text to accompany: coal resource occurrence and … · coal resource occurrence and coal...
TRANSCRIPT
Text to Accompany:
Open-File Report 79-1388
1979
COAL RESOURCE OCCURRENCE AND COAL DEVELOPMENT
POTENTIAL MAPS OF THE
ELKOL QUADRANGLE,
LINCOLN COUNTY, WYOMING
[Report includes 18 plates]
Prepared for
UNITED STATES DEPARTMENT OF THE INTERIOR
GEOLOGICAL SURVEY
By
DAMES & MOORE
DENVER, COLORADO
This report has not been edited for conformity with U.S. Geological Survey editorial standards or stratigraphic nomenclature.
-i-
CONTENTS
Page
Introduction................................................. 1
Purpose................................................. 1Location................................................ 1Accessibility........................................... 1Physiography............................................ 2Climate and vegetation.................................. 3Land status............................................. 3
General geology.............................................. 4
Previous work........................................... 4Stratigraphy............................................ 4Structure............................................... 8
Coal geology................................................. 9
Frontier Formation coal zones........................... 9Spring Valley coal zone............................... 10Kemmerer coal zone.................................... 10
Adaville Formation coal zone............................ 11
Coal resources............................................... 12
Coal development potential................................... 14
Development potential for surface mining methods........ 14Development potential for subsurface and in-situ
mining methods........................................ 15
References................................................... 30

-ii-
ILLUSTRATIONS
Plates 1-18. Coal resource occurrence and coal development potential maps:
1. Coal data map
2. Boundary and coal data map
3. Coal data sheet
4. Isopach map of the Spring Valley [1] coal bed,Cumberland seam, and the Adaville No. 1 coal bed
5. Structure contour map of the Spring Valley [1]coal bed, Cumberland seam, and the Adaville No. 1 coal bed
6. Overburden isopach and mining ratio map of theSpring Valley [1] coal bed, Cumberland seam, and the Adaville No. 1 coal bed
7. Isopach and structure contour map of the SpringValley [2], Upper Kemmerer, and the Adaville [5] coal beds
8. Overburden isopach and mining ratio map of the Spring Valley [2], Upper Kemmerer, and the Adaville [5] coal beds
9. Isopach and structure contour map of the Spring Valley [3] and the Adaville [6] coal beds
10. Overburden isopach and mining ratio map of theSpring Valley [3] and the Adaville [6] coal beds
11. Isopach and structure contour map of the Spring Valley [4] and the Adaville [7] coal beds
12. Overburden isopach and mining ratio map of theSpring Valley [4] and the Adaville [7] coal beds
13. Areal distribution and identified resources maps of the Spring Valley [2] and [4] coal beds and the Cumberland seam
-iii-
Illustrations Continued
14. Isopach and structure contour map of the Adaville [9] coal bed
15. Overburden isopach and mining ratio map of the Adaville [9] coal bed
16. Isopach and structure contour map of the Adaville [10] coal bed
17. Overburden isopach and mining ratio map of the Adaville [10] coal bed
18. Coal development potential map for surface mining methods
Page
Figure 1. Isopach and structure contour map of the Adaville [8]coal bed............................................ 24
2. Overburden isopach and mining ratio map of theAdaville [8] coal bed................................ 25
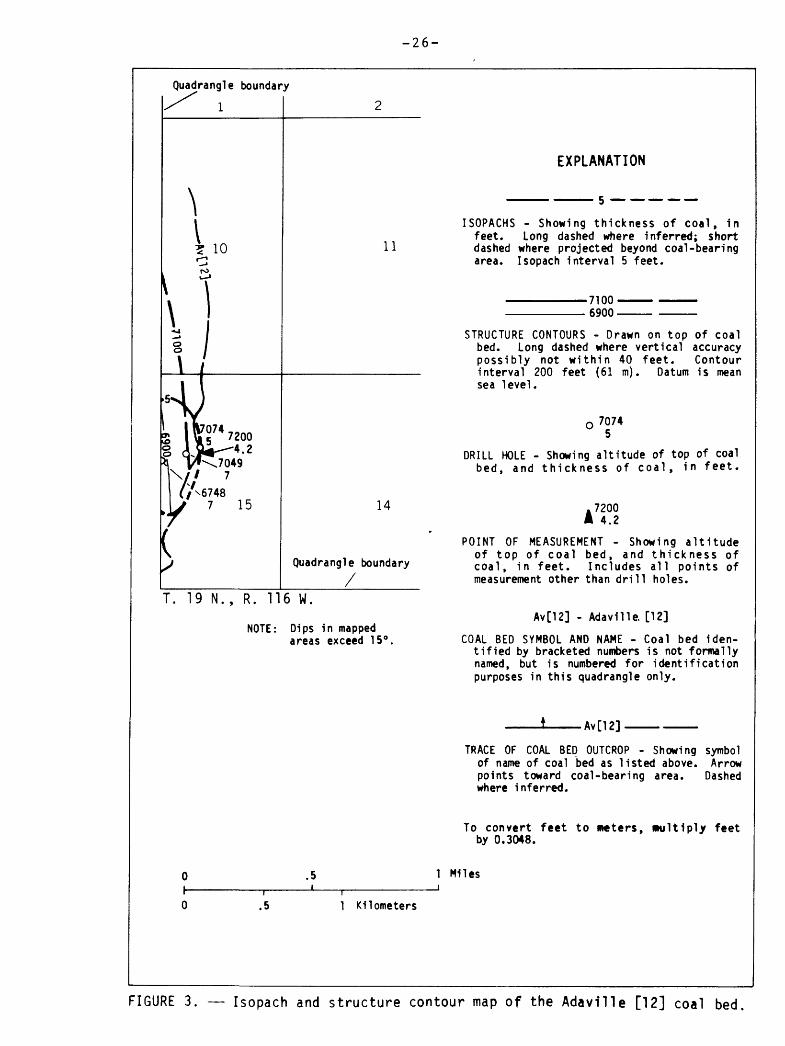
3. Isopach and structure contour map of the Adaville [12]coal bed............................................ 26
4. Overburden isopach and mining ratio map of theAdaville [12] coal bed.............................. 27
5. Isopach and structure contour map of the Adaville [14]coal bed............................................ 28
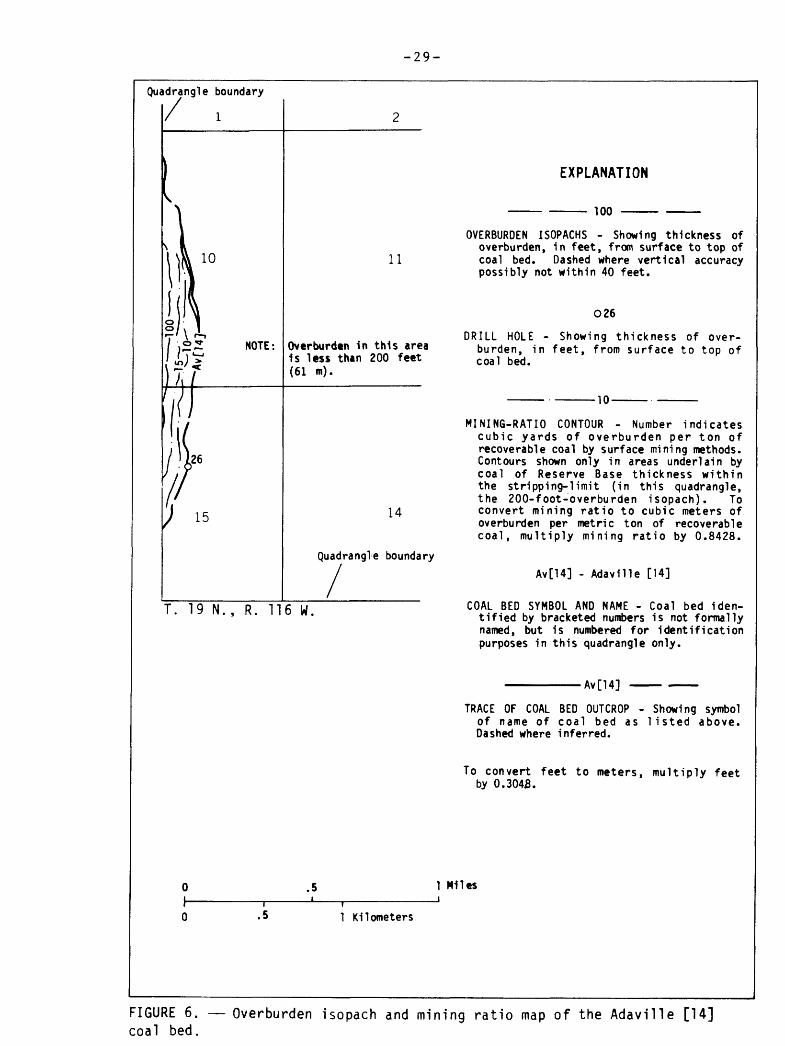
6. Overburden isopach and mining ratio map of theAdaville [14] coal bed.............................. 29

-iv-
TABLES
Page
Table 1. Chemical analyses of coals in the Elkolquadrangle, Lincoln County, Wyoming................. 17
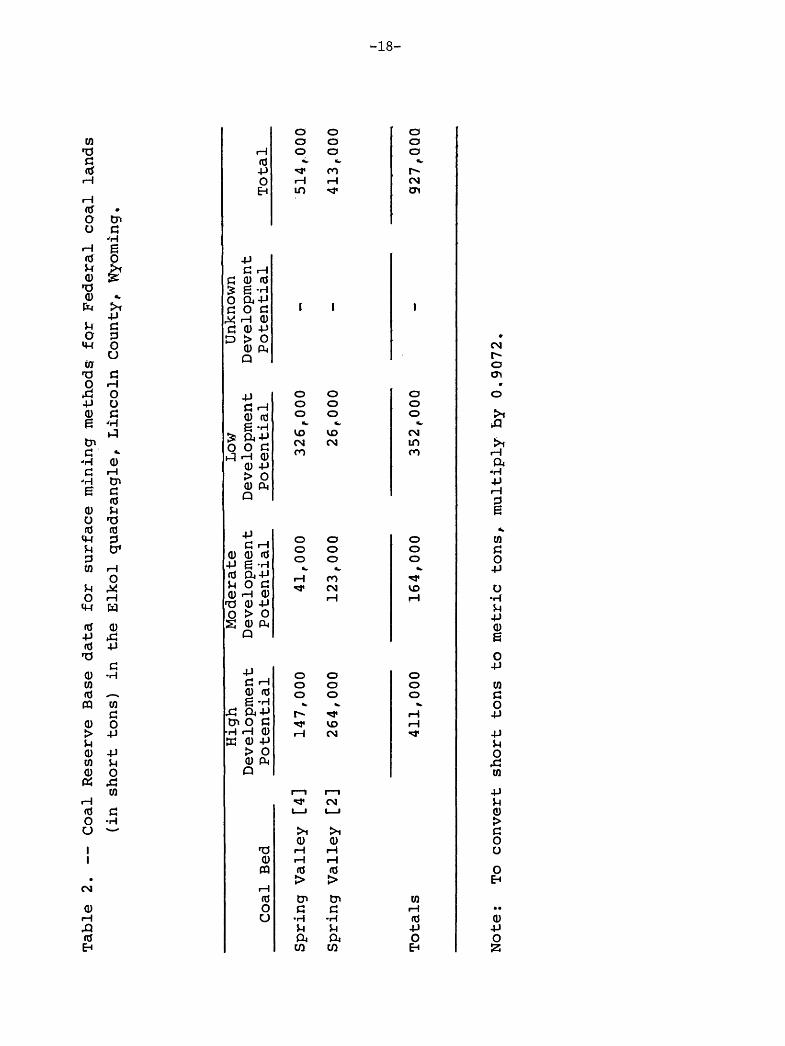
2. Coal Reserve Base data for surface mining methods in Federal coal lands (in short tons) in the Elkol quadrangle, Lincoln County, Wyoming..................................... 18
3. Sources of data used on plate 1....................... 19

INTRODUCTION
Purpose
This text is to be used in conjunction with Coal Resource Occurrence
(CRO) and Coal Development Potential (CDP) Maps of the Elkol quadrangle,
Lincoln County, Wyoming. This report was compiled to support the
land planning work of the Bureau of Land Management (BLM) to provide a
systematic coal resource inventory of Federal coal lands in Known
Recoverable Coal Resource Areas (KRCRA's) in the western United States.
This investigation was undertaken by Dames & Moore, Denver, Colorado, at
the request of the U.S. Geological Survey under contract number
14-08-0001-17104. The resource information gathered for this report is
in response to the Federal Coal Leasing Amendments Act of 1976 (P.L.
94-377). Published and unpublished public information available through
March, 1979, was used as the data base for this study. No new drilling
or field mapping was performed, nor was any confidential data used.
Location
The Elkol quadrangle is located in south-central Lincoln County,
Wyoming, approximately 3 airline miles (4.8 km) south of the town of
Kemmerer, Wyoming. The town of Elkol is located in the northwestern part
of the quadrangle.
Accessibility
U.S. Highway 30N, a paved heavy-duty road connecting the town
of Kemmerer to the north of the quadrangle with the town of Granger to
the southwest, crosses the northeast corner of the Elkol quadrangle.
U.S. Highway 189, a paved medium-duty road, crosses north-south through
the central part of the quadrangle connecting Kemmerer with Interstate
Highway 80, approximately 22 miles (35 km) to the south, and with the
town of Evanston to the southwest. A paved medium-duty road joins
Elkol in the northwestern corner of the quadrangle with U.S. Highway 189
near the northern edge of the quadrangle. Numerous unimproved dirt roads
and trails provide access for the remainder of the quadrangle (U.S.
Bureau of Land Management, 1971; Wyoming State Highway Commission,
1978).
-2-
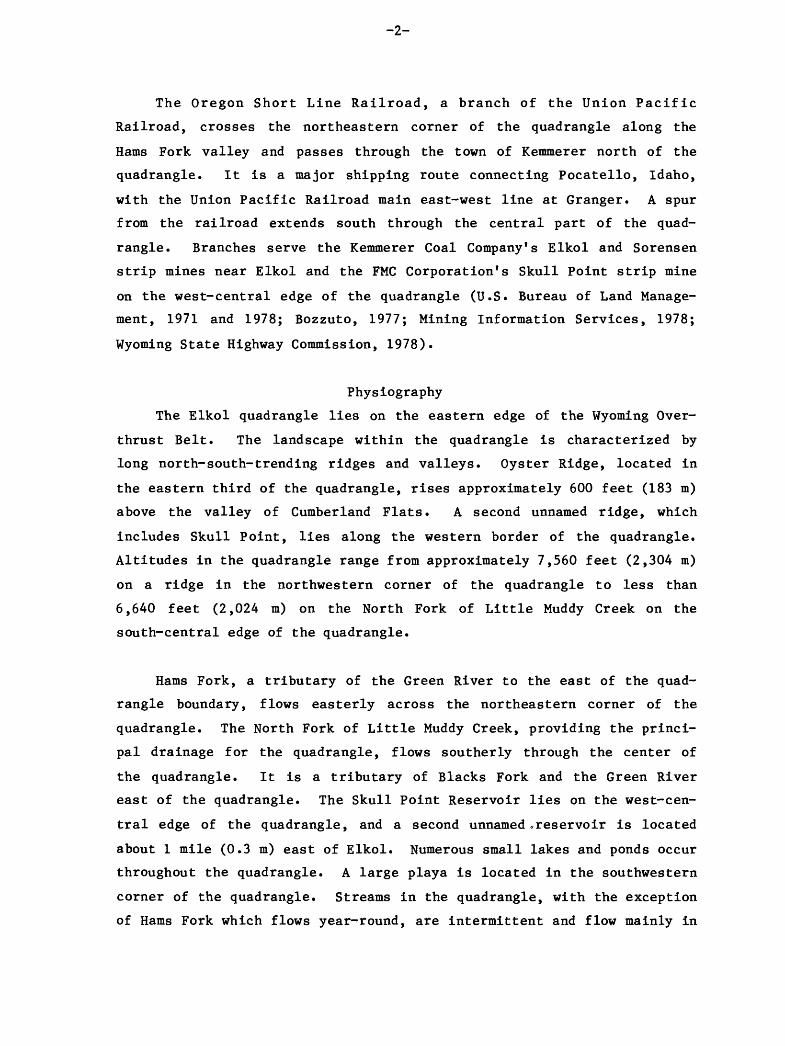
The Oregon Short Line Railroad, a branch of the Union Pacific
Railroad, crosses the northeastern corner of the quadrangle along the
Hams Fork valley and passes through the town of Kemmerer north of the
quadrangle. It is a major shipping route connecting Pocatello, Idaho,
with the Union Pacific Railroad main east-west line at Granger. A spur
from the railroad extends south through the central part of the quad
rangle. Branches serve the Kemmerer Coal Company's Elkol and Sorensen
strip mines near Elkol and the FMC Corporation's Skull Point strip mine
on the west-central edge of the quadrangle (U.S. Bureau of Land Manage
ment, 1971 and 1978; Bozzuto, 1977; Mining Information Services, 1978;
Wyoming State Highway Commission, 1978).
Physiography
The Elkol quadrangle lies on the eastern edge of the Wyoming Over-
thrust Belt. The landscape within the quadrangle is characterized by
long north-south-trending ridges and valleys. Oyster Ridge, located in
the eastern third of the quadrangle, rises approximately 600 feet (183 m)
above the valley of Cumberland Flats. A second unnamed ridge, which
includes Skull Point, lies along the western border of the quadrangle.
Altitudes in the quadrangle range from approximately 7,560 feet (2,304 m)
on a ridge in the northwestern corner of the quadrangle to less than
6,640 feet (2,024 m) on the North Fork of Little Muddy Creek on the
south-central edge of the quadrangle.
Hams Fork, a tributary of the Green River to the east of the quad
rangle boundary, flows easterly across the northeastern corner of the
quadrangle. The North Fork of Little Muddy Creek, providing the princi
pal drainage for the quadrangle, flows southerly through the center of
the quadrangle. It is a tributary of Blacks Fork and the Green River
east of the quadrangle. The Skull Point Reservoir lies on the west-cen
tral edge of the quadrangle, and a second unnamed *reservoir is located
about 1 mile (0.3 m) east of Elkol. Numerous small lakes and ponds occur
throughout the quadrangle. A large playa is located in the southwestern
corner of the quadrangle. Streams in the quadrangle, with the exception
of Hams Fork which flows year-round, are intermittent and flow mainly in

-3-
response to snowmelt in the spring (U.S. Bureau of Land Management,
1971).
Climate and Vegetation
The climate of southwestern Wyoming is semiarid, characterized
by low precipitation, rapid evaporation, and large daily temperature
variations. Summers are usually dry and mild, and winters are cold. The
annual precipitation averages approximately 10 inches (25 cm) and is
fairly evenly distributed throughout the year (Wyoming Natural Resources
Board, 1966).
The average annual temperature of the area is 39° F (4° C). The
temperature during January averages 17° F (-8° C) and typically ranges
from 4° F (-16° C) to 30° F (-1° C). During July, the average tempera
ture is 62° F (17° C), and the temperature typically ranges from 43° F
(6° C) to 82° F (28° C) (Wyoming Natural Resources Board, 1966; U.S.
Bureau of Land Management, 1978).
Winds are usually from the west and west-southwest with an average
annual velocity of 15 miles per hour (24 km per hr) (U.S. Bureau of Land
Management, 1978).
Principal types of vegetation in the quadrangle include grasses,
sagebrush, mountain mahogany, saltbush, greasewood, rabbitbrush, service-
berry, willow, and cottonwood (U.S. Bureau of Land Management, 1978).
Land Status
The Elkol quadrangle lies in the eastern part of the Kemmerer Known
Recoverable Coal Resources Area (KRCRA). Approximately 85 percent of the
quadrangle lies within the KRCRA boundary and the Federal government owns
the coal rights for about one third of this land. Two active coal leases
occur within the KRCRA boundary as shown on plate 2.

-4-
GENERAL GEOLOGY
Previous Work
Veatch (1907) mapped the geology and economic resources of a large
part of Lincoln and Uinta counties in southwestern Wyoming, Including
this quadrangle. Cobban and Reeside described the stratigraphy of the
coal-bearing Frontier Formation in the Kemmerer area In 1952. Hale
(1960) described the stratigraphy of the Frontier Formation in southwest
ern Wyoming and Utah. Lawrence (1963) described the Wasatch and Green
River Formations In the Cumberland Gap area. Oriel and Tracey (1970)
described the stratigraphy of the Evanston and Wasatch Formations present
in the Kemmerer area. Glass (1975) reported coal analyses and measured
sections of Adaville Formation coals from the Elkol and Sorensen mines
located In this quadrangle and In the southeast and southwest quarters of
the Kemmerer 15-minute quadrangle. The geology of the Kemmerer 15-minute
quadrangle, north of the Elkol quadrangle, was mapped by Rubey and
others (1975), and Schroeder and Lunceford (1976) mapped the goelogy and
coal resources of the Cumberland Cap quadrangle. Roehler and others
(1977) described the geology and coal resources of the Hams Fork coal
region including the Kemmerer coal field. Myers (1977) made a detailed
study of the stratigraphy of the Frontier Formation in the Kemmerer
area. Glass (1977) described the coal-bearing formations and coal beds
present in the Hams Fork coal region. M'Gonigle mapped the surface
geology of the Elkol (1979a) and Warfield Creek (1979b) quadrangles.
Unpublished data from Rocky Mountain Energy Company (RMEC) also provided
coal thickness Information.
Stratigraphy
The formations exposed in the Elkol quadrangle range In age from
Early Cretaceous to Eocene. The Frontier and Adaville Formations,
trending north-south through the quadrangle, are coal-bearing.
The Bear River Formation of Early Cretaceous age Is exposed along
the eastern edge of the quadrangle. It consists of interbedded clay-
stone, fine-grained sandstone, and fossillferous limestone (Rubey and
others, 1975).
-5-
The Aspen Shale of latest Early Cretaceous age conformably overlies
the Bear River Formation and is composed of dark gray shale containing a
few beds of gray sandstone and white to light-gray porcelanite. The
upper formational contact is placed at the top of the highest prominent
porcelanite bed. The formation is exposed in the eastern half of the
Elkol quadrangle and is approximately 825 feet (251 m) thick in the
adjacent quadrangle to the north (Rubey and others, 1975; M'Gonigle,
1979a).
The sandstones and shales of the Frontier Formation of early Late
Cretaceous age crop out in the east-central part of the quadrangle, where
they conformably overlie the Aspen Shale. M'Gonigle (1979a) has divided
the Frontier Formation into mappable units which are, in ascending order,
the Chalk Creek Member, Coalville Member, Allan Hollow Member, Oyster
Ridge Member, and the Dry Hollow Member.
The Chalk Creek Member generally consists of mudstone, sandstone,
and siltstone, with some coal, bentonite, procelanite, and limestone
(Cobban and Reeside, 1952). The League of Nations (Lower Carter Group),
Spring Valley, and Willow Creek coal zones are contained within this
member (Veatch, 1906, and Townsend, 1960) in the Kemmerer area. This
member is approximately 970 feet (296 m) thick where measured at Cumber
land Gap and 1,400 feet (427 m) thick in the Kemmerer area (Myers,
1977).
The Coalville Member is composed of resistant brown to tan sandstone
interbedded with softer shale units approximately 100 to 150 feet (70 to
46 m) thick (Myers, 1977).
The Alien Hollow Member consists primarily of dark-gray calcareous
shale and is approximately 300 feet (91 m) thick (Cobban and Reeside,
1955).
A ridge-forming sandstone unit, the Oyster Ridge Member, overlies
the Allan Hollow Member and is characterized by the presence of Ostrea

-6-
soleniscus, a long, slender oyster (Bozzuto, 1977). This member is
approximately 135 feet (41 m) thick (Cobban and Reeside, 1952).
The Dry Hollow Member caps the formation and consists of approxi
mately 300 feet (91 m) of sandstone, mudstone, siltstone and coal. The
Kemmerer coal zone is located approximately 250 feet (76 m) above the
Oyster Ridge Member (Cobban and Reeside, 1952).
The Frontier Formation is overlain by the Hilliard Shale of early
Late Cretaceous age and consists of a very thick sequence of dark-gray
shale containing minor glauconitic sandstone beds (Cobban and Reeside,
1952). The formation is exposed in the western half of the quadrangle
(M f Gonigle, 1979a) and ranges from 5,500 to 6,600 feet (1,676 to 2,012 m)
in thickness (Rubey and others, 1975; Bozzuto, 1977).
The Adaville Formation of Late Cretaceous age conformably overlies
the Hilliard Shale and is exposed along the western edge of the quad
rangle. It consists of yellow, gray, and black carbonaceous claystone,
siltstone, thin-bedded to massive brown and yellow sandstone, and num
erous coal seams (Cobban and Reeside, 1952; Rubey and others, 1975). A
regressive sand sequence, the Lazeart Sandstone Member, comprises the
lower 200 to 400 feet (61 to 122 m) of the formation. This prominent
ledge- and cliff-forming unit is composed of light-gray to white sandstone
directly overlain by the thickest coal beds of the formation (Rubey
and others, 1975). The Adaville Formation is approximately 2,900 feet
(884 m) thick in the adjacent quadrangle to the north (Rubey and others,
1975).
The main body of the Wasatch Formation (Eocene) unconformably
overlies Cretaceous and older rocks along the eastern edge of the quad
rangle (Rubey and others, 1975; M f Gonigle, 1979a). The main body is
composed of green and brown-red variegated mudstone, light-red and tan
conglomerate, and cross-bedded channel sandstone and ranges up to 400
feet (122 m) thick (Lawrence, 1963).

-7-
The main body of the Wasatch Formation is conformably overlain
by the Fontenelle tongue of the Green River Formation of early Eocene
age. The tan-white gastropodal and ostracodal marIstone and limestone,
shale and sandstone of the Fontenelle tongue are exposed along the
extreme eastern border of the quadrangle (Lawrence, 1963; M'Gonigle,
I979a). The Fontenelle tongue attains a maximum thickness of 135 feet
(41 m) in the area (Lawrence, 1963).
Holocene deposits of alluvium cover the stream valleys and tribu
taries of the North Fork of Muddy Creek and Hams Fork.
The Upper Cretaceous formations iu the Elkol quadrangle indicate the
transgressons and regressions of a broad, shallow north-south seaway that
extended across central North America. These formations accumulated near
the western edge of the Cretaceous sea and reflect the location of the
shoreline (Weimer, 1960 and 1961).
The interbedded claystones, sandstones, and limestones of the
Bear River Formation were deposited in a predominantly marine environ
ment. According to Roehler and others (1977), the formation thickens to
the north, where it was deposited in mixed fluvial, paludal, and marine
environments.
Deposition of the Aspen Shale marked a westward or landward move
ment of the sea. According to Hale (1960), the marine shales and sand
stones of the Aspen Shale were deposited in water depths up to 120 feet
(37 m).
The Frontier Formation sediments were deposited during two major
transgressions and regressions of the sea. The coal beds in the upper
and lower parts of the formation were deposited in coastal swamps
during periods when the sea retreated eastward. The Oyster Ridge
Sandstone Member is a littoral or beach deposit marking the retreat of
the Cretaceous sea from the area (Hale, 1960; Myers, 1977; Roehler
and others, 1977).
-8-
The marine sequence of shales, claystones and sandstones of the
Hilliard Shale were deposited during a transgression of the Cretaceous
sea and indicate the fluctuations of the shoreline (Roehler and others,
1977).
The Lazeart Sandstone Member at the base of the Adaville Formation
is a beach deposit marking a transition from the marine deposition of
the Hilliard Shale to the continental coastal plain deposition of the
Adaville Formation. The sediments of the Adaville Formation were de
posited in flood plains and swamps along the coastal plain (Roehler and
others, 1977).
The main body of the Wasatch Formation is composed of continental
sediments. The bright-colored mudstones were probably deposited on a
flood plain and then cut by stream channels now filled with well-sorted
conglomerate (Oriel and Tracey, 1970).
Lacustrine deposits derived from Gosiute Lake are represented
in the Fontenelle tongue of the Green River Formation (Lawrence, 1963).
Structure
The Elkol quadrangle is located on the southeastern edge of the
structurally complex Wyoming Overthrust Belt. Folded Paleozoic and
Mesozoic rocks are thrust eastward over folded older-Cretaceous rocks
with younger Cretaceous and Tertiary rocks resting unconformably on
top of the older rocks. Coal-bearing strata crop out in eroded limbs of
folds as long north-south trending belts bounded on the west by major
thrust faults (Roehler and others, 1977).
The coal-bearing formations in the Elkol quadrangle crop out on the
eastern limb of the Lazeart syncline, an asymmetrical fold whose axis
lies a few miles west of the quadrangle. Coal-bearing strata generally
dip 15° to 24° to the west (M f Gonigle, 1979a).
-9-
Several faults have been mapped by M'Gonigle (1979a) in the eastern
part of the quadrangle (plate 1), only two of which affect coal-bearing
formations.
COAL GEOLOGY
Coal-bearing formations in the Elkol quadrangle include both the
Frontier and Adaville. The Frontier Formation contains two major coal
zones, the Spring Valley, located approximately 400 feet (122 m) above
the base of the formation, and the Kemmerer coal zone near the top of the
formation. Two minor coal zones, the League of Nations (or Lower Carter
Group) (Veatch, 1906; Townsend, 1960) and the Willow Creek are believed
not to contain coal of Reserve Base thickness (5 feet or 1.5 meters) in
the Elkol quadrangle.
Numerous coal beds of the Adaville Formation are also present,
cropping out along a ridge trending north-south along the western
edge of the quadrangle. The thicker coal beds are located in a strati-
graphic interval approximately 1,000 feet (305 m) thick, immediately
overlying and intertonguing with the Lazeart Sandstone.
Chemical analyses of coal. An analysis of coal from the Spring Valley
zone (Frontier Formation) in the Elkol quadrangle is included in
table 1. Representative analyses of coal from both the Adaville Forma
tion and Kemmerer zone (Frontier Formation) in the Kemmerer 15-minute
quadrangle are also included.
In general, coals in the Spring Valley and Kemmerer coal zones are
high-volatile B bituminous in rank, and coal from the Adaville No. 1 coal
bed ranks as subbituminous A. Coals from other Adaville coal beds are
either subbituminous B or C (Glass, 1977). These coals have been ranked
on a moist, mineral-mater-free basis according to ASTM Standard Specifi
cation D 388-77 (American Society for Testing and Materials, 1977).
Frontier Formation Coal Zones
The Frontier Formation coal zones occupy a belt approximately
one mile (1.6 km) wide trending north-south through the east-central part
-10-
of the quadrangle. Dips average 22° to the west (M'Gonigle, 1979a).
Spring Valley Coal Zone
Four coal beds of the Spring Valley coal zone have been isopached
in the Elkol quadrangle. These coal beds have been informally named with
bracketed numbers for identification purposes in this quadrangle only,
and may have different designations in other quadrangles.
The Spring Valley [1] coal bed is, stratigraphically, the lowest
coal bed isopached in the quadrangle. The coal bed is 12.4 feet (3.8 m)
thick where measured in sec. 9, T. 20 N., R. 116 W., thinning southward
(plate 4).
The Spring Valley [2] coal bed lies above the Spring Valley [1]
coal bed and has a maximum measured thickness of 7.0 feet (2.1 m) in
sec. 21, T. 20 N., R. 116 W. This coal bed also thins to the south
(plate 7).
The Spring Valley [3] coal bed has been isopached in the southern
part of the quadrangle (plate 9) where it locally attains a thickness
of 5.8 feet (1.8 m). The coal bed averages 4.0 feet (1.2 m) in thickness
in this quadrangle and 3 feet (0.9 m) in the Cumberland Gap quadrangle
to the south, where the coal bed is designated as the Spring Valley [1]
coal bed.
The Spring Valley [4] coal bed locally attains a maximum measured
thickness of 6.9 feet (2.1 m) in sec. 4, T. 19 N., R. 116 W. (plate 11).
Coal from the Spring Valley [4] bed was mined in the subsurface at the
Blazon and Service mines. This coal bed thins to the south, but has
been traced into the Cumberland Gap quadrangle (Schroeder and Lunceford,
1976) where it is designated the Spring Valley [2] coal bed.
Kemmerer Coal Zone
The Kemmerer coal zone overlies and is separated from the Oyster
Ridge Member by approximately 220 to 250 feet (67 to 76 m) of mudstone,

1 1
sandstone, and siltstone. The Kemmerer coal zone is laterally extensive
and can be traced for many miles north and south of this quadrangle.
The Cumberland (RMEC, no date) or Main Kemmerer (Veatch, 1907)
seam is the major coal bed located within the Kemmerer coal zone. This
coal bed (seam) crops out along the western side of Oyster Ridge,
attaining a maximum thickness of 20.3 feet (6.2 m), excluding 1.3 feet
(0.4 m) of partings, where measured near the southern boundary of the
quadrangle (plate 4). It has been mined in the past a minimum of five
different locations within the quadrangle.
In the adjacent southeast quarter of the Kemmerer 15-minute quad
rangle to the north, the Cumberland seam averages 9 feet (2.7 m) in
thickness. In the Cumberland Gap quadrangle, the Cumberland seam has
a maximum measured thickness of 21 feet (6.4 m), excluding a rock parting
1 foot (0.3 m) thick.
The Upper Kemmerer, or Radio coal bed (Hunter, 1950), has been
encountered in sec. 5, T. 19 N., R. 116 W., where it is situated approxi
mately 20 to 50 feet (6 to 15 m) above the Cumberland seam. This coal
bed thickens locally to 6 feet (1.8 m), but is usually less than Reserve
Base thickness in most parts of the Kemmerer coal field. Minable thick
nesses have been reported for this coal bed near the town of Frontier,
Wyoming (Hunter, 1950; Glass, 1977).
Adaville Formation Coal Zone
The Adaville Formation is the most prolific coal-bearing formation
in the Hams Fork coal region (Glass, 1977) and, probably, in the country
(Hunter, 1950). The Adaville coals are numbered consecutively from the
lowermost bed upward, but because these coal beds thicken, thin, split,
and coalesce over very short distances (Glass, 1977), the numerical
designations have little meaning. Informal bracketed numbers, used to
designate some of the Adaville coal beds, are for identification purposes
in this quadrangle only.

-12-
In the Elkol quadrangle, as many as 21 Adaville coal beds are
currently strip-mined in the Kemmerer Coal Company's Sorenson mine (plate
1). FMC Corporation's Skull Point mine in sec. 27, T. 20 N., R. 117 W.
is also presently producing Adaville coal (Bozzuto, 1977; Mining Informa
tion Services, 1978).
The Adaville No. 1, generally the thickest of the Adaville coal
beds, overlies or intertongues with the Lazeart Sandstone Member.
Although this coal bed exhibits depositional discontinuities, especially
along strike (Buzzoto, 1977), it maintains a thickness of at least 10
feet (3.0 m) in the quadrangle and thickens to over 40 feet (12.2 m) at
some locations (plate 4). This coal bed occasionally contains claystone
and coaly shale, but is generally quite clean and requires no mechanical
cleaning (Engstrom, 1977).
To the north, in the southeast quarter of the Kemmerer 15-minute
quadrangle, the Adaville No. 1 coal bed attains a maximum measured
thickness of 88.1 feet (26.9 m), with no partings, in sec. 20, T. 21 N.,
R. 116 W. In the adjacent quadrangle to the south, most of the Adaville
Formation is covered by gravel (Schroeder and Lunceford, 1976), but the
Adaville No. 1 coal bed is believed to be present in a single coal test
hole with a thickness of 13 feet (4.0 m). In the the Cumberland Gap
quadrangle and the southern part of the Elkol quadrangle, thick Adaville
Formation coal beds (Adaville No. 1?) are probably contained within the
Lazeart Sandstone Member.
Because the land areas containing Adaville coal in the Elkol quad
rangle are either non-Federal or have already been leased, detailed
descriptions of other Adaville coal beds are not discussed in this
report. Isopach maps of Adaville coal beds are shown on plates 7, 9,
11, 14, and 16, and in figures 1, 3, and 5. (All figures are included at
the end of this report.)
COAL RESOURCES
Information from an oil and gas well, coal test holes drilled by
Rocky Mountain Energy Company (RMEC), and coal bed measurements by
-13-
Veatch (1907), Hunter (1950), Glass (1975), and M'Gonigle (1979a), were
used to construct maps of the coal beds in the Elkol quadrangle.
At the request of RMEC, coal-rock data for some of their drill holes have
not been shown on plate 1 or on the derivative maps. However, data from
these drill holes may have been used to construct the derivative maps.
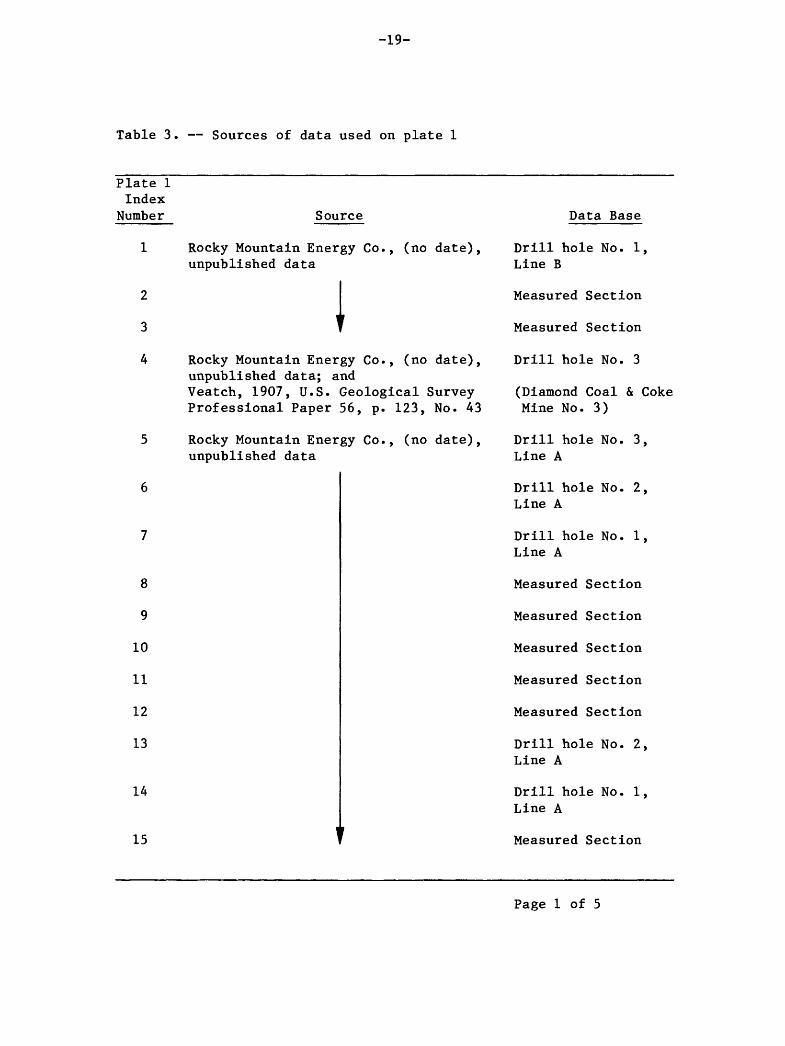
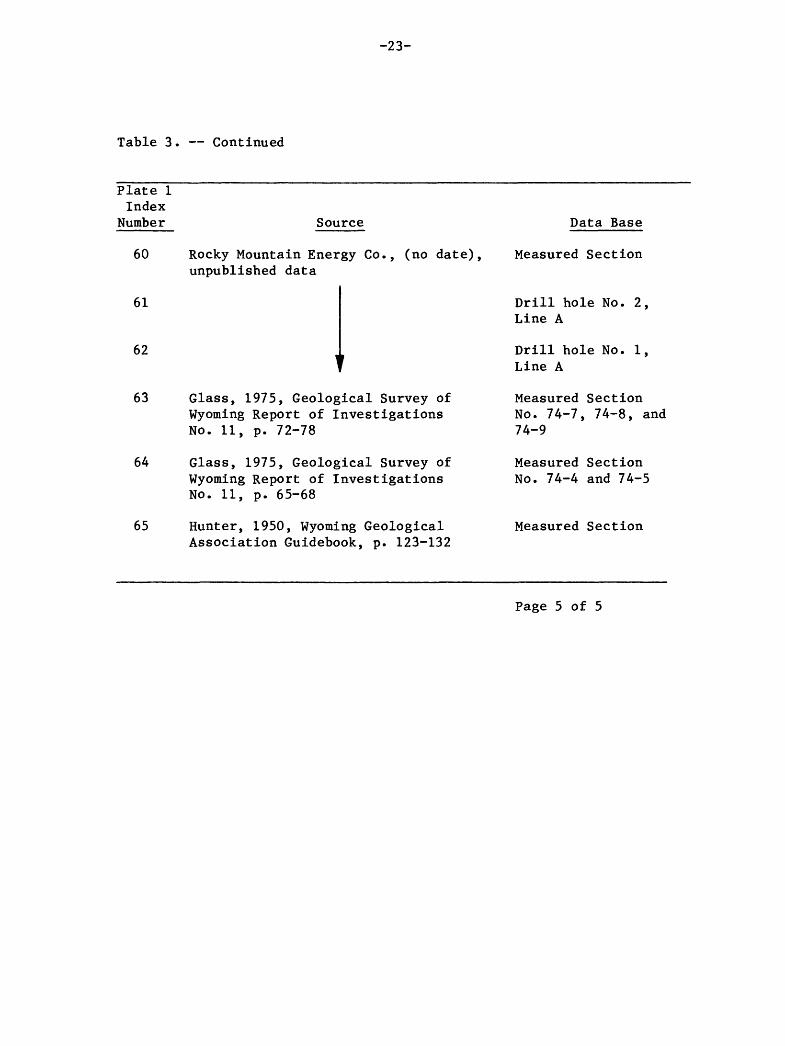
These data may be obtained by contacting RMEC. The source of each
indexed data point shown on plate 1 is listed in table 3.
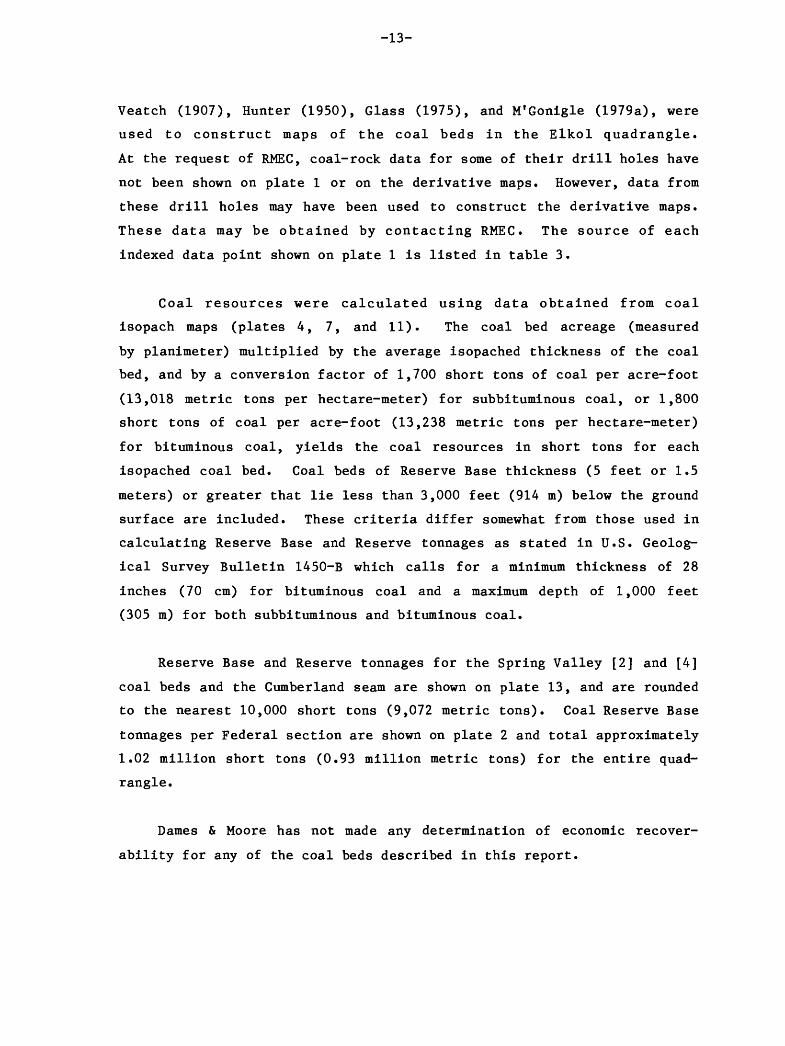
Coal resources were calculated using data obtained from coal
isopach maps (plates 4, 7, and 11). The coal bed acreage (measured
by planimeter) multiplied by the average isopached thickness of the coal
bed, and by a conversion factor of 1,700 short tons of coal per acre-foot
(13,018 metric tons per hectare-meter) for subbituminous coal, or 1,800
short tons of coal per acre-foot (13,238 metric tons per hectare-meter)
for bituminous coal, yields the coal resources in short tons for each
isopached coal bed. Coal beds of Reserve Base thickness (5 feet or 1.5
meters) or greater that lie less than 3,000 feet (914 m) below the ground
surface are included. These criteria differ somewhat from those used in
calculating Reserve Base and Reserve tonnages as stated in U.S. Geolog
ical Survey Bulletin 1450-B which calls for a minimum thickness of 28
inches (70 cm) for bituminous coal and a maximum depth of 1,000 feet
(305 m) for both subbituminous and bituminous coal.
Reserve Base and Reserve tonnages for the Spring Valley [2] and [4]
coal beds and the Cumberland seam are shown on plate 13, and are rounded
to the nearest 10,000 short tons (9,072 metric tons). Coal Reserve Base
tonnages per Federal section are shown on plate 2 and total approximately
1.02 million short tons (0.93 million metric tons) for the entire quad
rangle.
Dames & Moore has not made any determination of economic recover-
ability for any of the coal beds described in this report.

-14-
COAL DEVELOPMENT POTENTIAL
Coal development potential areas are drawn so as to coincide
with the boundaries of the smallest legal land subdivisions shown on
plate 2. In sections or parts of sections where no land subdivisions
have been surveyed by the BLM, approximate 40-acre (16-ha) parcels have
been used to show the limits of the high, moderate, or low development
potentials. A constraint imposed by the BLM specifies that the highest
development potential affecting any part of a 40-acre (16-ha) lot,
tract, or parcel be applied to that entire lot, tract, or parcel. For
example, if 5 acres (2 ha) within a parcel meet criteria for a high
development potential, 25 acres (10 ha) a moderate development potential,
and 10 acres (4 ha) a low development potential, then the entire 40 acres
(16 ha) are assigned a high development potential.
Development Potential for Surface Mining Methods
Areas where the coal beds of Reserve Base thickness are overlain by
200 feet (61 m) or less of overburden are considered to have potential
for surface mining and are assigned a high, moderate, or low development
potential based on the mining ratio (cubic yards of overburden per ton of
recoverable coal). The formula used to calculate mining ratios for
surface mining of coal is shown below:
MR = ' < Cf >
t (rf) where MR = mining ratio
t = thickness of overburden in feet o
t = thickness of coal in feet c
rf = recovery factor (85 percent for this quadrangle)
cf = conversion factor to yield MR value in terms of cubic yards of overburden per short tons of recoverable coal:
0.911 for subbituminous coal 0.896 for bituminous coal
Note: To convert mining ratio to cubic meters of overburden per metric ton of recoverable coal, multiply MR by 0.8428.
Areas of high, moderate, and low development potential for sur-
fce mining methods are defined as areas underlain by coal beds having

-15-
respective mining ratio values of 0 to 10, 10 to 15, and greater than
15. These mining ratio values for each development potential category
are based on economic and technological criteria and were provided by the
U.S. Geological Survey.
Areas where the coal data is absent or extremely limited between
the 200-foot (61-m) overburden line and the outcrop are assigned unknown
development potentials for surface mining methods. Areas where coal-
bearing units are not present within 200 feet (61 m) of the surface are
considered to have no coal development potential.
The coal development potential for surface mining methods (less
than 200 feet or 61 meters of overburden) is shown on plate 18. Of the
Federal land areas within the KRCRA boundary, 3 percent are rated high,
11 percent are rated unknown, and 86 percent are rated as having no
development potential for surface mining methods. Reserve Base tonnages
in the various development potential categories for surface mining
methods are listed in table 2.
Development Potential for
Subsurface and In-Situ Mining Methods
Areas ordinarily considered to have a development potential for
conventional subsurface mining methods include those areas where the coal
beds of Reserve Base thickness are between 200 feet (61 m) and 3,000 feet
(914 m) below the ground surface and have dips less than 15°. Areas of
high, moderate, and low development potential for conventional subsurface
mining are defined by the U.S. Geological Survey as areas underlain by
coal beds of Reserve Base thickness at depths ranging from 200 to 1,000
feet (61 to 305 m), 1,000 to 2,000 feet (305 to 610 m), and 2,000 to
3,000 feet (610 to 914 m), respectively. Unknown development potentials
are assigned to those areas where coal data is absent or extremely
limited.
All Federal lands within the KRCRA boundary in this quadrangle have
been classified as having an unknown development potential for

-16-
conventional subsurface mining methods because the coal beds have dips
greater than 15°.
Unfaulted coal beds lying between 200 and 3,000 feet (61 and 914 m)
below the ground surface, dipping greater than 15°, are considered to
have a development potential for in-situ mining methods. Based on
criteria provided by the U.S. Geological Survey, coal beds of Reserve
Base thickness dipping between 35° and 90° with a minimum Reserve Base of
50 million short tons (45.4 million metric tons) for bituminous coal and
70 million short tons (63.5 million metric tons) for subbituminous coal
have a moderate potential for in-situ development; coal beds dipping from
15° to 35°, regardless of tonnage, and coal beds dipping from 35° to 90°
with less than 50 million short tons (45.4 million metric tons) of coal
have a low development potential for in-situ mining methods. Coal
lying between the 200-foot (61-m) overburden line and the outcrop is
not included in the total coal tonnages available as it is needed for
cover and containment in the in-situ process.
Because the dips of the coal-bearing strata range from 15° to 24°
and the total Reserve Base tonnage available for in-situ mining is less
than 50 million short tons (only 90,000 short tons or 81,650 metric tons
as shown on plate 13), all Federal land areas within the KRCRA boundary
having known development potential for in-situ mining methods have been
rated low. The remaining Federal lands are classified as having unknown
development potential for in-situ mining methods.

3 3? 3o
Ml
s t o j» o H* 5 < < n (P H-h n ftGOft o co > C - - - \ a B tu t> o o H- n
tH- h B h rt- a erC h 0
ft h H-» O <P <P H-
CL<!* Hi <Pp- h o. M a> o a> v_»- Oc(- (P n*
£ o usM
S
§(- ftH- o(- »<
o- ,
tou> toen
O *> W Ml H'ffi
ft O X N H-tJ 3 B> .Ua> ft- n h « H-l-3
0 « H-X-V0 tou> S o M H- ^S Z
* *
C » to " I-1
1 CD Ot
^ S a> » -c
Spring Valley
n >
O -J
O H1
U) U) -J W
VD IO
ui in*t O
-J 00
-J O\
*>. VD
0 O
in *
I I
I I
1 I
I I
I 1
- H1 U 10
A. * to -J0 0
c?5^ «r M >- -
McnZ
to n 5*5A «oi n c z o> o?.°Ml
O\ (- 3E K> Ps. 3 H- (I> 3 t-3 0) (P
101 to to ui Z 1 * «* .
Kemmerer
n >
O UI
o vo
£>. ifc M 0
-J 1-
in *.|_ vo
O O
-J -J
UI O
0 0
o, a\
I I
I I
I i
I i
I I
i-1 (- UI K)
*t 00to vo0 0
n w MM*r«r 0-i 3EX H-«rg*
n -»(P <n o H1 t> n to n o
M*3 vo -J in to
Z
Adaville No. 1
n>
i 0 Ot
O -J
*. UI UI Ot
co in
in *. I to*t 00
^ *.co o
H'H'
in ui
1 1
1 1
1 1
(-I-K) O
en in*t UI 0 0
Location
o
co n o
Form of Analysis
Moisture
Volatile Matter
Fixed Carbon
Ash
Sulfur
Hydrogen
Carbon
Nitrogen
Oxygen
Calories
Btu/Lb
0 H
si?
Ultimate
Heating Value
fa CT
s; n ^ tro 03 3 H- H-3 O
CO 0 CO
OHi
O O fa M CO
H- 3
ft£T 0
0
n o
Tabl
e 2.
Co
al Re
serv
e Ba
se da
ta fo
r surface
mining methods fo
r Federal co
al lands
(in
shor
t tons)
in th
e Elkol quadrangle,
Lincoln County,
Wyoming,
Coal
Bed
Spring Valley
Spring Valley
[4]
[2]
High
Development
Potential
147,000
264,000
Moderate
Development
Potential
41,000
123,
000
Low
Development
Potential
326
fOOO
26,000
Unknown
Development
Potential
-
Total
514,000
413,000
Totals
411,000
164,000
352,000
927
fQQQ
00 I
Note:
To convert sh
ort
tons
to metric tons,
multiply by 0,9072,
-19-
Table 3. Sources of data used on plate 1
Plate 1 Index
Number
8
9
10
11
12
13
14
15
Source
Rocky Mountain Energy Co., (no date), unpublished data
IRocky Mountain Energy Co., (no date), unpublished data; and Veatch, 1907, U.S. Geological Survey Professional Paper 56, p. 123, No. 43
Rocky Mountain Energy Co., (no date), unpublished data
Data Base
Drill hole No. 1, Line B
Measured Section
Measured Section
Drill hole No. 3
(Diamond Coal & Coke Mine No. 3)
Drill hole No. 3, Line A
Drill hole No. 2, Line A
Drill hole No. 1, Line A
Measured Section
Measured Section
Measured Section
Measured Section
Measured Section
Drill hole No. 2, Line A
Drill hole No. 1, Line A
Measured Section
Page 1 of 5

-20-
Table 3. Continued
Plate 1 Index
Number
16
17
18
19
20
21
22
23
24
25
26
27
28
29
Source
Rocky Mountain Energy Co., (no date), unpublished data
Veatch, 1907, U.S. Geological Survey Professional Paper 56, p. 123
Rocky Mountain Energy Co., (no date), unpublished data
Veatch, 1907, U.S. Geological Survey Professional Paper 56, p. 123
Rocky Mountain Energy Co., (no date), unpublished data
Data Base
Measured Section
Measured Section
Measured Section No. 49
Drill hole No. 1, Line A
Measured Section No. 50
Drill hole No. 1, Line A
Drill hole No. 2, Line A
Drill hole No. H, Line A
Drill hole No. I, Line A
Drill hole No. J Line A
Drill hole No. K North
Drill hole No. L, Line A
Drill hole No. M, Line A
Drill hole No. N, Line A
Page 2 of 5

-21-
Table 3. Continued
Plate 1 Index
Number
30
31
32
33
34
35
36
37
38
39
40
41
42
43
Source
Rocky Mountain Energy Co., (no date), unpublished data
IVeatch, 1907, U.S. Geological Survey Professional Paper 56, p. 121-122
Rocky Mountain Energy Co., (no date), unpublished data
Data Base
Drill hole No. 0, Line A
Measured Section (Pacific Coal Mine)
Measured Section
Measured Section
Measured Section (Diamondville Mine)
Measured Section No. 21
Drill hole No. 22 (Diamond Coal & Coke Mine No. 4)
Measured Section
Measured Section
Drill hole No. 3, Line A
Measured Section
Drill hole No. 2, Line A
Drill hole No. 1, Line A
Measured Section
Page 3 of 5

-22-
Table 3. Continued
Plate 1 Index
Number
44
45
46
47
48
49
50
51
52
53
54
55
56
57
58
59
Source
Rocky Mountain Energy Co., (no date), unpublished data
TWilliam G. Helis Estate
Rocky Mountain Energy Co., (no date), unpublished data
Veatch, 1907, U.S. Geological Survey Professional Paper 56, p. 123
Rocky Mountain Energy Co., (no date), unpublished data
Data Base
Measured Section
Measured Section (Diamond Coal & Coke Mine No. 4)
Measured Section
Measured Section
Measured Section
Measured Section
Drill hole No. 2
Drill hole No. 1
Oil/gas well No. 27-1 Kemmerer
Measured Section
Measured Section
Drill hole No. 2
Measured Section
Drill hole No. 1
Measured SectionNo. 33 (Diamond Coal &Coke Mine No. 2)
Measured Section
Page 4 of 5
-23-
Table 3. Continued
Plate 1 Index
Number
60
61
62
63
64
65
Source
Rocky Mountain Energy Co, unpublished data
Data Base
(no date), Measured Section
Drill hole No. 2, Line A
Drill hole No. 1, Line A
Glass, 1975, Geological Survey of Wyoming Report of Investigations No. 11, p. 72-78
Glass, 1975, Geological Survey of Wyoming Report of Investigations No. 11, p. 65-68
Hunter, 1950, Wyoming Geological Association Guidebook, p. 123-132
Measured Section No. 74-7, 74-8, and 74-9
Measured Section No. 74-4 and 74-5
Measured Section
Page 5 of 5

-24-
T. 20 N., R. 1131
3
Sorenson Mine
Quadrangle boundary
<""~VN
,10 S
1 !00 ft-j A*
^ h
I* ? :J>^7200 ^ "*
fi AflCM9.1 1-
ff ^ '11 h H fl-15 15 L^
/ In19 - 1L/15
«9.7
22
0| , 0 -5
Quadrangle boundary 6 W. /
32/i \ »
\ EXPLANATION ) y^ 5
^2 10\ ISOPACHS - Showing thickness of coal, in
^ feet. Isopach interval 5 feet.V
Tonn
^ 7300 1
"J STRUCTURE CONTOURS - Drawn on top of coal , bed. Solid where vertical accuracy
y within 40 feet. Contour interval 100 feet -1 (31 m). Datum is mean sea level. \ \
1 k 19.1 i / POINT OF MEASUREMENT - Showing thickness of
A 1 coal, in feet. Includes all points of ^ measurement other than drill holes. Hy
1 Av[8] - Adaville [8] V
^J COAL BED SYMBOL AND NAME - Coal bed iden- y tified by bracketed numbers is not formally
r named, but is numbered for identification * purposes in this quadrangle only.
_...,, ._L Aufai , ......
TRACE OF COAL BED OUTCROP - Showing symbol of name of coal bed as listed above. Arrow points toward coal-bearing area. Dashed where inferred.
14 x-rr"l~>> s<*\NOTE: Dips in mapped A >-^^.^ J areas exceed 15°. *r ^
' ^V^ ±**
COAL STRIP MINE - Hachures point toward mined area. Dashed where approximately located.
0 -j To convert feet to meters, multiply feet ^ by 0.3048.
.5 1 Miles i , i
1 Kilometers
FIGURE 1. Isopach and structure contour map of the Adaville [8] coal bed.

-25-
Quadrangle boundary
T. 20 N., R. 116 M. /31
Sorenson Mine
11
. 22
Quadrangle boundary
32
A 4
X 4 X
^ ^
EXPLANATION
100
OVERBURDEN ISOPACHS - Showing thickness of overburden, in feet, from surface to top of coal bed. Dashed where vertical accuracy possibly not within 40 feet.
10
MINING-RATIO CONTOUR - Number indicates cubic yards of overburden per ton of recoverable coal by surface mining methods. Contours shown only in areas underlain by coal of Reserve Base thickness within the stripping-limit (in this quadrangle, the 200-f oot-overburden isopach). To convert mining ratio to cubic meters of overburden per metric ton of recoverable coal, multiply mining ratio by 0.8428.
Av[8] - Adaville [8]
COAL BED SYMBOL AND NAME - Coal bed iden- tified by bracketed numbers is not formally named, but is numbered for identification purposes in this quadrangle only.
Av[8]
TRACE OF COAL BED OUTCROP - Showing symbol of name of coal bed as listed above. Dashed where inferred.
NOTE:
1 A14Overburden in this area is less than 200 feet (61 m).
COAL STRIP MINE - Hachures point toward mined area. Dashed where approximately located.
To convert feet to meters, multiply feet by 0.3048.
23
0 Miles .5
.5 i Kilometers
FIGURE 2. Overburden isopach and mining ratio map of the Adaville [8] coal bed.
-26-
Quadrangle boundary
^ 1
\
15
11
14
Quadrangle boundary
T. 19 N., R. 116 W.
NOTE: Dips In mappedareas exceed 15°.
EXPLANATION
ISOPACHS - Showing thickness of coal, in feet. Long dashed where inferred; short dashed where projected beyond coal-bearing area. Isopach interval 5 feet.
7100 6900
STRUCTURE CONTOURS - Drawn on top of coal bed. Long dashed where vertical accuracy possibly not within 40 feet. Contour interval 200 feet (61 m). Datum is mean sea level.
0 7074
DRILL HOLE - Showing altitude of top of coal bed, and thickness of coal, in feet.
A 7200 A 4.2
POINT OF MEASUREMENT - Showing altitude of top of coal bed, and thickness of coal, in feet. Includes all points of measurement other than drill holes.
Av[12] - Adaville. [12]
COAL BED SYMBOL AND NAME - Coal bed iden tified by bracketed numbers is not formally named, but is numbered for identification purposes in this quadrangle only.
J. Av[12]
TRACE OF COAL BED OUTCROP - Showing symbol of name of coal bed as listed above. Arrow points toward coal-bearing area. Dashed where inferred.
To convert feet to meters, Multiply feet by 0.3048.
1 Miles
1 Kilometers
FIGURE 3. Isopach and structure contour map of the Adaville [12] coal bed.

-27-
Quadrangle boundary/
1
\\ 10 11
NOTE: Overburden in this area is less than 200 feet (61 m).
14
Quadrangle boundary
T. 19 N., R. 116 W.
EXPLANATION
100
OVERBURDEN ISOPACHS - Showing thickness of overburden, in feet, from surface to top of coal bed. Dashed where vertical accuracy possibly not within 40 feet.
0192
DRILL HOLE - Showing thickness of over burden, in feet, from surface to top of coal bed.
10
MINING-RATIO CONTOUR - Number indicates cubic yards of overburden per ton of recoverable coal by surface mining methods. Contours shown only in areas underlain by coal of Reserve Base thickness within the stripping-limit (in this quadrangle, the 200-foot-overburden isopach). To convert mining ratio to cubic meters of overburden per metric ton of recoverable coal, multiply mining ratio by 0.8428.
Av[12] - Adaville [12]
COAL BED SYMBOL AND NAME - Coal bed iden tified by bracketed numbers is not formally named, but is numbered for identification purposes in this quadrangle only.
Av[12]
TRACE OF COAL BED OUTCROP - Showing symbol of name of coal bed as listed above. Dashed where inferred.
To convert feet to meters, multiply feet by 0.3048.
.5
.5
1 Miles
1 Kilometers
FIGURE 4. Overburden isopach and mining ratto map of the Adaville [12] coal bed.

-28-
Quadrangle boundary
1
-Av[14]
15
'6900
11
NOTE:Dips in mapped areas exceed 15°.
14
Quadrangle boundary
T. 19 N., R. 116 W.
EXPLANATION
ISOPACHS - Showing thickness of coal, in feet. Long dashed where inferred. Isopach interval 5 feet.
7100
STRUCTURE CONTOURS - Drawn on top of coal bed. Long dashed where vertical accuracy possibly not within 40 feet; short dashed where projected above ground surface. Contour interval 200 feet (61 m). Datum is mean sea level.
O 7119 6.0
DRILL HOLE - Showing altitude of top of coal bed, and thickness of coal, in feet.
A 7250 6.4
POINT OF MEASUREMENT - Showing altitude of top of coal bed, and thickness of coal, in feet. Includes all points of measurement other than drill holes.
Av[14] - Adaville [14]
COAL BED SYMBOL AND NAME - Coal bed iden tified by bracketed numbers is not formally named, but is numbered for identification purposes in this quadrangle only.
Av[14]
TRACE OF COAL BED OUTCROP - Showing symbol of name of coal bed^as listed above. Arrow points toward coal-bearing area. Dashed where inferred.
To convert feet to meters, Multiply feet by 0.3048.
.5 1 Miles
1 Kilometers
FIGURE 5. Isopach and structure contour map of the Adaville [14] coal bed.
-29-
Quadrangle boundary
1
NOTE:
26
15
11
Overburdtn In this area 1s less than 200 feet (61 m).
14
Quadrangle boundary
T. 19 N., R. 116 W.
EXPLANATION
100
OVERBURDEN ISOPACHS - Showing thickness of overburden, in feet, from surface to top of coal bed. Dashed where vertical accuracy possibly not within 40 feet.
026
DRILL HOLE - Showing thickness of over burden, in feet, from surface to top of coal bed.
10-
MINING-RATIO CONTOUR - Number indicates cubic yards of overburden per ton of recoverable coal by surface mining methods. Contours shown only in areas underlain by coal of Reserve Base thickness within the stripping-!imit (in this quadrangle, the 200-foot-overburden isopach). To convert mining ratio to cubic meters of overburden per metric ton of recoverable coal, multiply mining ratio by 0.8428.
Av[14] - Adaville [14]
COAL BED SYMBOL AND NAME - Coal bed iden tified by bracketed numbers is not formally named, but is numbered for identification purposes in this quadrangle only.
Av[14]
TRACE OF COAL BED OUTCROP - Showing symbol of name of coal bed as listed above. Dashed where inferred.
To convert feet to meters, multiply feet by 0.304B.
1 Miles
1 Kilometers
FIGURE 6, coal bed
Overburden isopach and mining ratio map of the Adaville [14]
-30-
REFERENCES
American Society for Testing and Materials, 1977, Standard specifica tion for classification of coals by rank, in Gaseous fuels; coal and coke; atmospheric analysis: ASTM Standard Specification D 388-77, pt. 26, p. 214-218.
Bozzuto, R. T., 1977, Geology of the Skull Point mine area, Lincoln County, Wyoming, in Rocky Mountain and thrust belt geology and resources, Joint Wyoming, Montana and Utah Geological Association Guidebook, 29th Annual Field Conference, 1977: p. 673-678.
Cobban, W. A., and Reeside, J. B., Jr., 1952, Frontier Formation, Wyoming and adjacent areas: American Association of Petroleum Geologists Bulletin, v. 36, no. 10, p. 1913-1961.
Engstrom, L. A., 1977, The Kemmerer coal field update, in Rocky Mountain and thrust belt geology and resources, Joint Wyoming, Montana and Utah Geological Association Guidebook, 29th Annual Field Conference, 1977: p. 679-687.
Glass, G. B., 1975, Analyses and measured sections of 54 Wyoming coal samples (collected in 1974): Wyoming Geological Survey, Report of Investigations No. 11, 219 p.
_____ 1977, Update on the Hams Fork coal region, in Rocky Mountain and thrust belt geology and resources, Joint Wyoming, Montana, and Utah Geological Association Guidebook, 29th Annual Field Conference, 1977: p. 689-706.
Hale, L. A., 1960, Frontier formation, Coalville, Utah, and nearby areas of Wyoming and Colorado, in Overthrust belt of southwestern Wyoming and adjacent areas, Wyoming Geological Association Guidebook, 15th Annual Field Conference, 1960: p. 136-146.
Hunter, W. S., Jr., 1950, The Kemmerer coal field, in Southwestern Wyoming, Wyoming Geological Association Guidebook, 5th Annual Field Conference, 1950: p. 123-132.
Lawrence, J. C-, 1963, Origin of the Wasatch Formation, Cumberland Gap area, Wyoming: University of Wyoming, Contributions to Geology, v. 2, no. 2, p. 151-158.
M'Gonigle, John, 1979a, Preliminary geologic map and coal resources of the Elkol quadrangle, Lincoln County, Wyoming: U.S. Geological Survey, unpublished map, scale 1:24,000.
_____ 1979b, Preliminary geologic map and coal resources of the Warfield Creek quadrangle, Lincoln County, Wyoming: U.S. Geological Survey, unpublished map, scale 1:24,000.
Mining Informational Services, 1978, Wyoming Directory of Mines, in 1978 Keystone Coal Industry Manual: New York, McGraw-HilT7 p. 1190-1191.

-31-
References Continued
Myers, R. C., 1977, Stratigraphy of the Frontier Formation (Upper Cretaceous), Kemmerer area, Lincoln County, Wyoming, in Rocky Mountain and thrust belt geology and resources, Joint Wyoming, Montana and Utah Geological Association Guidebook, 29th Annual Field Conference, 1977: p. 271-311.
Oriel, S. S., and Tracey, J. I., Jr., 1970, Uppermost Cretaceous and Tertiary stratigraphy of Fossil Basin, southwestern Wyoming: U.S. Geological Survey Professional Paper 635, 53 p.
Rocky Mountain Energy Company, (no date), Unpublished data from town ship maps T. 20 N., R. 116 W., and T. 19 N., R. 116 W., and from the Union Pacific coal inventory of 1969.
Roehler, H. W., Swanson, V. E., and Sanchez, J. D., 1977, Summary report of the geology, mineral resources, engineering geology and environ mental geochemistry of the Sweetwater-Kemmerer area, Wyoming, part A, geology and mineral resources: U.S. Geological Survey Open-File Report 77-360, 80 p.
Rubey, W. W., Oriel, S. S., and Tracey, J. I., Jr., 1975, Geology of the Sage and Kemmerer 15-minute quadrangles, Lincoln County, Wyoming: U.S. Geological Survey Professional Paper 855, 18 p.
Schroeder, M. L., and Lunceford, R. L., 1976, Preliminary geologic map and coal resources of the Cumberland Gap quadrangle, Lincoln and Uinta Counties, Wyoming: U.S. Geological Survey, unpublished map, scale 1:24,000.
Townsend, D. H., 1960, Economic report on the Kemmerer coal field, in Overthrust belt of southwestern Wyoming and adjacent areas, Wyoming Geological Association Guidebook, 15th Annual Field Con ference, 1960: p. 252-255.
U.S. Bureau of Land Management, 1971, BLM public lands guide, Rock Springs district, Wyoming: Ogden, Utah, scale 1:337,920.
_____ 1978, Draft environmental statement, proposed development of coal resources in southwestern Wyoming: U.S. Department of the Interior, v. 1 to 3.
U.S. Bureau of Mines, 1931, Analyses of Wyoming coals: U.S. Bureau of Mines Technical Paper 484, pp. 54-57, 115-121.
U.S. Bureau of Mines and U.S. Geological Survey, 1976, Coal resource classification system of the U.S. Bureau of Mines and U.S. Geolog ical Survey: U.S. Geological Survey Bulletin 1450-B, 7 p.
Veatch, A. C., 1906, Coal and oil in southern Uinta County, Wyoming: U.S. Geological Survey Bulletin 285-F, p. 331-353.
-32-
References Cont inued
_____ 1907, Geography and geology of a portion of southwestern Wyoming with special reference to coal and oil: U.S. Geological Survey Professional Paper 56, 178 p.
Weimer, R. J., 1960, Upper Cretaceous stratigraphy, Rocky Mountain area: American Association of Petroleum Geologists Bulletin, v. 44, no. 1, p. 1-20.
_____ 1961, Uppermost Cretaceous rocks in central and southern Wyoming, and northwest Colorado, in Symposium on the Late Cretaceous rocks in Wyoming and adjacent areas: Wyoming Geological Association Guide book, 16th Annual Field Conference, 1961: p. 17-28.
Wyoming Natural Resources Board, 1966, Wyoming weather facts: Cheyenne, p. 30-31.
Wyoming State Highway Commission, 1978, Wyoming official highway map: Cheyenne, Wyoming, approximate scale 1:140,000.