textile made-up sector amid covid-19 august, 2020
TRANSCRIPT
TEXTILE MADE-UP SECTOR AMID COVID-19 August, 2020
SECTOR UPDATE

2
VIS Credit Rating Company Limited
The COVID-19 pandemic is inflicting high and rising human costs across the world, and the necessary protection measures are severely impacting economic activity. This pandemic is expected to have much worse impact than the financial crisis of 2008-09 and is projected to contract the global economy by -3% in 2020.
IMF projects that advanced economies will contract by around 6% in 2020 while emerging markets and developing economies will contract by 1%. Meanwhile, with more people living close to the international poverty line (as explained by the share of the world’s population living on less than $1.90/day), the developing world, low- and middle-income countries will the greatest implications in terms of extreme poverty.
The global manufacturing growth which was already decelerating in 2019 due to the trade tensions among dominant economies is expected to further decline due to economic disruptions triggered by COVID-19.
Global Implications of COVID-19 – An Overview
VIS Credit Rating Company Limited
3
Textiles and Garments Supply Chain – Challenges for Developing Countries
The coronavirus pandemic led to a 3% drop in global trade values in the first quarter of 2020, according to United Nations Conference on Trade and Development (UNCTAD) forecasts.
The downturn is expected to accelerate in the second quarter, with global trade projected to record a quarter-on-quarter decline of 27%, according to the report by the Committee for the Coordination of Statistical Activities (CCSA).
Industries whose operations are more globalized (and particularly those that rely on Chinese inputs for production) were most exposed to initial supply chain disruption due to COVID-19. This was the case for precision instruments, machinery, automotive and communication equipment.
Given its non-essential nature, the fashion industry faces significant risks. Indeed, in times of pandemic, as majority consumers around the world remain in lockdown, they no longer need new products. This industry is characterized by a highly integrated global supply chain.
While many developing countries play the role of the supplier of low-cost inputs, many of which are dependent on textile and garments exports, are facing serious challenges and concerns.
4
VIS Credit Rating Company Limited
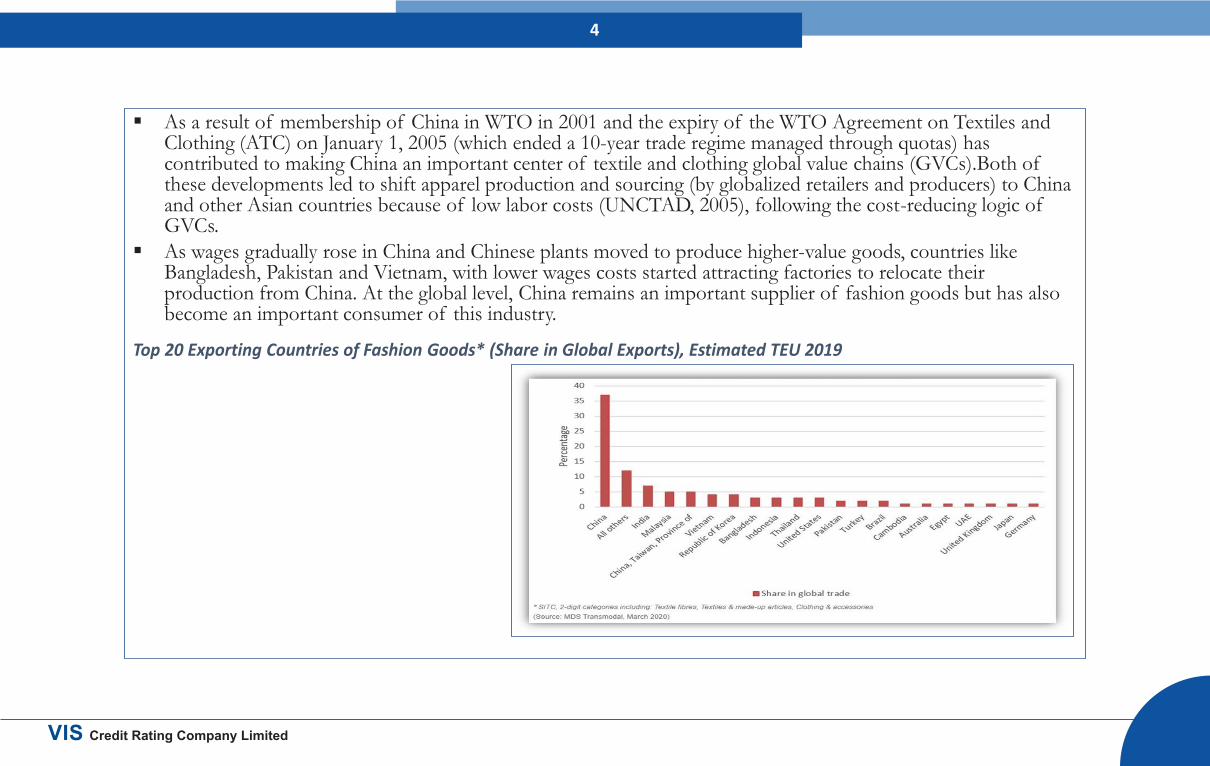
As a result of membership of China in WTO in 2001 and the expiry of the WTO Agreement on Textiles and Clothing (ATC) on January 1, 2005 (which ended a 10-year trade regime managed through quotas) has contributed to making China an important center of textile and clothing global value chains (GVCs).Both of these developments led to shift apparel production and sourcing (by globalized retailers and producers) to China and other Asian countries because of low labor costs (UNCTAD, 2005), following the cost-reducing logic of GVCs.
As wages gradually rose in China and Chinese plants moved to produce higher-value goods, countries like Bangladesh, Pakistan and Vietnam, with lower wages costs started attracting factories to relocate their production from China. At the global level, China remains an important supplier of fashion goods but has also become an important consumer of this industry.
Top 20 Exporting Countries of Fashion Goods* (Share in Global Exports), Estimated TEU 2019

VIS Credit Rating Company Limited
5
• Major exporters of fashion goods for whom exports in the sector represent a significant share of export earnings are shown in Figure below. Thus, the Asian country most severely impacted by the pandemic could be Bangladesh where 85% of its exports include fashion goods.
Top 20 exporting Countries of Fashion goods (Share in Total Country Exports), Estimated TEU 2019
6
VIS Credit Rating Company Limited
Emerging Concerns Related to Textile Sector from the Perspective of Developing Countries
Supply chain disruptions and reduced demand: As of yet, European and American retailers, the two destination markets for this sector, are still cancelling their
orders, causing serious concerns in many sourcing countries. As shippers are increasingly invoking „force majeure‟ clauses within their contracts to halt their payments, on
April 8, 2020, the Sustainable Textile of Asian Region (STAR) Network, the body, which brings together representatives of the producing associations from Bangladesh, Cambodia, China, Myanmar, Pakistan and Vietnam, released a joint statement on the issue.
It insisted brands and retailers to consider the impact that their purchasing decisions during the coronavirus pandemic could have on workers and small businesses in the supply chain and, therefore, to honor their contracts with their suppliers.
In their statement, the STAR Network invited global businesses to “support business partners in the supply chain as much as possible, and aim at a long-term strategy of business continuity, supply chain unity and social sustainability.”
7
VIS Credit Rating Company Limited
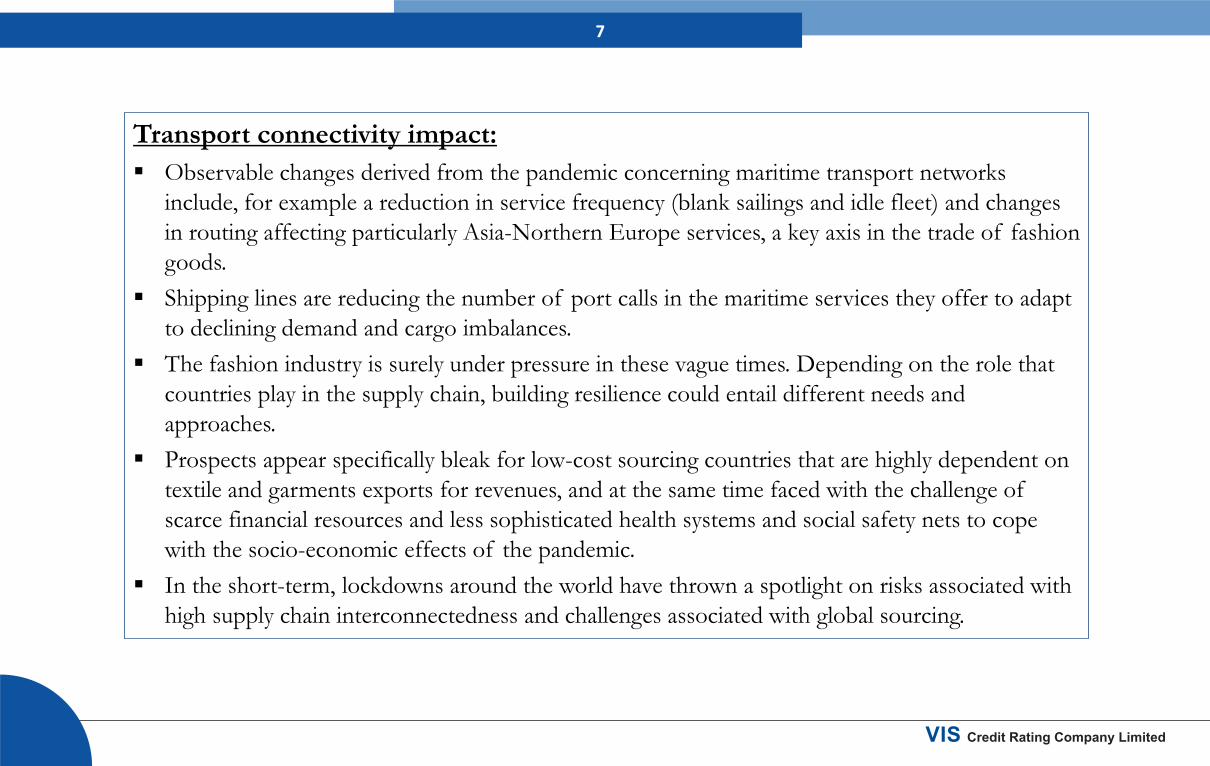
Transport connectivity impact: Observable changes derived from the pandemic concerning maritime transport networks
include, for example a reduction in service frequency (blank sailings and idle fleet) and changes in routing affecting particularly Asia-Northern Europe services, a key axis in the trade of fashion goods.
Shipping lines are reducing the number of port calls in the maritime services they offer to adapt to declining demand and cargo imbalances.
The fashion industry is surely under pressure in these vague times. Depending on the role that countries play in the supply chain, building resilience could entail different needs and approaches.
Prospects appear specifically bleak for low-cost sourcing countries that are highly dependent on textile and garments exports for revenues, and at the same time faced with the challenge of scarce financial resources and less sophisticated health systems and social safety nets to cope with the socio-economic effects of the pandemic.
In the short-term, lockdowns around the world have thrown a spotlight on risks associated with high supply chain interconnectedness and challenges associated with global sourcing.

VIS Credit Rating Company Limited
8
Textile Industry of Pakistan
Most important manufacturing sector of Pakistan.
Have the longest value chain.
The sector contributes nearly one-fourth to industrial value-added segment and 8.5% to the GDP of Pakistan.
Provides employment to around 40% of industrial labor force.
Except for seasonal and cyclical fluctuations, textile products have maintained a share of about 59% in national exports. Characterized by large-scale organized sector as well as unorganized cottage/ small and medium units.

VIS Credit Rating Company Limited
9
An Overview of Pakistan Textile Sector
Cotton Spinning Sector
• Backbone of textile value chain
• Comprises 517 textile units (40 composite units and 477 spinning units)
• With 13.4 million spindles and 198,801 rotors installed and capacity utilization of 84.6% and 63.7%, respectively during FY19.
Cloth Sector
• Problems of power loom sector are mainly caused by poor technology and scarcity of quality yarn.
• Installed looms are 9,084 and operational looms are 6,384.
• Moreover, production in mill sector is reported, while in non-mill sector is not reported.
Textile Made-Up Sector
• Highest value-added segment of textile sector.
• Comprised different sub-sectors namely, hosiery, ready-made garments, towel industry, canvas, synthetic textile fabrics, woolen industry and jute industry
10
VIS Credit Rating Company Limited
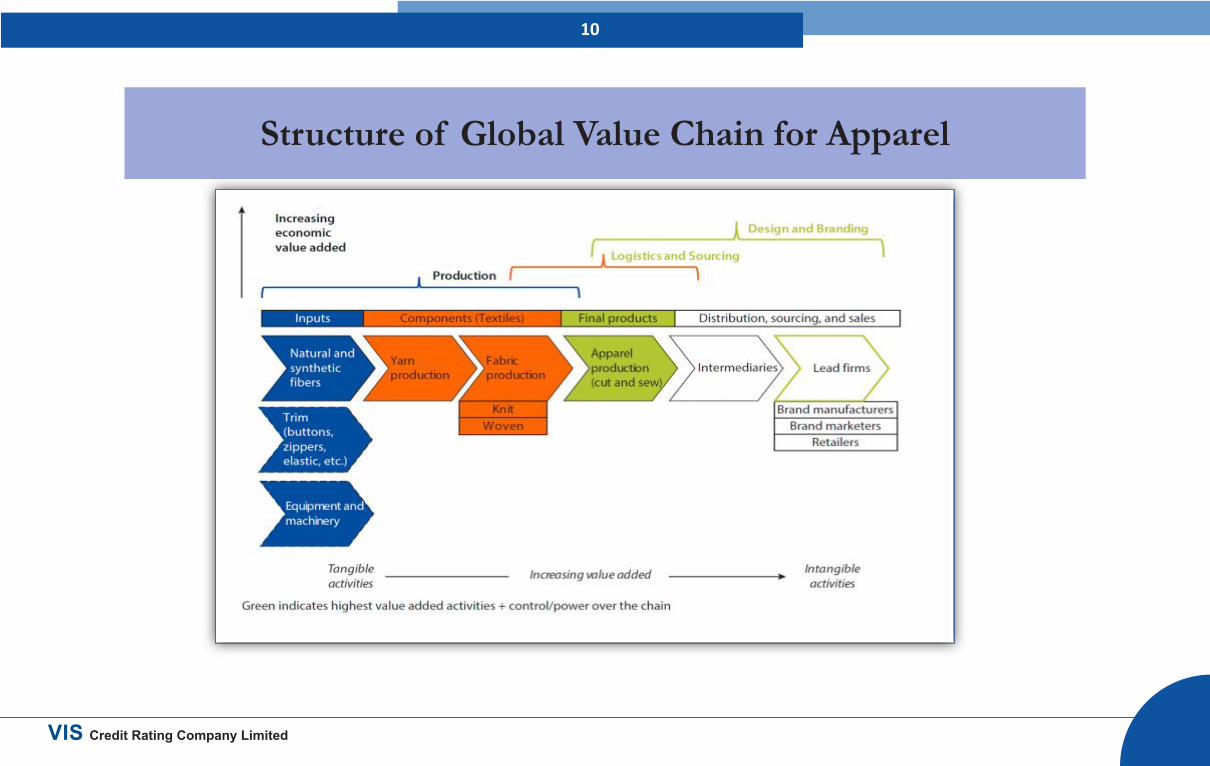
Structure of Global Value Chain for Apparel
11
VIS Credit Rating Company Limited
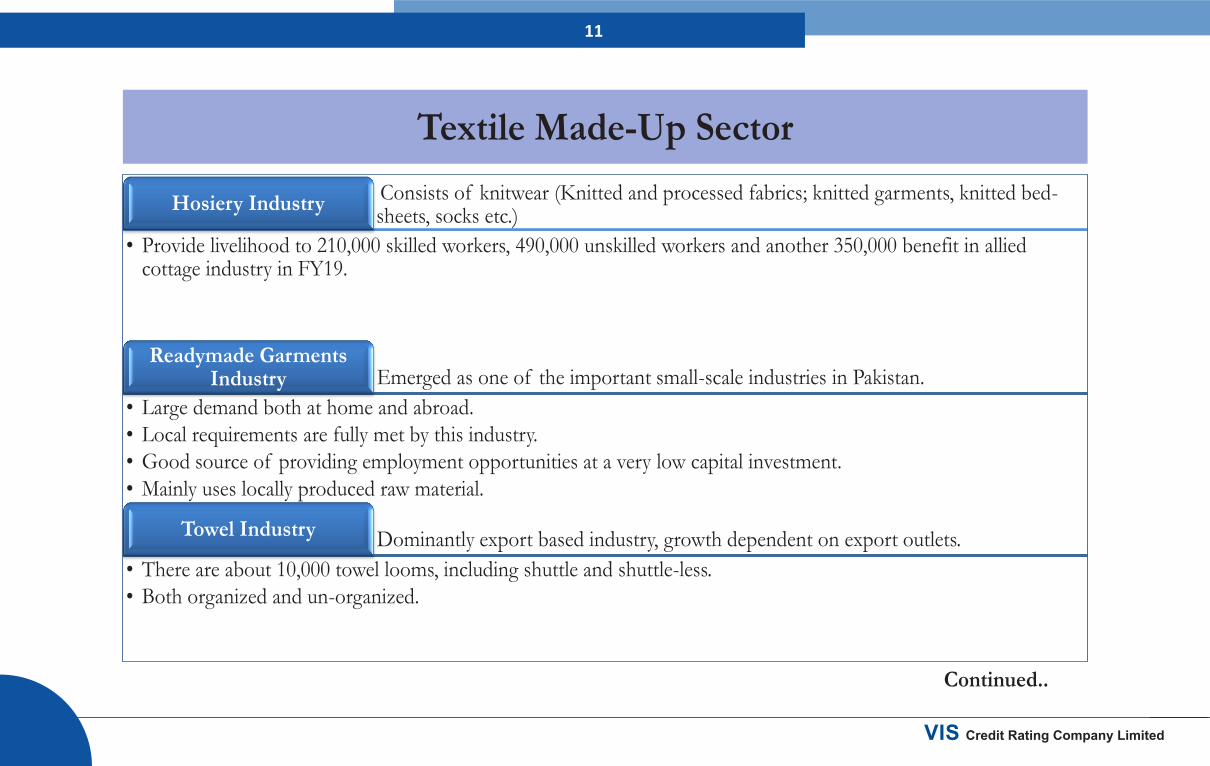
Textile Made-Up Sector Consists of knitwear (Knitted and processed fabrics; knitted garments, knitted bed-sheets, socks etc.) Hosiery Industry
• Provide livelihood to 210,000 skilled workers, 490,000 unskilled workers and another 350,000 benefit in allied cottage industry in FY19.
Emerged as one of the important small-scale industries in Pakistan. Readymade Garments
Industry • Large demand both at home and abroad. • Local requirements are fully met by this industry. • Good source of providing employment opportunities at a very low capital investment. • Mainly uses locally produced raw material.
Dominantly export based industry, growth dependent on export outlets. Towel Industry
• There are about 10,000 towel looms, including shuttle and shuttle-less. • Both organized and un-organized.
Continued..

12
VIS Credit Rating Company Limited
Has great potential for export; 60% of its production is exported while 40% is locally consumed. Canvas
• Also known as raw cotton consuming sector. • Production capacity is 100 million Sq. meters.
Synthetic fibers, Nylon, Polyester, Acrylic and Polyolefin dominate the market. Synthetic Textile Fabrics
• Currently five major producers of synthetic fibers in Pakistan. • With a capacity of 636,000 tons per annum.
Main products manufactured by woolen industry are carpets and rugs (coarser quality wool) Woolen Industry
• Woolen textile and clothing sector is almost non-existent as compared to other cotton and man-made fibers based textile and clothing industry.
Jute Industry The main products manufactured by this industry are Jute Sacks and Hessian cloth.
• Used for packing and handling of Wheat, Rice and Food Grains. • There are 10 units of Jute industry in the country, with 24,712 spindles and 1,072 looms installed as of now.

13
• Within the textiles chain, ready-made garments manufacturing is the segment that is the most labor and least energy intensive. It is also the highest value addition segment, and the one best suited to Pakistan’s comparative advantage.
• The local needs are catered by various recognized brands and non-branded clothing manufacturers.
VIS Credit Rating Company Limited

14
VIS Credit Rating Company Limited
• The garments sector of Pakistan also caters various international brands.
15
Overall Downturn in Manufacturing Sector
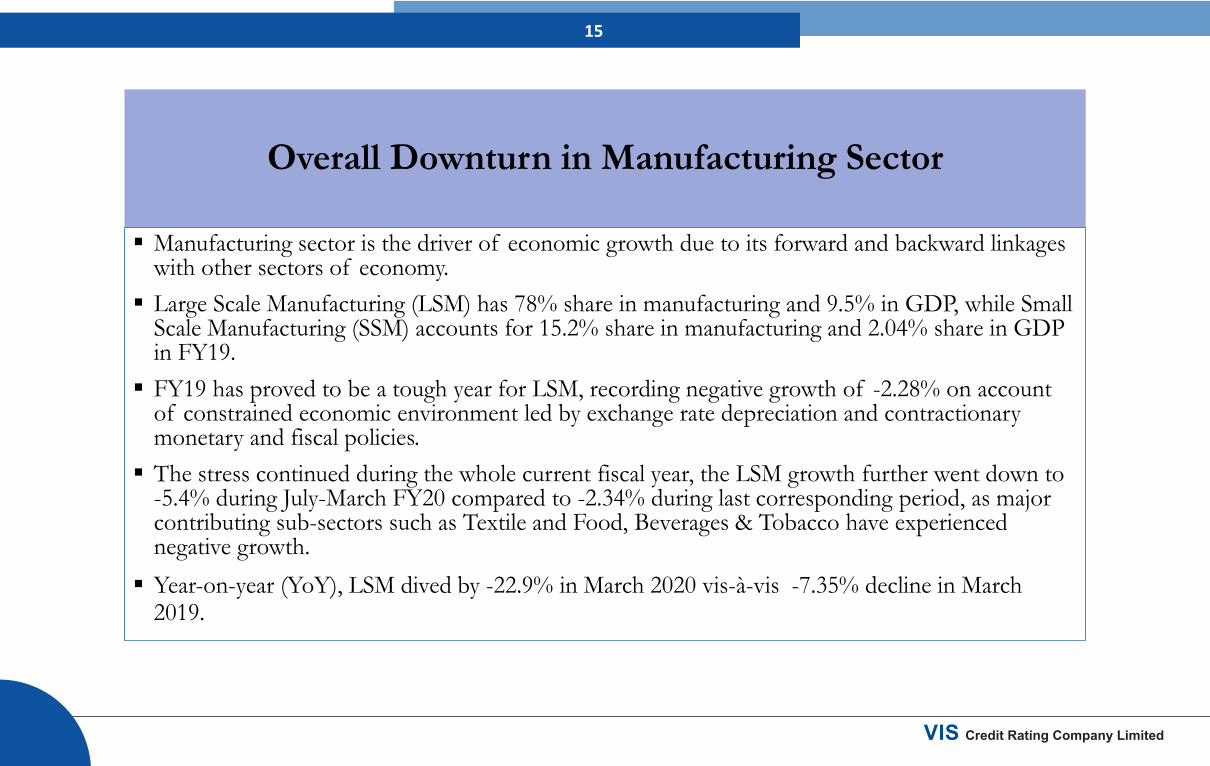
Manufacturing sector is the driver of economic growth due to its forward and backward linkages with other sectors of economy.
Large Scale Manufacturing (LSM) has 78% share in manufacturing and 9.5% in GDP, while Small Scale Manufacturing (SSM) accounts for 15.2% share in manufacturing and 2.04% share in GDP in FY19.
FY19 has proved to be a tough year for LSM, recording negative growth of -2.28% on account of constrained economic environment led by exchange rate depreciation and contractionary monetary and fiscal policies.
The stress continued during the whole current fiscal year, the LSM growth further went down to -5.4% during July-March FY20 compared to -2.34% during last corresponding period, as major contributing sub-sectors such as Textile and Food, Beverages & Tobacco have experienced negative growth.
Year-on-year (YoY), LSM dived by -22.9% in March 2020 vis-à-vis -7.35% decline in March 2019.
VIS Credit Rating Company Limited
16
VIS Credit Rating Company Limited
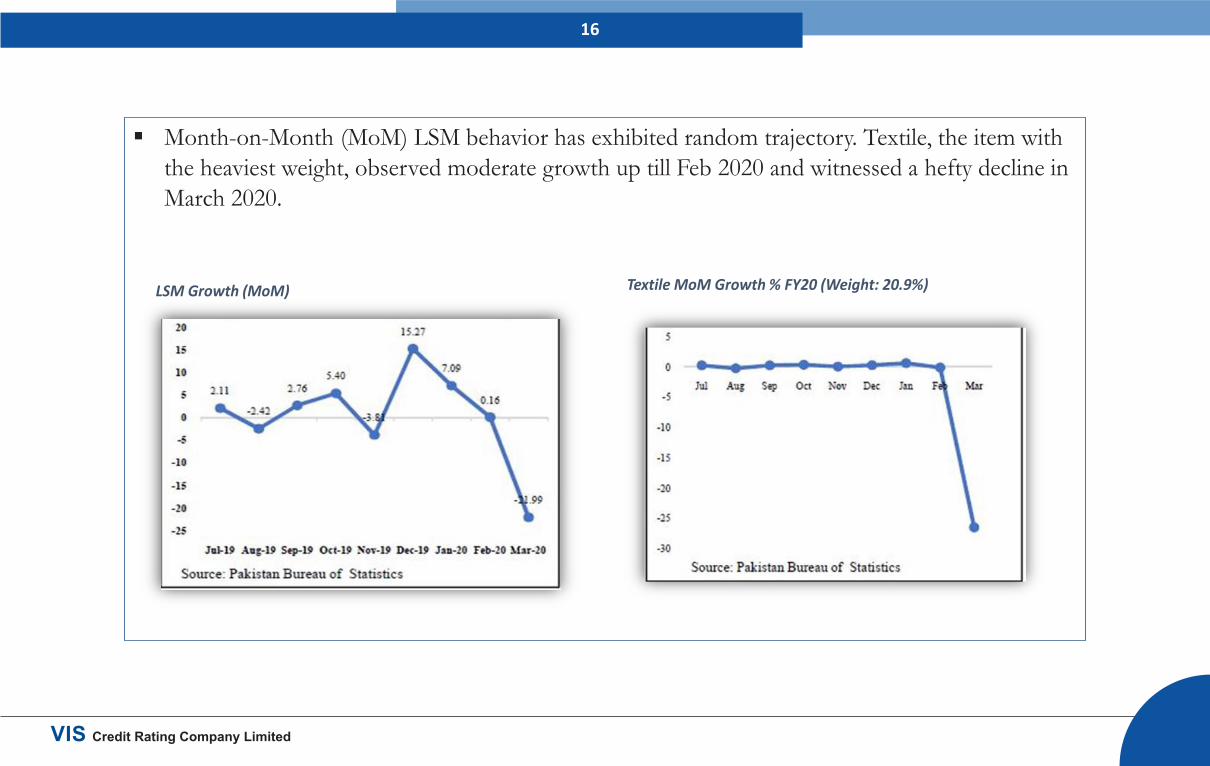
Month-on-Month (MoM) LSM behavior has exhibited random trajectory. Textile, the item with the heaviest weight, observed moderate growth up till Feb 2020 and witnessed a hefty decline in March 2020.
LSM Growth (MoM)
Textile MoM Growth % FY20 (Weight: 20.9%)

17
Table: Group-Wise Growth of LSM for the Period of Jul-Mar 2019-20 Vs Jul-Mar 2018-19
S# Groups Weights % Change (July-March)
2018-19 2019-20
1 Textile 20.9 -0.17 -2.57
2 Food, Beverages & Tobacco 12.4 -3.59 -2.33
3 Coal & Petroleum Products 5.5 -6.00 -17.46
4 Pharmaceuticals 3.6 -8.66 -5.38
5 Chemicals 1.7 -4.10 -2.30
6 Automobiles 4.6 -7.56 -36.50
7 Iron & Steel Products 5.4 -11.00 -7.96
8 Fertilizers 4.4 4.50 5.81
9 Electronics 2.0 39.90 -13.54
10 Leather Products 0.9 -0.04 4.96
11 Paper & Board 2.3 -2.48 4.23
12 Engineering Products 0.4 9.90 -7.05
13 Rubber Products 0.3 3.74 4.31
14 Non-Metallic Mineral Products 5.4 -4.93 1.82
15 Wood Products 0.6 -8.24 -22.11
VIS Credit Rating Company Limited
18
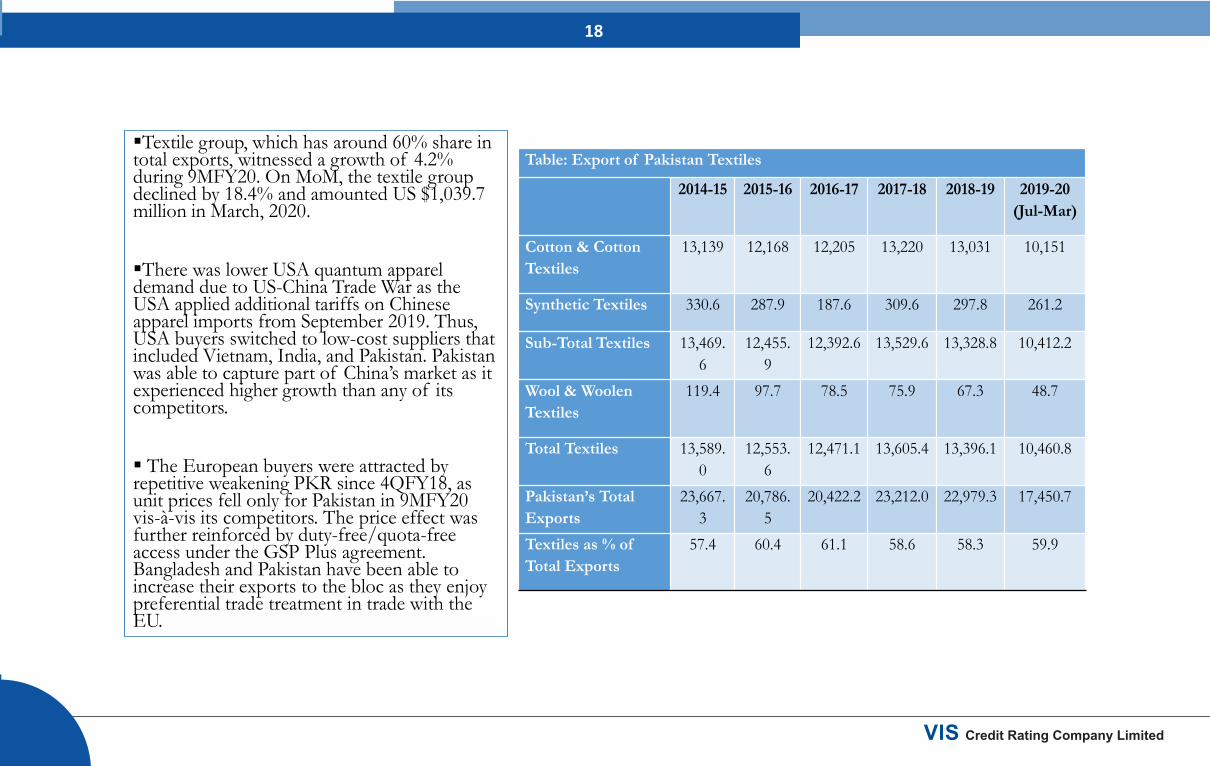
Textile group, which has around 60% share in total exports, witnessed a growth of 4.2% during 9MFY20. On MoM, the textile group declined by 18.4% and amounted US $1,039.7 million in March, 2020. There was lower USA quantum apparel demand due to US-China Trade War as the USA applied additional tariffs on Chinese apparel imports from September 2019. Thus, USA buyers switched to low-cost suppliers that included Vietnam, India, and Pakistan. Pakistan was able to capture part of China’s market as it experienced higher growth than any of its competitors. The European buyers were attracted by repetitive weakening PKR since 4QFY18, as unit prices fell only for Pakistan in 9MFY20 vis-à-vis its competitors. The price effect was further reinforced by duty-free/quota-free access under the GSP Plus agreement. Bangladesh and Pakistan have been able to increase their exports to the bloc as they enjoy preferential trade treatment in trade with the EU.
Table: Export of Pakistan Textiles
2014-15 2015-16 2016-17 2017-18 2018-19 2019-20 (Jul-Mar)
Cotton & Cotton Textiles
13,139 12,168 12,205 13,220 13,031 10,151
Synthetic Textiles 330.6 287.9 187.6 309.6 297.8 261.2
Sub-Total Textiles 13,469.6
12,455.9
12,392.6 13,529.6 13,328.8 10,412.2
Wool & Woolen Textiles
119.4 97.7 78.5 75.9 67.3 48.7
Total Textiles 13,589.0
12,553.6
12,471.1 13,605.4 13,396.1 10,460.8
Pakistan’s Total Exports
23,667.3
20,786.5
20,422.2 23,212.0 22,979.3 17,450.7
Textiles as % of Total Exports
57.4 60.4 61.1 58.6 58.3 59.9
VIS Credit Rating Company Limited
19
VIS Credit Rating Company Limited
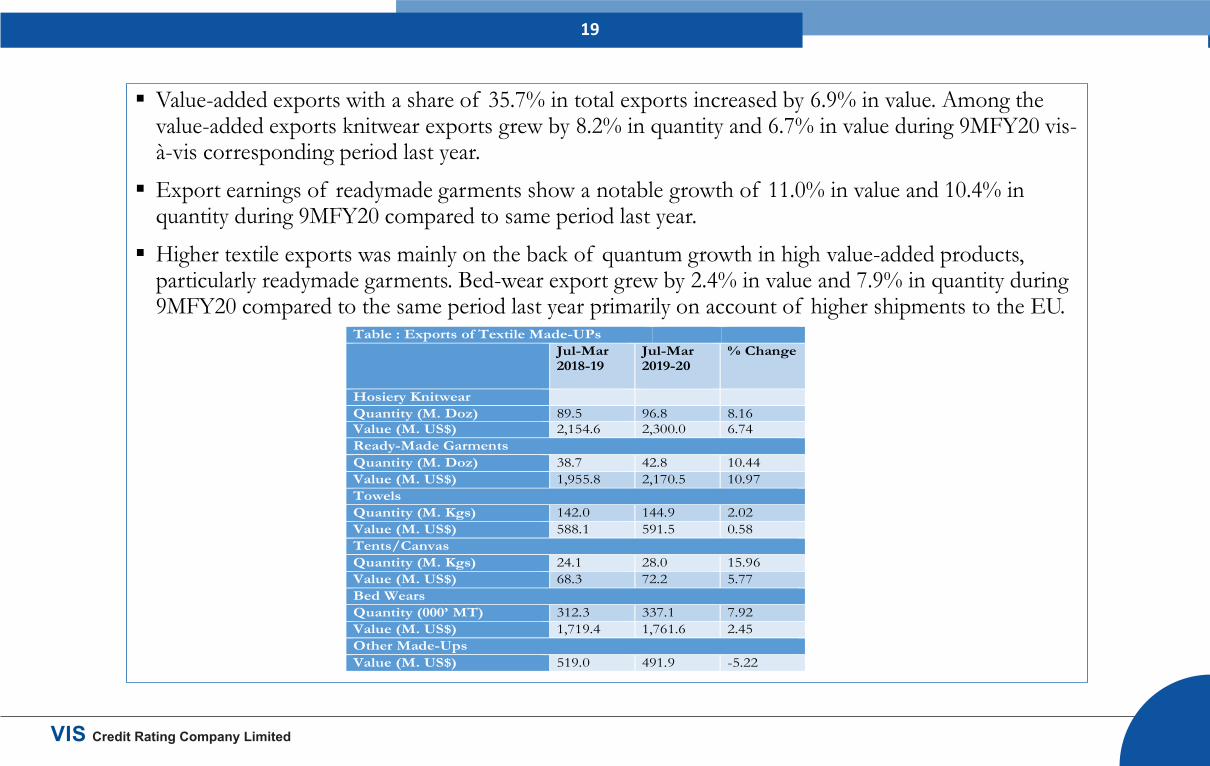
Value-added exports with a share of 35.7% in total exports increased by 6.9% in value. Among the value-added exports knitwear exports grew by 8.2% in quantity and 6.7% in value during 9MFY20 vis-à-vis corresponding period last year.
Export earnings of readymade garments show a notable growth of 11.0% in value and 10.4% in quantity during 9MFY20 compared to same period last year.
Higher textile exports was mainly on the back of quantum growth in high value-added products, particularly readymade garments. Bed-wear export grew by 2.4% in value and 7.9% in quantity during 9MFY20 compared to the same period last year primarily on account of higher shipments to the EU.
Table : Exports of Textile Made-UPs Jul-Mar
2018-19 Jul-Mar 2019-20
% Change
Hosiery Knitwear Quantity (M. Doz) 89.5 96.8 8.16 Value (M. US$) 2,154.6 2,300.0 6.74 Ready-Made Garments Quantity (M. Doz) 38.7 42.8 10.44 Value (M. US$) 1,955.8 2,170.5 10.97 Towels Quantity (M. Kgs) 142.0 144.9 2.02 Value (M. US$) 588.1 591.5 0.58 Tents/Canvas Quantity (M. Kgs) 24.1 28.0 15.96 Value (M. US$) 68.3 72.2 5.77 Bed Wears Quantity (000’ MT) 312.3 337.1 7.92 Value (M. US$) 1,719.4 1,761.6 2.45 Other Made-Ups Value (M. US$) 519.0 491.9 -5.22 Source: Ministry of Textile
20
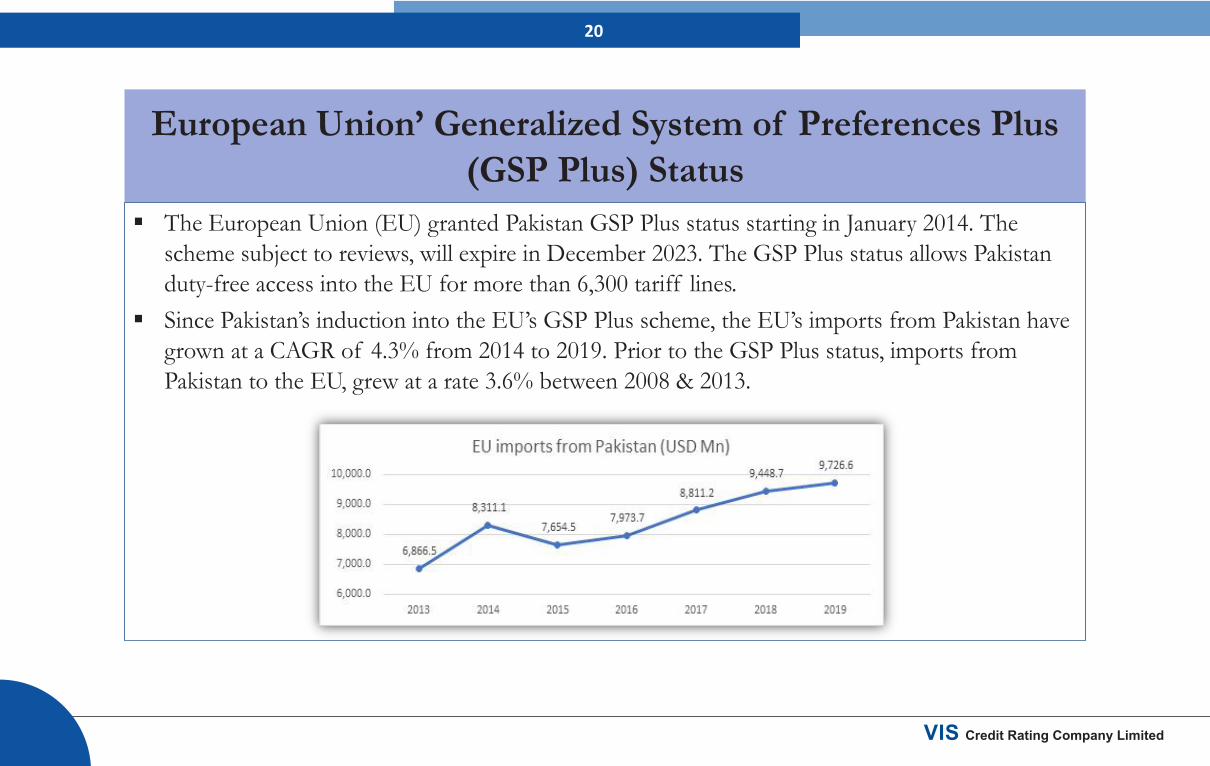
European Union’ Generalized System of Preferences Plus (GSP Plus) Status
The European Union (EU) granted Pakistan GSP Plus status starting in January 2014. The scheme subject to reviews, will expire in December 2023. The GSP Plus status allows Pakistan duty-free access into the EU for more than 6,300 tariff lines.
Since Pakistan’s induction into the EU’s GSP Plus scheme, the EU’s imports from Pakistan have grown at a CAGR of 4.3% from 2014 to 2019. Prior to the GSP Plus status, imports from Pakistan to the EU, grew at a rate 3.6% between 2008 & 2013.
VIS Credit Rating Company Limited

21
The EU’s imports from Pakistan have risen from US$ 6.8 billion in 2013 to US$ 9.7 billion in 2019. However, Pakistan market share has remained largely stagnant during this period.
In the US$ 6.2 trillion EU import market, Pakistan’s share in 2019 was only 0.16%.
VIS Credit Rating Company Limited
22
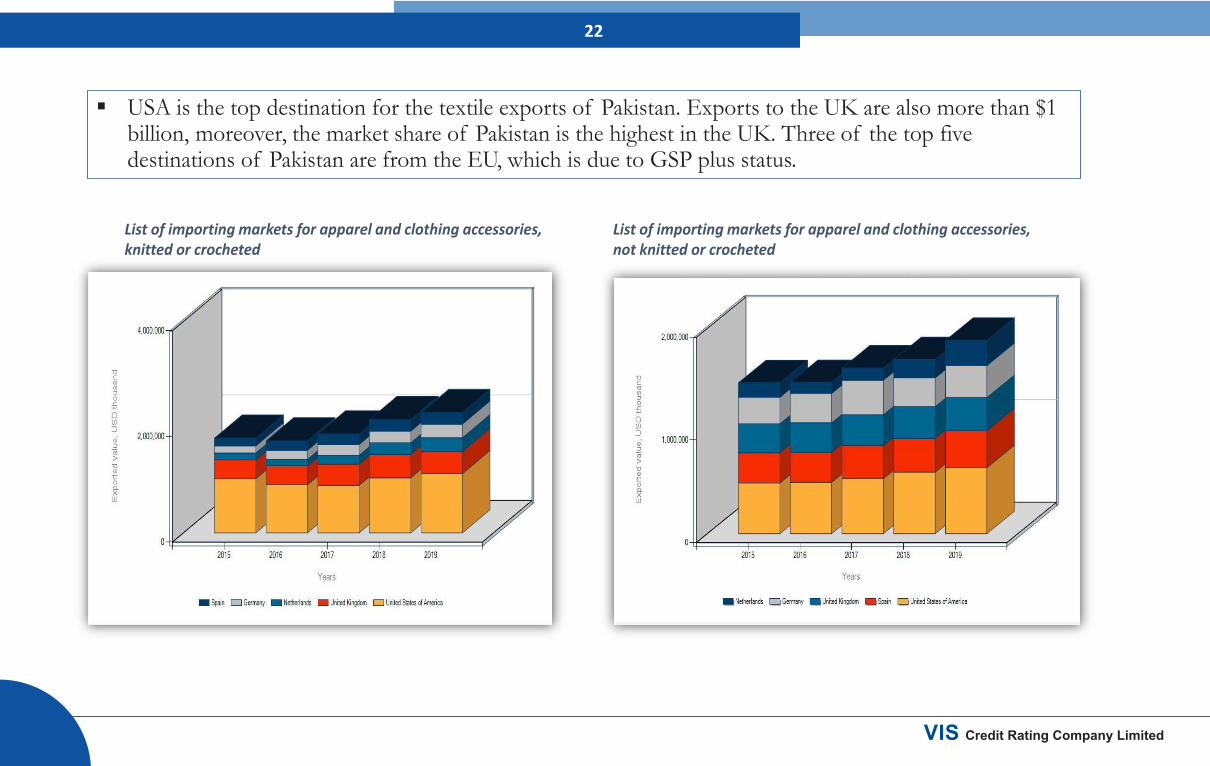
USA is the top destination for the textile exports of Pakistan. Exports to the UK are also more than $1 billion, moreover, the market share of Pakistan is the highest in the UK. Three of the top five destinations of Pakistan are from the EU, which is due to GSP plus status.
List of importing markets for apparel and clothing accessories, knitted or crocheted
List of importing markets for apparel and clothing accessories, not knitted or crocheted
VIS Credit Rating Company Limited

23
Key Issues Related to Slower Textile Exports
Despite having duty-free access for nearly all tariff line for the last six years, Pakistan’s market share has remained stagnant as it has not focused on items which are imported by the EU in large quantities, nor has it focused on items which have witnessed high rates of growth in the EU’s import basket.
Textile consumer preferences are shifting from cotton-based apparel to synthetic man-made apparel. In the world market, consumption of man-made or synthetic fibres against natural fibres has shifted to a ratio of 70:30, with synthetic fibres having the lions share, while a decade ago it was 30:70.
Pakistan has lagged far behind the global market players in the area of man-made textile products and failed to make inroads into synthetic market globally on account of heavily imposed import duties on raw materials required for the production of synthetic fibres. Apparel and Homes Textiles imported from Pakistan by the EU at best have a cotton-PSF mix of around 80:20.
The import duty on Polyester Staple Fibre (PSF) which is spun to make Man-Made Fibre (MMF) yarns reaches up to 20% (7% import duty and 2.9% to 11.5% anti-dumping duty).
Continued…
VIS Credit Rating Company Limited

24
Amidst the ongoing crisis, foreign exchange spent on the import of MMF yarns from Indonesia, China, Thailand and India is around Rs 12 billion to Rs. 16 billion. In Pakistan, the domestic production of polyester viscose blended yarns is approximately 165,000 tons per annum. More than 50,000 tons of PSF yarns are imported per annum. This is equivalent to the production of almost 15-20 domestic mills in the business of 100% polyester, polyester viscose blended, viscose or polyester yarns and other synthetic fibre-blended yarns spun out of a total of 45-50 mills.
Pakistan needs to have a focused strategy to increase its market share in EU imports as well to have a strong presence in items which have witnessed large increase in demand in EU.
Continued…
Import of Textile Group
VIS Credit Rating Company Limited

25
Another issue is 1.5% Turnover Tax/ Minimum Tax. This tax increases cost of exports by an average 5-6 % as the tax is levied on the same goods multiple times as it passes through the value chain. The textile industry generally works on thin margins.
Energy accounts for around 35% of conversion costs in the textile value chain and therefore competitive pricing of exports is very highly sensitive to energy pricing. It had been agreed that Rs. 20 billion will be allocated for energy for use in maintaining 7.5 cents/kwh for electricity and $ 6.5/MMBTU for RLNG/Gas. However, the in the Budget 2020-21, only Rs. 10b has been allocated for RLNG.
Pakistan's duty and tax remission for export (DTRE) program is highly inefficient, as it can take two to four months to import synthetic fibers, leading to delays and uncertainties in production that are not acceptable to global buyers.
VIS Credit Rating Company Limited

26
COVID-19 and Pakistan’s Exports Since March 15, 2020 a significant decline in trade shipments was witnessed as the coronavirus cases spiked in
major export destinations, primarily in Europe and North America. Moreover, exports through the land routes were almost non-existent during the month as Iran, Afghanistan and Pakistan shut down their respective borders to contain the pandemic.
With only a few buyers were honoring their import commitments with local manufacturers, exports were expected to decline during the month of April. Details showed exports of ready-made garments dipped by 69.5% in value (in PKR millions) in April 2020 over March 2020 and 69.1% over April 2019, while those of knitwear dipped 54.4% in value (in PKR millions) over March 2020 and 55.4% over April 2019, bed wear posted negative growth of 51.3% in value (in PKR millions) over March 2020 and 50.5% over April 2019.
S# Commodities % Change for value in million Rupees in April, 2020 over March, 2020 April, 2019 1 Rice Others 7.65 8.89 2 Knitwear -54.35 -55.44 3 Basmati Rice 36.26 41.36 4 Bed Wear -51.31 -50.54 5 Readymade Garments -69.52 -69.06 6 Cotton Cloth -66.84 -64.74 7 Cotton Yarn -51.16 -57.24 8 Fish & Fish Preparations -25.67 -40.90 9 Plastic Materials 14.90 51.84 10 Meat & Meat Preparations 14.91 3.35
Continued…
VIS Credit Rating Company Limited

27
Given the permission granted by the government to export Personal Protective Equipment (PPE), textile exports are picking up pace.
According to the provisional figures compiled by the PBS, exports from Pakistan during June, 2020 amounted to Rs. 263,988 million (provisional) as against Rs. 223,536 million (provisional) in May, 2020 and Rs. 264,345 million during June, 2019 showing an increase of 18.10% over May, 2020.
In terms of US dollars the exports in June, 2020 were $ 1,599 million (provisional) as compared to $ 1,396 million (provisional) in May, 2020 showing an increase of 14.54% but decreased by 6.11% as compared to $ 1,703 million in June 2019.
Exports during July – June, 2019 - 2020 totaled Rs. 3,369,809 million (provisional) as against Rs. 3,128,230 million during the corresponding period of last year showing an increase of 7.72%. Meanwhile, in terms of US dollars the exports during July – June, 2019 - 2020 totaled $ 21,394 million (provisional) against $ 22,958 million during the corresponding period of last year showing a decrease of 6.81%.
Continued…
VIS Credit Rating Company Limited

28
Main commodities of exports during June, 2020 were knitwear (Rs. 36,549 million), readymade garments (Rs. 30,542 million), bed wear (Rs. 27,462 million), cotton cloth (Rs. 21,495 million), rice others (Rs. 17,043 million), cotton yarn (Rs. 12,271 million), towels (Rs.9,727 million), basmati rice (Rs. 7,887 million), made-up articles (excl. towels & bed wear) (Rs.7,018 million) and fruits (Rs. 5,498 million).
S# Commodities % Change for value in million Rupees in June, 2020 over May, 2020 June, 2019 1 Knitwear 26.20 2.26 2 Readymade Garments 40.69 -8.10 3 Bed Wear 17.46 1.73 4 Cotton Cloth 36.64 -13.23 5 Rice Others -15.12 22.45 6 Cotton Yran 47.42 2.21 7 Towels 45.88 14.35 8 Basmati Rice -39.92 -3.63 9 Made-up Articles (excl. towels & bed wear) 26.75 1.42 10 Fruits 271.74 59.97
VIS Credit Rating Company Limited

29
This section covers financial analysis of textile manufacturing companies, within textile made-up
universe rated by VIS. Nearly all of these companies are vertically integrated manufacturing units, with a wide product range including readymade garments, denim fabric, denim garments, apparel for men and women, towels, home textile, knitted apparel, hotel and restaurant linen, hospital gowns, shower curtains, grey, dyed and processed fabric.
Financial profile of large integrated players have improved on a timeline basis with increase in equity base mainly due to profit retention.
Due to local currency depreciation, sales of these companies have grown at a three year CAGR of 9.0% (base year 2017), given around 90% of the revenue constituting export sales. The same trend has been observed in 1HFY20 sales of almost all players.
Gross margins vary across different companies and depends upon sales mix, whereby companies having greater weight of high value-added products in the sales mix have reported higher margins. Meanwhile, margins have remained stagnant over the last two years of majority of the players due to increasing competition, rising input costs and higher cost of doing business.
Financial Analysis of Textile Made-Up Sector Companies Rated by VIS
Continued…
VIS Credit Rating Company Limited

30
Debt profile of these companies is a mix of long-term and short-term debt and has witnessed an increasing trend due to capital expenditures and to meet higher working capital needs .
Liquidity profile of the industry remains healthy with strong cash flows in relation to outstanding obligations having sound debt servicing ability.
As the situation is currently evolving, performance of these companies depends on honoring of commitments by international buyers and diversification of product portfolio to compete with international competitors.
FFO: Funds from Operations DSCR: Debt Service Coverage Ratio
VIS Rated Garments Manufacturing Companies FY17 FY18 FY19 Average Sales (in PKR millions) 13,693 16,222 19,317 Average Gross Margins (%) 13.4% 15.7% 15.6% Average Gearing (x) 1.11 1.10 1.08 Average FFO to Total Debt (x) 2.79 0.49 0.56 Average DSCR (x) 5.57 8.03 8.77 Average Equity (in PKR millions) 7,370 8,383 10,028 Average Long Term Debt (in PKR millions) 2,290 2,523 2,916 Average Short Term Debt (in PKR millions) 4,007 4,987 5,926 Average Total Debt (in PKR millions) 6,297 7,510 8,842
VIS Credit Rating Company Limited

31
Sources
World Bank Blogs PovcalNet United Nations Conference on Trade and Development (UNCTAD) Committee for the Coordination of Statistical Activities (CCSA) JOC.com Pakistan Bureau of Statistics (PBS) Ministry of Textile Industry- Pakistan All Pakistan Textile Mills Association (APTMA) United Nations Industrial Development Organization (UNIDO) Pakistan Economic Survey 2019-20 Textile Commissioner’s Organization (TCO) Trade Map-International Trade Center (ITC) Dawn News Pakistan Business Council (PBC)
Analyst’s Contact Tayyaba Ijaz Assistant Manager [email protected]
VIS Credit Rating Company Limited