textile mills limited - idreestextile.comidreestextile.com/products/gallery/invinfdocur79.pdf ·...
TRANSCRIPT

TEXTILE MILLS LIMITED

BOARD OF DIRECTORS Mr. S.M. Idrees Allawala
Mr. S. M. Mansoor Allawala
Mr. Kamran Idrees Allawala
Mr. Naeem Idrees Allawala
Mr. Omair Idrees Allawala
Mr. Rizwan Idrees Allawala
Mr. Muhammad Israil
Mr. Muhammad Saeed
Mr. Rizwan Idrees Allawala
Mr. Muhammad Saeed
Mr. Muhammad Israil
Syed Shahid Sultan
M/s. Deloitte Yousuf Adil
Chartered Accountants
Mr.Mr.Mr. Muhammad
Kamran Idrees AllawalaRizwan Idrees Allawala
Saeed
- Chairman- Member- Member
- Chairman
- CEO
- Director
- Director
- Director
- Director
- Director
- Director
- Chairman
- Member
- Member
- Secretary
AUDIT COMMITTEE
Mr. Muhammad JawaidCHIEF FINANCIAL OFFICER
Syed Shahid SultanCOMPANY SECRETARY
AUDITORS
HUMAN RESOURCE &REMUNERATIONCOMMITTEE
National Bank of PakistanBank Alfalah LimitedHabib Metropolitan Bank Ltd.Soneri Bank LimitedUnited Bank Ltd. (UBL Ameen)Silk Bank Ltd.Meezan Bank Ltd.Bank of Punjab Ltd.BankIslami Pakistan Ltd.Bank Al Habib Ltd.Dubai Islamic Bank Pakistan Ltd.
6-C, Ismail Centre, 1st Floor,
Central Commercial Area,
Bahadurabad,
Karachi - 74800.
BANKERS
REGISTERED OFFICE
SHARES REGISTRAR
MILLS
M/S. NI Associates (Pvt) Ltd.
Kot Shah Mohammad,
Tehsil Nankana,
District Nankana,
Punjab.

KarachiFebruary 29, 2016
S.M. Idrees AllawalaChairman
for and on behalf of the Board
The Board sincerely appreciates the continued support of the bankers,customers, suppliers and shareholders and the untiring services rendered by theemployees.
The Directors of your Company are pleased to present the condensed interimfinancial information of the Company for the half year ended December 31, 2015duly reviewed by the auditors.
Sales during the period under review amounted to Rs. 913.215 million ascompared to Rs.1,157.240 million during the corresponding period which showsa decrease of 21.09%. Finance cost amounted to Rs. 45.734 million ascompared to Rs. 41.932 million in the comparable period of last year. Loss aftertax worked out to Rs. 44.111 million during the period as compared to profit ofRs. 24.236 million in the corresponding period. Loss per share amounted toRs. 2.44 as compared to earnings per share of Rs. 1.34 in the comparable halfof last year.
The period under review has been a difficult one not only for your Company butfor the whole spinning and overall textile industry of the country. In the backdropof significant reduction in Pakistan's cotton crop size, its rate remained on ahigher side. Yarn prices on the other hand remained low both in the domesticand in the international market especially in China where the economy is facing aslowdown in growth rate. Other factors, which are responsible for erosion ofprofitability due to soaring cost of doing business include; increase in wages,expensive energy due to imposition of various surcharges, high taxes, importduties and infrastructure cess.
In the highly competitive global market place, our government should support thebusinesses as is done in other countries. This can be done by offering incentivesfor up-gradation of production facilities, timely tax refunds, subsidizing farmers,duty free import of machinery & raw material and restoration of zero-rating regimeof sales tax. The government should pass on due benefit of the enormousreduction in international oil price and implement reduction in the electricity tariffas announced by the prime minister recently.
The management of your Company is working hard to overcome the difficultiesthrough cost control and process efficiencies. Continuous availability of LNG tothe textile industry at affordable rates and eligibility of the spinning sector foravailing the Long Term Finance Facility (LTFF) are likely to benefit theCompany and, by the grace of Allah, we shall be able to steer the Companytowards profitability.

Introduction
Scope of Review
Conclusion
Chartered Accountants
Engagement Partner:
Nadeem Yousuf Adil
Dated: February 29, 2016Place: Karachi
We conducted our review in accordance with the International Standard onReview Engagements 2410, “Review of Interim Financial Information Performedby the Independent Auditor of the Entity”. A review of interim financial informationconsists of making inquiries, primarily of the persons responsible for financial andaccounting matters, and applying analytical and other review procedures. Areview is substantially less in scope than an audit conducted in accordance withInternational Standards on Auditing and consequently does not enable us toobtain assurance that we would become aware of all significant matters that mightbe identified in an audit. Accordingly, we do not express an audit opinion.
Based on our review, nothing has come to our attention that causes us to believethat the accompanying interim financial information as of and for the six monthsended December 31, 2015 is not prepared, in all material respects, inaccordance with the approved accounting standards as applicable in Pakistan forinterim financial reporting.
We have reviewed the accompanying condensed interim balance sheet ofIDREES TEXTILE MILLS LIMITED (”the Company”) as at December 31, 2015,and the related condensed interim profit and loss account, condensed interimcash flow statement and condensed interim statement of changes in equitytogether with the notes forming part thereof for the six months then ended(here-in-after referred to as “interim financial information”). Management isresponsible for the preparation and presentation of this interim financialinformation in accordance with approved accounting standards as applicable inPakistan for interim financial reporting, Our responsibility is to express aconclusion on this interim financial information based on our review. The figuresreported in the condensed interim profit and loss account for the three monthsended December 31, 2015 and 2014 have not been reviewed, as we arerequired to review only the cumulative figures for the six months endedDecember 31, 2015.

(Un-audited) (Audited) (Un-audited) (Audited)December 31, June 30, December 31, June 30,
2015 2015 2015 2015Note Note
SHARE CAPITAL AND RESERVES NON-CURRENT ASSETS
Authorized capital Property, pl
616,349,608 636,100,076
SURPLUS ON REVALUATIONOF PROPERTY, PLANTAND EQUIPMENT 517,619,401 544,894,888
NON-CURRENT LIABILITIES
Long-term financeRelated parties 71,712,359 68,045,303
CURRENT ASSETS
Stores, spares and loosefinance lease 75,647,471 72,213,511 tools 34,267,222 39,362,182
Deferred liabilities 271,224,144 293,428,229 Stock-in-trade 7 388,272,858 668,568,133
Trade debts 524,226,322 429,974,424
Loans and advances 84,799,621 66,372,792CURRENT LIABILITIES
Deposits and short-term
Trade and other payables 149,786,091 262,158,421 prepayments 11,141,876 8,965,747
Interest / mark-up accrued 12,008,511 12,446,560Short-term borrowings 4 777,731,617 782,091,973 Other receivables 21,416,101 9,555,205Current portion of
liabilities against assets subject to Other financial asset 34,550,710 33,550,710finance lease 54,652,181 58,246,798
Provision for taxation 30,153,298 18,795,754 Cash and bank balances 18,124,235 9,642,394
1,024,331,698 1,133,739,506 1,116,798,945 1,265,991,587
CONTINGENCIES ANDCOMMITMENTS 5
2,576,884,681 2,748,421,513 2,576,884,681 2,748,421,513
The annexed notes 1 to 13 form an integral part of this condensed interim financial information.
………..Rupees……….………..Rupees……….
Liabilities against assets subject to
CHIEF EXECUTIVE OFFICER DIRECTOR
Issued, subscribed and paid-up capital 180,480,000 180,480,000 1,460,085,736 1,482,429,926Unappropriated profit 435,869,608 455,620,076
ant and22,000,000 ordinary equipment 6 1,433,541,333 1,455,823,917
shares of Rs.10 each 220,000,000 220,000,000Long-term deposits 26,544,403 26,606,009

Note
Gross profit 26,042,957 96,783,238 10,078,655 48,422,719
Distribution cost (9,508,746) (11,128,418) (2,185,537) (7,176,825)Administrative expenses (28,983,243) (31,960,856) (13,131,409) (16,158,930)
(38,491,989) (43,089,274) (15,316,946) (23,335,755)
(12,449,032) 53,693,964 (5,238,291) 25,086,964Finance cost (45,733,934) (41,931,778) (23,507,969) (23,463,963)
Other operating expenses 9 (17,219,725) (2,713,258) (14,682,552) (2,556,711)
(75,402,691) 9,048,928 (43,428,812) (933,710)
Other income 10 16,220,072 5,190,564 15,108,194 4,401,455
(Loss) / profit before taxation (59,182,619) 14,239,492 (28,320,618) 3,467,745
Taxation
Current - for the period (11,102,301) (7,246,878) (9,279,554) (4,013,260)- prior year (362,699) (149,875) (362,699) (149,875)
Deferred 26,536,777 17,393,431 4,046,934 17,393,431
15,071,777 9,996,678 (5,595,319) 13,230,296
(Loss) / profit for the period (44,110,842) 24,236,170 (33,915,937) 16,698,041
Other comprehensive income for the period
Items that may be reclassified subsequently - - - -to profit or loss
Items that will not be reclassified subsequentlyto profit or loss - - - -
Total comprehensive income for the period (44,110,842) 24,236,170 (33,915,937) 16,698,041
(Loss) / Earnings per share - basic and diluted (2.44) 1.34 (1.88) 0.93
The annexed notes 1 to 13 form an integral part of this condensed interim financial information.
………....……………………...... Rupees …………………………...............
Six months ended Three months endedDecember 31,
2015December 31,
2014December 31,
2015December 31,
2014
CHIEF EXECUTIVE OFFICER DIRECTOR
Sales - net 913,215,200 1,157,240,054 406,825,751 614,494,934Cost of sales 8 (887,172,243) (1,060,456,816) (396,747,096) (566,072,215)

The annexed notes 1 to 13 form an integral part of this condensed interim financial information.
NoteA. CASH FLOWS FROM OPERATING ACTIVITIES
(Loss) / profit before taxation (59,182,619) 14,239,492
Adjustments for:Depreciation 45,979,992 44,367,826Provision for staff retirement gratuity 7,875,612 7,375,465Loss on sale of property, plant and equipment 15,421,184 -Finance cost 42,066,878 41,931,778Finance cost on unwinding of discount on long-term finance from related parties 3,667,056 -
Operating cash flows before working capital changes 55,828,103 107,914,561
(Increase) / decrease in current assets
Stores, spares and loose tools 5,094,960 (794,922)Stock-in-trade 280,295,275 (356,159,373)Trade debts (94,251,898) 40,602,727Loans and advances (9,445,461) 47,409,833Deposits and short-term prepayments (2,176,129) (2,074,464)Other receivables (11,860,896) 1,859,279
Increase / (decrease) in current liabilitiesTrade and other payable (106,620,397) 53,233,302
Working capital changes 61,035,454 (215,923,618)
Cash generated from / (used in) operations 116,863,557 (108,009,057)Finance cost paid (42,504,927) (42,295,822)
Staff retirement gratuity paid (9,913,040) (4,952,300)
Income tax paid (9,088,824) (9,978,320)
Net cash generated from / (used in) operating activities 55,356,766 (165,235,499)
B. CASH FLOWS FROM INVESTING ACTIVITIES
Purchase of property, plant and equipment (14,039,092) (39,957,509)Proceed from disposal of property, plant and equipment 2,125,000 -Long-term deposits 61,606 1,848,418Other financial asset - net (1,000,000) 459,000
Net cash used in investing activities (12,852,486) (37,650,091)
C. CASH FLOWS FROM FINANCING ACTIVITIES
Repayment of long-term finance - net - (9,428,523)Lease rental paid - net (27,365,157) (38,943,442)Finance against imported merchandise (FIM) repaid - (23,391,889)Dividend paid (2,296,926) (2,422,402)
Net cash used in financing activities (29,662,083) (74,186,256)
Net increase / (decrease) in cash and cash equivalents (A+B+C) 12,842,197 (277,071,846)
Cash and cash equivalents at the beginning of the period (772,449,579) (501,659,506)
Cash and cash equivalents at the end of the period 11 (759,607,382) (778,731,352)
Six months ended
December 31,2015
December 31,2014
…...….....…. Rupees ……………
CHIEF EXECUTIVE OFFICER DIRECTOR

Issued,subscribed Unappropriatedand paid up profit
capital
Balance as at July 1, 2014 180,480,000 391,660,728 572,140,728
Total comprehensive income for the periodProfit for the period - 24,236,170 24,236,170Other comprehensive income - - -
- 24,236,170 24,236,170Transfer from surplus on revaluation of property,
plant and equipment on account of incrementaldepreciation charged thereon - net of tax - 18,104,270 18,104,270
Transactions with owners recognized directly in equityFinal cash dividend for the year ended June 30, 2014@ Re. 1 per share to minority shareholders - (5,830,226) (5,830,226)
Balance as at December 31, 2014 180,480,000 428,170,942 608,650,942
Balance as at July 1, 2015 180,480,000 455,620,076 636,100,076
Total comprehensive income for the periodLoss for the period - (44,110,842) (44,110,842)Other comprehensive income - - -
- (44,110,842) (44,110,842)Transfer from surplus on revaluation of property,
plant and equipment on account of incrementaldepreciation charged thereon - net of tax - 16,320,682 16,320,682
Transfer from surplus on revaluation ondisposal of property, plant and equipment - net of tax - 10,954,805 10,954,805
Transactions with owners recognized directly in equity
Final cash dividend for the year ended June 30, 2015@ Re. 0.50 per share to minority shareholders - (2,915,113) (2,915,113)
Balance as at December 31, 2015 180,480,000 435,869,608 * 616,349,608
* This includes the unamortized portion amounting to Rs. 28,617,642 (June 30, 2015: Rs. 32,284,698) of interest free loan obtainedfrom related parties, which is not available for distribution.
The annexed notes 1 to 13 form an integral part of this condensed interim financial information.
…………………..……... Rupees ……………………………
Total
CHIEF EXECUTIVE OFFICER DIRECTOR

NOTES TO THE CONDENSED INTERIM FINANCIAL INFORMATION (UN-AUDITED)For The Six Months Ended December 31, 2015
1. STATUS AND NATURE OF BUSINESS
1.1
2. BASIS OF PREPARATION
2.1 Statement of compliance
3. SIGNIFICANT ACCOUNTING AND RISK MANAGEMENT POLICIES, ESTIMATES AND JUDGEMENTS
3.1 Significant accounting policies
3.2 Financial risk management
3.3 Fair value of finanacial assets and liabilities
3.4 Estimates and judgments
This condensed interim financial information is un-audited. However, a limited scope review has been carried out by theexternal auditors of the Company in accordance with the requirements of the Code of Corporate Governance.
This condensed interim financial information does not include all the information required for full annual financialstatements and should be read in conjunction with the annual audited financial statements of the Company for the yearended June 30, 2015.
The carrying value of financial assets and financial liabilities reported in this condensed interim financial informationapproximates their fair values.
The significant accounting policies adopted in the preparation of this condensed interim financial information are thesame as those applied in the preparation of the annual audited financial statements of the Company for the year endedJune 30, 2015.
This condensed interim financial information for the six months ended December 31, 2015 has been prepared inaccordance with the requirements of International Accounting Standard 34 - 'Interim Financial Reporting' and provisionsof and directives issued under the Companies Ordinance, 1984. In case where requirements differ, the provisions of ordirectives issued under the Companies Ordinance,1984 have been followed.
The financial risk management objective and policies are consistent with those disclosed in the annual audited financialstatements of the Company for the year ended June 30, 2015.
Certain new International Financial Reporting Standards (IFRSs) and amendments to existing IFRSs are effective forperiods beginning on or after July 1, 2015, which does not have any impact on this condensed interim financialinformation except for IFRS 13 “Fair Value Measurement”, which results in certain additional disclosures.
Idrees Textile Mills Limited (the Company) was incorporated in Pakistan as an unquoted public limited company on June5, 1990 under the Companies Ordinance, 1984 and was listed on Karachi and Lahore Stock Exchanges (now integrated /merged into Pakistan Stock Exchange) on April 28,1992. The registered office of the Company is situated at 6-C, IsmailCentre, 1st floor, Central Commercial Area, Bahadurabad, Karachi in the Province of Sindh. The principal activity of theCompany is manufacturing, processing and sale of fabric and all kinds of yarn. The Company's manufacturing facility islocated at Kot Shah Muhammad, District Nankana in the Province of Punjab.
IFRS 13 establishes a single source of guidance for fair value measurements and disclosures about fa ir valuemeasurements. However, it does not change the requirements regarding which items should be measured or disclosed atfair value. The scope of IFRS 13 is broad; it applies to both financial instrument items and non-financial instrument itemsfor which other IFRSs require or permit fair value measurements and disclosures about fair value measurements, exceptin specified circumstances. The application of this standard does not have an impact on this condensed interim financialinformation except certain additional disclosures as given in note 6.1.
The estimates, judgments and methods of computation adopted in the preparation of this condensed interim financialinformation are same as those applied in the preparation of the annual audited financial statements of the Company forthe year ended June 30, 2015.
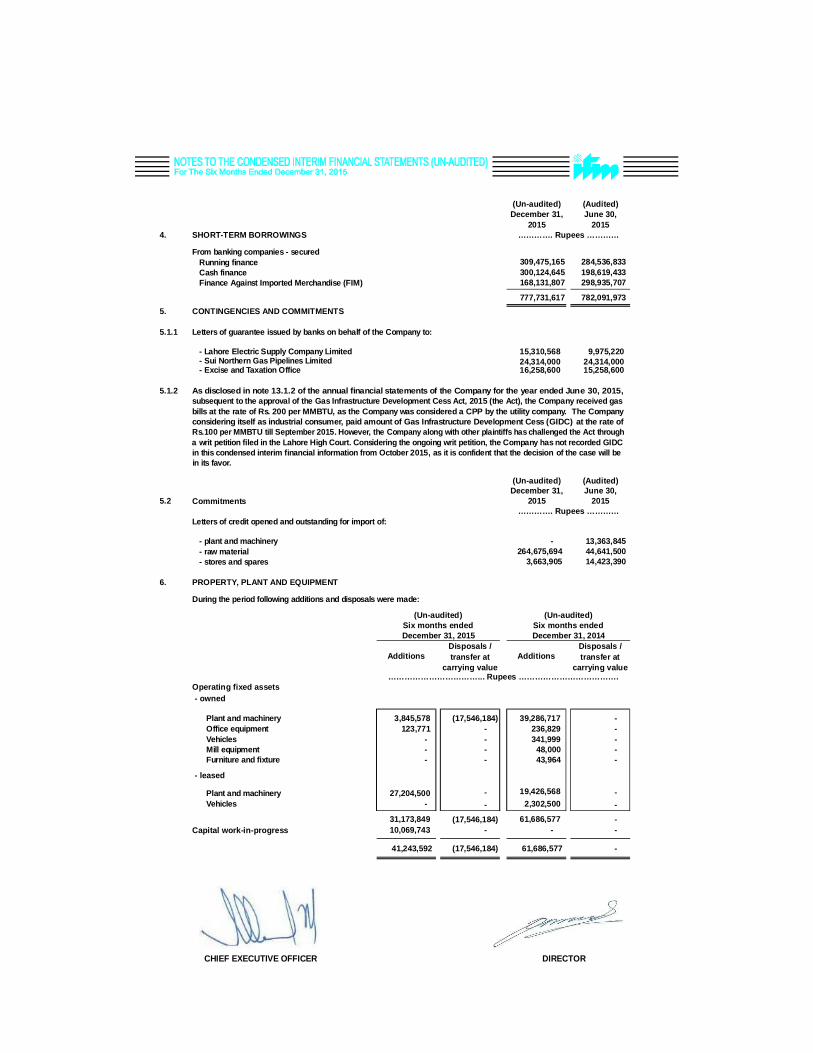
4. SHORT-TERM BORROWINGS
From banking companies - securedRunning financeCash financeFinance Against Imported Merchandise (FIM)
5. CONTINGENCIES AND COMMITMENTS
5.1.1 Letters of guarantee issued by banks on behalf of the Company to:
- Lahore Electric Supply Company Limited- Sui Northern Gas Pipelines Limited- Excise and Taxation Office
5.1.2
5.2 Commitments
Letters of credit opened and outstanding for import of:
- plant and machinery- raw material- stores and spares
6. PROPERTY, PLANT AND EQUIPMENT
Operating fixed assets- owned
Plant and machineryOffice equipmentVehiclesMill equipmentFurniture and fixture
- leased
Plant and machineryVehicles
Capital work-in-progress
As disclosed in note 13.1.2 of the annual financial statements of the Company for the year ended June 30, 2015,subsequent to the approval of the Gas Infrastructure Development Cess Act, 2015 (the Act), the Compabills at the rate of Rs. 200 per MMBTU, as the Company was considered a CPP by the utility company. The Companyconsidering itself as industrial consumer, paid amount of Gas Infrastructure Development Cess (GIDC) at the rate ofRs.100 per MMBTU till September 2015. However, the Company along with other plaintiffs has challenged the Act througha writ petition filed in the Lahore High Court. Considering the ongoing writ petition, the Company hasin this condensed interim financial information from October 2015, as it is confident that the decisionin its favor.
During the period following additions and disposals were made:
CHIEF EXECUTIVE OFFICER DIRECTOR
(Un-audited) (Audited)December 31, June 30,
2015 2015
309,475,165 284,536,833300,124,645 198,619,433168,131,807 298,935,707
777,731,617 782,091,973
15,310,568 9,975,22024,314,000 24,314,00016,258,600 15,258,600
(Un-audited) (Audited)December 31, June 30,
2015 2015
- 13,363,845264,675,694 44,641,500
3,663,905 14,423,390
3,845,578 (17,546,184) 39,286,717 -123,771 - 236,829 -
- - 341,999 -- - 48,000 -- - 43,964 -
27,204,500 - 19,426,568 -- - 2,302,500 -
31,173,849 (17,546,184) 61,686,577 -10,069,743 - - -
41,243,592 (17,546,184) 61,686,577 -
ny received gas
not recorded GIDCof the case will be
…………. Rupees …………
AdditionsDisposals /transfer at
carrying value
(Un-audited)
December 31, 2015Six months ended
(Un-audited)
Additions
Six months ended
……………………………... Rupees ……………………………….
December 31, 2014
…………. Rupees …………
Disposals /transfer at
carrying value

Level 1 Level 2 Level 3 Total
- 80,125,000 - 80,125,000- 173,694,511 - 173,694,511- 24,647,414 - 24,647,414- 923,733,728 - 923,733,728- 129,441,890 - 129,441,890- 41,241,668 - 41,241,668- 10,082,347 - 10,082,347
- 1,382,966,558 - 1,382,966,558
- 80,125,000 - 80,125,000- 182,810,959 - 182,810,959- 26,062,988 - 26,062,988- 922,885,333 - 922,885,333- 145,310,161 - 145,310,161- 43,140,440 - 43,140,440- 3,293,933 - 3,293,933
- 1,403,628,814 - 1,403,628,814
(Un-audited) (Audited)December 31, June 30,
2015 2015
222,002,838 305,798,53922,361,096 143,925,68112,866,438 20,104,990
125,773,829 192,958,1985,268,657 5,780,725
388,272,858 668,568,133
………….………….…………. Rupees …………………….………….
…………. Rupees …………
6.1
Levels of fair value are defined as follows:
Level 1 - Quoted prices (unadjusted) in active markets for identical assets or liabilities
Level 3 - Inputs for the asset or liability that are not based on observable market data (that is, unobservable inputs).
As at December 31, 2015 (Un-audited)
Land - freeholdMills building on freehold landLabour colony on freehold landPlant and machinery - ownedPlant and machinery - leasedElectric installationsMill equipment
As at June 30, 2015 (Audited)
Land - freeholdMills building on freehold landLabour colony on freehold landPlant and machinery - ownedPlant and machinery - leasedElectric installationsMill equipment
There were no changes in valuation techniques during the year/period.
7. STOCK-IN-TRADE
Raw material- In hand- In transit
Work-in-processFinished goodsWaste
The Company's land, building, labour colony, plant and machinery, electric installations and mill equipment are stated atrevalued amounts, being the fair value at the date of revaluation, less any subsequent depreciation and subsequentaccumulated impairment losses, if any. The fair value measurements of the Company's land, building, labour colony, plantand machinery, electric installations and mill equipment as at June 30, 2013 was performed by M/s Al -Noor Consultants &Evaluators (an independent valuer).
Details of fair value hierarchy and information relating to fair value of Company's free hold land, building, electricinstallations and plant and machinery is as follows:
Level 2 - Inputs other than quoted prices included within level 1 that are observable for the asset or liability, either directly(that is, as prices) or indirectly (that is, derived from prices).

8.
9.
10.
COST OF SALESRaw material consumed 524,379,005 763,642,512 179,123,300 400,046,041Salaries, wages and benefits 77,978,741 77,772,694 35,051,264 43,608,479Fuel and power 127,053,792 128,504,943 66,852,114 73,347,918Depreciation 41,408,950 40,360,820 20,249,751 20,515,747Stores and spares 17,450,467 21,647,358 6,014,398 9,777,742Packing material 15,034,844 20,447,047 4,701,424 11,841,512Insurance 3,285,370 3,098,968 1,485,370 1,448,968Repairs and maintenance 2,388,063 1,476,533 1,478,915 1,036,228Fabric processing cost - 5,250,000 - -Vehicle running and maintenance 1,057,795 1,099,466 605,547 522,147Other manufacturing overheads 2,200,227 3,265,236 1,177,551 1,137,742
812,237,254 1,066,565,577 316,739,634 563,282,524
Work-in-process
Opening stock 20,104,990 26,464,751 19,821,995 24,369,238Closing stock (12,866,438) (22,093,737) (12,866,438) (22,093,737)
7,238,552 4,371,014 6,955,557 2,275,501
Cost of goods manufactured 819,475,806 1,070,936,591 323,695,191 565,558,025`
Finished goods
Opening stock 198,738,923 207,243,007 204,094,391 218,236,972Closing stock (131,042,486) (217,722,782) (131,042,486) (217,722,782)
67,696,437 (10,479,775) 73,051,905 514,190
887,172,243 1,060,456,816 396,747,096 566,072,215
(Un-audited) (Un-audited)December 31, December 31,
2015 2014
OTHER OPERATING EXPENSESWorkers' profit participation fund - 972,084Workers' welfare fund - 388,834Infrastructure cess 1,768,041 -Exchange loss - 1,352,340Loss on disposal of property, plant and equipment 15,451,684 -
17,219,725 2,713,258
OTHER INCOMEIncome from financial assets
Profit on deposits 1,388,933 1,452,954Income from non-financial assets
Operating income on trading of raw material 14,693,214 -Sale of scrap 20,000 257,000Other 117,925 3,480,610
16,220,072 5,190,564
Six months ended Three months ended
…………. Rupees …………
.......………………….…………… Rupees …………………………….……
(Un-audited) (Un-audited)
December 31,2015
December 31,2014
December 31,2014
December 31,2015

(Un-audited) (Un-audited)December 31, December 31,
2015 2014
11. CASH AND CASH EQUIVALENTSCash and bank balances 18,124,235 12,945,702Short-term borrowings (777,731,617) (791,677,054)
(759,607,382) (778,731,352)
12. TRANSACTIONS WITH RELATED PARTIES
Relationship with the Company Nature of Transactions
517,105 446,449
Key management personnel Short-term employee benefit 4,200,000 3,740,000
Directors
13. DATE OF AUTHORIZATION FOR ISSUE
The related parties comprise of associated undertakings, directors, key management personnel and post employmentretirement benefit plan. The significant transactions with related parties carried out during the period are as follows:
December 31,2015
Unwinding of discount on loanfrom directors -3,667,056
December 31,2014
CHIEF EXECUTIVE OFFICER DIRECTOR
Six months ended
…......……… Rupees ………………
Employee retirement benefit plan
This condensed interim financial information was authorized for issue on February 29, 2016, by the Board of Directorsof the Company.
(Un-audited)
…………. Rupees …………
Contribution made to providentfund
The Chief Executive, directors and some executives are provided with free use of Company maintained cars.