textile mills limited - gul ahmed...mohomed bashir mohammed zaki bashir abdul aleem chief executive...
TRANSCRIPT

T e x t i l e M i l l s L i m i t e d
Quarterly ReportCondensed Interim Financial Information
For The First Quarter Ended September 30, 2018

Company Information
BOARD OF DIRECTORS Mohomed Bashir - ChairmanZain Bashir - Vice Chairman/ Executive DirectorMohammed Zaki Bashir - Chief Executive OfficerZiad Bashir - Non Executive DirectorS.M. Nadim Shafiqullah - Non Executive DirectorDr. Amjad Waheed - Independent DirectorEhsan A. Malik - Independent Director
CHIEF FINANCIAL OFFICER Abdul Aleem
COMPANY SECRETARY Salim Ghaffar
AUDIT COMMITTEE Dr. Amjad Waheed - Chairman & MemberMohomed Bashir - MemberS.M. Nadim Shafiqullah - MemberSalim Ghaffar - Secretary
HUMAN RESOURCE AND Ehsan A. Malik - Chairman & MemberREMUNERATION Mohomed Bashir - MemberCOMMITTEE Zain Bashir - Member
Salim Ghaffar - Secretary
BANKERS Allied Bank LimitedBank Al Habib LimitedAskari Bank LimitedAl Baraka Bank (Pakistan) LimitedBank Alfalah Limited (Islamic)Bankislami Pakistan LimitedThe Bank Of PunjabDubai Islamic Bank Pakistan LimitedFaysal Bank LimitedHabib Bank LimitedHabib Metropolitan Bank LimitedMCB Bank LimitedMCB Islamic Bank LimitedMeezan Bank LimitedNational Bank Of PakistanSamba Bank LimitedSilkbank LimitedSoneri Bank LimitedStandard Chartered Bank (Pakistan) LimitedUnited Bank LimitedThe Bank of Khyber
AUDITORS Kreston Hyder Bhimji & Co.Chartered Accountants
INTERNAL AUDITORS Grant Thornton Anjum RahmanChartered Accountants
LEGAL ADVISORS A.K. Brohi & CoAdvocates
REGISTERED OFFICE Plot No.82,Main National Highway,Landhi, Karachi-75120
SHARE REGISTRAR FAMCO Associates (Private) Limited8-F, Next To Hotel Faran, Nursery, Block 6,P.E.C.H.S., Shahrah-E-Faisal, Karachi.Phone No. (+92-021) 34380101-5Fax No. (+92-021) 34380106
MILLS Landhi Industrial Area,Karachi-75120
E-MAIL [email protected]
URL www.gulahmed.com
Quarterly Report|| 1

DIRECTORS’ REVIEW REPORT TO THE SHAREHOLDERS
The Directors of your Company are pleased to present their review of the affairs of the Company for the first quarter ended September 30, 2018.
ECONOMIC AND INDUSTRIAL OVERVIEW
During the first quarter of FY 18-19, the current account deficit registered a slight decline to $3.665 billion from $3.761 billion during the same period last year. The lower deficit is primarily due to a 13.1% increase in remittances coupled with exports growth of 4.6% i.e. from $5.2 billion to $5.4 billion, while imports increased only by 0.63% i.e. from $14.17 billion to $14.26 billion as compared to the first quarter of last year. On the other hand, foreign direct investment dropped 43% to $0.4 billion as the options are being evaluated to fix the current economic situation.
The central bank’s reserves saw a steep decline of $1.07 billion during the first quarter of 2018-19 and stood at $8.41 billion at the quarter end, enough to cover import bill of one and a half months.Consequently, the PKR remained under pressure and devalued further post quarter end.
TEXTILE INDUSTRY
Textile exports increased by 1% from $3.26 billion to $3.36 million during the first quarter as compared to the corresponding quarter of previous year mainly on account of increase in exports of knitwear, whereas exports of readymade-garments and cotton yarn had declined.
Pakistan’s textile industry continues to struggle in keeping production cost at a competitive level due tomultiple factors. Over the last few years local cotton production has decreased which has left the industry with the only choice of importing cotton to fulfill the requirements. This coupled with higher input cost of chemical, dyes and machinery which are also being imported from other countries have increased the cost of prodcuts substantially. Further, long outstanding receivables from the government also leaves the industry under stress. Hence, under the current scenario it has become quite challenging for Pakistan’s textile industry to attain competitive advantage in international market versus regional competitors.
FINANCIAL PERFORMANCE
The Company’s continued focus on profitable avenues, maximizing efficiency in production activities, investment in machinery modernization, cost rationalization etc. has enabled to boost overall sales and historic increase in profit as compared to the corresponding period of previous years.
Quarterly Report|| 2

Key performance numbers are presented below:
Units Quarter ended September 30, 2018
Quarter ended September 30, 2017
Export sales Rs. in millions 7,201 5,757Local sales Rs. in millions 4,733 3,474Total sales Rs. in millions 11,934 9,231Gross profit Rs. in millions 2,693 1,777Profit / loss before tax Rs. in millions 740 160Profit / loss after tax Rs. in millions 651 102Earnings / loss per share (EPS) Rupees 1.83 0.29Debt to equity ratio Times 0.54 0.62Current ratio Times 1.12 1.10Break-up-value per share Rupees 37.23 37.08
The Company registered quarterly net sales of Rs 11,934 million against Rs 9,231 million in the corresponding quarter of previous year i.e. an increase of over 29%. The Company was able to boost both local and export sales. Improved operational performance during the quarter as compared to corresponding quarter of previous year is evident from the 52% growth in gross profit i.e. from Rs 1,777 million to Rs 2,693 million. Owing to the effects of cost rationalization measures and BMR activities during previous years, gross profit margin also improved from 19.2% to 22.6%. Consequently, the Company achieved profit after tax of Rs 651 million in the quarter, as compared to Rs 102 million during corresponding quarter of previous year, reflecting a growth of over 6 times.
FUTURE OUTLOOK
Pakistan’s economy is currently facing challenges of depleted foreign exchange reserves and fiscal deficit and measures are being taken in terms of deep cuts in development funding for FY 2018-19. It is expected that economic activity is likely to slow down in FY19 as the overall macroeconomic policy is restricted to stabilization measures. The SBP estimates inflation to be around 6.5% - 7.5% during FY 18-19 while GDP growth target has been lowered from 6.2% to around 4.7%.
The new government has a very clear agenda of supporting the exporters. Textile exports roughly make up 60% of the country’s total exports and we expect that government policies will back up the growth of the textile industry. The government has already revoked duties on 82 tariff lines relating to raw materials and inputs for export oriented sectors while relaxation has been given on the import of textile machinery in order to enhance the capacity of the sector. Further, textile industry will continue to receive gas supply on existing rates and would also obtain gas on priority during winters.
Accordingly, we are optimistic about the future outlook of our business and improvement in profitability. Efforts are also directed towards improving the Company’s footprint in retail business in Pakistan as we believe there is potential to improve market share, through e-commerce sales and otherwise.
Quarterly Report|| 3

CONSOLIDATED FINANCIAL STATEMENTS
Consolidated financial statements for the quarter ended September 30, 2018 of the Company and its subsidiaries Gul Ahmed International Limited (FZC) - UAE, GTM (Europe) Limited – UK, GTM USA Corp. - USA and Sky Home Corp. – USA are attached.
ACKNOWELDGEMENT
We acknowledge and appreciate the efforts and valuable support of all stakeholders.
For and on behalf of the Board
October 29, 2018Karachi
\
_______________ ___________________Mohomed BashirChairman
Mohammed Zaki BashirChief Executive Officer
Quarterly Report|| 4

Condensed Interim Un-consolidated Balance SheetAs at September 30, 2018
Un-Audited AuditedSeptember June
Note 2018 2018
EQUITY AND LIABILITIES
SHARE CAPITAL AND RESERVES Authorised share capital
750,000,000 ordinary shares of Rs.10 each 7,500,000 7,500,000
Issued, subscribed and paid-up capital 3,564,955 3,564,955 356,495,525 ordinary shares of Rs. 10 each
Reserves 9,707,049 9,055,772 13,272,004 12,620,727
NON-CURRENT LIABILITIES Long term financing - Secured 5 7,124,482 6,911,869 Deferred liabilities
Deferred taxation - net 25,914 23,692 Staff gratuity 62,211 63,165
88,125 86,857
CURRENT LIABILITIES Trade and other payables 8,812,669 7,008,948 Accrued mark-up/profit 136,516 175,633 Short term borrowings 18,745,405 15,076,081 Current maturity of long term financing 5 1,469,832 1,365,857 Unclaimed dividend 5,276 6,421 Unpaid dividend 11,052 11,052
29,180,750 23,643,992
CONTINGENCIES AND COMMITMENTS 7
49,665,361 43,263,445
ASSETS
NON-CURRENT ASSETSProperty, plant and equipment 8 16,607,663 16,104,319 Intangible assets 9 55,611 23,985 Long term investment 58,450 58,450 Long term loans and advances 44,114 37,314 Long term deposits 305,869 202,959
17,071,707 16,427,027
CURRENT ASSETSStores and spares 1,159,748 961,088 Stock-in-trade 19,707,197 16,143,933 Trade debts 6,653,052 5,398,565 Loans, advances and other receivables 1,235,404 1,197,376 Short term prepayments 261,148 239,661 Refunds due from Government 2,556,436 1,827,764 Taxation - net 638,798 597,781 Cash and bank balances 381,871 470,250
32,593,654 26,836,418
49,665,361 43,263,445
MOHOMED BASHIR MOHAMMED ZAKI BASHIR ABDUL ALEEMChief Executive Officer Chief Finance Officer
Rupees in '000
The annexed notes form an integral part of this condensed interim un-consolidated financial information.
Chairman
Quarterly Report|| 5

Condensed Interim Un-consolidated Profit And Loss AccountFor the quarter ended 30 September, 2018
Note September September 2018 2017
Sales - net 11,934,342 9,231,082
Cost of sales 9,241,579 7,454,336
Gross profit 2,692,763 1,776,746
Distribution costs 1,099,392 893,096
Administrative costs 511,001 525,919
Other operating costs 93,141 10,986
1,703,534 1,430,001
989,229 346,745
Other income 11,442 37,422
Operating profit 1,000,671 384,167
Finance cost 260,367 224,149
Profit before taxation 740,304 160,018
Taxation
- Current 11 86,805 57,638
- Deferred 2,222 -
89,027 57,638 Profit after taxation 651,277 102,380
Re-stated
Earning per share - basic and diluted (Rs.) 1.83 0.29
MOHOMED BASHIR MOHAMMED ZAKI BASHIR ABDUL ALEEMChief Executive Officer Chief Finance OfficerChairman
Un-Audited
----------------------------Rupees in '000----------------------------
The annexed notes form an integral part of this condensed interim un-consolidated financial information.
Quarterly Report|| 6

Condensed Interim Un-consolidated Statement of Comprehensive IncomeFor the quarter ended 30 September, 2018
Note September September 2018 2017
Profit after taxation 651,277 102,380
Other comprehensive income - -
Total comprehensive income 651,277 102,380
MOHOMED BASHIR MOHAMMED ZAKI BASHIR ABDUL ALEEMChairman Chief Executive Officer Chief Finance Officer
The annexed notes form an integral part of this condensed interim un-consolidated financial information.
Un-Audited
----------------------------Rupees in '000----------------------------
Quarterly Report|| 7

Condensed Interim Un-ConsolidatedCash Flow StatementFor the quarter ended 30 September, 2018
Note September September 2018 2017
CASH FLOWS FROM OPERATING ACTIVITIES
Profit before taxation 740,304 160,018
Adjustments for:Depreciation 455,627 451,893 Amortisation 2,908 2,530 Provision for gratuity 5,776 6,306 Finance cost 260,367 223,944 Provision for slow moving/obsolete stores
spares and loose tools 8,368 1,962 Impairment allowance against doubtful trade debts - 10,535
Loss on disposal of property, plant and equipment 26,608 2,564 Gain on disposal of property, plant and equipment (9,658) (25,665)
749,996 674,069 Cash flows from operating activities before adjustments of
working capital 1,490,300 834,087
Changes in working capital: Increase in current assets
Stores and spares (207,028) (230,297) Stock-in-trade (3,563,264) (2,312,367)Trade debts (1,254,487) 645,386 Loans, advances and other receivables (38,028) (714,944) Short term prepayments (21,487) (421,674) Refunds due from Government (728,672) 71,805
(5,812,966) (2,962,091) Increase in current liabilities
Trade and other payables 1,803,721 1,493,184(4,009,245) (1,468,907)
Cash generated used in operations (2,518,945) (634,820)
Adjustments for:Gratuity paid (6,730) (24,583) Finance cost paid (299,484) (258,968) Income tax paid or deducted (127,822) (103,723) Increase in Long term loans and Advances (6,800) (2,941) Increase/(decrease) in Long term deposits (102,910) 153
(543,746) (390,062) Net Cash generated used in Operating activities (3,062,691) (1,024,882)
CASH FLOWS FROM INVESTING ACTIVITIES
Addition to property, plant and equipment (1,054,125) (261,272) Addition to intangible assets (34,534) - Proceeds from sale of property, plant and equipment 78,205 61,395 Net cash used in investing activities (1,010,454) (199,877)
Balance carried forward (4,073,145) (1,224,759)
Un-Audited
-----------Rupees in '000-----------
Quarterly Report|| 8

Condensed Interim Un-ConsolidatedCash Flow StatementFor the quarter ended 30 September, 2018
Note September September 2018 2017
Balance brought forward (4,073,145) (1,224,759)
CASH FLOWS FROM FINANCING ACTIVITIES
Long term financing obtained 505,541 137,630 Long term financing repaid (188,954) (136,519) Dividend paid (1,145) (16)
Net cash generated from financing activities 315,442 1,095
Net decrease in cash and cash equivalents (3,757,703) (1,223,664)
Cash and cash equivalents - at the beginning of the period (14,605,831) (11,665,461)
Cash and cash equivalents - at the end of the period 10 (18,363,534) (12,889,125)
MOHOMED BASHIR MOHAMMED ZAKI BASHIR ABDUL ALEEMChairman Chief Executive Officer Chief Finance Officer
Un-Audited
-----------Rupees in '000-----------
The annexed notes form an integral part of this condensed interim un-consolidated financial information.
Quarterly Report|| 9

Condensed Interim Un-consolidated Statement of Changes in EquityFor the quarter ended 30 September, 2018
General Reserve
Unappropriated Profit
Balance as at June 30, 2017 (Audited) 3,564,955 1,405,415 4,980,000 963,547 7,348,962 10,913,917
Total Comprehensive income for the First Quarterended September 2017 (un-audited)
Profit after taxation - - - 102,380 102,380 102,380
Balance as at 30 September, 2017 (Un-audited) 3,564,955 1,405,415 4,980,000 1,065,927 7,451,342 11,016,297
Transactions with owners- - - (356,496) (356,496) (356,496)
Transfer to general reserve - - 400,000 (400,000) - -
Total Comprehensive income for the yearended 30 June, 2018
Profit after taxation - - - 1,972,593 1,972,593 1,972,593
- - - (11,667) (11,667) (11,667)
- - - 1,960,926 1,960,926 1,960,926
Balance as at 30 June, 2018 3,564,955 1,405,415 5,380,000 2,270,357 9,055,772 12,620,727
- - - 651,277 651,277 651,277 - -
Balance as at September 30, 2018 (Un-audited) 3,564,955 1,405,415 5,380,000 2,921,634 9,707,049 13,272,004
MOHOMED BASHIR MOHAMMED ZAKI BASHIR ABDUL ALEEMChairman Chief Executive Officer Chief Finance Officer
Reserves TotalRevenue ReserveShare Capital Capital reserve - Share Premium
Reserves
------------------------------------ Rupees '000------------------------------------
Final dividend for the year ended June 30, 2017
The annexed notes form an integral part of this condensed interim un-consolidated financial information.
Other comprehensive loss
Total comprehensive income for the quarter ended September 30, 2018 (Un-audited)Profit after taxation
Quarterly Report|| 10

Notes to the Condensed Interim Un-consolidated Financial Information (Un-audited)For the quarter ended 30 September, 2018
1 LEGAL STATUS AND ITS OPERATIONS
1.1
The Company is a subsidiary of Gul Ahmed Holdings (Private) Limited. Note no. 5.2.1.
Details of Subsidiaries
Name Chief Executive officer Address Date of
IncorporationCountry of
Incorporation %of Holding Audit Status as at 30 September, 2018
Gul Ahmed International Limited FZC
Mr. Mohomed Bashir
P.O.box 8705, Q4-29, Sharjah Airport International free zone, Sharjah, U.A.E.
December 11, 2002 U.A.E 100% Un-audited
GTM (Europe) Limited - Indirect subsidiary
Mr. Mohomed Bashir
City Wharf, New Bailey Street, Manchester M3 5ER, United Kingdom
April 17, 2003 U.K 100% Un-audited
GTM USA - Indirect subsidiary
Mr. Mohomed Bashir
515, 7 West 34th Street, New York, USA March 19, 2012 U.S.A 100% Un-audited
Sky Home- Indirect Subsidiary
Mr. Mohomed Bashir
Street No. 328, South King Charles Road, City Raleigh, State North Carolina
February 28, 2017 U.S.A 100% Un-audited
1.2 Geographical locations and addresses of all lands owned by the Company are as follows;
Unit Area AddressUnit 1,2 & 3 25.07 Acres Plot No. HT-4, Landhi Industrial Area, Landhi KarachiUnit 4 & 5 14.9 Acres Survey No.82, Deh Landhi ,Karachi Unit 6,7 & 8 18.56 Acres Plot No. H-7, Landhi Industrial Area, Landhi, Karachi Lasani warehouse 4.17 Acres Plot No. H-19, Landhi Industrial Area, Landhi, KarachiMTF Plot 44.04 acres P.U. No. 48, 49, 50, & 51, Near Machine Tool Factory
Deh Khanto Tapo Landhi, KarachiPlot 2 Kanal,19 Plot No. 24-A, C-III, Gulberg Lahore
Marlas and 153.5 Sq. Feet
1.3 Geographical locations and addresses of all factory building and warehouses on rented premises are as follows;
Unit AddressHighway stitching complex Plot# 369, Main National Highway, Landhi, KarachiYarn Dyeing and Knitting unit Plot# HT/3A,KDA Scheme 3, Landhi Industrial area, KarachiStitching unit Plot# ST-17/1 and ST-17/3, Federal 'B' Area, Azizabad, KarachiHussaini stitching unit Plot# HT/8,KDA Scheme 3, Landhi Industrial area, KarachiApparel division Plot# 12, Sector 23, Korangi Industrial area, Karachi
1.4
2 BASIS OF PREPARATION
Operational
Gul Ahmed Textile Mills Limited (The Company) was incorporated on April 01, 1953 in Pakistan as a private limited company, subsequentlyconverted into public limited company on January 07, 1955 and is listed in Pakistan Stock Exchange Limited. The Company is a composite textilemill and is engaged in the manufacture and sale of textile products.
The Company’s registered office is situated at Plot No. 82, Main National Highway, Landhi, Karachi.
The Company has the following subsidiaries:
Status
Operational
Operational
Operational
All four subsidiaries are engaged in distribution/trading of textile related products.
As at June 30, 2018, the Company has 64 retail outlets, 32 fabric stores, 2 fair price shops, 5 whole sale shops and 7 franchises.
This condensed interim un-consolidated financial information of the Company for the quarter ended September 30, 2018 has been prepared in accordance with the requirements of the International Accounting Standards 34 - Interim Financial Reporting and provisions of and directives issued under therepealed Companies Ordinance, 1984. In case where requirements differ, the provisions of or directives issued under the repealed Companies Ordinance,1984 shall prevail.
This condensed interim un-consolidated financial information comprise of the condensed interim un-consolidated balance sheet as at September 30, 2018and the condensed interim un-consolidated profit and loss account, condensed interim un-consolidated statement of comprehensive income, condensedinterim un-consolidated cash flow statement and condensed interim un-consolidated statement of changes in equity for the quarter ended September 30,2018.
The comparative balance sheet, presented in this condensed interim un-consolidated financial Information, as at June 30, 2018 has been extracted fromthe audited un-consolidated financial statements of the Company for the year ended June 30, 2018, whereas the comparative condensed interim un-consolidated profit and loss account, condensed interim un-consolidated statement of comprehensive income, condensed interim un-consolidated cashflow statement and condensed interim un-consolidated statement of changes in equity for the quarter ended September 30, 2018 have been extractedfrom the condensed interim un-consolidated financial information of the Company for the quarter ended September 30, 2017.
Quarterly Report|| 11

3 ACCOUNTING POLICIES
4 ACCOUNTING ESTIMATES, JUDGEMENTS AND FINANCIAL RISK MANAGEMENT
5 Long term financing - SecuredUn-Audited AuditedSeptember June
2018 2018
Opening balance 8,277,726 7,824,892 Add: Obtained during the period / year 505,541 1,270,701 Less: Repaid during the period / year (188,954) (817,867)
8,594,313 8,277,726
Less: Current portion shown under current liabilities (1,469,831) (1,365,857) 7,124,482 6,911,869
6 TRADE AND OTHER PAYABLES
Trade and other payables include provision in respect of;
a)
b)
7 CONTINGENCIES AND COMMITMENTS
Contingencies
a)
Guarantees
(a)
(b)
(c)
(d)
The preparation of this condensed interim un-consolidated financial information requires management to make estimates, assumptions and use judgmentsthat affect the application of policies and reported amounts of assets and liabilities and income and expenses. Estimates, assumptions and judgments arecontinually evaluated and are based on historical experience and other factors, including reasonable expectations of future events. Revisions toaccounting estimates are recognised prospectively commencing from the period of revision. Judgments and estimates made by the management in thepreparation of this condensed interim financial information are the same as those that were applied to financial statements as at and for the year ended
This condensed interim unconsolidated financial information do not include all the information required in annual financial statements prepared inaccordance with approved accounting standards as applicable in Pakistan, and should be read in conjunction with the un-consolidated financial statements for the year ended June 30, 2018.
Certain new IFRSs and amendments to existing IFRSs, effective for periods beginning on or after July 1, 2018, do not have any impact on this condensedinterim financial information, and are therefore not presented.
Same accounting policies and methods of computation are adopted for the preparation of these condensed interim un-consolidated financial information as those applied in the preparation of un-consolidated financial statements for the year ended June 30, 2018.
The Company's financial risk objectives and policies are consistent with those disclosed in the annual audited financial statements as at and for the year ended June 30, 2018.
Rupees in '000
Increase in gas tariff rates notified vide SRO No. (I) / 2015 dated 31 August, 2015, and Oil and Gas Regulatory Authority (OGRA) notificationdated 30 December, 2016 was challenged in Honorable Sindh Hight Court by the Company, as was disclosed in note no. 10.1.2 of the financialstatements for the year ended June 30, 2018. Accordingly, the Company has provided banker's verified Cheque of Rs. 250.675 million (June-2018: 217.356 million) as security to Nazir of High Court Sindh and also, as a matter of prudence, made full provision up to the quarter ended 30September 2018 amounting to Rs. 410.601 million (June-2018: 377.283 million) in the unconsolidated financial statements. Subsequent to theperiod ended, the Oil and Gas Regulatory Authority (OGRA) has issued another notification dated October 04, 2018, revising the tariff effectivefrom September 27, 2018 and the Company has paid the bill accordingly.
The Company as mentioned in note 12.1.3 of the financial statements for the year ended June 30, 2018 had filed a suit in the Honorable SindhHigh Court challenging the charging of captive power tariff instead of industry tariff. Accordingly, the Company has provided banker's certifiedcheques of Rs. 388.570 million (June-2018: Rs. 332.397 million) as security to Nazir of High Court of Sindh and also, as a matter of prudence,made full provision up to the quarter ended 30 September, 208 amounting to Rs. 626.230 million (June-2018: Rs. 570.057 million) in theunconsolidated financial statements. Subsequent to the period ended, the OGRA has issued another notification dated October 04, 2018 revisingthe tariff effective September 27, 2018 and the Company has paid the bill accordingly.
The status of contingencies, as reported in the annual financial statements for the year ended June 30, 2018 remained unchanged during the current period except following;
In the matter of Gas Infrastructure Development Cess (GIDC), wherein there is no change in its status as disclosed in note 12.7 of the financial statements for the year ended June 30, 2018 except that the amount of provision of Rs. 1,876 million (June-2018: Rs.1,725 million) commencing from May 22, 2015 to the balance sheet date.
Rs. 853 million (June-2018: Rs. 839 million) against guarantees issued by banks which are secured by pari passu hypothecation charge overstores and spares, stock-in-trade, trade debts and other receivables. These guarantees includes guarantees issued by related party amounting toRs. 784 million (June 2018: Rs. 771 million).
Post dated cheques Rs. 2,673 million (June-2018: Rs. 3,440 million) are issued to Custom Authorities in respect of duties on imported itemsavailed on the basis of consumption and export plans.
Bills discounted Rs. 1,486 million (June-2018: Rs. 1,292 million).
Corporate guarantee of Rs. 113.035 million (June-2018: Rs. 110.45 million) has been issued to a bank in favor of indirect subsidiary company -GTM (Europe) Limited - UK. This has been issued in accordance with the requirement of Companies Act, 2017.
Quarterly Report|| 12

Commitments
(a)
(b)
Un-Audited AuditedSeptember June
2018 2018
Not more than one year 575,177 800,204 More than one year but not more than five years 2,693,651 2,276,407 More than five years 633,778 815,837
3,902,606 3,892,448
8 PROPERTY, PLANT AND EQUIPMENT
Operating fixed assets 8.1&8.2 15,125,820 14,908,714 Capital work in progress (CWIP) 8.4 1,481,843 1,195,605
16,607,663 16,104,319
Un-AuditedSeptember September
8.1 Additions during the period 2018 2017
Buildings and structures on leasehold land 74,462 530,910 Plant and machinery 638,686 1,864,805 Furniture and fixtures - 559 Office equipment 13,877 6,927 Vehicles 39,445 10,511
766,470 2,413,712
8.1.1
Un-AuditedSeptember September
2018 2017
8.2 Disposals - operating fixed assets (at net book value)
Plant and machinery 71,309 22,484 Vehicles 22,428 4,339
93,737 26,823
8.2.1
8.3 Depreciation charge during the period 455,627 451,893
Un-AuditedSeptember September
2018 2017
8.4 Additions - capital work in progress (at cost)
Machinery 825,186 20,500 Building 158,045 194,527
983,231 215,027
Note Un-Audited Audited9 INTANGIBLE ASSETS September June
2018 2018
Intangible - net book value 9.1&9.2 55,611 23,985
Un-AuditedSeptember September
2018 2017
9.1 Additions - intangibles (at cost)Computer Software 34,534 -
9.2 Amortization charge during the period 2,908 2,530
10 CASH AND CASH EQUIVALENTS 2017 2016
Cash and cash equivalents comprises of:
Cash and bank balances 381,871 395,346Short term borrowings (18,745,405) (13,284,471)
(18,363,534) (12,889,125)
11 TAXATIONProvision for current taxation has been made on the basis of normal tax liability, final taxation, tax credit andseparate block income under the Income Tax Ordinance, 2001.
The Company is committed for capital expenditure as at September 30, 2018 of Rs. 1,198.1 million (June 2018: Rs. 1,234.4 million).
Additions to building and structure on leasehold land and plant and machinery include transfers from capital work-in-progress amounting to Rs.55.4 million and Rs. 640 million (September-2017: Additions to building and structure on leasehold land, plant and machinery and others includetransfers from capital work-in-progress amounting to Rs. 2,063 million, Rs. 304 million and Rs. 40 k).
The Company is committed to minimum rental payments for Retail outlets for each of the following period as follows:
Rupees in '000
Rupees in '000
Rupees in '000
Rupees in '000
Rupees in '000Rupees in '000
Disposals include assets scrapped at Net book value during the period of Rs. Nil (Sept-2017: Rs. 220 k).
Rupees in '000
Rupees in '000
Quarterly Report|| 13

12 SEGMENT INFORMATION
a) Spinning : Production of different qualities of yarn using both natural and artificial fibers.b) Weaving:c) Retail and
Distribution:d)
Transactions among the business segments are recorded at cost.
12.1 Segment Profitability
Sept-2018 Sept-2017 Sept-2018 Sept-2017 Sept-2018 Sept-2017 Sept-2018 Sept-2017 Sept-2018 Sept-2017 Sept-2018 Sept-2017
Sales 2,212,033 1,316,965 368,633 505,046 3,225,687 2,312,015 8,799,258 7,439,029 (2,671,269) (2,341,973) 11,934,342 9,231,082 Cost of sales 1,819,118 1,114,856 418,986 438,619 2,099,463 1,617,284 7,575,281 6,625,550 (2,671,269) (2,341,973) 9,241,579 7,454,336
Gross profit 392,915 202,109 (50,353) 66,427 1,126,224 694,731 1,223,977 813,479 - - 2,692,763 1,776,746
31,215 45,032 13,281 19,818 1,008,108 845,346 557,789 508,819 - 1,610,393 1,419,015
361,700 157,077 (63,634) 46,609 118,116 (150,615) 666,188 304,660 - - 1,082,370 357,731 Finance Cost 260,367 224,149 Other operating expenses 93,141 10,986 Other income (11,442) (37,422)
342,066 197,713 Profit/(loss) before taxation 740,304 160,018 Taxation 89,027 57,638 Profit/(loss) after taxation 651,277 102,380
Depreciation and Amortisation Expense 131,926 124,321 74,670 72,851 72,561 74,202 179,378 183,049 - - 458,535 454,423
12.2 Segment assets and liabilities
Un-Audited Audited Un-Audited Audited Un-Audited Audited Un-Audited Audited Un-Audited Audited Un-Audited AuditedSept-2018 June - 2018 Sept-2018 June - 2018 Sept-2018 June - 2018 Sept-2018 June - 2018 Sept-2018 June - 2018 Sept-2018 June - 2018
Assets 10,872,645 11,021,310 3,378,795 3,357,067 5,986,924 5,396,751 27,294,038 22,155,720 2,132,959 1,332,597 49,665,361 43,263,445
Liabilities 3,787,449 3,802,668 1,836,594 1,895,092 890,253 905,830 12,871,142 7,524,144 17,007,919 16,514,984 36,393,357 30,642,718
Segment Capital & IntangibleExpenditure 48,371 830,051 414,035 1,844,453 59,910 217,508 178,726 143,483 99,962 297,537 801,004 3,333,032
12.3
12.4
12.5
12.6 Information about major customer
Revenue from major customer whose revenue exceeds 10% of gross sales is Rs.2,966 million (Sep-2017: Rs. 2,591 million).
Total
The Company's Operations have been divided in four segments based on the nature of process and internal reporting. Following are the four reportable business segments:
Weaving is a method of fabric production in which two distinct sets of yarns or threads are interlaced at right angles to form a fabric.On the retail front, Ideas by Gul Ahmed offers fabrics and made-ups, ranging from home accessories to clothing.
Processing, Home Textile and Apparel Processing of greige fabrics into various types of finished fabrics for sale as well as to manufacture and sale of madeups and home textile products.
Spinning Weaving Retail and Distribution Processing, Home Textile and Apparel
Elimination Of Inter Segment Transactions
Spinning Weaving Retail and Distribution Processing, Home Textile and Apparel
------------------------------------------------Rs. 000s------------------------------------------------
The Company has implemented Microsoft Dynamics 365 for Retail & Distribution, which has now enabled the Company to disclose the figures separately for the segment.
Unallocated items represent those assets and liabilities which are common to all segments and these include investment in subsidiary, long term deposits, other receivables, deferredliabilities, certain common borrowing and other corporate assets and liabilities.
Based on judgement made by management, Processing, Home Textile and Apparel segments have been aggregated into single operating segment as the segments have similareconomic characteristics in respect of nature of the products, nature of production process, type of customers, method of distribution and nature of regularity environment.
------------------------------------------------Rs. 000s------------------------------------------------
Distribution cost and Administrative expenses Profit/(Loss) before tax and before charging following
Unallocated Total
Quarterly Report|| 14

12.7 Information by geographical area
Sep-18 Sep-17 Sep-18 Jun-18
Pakistan 4,732,864 3,473,709 17,013,257 16,368,577Germany 2,565,645 1,618,380 - - United States 1,117,974 901,262 - - France 344,846 506,271 - - Netherlands 591,452 501,736 - - United Kingdom 366,360 479,472 - - Italy 489,925 442,263 - - Spain 171,664 274,272 - - China 322,518 221,158 - - Sweden 327,628 211,862 - - United Arab Emirates 366,360 44,206 58,450 58,450 Other Countries 537,106 556,491 - -
11,934,342 9,231,082 17,071,707 16,427,02713,756,912
13 TRANSACTIONS AND BALANCES WITH RELATED PARTIES
Un-AuditedRelationship with Nature of transactions Sep-18 Sep-17the Company
Subsidiaries and Sale of goods 420,006 343,352 indirect subsidiaries Commission paid 121,061 32,033
Associated Companies Purchase of goods 44,493 23,516 and other related parties Sale of goods - 72
Rent paid 21,733 19,699 Fees paid 2,000 2,000 Donation paid 417 - Bills discounted 1,532,671 2,343,161 Commission / Bank charges paid 13,640 12,983 Mark up / Interest charged 8,943 1,472 Provident fund contribution 40,472 38,353
Un-Audited AuditedRelationship with Nature of outstanding balances Sep-18 Jun-18the Company
Subsidiaries and Trade and other payables 19,704 37,943 indirect subsidiaries Long term investment 58,450 58,450
Trade debts 480,947 390,603 Other receivables 17,468 22,526 Corporate guarantee issued in favour
of subsidiary company 113,035 110,450
Associated companies Borrowings from Banks 953,357 964,494 and others related parties Trade and other payables - Creditors 840 15,731
Payable to employee's provident fund 21,272 21,025 Bank guarantee 784,726 770,804 Accrued mark-up 2,925 8,785 Loans to key management personnel
& executive 69,081 54,594 Deposit with banks 336,720 115,270 Prepaid rent 28,392 42,588
Revenue Non-current assets
-------------------Rupees in '000-------------------
The related parties comprise subsidiaries, associated companies, companies where directors also holddirectorship, directors of the company and key management personnel. The Company in the normal course ofbusiness carried out transaction with various related parties.
Rupees in '000
Rupees in '000
Quarterly Report|| 15

14 FAIR VALUES
- Level 1
- Level 2
- Level 3
15 DATE OF AUTHORISATION
16 GENERAL
16.1
16.2 Figures have been rounded off to the nearest thousand rupees.
17 CORRESPONDING FIGURES
Reclassification from component Reclassification to component AmountRs '000
Other income Sales 15,972 Other income Sales - net (Exchange gain on realization
of export receivables)
Finance cost Cost of sales 205 Finance cost Cost of sales (Exchange gain on purchase)
MOHOMED BASHIR MOHAMMED ZAKI BASHIR ABDUL ALEEMChairman Chief Executive Officer Chief Finance Officer
Inputs other than quoted prices included within level 1 that are observable for the asset or liability,either directly (that is, as prices) or indirectly (that is, derived from prices).
There are no transactions with directors of the Company and key management personnel other than under theterms of employment for the period ending September 2018 amounting to Rs. 228 million (September-17: Rs.222 million) on account of remuneration.
Fair value is the price that would be received to sell an asset or paid to transfer a liability in an orderlytransaction in the principal (or most advantageous) market at the measurement date under current marketconditions (i.e. an exit price) regardless of whether that price is directly observable or estimated using anothervaluation technique.
The Company while assessing fair values uses valuation techniques that are appropriate in the circumstances
using relevant observable data as far as possible and minimizing the use of unobservable inputs. Fair values
are categorized into following three levels based on the input used in the valuation techniques;
Quoted prices in active markets for identical assets or liabilities that can be assessed atmeasurement.
Inputs are unobservable inputs for the asset or liability Inputs for the asset or liability that are notbased on observable market data (that is, unobservable inputs).
Financial assets and liabilities of the Company are either short term in nature or are repriced periodicallytherefore; their carrying amounts approximate their fair values.
These financial statements were authorised for issue on 29 October, 2018 by the Board of Directors of theCompany.
Allocations for the workers' profit participation fund, workers' welfare fund and taxation are provisional and finalliability including liability for deferred taxation will be determined on the basis of annual results.
For better presentation and due to revisions in the Companies Act 2017, certain re-classification have beenmade in the corresponding figures including following;
Quarterly Report|| 16

T e x t i l e M i l l s L i m i t e d
Consolidated AccountsConsolidated Condensed Interim Financial Information
For The First Quarter Ended September 30, 2018

Condensed Interim Consolidated Statement of Financial PositionAs at September 30, 2018
Un-Audited AuditedSeptember June
Note 2018 2018 --------------Rs. '000--------------
EQUITY AND LIABILITIES
SHARE CAPITAL AND RESERVES Authorised share capital 750,000,000 ordinary shares of Rs.10 each 7,500,000 7,500,000
Share Capital 3,564,955 3,564,955 356,495,525 ordinary shares of Rs. 10 each
Reserves 10,143,886 9,458,376 13,708,841 13,023,331
NON-CURRENT LIABILITIES Long term financing 7,124,482 6,911,869 Deferred liabilities
Deferred taxation 39,912 37,690 Staff Gratuity 69,880 71,517
109,792 109,207
CURRENT LIABILITIES Trade and other payables 9,178,424 7,126,081 Accrued mark-up/profit 136,516 175,633 Short term borrowings 18,745,405 15,146,734 Current maturity of long term financing 1,469,832 1,365,857 Unclaimed dividend 5,276 6,421 Unpaid dividend 11,052 11,052 Provision for taxation 5,398 13,157
29,551,903 23,844,935
CONTINGENCIES AND COMMITMENTS 8
50,495,018 43,889,342
ASSETS
NON-CURRENT ASSETSProperty, plant and equipment 9 16,624,464 16,121,877 Intangible assets 10 63,061 32,005 Long Term Investment 56,783 55,794 Long term loans and advances 44,114 38,607Long term deposits 305,869 205,999 Deferred taxation - 290
17,094,291 16,454,572
CURRENT ASSETSStores and spares 1,159,748 961,088 Stock-in-trade 20,105,408 16,419,958 Trade debts 6,998,898 5,666,199 Loans, advances and other receivables 1,230,594 1,192,970 Short term prepayments 285,820 249,933 Refunds due from Government 2,556,436 1,827,764 Taxation - net 638,798 597,781 Cash and bank balances 425,025 519,077
33,400,727 27,434,770
50,495,018 43,889,342
MOHOMED BASHIR MOHAMMED ZAKI BASHIRChairman Chief Executive Officer
- -
The annexed notes form an integral part of these condensed interim consolidated financial information.
ABDUL ALEEMChief Financial Officer
Quarterly Report|| 17

Condensed Interim Consolidated Statement of Profit or LossFor the quarter ended September 30, 2018
September September 2018 2017
--------------Rs. '000--------------
Sales - net 12,403,375 9,457,662
Cost of sales 9,493,626 7,620,304
Gross profit 2,909,750 1,837,358
Distribution cost 1,137,981 894,093 Administrative cost 632,718 609,093 Other operating cost 93,141 8,422
1,863,840 1,511,6081,045,910 325,750
Other income 11,578 50,830
Operating profit 1,057,488 376,580
Finance cost 262,744 224,635
Profit before taxation 794,744 151,945
Taxation- Current 86,805 57,396 - Deferred 2,222 -
89,027 57,396Profit after taxation 705,717 94,549
Earning per share - basic and diluted (Rs.) 1.98 0.27
MOHOMED BASHIR MOHAMMED ZAKI BASHIRChairman Chief Executive Officer
Un-Audited
The annexed notes form an integral part of these condensed interim consolidated financial information.
ABDUL ALEEMChief Financial Officer
Quarterly Report|| 18

Condensed Interim Consolidated Statement of Comprehensive IncomeFor the quarter ended September 30, 2018
Un-AuditedSeptember September
2018 2017 --------------Rs. '000--------------
Prodit after taxation 705,717 94,549
Other comprehensive income for the period
Items that will be reclassified to profit and loss account subsequently
Exchange difference on translation of foreign subsidiaries (20,208) 5,482
Total comprehensive income 685,509 100,031
MOHOMED BASHIR MOHAMMED ZAKI BASHIRChairman Chief Executive Officer
The annexed notes form an integral part of these condensed interim consolidated financial information.
ABDUL ALEEMChief Financial Officer
Quarterly Report|| 19

Condensed Interim Consolidated Statement of Cash Flows For the quarter ended September 30, 2018
Un-AuditedNote September September
2018 2017CASH FLOWS FROM OPERATING ACTIVITIES
Profit before taxation 794,744 151,945
Adjustments for:Depreciation 456,384 452,992 Amortisation 3,478 2,854 Provision for gratuity 5,776 6,768 Finance cost 262,744 224,635 Provision for slow moving/obsolete stores and spares 8,368 1,962
Impairment allowance against doubtful trade debts - 10,535 Gain on disposal of property, plant and equipment (9,658) (23,101) Loss on disposal of property, plant and equipment 26,608 -
753,700 676,645
Cash flows from operating acitivies before adjustments of working capital 1,548,444 828,590
Changes in working capital: (Increase)/decrease in current assets
Stores and spares (207,028) (230,297)Stock-in-trade (3,685,450) (2,315,503)Trade debts (1,332,699) 685,285Loans, advances and other receivables (37,624) (714,234)Short term prepayments (35,887) (426,290)Refunds due from Government - Net (728,672) 71,805
(6,027,360) (2,929,234) Decrease in current liabilities
Trade and other payables 2,052,343 1,504,580(3,975,017) (1,424,654)
Cash generated from operations before following: (2,426,573) (596,064)
Gratuity paid (7,413) (24,583)Finance cost paid (301,861) (259,659)Income tax paid or deducted (135,290) (103,579)Net decrease /(increase) in Long term loans and advances (5,507) (2,941)Increase in Long term deposits - Net (99,870) 2,773
(549,941) (387,989)Net cash used in operating activities (2,976,514) (984,053)
CASH FLOWS FROM INVESTING ACTIVITIES-
Addition to property, plant and equipment (1,054,125) (261,882)Addition to intangible assets (34,534) - Proceeds from sale of property, plant and equipment 78,205 61,395 Long term Investment (989) - Net cash used in investing activities (1,011,443) (200,487)
--------------Rs. '000--------------
Quarterly Report|| 20

Condensed Interim Consolidated Statement of Cash Flows For the quarter ended September 30, 2018
Note Un-AuditedSeptember September
2018 2017
CASH FLOWS FROM FINANCING ACTIVITIES
Long term financing obtained 505,541 137,630 Long term financing repaid (188,954) (136,519) Dividend paid (1,145) (16)
Net cash generated from financing activities 315,442 1,095 Exchange difference on translation of foreign susidiaries (20,208) 5,482
Net decrease in cash and cash equivalents (3,692,723) (1,177,963)
Cash and cash equivalents - at the beginning of the period (14,627,657) (11,648,168)
Cash and cash equivalents - at the end of the period 11 (18,320,380) (12,826,131)
MOHOMED BASHIR MOHAMMED ZAKI BASHIRChairman Chief Executive Officer
--------------Rs. '000--------------
The annexed notes form an integral part of these condensed interim consolidated financial information.
ABDUL ALEEMChief Financial Officer
Quarterly Report|| 21

Condensed Interim Consolidated Statement of Changes in EquityFor the quarter ended September 30, 2018
General Reserve
Exchange difference on translation of
foreign subsidiaries
Statutory reserve
created by foreign
subsidiary
Unappropriated profit
Balance as at June 30, 2017 3,564,955 1,405,415 4,980,000 123,550 18,060 1,103,678 7,630,703 11,195,658
Profit after taxation - - - - - 94,549 94,549 94,549
Other comprehensive income - - - 5,482 - - 5,482 5,482
- - - 5,482 - 94,549 100,031 100,031
Balance as at September 30, 2017 (Un-Audited) 3,564,955 1,405,415 4,980,000 129,032 18,060 1,198,227 7,730,734 11,295,689
Transfer to - - 400,000 - - (400,000) - -
Statutory reserve - - - - 1,588 (1,588) - - - - 400,000 - 1,588 (401,588) - -
Transactions with owners
- - - - - (356,496) (356,496) (356,496)
Profit after taxation - - - - - 2,065,832 2,065,832 2,065,832 Other comprehensive income - - - 29,973 - (11,667) 18,306 18,306
- - - 29,973 - 2,054,165 2,084,138 2,084,138
Balance as at June 30, 2017 3,564,955 1,405,415 5,380,000 159,005 19,648 2,494,308 9,458,376 13,023,331
Profit after taxation - - - - - 705,717 705,717 705,717 Other comprehensive income - - - (20,208) - - (20,208) (20,208)
- - - (20,208) - 705,717 685,509 685,510 Balance as at September 30, 2018 (Un-Audited) 3,564,955 1,405,415 5,380,000 138,797 19,648 3,200,025 10,143,885 13,708,841
MOHOMED BASHIR MOHAMMED ZAKI BASHIR ABDUL ALEEMChairman Chief Executive Chief Financial Officer
The annexed notes form an integral part of these condensed interim consolidated financial information.
Total comprehensive incomefor the period October 01, 2017 to June 30, 2018
Total comprehensive incomefor the first quarter ended September 2018 (un-audited)
Final dividend for the year ended June 30, 2017
Share capital
Reserves
TotalCapital reserve - Share
Premium
Revenue reserve
Subtotal Reserves
--------------------------------------------------Rs. '000--------------------------------------------------
Total comprehensive incomefor the first quarter ended September 2017 (un-audited)
General reserve
Quarterly Report|| 22

Notes to the Condensed Interim Consolidated Financial Information (Un-audited)For the quarter ended September 30, 2018
1 LEGAL STATUS AND ITS OPERATIONS
1.1 Gul Ahmed Group ( "the Group") comprises the following:
- Gul Ahmed Textile Mills Limited- Gul Ahmed International Limited (FZC) - UAE- GTM (Europe) Limited - UK- GTM USA Corp. - USA- Sky Home Corp.- USA
1.2 Basis of consolidation
Details of Subsidiaries
Name Chief Executive officer Address Date of
IncorporationCountry of Incorporation %of Holding Status Audit Status as at 30
September, 2018
Gul Ahmed International Limited FZC
Mr. Mohomed Bashir
P.O.box 8705, Q4-29, Sharjah Airport International free zone, Sharjah, U.A.E.
December 11, 2002 U.A.E 100% Operational Un-audited
GTM (Europe) Limited - Indirect subsidiary
Mr. Mohomed Bashir
City Wharf, New Bailey Street, Manchester M3 5ER, United Kingdom
April 17, 2003 U.K 100% Operational Un-audited
GTM USA - Indirect subsidiary
Mr. Mohomed Bashir
515, 7 West 34th Street, New York, USA
March 19, 2012 U.S.A 100% Operational Un-audited
Sky Home- Indirect Subsidiary
Mr. Mohomed Bashir
Street No. 328, South King Charles Road, City Raleigh, State North Carolina
February 28, 2017 U.S.A 100% Operational Un-audited
1.3 Geographical locations and addresses of all lands owned by the Company are as follows;
Unit Area AddressUnit 1,2 & 3 25.07 Acres Plot No. HT-4, Landhi Industrial Area, Landhi KarachiUnit 4 & 5 14.9 Acres Survey No.82, Deh Landhi ,Karachi Unit 6,7 & 8 18.56 Acres Plot No. H-7, Landhi Industrial Area, Landhi, Karachi Lasani warehouse4.17 Acres Plot No. H-19, Landhi Industrial Area, Landhi, KarachiMTF Plot 44.04 acres P.U. No. 48, 49, 50, & 51, Near Machine Tool Factory
Deh Khanto Tapo Landhi, KarachiPlot 2 Kanal,19 Plot No. 24-A, C-III, Gulberg Lahore
Marlas and 153.5 Sq. Feet
1.4 Geographical locations and addresses of all factory building and warehouses on rented premises are as follows;
Unit AddressHighway stitching complex Plot# 369, Main National Highway, Landhi, KarachiYarn Dyeing and Knitting unit Plot# HT/3A,KDA Scheme 3, Landhi Industrial area, KarachiStitching unit Plot# ST-17/1 and ST-17/3, Federal 'B' Area, Azizabad, KarachiHussaini stitching unit Plot# HT/8,KDA Scheme 3, Landhi Industrial area, KarachiApparel division Plot# 12, Sector 23, Korangi Industrial area, Karachi
Gul Ahmed Textile Mills Limited (The Holding Company) was incorporated on 1st April 1953 in Pakistan as a private limited company,converted into public limited company on 7th January 1955 and was listed on Karachi and Lahore Stock Exchanges in 1970 and 1971respectively. The Holding Company is a composite textile mill and is engaged in the manufacture and sale of textile products.
The Holding Company's registered office is situated at Plot No. 82, Main National Highway, Landhi, Karachi.
Gul Ahmed International Limited (FZC) -UAE is a wholly owned subsidiary of Gul Ahmed Textile Mills Limited, GTM (Europe) Limited is awholly owned subsidiary of Gul Ahmed International Limited (FZC) - UAE and GTM USA Corp. and Sky Home Corp. are wholly ownedsubsidiaries of GTM (Europe) Limited.
The Company is a subsidiary of Gul Ahmed Holdings (Private) Limited and owns 66.78% shares of the Company.
The financial information include the financial information of the Group.
Subsidiary companies are consolidated from the date on which more than 50% voting rights are transferred to the Holding Company orpower to govern the financial and operating policies over the subsidiary and is excluded from consolidation from the date of disposal orcessation of control.
The financial statements of the subsidiaries are prepared for the same reporting period as the Holding Company, using consistentaccounting policies.
The assets and liabilities of the subsidiary company have been consolidated on a line-by-line basis and the carrying value of investmentheld by the Company is eliminated against the subsidiary's share capital. All intra-group balances and transactions are eliminated.
All four subsidiaries are engaged in distribution/trading of textile related products.
Quarterly Report|| 23

1.5 As at June 30, 2018, the Company has 64 retail outlets, 32 fabric stores, 2 fair price shops, 5 whole sale shops and 7 franchises.
2 BASIS OF PREPARATION
3 ACCOUNTING POLICIES
4 FINANCIAL RISK MANAGEMENT
5 ACCOUNTING ESTIMATES, JUDGEMENTS AND FINANCIAL RISK MANAGEMENT
Un-Audited AuditedSeptember June
2018 20186 Long term financing - Secured
Opening balance 8,277,726 7,824,892 Add: Obtained during the period / year 505,541 1,270,701 Less: Repaid during the period / year (188,954) (817,867)
8,594,313 8,277,726
Less: Current portion shown under current liabilities (1,469,831) (1,365,857) 7,124,482 6,911,869
7 TRADE AND OTHER PAYABLES
Trade and other payables include provision in respect of;
a)
b)
Rupees in thousand
Increase in gas tariff rates notified vide SRO No. (I) / 2015 dated 31 August, 2015, and Oil and Gas Regulatory Authority(OGRA) notification dated 30 December, 2016 was challenged in Honorable Sindh Hight Court by the Group, as wasdisclosed in note no. 10.1.2 of the financial statements for the year ended June 30, 2018. Accordingly, the Group hasprovided banker's verified Cheque of Rs. 250.675 million (June-2018: 217.356 million) as security to Nazir of High CourtSindh and also, as a matter of prudence, made full provision up to the quarter ended 30 September 2018 amounting toRs. 410.601 million (June-2018: 377.283 million) in the consolidated financial statements. Subsequent to the periodended, the Oil and Gas Regulatory Authority (OGRA) has issued another notification dated October 04, 2018, revising thetariff effective from September 27, 2018 and the Group has paid the bill accordingly.
The Group as mentioned in note 12.1.3 of the financial statements for the year ended June 30, 2018 had filed a suit in theHonorable Sindh High Court challenging the charging of captive power tariff instead of industry tariff. Accordingly, theGroup has provided banker's certified cheques of Rs. 388.570 million (June-2018: Rs. 332.397 million) as security toNazir of High Court of Sindh and also, as a matter of prudence, made full provision up to the quarter ended 30September, 208 amounting to Rs. 626.230 million (June-2018: Rs. 570.057 million) in the consolidated financialstatements. Subsequent to the period ended, the OGRA has issued another notification dated October 04, 2018 revisingthe tariff effective September 27, 2018 and the Group has paid the bill accordingly.
The comparatives statement of Financial Position, presented in these condensed interim consolidated financial information, as at June30, 2018 has been extracted from the audited financial statements of the Group for the year ended June 30, 2018 whereas thecomparative condensed interim consolidated statement of profit or loss, condensed interim consolidated statement of comprehensiveincome, condensed interim consolidated statement of cash flows and condensed interim consolidated statement of changes in equity forthe first quarter ended September 30, 2018 have been extracted from the condensed interim consolidated financial information of theGroup for the first quarter ended September 30, 2017.
These condensed interim consolidated financial information do not include all the information required in annual financial statements prepared in accordance with approved accounting standards as applicable in Pakistan, and should be read in conjunction with the consolidated financial statements for the year ended June 30, 2018.
Certain new IFRSs and amendments to existing IFRSs, effective for periods beginning on or after July 1, 2018, do not have any impacton this condensed interim financial information, and are therefore not presented.
Accounting policies and method of computations adopted for the preparation of these condensed interim consolidated financialinformation are the same as those applied in the preparation of the consolidated financial statements for the year ended June 30, 2018.
The Group's financial risk objectives and policies are consistent with those disclosed in the annual audited financial statements as at andfor the year ended June 30, 2018.
The preparation of this condensed interim consolidated financial information requires management to make estimates, assumptions anduse judgments that affect the application of policies and reported amounts of assets and liabilities and income and expenses. Estimates,assumptions and judgments are continually evaluated and are based on historical experience and other factors, including reasonableexpectations of future events. Revisions to accounting estimates are recognised prospectively commencing from the period of revision.Judgments and estimates made by the management in the preparation of this condensed interim financial information are the same asthose that were applied to financial statements as at and for the year ended June 30, 2018.
These condensed interim consolidated financial information comprise of the condensed interim consolidated statement of FinancialPosition as at September 30, 2018 and the condensed interim consolidated statement of profit or loss, condensed interim consolidatedstatement of comprehensive income, condensed interim consolidated statement of cash flows and condensed interim consolidatedstatement of changes in equity for the first quarter ended September 30, 2018.
The condensed interim consolidated financial information comprise the consolidated statement of Financial Position of Gul Ahmed TextileMills Limited, its wholly owned subsidiary company Gul Ahmed International Limited (FZC), GTM (Europe) Limited which is the whollyowned subsidiary of Gul Ahmed International Limited (FZC), GTM USA Corporation which is the wholly owned subsidiary of GTM(Europe) Limited and Sky Home Corporation which is the wholly owned subsidiary of GTM (Europe) Limited, as at September 30, 2018and the related consolidated statement of profit or loss, consolidated statement of cash flows and consolidated statement of changes inequity together with the notes forming part thereof for the period then ended. The financial statements of the subsidiary companies havebeen consolidated on a line by line basis.
This condensed interim consolidated financial information of the Group for the quarter ended September 30, 2018 has been prepared inaccordance with the requirements of the International Accounting Standards 34 - Interim Financial Reporting and provisions of anddirectives issued under the repealed Companies Ordinance, 1984. In case where requirements differ, the provisions of or directivesissued under the repealed Companies Ordinance, 1984 shall prevail.
Quarterly Report|| 24

8 CONTINGENCIES AND COMMITMENTS
Contingencies
Gurarantees
(a)
(b)
(c)
(d)
Commitments
(a) Group is committed for certain expenditures which are stated as follows:
Un-Audited AuditedSeptember June
2018 2018
(b) The Group is committed for minimum rental payments for each of following period as follows:
Not more than one year 575,177 800,204 More than one year but not more than five years 2,693,651 2,276,407 More than five years 633,778 815,837
3,902,606 3,892,448
9 PROPERTY, PLANT AND EQUIPMENT
Operating fixed assets 9.1 & 9.2 15,142,620 14,926,272 Capital work in progress (CWIP) 9.4 1,481,843 1,195,605
16,624,464 16,121,877
Un-Auditedfor the first quarter for the first quarter
September September 2018 2017
9.1 Additions during the period
Buildings and structures on leasehold land 74,462 530,910 Plant and machinery 638,686 1,864,805 Furniture and fixtures - 1,153 Office equipment 13,877 6,961 Vehicles 39,445 10,511
766,470 2,414,340
9.1.1
--------------Rs. '000--------------
--------------Rs. '000--------------
Additions to building and structure on leasehold land and plant and machinery include transfers from capital work-in-progressamounting to Rs. 55.4 million and Rs. 640 million (September-2017: Additions to building and structure on leasehold land,plant and machinery and others include transfers from capital work-in-progress amounting to Rs. 2,063 million, Rs. 304million and Rs. 40 k).
The Group is committed for capital expenditure as at September 30, 2018 of Rs. 1,198.1 million (June 2018: Rs. 1,234.4 million).
The status of contingencies, as reported in the annual financial statements for the year ended June 30, 2018, except as statedbelow, remained unchanged during the current period.
Rs. 853 million (June-2018: Rs. 839 million) against guarantees issued by banks which are secured by pari passuhypothecation charge over stores and spares, stock-in-trade, trade debts and other receivables. These guarantees includesguarantees issued by related party amounting to Rs. 784 million (June 2018: Rs. 771 million).
Post dated cheques Rs. 2,673 million (June-2018: Rs. 3,440 million) are issued to Custom Authorities in respect of duties onimported items availed on the basis of consumption and export plans.
Bills discounted Rs. 1,486 million (June-2018: Rs. 1,292 million).
Corporate guarantee of Rs. 113.035 million (June-2018: Rs. 110.45 million) has been issued to a bank in favor of indirectsubsidiary company - GTM (Europe) Limited - UK. This has been issued in accordance with the requirement of CompaniesAct, 2017.
Quarterly Report|| 25
Un-Auditedfor the first quarter for the first quarter
September September 2018 2017
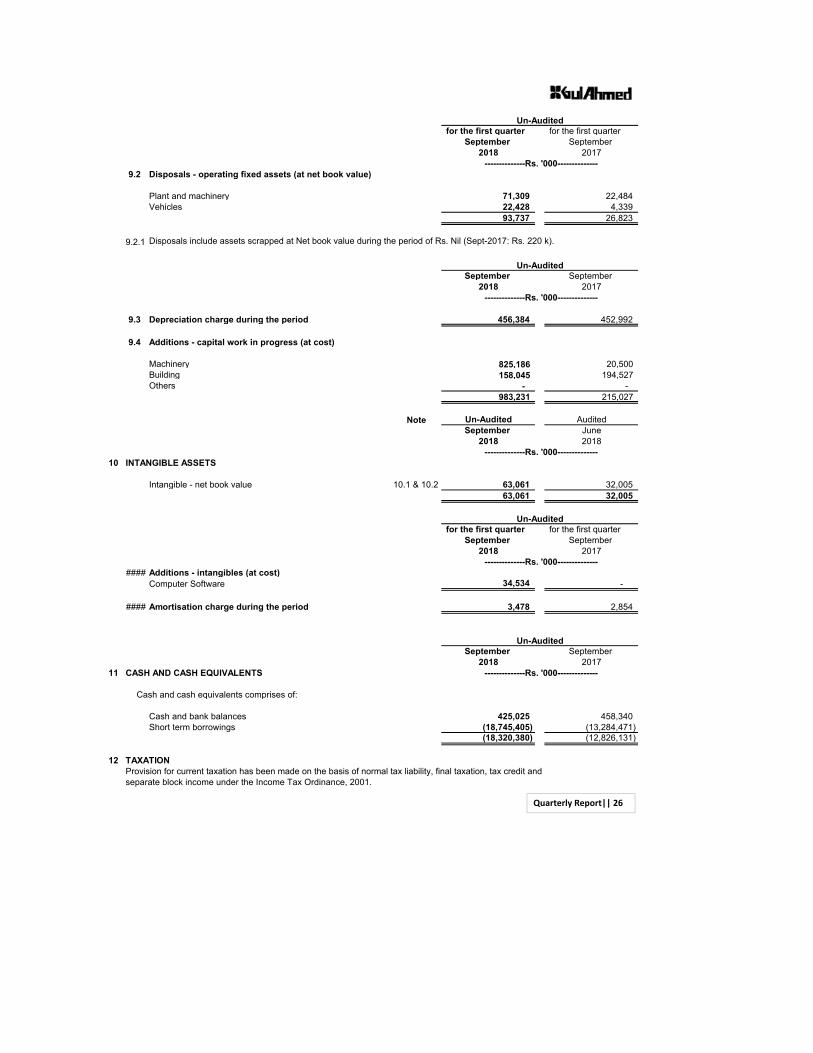
9.2 Disposals - operating fixed assets (at net book value)
Plant and machinery 71,309 22,484 Vehicles 22,428 4,339
93,737 26,823
9.2.1
Un-AuditedSeptember September
2018 2017
9.3 Depreciation charge during the period 456,384 452,992
9.4 Additions - capital work in progress (at cost)
Machinery 825,186 20,500 Building 158,045 194,527 Others - -
983,231 215,027
Note Un-Audited AuditedSeptember June
2018 2018
10 INTANGIBLE ASSETS
Intangible - net book value 10.1 & 10.2 63,061 32,005 63,061 32,005
Un-Auditedfor the first quarter for the first quarter
September September 2018 2017 --------------Rs. '000--------------
#### Additions - intangibles (at cost)Computer Software 34,534 -
#### Amortisation charge during the period 3,478 2,854
Un-AuditedSeptember September
2018 201711 CASH AND CASH EQUIVALENTS
Cash and cash equivalents comprises of:
Cash and bank balances 425,025 458,340Short term borrowings (18,745,405) (13,284,471)
(18,320,380) (12,826,131)
12 TAXATIONProvision for current taxation has been made on the basis of normal tax liability, final taxation, tax credit andseparate block income under the Income Tax Ordinance, 2001.
--------------Rs. '000--------------
--------------Rs. '000--------------
--------------Rs. '000--------------
--------------Rs. '000--------------
Disposals include assets scrapped at Net book value during the period of Rs. Nil (Sept-2017: Rs. 220 k).
Quarterly Report|| 26
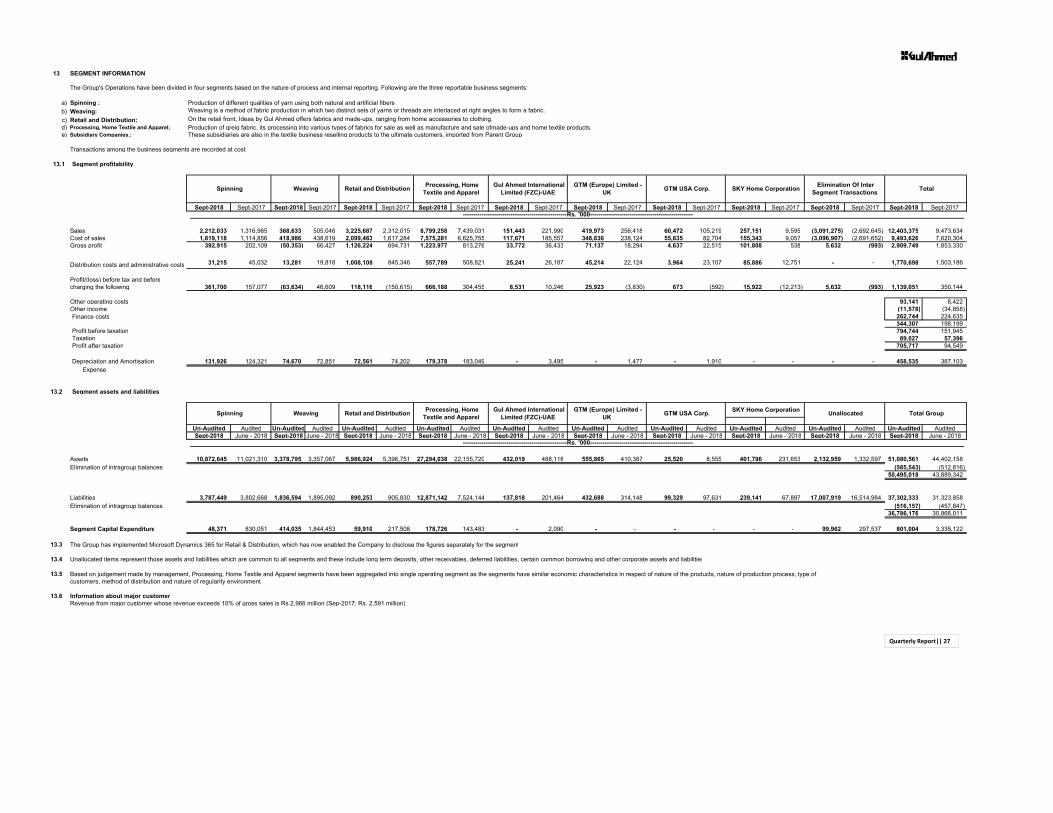
13 SEGMENT INFORMATION
a) Spinning : Production of different qualities of yarn using both natural and artificial fibers.b) Weaving:c) Retail and Distribution:d) Processing, Home Textile and Apparel; Production of greig fabric, its processing into various types of fabrics for sale as well as manufacture and sale of made-ups and home textile products.e) Subsidiary Companies.: These subsidiaries are also in the textile business reselling products to the ultimate customers, imported from Parent Group.
Transactions among the business segments are recorded at cost.
13.1 Segment profitability
Sept-2018 Sept-2017 Sept-2018 Sept-2017 Sept-2018 Sept-2017 Sept-2018 Sept-2017 Sept-2018 Sept-2017 Sept-2018 Sept-2017 Sept-2018 Sept-2017 Sept-2018 Sept-2017 Sept-2018 Sept-2017 Sept-2018 Sept-2017
Sales 2,212,033 1,316,965 368,633 505,046 3,225,687 2,312,015 8,799,258 7,439,031 151,443 221,990 419,973 256,418 60,472 105,219 257,151 9,595 (3,091,275) (2,692,645) 12,403,375 9,473,634 Cost of sales 1,819,118 1,114,856 418,986 438,619 2,099,463 1,617,284 7,575,281 6,625,755 117,671 185,557 348,836 238,124 55,835 82,704 155,343 9,057 (3,096,907) (2,691,652) 9,493,626 7,620,304 Gross profit 392,915 202,109 (50,353) 66,427 1,126,224 694,731 1,223,977 813,276 33,772 36,433 71,137 18,294 4,637 22,515 101,808 538 5,632 (993) 2,909,749 1,853,330
Distribution costs and administrative costs 31,215 45,032 13,281 19,818 1,008,108 845,346 557,789 508,821 25,241 26,187 45,214 22,124 3,964 23,107 85,886 12,751 - - 1,770,698 1,503,186
Profit/(loss) before tax and beforecharging the following 361,700 157,077 (63,634) 46,609 118,116 (150,615) 666,188 304,455 8,531 10,246 25,923 (3,830) 673 (592) 15,922 (12,213) 5,632 (993) 1,139,051 350,144
Other operating costs 93,141 8,422 Other income (11,578) (34,858) Finance costs 262,744 224,635
344,307 198,199 Profit before taxation 794,744 151,945 Taxation 89,027 57,396 Profit after taxation 705,717 94,549
Depreciation and Amortisation 131,926 124,321 74,670 72,851 72,561 74,202 179,378 183,049 - 3,495 - 1,477 - 1,910 - - - - 458,535 387,103 Expense
13.2 Segment assets and liabilities
Un-Audited Audited Un-Audited Audited Un-Audited Audited Un-Audited Audited Un-Audited Audited Un-Audited Audited Un-Audited Audited Un-Audited Audited Un-Audited Audited Un-Audited AuditedSept-2018 June - 2018 Sept-2018 June - 2018 Sept-2018 June - 2018 Sept-2018 June - 2018 Sept-2018 June - 2018 Sept-2018 June - 2018 Sept-2018 June - 2018 Sept-2018 June - 2018 Sept-2018 June - 2018 Sept-2018 June - 2018
Assets 10,872,645 11,021,310 3,378,795 3,357,067 5,986,924 5,396,751 27,294,038 22,155,720 432,019 488,118 555,865 410,387 25,520 8,555 401,796 231,653 2,132,959 1,332,597 51,080,561 44,402,158 Elimination of intragroup balances (585,543) (512,816)
50,495,018 43,889,342
Liabilities 3,787,449 3,802,668 1,836,594 1,895,092 890,253 905,830 12,871,142 7,524,144 137,818 201,464 432,688 314,148 99,329 97,631 239,141 67,897 17,007,919 16,514,984 37,302,333 31,323,858 Elimination of intragroup balances (516,157) (457,847)
36,786,176 30,866,011
Segment Capital Expenditure 48,371 830,051 414,035 1,844,453 59,910 217,508 178,726 143,483 - 2,090 - - - - - - 99,962 297,537 801,004 3,335,122
13.3
13.4 Unallocated items represent those assets and liabilities which are common to all segments and these include long term deposits, other receivables, deferred liabilities, certain common borrowing and other corporate assets and liabilities.
13.5
13.6 Information about major customerRevenue from major customer whose revenue exceeds 10% of gross sales is Rs.2,966 million (Sep-2017: Rs. 2,591 million).
Total
--------------------------------------------------Rs. '000--------------------------------------------------
--------------------------------------------------Rs. '000--------------------------------------------------
The Group has implemented Microsoft Dynamics 365 for Retail & Distribution, which has now enabled the Company to disclose the figures separately for the segment.
Based on judgement made by management, Processing, Home Textile and Apparel segments have been aggregated into single operating segment as the segments have similar economic characteristics in respect of nature of the products, nature of production process, type of customers, method of distribution and nature of regularity environment.
Gul Ahmed International Limited (FZC)-UAE
GTM (Europe) Limited - UK GTM USA Corp. SKY Home Corporation Unallocated Total Group Spinning Weaving Retail and Distribution Processing, Home
Textile and Apparel
The Group's Operations have been divided in four segments based on the nature of process and internal reporting. Following are the three reportable business segments:
Weaving is a method of fabric production in which two distinct sets of yarns or threads are interlaced at right angles to form a fabric.On the retail front, Ideas by Gul Ahmed offers fabrics and made-ups, ranging from home accessories to clothing.
Spinning Weaving Retail and Distribution Processing, Home Textile and Apparel
Gul Ahmed International Limited (FZC)-UAE
GTM (Europe) Limited - UK GTM USA Corp. SKY Home Corporation Elimination Of Inter
Segment Transactions
Quarterly Report|| 27

13.7 Information by geographical area
Sep - 2018 Sep - 2017 Sep - 2018 Jun - 2018
Pakistan 4,732,864 3,473,709 17,013,257 16,368,577 Germany 2,565,645 1,618,380 - - United States 1,361,331 928,071 - 4,121 Netherlands 344,846 501,736 - - Italy 591,452 442,263 - - United Kingdom 447,327 499,305 62,697 64,089 Spain 489,925 274,272 - - France 171,664 506,271 - - Sweden 322,518 211,862 - China 327,628 221,158 - United Arab Emirates 511,069 240,116 18,337 17,785 Other Countries 537,106 540,519 - - Total 12,403,375 9,457,662 17,094,291 16,454,572
14 TRANSACTIONS AND BALANCES WITH RELATED PARTIES
Un-AuditedSep - 2018 Sep - 2017
Relationship with Nature of transactionsthe Group
Associated Companies Purchase of goods 44,493 23,516 and other related parties Sale of goods - 72
Rent paid 21,733 19,699 Fees paid 2,000 2,000 Commission/Discount - - Donation paid 417 - Bills discounted 1,532,671 2,343,161 Commission / Bank charges paid 13,640 12,983 Mark up / Interest charged 8,943 1,472 Holding Company's contribution to -
provident fund 40,472 38,353
Relationship with Nature of outstanding balances Un-Audited Auditedthe Group Sep - 2018 Jun - 2018
Associated companies Deposit with banks 336,720 115,270 and others related parties Borrowings from Banks 953,357 964,494
Bank guarantee 784,726 770,804 Trade and other payables 840 15,731 Trade debts - - Accrued mark-up 2,925 8,785 Advances to suppliers - - Loans to key management personnel - & executive 69,081 54,594 Payable to employee's provident fund 21,272 21,025Prepaid Rent 28,392 42,588
The related parties comprise subsidiaries, associated companies, companies where directors also holddirectorship, directors of the Group and key management personnel. The Group in the normal course of businesscarried out transaction with various related parties.
Rupees in thousand
Rupees in thousand
There are no transactions with directors of the Company and key management personnel other than under theterms of employment for the period ending September 2018 amounting to Rs. 260 million (September-17: Rs. 249million) on account of remuneration.
Rupees in thousand
Revenue Non-current assetsFor the first quarter ended
(Un-audited) Un-Audited Audited
Quarterly Report|| 28

15 FAIR VALUES
- Level 1
- Level 2
- Level 3
16 DATE OF AUTHORISATION
17 GENERAL
Figures have been rounded off to the nearest thousand rupees.
Reclassification from component Reclassification to component AmountRs '000
Other income SalesOther income Sales - net (Exchange gain on realization 15,972
of export receivables)
Finance cost Cost of sales 205 Finance cost Cost of sales (Exchange gain on purchase)
MOHOMED BASHIR MOHAMMED ZAKI BASHIRChairman Chief Executive Officer
Allocations for the workers' profit participation fund, workers' welfare fund and taxation are provisional and finalliability including liability for deferred taxation will be determined on the basis of annual results.
ABDUL ALEEMChief Financial Officer
Quoted prices in active markets for identical assets or liabilities that can be assessed atmeasurement.
Inputs other than quoted prices included within level 1 that are observable for the asset orliability, either directly (that is, as prices) or indirectly (that is, derived from prices).
Inputs are unobservable inputs for the asset or liability Inputs for the asset or liability thatare not based on observable market data (that is, unobservable inputs).
Financial assets and liabilities of the Group are either short term in nature or are repriced periodically therefore;their carrying amounts approximate their fair values.
These financial statements were authorised for issue on October 29, 2018 by the Board of Directors of the Group.
The Group while assessing fair values uses valuation techniques that are appropriate in the circumstances usingrelevant observable data as far as possible and minimizing the use of unobservable inputs. Fair values arecategorized into following three levels based on the input used in the valuation techniques;
Fair value is the price that would be received to sell an asset or paid to transfer a liability in an orderly transaction inthe principal (or most advantageous) market at the measurement date under current market conditions (i.e. an exitprice) regardless of whether that price is directly observable or estimated using another valuation technique.
Quarterly Report|| 29