texture defect detection system with image deflection ... · texture defect detection system with...
TRANSCRIPT
Texture Defect Detection System with Image Deflection Compensation
CHUN-CHENG LIN CHENG-YU YEH
Department of Electrical Engineering National Chin-Yi University of Technology
35, Lane 215, Sec. 1, Chungshan Road, Taiping, Taichung, Taiwan [email protected] [email protected]
Abstract: Image textural analysis technology has been widely used in the design of automated defect detection systems. Because the presence of defects may change the textural features of an image, a reference image without defects can be compared with the test image to detect whether there are any defects. However, besides defects, the deflection of the input test image could also change its textural features. When there is any angular difference between the reference and test images, their textural features would also be different, even if there is no defect in the test image. As a result, misjudgment of the defect detection system may occur. Most of the previous studies have focused on the development of textural analysis technology which could decrease the effect of test image deflection. This study aimed to estimate the deflection angle of test images through polar Fourier transform and phase correlation analysis, and rotate the reference image by the same angle to compensate for the deflection of the test image. After the angles of the reference and test images were brought into line, the textural analysis based on the gray level co-occurrence matrix was applied to analyze and compare the textural features of the two images. The results of actual texture defect detection demonstrated that the angular differences between the reference and test images could be estimated correctly, with an estimation error of only 0° to 0.5°. By compensating for the deflection of the test image, the accuracy of the texture defect detection could be effectively enhanced. Key-Words: - Texture defect detection, Image deflection compensation, Polar Fourier transform, Phase correlation analysis, Gray level co-occurrence matrix 1 Introduction
In automated production systems, defects are likely to occur in many products, such as textiles, steel products, discs, and glass and paper products, due to the abnormality of processing tools during processing. If the defect is too small to be identified by visual inspection, it would be time-consuming and strenuous to carry out manual inspection, and thus inspection may be neglected. Since the textural features of defects are different from those of the products, many studies have proposed image textural analysis technology to design an automated defect detection system. The main aim of textural analysis is to simulate human capability of distinguishing textures, and identify appropriate textural features to describe the image, so as to analyze textural differences.
The main methods for textural analysis include the statistical method [1-9], the structural method [10] and the spectral method [11-15]. The statistical method can provide all sorts of statistical data about the relative positions among pixels, and then decrease the effects of textural image translation, rotation and noise, thus having inherent advantages for defect detection. It can be divided into first order, second order and higher order levels. Julesz [16]
pointed out that human’s vision system is most appropriate for second-order statistics; thus, most researchers have adopted this kind of statistics. The second-order statistical method includes the gray level co-occurrence matrix (GLCM) [1-5], the neighboring gray level dependence matrix [6-8] and the neighborhood gray tone difference matrix [9]. The structural method considers that images are formed by textural primaries arranged based on specific rules. Accordingly, it identifies the arrangement rules by obtaining textural primaries in the image [10]. However, to analyze the images with inconspicuous textural rules, the structural method cannot effectively obtain the textural primaries and describe their arrangement rules. The spectral method uses Fourier transform to analyze the obtained spectrums and distinguish the features of periodic texture, such as main direction, spatial period and spectral energy [11-15].
Moreover, there are some other textural analysis methods based on the Markov random field model [17,18], the directional Walsh-Hadamard transform [19], the random subspace neural classifier [20], the wavelet transform [21], and the optimized filter [22,23]. Chang et al. [17] observed that certain spatial and temporal features of the Markov random
WSEAS TRANSACTIONS on COMPUTERS Chun-Cheng Lin, Cheng-Yu Yeh
ISSN: 1109-2750 1575 Issue 9, Volume 8, September 2009
field density function can be derived to model temporal textures. They proposed a texture descriptor based on spatial and temporal prediction residual of mean filtering to study the dynamic nature of textures for video indexing. Zimeras [18] further developed an auto-logistic model based on Markov random fields to simulate texture patterns. The method based on the directional Walsh-Hadamard transform [19] can insert the basic advantages of multi-scale and multi-directional texture analysis into a fast modified Walsh-Hadamard transform. The random subspace neural classifier [20] was developed and used for image recognition in micromechanics, and can recognize different types of metal surfaces after mechanical processing. Ngan et al [21] proposed the method based on wavelet transform and golden image subtraction for defect detection on patterned fabric or repetitive patterned texture. The golden image subtraction can effectively segment out the defective regions on patterned fabric. The optimized filters using linear finite-impulse-response filters [22] and Gabor filters [23] were designed to automatically extract the defects in textured materials.
Since the presence of defects can change the textural features of an image, a reference image without defects can be used to compare with the test image to detect whether there are any defects. However, besides defects, the image deflection can also change textural features and affect the accuracy of defect detection. When there is any angular difference between the reference image and the test image, their textural features are accordingly different, even if there is no defect in the test image. As a result, misjudgment of the detection system may occur. Although the current methods of textural analysis can extract various useful features in textured materials, they are all sensitive to image deflection. This study aimed to compensate for the deflection angle of the test image, so as to enhance the accuracy of texture defect detection. It transformed the rotation relationship between the test and reference images into a displacement relationship in the frequency domain through polar Fourier transform [24-27], and estimated the displacement vector in the frequency domain through phase correlation analysis [28] to obtain the angular difference between the two images. Then, the reference image was rotated by the same angle to compensate for the deflection of the test image. When the angles of the test and reference images were brought into line, the GLCM-based statistical method was applied to analyze and compare the textural features of the two images.
The remainder of this paper is organized as follows. Sections 2 and 3 introduce the estimation methods for the deflection angle of the test image and the GLCM-based texture analysis, respectively. Section 4 establishes the texture defect detection rules, and defines the performance indexes of the texture defect detection system. Section 5 explains the detection results of the texture defect detection system for all defect images. Section 6 gives the conclusions. 2 Estimation methods for the deflection angle of the test image According to the properties of Fourier transform, spatial signal displacement or rotation has specific corresponding relationships in the frequency domain. Therefore, the spatial displacement vector or rotation angle can be calculated from the frequency domain. Kuglin and Hines [28] used the translation property of Fourier transform to propose a phase correlation analysis to calculate the displacement vector between two images, and applied this analysis in image registration. Other research on image registration [24-27] combined polar Fourier transform and phase correlation analysis to further calculate the difference of rotation angles between two images. Through polar Fourier transform, the original spatial rotation relationship of these two images before and after rotating could be expressed as a displacement relationship in the frequency domain. Therefore, phase correlation analysis can be further used to calculate the displacement vector in the frequency domain, and to obtain the angle difference of these two images.
In this study, the estimation method for the deflection angle of the test image is described in detail as follows. Suppose that 1f and 2f are the images before and after a displacement of ),( 00 yx , the relationship between which is as follows:
),(),( 0012 yyxxfyxf −−= (1) According to the translation property of Fourier transform, the relationship between Fourier transforms ),(1 vuF and ),(2 vuF of image 1f and
2f is as follows:
),(),( 1)(2
200 vuFevuF vyuxj ×= +− π (2)
Moreover,
WSEAS TRANSACTIONS on COMPUTERS Chun-Cheng Lin, Cheng-Yu Yeh
ISSN: 1109-2750 1576 Issue 9, Volume 8, September 2009

)(2
1
2 00
),(),( vyuxje
vuFvuF +−= π (3)
Accordingly, image displacement in frequency domain can only change the phase correlation of )(2 00 vyuxje +− π . After Eq. (3) taken on inverse Fourier transform, ),( 00 yyxx −−δ can be obtained. The position of maximum ),( 00 yyxx −−δ is then the displacement vector ( 0x , 0y ). The inverse Fourier transform of Eq. (3) is defined as a phase correlation function as follows [28]:
)),(),((),(
1
21
vuFvuFyxCorr −ℑ=
)),((maxarg),(),(00 yxCorryx
yx= (4)
where 1−ℑ is the inverse Fourier transform, and 0x and 0y are the positions of the maximum phase correlation function. Therefore, in phase correlation analysis, two images with a displacement relationship undergo Fourier transform first, and then their phase correlation function is calculated, and the position of the maximum phase correlation function is obtained, in order to find the displacement vector between the two images.
Figures 1(a) and (b) are the images of a rectangle before and after a displacement of (30, 10). The corresponding phase correlation function is shown in Figure 2. As seen, the maximum value of this function appears at (30, 10). Therefore, the spatial displacement vector of the images is (30, 10).
Image rotation also has a specific corresponding relationship in the frequency domain [24-27]. Supposing that 2f can be obtained through rotating
1f by 0θ , then the relationship between 1f and 2f can be described as follows:
,sincos(),( 0012 θθ yxfyxf += )sincos 00 θθ yx +− (5)
According to the rotation properties of Fourier transform, the relationship between spectrums
),(1 vuF and ),(2 vuF after 1f and 2f undergo Fourier transform is as follows:
,sincos(),( 0012 θθ vuFvuF += )sincos 00 θθ vu +− (6)
(a) (b)
Fig. 1 A rectangle image, (a) before displacement; (b) after a displacement of (30, 10).
Fig. 2 The phase correlation function corresponding to a displacement of (30, 10).
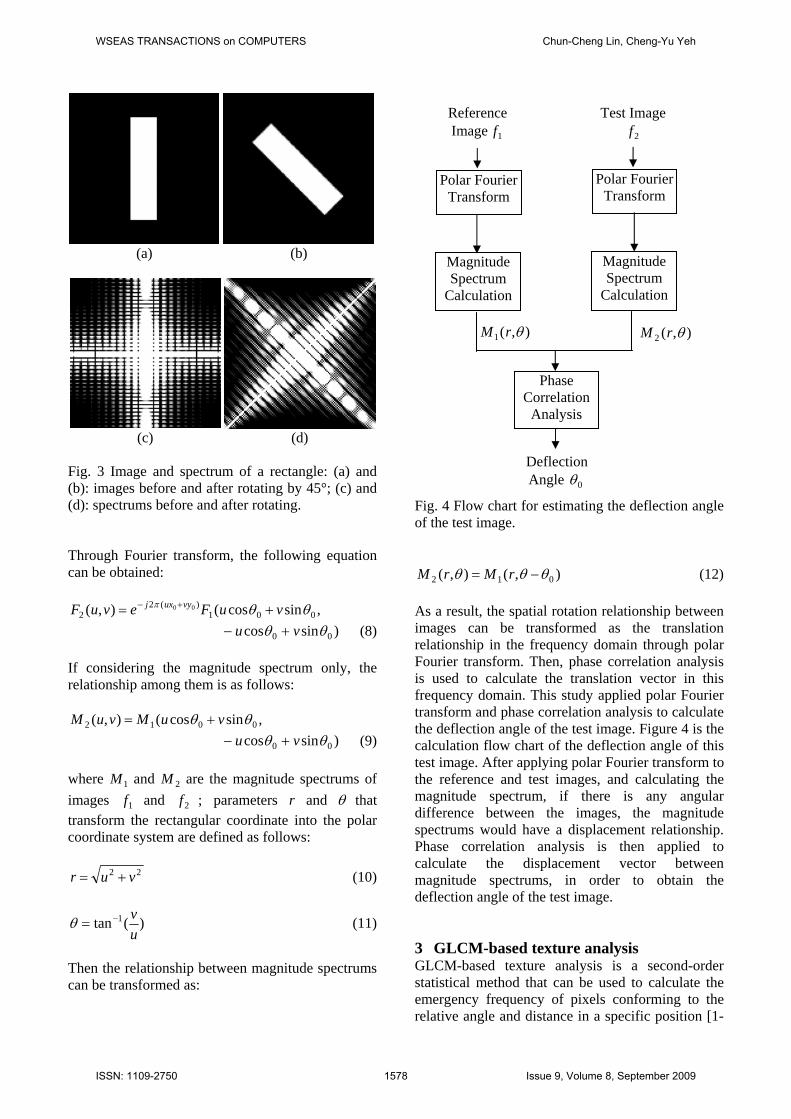
Therefore, when the image rotates by 0θ , the spectrum also rotates by 0θ . Figures 3(a) and (b) are the images of a rectangle before and after rotating by 45°. Figures 3(c) and (d) show the spectrums of the image before and after rotating. The rotation angles of the spectrum in the frequency domain and the image in the spatial domain are both 45°.
Although the rotation angles in the frequency and spatial domains are the same, they cannot be calculated directly in the frequency domain. The spatial rotation relationship needs to be transformed into a displacement relationship in the frequency domain. Polar Fourier transform transforms the spectrum represented by the rectangular coordinate after Fourier transform into that represented by polar coordinate. Supposing that 2f is obtained through translating 1f by ),( 00 yx and rotating it by
0θ , then the relationship between 1f and 2f can be described as follows:
,sincos(),( 00012 xyxfyxf −+= θθ
)sincos 000 yyx −+− θθ (7)
Mag
nitu
de
WSEAS TRANSACTIONS on COMPUTERS Chun-Cheng Lin, Cheng-Yu Yeh
ISSN: 1109-2750 1577 Issue 9, Volume 8, September 2009
(a) (b)
(c) (d)
Fig. 3 Image and spectrum of a rectangle: (a) and (b): images before and after rotating by 45°; (c) and (d): spectrums before and after rotating. Through Fourier transform, the following equation can be obtained:
,sincos(),( 001)(2
200 θθπ vuFevuF vyuxj += +−
)sincos 00 θθ vu +− (8) If considering the magnitude spectrum only, the relationship among them is as follows:
,sincos(),( 0012 θθ vuMvuM += )sincos 00 θθ vu +− (9)
where 1M and 2M are the magnitude spectrums of images 1f and 2f ; parameters r and θ that transform the rectangular coordinate into the polar coordinate system are defined as follows:
22 vur += (10)
)(tan 1
uv−=θ (11)
Then the relationship between magnitude spectrums can be transformed as:
Fig. 4 Flow chart for estimating the deflection angle of the test image.
),(),( 012 θθθ −= rMrM (12) As a result, the spatial rotation relationship between images can be transformed as the translation relationship in the frequency domain through polar Fourier transform. Then, phase correlation analysis is used to calculate the translation vector in this frequency domain. This study applied polar Fourier transform and phase correlation analysis to calculate the deflection angle of the test image. Figure 4 is the calculation flow chart of the deflection angle of this test image. After applying polar Fourier transform to the reference and test images, and calculating the magnitude spectrum, if there is any angular difference between the images, the magnitude spectrums would have a displacement relationship. Phase correlation analysis is then applied to calculate the displacement vector between magnitude spectrums, in order to obtain the deflection angle of the test image. 3 GLCM-based texture analysis GLCM-based texture analysis is a second-order statistical method that can be used to calculate the emergency frequency of pixels conforming to the relative angle and distance in a specific position [1-
Deflection Angle 0θ
Reference Image 1f
Test Image2f
Polar FourierTransform
Magnitude Spectrum
Calculation
Polar FourierTransform
Phase Correlation
Analysis
Magnitude Spectrum
Calculation
),(1 θrM ),(2 θrM
WSEAS TRANSACTIONS on COMPUTERS Chun-Cheng Lin, Cheng-Yu Yeh
ISSN: 1109-2750 1578 Issue 9, Volume 8, September 2009

5]. The corresponding GLCM is different due to the difference of the relative position angle of the detected pixels. Each image has four GLCMs under different angles, 0°, 45°, 90° and 135°. ),( lkI and ),( nmI are two pixels in the two-dimension image I, then GLCMs under different angles can be described as follows [1]:
⎥⎥⎥
⎦
⎤
⎢⎢⎢
⎣
⎡
==
=−=−
∈
=
jnmIilkIdnlmk
InmlkdjiP
),(,),(,0
),(),,(#)0,,,( (13)
⎥⎥⎥⎥
⎦
⎤
⎢⎢⎢⎢
⎣
⎡
===−−=−
−=−=−∈
=
jnmIilkIdnldmkor
dnldmkInmlk
djiP
),(,),(),(
),(),(),,(
#)45,,,( (14)
⎥⎥⎥
⎦
⎤
⎢⎢⎢
⎣
⎡
==
=−=−
∈
=
jnmIilkInldmkInmlk
djiP),(,),(
0,),(),,(
#)90,,,( (15)
⎥⎥⎥⎥
⎦
⎤
⎢⎢⎢⎢
⎣
⎡
==−=−−=−
=−=−∈
=
jnmIilkIdnldmkor
dnldmkInmlk
djiP
),(,),(),(
),(),(),,(
#)135,,,( (16)
where, d is the distance between pixels, # is the quantity of collection elements, and i and j are the pixel values of ),( lkI and ),( nmI . Figure 5 is an 8×8 image example, the gray level values of which are 2,1,0=j . Figure 6 is the GLCM schematic diagram of this 8×8 image example. Supposing that
1=d , then GLCM in four directions can be calculated according to Eqs. (13), (14), (15) and (16), as shown in Figure 7.
Figure 8 is an image example with vertical texture. Figures 9(a), (b), (c) and (d) are the GLCMs at 0°, 45°, 90° and 135°, respectively, where a larger GLCM indicates higher brightness. As shown in Figure 9, the numerical value distribution is related to textural structure. The GLCM value of structures with fewer gray level interfaces tends to be distributed near the diagonal line, while that of structures with more gray level interfaces spreads from the diagonal line and distributes uniformly.
0 0 2 2 0 0 2 2
2 2 1 1 2 2 1 1
0 0 2 2 0 0 2 2
2 2 1 1 2 2 1 1
0 0 2 2 0 0 2 2
2 2 1 1 2 2 1 1
0 0 2 2 0 0 2 2
2 2 1 1 2 2 1 1 Fig. 5 An 8×8 image example.
Gray level 0 1 2
0 #(0,0) #(0,1) #(0,2)
1 #(1,0) #(1,1) #(1,2)
2 #(2,0) #(2,1) #(2,2)
Fig. 6 GLCM schematic diagram for an 8×8 image example.
16 0 12 0 10 140 16 12 10 0 14
12 12 32 14 14 22(a) 0° (b) 45°
0 0 28 0 8 140 0 28 8 0 14
28 28 0 14 14 20(c) 90° (d) 135°
Fig. 7 The co-occurrence matrices of an 8×8 image example.
Fig. 8 An image example with vertical textures
WSEAS TRANSACTIONS on COMPUTERS Chun-Cheng Lin, Cheng-Yu Yeh
ISSN: 1109-2750 1579 Issue 9, Volume 8, September 2009

(a) (b)
(c) (d)
Fig. 9 GLCMs of an image example with vertical textures at (a) 0°, (b) 45°, (c) 90° and (d) 135°. Since the image texture in Figure 8 presents a vertical trend, GLCM at 90° distributes significantly near the diagonal line, as shown in Figure 9(c). At the same time, GLCMs in the other directions distribute uniformly, as shown in Figures 9(a), (b), and (d).
Conventional textural features in GLCM texture analysis include contrast, angular second moment (ASM), homogeneity, entropy and correlation, which are defined as follows [2-5]: 1) Contrast
( ) ( )∑∑ −=i j
d jiPjiCON ,2 (17)
where Pd is the normalized GLCM, defined as follows:
( )P
jiPP
oi j
d
∑∑= =
= 255 255
0
,
1 (18)
Contrast is used to measure the sharp degree of the contrast and reflect the situation of co-occurrence matrices elements near the main diagonal line. When larger values center on the main diagonal line of co-occurrence matrices, the image contrast is smaller. Otherwise, when larger values centre at the
upper right or lower left corners, the contrast is larger. A smaller contrast indicates closer gray-level values among pixels, while a larger contrast indicates larger differences of gray-level values among pixels. 2) Angular second moment
( )[ ]∑∑=i j
d jiPASM 2, (19)
The ASM value is equal to the quadratic sum of all elements in GLCM and also the energy of GLCM. ASM is used to measure the consistency and uniformity of image gray level distribution, which means the repeated emergence probability of a certain pixel: higher probability indicates higher consistency. When an image has consistent texture, few values of normalized GLCM off the diagonal line are approximate to 1, while others are approximate to 0. Therefore, when the image texture is more consistent and uniform, GLCM values tend to centre on the few elements, thus making the ASM value larger. Otherwise, when GLCM values distribute more uniformly, the ASM value is smaller.
3) Homogeneity
( )∑∑ ≠−
=i j
d jijiPji
HOM ,,12 (20)
When larger values are concentrated around the main diagonal line, homogeneity would be larger. Opposite to contrast, homogeneity is used to analyze the homogeneous degree of the image: the more homogeneous the image (contrast less sharp), the larger the homogeneity. An image with a sharper contrast is detailed, while one with higher homogeneity is coarse. 4) Entropy
( ) ( )∑∑−=i j
dd jiPjiPEN ,log, (21)
Entropy is mainly used to measure textural complexity. When the texture of a textural image is unorderly, gray level values distribute uniformly, making the values of all elements in the co-occurrence matrix smaller. Therefore, larger entropy indicates higher textural complexity. Entropy is in inverse proportion to energy. The co-occurrence matrix values of an image with higher entropy distribute uniformly.
WSEAS TRANSACTIONS on COMPUTERS Chun-Cheng Lin, Cheng-Yu Yeh
ISSN: 1109-2750 1580 Issue 9, Volume 8, September 2009
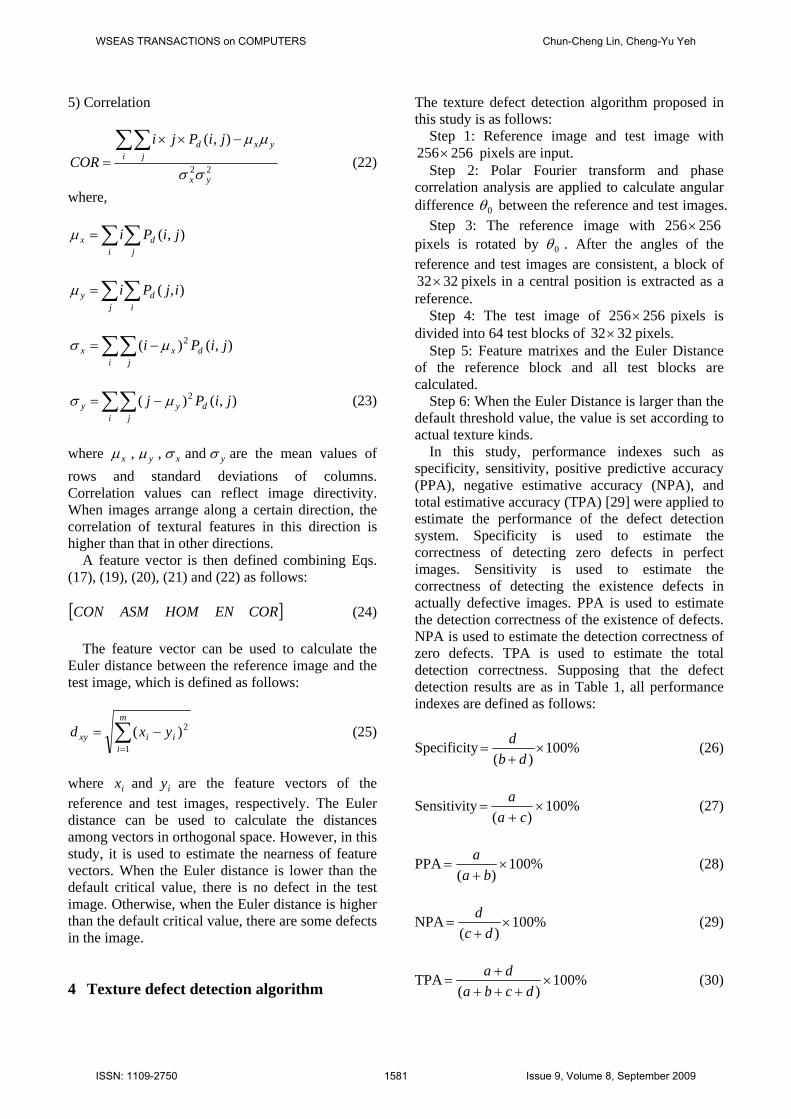
5) Correlation
22
),(
yx
i jyxd jiPji
CORσσ
μμ∑∑ −××
= (22)
where,
∑∑=j
di
x jiPi ),(μ
∑∑=i
dj
y ijPi ),(μ
∑∑ −=i j
dxx jiPi ),()( 2μσ
∑∑ −=i j
dyy jiPj ),()( 2μσ (23)
where xμ , yμ , xσ and yσ are the mean values of rows and standard deviations of columns. Correlation values can reflect image directivity. When images arrange along a certain direction, the correlation of textural features in this direction is higher than that in other directions.
A feature vector is then defined combining Eqs. (17), (19), (20), (21) and (22) as follows: [ ]CORENHOMASMCON (24)
The feature vector can be used to calculate the Euler distance between the reference image and the test image, which is defined as follows:
∑=
−=m
iiixy yxd
1
2)( (25)
where ix and iy are the feature vectors of the reference and test images, respectively. The Euler distance can be used to calculate the distances among vectors in orthogonal space. However, in this study, it is used to estimate the nearness of feature vectors. When the Euler distance is lower than the default critical value, there is no defect in the test image. Otherwise, when the Euler distance is higher than the default critical value, there are some defects in the image. 4 Texture defect detection algorithm
The texture defect detection algorithm proposed in this study is as follows:
Step 1: Reference image and test image with 256256× pixels are input.
Step 2: Polar Fourier transform and phase correlation analysis are applied to calculate angular difference 0θ between the reference and test images.
Step 3: The reference image with 256256× pixels is rotated by 0θ . After the angles of the reference and test images are consistent, a block of
3232× pixels in a central position is extracted as a reference.
Step 4: The test image of 256256× pixels is divided into 64 test blocks of 3232× pixels.
Step 5: Feature matrixes and the Euler Distance of the reference block and all test blocks are calculated.
Step 6: When the Euler Distance is larger than the default threshold value, the value is set according to actual texture kinds.
In this study, performance indexes such as specificity, sensitivity, positive predictive accuracy (PPA), negative estimative accuracy (NPA), and total estimative accuracy (TPA) [29] were applied to estimate the performance of the defect detection system. Specificity is used to estimate the correctness of detecting zero defects in perfect images. Sensitivity is used to estimate the correctness of detecting the existence defects in actually defective images. PPA is used to estimate the detection correctness of the existence of defects. NPA is used to estimate the detection correctness of zero defects. TPA is used to estimate the total detection correctness. Supposing that the defect detection results are as in Table 1, all performance indexes are defined as follows:
Specificity %100)(×
+=
dbd (26)
Sensitivity %100)(×
+=
caa (27)
PPA %100)(×
+=
baa (28)
NPA %100)(×
+=
dcd (29)
TPA %100)(×
++++
=dcba
da (30)
WSEAS TRANSACTIONS on COMPUTERS Chun-Cheng Lin, Cheng-Yu Yeh
ISSN: 1109-2750 1581 Issue 9, Volume 8, September 2009

5 Experiment results In this study, four kinds of test images with bifilar defects, panel defects, greasy defects and scratch defects under different deflection angles were applied to evaluate the performance of the texture defect detection system. As seen from Figure 10, when there is no deflection in the test image, applying GLCM-based texture analysis only can detect the defective blocks correctly. However, given any deflection in the test image angle, the detection correctness of applying GLCM-based texture analysis only decreases greatly. Figures 11, 12, 13 and 14 show the defect detection results of GLCM-based texture analysis without and with image deflection compensation when the defective test images deflect different angles. Because the differences between the perfect and defective blocks for greasy and scratch defects are less conspicuous than those for bifilar and panel defects, the Euler distances and the threshold value of identifying defective blocks for greasy and scratch defects are also lower than those for bifilar and panel defects. The threshold values for identifying bifilar, panel, greasy and scratch defects are 300, 300, 15 and 25, respectively. The smaller Euler distances also cause more misjudgments in the detection of greasy and scratch defects when the input test image deflects, if only applying GLCM-based texture analysis without image deflection compensation. Moreover, the larger the deflection angle, the lower the accuracy of the defect detection. After adding phase correlation analysis and compensating for the deflection angle of the test image, the detection accuracy of the defective blocks can revert to that when the test image has no angular deflection.
This study further analyzed the performance indexes of the texture defect detection system for different deflection angles and test images with various defects. Tables 2, 3, 4 and 5 list the performance indexes for bifilar defects, panel defects, greasy defects and scratch defects, respectively, using GLCM-based texture analysis without and with image deflection compensation under different deflection angles of the input test image. The quantity of actual perfect and defective blocks is dependent on the deflected test image. The results demonstrated that image deflection compensation can increase TPA by 11% (97%-86%), 1% (100%-99%), 52% (97%-45%) and 37% (98%-61%) in the detection of bifilar defects, panel defects, greasy defects and scratch defects, respectively. As seen, the deflection of the test image has the smallest effect on the textural features of the test image with panel defects, and the largest effect on the test image with greasy defects.
Table 1 Distribution of defect detection results
Actual
defective blocks
Actual perfect blocks
Total
Detected defective
blocks a b a+b
Detected perfect blocks
c d c+d
Total a+c b+d
(a) (b)
(c) (d)
Fig. 10 Defect detection results of GLCM texture analysis when there is no deflection in the test image (a) bifilar defects (b) panel defects, (c) greasy defects and (d) scratch defects.
Tables 2, 3, 4 and 5 also indicate the actual
deflection angles of the test image and the estimated deflection angles by polar Fourier transform and phase correlation analysis. The estimation error of the deflection angle is only from 0° to 0.5°. Hence the deflection angle of the test image can be compensated for quite correctly.
WSEAS TRANSACTIONS on COMPUTERS Chun-Cheng Lin, Cheng-Yu Yeh
ISSN: 1109-2750 1582 Issue 9, Volume 8, September 2009

(a) (b)
(c) (d)
Fig. 11 Bifilar defects detection results when the input test image deflects 45° ((a) and (b)) and 150° ((c) and (d)) using GLCM-based texture analysis without ((a) and (c)) and with ((b) and (d)) image deflection compensations.
(a) (b)
(c) (d)
Fig. 12 Panel defects detection results when the input test image deflects 45° ((a) and (b)) and 150° ((c) and (d)) using GLCM-based texture analysis without ((a) and (c)) and with ((b) and (d)) image deflection compensations.
(a) (b)
(c) (d)
Fig. 13 Greasy defects detection results when the input test image deflects 45° ((a) and (b)) and 150° ((c) and (d)) using GLCM-based texture analysis without ((a) and (c)) and with ((b) and (d)) image deflection compensations.
(a) (b)
(c) (d)
Fig. 14 Scratch defects detection results when the input test image deflects 45° ((a) and (b)) and 150° ((c) and (d)) using GLCM-based texture analysis without ((a) and (c)) and with ((b) and (d)) image deflection compensations.
WSEAS TRANSACTIONS on COMPUTERS Chun-Cheng Lin, Cheng-Yu Yeh
ISSN: 1109-2750 1583 Issue 9, Volume 8, September 2009

Table 2 Performance indexes for the detection of bifilar defects.
GLCM
GLCM +
Image Deflection Compensation
Specificity (%) 84 98
Sensitivity (%) 95 93
PPA (%) 55 91
NPA (%) 99 99
TPA (%) 86 97
Actual deflection angles are 30°, 45°, 60° and 150°, while estimated deflection angles are 29.5°, 45°, 60.5° and 150.5°. The threshold value is 300.
Table 3 Performance indexes for the detection of panel defects.
GLCM
GLCM +
Image Deflection Compensation
Specificity (%) 100 100
Sensitivity (%) 63 100
PPA (%) 100 100
NPA (%) 99 100
TPA (%) 99 100
Actual deflection angles are 9°, 14°, 22° and 33°, while estimated deflection angles are 8.5°, 14.1°, 22.5° and 32.5°. The threshold value is 300.
6 Conclusions This study estimated angular differences between the reference and test images using polar Fourier transform and phase correlation analysis, and rotated the reference image by the same angle to compensate for the deflection of the test image.
Table 4 Performance indexes for the detection of greasy defects.
GLCM
GLCM +
Image Deflection Compensation
Specificity (%) 41 98
Sensitivity (%) 88 92
PPA (%) 13 81
NPA (%) 97 99
TPA (%) 45 97
Actual deflection angles are 11°, 19°, 29° and 36°, while estimated deflection angles are 11.3°, 19.5°, 29.5° and 36.4°. The threshold value is 15.
Table 5 Performance indexes for the detection of scratch defects.
GLCM
GLCM +
Image Deflection Compensation
Specificity (%) 57 97
Sensitivity (%) 100 100
PPA (%) 17 77
NPA (%) 100 100
TPA (%) 61 98
Actual deflection angles are 5°, 11°, 27° and 38°, while estimated deflection angles are 5.4°, 11.2°, 26.7° and 37.9°. The threshold value is 25.
The estimation error of the image deflection angle was only from 0° to 0.5°. Hence the estimated deflection angle can be further applied to compensate for deflection effects. The experimental results of the texture defect detection showed that, when there is some deflection in the test image, the
WSEAS TRANSACTIONS on COMPUTERS Chun-Cheng Lin, Cheng-Yu Yeh
ISSN: 1109-2750 1584 Issue 9, Volume 8, September 2009
defect detection accuracy of using GLCM-based texture analysis only decreases greatly, while that of compensating for the angular deflection of the test image can be effectively enhanced. In conclusion, the texture defect detection system with image deflection compensation proposed in this study can effectively solve the problem of test image deflection and enhance the performance of the texture defect detection system.
7 Acknowledgement This research was financially supported by the National Science Council under Grant No. 97-2320-B-167-001. References: [1] R.M. Haralick, K. Shanmugan, I.H. Dinstein,
Textural features for image classification, IEEE Transaction on Systems, Man, and Cybernetics, Vol.SMC-3, 1973, pp.610-621.
[2] L.K. Soh, C. Tsatsoulis, Texture Analysis of SAR Sea Ice Imagery Using Gray Level Co-Occurrence Matrices, IEEE Transactions on Geoscience and Remote Sensing, Vol.37, 1999, pp.780-795.
[3] D. Mery, M.A. Berti, Automatic Detection of Welding Defects Using Texture Features, Insight, Vol.45, 2003, pp.676-681.
[4] U. Kandaswamy , D.A. Adjeroh, M.C. Lee, Efficient Texture Analysis of SAR Imagery, IEEE Transactions on Geoscience and Remote Sensing, Vol.43, 2005,pp.2075-2083.
[5] C.E. Honeycutt, R. Plotnick, Image analysis techniques and gray-level co-occurrence matrices (GLCM) for calculating bioturbation indices and characterizing biogenic sedimentary structures, Computers and Geosciences, Vol.34, 2008, pp.1461-1472.
[6] C. Sun, W.G. Wee, Neighboring Gray Level Dependence Matrix for Texture Classification, Computer Vision, Graphics and Image Processing, Vol.23, 1982, pp.235-245.
[7] L.H. Siew, R.M. Hodgson, E.J. Wood, Texture Measures for Carpet Wear Assessment, IEEE Transaction on Pattern Analysis and Machine Intelligence, Vol.10, 1988, pp.92-105.
[8] A. Murali, W.V. Stoecker, R.H. Moss, Detection of Solid Pigment in Dermatoscopy Images Using Texture Analysis, Skin Research and Technology, Vol.6, 2000, pp.193-198.
[9] C.I. Christodoulou, S.C. Michaelides, C.S. Pattichis, Multifeature Texture Analysis for the Classification of Clouds in Satellite Imagery,
IEEE Transactions on Geoscience and Remote Sensing, Vol.41, 2003, pp.2662-2668.
[10] C.D. Ruberto, G. Rodriguez, S. Vitulano, Image Segmentation by Texture Analysis, Proceedings of International Conference on Image Analysis and Processing, 1999, pp.376-381.
[11] C.H. Chen, G.K.H. Pang, Fabric Defect Detection by Fourier Analysis, IEEE Transactions on Industry Application, Vol.36, 2000, pp.1267-2000.
[12] Z. Peng, T.B. Kirk, Two-dimensional Fast Fourier Transform and Power Spectrum for Wear Particle Analysis, Tribology International, Vol.30,1997, pp.583-590.
[13] D. Zhang, G. Lu, Study and Evaluation of Different Fourier Methods for Image Retrieval, Image and Vision Computing, Vol.23, 2005, pp.33-49.
[14] D.M. Tsai , C.Y. Hsieh, Automated Surface Inspection for Directional Textures, Image and Vision Computing, Vol.18, 1999, pp.49-62.
[15] D.M. Tsai, T.Y. Huang, Automated Surface Inspection for Statistical Textures, Image and Vision Computing, Vol.21, 2003, pp.307-323.
[16] T. Caelli, B. Julesz, Psychophysical Evidence for Global Feature Processing in Visual Texture Discrimination, Journal of the Optical Society of America, Vol.69, 1979, pp.675-678.
[17] W.H. Chang, N.C. Yang, C.M. Kuo, Y.J. Chen, A Novel Temporal Texture Descriptor Using Spatial-Temporal Local Distribution for Video Retrieving, WSEAS Transactions on Information Science and Applications, Vol. 3, 2006, pp.2079-2085.
[18] S. Zimeras, Simulating texture patterns using auto-logistic models, WSEAS Transactions on Systems, Vol. 5, 2006, pp.2269-2276.
[19] S.A. Monadjemi, P. Moallem, A fast multi-scale/multi-directional texture feature extraction scheme, WSEAS Transactions on Computers, Vol. 5, 2006, pp.2106-2113.
[20] T. Baidyk, E. Kussul, O. Makeyev, Texture recognition with random subspace neural classifier, WSEAS Transactions on Circuits and Systems, Vol. 4, 2005, pp.319-324.
[21] H.Y.T. Ngan, G.K.H. Pang, S.P. Yung, M.K. Ng, Wavelet based methods on patterned fabric defect detection, Pattern Recognition, Vol.38, 2005, pp.559-576.
[22] A. Kumar, G.K.H. Pang, Defect Detection in Textured Materials Using Optimized Filters, IEEE Transaction on Systems, Man, and Cybernetics, Vol.32, 2002, pp.553-570.
WSEAS TRANSACTIONS on COMPUTERS Chun-Cheng Lin, Cheng-Yu Yeh
ISSN: 1109-2750 1585 Issue 9, Volume 8, September 2009

[23] A. Kumar, G.K.H. Pang, Defect Detection in Textured Materials Using Gabor Filters, IEEE Transactions on Industry Applications, Vol.38, 2002, pp.425-440.
[24] B.S. Reddy , B.N. Chatterji, An FFT-Based Technique for Translation , Rotation , and Scale-Invariant Image Registration, IEEE Transactions on Image Processing, Vol.5, 1991, pp.1266-1271.
[25] A. Averbuch, Y. Keller, FFT Based Image Registration”, Proceedings of IEEE International Conference on Acoustics, Speech and Signal Processing, Vol.4, 2002, pp.IV/3608-IV/3611.
[26] Y. Keller, A. Averbuch, M. Israeli, Pseudopolar-Based Estimation of Large Translations , Rotations , and Scalings in
Images, IEEE Transactions on Image Processing, Vol.14, 2005, pp.12-22.
[27] Y. Keller , Y. Shkolnisky, A. Averbuch, The Angular Difference Function and Its Application to Image Registration, IEEE Transactions on Pattern Analysis and Machine Intelligence, Vol.27, 2005, pp.969-976.
[28] C.D. Kuglin, D.C. Hines, The phase correlation image alignment method, Proceedings of IEEE International Conference on Cybernetics and Society, 1975pp.163-165.
[29] P.F. Griner, R.J. Mayewski, A.I. Mushlin, P. Greenland, Selection and interpretation of diagnostic tests and procedures. Principles and applications, Annals of internal medicine, Vol.94, 1981, pp.557–592.
WSEAS TRANSACTIONS on COMPUTERS Chun-Cheng Lin, Cheng-Yu Yeh
ISSN: 1109-2750 1586 Issue 9, Volume 8, September 2009