tga decomposition kinetics - greenenergy.fcu.edu.t · tga decomposition kinetics 78 decomposition...
TRANSCRIPT
TGA
Decomposition Kinetics
78
Decomposition Kinetics Background
Includes isothermal and constant heating rate methods.
Constant heating rate method is the fastest and will be discussed here.
Based on method of Flynn and Wall – Polymer Letters, 19, 323, (1966).
Requires collection of multiple curves at multiple heating rates.
Ultimate benefit obtained in ‘Life-Time’ plots.
89

79
TA Specialty Library -- TGA Kinetics
Requires at least 3 TGA runs at different heating rates or 1 Modulated
TGA® run
Calculates Activation energy & conversion curves
Ultimate benefit is predictive curves “Lifetime Plots”
80
Kinetic Analysis
The rate at which a kinetic process proceeds depends not only
on the temperature the specimen is at, but also the time it has
spent at that temperature.
Typically kinetic analysis is concerned with obtaining
parameters such as activation energy (Ea), reaction order (k),
etc. and/or with generating predictive curves.
90

81
Kinetic Analysis, con’t.
Activation energy (Ea) can be defined as the minimum
amount of energy needed to initiate a chemical process.
State 1
State 2
Ea
With Modulated TGA, Ea can be
measured directly.
82
TGA Kinetics - Wire Insulation Thermal Stability
℃
℃
℃ ℃
℃
91

83
TGA Kinetics - Heating Rate vs. Temperature
1.4 1.5 1.6
1
2
5
10
1000/T (K)
Ln (
HE
AT
RA
TE
) (°
C/m
in)
460 440 420 400 380 360
20 10 5
2.5 1.0 0.5
Conversion
Activation Energy (Ea) Slope
84
TGA Kinetics - Estimated Lifetime
TEMPERATURE (°C)
1.5 1.6 1.7 1.8 1.9 10
100
1000
10000
100000
1000000
1000/T (K)
ES
TIM
AT
ED
LIF
E (
hr.
)
260 280 300 320 340 360
1 century
1 decade
1 yr.
1 mo.
1 week
1 day
ES
TIM
AT
ED
LIF
E
92
Thermogravimetry Under Extreme
High Heating Rate Conditions
What Constitutes Extreme Conditions?
High Heating Rates
Kinetic Studies
Sample Throughput
93

Rapid Heating Thermal Analysis
Gasification, combustion, and volatilization are complex
processes.
Thermal treatments by different heating rates and
time/temperature relationships can result is different
chemical decomposition products.
As an example, heating at a high rate can result in the
thermal degradation of component that would otherwise
volatilize at a slow heating rate.
Rapid heating rates, as on the TA Instruments Discovery
TGA and pyrolysis GC/MS, provide powerful techniques
to investigate the time/temperature relationships
Discovery TGA & Q5000 IR Innovative IR-Heating Furnace
94

DTGA Ballistic Heating Performance
0
500
1000
1500
2000
[
] D
eriv
. Tem
pera
ture
(°C
/min
) –
– –
–
0
200
400
600
800
Tem
pera
ture
(°C
)
0 2 4 6 8
Time (min)
Run #1Run #2Run #3Run #4
Equilibrate method
segment is very
repeatable and achieves
rates approaching
2000°C/min in this
application
DTGA Heating Rate Comparison-
Temperature
20°C/min
500°C/min
95
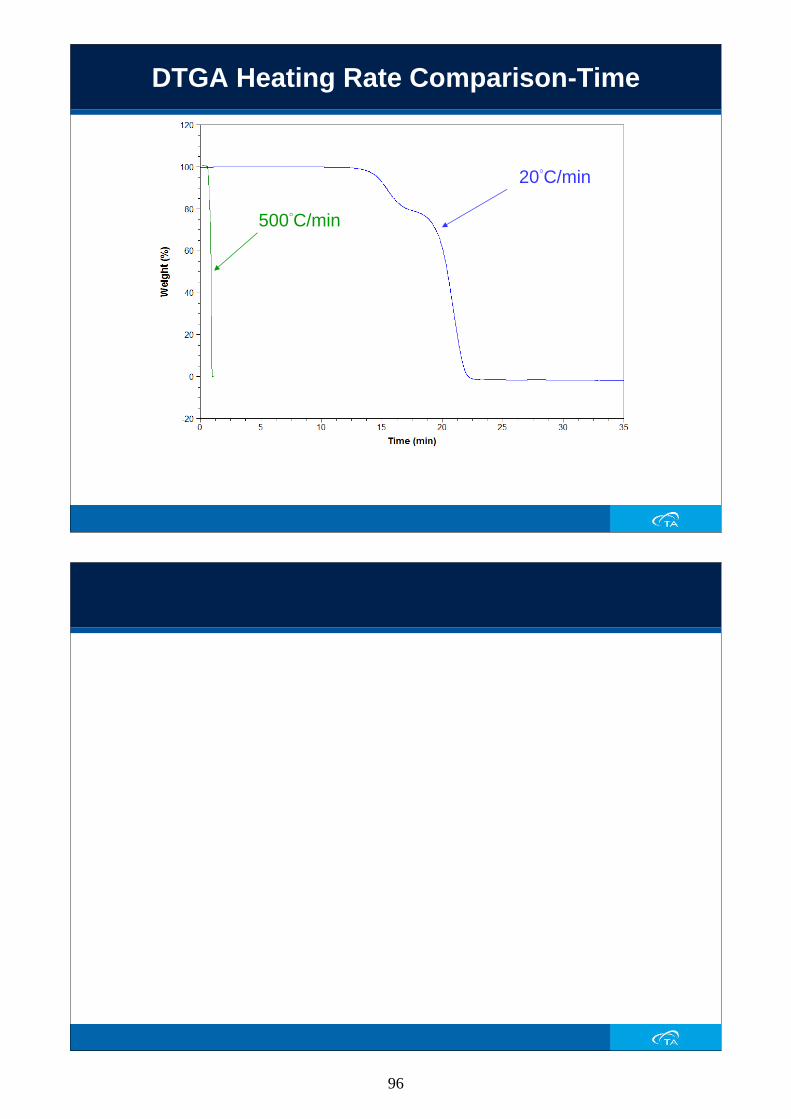
DTGA Heating Rate Comparison-Time
20°C/min
500°C/min
High Heating Rate TGA: Kinetic
Studies
96
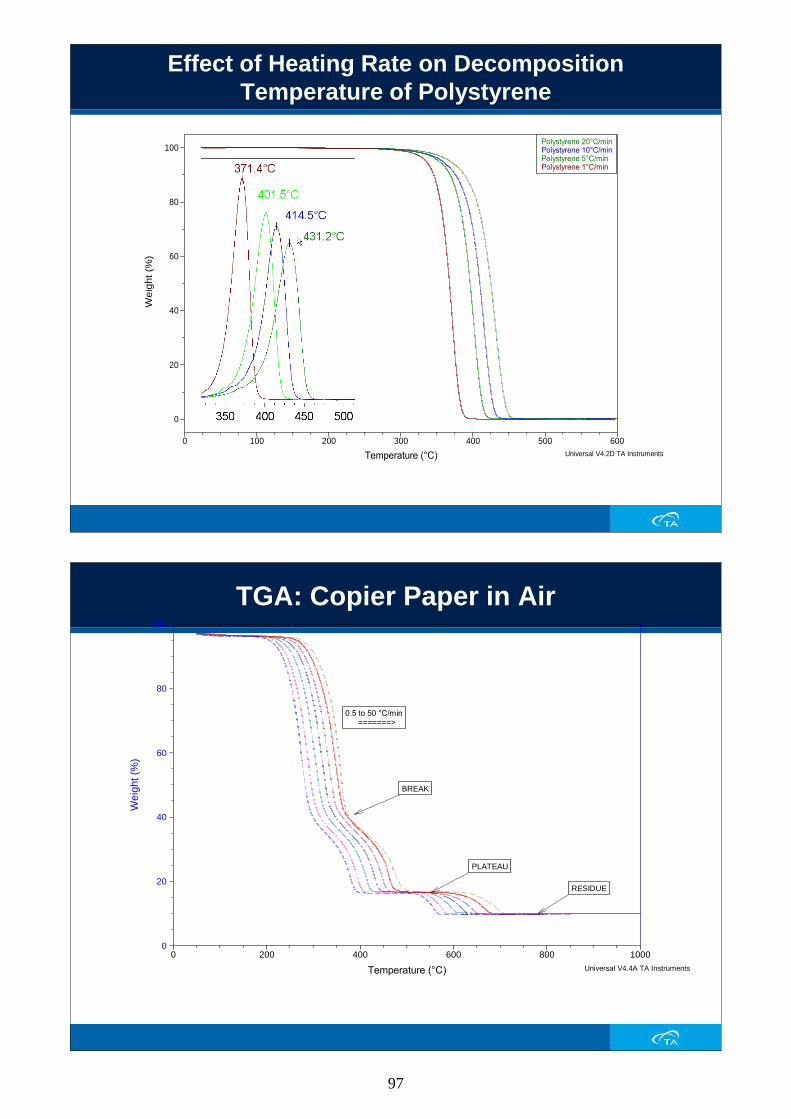
Effect of Heating Rate on Decomposition
Temperature of Polystyrene
0
20
40
60
80
100W
eig
ht (%
)
0 100 200 300 400 500 600
Temperature (°C)
Polystyrene 20°C/minPolystyrene 10°C/minPolystyrene 5°C/minPolystyrene 1°C/min
Universal V4.2D TA Instruments
TGA: Copier Paper in Air
0.5 to 50 °C/min =======>
BREAK
PLATEAU
RESIDUE
0
20
40
60
80
100
Weig
ht (%
)
0 200 400 600 800 1000
Temperature (°C) Universal V4.4A TA Instruments
97

TGA: Quantitation of Copier Paper
HEATING BREAK PLATEAU RESIDUE
RATE weight % weight % weight %
__°C/min__ __________ __________ __________
0.5 40.63 16.32 9.87
1 41.09 16.64 9.85
2.3 41.27 16.70 -
5 41.55 16.66 9.79
10 41.82 16.57 9.74
23 41.40 16.63 9.90
50 40.35 16.70 9.88
100 37.67 17.06 10.08
230 33.53 16.68 9.83
500 31.46 - 9.77
- - - -
Equilibrate 25.06 - 9.66
> 2300 °C/min
Average 41.29 16.66 9.84
STD DEV 0.41 0.19 0.11
TGA: Semi-Log Plot of Copier Paper
0.5 °C/min
5.0 °C/min
50 °C/min
500 °C/min
Equilibrate>2000 °C/min
6 Seconds 10 Minutes 16.7 Hours
0
20
40
60
80
100
Weig
ht (%
)
0
20
40
60
80
100
Weig
ht (%
)
0.01 0.1 1 10 100 1000 10000
Time (min) Universal V4.4A TA Instruments
*
* No data at 1000 °C/min
98
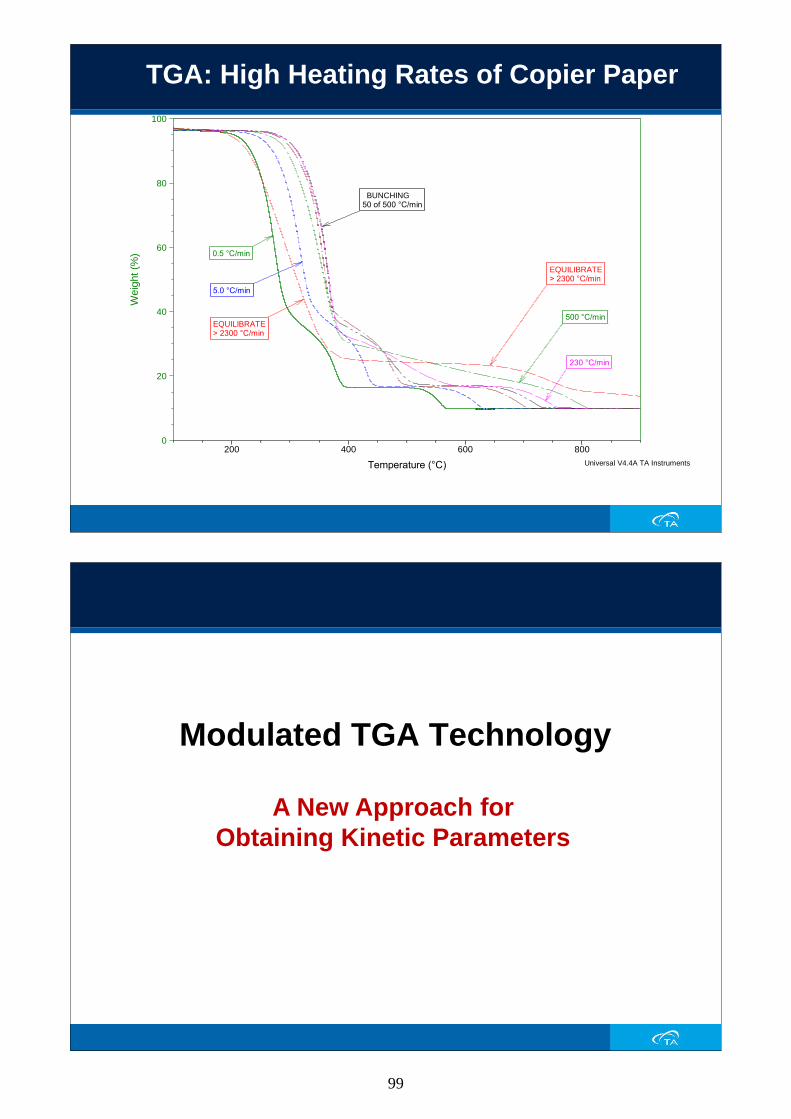
TGA: High Heating Rates of Copier Paper
EQUILIBRATE> 2300 °C/min
EQUILIBRATE> 2300 °C/min
500 °C/min
230 °C/min
BUNCHING 50 of 500 °C/min
0.5 °C/min
5.0 °C/min
0
20
40
60
80
100
Weig
ht (%
)
200 400 600 800
Temperature (°C) Universal V4.4A TA Instruments
Modulated TGA Technology
A New Approach for
Obtaining Kinetic Parameters
99

Temperature Change in MDSC and MTGA
MTGA OF 60% EVA WITH LINEAR RAMP
150 200 250 300 350 400 450 500
-20
0
20
40
60
80
100
120
-0.5
0.0
0.5
1.0
1.5
2.0
2.5
Temperature (℃)
We
igh
t (%
)
[---
----
----
-] D
eri
v. M
od
ula
ted
We
igh
t (%
/min
) TGA Modulated
100
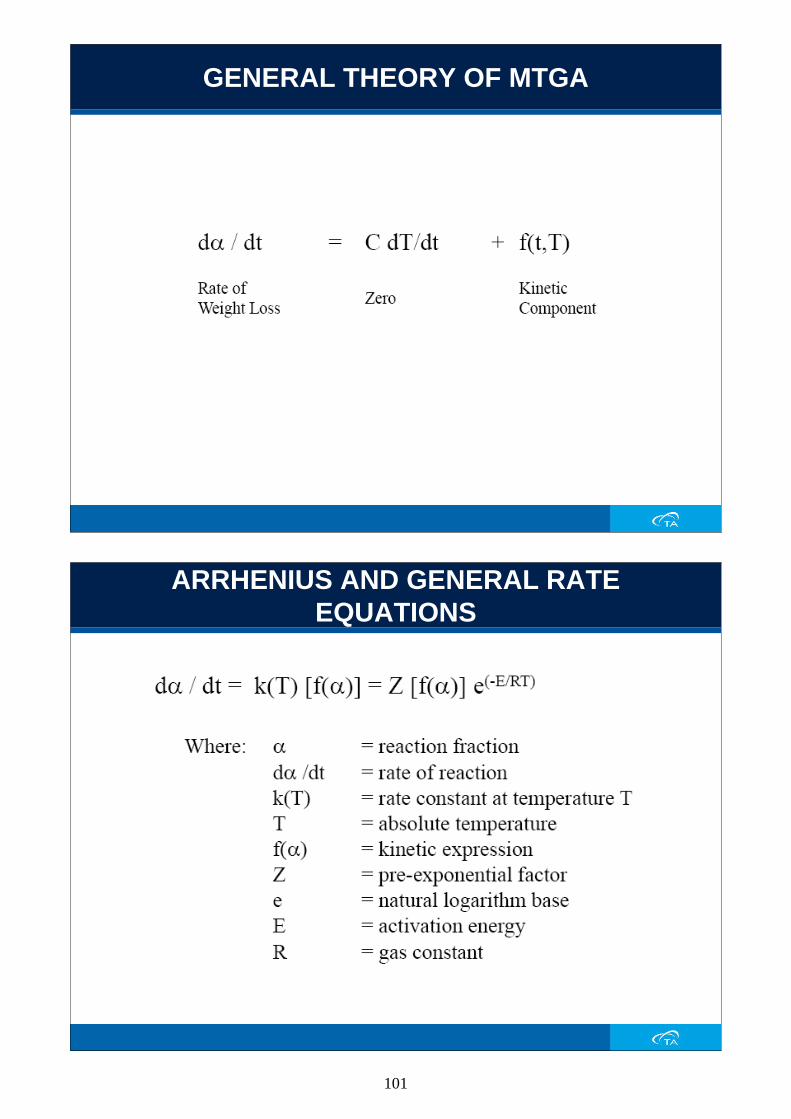
GENERAL THEORY OF MTGA
ARRHENIUS AND GENERAL RATE
EQUATIONS
101

KINETIC EXPRESSION RATIO
FACTOR JUMP EQUATION AT
CONSTANT CONVERSION
102
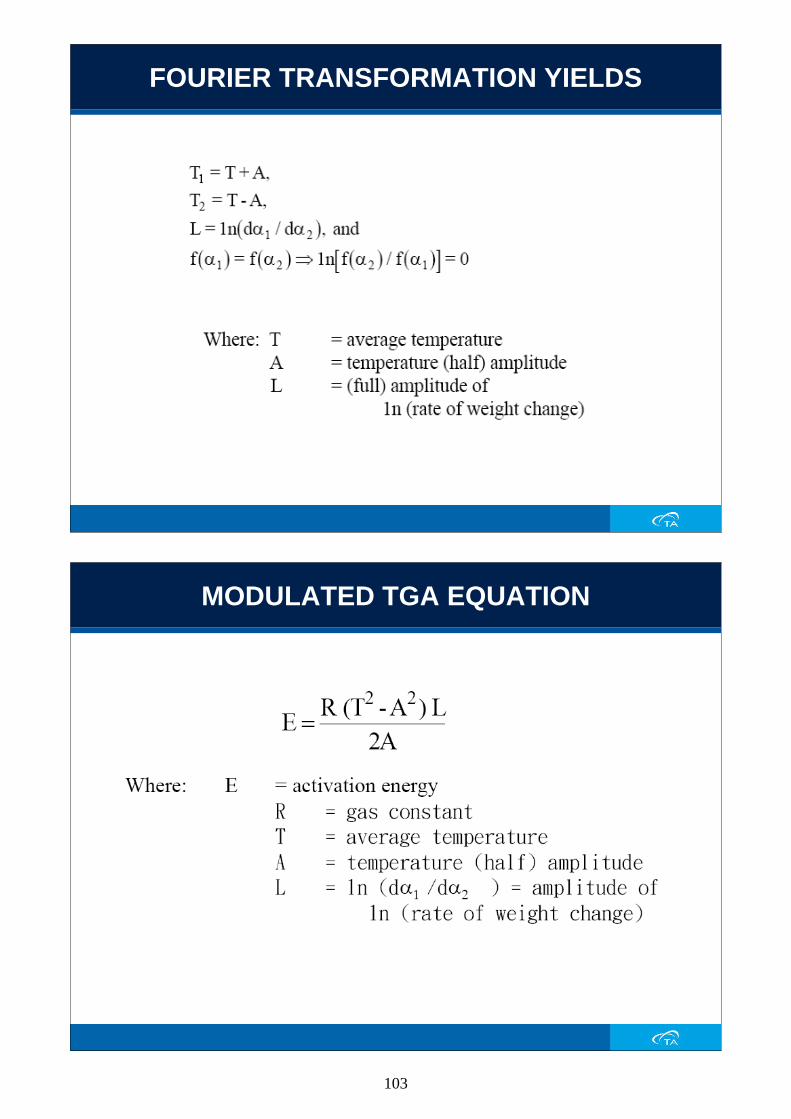
FOURIER TRANSFORMATION YIELDS
MODULATED TGA EQUATION
103
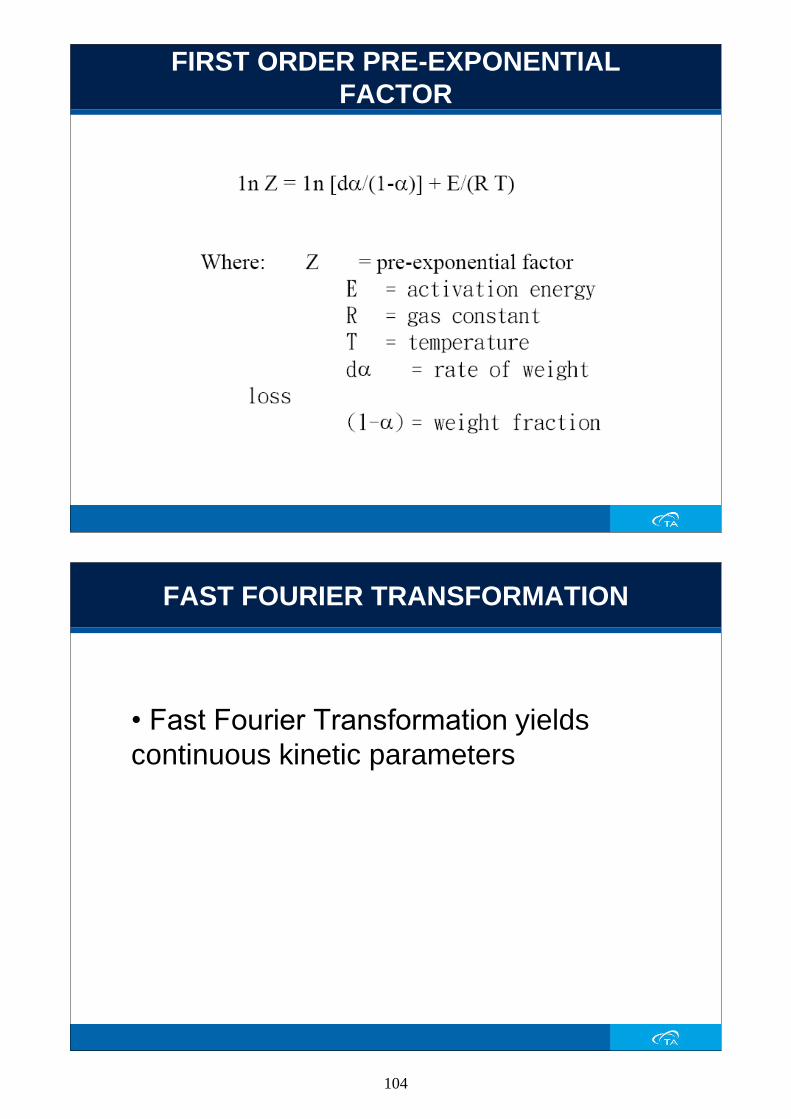
FIRST ORDER PRE-EXPONENTIAL
FACTOR
FAST FOURIER TRANSFORMATION
• Fast Fourier Transformation yields
continuous kinetic parameters
104
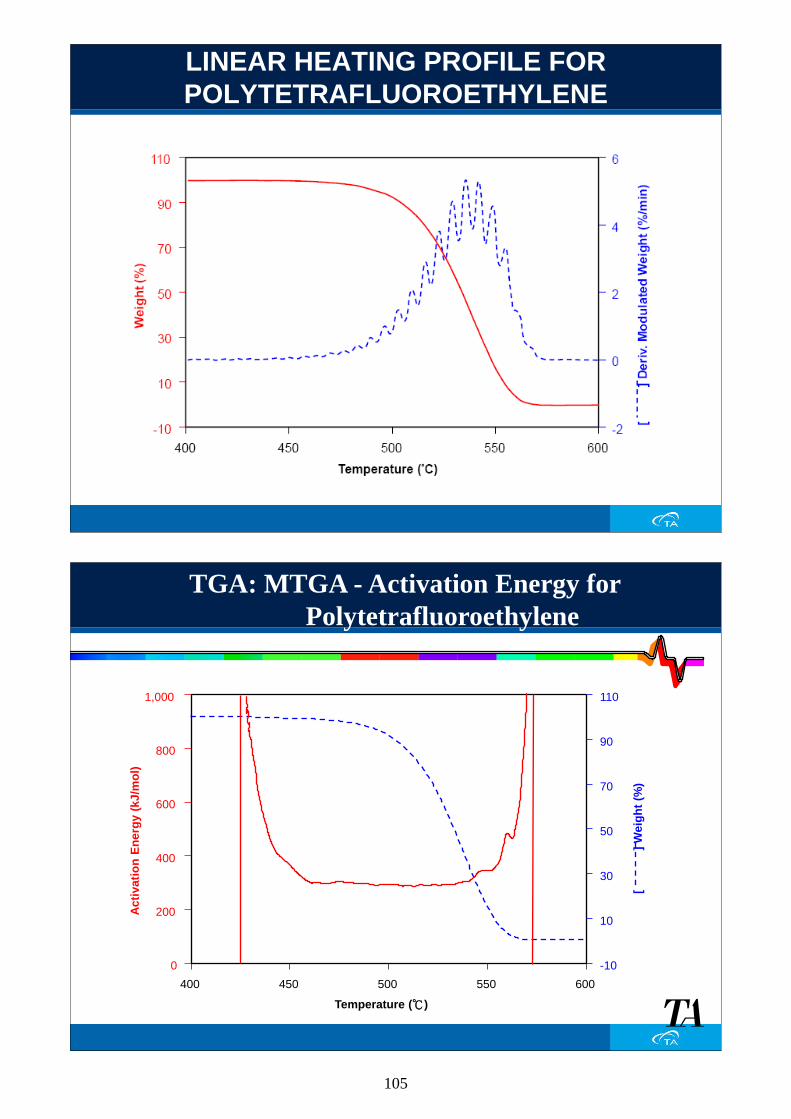
LINEAR HEATING PROFILE FOR
POLYTETRAFLUOROETHYLENE
TGA: MTGA - Activation Energy for
Polytetrafluoroethylene
400 450 500 550 600
0
200
400
600
800
1,000
-10
10
30
50
70
90
110
Temperature (℃)
Ac
tiva
tio
n E
ne
rgy (
kJ
/mo
l)
[
] W
eig
ht
(%)
105

EVA(60%Vac)的分解活化能溫度歷程圖
EFFECT OF CONVERSION ON
ACTIVATION ENERGY
106
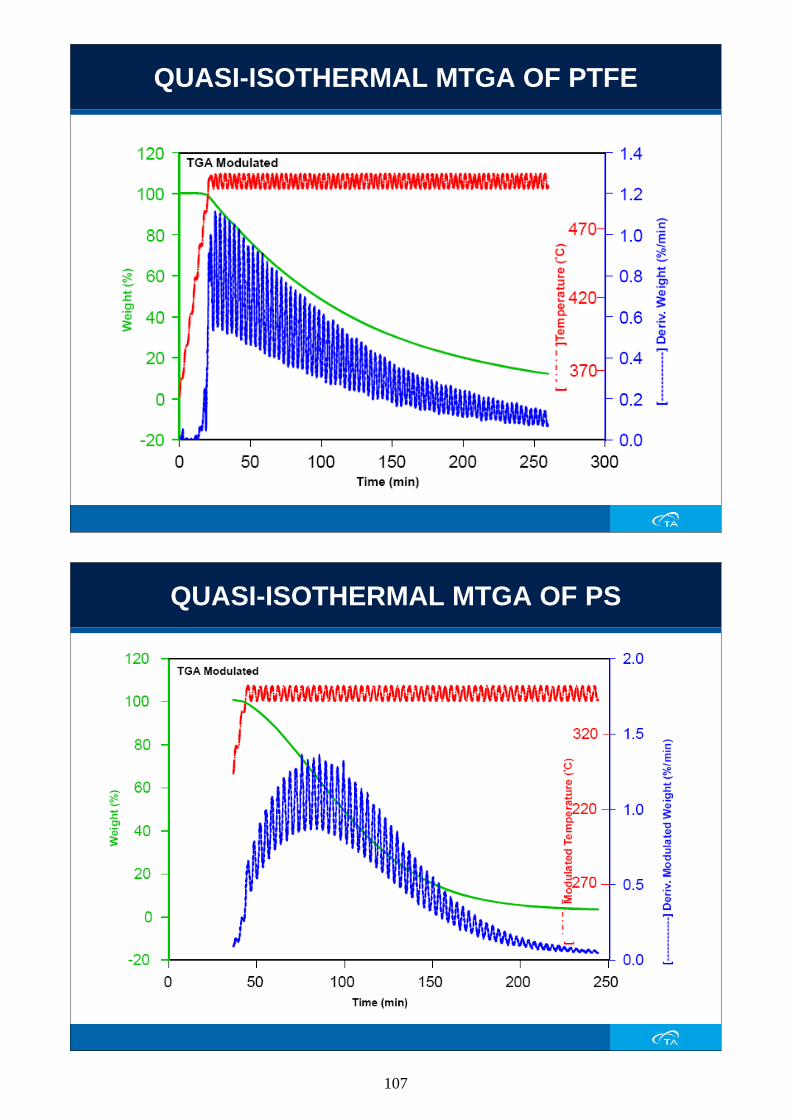
QUASI-ISOTHERMAL MTGA OF PTFE
QUASI-ISOTHERMAL MTGA OF PS
107

MTGA OF 60% EVA WITH DYNAMIC
HEATING RATE
MTGA REPEATABILITY
POLY (60% ETHYLENE VINYL ACETATE)
108

MTGA KINETICS COMPARISON
MTGA EXPERIMENTAL CONDITIONS
• Period : > 200 seconds
(temperature range dependent)
• Amplitude : 4 - 5 ° C
• Cycles Across Transition : > 5
Temperature Program
• Isothermal or
• Heating Rate : < 2 ° C/min
109
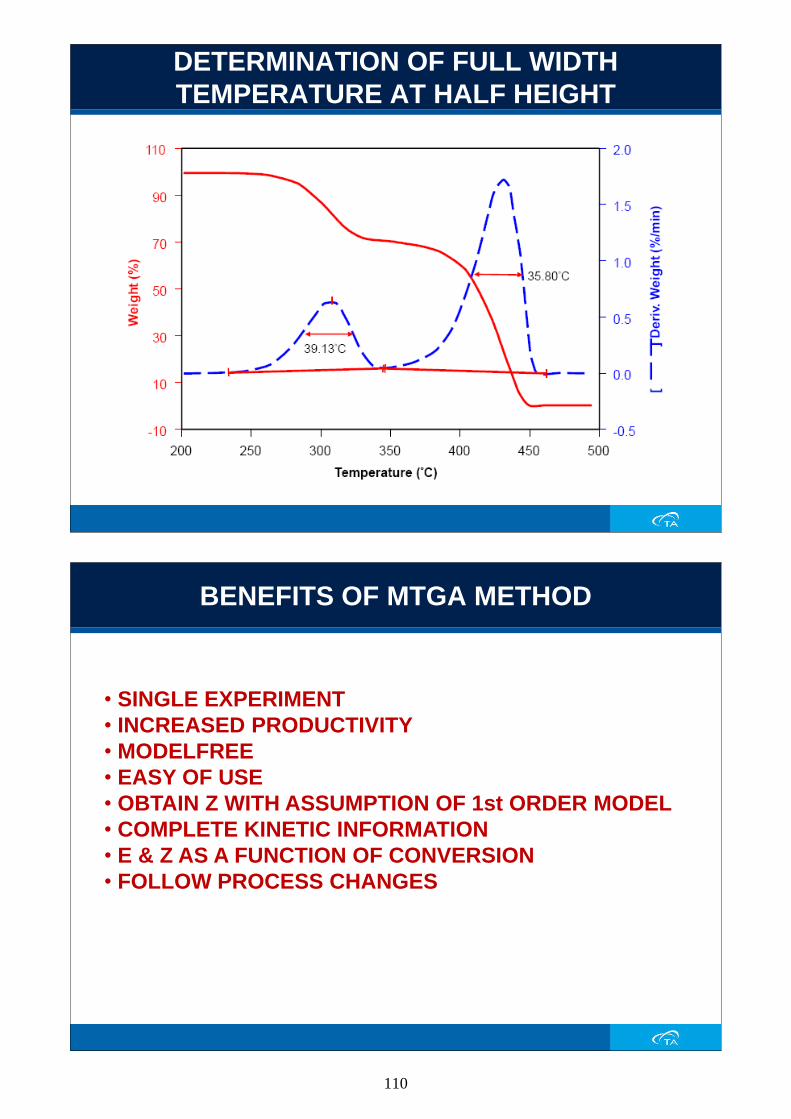
DETERMINATION OF FULL WIDTH
TEMPERATURE AT HALF HEIGHT
BENEFITS OF MTGA METHOD
• SINGLE EXPERIMENT
• INCREASED PRODUCTIVITY
• MODELFREE
• EASY OF USE
• OBTAIN Z WITH ASSUMPTION OF 1st ORDER MODEL
• COMPLETE KINETIC INFORMATION
• E & Z AS A FUNCTION OF CONVERSION
• FOLLOW PROCESS CHANGES
110
Evolved Gas Analysis
122
Why Use Evolved Gas Analysis?
• TGA measures weight changes (quantitative)
• Difficult to separate, identify, and quantify individual
degradation products (off-gases)
• Direct coupling to identification techniques (Mass Spec,
FTIR) reduces this problem
111

123
TGA-EGA: Typical Applications
• Polymers (composition, hazard evaluation,
identification)
• Natural Products (contamination in soil, raw material
selection {coal, clays})
• Catalysts (product/by-product analysis, conversion
efficiency)
• Inorganics (reaction elucidation, stoichiometry,
pyrotechnics)
• Pharmaceuticals (stability, residual solvent, formulation)
124
Q50/Q500 EGA Furnace Schematic
Quartz Liner
Off-Gases
Balance Purge
Sample
Thermocouple
Sample
Pan
Furnace Core
Purge Gas In
Low internal Volume
~15ml
112
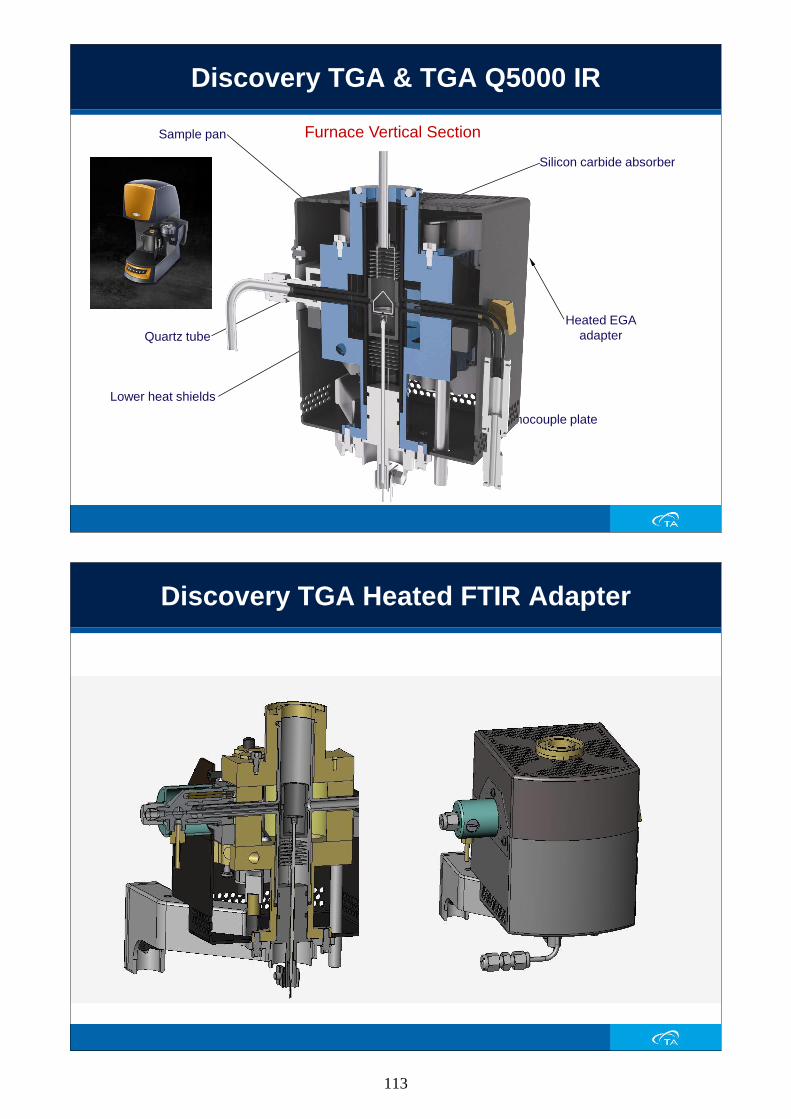
Discovery TGA & TGA Q5000 IR
Sample pan
Silicon carbide absorber
Thermocouple plate
Lower heat shields
Heated EGA
adapter Quartz tube
Furnace Vertical Section
Discovery TGA Heated FTIR Adapter
113

127
Mass-Spectrometry Benefits
• Additional information for the interpretation of the
reactions in the TGA results
• Sensitive method for the analysis of gaseous
reaction products
• Exact control of the furnace atmosphere before
starting and during the experiment
• Location of air leaks around the furnace
128
TGA-Mass Spectroscopy
Advantages:
Higher sensitivity and wider dynamic range than FTIR
(1ppm vs. 10ppm).
Measures non-IR absorbing gases.
More rapid response.
Disadvantage:
Cannot distinguish between isomers. (e.g. N2 and CO)
114

129
TGA-MS: System Schematic
130
TGA - FTIR
FTIR (Fourier transformation infrared spectroscopy):
Advantages:
On-line measurement
Hydrocarbons are easy to identify
Disadvantages:
No detection of inert gases (no dipole moment)
Detection of inorganic gases limited
115

TGA-FTIR: System Schematic
TA Instruments Universal Analysis software supports the importation of
MS (trend analysis) and FTIR data (Gram-Schmidt and Chemigram
reconstructions), allowing TGA and EGA data to be displayed on a
common axis of temperature and/or time.
MS & FTIR Attached to Interface
116

133
TGA of Calcium Oxalate
-2
0
2
4
6
8
10
De
riv.
We
ight
(%/m
in)
20
40
60
80
100
120
We
igh
t (%
)
0 200 400 600 800 1000
Temperature (°C)
Sample: Calcium Oxalate MonohydrateSize: 17.6070 mgMethod: RT-->1000°C @ 20°C/min
TGA
Universal V2.7B TA Instruments
134
TGA-MS Calcium Oxalate
TGAderivative weight loss
H2Om/e=18
COm/e=28
CO2 m/e=44
0 200 400 600 800
Temperature (°C)
117

135
TGA-MS
-1
0
1
2
3
4
Deriv.
Weig
ht (%
/min
)
90
92
94
96
98
Weig
ht (%
)
250 252 254 256 258 260 262 264 266
Time (min)
Sample: 583-35-E Size: 19.6330 mg TGA
Universal V2.7B TA Instruments
Gas switch from N2
to 2% H2 in N2.
136
TGA-MS
During weight loss, a reaction
occurs between H2 in purge and
sample in which H2O and HO are
produced.
118

137
Smoke Generation in Flame
Retarded Polymers (PVC)
0 100 200 300 400 500
20
40
60
80
100
Temperature (°C)
TG
A W
eig
ht (%
)
MS
Inte
ns
ity
PVC
PVC + MoO 3
0 100 200 300 400 500
Temperature (°C)
Benzene
(78 amu)
Benzene is a component of smoke. Much reduced in the flame retardent sample.
138
Compositional Analysis by TGA-MS
Sample: EVA (25%)Size: 5.7390 mgHeating Rate: 20°C/min
17.45% Acetic Acid(1.001mg)
Hydrocarbon CxHy
% VA= % Acetic Acid* Molecular Wt (VA) / Molecular Wt (AA)
% VA = 17.45(86.1/60.1)% VA = 25%
m/e 60
m/e 56
Acetic Acid
0.0001
0.001
0.01
0.1
1
Ion
Curr
en
t (n
A)
0
25
50
75
100
We
igh
t (%
)
0 100 200 300 400 500 600 700
Temperature (°C) Universal V3.8A TA Instruments
119

Thank You
Thank you for your attention!
120