th e rav l & ou ism e n e v i competitiveness index 2011 ... · pdf filechapter 1.1 th e...
TRANSCRIPT

1.1: The
Trave
l & Tou
rism Com
petit
iven
ess Inde
x 20
11
3
CHAPTER 1.1
The Travel & TourismCompetitiveness Index 2011:Assessing Industry Drivers inthe Wake of the CrisisJENNIFER BLANKE
THEA CHIESA
World Economic Forum
After a difficult period, which recast much of the Travel &Tourism (T&T) industry’s landscape, the sector is slowlyrecovering from the economic downturn, with emergingmarkets leading the way and Europe and North Americalagging behind. Slow growth combined with austeritymeasures adopted by many European countries is likelyto affect travel choices, and “homecations” might wellcontinue to be the choice for many. This will haveimportant consequences for many key destination markets, which must now look to attract new travelers,especially from the emerging markets.
On the other hand, emerging-market economies in Asia and Latin America continue to grow brisklydespite the global recession. This factor, coupled with arapidly growing middle class and a marked public-sectorcommitment to the importance of tourism in manycountries—an example of this commitment is China’srecent declaration that Travel & Tourism is “a pillar ofthe economy”—are stimulating the growth in T&Tservices and benefiting many key destinations.
With respect to travel, the air transport sector seemsset for slight recovery after a disastrous 2009 and a 2010marked by many and varied crises such as the Icelandicvolcano, abundant snowfalls, and labor disruptions, especially in Europe. According to the International AirTransport Association (IATA), the industry should end2010 with US$15.1 billion in profits.1
Indeed, after a contraction of 4.2 percent 2009,according to the World Tourism Organization(UNWTO), international tourist arrivals picked upagain in 2010 and have returned to their pre-crisis peaklevel, representing a growth of 5 to 6 percent over 2009;they are expected to return to the long-term average of4 percent in 2011. The World Travel & Tourism Council(WTTC) estimates that, from direct and indirect activi-ties combined, the T&T sector now accounts for 9.2percent of global GDP, 4.8 percent of world exports,and 9.2 percent of world investment, returning to theposition it held before the crisis.
The T&T sector’s potential to provide economicgrowth and development internationally led the WorldEconomic Forum five years ago to embark on the project of assessing the T&T competitiveness of nationsaround the world. A growing national T&T sector contributes to employment, raises national income, andcan improve the balance of payments. Thus the sector is an important driver of growth and prosperity, and,particularly within developing countries, it can also playa role in poverty reduction. This chapter presents thefourth edition of the Travel & Tourism CompetitivenessIndex (TTCI), launched for the first time in 2007.
Although developing the T&T sector providesmany benefits, numerous obstacles at the national levelcontinue to hinder its development. The TTCI aims tomeasure the many different regulatory and business-related issues that have been identified as levers forimproving T&T competitiveness in countries around
The Travel & Tourism Competitiveness Report 2011 © 2011 World Economic Forum

1.1: The
Trave
l & Tou
rism Com
petit
iven
ess Inde
x 20
11
4
the world. Through detailed analysis of each pillar andsubpillar of the Index, businesses and governments canaddress their particular challenges to the sector’s growth.
This Report aims to serve two purposes. First, byproviding a cross-country analysis of the drivers of T&T competitiveness, we intend to provide the industrywith useful comparative information and an importantbenchmarking tool for making decisions related to business and industry development. Second, the analysisprovides an opportunity for the T&T industry to high-light for national policymakers the obstacles to T&Tcompetitiveness that require policy attention, and toenable dialogue between the private and public sectorsfor improving the environment for developing the T&Tindustry at the national level. Indeed, since its introduc-tion, the Report has become an important component inthe toolkits of government ministries around the world.
The Forum is committed to publishing this Reportevery two years in an effort to ensure that it continuesto provide a leading strategic tool used by both businessand governments for creating blueprints for sustainableand viable T&T development.
The Travel & Tourism Competitiveness IndexThe Travel & Tourism Competitiveness Index (TTCI)has been developed within the context of the WorldEconomic Forum’s Industry Partnership Programme for the Aviation, Travel & Tourism sector. The TTCIaims to measure the factors and policies that make it attractive to develop the T&T sector in different countries. The Index was developed in close collaboration withour Strategic Design Partner Booz & Company and our Data Partners Deloitte, IATA, the InternationalUnion for Conservation of Nature (IUCN), the WorldTourism Organization (UNWTO), and WTTC. Wehave also received important feedback from a number of key companies that are Industry Partners in theeffort, namely Airbus, Bombardier, Etihad Airways, Gulf Air, Hertz, Jet Airways, Jumeirah, Rolls-Royce,Silversea, SWISS, and Visa.
The TTCI is based on three broad categories ofvariables that facilitate or drive T&T competitiveness.These categories are summarized into the three sub-indexes of the Index: (1) the T&T regulatory frameworksubindex; (2) the T&T business environment and infra-structure subindex; and (3) the T&T human, cultural,and natural resources subindex. The first subindex cap-tures those elements that are policy related and generallyunder the purview of the government; the secondsubindex captures elements of the business environmentand the “hard” infrastructure of each economy; and thethird subindex captures the “softer” human, cultural, andnatural elements of each country’s resource endowments.
Each of these three subindexes is composed in turnby a number of pillars of T&T competitiveness, ofwhich there are 14 in all. These are:
1. Policy rules and regulations2. Environmental sustainability3. Safety and security4. Health and hygiene5. Prioritization of Travel & Tourism6. Air transport infrastructure7. Ground transport infrastructure8. Tourism infrastructure9. ICT infrastructure
10. Price competitiveness in the T&T industry11. Human resources12. Affinity for Travel & Tourism13. Natural resources14. Cultural resources
Figure 1 summarizes the structure of the overallIndex, showing how the 14 component pillars are allo-cated within the three subindexes. The figure also showsa notional 15th pillar on climate change. Although wehave not yet included this concept in the calculationbecause of data deficiencies in measuring various aspectsof climate change, given its importance to the future ofthe T&T sector it is our intention to integrate this pillarinto the Index in the future as relevant data becomeavailable.
Each of the pillars is, in turn, made up of a numberof individual variables. The dataset includes both Surveydata from the World Economic Forum’s annualExecutive Opinion Survey (Survey), and quantitativedata from publicly available sources, international organ-izations, and T&T institutions and experts (for example,IATA, IUCN, the UNWTO, WTTC, UNCTAD, andUNESCO). The Survey is carried out among CEOsand top business leaders in all economies covered by ourresearch; these are the people making the investmentdecisions in their respective economies. The Survey provides unique data on many qualitative institutionaland business environment issues, as well as specific issuesrelated to the T&T industry and the quality of the natu-ral environment.
The policy rules and regulations pillar captures theextent to which the policy environment is conducive to developing the T&T sector in each country.Governments can have an important impact on theattractiveness of developing this sector, depending onwhether the policies that they create and perpetuatesupport or hinder its development. Sometimes well-intentioned policies can end up creating red tape orobstacles that have the opposite effect from that whichwas intended. In this pillar we take into account theextent to which foreign ownership and foreign directinvestment (FDI) are welcomed and facilitated by thecountry, how well property rights are protected, thetime and cost required for setting up a business, theextent to which visa requirements make it complicatedfor visitors to enter the country, and the openness of the bilateral Air Service Agreements into which the
The Travel & Tourism Competitiveness Report 2011 © 2011 World Economic Forum

1.1: The
Trave
l & Tou
rism Com
petit
iven
ess Inde
x 20
11
5government has entered with other countries. This yearwe have included an additional variable measuring thecommitments made within the international traderegime to opening tourism and travel services (underGATS).
The importance of the natural environment forproviding an attractive location for tourism cannot beoverstated, and it is clear that policies and factorsenhancing environmental sustainability are crucial forensuring that a country will continue to be an attractivedestination going into the future. In this pillar we meas-ure the stringency of the government’s environmentalregulations in each country as well as the extent towhich they are actually enforced. Given the environ-mental impacts that tourism itself can sometimes bringabout, we also take into account the extent to whichgovernments prioritize the sustainable development ofthe T&T industry in their respective economies. Inaddition to policy inputs, this pillar includes some of therelated environmental outputs, including carbon dioxideemissions and the percentage of endangered species inthe country.
Safety and security is a critical factor determiningthe competitiveness of a country’s T&T industry. Touristsare likely to be deterred from traveling to dangerouscountries or regions, making it less attractive to developthe T&T sector in those places. Here we take intoaccount the costliness of common crime and violence as well as terrorism, and the extent to which policeservices can be relied upon to provide protection from
crime as well as the incidence of road traffic accidents in the country.
Health and hygiene is also essential for T&T com-petitiveness. The access within a country to improveddrinking water and sanitation is important for the comfort and health of travelers. And in the event thattourists do become ill, the country’s health sector mustbe able to ensure they are properly cared for, as meas-ured by the availability of physicians and hospital beds.
The extent to which the government prioritizes the T&T sector also has an important impact on T&Tcompetitiveness. By making clear that Travel &Tourismis a sector of primary concern, and by reflecting this in its budget priorities, the government can channelneeded funds to essential development projects. It alsosends a signal of its intentions, which can have positivespillover effects such as attracting further private invest-ment into the sector. Prioritization of the sector can be reflected in a variety of other ways as well, such asgovernment efforts to collect and make available T&Tdata on a timely basis and commissioning high-quality“destination-marketing” campaigns.
Quality air transport infrastructure provides ease ofaccess to and from countries, as well as movement todestinations within countries. In this pillar we measureboth the quantity of air transport, as measured by theavailable seat kilometers, the number of departures, airport density, and the number of operating airlines, aswell as the quality of the air transport infrastructure bothfor domestic and international flights.
Figure 1: Composition of the three subindexes of the TTCI
Subindex A:T&T regulatory framework
Health and hygiene
Safety and security
Environmental sustainability
Policy rules and regulations
Prioritization of Travel & Tourism
Subindex B: T&T business environment
and infrastructure
ICT infrastructure
Tourism infrastructure
Ground transport infrastructure
Air transport infrastructure
Price competitiveness in the T&T industry
Subindex C: T&T human, cultural, and
natural resources
Human resources
Affinity for Travel & Tourism
Cultural resources
Climate change
Natural resources
Travel & Tourism Competitiveness Index
The Travel & Tourism Competitiveness Report 2011 © 2011 World Economic Forum

1.1: The
Trave
l & Tou
rism Com
petit
iven
ess Inde
x 20
11
6
Vital for ease of movement within a country is the extensiveness and quality of its ground transportinfrastructure.This takes into account the quality ofroads, railroads, and ports, as well as the extent to whichthe national transport network as a whole offers efficient,accessible transportation to key business centers andtourist attractions.
We have also included a pillar that captures a number of aspects of the general tourism infrastructurein each country, as distinct from the general transportinfrastructure. This takes into account the accommoda-tion infrastructure (the number of hotel rooms) and thepresence of major car rental companies in the country,as well as a measure of its financial infrastructure fortourists (the availability of automatic teller machines, orATMs).
Given the increasing importance of the onlineenvironment for the modern T&T industry for planningitineraries and purchasing travel and accommodations,we also capture the quality of the ICT infrastructure ineach economy. Here we measure ICT penetration rates(Internet, telephone lines, and broadband), which pro-vide a sense of the society’s online activity. We alsoinclude a specific measure of the extent to which theInternet is used by businesses in carrying out transac-tions in the economy, to get a sense of the extent towhich these tools are in fact being used for business(including T&T) transactions.
The price competitiveness in the T&T industry isclearly an important element to take into account, with lower costs increasing the attractiveness of somecountries for many travelers. To measure countries’ pricecompetitiveness, we take into account factors such as the extent to which goods and services in the countryare more or less expensive than elsewhere (purchasingpower parity), airfare ticket taxes and airport charges(which can make flight tickets much more expensive),fuel price levels compared with those of other coun-tries, and taxation in the country (which can be passedthrough to travelers) as well as the relative cost of hotelaccommodations.
Quality human resources in an economy ensure thatthe industry has access to the collaborators it needs todevelop and grow. This pillar takes into account the healthand the education and training levels in each economy,and is made up of two specific subpillars. The educationand training subpillar measures educational attainmentrates (primary and secondary), as well as the overallquality of the educational system in each country, asassessed by the business community. Besides the formaleducational system, we also take into account private-sector involvement in upgrading human resources,including the availability of specialized training servicesand the extent of staff training by companies in thecountry. The subpillar measuring the availability of qualified labor further takes into account the extent towhich hiring and firing is impeded by regulations, and
whether labor regulations make it easy or difficult tohire foreign labor. The health of the workforce is alsoincluded here, as measured by the overall life expectancyin the country as well as the specific costliness ofHIV/AIDS to businesses.
Also included is the affinity for Travel & Tourism,which measures the extent to which a country and society are open to tourism and foreign visitors. It isclear that the general openness of the population totravel and to foreign visitors has an important impact on T&T competitiveness. In particular, we provide ameasure of the national population’s attitude toward foreign travelers; a measure of the extent to which busi-ness leaders are willing to recommend leisure travel intheir countries to important business contacts; and ameasure of tourism openness (tourism expenditures andreceipts as a percentage of GDP), which provides a senseof the importance of tourism relative to the country’soverall size.
It is clear that natural resources are another impor-tant factor underlying national T&T competitiveness.Countries that are able to offer travelers access to natural assets clearly have a competitive advantage. Inthis pillar we include a number of environmental attrac-tiveness measures, including the number of UNESCOnatural World Heritage sites, a measure of the quality ofthe natural environment, the richness of the fauna in the country as measured by the total known species ofanimals, and the percentage of nationally protectedareas.
Finally, the cultural resources at each country’s disposal are also a critical driver of T&T competitivenessaround the world. In this pillar we include the number ofUNESCO cultural World Heritage sites, sports stadiumseat capacity, and the number of international fairs andexhibitions in the country, as well as a measure of itscreative industries exports, which provides an indicationof cultural richness.
These 14 pillars are regrouped into the three sub-indexes described above, as shown in Figure 1, and theoverall score for each country is derived as an unweightedaverage of the three subindexes. The details of the com-position of the TTCI are shown in Appendix A; detailedrankings and scores of this year’s Index are found inAppendix B.
Country coverageSeven new economies have been included in the analy-sis this year. These include four new African countries(Angola, Cape Verde, Rwanda, and Swaziland), twoMiddle Eastern countries (Iran and Lebanon), and oneAsian country (Timor-Leste). On the other hand, onecountry covered in the last Report, Suriname, is not cov-ered this year because of a lack of Survey data. This hasled to a net increase in country coverage for a total of 139economies this year—six more than in the 2009 Report—
The Travel & Tourism Competitiveness Report 2011 © 2011 World Economic Forum

1.1: The
Trave
l & Tou
rism Com
petit
iven
ess Inde
x 20
11
7
covering all of the world’s regions and accounting forover 98 percent of world GDP.
The Travel & Tourism Competitiveness Index rankings2011Table 1 shows the overall rankings of the TTCI, com-paring this year’s rankings with those from the 2009edition of the Report, showing all countries rankedtogether. The results are positively correlated with anumber of T&T indicators. For example, Figures 2 and 3show the correlation between the TTCI and touristarrivals, and between the TTCI and tourism receipts,respectively (both shown in log form) in 2009. As thefigures show, the Index is quite highly correlated withboth the number of tourists actually traveling to variouscountries and the annual income generated from Travel& Tourism, with few notable outliers. This relationshiphas held since the Index first appeared in 2007, support-ing the idea that the TTCI captures factors that areimportant for developing the T&T industry.
Top three performers in each pillar of the TTCITable 2 shows the rankings of those economies demonstrating the top three performances in each ofthe 14 pillars of the TTCI. The table shows that twoeconomies are among the top three performers in fourpillars (Singapore and Switzerland), and two economiesare among the best in three pillars (Hong Kong andSweden). Four countries are among the best performersin two pillars (Austria, Barbados, Iceland, and the UnitedStates). All other countries shown in the table demonstratenotable strengths in one area measured by the TTCI.
Singapore, Hong Kong, and New Zealand are topranked for policy rules and regulations. These economieshave put into place overarching policy environmentsthat are conducive to the development of the T&T sector, including well-protected property rights, rulesattracting FDI, and a minimum of red tape required insetting up new businesses. They are joined in the top 10 by two Nordic countries, Finland and Sweden, aswell as Canada, among the countries shown in the table.
Sweden, Switzerland, and Denmark—three countrieswith a good reputation for environmental protection—hold the top three spots in the environmental sustain-ability pillar. These countries are characterized by envi-ronmental legislation that is both stringent and wellenforced, a specific focus on developing the tourismsector in a sustainable way, and good overall environ-mental outcomes in terms of low levels of pollution and environmental damage. Also in the top 10 amongcountries shown in the table are Austria, Finland,Germany, and Norway, all with a significant focus onprotecting the environment.
Safety and security is another area dominated byEuropean countries, and the Nordics in particular,
with Finland, Switzerland, and Norway holding the topthree spots in this pillar. These countries do not sufferfrom high levels of crime and violence, and they allbenefit from effective police forces. They are also notoverly concerned by the threat of terrorism, as is thecase in many countries today. Additionally, they gainfrom roads that are safe by international standards, withfew deaths caused by road traffic accidents.
Hong Kong, Lithuania, and Austria are top rankedfor the quality of their health and hygiene, with variousstrengths, such as high levels of access to clean drinkingwater and sanitation and good health infrastructure.They are therefore able to cater well to a major concernthat tourists have when considering where to travelingabroad.
Mauritius, Singapore, and Barbados are the top performers in terms of the overall prioritization of thetourism industry. This is perhaps not surprising given theimportance of the sector for their economies, and it isborne out through their high government expenditureon the sector, strong destination-marketing campaigns,and country-level presence at key international tourismfairs. They also make significant efforts to collect datameasuring tourism-sector activity on a timely basis.Other countries shown in the table that are among thetop 10 in this pillar are Cyprus and Iceland, which arealso making great efforts to successfully develop theirtourism sectors.
The air transport infrastructure pillar continues to bedominated by three English-speaking countries: Canada,the United States, and Australia. These are vast countriesthat are highly dependent on air transport, and indeedthey are home to many airports and operating airlines,which are providing quality service and high levels of airtraffic.
The best ground transport infrastructure is found in Hong Kong, Singapore, and Germany. All three havehigh-quality roads, railroads, and ports and also are characterized by ground transport networks that worktogether seamlessly. Travelers in these economies can get from one place to another without hassle or compli-cation, increasing their attractiveness as destinations.
The tourism infrastructure pillar is also dominated atthe very top by European countries, topped by Austria,Cyprus, and Italy, all tied at first place. Visitors to thesecountries have many hotels to choose from, excellentcar rental facilities, and many ATMs for withdrawingcash. In other words, visitors have choices in how theyvisit, travel, and move around in these countries, andthey have the necessary facilities for a comfortable stay.
The ICT infrastructure pillar is best in Sweden,Switzerland, and Iceland, with high penetration rates ofICTs and strong use of the Internet for business transac-tions. This situation strongly supports the T&T industriesin these countries, which have become increasinglydependent on such tools for marketing and distribution.
The Travel & Tourism Competitiveness Report 2011 © 2011 World Economic Forum

2011 2009Country/Economy Rank/139 Score Rank/133
Switzerland 1 5.68 1Germany 2 5.50 3France 3 5.41 4Austria 4 5.41 2Sweden 5 5.34 7United States 6 5.30 8United Kingdom 7 5.30 11Spain 8 5.29 6Canada 9 5.29 5Singapore 10 5.23 10Iceland 11 5.19 16Hong Kong SAR 12 5.19 12Australia 13 5.15 9Netherlands 14 5.13 13Luxembourg 15 5.08 23Denmark 16 5.05 14Finland 17 5.02 15Portugal 18 5.01 17New Zealand 19 5.00 20Norway 20 4.98 19Ireland 21 4.98 18Japan 22 4.94 25Belgium 23 4.92 22Cyprus 24 4.89 21Estonia 25 4.88 27Malta 26 4.88 29Italy 27 4.87 28Barbados 28 4.84 30Greece 29 4.78 24United Arab Emirates 30 4.78 33Czech Republic 31 4.77 26Korea, Rep. 32 4.71 31Slovenia 33 4.64 35Croatia 34 4.61 34Malaysia 35 4.59 32Montenegro 36 4.56 52Taiwan, China 37 4.56 43Hungary 38 4.54 38China 39 4.47 47Bahrain 40 4.47 41Thailand 41 4.47 39Qatar 42 4.45 37Mexico 43 4.43 51Costa Rica 44 4.43 42Puerto Rico 45 4.42 53Israel 46 4.41 36Tunisia 47 4.39 44Bulgaria 48 4.39 50Poland 49 4.38 58Turkey 50 4.37 56Latvia 51 4.36 48Brazil 52 4.36 45Mauritius 53 4.35 40Slovak Republic 54 4.35 46Lithuania 55 4.34 49Panama 56 4.30 55Chile 57 4.27 57Uruguay 58 4.24 63Russian Federation 59 4.23 59Argentina 60 4.20 65Oman 61 4.18 68Saudi Arabia 62 4.17 71Romania 63 4.17 66Jordan 64 4.14 54Jamaica 65 4.12 60South Africa 66 4.11 61Brunei Darussalam 67 4.07 69India 68 4.07 62Peru 69 4.04 74
(Cont’d.)
2011 2009Country/Economy Rank/139 Score Rank/133
Lebanon 70 4.03 n/aAlbania 71 4.01 90Dominican Republic 72 3.99 67Georgia 73 3.98 73Indonesia 74 3.96 81Egypt 75 3.96 64Macedonia, FYR 76 3.96 80Colombia 77 3.94 72Morocco 78 3.93 75Trinidad and Tobago 79 3.91 84Vietnam 80 3.90 89Sri Lanka 81 3.87 78Serbia 82 3.85 88Azerbaijan 83 3.85 76Namibia 84 3.84 82Ukraine 85 3.83 77Guatemala 86 3.82 70Ecuador 87 3.79 96Honduras 88 3.79 83Cape Verde 89 3.77 n/aArmenia 90 3.77 91Botswana 91 3.74 79Gambia, The 92 3.70 87Kazakhstan 93 3.70 92Philippines 94 3.69 86Kuwait 95 3.68 95El Salvador 96 3.68 94Bosnia and Herzegovina 97 3.63 107Guyana 98 3.62 102Moldova 99 3.60 93Nicaragua 100 3.56 103Mongolia 101 3.56 105Rwanda 102 3.54 n/aKenya 103 3.51 97Senegal 104 3.49 101Syria 105 3.49 85Venezuela 106 3.46 104Kyrgyz Republic 107 3.45 106Ghana 108 3.44 110Cambodia 109 3.44 108Tanzania 110 3.42 98Zambia 111 3.40 100Nepal 112 3.37 118Algeria 113 3.37 115Iran, Islamic Rep. 114 3.37 n/aUganda 115 3.36 111Swaziland 116 3.35 n/aBolivia 117 3.35 114Tajikistan 118 3.34 109Zimbabwe 119 3.31 121Benin 120 3.30 120Malawi 121 3.30 117Ethiopia 122 3.26 123Paraguay 123 3.26 122Libya 124 3.25 112Pakistan 125 3.24 113Cameroon 126 3.18 125Madagascar 127 3.18 116Mozambique 128 3.18 124Bangladesh 129 3.11 129Nigeria 130 3.09 128Côte d’Ivoire 131 3.08 130Burkina Faso 132 3.06 126Mali 133 3.05 119Timor-Leste 134 2.99 n/aLesotho 135 2.95 132Mauritania 136 2.85 127Burundi 137 2.81 131Angola 138 2.80 n/aChad 139 2.56 133
Table 1: Travel & Tourism Competitiveness Index 2011 and 2009 comparison
8
1.1: The
Trave
l & Tou
rism Com
petit
iven
ess Inde
x 20
11
The Travel & Tourism Competitiveness Report 2011 © 2011 World Economic Forum

9
1.1: The
Trave
l & Tou
rism Com
petit
iven
ess Inde
x 20
11
1 2 3 4 5 6
0
1
2
3
4
5
6
Figure 2: T&T competitiveness and tourist arrivals
Log
of in
tern
atio
nal t
ouri
st a
rriv
als
(thou
sand
s), 2
009
Travel & Tourism Competitiveness Index 2011 scores
1 2 3 4 5 6
0
1
2
3
4
5
6
Figure 3: T&T competitiveness and tourism receipts
Log
of in
tern
atio
nal t
ouri
st re
ceip
ts(th
ousa
nds)
, 200
9
Travel & Tourism Competitiveness Index 2011 scores
The Travel & Tourism Competitiveness Report 2011 © 2011 World Economic Forum

Table 2: Top three performing economies per pillar
Policy rules and
regulations
Environmental
sustainability
Safety and security
Health and hygiene
Prioritization of
Travel & Tourism
Air transport
infrastructure
Ground transport
infrastructure
Tourism infrastructure
ICT infrastructure
Price competitiveness
in the T&T industry
Human capital
Affinity for Travel
& Tourism
Natural resources
Cultural resources
Country/Economy
Albania 46 72 44 66 55 96 97 77 71 94 57 3 113 83
Australia 30 59 18 58 37 3 51 16 24 113 20 55 4 20
Austria 28 5 10 3 16 26 15 1 25 121 25 15 43 13
Barbados 75 30 34 33 3 25 10 28 27 74 48 2 129 63
Brazil 114 29 75 73 108 42 116 76 56 114 70 97 1 23
Brunei Darussalam 120 136 23 70 127 41 49 91 47 1 47 78 38 91
Canada 4 35 24 52 40 1 33 21 14 105 5 52 11 18
Cyprus 79 51 26 43 6 21 20 1 31 109 24 11 117 47
Denmark 17 3 8 38 81 17 7 24 10 139 4 111 77 22
Finland 5 7 1 12 65 16 21 42 17 128 7 83 66 26
Gambia, The 86 44 88 103 26 82 52 127 108 2 107 30 106 116
Germany 20 4 9 7 83 7 3 15 7 125 19 81 18 4
Hong Kong SAR 2 109 5 1 12 12 1 70 4 67 6 8 68 40
Iceland 33 15 4 4 9 18 32 7 3 71 3 14 80 56
Italy 84 60 48 27 56 29 39 1 34 129 45 91 49 8
Lebanon 98 125 123 48 39 56 100 29 80 55 64 1 139 98
Lithuania 83 19 59 1 97 107 26 50 32 73 62 84 114 57
Malaysia 21 64 83 75 46 34 36 74 52 3 37 17 22 33
Mauritius 27 62 45 68 1 61 41 47 66 18 53 4 131 110
New Zealand 3 20 14 30 21 11 50 36 23 84 14 18 30 49
Norway 15 6 3 23 36 9 63 23 11 134 16 88 60 27
Singapore 1 41 13 55 2 14 2 33 20 29 2 12 96 30
Spain 85 33 36 29 11 8 13 8 30 106 46 37 35 2Sweden 8 1 7 36 60 10 16 37 1 120 13 54 45 1Switzerland 18 2 2 13 14 13 5 8 2 127 1 34 16 9
Tanzania 97 43 115 134 90 121 123 125 130 56 125 80 2 101
United Kingdom 13 11 30 46 49 5 17 19 9 135 8 86 23 3United States 16 105 62 45 33 2 28 13 21 100 11 104 3 6
1.1: The
Trave
l & Tou
rism Com
petit
iven
ess Inde
x 20
11
10
The price competitiveness pillar is topped byBrunei Darussalam, the Gambia, and Malaysia. All threecountries benefit from low fuel costs. Brunei benefitsfrom low ticket taxes and airport charges, and low taxa-tion more generally, while the Gambia and Malaysia arecharacterized by moderate-to-low taxes, low fuel prices,and highly competitive hotel prices. When choosing adestination, these countries benefit from the interest ofmany visitors in getting more for their money.
Switzerland, Singapore, and Iceland hold the topthree spots in the human resources pillar. These coun-tries have strong educational systems as well as top-notchtraining facilities and healthy workforces. In addition,they are characterized by flexible labor markets and significant ease in hiring foreign labor, which makes itmuch easier to manage the seasonal hiring so critical for the T&T industry.
The countries with the top three assessments forthe affinity for Travel & Tourism are Lebanon, Barbados,and Albania, with all three displaying great openness toforeign travelers and with their business communities
also expressing their sense of the great value of tourismon offer in their countries.
The top three countries in the natural resources pillar span three continents: Brazil, Tanzania, and theUnited States. These countries each have several WorldHeritage natural sites and much protected land area, andboast a rich fauna as measured by the total number ofknown species living in them. Within the table we seethat Australia is ranked 4th, also offering rich naturalresources to visitors. These countries have the great fortune to be endowed with inherent attractions fortourists interested in nature tourism.
Finally, Sweden, Spain, and the United Kingdomare the top three ranked countries for their culturalresources. All three have a large number of World Heritagecultural sites, strong creative industries, many interna-tional fairs and exhibitions, and significant sports stadiumcapacities. These attributes come together to provide avariety of cultural attractions for visitors.
More details on the T&T competitiveness of specificcountries will be discussed in the section below.
The Travel & Tourism Competitiveness Report 2011 © 2011 World Economic Forum

1.1: The
Trave
l & Tou
rism Com
petit
iven
ess Inde
x 20
11
11
Regional rankingsThis section will discuss some of the highlights of therankings in a regional context, grouping countries intothe following five regional groups: Europe, the Americas,Asia Pacific (including Central Asia), the Middle Eastand North Africa, and sub-Saharan Africa. For furtherdetails for each of the 139 economies included in thisIndex, we provide two-page profiles in Part 2 of theReport.The profiles show the rankings on each subindexand pillar, as well as on each of the 74 indicators includedin the Index.
EuropeTable 1 shows that many countries from Europe do very well in the rankings, with all of the top 5 placestaken by European countries and 14 of the top 20countries hailing from the region. Table 3 shows therankings just for European countries, with the first column showing the rank within the region and thesecond column showing the overall rank out of all 139economies included in the Index this year. As the tableshows, Switzerland is ranked 1st out of all countries in the 2011 TTCI, a position it has held since the firstedition of this Report in 2007. Germany, France, Austria,Sweden, the United Kingdom, and Spain follow as theother countries among the top 10 overall.
Switzerland is a country rich in cultural and natural resources, including an impressive number ofWorld Heritage cultural and natural sites for a countryof its size. A large percentage of the country’s land areais protected and the natural environment is assessed asbeing among the most pristine in the world (ranked5th). This natural heritage is buttressed by a strongnational focus on environmental sustainability: Switzerlandis ranked 2nd overall on this pillar, based on strong andwell-enforced environmental legislation and with a par-ticular focus on developing the T&T sector sustainably.
Switzerland is not only an attractive leisure tourismdestination, but is also an important business travel hub,with many international fairs and exhibitions held in thecountry each year. Staffing of the industry is facilitatedby the availability of qualified labor to work in Travel & Tourism (ranked 2nd), perhaps not surprising in acountry with many of the best hotel managementschools. Added to these strengths is Switzerland’s excel-lent ground transport infrastructure (ranked 5th), withtop-quality roads and railroads and an excellent domes-tic transport network. Also well assessed is the specifictourism infrastructure (ranked 8th), with readily avail-able hotel rooms and automated teller machines (ATMs)for cash withdrawals. Such high-quality infrastructuremakes a tourist’s stay in the country easy and comfort-able, an experience that is reinforced by the high levelof general safety and security (ranked 2nd, just behindFinland).
Germany is ranked 2nd in Europe and out of allcountries in the TTCI, having moved up one place
since the last assessment and overtaking Austria. Thecountry is characterized by abundant cultural resources,ranked 6th worldwide for its 32 World Heritage culturalsites, 2nd for the number of international fairs and exhibitions held in the country, and 3rd for its creativeindustries. The country’s infrastructure is among the bestin the world, ranked 3rd for the quality of its groundtransport infrastructure and 7th for its air transport infra-structure. In addition, Germany makes great efforts todevelop the T&T industry in a sustainable way, with theworld’s most stringent and best-enforced environmentalregulations and strong support of international environ-mental efforts, as demonstrated through its ratification of many international environmental treaties.
France moves up this year by one place to 3rdposition, also overtaking Austria. France attracts touristswith its rich cultural heritage (ranked 4th for the num-ber of World Heritage cultural sites and 7th for creativeindustries). The country also hosts many internationalfairs and exhibitions (ranked 5th), thereby attractingbusiness travelers as well. France’s ground transport infra-structure is among the best in the world (ranked 4th), withthe quality of roads and railroads particularly well assessed,as well as its air transport infrastructure (ranked 6th).Ensuring that the sector is developed in a sustainableway is also a significant priority for the government,with France ranked 9th on this pillar.
Austria drops by two positions this year, althoughthe country is still ranked a high 4th out of all 139economies. Its ranking is attributable to its rich culturalresources, with eight World Heritage cultural sites, rich creative industries, and many fairs and exhibitionscatering to business travelers. The natural environment is also well assessed, along with the country’s focus onenvironmental sustainability (ranked 5th). In addition,Austrians are perceived as open and welcoming to for-eign travelers. Austria’s tourism infrastructure is assessedas second to none, with abundant car rental facilities,hotel accommodations, and ATMs. Other strengthsinclude Austria’s assessment as one of the safest countriesin the world (ranked 10th) and its excellent health andhygiene levels (ranked 3rd).
Sweden joins the top five countries for the firsttime, having improved by two places since the 2009 T&TReport.The country is ranked 1st out of all countries in three key areas that span the three subindexes of theTTCI: environmental sustainability, ICT infrastructure,and cultural resources. The country’s supportive policyenvironment (ranked 8th), excellent safety and securityenvironment (7th), and excellent air transport infrastruc-ture (10th) contribute to this strong result and help thecountry to overcome its lack of price competitiveness(ranked 120th).
The United Kingdom moves up by an impressivefour positions since the last edition of the Report to reach7th place this year. The country’s T&T competitivenessis based on its excellent cultural resources (ranked 3rd),
The Travel & Tourism Competitiveness Report 2011 © 2011 World Economic Forum

strong human resources (ranked 8th), and solid ICT and air transport infrastructures (ranked 9th and 5th,respectively). The country also benefits from a support-ive policy environment as well as significant focus onenvironmental sustainability. Its rise in rank since the lastassessment is driven largely by greater safety and security,a greater affinity for Travel & Tourism in the country,and more competitive prices, particularly hotel prices.
Spain is ranked behind the United Kingdom within Europe, falling two places to 8th position. Thecountry is ranked 2nd worldwide for the richness of its cultural resources, with many World Heritage sites,
a large number of international fairs and exhibitions,and a significant sports stadium capacity. Spain’s tourisminfrastructure is ranked 8th internationally, with manyhotel rooms, car rental facilities, and ATMs; and its airtransport infrastructure also gets good marks (ranked8th). The government prioritizes the sector significantly,taking great care to collect comprehensive and timelydata on the T&T sector, and the country makes strongefforts to attract tourists through solid destination-marketing campaigns and by ensuring Spain’s presenceat many international tourism fairs. Spain’s decline inrank is driven in large part by increased concerns about
Table 3: The Travel & Tourism Competitiveness Index 2011: Europe
SUBINDEXES
T&T business environment T&T human, cultural, OVERALL INDEX T&T regulatory framework and infrastructure and natural resources
Country/Economy Regional rank Overall rank Score Rank Score Rank Score Rank Score
Switzerland 1 1 5.68 1 5.99 1 5.58 2 5.48
Germany 2 2 5.50 12 5.67 2 5.57 5 5.26
France 3 3 5.41 7 5.71 8 5.35 9 5.18
Austria 4 4 5.41 3 5.89 12 5.19 10 5.13
Sweden 5 5 5.34 11 5.67 15 5.15 8 5.21
United Kingdom 6 7 5.30 21 5.35 11 5.27 3 5.28
Spain 7 8 5.29 22 5.34 10 5.32 6 5.22
Iceland 8 11 5.19 2 5.90 6 5.36 41 4.31
Netherlands 9 14 5.13 16 5.50 18 5.10 16 4.78
Luxembourg 10 15 5.08 14 5.51 7 5.35 38 4.37
Denmark 11 16 5.05 15 5.51 16 5.11 26 4.53
Finland 12 17 5.02 5 5.74 30 4.75 25 4.55
Portugal 13 18 5.01 19 5.47 24 4.84 17 4.73
Norway 14 20 4.98 8 5.71 26 4.79 32 4.45
Ireland 15 21 4.98 10 5.68 23 4.88 37 4.37
Belgium 16 23 4.92 18 5.48 35 4.66 20 4.64
Cyprus 17 24 4.89 23 5.33 14 5.15 44 4.19
Estonia 18 25 4.88 17 5.50 19 5.09 50 4.06
Malta 19 26 4.88 9 5.69 22 4.93 54 4.02
Italy 20 27 4.87 45 5.00 27 4.79 15 4.83
Greece 21 29 4.78 34 5.11 29 4.75 29 4.48
Czech Republic 22 31 4.77 26 5.26 37 4.56 31 4.48
Slovenia 23 33 4.64 29 5.19 33 4.70 53 4.03
Croatia 24 34 4.61 42 5.02 36 4.58 43 4.23
Montenegro 25 36 4.56 32 5.15 49 4.15 36 4.38
Hungary 26 38 4.54 24 5.29 45 4.28 48 4.06
Bulgaria 27 48 4.39 54 4.79 44 4.32 51 4.05
Poland 28 49 4.38 49 4.86 65 3.81 30 4.48
Turkey 29 50 4.37 66 4.58 55 4.02 28 4.50
Latvia 30 51 4.36 38 5.07 39 4.36 83 3.66
Slovak Republic 31 54 4.35 39 5.05 57 3.96 52 4.04
Lithuania 32 55 4.34 33 5.14 46 4.21 85 3.66
Russian Federation 33 59 4.23 73 4.49 53 4.07 45 4.15
Romania 34 63 4.17 51 4.85 66 3.80 66 3.84
Albania 35 71 4.01 53 4.79 91 3.30 61 3.93
Georgia 36 73 3.98 35 5.11 94 3.21 92 3.62
Macedonia, FYR 37 76 3.96 56 4.78 78 3.49 93 3.62
Serbia 38 82 3.85 67 4.57 84 3.39 94 3.60
Ukraine 39 85 3.83 64 4.63 76 3.53 118 3.33
Armenia 40 90 3.77 58 4.75 100 3.09 107 3.47
Bosnia and Herzegovina 41 97 3.63 92 4.24 97 3.14 103 3.49
Moldova 42 99 3.60 68 4.57 98 3.11 129 3.12
12
1.1: The
Trave
l & Tou
rism Com
petit
iven
ess Inde
x 20
11
The Travel & Tourism Competitiveness Report 2011 © 2011 World Economic Forum

13
1.1: The
Trave
l & Tou
rism Com
petit
iven
ess Inde
x 20
11
the availability of qualified labor and a comparativeweakening of some aspects of the policy environment.
Italy moves up by one position to 27th overall, andis ranked 20th in Europe. As well as its cultural richness,with many World Heritage Sites, international fairs andexhibitions, and rich creative industries, Italy’s strengthslie in areas such as the health and hygiene of the coun-try (27th), its air transport infrastructure (30th), andespecially its excellent tourism infrastructure (ranked 1st). However, it faces a number of challenges that bringits overall rating down. These include policy rules andregulations, where Italy ranks 84th (consistently gettingworse over the past few years) because of its lack of foreign ownership (ranked 112th) and its lack of trans-parency in government policymaking (119th). In addi-tion, ground transport infrastructure requires upgrading,there is insufficient focus on developing the sector in an environmentally sustainable way, and the countrycontinues to suffer from a lack of price competitiveness.
Greece is ranked 21st in Europe and 29th overall,down by five positions since the last assessment. Thecountry benefits from rich cultural resources (ranked25th), excellent health and hygiene (ranked 20th overall), and a top-notch tourism infrastructure (5th).Further, there is a strong national affinity for tourismcompared with many other European countries, includ-ing a generally open and positive attitude towardtourists (26th). The decline in rank can be traced to factors such as a weaker policy environment andincreased concerns about safety and security, as well as a lower prioritization of Travel & Tourism within the country (perhaps not surprising given the country’srecent more general economic travails).
Croatia, a country well known for its tourismindustry and one that is aiming to join the EuropeanUnion (EU) in the coming years, is ranked 24th inEurope and 34th overall, on a par with countries such asMalaysia and well ahead of several EU members. Croatia’sperformance has remained stable over the last severaleditions of the Report. It is endowed with a remarkable15 cultural and 1 natural World Heritage sites, and isranked 20th in terms of its overall affinity for Travel & Tourism. In addition, the country’s tourism-specificinfrastructure is ranked 4th out of all 139 countries. Onthe other hand, in order to improve the sector’s compet-itiveness further, a goal will be to upgrade ground transport infrastructure, particularly railroads and ports as well as air transport infrastructure, and to bring policyrules and regulations in the country more in line withthose that are needed for developing the sector (presentlyranked 77th).
Montenegro sees one of the most impressiveimprovements this year out of all countries, going up by a full 16 places to 36th overall, just behind Croatia in the region. The country’s policy rules and regulationsfor the sector have improved substantially, now ranked10th in this area; it is also prioritizing the sector more
strongly. Montenegro has a strong affinity for Travel &Tourism (ranked 7th), perhaps not surprising given theimportance of the sector for the country’s economy. Yetwhile tourism infrastructure is already well developed(ranked 25th), ground transport infrastructure (109th)and air transport infrastructure (62nd) could be furtherimproved to reinforce the country’s T&T competitiveness.
Turkey is ranked 29th in Europe and 50th in theTTCI, up six places since the last assessment. The coun-try certainly benefits from its rich cultural heritage, with 17 World Heritage cultural sites, 2 World Heritagenatural sites, several international fairs and exhibitions,and strong creative industries. In addition, the policyrules and regulations governing the sector are supportiveand have improved since the 2009 T&T Report (ranked34th). However, the country’s overall T&T competitive-ness is held back by worries about safety and security(97th), particularly related to terrorism and concernsabout the ability of the police to provide protectionfrom crime and violence. Health and hygiene is also acomparative weakness (67th), as well as ground transportinfrastructure inadequacies (especially railroads andports). In addition, further attention must be placed onprotecting the country’s natural resources (it is ranked85th for environmental sustainability).
Russia is ranked 33rd in Europe and 59th overall,with a stable performance compared with the last Report.The country gets relatively high marks for naturalresources (27th) and cultural resources (35th), due inparticular to its many World Heritage sites. It also has aquite well developed air transport infrastructure (31st),an assessment that has improved somewhat since the2009 T&T Report. However, ground transport infra-structure (95th) gets lower marks. Safety and securityissues are also of serious concern (113th), with a highlevel of crime and violence, a lack of trust in the policeto provide protection from crime, and many deathscaused by road traffic accidents, although this is an over-all area that has seen some improvement since the lastassessment. Most strikingly, Russia is assessed as having avery nonconducive policy environment (126th) due, forexample, to extremely rare foreign ownership, propertyrights that are not well protected, and visa requirementsfor visitors from many countries. A lack of focus onenvironmental sustainability, ranked 98th, is also an areaof concern. More generally, the sector is not seen to be apriority of the government, and is ranked a low 122nd.
As in past years, at the bottom of the Europeanrankings are a number of Balkan countries (Macedonia,Serbia, and Bosnia and Herzegovina), as well asUkraine, Armenia, and Moldova. In line with theirless-advanced development, these countries will requiresignificant investments in upgrading the infrastructureneeded to support healthy and growing T&T sectors.
The Travel & Tourism Competitiveness Report 2011 © 2011 World Economic Forum

The AmericasTable 4 shows the regional rankings for the countries inthe Americas. As this table shows, the United States isthe highest-ranked country in the Americas and 6th outof all countries, up two positions from the last assessmentand with a somewhat stable performance since theTTCI was conceived. The country places 3rd for itsoverall business environment and infrastructure and 1st for its human, cultural, and natural resources. In par-ticular, the United States has an excellent air transportinfrastructure (ranked 2nd) and high-quality tourisminfrastructure. Its cultural resources are ranked 6th andits natural resources are ranked 3rd out of all countries,with many nationally protected areas and many WorldHeritage natural sites, although a perception exists thatthe environment is not being sufficiently protected(ranked 105th for environmental sustainability).
Canada falls four places this year to 9th overall and2nd in the region. Canada’s natural resources constitutea key strength, with the country’s nine World Heritagenatural sites placing it 4th internationally. Its culturalresources are also a strong point, with many internationalfairs and exhibitions in the country and strong creativeindustries in particular. Canada’s air transport infrastruc-ture is ranked 1st out of all countries, and it also getsgood marks for its tourism and ICT infrastructure, facil-itating the online T&T environment. Canada’s policy
environment is very conducive to the development of the sector (ranked 4th, up one place since the 2009T&T Report).
Barbados is ranked 3rd in the region, at 28th over-all, up two places since the last assessment. Barbados isranked 2nd overall for the country’s affinity for Travel &Tourism, with a positive attitude toward tourists andtoward the value of tourism in the country. The countryis prioritizing the sector to a very high degree (ranked3rd), spending a high percentage of GDP on the sector,ensuring effective destination-marketing campaigns, andcollecting relevant sector data on a timely basis. Increasedefforts toward environmental sustainability would furtherreinforce the country’s strong T&T competitiveness.
Mexico has improved by eight places and is nowranked 4th in the region and 43rd overall, overtakingCosta Rica and Brazil since the last assessment. Mexicogets impressive marks for its natural resources (ranked10th), an area that shows an improvement since the lastassessment, with many World Heritage natural sites andrich fauna. The country’s cultural resources are alsoamong the best in the world (19th), with 33 WorldHeritage cultural sites, several international fairs andexhibitions, and strong creative industries. These inherentstrengths are reinforced by the overall prioritization ofthe sector in the country (30th), with effective market-ing and branding campaigns for attracting tourists and
Table 4: The Travel & Tourism Competitiveness Index 2011: The Americas
SUBINDEXES
T&T business environment T&T human, cultural, OVERALL INDEX T&T regulatory framework and infrastructure and natural resources
Country/Economy Regional rank Overall rank Score Rank Score Rank Score Rank Score
United States 1 6 5.30 44 5.01 3 5.42 1 5.48
Canada 2 9 5.29 25 5.28 5 5.38 7 5.21
Barbados 3 28 4.84 20 5.45 21 4.99 47 4.07
Mexico 4 43 4.43 74 4.48 61 3.91 13 4.90
Costa Rica 5 44 4.43 47 4.92 58 3.95 33 4.43
Puerto Rico 6 45 4.42 40 5.05 38 4.55 88 3.65
Brazil 7 52 4.36 80 4.40 75 3.55 11 5.13
Panama 8 56 4.30 52 4.84 52 4.08 57 3.97
Chile 9 57 4.27 48 4.91 56 3.99 62 3.89
Uruguay 10 58 4.24 30 5.19 71 3.62 60 3.93
Argentina 11 60 4.20 72 4.51 70 3.66 35 4.41
Jamaica 12 65 4.12 55 4.79 59 3.93 87 3.65
Peru 13 69 4.04 87 4.30 82 3.40 34 4.42
Dominican Republic 14 72 3.99 63 4.66 69 3.66 89 3.65
Colombia 15 77 3.94 102 4.17 92 3.30 39 4.36
Trinidad and Tobago 16 79 3.91 100 4.18 51 4.13 111 3.42
Guatemala 17 86 3.82 103 4.08 81 3.40 58 3.96
Ecuador 18 87 3.79 93 4.24 93 3.26 64 3.87
Honduras 19 88 3.79 90 4.27 80 3.41 77 3.68
El Salvador 20 96 3.68 84 4.35 79 3.49 124 3.19
Guyana 21 98 3.62 91 4.25 99 3.10 102 3.50
Nicaragua 22 100 3.56 105 3.99 104 3.03 84 3.66
Venezuela 23 106 3.46 120 3.67 96 3.15 99 3.55
Bolivia 24 117 3.35 133 3.36 111 2.87 67 3.82
Paraguay 25 123 3.26 107 3.95 122 2.72 130 3.11
Note: Suriname is not covered anymore this year.
1.1: The
Trave
l & Tou
rism Com
petit
iven
ess Inde
x 20
11
14
The Travel & Tourism Competitiveness Report 2011 © 2011 World Economic Forum

1.1: The
Trave
l & Tou
rism Com
petit
iven
ess Inde
x 20
11
15
significant efforts to collect T&T sector data in a com-prehensive and timely manner. Some areas requiringattention are the ground transport infrastructure (79th),insufficient heath and hygiene (ranked 64th), and safetyand security concerns, ranked 128th.
Costa Rica is ranked 5th in the region and 44thoverall. The country gets excellent marks for its naturalresources (ranked 6th), with several World Heritage sites,a high percentage of nationally protected areas, and itsvery diverse fauna. Given the importance of the naturalenvironment for the country’s tourism industry, it isnotable that it ranks a high 25th overall for environ-mental sustainability, an area where it has continued toimprove over the past few years. However, health andhygiene remains a concern (74th). Further, although itstourism infrastructure is relatively well developed (39th),with a strong presence of major car rental companiesand abundant hotel rooms, ground transport infrastruc-ture requires significant upgrading (93rd), particularlyroads and ports, making travel in the country somewhatdifficult.
Puerto Rico is ranked 6th in the region and 45thoverall, up eight places since the last assessment. PuertoRico has a number of strengths, which include a policyenvironment that is conducive to the development of thesector (14th) and solid efforts to ensure environmentalsustainability (14th). Puerto Rico’s air and ground trans-port infrastructure are also well assessed (ranked 31st and 19th, respectively). The quality of human resourcesis a comparative strength as well, particularly by regionalstandards, with Puerto Rico ranked 33rd on this pillar.On the other hand, its T&T competitiveness could bestrengthened by upgrading its ICT infrastructure (63rd).Other areas of concern include safety and security inthe territory (61st) and health and hygiene issues (69th).Areas of measurable improvement are Puerto Rico’s pricecompetitiveness and its affinity for Travel & Tourism.
Brazil is ranked 7th in the Americas and 52ndoverall, declining by seven places since the last assess-ment but with a stable score. The country is ranked 1stout of all countries for its natural resources and 23rd for its cultural resources, with many World Heritagesites, a great proportion of protected land area, and therichest fauna in the world. This is buttressed by a focuson environmental sustainability (ranked 29th), an areathat has been improving over recent years. Safety andsecurity has also improved impressively since the lastassessment. On the other hand, the ground transportnetwork remains underdeveloped (116th), with thequality of roads, ports, and railroads requiring improve-ments. The country also continues to suffer from a lackof price competitiveness (114th), attributable in part tohigh ticket taxes and airport charges in the country, aswell as high prices and high taxation more generally.Further, the overall policy environment is not particularlyconducive to the development of the sector (ranked114th), with discouraging rules on FDI, much time
required for starting a business, and somewhat restrictivecommitments to opening up tourism services underGATS commitments.
Chile is ranked 9th in the region and 57th overall,maintaining a very stable performance since the lastassessment. It has notable cultural resources, with sixWorld Heritage cultural sites and several internationalfairs and exhibitions held in the country. In addition,policy rules and regulations are conducive to the devel-opment of the T&T sector (12th), with few foreignownership restrictions, a liberal visa regime, and openbilateral Air Service Agreements, although the time andcost for starting new businesses remains relatively high.The country also benefits from good safety and securityby regional standards (27th). However, Chile’s T&Tcompetitiveness would be strengthened by upgradingboth its transport and tourism infrastructures and by agreater focus on developing the industry in a moreenvironmentally sustainable way.
Argentina is ranked 11th in the region, placing60th overall, up five places since the last Report.Argentina has strong natural resources (20th), with four World Heritage sites and very diverse fauna. Thecountry also benefits from a relatively high airport density, abundant seat kilometers, and a number of operating airlines, although the quality of air transportcontinues to be highlighted as a problem area (ranked115th). A number of other weaknesses are pulling the country’s overall score down. For example, severalgovernment policies—such as weak property rights and stringent rules on FDI (both ranked 134th)—arenot supporting the development of the sector. Further,environmental regulation is not sufficiently stringent(ranked 119th) or well enforced (ranked 134th), whichis of concern given the importance of natural resourcesfor the country’s tourism industry.
Venezuela, despite being ranked a high 9th for itsnatural resources (with much protected land area anddiverse fauna), is ranked third from last in the region, at106th overall. Among its significant weaknesses are alack of safety and security (ranked 134th), a low priori-tization of the tourism industry (126th), and itsextremely low rank for national affinity for Travel &Tourism (138th). In addition, infrastructure is in need of upgrading, particularly ground transport infrastructure(ranked 136th). The policy environment is also not very conducive to the development of the T&T sector.Property rights are not well protected in the country,and FDI is also not encouraged (ranked 139th, last outof all countries, for both indicators).
Asia PacificTable 5 displays the regional rankings and data for theAsia Pacific region. As the table shows, Singapore is thetop-ranked country in the region at 10th position, thesame position it held in the last edition of the Report.Singapore benefits from excellent transport infrastruc-
The Travel & Tourism Competitiveness Report 2011 © 2011 World Economic Forum

ture, with ground transport infrastructure and air trans-port infrastructure ranked 2nd and 14th, respectively.Singapore is ranked 2nd for the quality of its humanresources available to work in the country. And with thecountry’s famously well-functioning public institutions,it is perhaps not surprising that it ranks 1st out of allcountries for its policy environment, with rules and regulations that are extremely conducive to the develop-ment of its T&T industries (policies facilitating foreignownership and FDI, well-protected property rights, andfew visa restrictions). Further, Singapore is among thesafest countries of all assessed with regard to safety andsecurity, and is ranked 2nd for the overall prioritizationof Travel & Tourism in the country. Price competitive-ness also remains an area of strength compared withmany other countries at the same advanced stage ofdevelopment.
Singapore is followed in the regional rankings byHong Kong SAR at 12th overall, the same place it held in the last edition. Hong Kong’s transport is evenbetter assessed than Singapore’s, with ground transportand air transport infrastructures ranked 1st and 12th,respectively. Hong Kong gets relatively good marks forcultural resources, with many international fairs andexhibitions held in the country and strong creativeindustries. Hong Kong’s policy environment is rated
second only to Singapore’s, and the tourism sector is aclear priority (ranked 12th). Like Singapore, Hong Kongis safe from crime and violence (ranked 5th), and thecountry is unsurpassed for the quality of health andhygiene, where it ranks 1st.
Australia continues to decline in the rankings byfour more places, and is now at 13th position overall.Australia’s T&T competitiveness continues to be charac-terized by a number of clear strengths, including its richnatural resources: the country ranks 1st for its WorldHeritage natural sites, benefiting from diverse fauna anda pristine natural environment. Given the importance of the environment for much of its leisure tourism, it isnotable that the stringency and enforcement of its envi-ronmental regulations are well assessed. And given thecountry’s distance from other continents and the relatedimportance of domestic air travel to overcome the largedistances between major sites, its competitiveness is alsobuttressed by excellent air transport infrastructure (ranked3rd) as well as good general tourism infrastructure(ranked 16th). The drop in rank since the last editioncan be traced in large part to a perceived weakening ofthe focus on environmental sustainability and increasedconcerns about the availability of qualified labor in thecountry.
Table 5: The Travel & Tourism Competitiveness Index 2011: Asia Pacific
SUBINDEXES
T&T business environment T&T human, cultural, OVERALL INDEX T&T regulatory framework and infrastructure and natural resources
Country/Economy Regional rank Overall rank Score Rank Score Rank Score Rank Score
Singapore 1 10 5.23 6 5.72 4 5.39 23 4.59
Hong Kong SAR 2 12 5.19 4 5.80 13 5.19 24 4.59
Australia 3 13 5.15 36 5.08 17 5.11 4 5.28
New Zealand 4 19 5.00 13 5.60 25 4.80 22 4.60
Japan 5 22 4.94 27 5.24 32 4.72 14 4.86
Korea, Rep. 6 32 4.71 50 4.86 28 4.76 27 4.53
Malaysia 7 35 4.59 60 4.71 40 4.35 18 4.72
Taiwan, China 8 37 4.56 46 4.95 31 4.73 55 4.00
China 9 39 4.47 71 4.52 64 3.84 12 5.06
Thailand 10 41 4.47 77 4.45 43 4.32 21 4.64
Brunei 11 67 4.07 96 4.20 50 4.14 63 3.87
India 12 68 4.07 114 3.84 68 3.71 19 4.65
Indonesia 13 74 3.96 94 4.21 86 3.33 40 4.35
Vietnam 14 80 3.90 89 4.28 89 3.31 46 4.12
Sri Lanka 15 81 3.87 79 4.41 83 3.40 68 3.81
Azerbaijan 16 83 3.85 59 4.72 87 3.33 105 3.49
Kazakhstan 17 93 3.70 65 4.59 88 3.32 123 3.19
Philippines 18 94 3.69 98 4.18 95 3.18 75 3.69
Mongolia 19 101 3.56 97 4.20 112 2.82 86 3.65
Kyrgyz Republic 20 107 3.45 95 4.21 132 2.59 100 3.54
Cambodia 21 109 3.44 110 3.92 118 2.73 81 3.67
Nepal 22 112 3.37 106 3.97 128 2.62 101 3.52
Tajikistan 23 118 3.34 88 4.28 130 2.60 128 3.13
Pakistan 24 125 3.24 129 3.45 102 3.06 122 3.21
Bangladesh 25 129 3.11 130 3.45 113 2.82 131 3.05
Timor-Leste 26 134 2.99 123 3.64 138 2.42 134 2.90
1.1: The
Trave
l & Tou
rism Com
petit
iven
ess Inde
x 20
11
16
The Travel & Tourism Competitiveness Report 2011 © 2011 World Economic Forum

1.1: The
Trave
l & Tou
rism Com
petit
iven
ess Inde
x 20
11
17
New Zealand is ranked 4th in the region and 19th overall, up one position since the last edition. Thecountry benefits from its rich natural resources, with anumber of World Heritage natural sites (ranked 17th) anda pristine natural environment (ranked 3rd), protectedby strong and well-enforced environmental legislation.The overall policy rules and regulations in the countryare conducive to the development of the sector (ranked3rd), with very transparent policymaking and among theleast time and lowest cost required to start a businessinternationally. Although the country’s ground transportnetwork remains somewhat underdeveloped, its airtransport infrastructure gets excellent marks (ranked11th), and both the tourism and ICT infrastructures are quite good by international standards. New Zealandalso benefits from high-quality human resources (ranked14th) and a very safe and secure environment overall(14th).
Japan is ranked 5th regionally and 22nd out of all countries in the TTCI, up three places since the lastassessment. Japan benefits from its cultural resources(ranked 12th), attributable to its 29 World Heritage cultural sites, the many international fairs and exhibi-tions held in the country, and its rich creative industries.Its ground transport infrastructure is among the best in the world (ranked 6th), especially railroads, and Japancontinues to be a leader in the area of education andtraining (ranked 12th). However, Japan ranks third fromthe bottom for the affinity of the country for Travel &Tourism (131st), and it struggles with prices that are notcompetitive by international standards (ranked 137th).
Korea, Rep. is ranked 32nd, just ahead of Malaysiain the regional rankings. Korea’s strengths lie in itsexcellent ground transport and ICT infrastructure(ranked 18th and 8th, respectively) and its rich culturalresources (ranked an impressive 5th). On the other hand,its overall T&T competitiveness is held back by a weakaffinity for Travel & Tourism (ranked a low 120th), lowprioritization of the sector more generally (94th), and its relative costliness as a destination (ranked 96th).
Malaysia is ranked 7th regionally and 35th overall,down three positions since the 2009 T&T Report.Malaysia benefits from its rich natural resources (ranked22nd) and its cultural resources (ranked 33rd). Thecountry also benefits from excellent price competitive-ness (ranked 3rd), with low comparative hotel and fuelprices, low ticket taxes and airport charges, very com-petitive hotel prices, and a favorable tax regime. Malaysia’spolicy environment is assessed as conducive to the devel-opment of the sector (ranked 21st), and the country ischaracterized by a strong affinity for Travel & Tourismmore generally (ranked 17th). With regard to weaknesses,health and hygiene indicators lag behind those of manyother countries in the region, with, in particular, a lowphysician density (placing the country 96th).
China, ranked 9th regionally, has continued itsascent in the rankings, moving up an additional eight
places to 39th overall this year. China has been buildingon a number of clear strengths: it is ranked 5th for itsnatural resources, with many World Heritage naturalsites and fauna that are among the richest in the world.It is ranked 16th for its cultural resources, with severalWorld Heritage cultural sites, many international fairsand exhibitions held in the country, and creative indus-tries that are unsurpassed. Moreover, the country isranked 24th in price competitiveness. In addition, Chinahas a relatively good air transport infrastructure (ranked35th). However, there are some weaknesses pulling thecountry’s ranking down. China has a policy environmentthat is not conducive for T&T development (ranked80th), although this is an area that has improved some-what since the last assessment. Furthermore, policiesrelated to environmental sustainability, while alsoimproving, require further attention (95th). There arealso some concerns related to health and hygiene (96th).Ground transport infrastructure gets middling marks(59th), and the country’s tourism infrastructure remainsunderdeveloped (ranked 95th), with few hotel roomsavailable and few ATMs.
Thailand is ranked 10th in the region and 41stoverall, down two places since the last edition. It isendowed with rich natural resources and a strong affinityfor Travel & Tourism (ranked 21st and 24th, respectively),with a very friendly attitude of the population towardtourists (ranked 8th). This is buttressed by the govern-ment’s strong prioritization of the sector (ranked 16th),with good destination-marketing campaigns and pricecompetitiveness. However, some weaknesses remain:despite the prioritization of the sector by the govern-ment, some aspects of the regulatory environment—such as stringent foreign ownership restrictions, visarestrictions for many travelers, and the long timerequired for starting a business in the country—are notparticularly conducive to developing the sector (ranked76th). In addition, given the importance of the naturalenvironment for the country’s tourism, environmentalsustainability should be a greater priority (ranked 97th).
India is ranked 12th in the region and 68th overall,down six places since the last edition. As with China,India is well assessed for its natural resources (ranked8th) and cultural resources (24th), with many WorldHeritage sites, both natural and cultural, rich fauna, manyfairs and exhibitions, and strong creative industries. Indiaalso has quite good air transport (ranked 39th), particu-larly given the country’s stage of development, and rea-sonable ground transport infrastructure (ranked 43rd).However, some aspects of its tourism infrastructureremain somewhat underdeveloped (ranked 89th), withvery few hotel rooms per capita by international com-parison and low ATM penetration. Another area of concern is the policy environment, which has weakenedmeasurably since the last assessment and is now ranked128th, with much time and cost for starting a business,bilateral Air Service Agreements that are not assessed as
The Travel & Tourism Competitiveness Report 2011 © 2011 World Economic Forum

1.1: The
Trave
l & Tou
rism Com
petit
iven
ess Inde
x 20
11
18
open, and visas required for most visitors. Other areasrequiring attention are health and hygiene standards(112th) and the country’s human resources base (96th).
Indonesia is ranked 13th in the regional rankingsand 74th overall, up seven places since the last edition.In terms of strengths, Indonesia places 17th for its natu-ral resources, with several World Heritage natural sitesand the richness of its fauna as measured by the knownspecies in the country. Indonesia also has rich culturalresources (ranked 39th), with eight World Heritage cultural sites, a number of international fairs and exhibi-tions held in the country, and strong creative industries.Further, the country is ranked 4th overall on price competitiveness in the T&T industry because of itscompetitive hotel prices (ranked 6th), low ticket taxesand airport charges, and favorable fuel prices. In addi-tion, it is ranked 15th for its national prioritization ofTravel & Tourism. However, these strengths are heldback by underdeveloped infrastructure in the country,including to a certain extent air transport (58th) andespecially ground transport (82nd), tourism infrastructure(116th), and ICT infrastructure (96th), representing sig-nificant investment opportunities in the country. Thereare also some concerns related to safety and security,particularly a lack of trust of police services and thebusiness costs of potential terrorism. In addition, thecountry is not ensuring the sustainable development ofthe tourism sector (ranked 127th), an area of particularconcern given the sector’s dependence on the quality ofthe natural environment.
Vietnam is ranked 14th in the region and 80thoverall, up nine places since the last assessment. It benefits from its rich cultural resources (ranked 36th),with several World Heritage cultural sites, several inter-national fairs and exhibitions, and strong creative indus-tries. Another attraction is Vietnam’s natural resources,ranked 24th for its World Heritage natural sites, andwith very diverse fauna in the country. These attributesare reinforced by the country’s price competitiveness(16th). In order to strengthen its T&T competitiveness,Vietnam must further develop its transport infrastructureand its tourism infrastructure (110th), while ensuringthat the sector is developed in an environmentally sus-tainable way (115th).
The Philippines is ranked 18th regionally and 94th overall, down eight places since the last edition,with a weaker performance across most areas measuredby the Index. Among the country’s strengths are aspectsof its natural resources: it is ranked 24th for the numberof World Heritage natural sites and 40th for the totalknown species in the country. The Philippines also ben-efits from excellent price competitiveness (ranked 20th),with low prices overall, particularly hotel prices, and lowticket taxes and airport charges. There are also someaspects of the policy rules and regulations regime thatare conducive to the development of the sector, such asfew visa requirements for foreign visitors (ranked 3rd)
and bilateral Air Service Agreements that are assessed as comparatively open (29th), although other areas—such as the protection of property rights, rules related to foreign investment, and the difficulty of starting abusiness in the country—remain a challenge. Othermatters of concern are safety and security (ranked 109th);health and hygiene levels (97th); and transport, tourism,and ICT infrastructures that require upgrading.
The Middle East and North AfricaTable 6 shows the regional rankings for the Middle East and North Africa region. Note that these rankingswere established prior to the political unrest experiencedin North Africa in early 2011. As the table shows, theUnited Arab Emirates (UAE) continues to lead theregion at 30th overall, up three places since the lastassessment. While the UAE is not endowed with richnatural resources (116th), it sees a significant improve-ment in the assessment of its cultural resources (34th, up from 84th). In addition, the country is characterizedby a strong affinity for Travel & Tourism (25th). TheUAE’s infrastructure also gets good marks, particularlyits air transport infrastructure, which is ranked a veryhigh 4th out of all countries assessed. The government is seen as prioritizing the sector strongly (ranked 8th)and carrying out very effective destination-marketingcampaigns (ranked 1st). An area of clear improvementover recent years is in the rules and regulations, whichhave been adjusted to better support the sector’s devel-opment, with the UAE moving up from 81st place inthe 2009 Report to 38th place this year.
Bahrain is ranked 2nd in the region and 40th over-all, up one place since the last assessment. The countrybenefits from good transport infrastructure, particularlyground transport infrastructure (ranked 11th), and froma well-developed tourism infrastructure (ranked 26th).Bahrain also has high-quality human resources to call on in the country (29th), along with high levels of safetyand security. On the other hand, policy rules and regula-tions could be more supportive of the sector’s develop-ment (ranked 58th), and environmental sustainabilityremains a particular area of concern (123rd).
Qatar is ranked 3rd in the region and 42nd overall,down five places since the 2009 T&T Report. Qatarbenefits from a safe and secure environment (ranked28th), high-quality human resources in the country(ranked 18th), good tourism infrastructure (34th), andexcellent air transport infrastructure (21st), in line withits increasing role as an air transportation hub. In orderto further improve the country’s T&T competitiveness,the country should continue to improve its policy envi-ronment and also to focus on environmental sustainabil-ity (67th).
Israel is ranked 4th in the region, dropping 10 placesto 46th overall. Israel benefits from its cultural attributes,including a number of World Heritage cultural sites. Thecountry’s human resources base is also well evaluated
The Travel & Tourism Competitiveness Report 2011 © 2011 World Economic Forum

(31st), providing healthy and well-trained people to workin the T&T sector. Further, its ICT infrastructure is quitewell developed compared with those of other countriesin the region. But although Israel gets excellent marksrelated to health and hygiene (ranked 16th), some aspectsof safety and security continue to be worriesome, primarily related to concerns about terrorism (ranked105th). The decline in rank since the last assessment is in large part attributable to a weakening in the policyenvironment, and a sense that the sector is no longerbeing prioritized as strongly as in the past.
Tunisia is ranked 5th in the region and 47th over-all, down three places since the last edition. Tunisia ben-efits from its strong prioritization of Travel & Tourism(8th), with high government spending on the sector,effective destination-marketing campaigns, and impres-sive efforts to collect tourism data in a comprehensiveand timely manner. In addition, the country continuesto benefit from its price competitiveness, ranked 9th,with competitive hotel prices, reasonable taxation, andlow prices more generally. On the other hand, healthand hygiene remains an area of concern (79th), with arelatively low physician density and a low concentrationof hospital beds, and access to improved sanitation andwater that could be improved. The country’s ICT infra-structure also remains underdeveloped (ranked 76th).The effects of the recent political unrest in the countryare not captured by the present assessment, which weexpect to become apparent in the next Report.
Lebanon enters the Index for the first time, ranking 9th in the region and 70th overall. The country
has a number of cultural attributes, such as five WorldHeritage cultural sites and some creative industries.Perhaps more importantly, Lebanon is ranked 1st out of all countries for its affinity for Travel & Tourism, with tourism accounting for a significant amount ofeconomic activity, a very positive attitude toward foreign travelers, and an appreciation of the value of thecountry’s attributes for tourism. And indeed, tourisminfrastructure is well developed in the country (ranked29th). On the other hand, in order to further improveLebanon’s T&T competitiveness, ground transport infra-structure should be further developed (ranked 100th),safety and security issues must be addressed (123rd), andpolicy rules and regulations should be more generallyreviewed in order to better support the sector’s develop-ment (98th). Looking forward, environmental sustain-ability will also need to be taken into account (125th).
Egypt is ranked 10th regionally, dropping 11 posi-tions to reach 75th overall. While the effects of therecent political turmoil are not yet captured by the datadiscussed here, in the short term it is clear that politicalstability will be crucial to buttressing the country’s T&T competitiveness. The TTCI points to a number of longer-term issues that must be addressed. Egypt’sinfrastructure needs improvement, particularly itstourism infrastructure (74th), its ground transport infra-structure (88th), and its ICT infrastructure (93rd), allareas that have weakened on a comparative basis sincethe last assessment. A focus on improving education and training in the country, ranked 87th, would alsoimprove the country’s overall T&T competitiveness. On
Table 6: The Travel & Tourism Competitiveness Index 2011: The Middle East and North Africa
SUBINDEXES
T&T business environment T&T human, cultural, OVERALL INDEX T&T regulatory framework and infrastructure and natural resources
Country/Economy Regional rank Overall rank Score Rank Score Rank Score Rank Score
United Arab Emirates 1 30 4.78 57 4.77 9 5.32 42 4.24
Bahrain 2 40 4.47 62 4.66 20 5.06 78 3.68
Qatar 3 42 4.45 43 5.02 34 4.68 90 3.64
Israel 4 46 4.41 41 5.04 42 4.33 65 3.87
Tunisia 5 47 4.39 31 5.17 54 4.05 59 3.94
Oman 6 61 4.18 61 4.67 47 4.18 76 3.69
Saudi Arabia 7 62 4.17 81 4.38 41 4.35 70 3.77
Jordan 8 64 4.14 37 5.08 72 3.61 74 3.73
Lebanon 9 70 4.03 78 4.42 63 3.86 69 3.80
Egypt 10 75 3.96 70 4.53 74 3.59 71 3.77
Morocco 11 78 3.93 69 4.55 77 3.50 73 3.74
Kuwait 12 95 3.68 108 3.94 60 3.92 126 3.18
Syria 13 105 3.49 101 4.17 109 2.91 113 3.39
Algeria 14 113 3.37 112 3.87 110 2.89 116 3.35
Iran, Islamic Rep. 15 114 3.37 131 3.43 103 3.03 91 3.64
Libya 16 124 3.25 122 3.64 107 2.92 125 3.18
1.1: The
Trave
l & Tou
rism Com
petit
iven
ess Inde
x 20
11
19
The Travel & Tourism Competitiveness Report 2011 © 2011 World Economic Forum

a positive note, looking forward, the Index highlightsthe many strengths on which the country can build itsT&T competitiveness. Egypt is rich in cultural heritage,with seven World Heritage cultural sites and severalinternational fairs and exhibitions held in the country. Inaddition to its cultural attributes, it has been benefitingfrom excellent price competitiveness, ranked 5th, withcompetitive hotel prices, low fuel costs, and low pricesmore generally.
Morocco is ranked 11th in the regional rankingsand 78th overall. Morocco also receives a good evalua-tion for aspects of its cultural resources, and is notablyranked 23rd for its many World Heritage cultural sites.In addition, the country is seen to be prioritizing thedevelopment of the sector (ranked 23rd), and is charac-terized by a strong affinity for Travel & Tourism moregenerally. Moreover, the government is seen to be mak-ing efforts to develop the T&T sector in a sustainableway. In order to improve the industry’s competitivenessfurther, efforts should be made to improve health andhygiene levels in the country (104th) and upgrade edu-cation and training (102nd), as well as make additional
improvements to the country’s transport and tourisminfrastructure. Safety and security also remain an area of concern.
Sub-Saharan AfricaTable 7 shows the rankings for sub-Saharan Africa.Mauritius remains the highest-ranked country in thisregion at 53rd overall, despite dropping 13 places in therankings since the last assessment. Mauritius is ranked1st out of all countries for the overall prioritization ofthe sector, with high government spending on thetourism industry (ranked 3rd), ensuring excellent desti-nation-marketing campaigns to attract tourists (ranked8th), and collecting tourism data in a timely fashion.Mauritius is ranked 4th for the country’s overall affinityfor Travel & Tourism, with the sector representing an important part of the economy and thegeneral attitude of the population to foreign travelersbeing extremely welcoming. The country’s tourisminfrastructure is well developed by regional standards(47th), and its policy environment is supportive of thedevelopment of the sector (ranked 27th). Mauritius also
Table 7: Travel & Tourism Competitiveness Index 2011: Sub-Saharan Africa
SUBINDEXES
T&T business environment T&T human, cultural, OVERALL INDEX T&T regulatory framework and infrastructure and natural resources
Country/Economy Regional rank Overall rank Score Rank Score Rank Score Rank Score
Mauritius 1 53 4.35 28 5.24 48 4.15 79 3.67
South Africa 2 66 4.11 82 4.37 62 3.88 49 4.06
Namibia 3 84 3.84 83 4.37 67 3.71 109 3.45
Cape Verde 4 89 3.77 85 4.33 73 3.61 114 3.39
Botswana 5 91 3.74 86 4.32 85 3.34 98 3.56
Gambia, The 6 92 3.70 76 4.46 90 3.31 117 3.35
Rwanda 7 102 3.54 75 4.46 120 2.73 110 3.43
Kenya 8 103 3.51 113 3.87 106 2.93 72 3.75
Senegal 9 104 3.49 111 3.90 108 2.92 82 3.67
Ghana 10 108 3.44 115 3.82 105 3.01 104 3.49
Tanzania 11 110 3.42 121 3.67 127 2.62 56 3.97
Zambia 12 111 3.40 104 4.02 131 2.60 95 3.58
Uganda 13 115 3.36 116 3.75 125 2.65 80 3.67
Swaziland 14 116 3.35 99 4.18 101 3.07 136 2.81
Zimbabwe 15 119 3.31 118 3.71 126 2.64 96 3.57
Benin 16 120 3.30 119 3.68 117 2.75 106 3.47
Malawi 17 121 3.30 109 3.93 133 2.54 112 3.42
Ethiopia 18 122 3.26 132 3.42 114 2.81 97 3.56
Cameroon 19 126 3.18 127 3.49 129 2.61 108 3.45
Madagascar 20 127 3.18 126 3.49 116 2.76 120 3.29
Mozambique 21 128 3.18 124 3.64 119 2.73 127 3.15
Nigeria 22 130 3.09 134 3.22 115 2.76 119 3.30
Côte d’Ivoire 23 131 3.08 135 3.22 124 2.67 115 3.36
Burkina Faso 24 132 3.06 117 3.71 135 2.50 132 2.99
Mali 25 133 3.05 128 3.47 137 2.42 121 3.26
Lesotho 26 135 2.95 125 3.54 123 2.70 138 2.63
Mauritania 27 136 2.85 136 3.16 136 2.44 133 2.95
Burundi 28 137 2.81 137 3.08 134 2.52 135 2.82
Angola 29 138 2.80 138 3.07 121 2.72 139 2.61
Chad 30 139 2.56 139 2.88 139 2.09 137 2.70
1.1: The
Trave
l & Tou
rism Com
petit
iven
ess Inde
x 20
11
20
The Travel & Tourism Competitiveness Report 2011 © 2011 World Economic Forum

1.1: The
Trave
l & Tou
rism Com
petit
iven
ess Inde
x 20
11
21
benefits from price competitiveness (ranked 18th), withrelatively low prices overall and taxation that is notoverly burdensome, although this would be improvedthrough lower ticket taxes and airport charges, and morecompetitive hotel prices. Safety and security levels arealso good by regional standards (ranked 45th). In termsof challenges, although the government is seen to bemaking an effort to develop the industry in a sustainableway (ranked 10th), this effort could be backed up bymore stringent and well-enforced environmental regula-tions (ranked 60th and 55th, respectively). The drop inrank is attributable to declines across most areas meas-ured by the Index, and particularly those measuring thequality of infrastructure, including transport, tourism,and ICT infrastructures.
South Africa is ranked 2nd in the region and 66thoverall, joining Mauritius as one of the only two sub-Saharan African countries in the top half of the overallrankings. South Africa comes in at a high 14th for itsnatural resources and 55th for its cultural resources,based on its many World Heritage sites, its rich fauna, its creative industries, and the many international fairsand exhibitions held in the country. The 2010 FIFAWorld Cup has reinforced South Africa’s position as akey international tourist destination. South Africa alsobenefits from price competitiveness (37th), with reason-ably priced hotel rooms and a favorable tax regime.Infrastructure in South Africa is also well developed forthe region, with air transport infrastructure ranked 43rdand a particularly good assessment of railroad quality(47th) and road quality (43rd). Overall, policy rules andregulations are conducive to the sector’s development(ranked 31st); this is an area where the country hasimproved since the last assessment, with well-protectedproperty rights and few visa requirements for visitors.Indeed, in 2010 the government selected tourism as one of the five priority sectors in its growth plan andhas been reviewing tourism legislation in an effort tostreamline it further. However, there are also some areasof weakness that have brought down the country’s over-all ranking. Safety and security remains of serious concern(ranked 129th), as is the level of health and hygiene,where South Africa is ranked 88th as a result of its lowphysician density and concerns about access to improvedsanitation in particular. Related to this, health indicatorsare extremely worrisome. South Africa’s life expectancy islow (albeit improving), at 53 years, placing the country124th overall, a ranking related in large part to the veryhigh rates of communicable diseases such as HIV/AIDS.Improving the health of the workforce is of urgent con-cern for the future of the T&T sector, as well as for allother sectors in the economy.
Namibia follows South Africa in the regional rank-ings, placing 84th overall. The country benefits from itsrich natural resources, with rich fauna and a pristinenatural environment. Indeed, environmental sustainabilityis prioritized in the country (ranked 22nd), which is
critical given the importance of the quality of the envi-ronment for Namibia’s tourism. In addition, groundtransport infrastructure is well developed by regionalstandards (44th). In order to further develop the sector, amore conducive policy environment will be important.For example, despite efforts in recent years, it remainscostly and time consuming to start a business in thecountry. Health and hygiene is also not up to interna-tional standards (106th): the country has few doctorsand insufficient access to improved sanitation and drink-ing water. More generally, improving the country’shuman resources base through better education andtraining and more conducive labor laws will be critical.
Botswana is ranked 5th in the region at 91st overall,down 12 places after a significant improvement in thelast edition of the Index. The country, known for itsbeautiful natural parks, is ranked 33rd out of all coun-tries for its natural resources, with much nationally protected land area (ranked 6th), rich fauna, and a lackof environmental damage. The country also benefitsfrom excellent price competitiveness, where it is ranked8th because of low ticket taxes and airport charges, afavorable tax regime, and low prices more generally. Inaddition, some aspects of the policy environment aresupportive of the sector’s development, including well-protected property rights and few visa restrictions.However, Botswana does face some challenges that lead toits rather low ranking overall. The country’s bilateral AirService Agreements are not evaluated as open (105th),and, despite improvements, much time is still requiredfor starting a new business (61 days, placing the country126th). Further, Botswana’s transport infrastructure issomewhat underdeveloped, as is tourism infrastructure,with a low hotel room concentration, a limited presenceof international car rental companies, and relatively fewATMs. There are also some concerns in the area ofhealth and hygiene (100th), attributable to a low physi-cian density, limited hospital beds, and insufficient accessto improved sanitation. Associated with this, the greatestcomparative weakness relates to the health of the work-force, although it must be noted that the country’s aver-age life expectancy of 62 years represents a significantimprovement over the situation in recent years.
Kenya, a country long famous for its tourismattributes, is ranked 8th regionally and 103rd overall.Kenya is ranked 28th for its natural resources, with itstwo World Heritage natural sites and its rich diversity of fauna. Tourism is a recognized priority within thecountry (ranked 18th on this pillar), with high govern-ment spending on the sector and effective destination-marketing campaigns. In addition, there is a strong focuson environmental sustainability in the country (ranked26th), which is particularly important for Kenya giventhe sector’s dependence on the natural environment. Onthe downside, the policy environment is not at presentsufficiently conducive to the development of the sector(ranked 103rd), with bilateral Air Service Agreements
The Travel & Tourism Competitiveness Report 2011 © 2011 World Economic Forum

1.1: The
Trave
l & Tou
rism Com
petit
iven
ess Inde
x 20
11
22
that are not open, insufficiently protected property rights,and much time and cost required for starting a business.In addition, infrastructure remains underdeveloped andhealth and hygiene levels require improvement. Finally,the security situation in the country remains a signifi-cant hindrance to further developing the sector (ranked139th).
Tanzania is ranked 11th in the region and 110thoverall, down 12 places since the last assessment.Tanzania places 2nd worldwide for its natural environ-ment, with several World Heritage natural sites, richfauna, and much protected land area. This is buttressedby some focus in the country on environmental sustain-ability (ranked 43rd), although there has been a weaken-ing in this area since the last assessment. On the otherhand, the country’s policy environment is not sufficientlysupportive of the development of the sector, and in factis measurably less so than it was in the last edition of the Index, continuing a downward trend from previousyears. Other issues of concern are security levels in thecountry, and a focus must be placed on improving thehealth of the workforce, upgrading the educational sys-tem, and improving all types of infrastructure on whichthe industry is dependent.
Zimbabwe is ranked 15th in the region and 119thoverall, an improvement of two places since the lastassessment. This continues to be a low ranking for acountry that was, until recently, a popular tourist desti-nation. Indeed, Zimbabwe is ranked a remarkable 13thfor natural resources overall, with a number of WorldHeritage natural sites, much nationally protected landarea, and rich fauna. Despite these strengths, which haveattracted tourists to Zimbabwe over the years, the Indexmainly highlights the country’s weaknesses in otherareas. After years of political mismanagement, the policyenvironment is among the worst in the world (ranked136th), with extremely poor assessments for laws relatedto FDI and property rights, and where starting a busi-ness is extremely difficult and costly. Safety and securityis also a major concern, with high crime and violenceand a lack of trust in the reliability of police services toprovide protection from crime (126th), reflecting thegeneral breakdown in law and order in the country inrecent years. There are also concerns related to humanresources, with low enrollment rates in primary and secondary education by international standards, andamong the worst health indicators in the world: whilelife expectancy has been increasing in many other countries in the region, it continues to decline inZimbabwe, and is now just 42 years in the country,placing it 139th—last of all countries covered.
ConclusionsWe have looked at the T&T competitiveness of 139economies, spanning all regions of the world, based on the World Economic Forum’s Travel & Tourism
Competitiveness Index (TTCI). The TTCI representsour best efforts to capture the complex phenomenon of T&T competitiveness, demonstrating that a wholearray of reforms and improvements in different areas are required for improving the T&T competitiveness ofnations.
By highlighting success factors and obstacles toT&T competitiveness in economies around the world,the TTCI is a tool that can be used to identify the com-petitive strengths of individual economies as well as thebarriers that impede the development of the sector. Italso allows countries to track their progress over time on those indicators of interest.
We will continue to publish The Travel & TourismCompetitiveness Report on a biennial basis, ensuring thatthe TTCI can continue to be used as a platform for dialogue between the business community and nationalpolicymakers working together to improve the T&Tcompetitiveness of their respective economies, and thusimproving the growth prospects and prosperity of theircitizens.
Note1 However, IATA notes that it will be important to temper thisrecent optimism given that, despite a marked consolidation of the industry and good management of stock, 2011 will likely seea decrease in the sector’s growth because of lingering high ratesof unemployment and low consumer spending and confidence in Europe and North America. In addition, a surge of aircraft deliv-eries in 2011 will fuel capacity expansion. In this context, IATAestimates that profitability of the air transport industry will fallsomewhat in 2011. For further details on IATA’s projections, seeIATA 2010.
ReferencesBlanke, J. and T. Chiesa. 2007. “The Travel & Tourism Competitiveness
Index: Assessing Key Factors Driving the Sector’s Development.”In The Travel & Tourism Competitiveness Report 2007: Furtheringthe Process of Economic Development. Geneva: World EconomicForum. 3–25.
———. 2008. “The Travel & Tourism Competitiveness Index: MeasuringKey Elements Driving the Sector’s Development.” In The Travel &Tourism Competitiveness Report 2008: Balancing EconomicDevelopment and Environmental Sustainability. Geneva: WorldEconomic Forum. 3–26.
Blanke, J., T. Chiesa, and E. Trujillo Herrera. 2009. “The Travel &Tourism Competitiveness Index 2009: Measuring Sectoral Driversin a Downturn.” In The Travel & Tourism Competitiveness Report2009: Managing in a Time of Turbulence. Geneva: WorldEconomic Forum. 3–37.
IATA (International Air Transport Association). 2010. “ImprovedProfitability but Margins Still Pathetic: Europe Continues to Lag.”Press Release 57, December 14. Available at http://www.iata.org/pressroom/pr/Pages/2010-12-14-01.aspx.
WTTC (World Travel & Tourism Council). 2010. TSA Research.
UNWTO (World Tourism Organization). 2010. World Tourism Barometer.October 2010 8 (3). October 2010. Madrid: UNWTO. Available athttp://www.unwto.org/facts/eng/barometer.htm.
The Travel & Tourism Competitiveness Report 2011 © 2011 World Economic Forum

23
1.1: The
Trave
l & Tou
rism Com
petit
iven
ess Inde
x 20
11
This appendix provides details about the construction ofthe Travel & Tourism Competitiveness Index (TTCI).
The TTCI is composed of three subindexes: theT&T regulatory framework subindex; the T&T businessenvironment and infrastructure subindex; and the T&Thuman, cultural, and natural resources subindex.
These subindexes are, in turn, composed of the 14 pillars of T&T competitiveness shown below: namely,policy rules and regulations, environmental sustainability,safety and security, health and hygiene, prioritization of Travel & Tourism, air transport infrastructure, groundtransport infrastructure, tourism infrastructure, ICTinfrastructure, price competitiveness in the T&T industry,human resources, affinity for Travel & Tourism, naturalresources, and cultural resources. The numbering of thevariables matches the numbering of the data tables. Thenumber preceding the period indicates to which pillarthe variable belongs (e.g., variable 1.01 belongs to thefirst pillar).
The pillars are calculated from both variablesderived from the Executive Opinion Survey (Survey)and data from other sources. The Survey data comprisethe responses to the World Economic Forum’s ExecutiveOpinion Survey and range from 1 to 7; other data werecollected from various sources, which are described inthe Technical Notes and Sources section at the end ofthe Report.These data are identified by an asterisk (*) inthe following pages. To make the aggregation possible,these variables are transformed into a 1-to-7 scale inorder to align them with the Survey results. We apply amin-max transformation, which preserves the order of,and the relative distance between, country scores.1
Each of the pillars has been calculated as anunweighted average of the individual component vari-ables. The subindexes are then calculated as unweightedaverages of the included pillars. In the case of thehuman resources pillar, which is itself composed of twosubpillars (education and training and availability ofqualified labor), the overall pillar is the unweighted aver-age of the two subpillars.
The overall TTCI is then the unweighted averageof the three subindexes. The variables of each pillar andsubpillar are listed below.
Subindex A: T&T regulatory framework
Pillar 1: Policy rules and regulations1.01 Prevalence of foreign ownership1.02 Property rights1.03 Business impact of rules on FDI1.04 Visa requirements*1.05 Openness of bilateral Air Service Agreements*1.06 Transparency of government policymaking1.07 Time required to start a business*1.08 Cost to start a business*1.09 GATS commitments restrictiveness index of T&T
services*
Pillar 2: Environmental sustainability2.01 Stringency of environmental regulation2.02 Enforcement of environmental regulation2.03 Sustainability of T&T industry development2.04 Carbon dioxide emissions*2.05 Particulate matter concentration*2.06 Threatened species*2.07 Environmental treaty ratification*
Pillar 3: Safety and security3.01 Business costs of terrorism3.02 Reliability of police services3.03 Business costs of crime and violence3.04 Road traffic accidents*
Pillar 4: Health and hygiene4.01 Physician density*4.02 Access to improved sanitation*4.03 Access to improved drinking water*4.04 Hospital beds*
Pillar 5: Prioritization of Travel & Tourism5.01 Government prioritization of the T&T industry5.02 T&T government expenditure*5.03 Effectiveness of marketing and branding to attract
tourists5.04 Comprehensiveness of annual T&T data*2
5.05 Timeliness of providing monthly/quarterly T&T data*2
Subindex B: T&T business environment and infrastructure
Pillar 6: Air transport infrastructure6.01 Quality of air transport infrastructure6.02 Available seat kilometers, domestic*3
6.03 Available seat kilometers, international*3
6.04 Departures per 1,000 population*6.05 Airport density*6.06 Number of operating airlines*6.07 International air transport network*
Pillar 7: Ground transport infrastructure7.01 Quality of roads7.02 Quality of railroad infrastructure7.03 Quality of port infrastructure7.04 Quality of domestic transport network7.05 Road density*
Pillar 8: Tourism infrastructure8.01 Hotel rooms*8.02 Presence of major car rental companies*8.03 ATMs accepting Visa cards*
Pillar 9: ICT infrastructure9.01 Extent of business Internet use9.02 Internet users*9.03 Telephone lines*9.04 Broadband Internet subscribers*9.05 Mobile telephone subscribers*
Appendix A: Composition of the Travel & Tourism Competitiveness Index 2011
The Travel & Tourism Competitiveness Report 2011 © 2011 World Economic Forum

Appendix A: Composition of the Travel & Tourism Competitiveness Index 2011 (cont’d.)
1.1: The
Trave
l & Tou
rism Com
petit
iven
ess Inde
x 20
11
24
Pillar 10: Price competitiveness in the T&T industry10.01 Ticket taxes and airport charges*10.02 Purchasing power parity*10.03 Extent and effect of taxation10.04 Fuel price levels*10.05 Hotel price index*
Subindex C: T&T human, cultural, and naturalresources
Pillar 11: Human resources
Education and training
11.01 Primary education enrollment*11.02 Secondary education enrollment*11.03 Quality of the educational system11.04 Local availability of specialized research and training
services11.05 Extent of staff training
Availability of qualified labor
11.06 Hiring and firing practices11.07 Ease of hiring foreign labor11.08 HIV prevalence*4
11.09 Business impact of HIV/AIDS4
11.10 Life expectancy*
Pillar 12: Affinity for Travel & Tourism12.01 Tourism openness*12.02 Attitude of population toward foreign visitors12.03 Extension of business trips recommended
Pillar 13: Natural resources13.01 Number of World Heritage natural sites*13.02 Protected areas*13.03 Quality of the natural environment13.04 Total known species*
Pillar 14: Cultural resources14.01 Number of World Heritage cultural sites*14.02 Sports stadiums*14.03 Number of international fairs and exhibitions*14.04 Creative industries exports*
Notes1 The standard formula for converting each variable that is notderived from the Survey to the 1-to-7 scale is
6 x country score – sample minimum + 1( sample maximum – sample minimum )The sample minimum and sample maximum are the lowest andhighest scores of the overall sample, respectively. For those vari-ables for which a higher value indicates a worse outcome (e.g.,road traffic accidents, fuel price levels), we rely on a normalizationformula that, in addition to converting the series to a 1-to-7 scale,reverses it, so that 1 and 7 still correspond to the worst and bestrespectively:
–6 x country score – sample minimum + 7( sample maximum – sample minimum )In some instances, adjustments were made to account forextreme outliers in the data.
2 A weight of 0.5 is applied to the variables 5.04Comprehensiveness of annual T&T data and 5.05 Timeliness ofproviding monthly/quarterly T&T data. In this way we treat themas if they were one additional variable.
3 Variables 6.02 Available seat kilometers, domestic and 6.03Available seat kilometers, international are combined to form onesingle variable.
4 The impact of HIV/AIDS on T&T competitiveness depends notonly on its respective incidence rate, but also on how costly it isfor business. Therefore, in order to estimate the impact ofHIV/AIDS, we combine its incidence rate with the Survey ques-tion on its perceived cost to businesses. To combine these datawe first take the ratio of each country’s incidence rate relative tothe highest incidence rate in the whole sample. The inverse ofthis ratio is then multiplied by each country’s score on the relatedSurvey question. This product is then normalized to a 1-to-7 scale.
Note that countries with zero reported incidences receive a 7,regardless of their scores on the related Survey question.
The Travel & Tourism Competitiveness Report 2011 © 2011 World Economic Forum

In this appendix we present the detailed rankings and scores of the Travel & Tourism Competitiveness Index for 2011for all 139 countries covered this year. This complements the regional rankings shown in the chapter.
Table B1: The Travel & Tourism Competitiveness Index 2011
SUBINDEXES
T&T business environment T&T human, cultural, OVERALL INDEX T&T regulatory framework and infrastructure and natural resources
Country/Economy Rank Score Rank Score Rank Score Rank Score
Albania 71 4.01 53 4.79 91 3.30 61 3.93Algeria 113 3.37 112 3.87 110 2.89 116 3.35Angola 138 2.80 138 3.07 121 2.72 139 2.61Argentina 60 4.20 72 4.51 70 3.66 35 4.41Armenia 90 3.77 58 4.75 100 3.09 107 3.47Australia 13 5.15 36 5.08 17 5.11 4 5.28Austria 4 5.41 3 5.89 12 5.19 10 5.13Azerbaijan 83 3.85 59 4.72 87 3.33 105 3.49Bahrain 40 4.47 62 4.66 20 5.06 78 3.68Bangladesh 129 3.11 130 3.45 113 2.82 131 3.05Barbados 28 4.84 20 5.45 21 4.99 47 4.07Belgium 23 4.92 18 5.48 35 4.66 20 4.64Benin 120 3.30 119 3.68 117 2.75 106 3.47Bolivia 117 3.35 133 3.36 111 2.87 67 3.82Bosnia and Herzegovina 97 3.63 92 4.24 97 3.14 103 3.49Botswana 91 3.74 86 4.32 85 3.34 98 3.56Brazil 52 4.36 80 4.40 75 3.55 11 5.13Brunei Darussalam 67 4.07 96 4.20 50 4.14 63 3.87Bulgaria 48 4.39 54 4.79 44 4.32 51 4.05Burkina Faso 132 3.06 117 3.71 135 2.50 132 2.99Burundi 137 2.81 137 3.08 134 2.52 135 2.82Cambodia 109 3.44 110 3.92 118 2.73 81 3.67Cameroon 126 3.18 127 3.49 129 2.61 108 3.45Canada 9 5.29 25 5.28 5 5.38 7 5.21Cape Verde 89 3.77 85 4.33 73 3.61 114 3.39Chad 139 2.56 139 2.88 139 2.09 137 2.70Chile 57 4.27 48 4.91 56 3.99 62 3.89China 39 4.47 71 4.52 64 3.84 12 5.06Colombia 77 3.94 102 4.17 92 3.30 39 4.36Costa Rica 44 4.43 47 4.92 58 3.95 33 4.43Côte d’Ivoire 131 3.08 135 3.22 124 2.67 115 3.36Croatia 34 4.61 42 5.02 36 4.58 43 4.23Cyprus 24 4.89 23 5.33 14 5.15 44 4.19Czech Republic 31 4.77 26 5.26 37 4.56 31 4.48Denmark 16 5.05 15 5.51 16 5.11 26 4.53Dominican Republic 72 3.99 63 4.66 69 3.66 89 3.65Ecuador 87 3.79 93 4.24 93 3.26 64 3.87Egypt 75 3.96 70 4.53 74 3.59 71 3.77El Salvador 96 3.68 84 4.35 79 3.49 124 3.19Estonia 25 4.88 17 5.50 19 5.09 50 4.06Ethiopia 122 3.26 132 3.42 114 2.81 97 3.56Finland 17 5.02 5 5.74 30 4.75 25 4.55France 3 5.41 7 5.71 8 5.35 9 5.18Gambia, The 92 3.70 76 4.46 90 3.31 117 3.35Georgia 73 3.98 35 5.11 94 3.21 92 3.62Germany 2 5.50 12 5.67 2 5.57 5 5.26Ghana 108 3.44 115 3.82 105 3.01 104 3.49Greece 29 4.78 34 5.11 29 4.75 29 4.48Guatemala 86 3.82 103 4.08 81 3.40 58 3.96Guyana 98 3.62 91 4.25 99 3.10 102 3.50Honduras 88 3.79 90 4.27 80 3.41 77 3.68Hong Kong SAR 12 5.19 4 5.80 13 5.19 24 4.59Hungary 38 4.54 24 5.29 45 4.28 48 4.06Iceland 11 5.19 2 5.90 6 5.36 41 4.31India 68 4.07 114 3.84 68 3.71 19 4.65Indonesia 74 3.96 94 4.21 86 3.33 40 4.35Iran, Islamic Rep. 114 3.37 131 3.43 103 3.03 91 3.64
Cont’d.
Appendix B: Travel & Tourism Competitiveness Index 2011 detailed rankings
1.1: The
Trave
l & Tou
rism Com
petit
iven
ess Inde
x 20
11
25
The Travel & Tourism Competitiveness Report 2011 © 2011 World Economic Forum

Table B1: The Travel & Tourism Competitiveness Index 2011 (cont’d.)
SUBINDEXES
T&T business environment T&T human, cultural, OVERALL INDEX T&T regulatory framework and infrastructure and natural resources
Country/Economy Rank Score Rank Score Rank Score Rank Score
Ireland 21 4.98 10 5.68 23 4.88 37 4.37Israel 46 4.41 41 5.04 42 4.33 65 3.87Italy 27 4.87 45 5.00 27 4.79 15 4.83Jamaica 65 4.12 55 4.79 59 3.93 87 3.65Japan 22 4.94 27 5.24 32 4.72 14 4.86Jordan 64 4.14 37 5.08 72 3.61 74 3.73Kazakhstan 93 3.70 65 4.59 88 3.32 123 3.19Kenya 103 3.51 113 3.87 106 2.93 72 3.75Korea, Rep. 32 4.71 50 4.86 28 4.76 27 4.53Kuwait 95 3.68 108 3.94 60 3.92 126 3.18Kyrgyz Republic 107 3.45 95 4.21 132 2.59 100 3.54Latvia 51 4.36 38 5.07 39 4.36 83 3.66Lebanon 70 4.03 78 4.42 63 3.86 69 3.80Lesotho 135 2.95 125 3.54 123 2.70 138 2.63Libya 124 3.25 122 3.64 107 2.92 125 3.18Lithuania 55 4.34 33 5.14 46 4.21 85 3.66Luxembourg 15 5.08 14 5.51 7 5.35 38 4.37Macedonia, FYR 76 3.96 56 4.78 78 3.49 93 3.62Madagascar 127 3.18 126 3.49 116 2.76 120 3.29Malawi 121 3.30 109 3.93 133 2.54 112 3.42Malaysia 35 4.59 60 4.71 40 4.35 18 4.72Mali 133 3.05 128 3.47 137 2.42 121 3.26Malta 26 4.88 9 5.69 22 4.93 54 4.02Mauritania 136 2.85 136 3.16 136 2.44 133 2.95Mauritius 53 4.35 28 5.24 48 4.15 79 3.67Mexico 43 4.43 74 4.48 61 3.91 13 4.90Moldova 99 3.60 68 4.57 98 3.11 129 3.12Mongolia 101 3.56 97 4.20 112 2.82 86 3.65Montenegro 36 4.56 32 5.15 49 4.15 36 4.38Morocco 78 3.93 69 4.55 77 3.50 73 3.74Mozambique 128 3.18 124 3.64 119 2.73 127 3.15Namibia 84 3.84 83 4.37 67 3.71 109 3.45Nepal 112 3.37 106 3.97 128 2.62 101 3.52Netherlands 14 5.13 16 5.50 18 5.10 16 4.78New Zealand 19 5.00 13 5.60 25 4.80 22 4.60Nicaragua 100 3.56 105 3.99 104 3.03 84 3.66Nigeria 130 3.09 134 3.22 115 2.76 119 3.30Norway 20 4.98 8 5.71 26 4.79 32 4.45Oman 61 4.18 61 4.67 47 4.18 76 3.69Pakistan 125 3.24 129 3.45 102 3.06 122 3.21Panama 56 4.30 52 4.84 52 4.08 57 3.97Paraguay 123 3.26 107 3.95 122 2.72 130 3.11Peru 69 4.04 87 4.30 82 3.40 34 4.42Philippines 94 3.69 98 4.18 95 3.18 75 3.69Poland 49 4.38 49 4.86 65 3.81 30 4.48Portugal 18 5.01 19 5.47 24 4.84 17 4.73Puerto Rico 45 4.42 40 5.05 38 4.55 88 3.65Qatar 42 4.45 43 5.02 34 4.68 90 3.64Romania 63 4.17 51 4.85 66 3.80 66 3.84Russian Federation 59 4.23 73 4.49 53 4.07 45 4.15Rwanda 102 3.54 75 4.46 120 2.73 110 3.43Saudi Arabia 62 4.17 81 4.38 41 4.35 70 3.77Senegal 104 3.49 111 3.90 108 2.92 82 3.67Serbia 82 3.85 67 4.57 84 3.39 94 3.60Singapore 10 5.23 6 5.72 4 5.39 23 4.59Slovak Republic 54 4.35 39 5.05 57 3.96 52 4.04Slovenia 33 4.64 29 5.19 33 4.70 53 4.03South Africa 66 4.11 82 4.37 62 3.88 49 4.06Spain 8 5.29 22 5.34 10 5.32 6 5.22Sri Lanka 81 3.87 79 4.41 83 3.40 68 3.81Swaziland 116 3.35 99 4.18 101 3.07 136 2.81Sweden 5 5.34 11 5.67 15 5.15 8 5.21Switzerland 1 5.68 1 5.99 1 5.58 2 5.48Syria 105 3.49 101 4.17 109 2.91 113 3.39
Cont’d.
Appendix B: Travel & Tourism Competitiveness Index 2011 detailed rankings (cont’d.)
1.1: The
Trave
l & Tou
rism Com
petit
iven
ess Inde
x 20
11
26
The Travel & Tourism Competitiveness Report 2011 © 2011 World Economic Forum

Table B1: The Travel & Tourism Competitiveness Index 2011 (cont’d.)
SUBINDEXES
T&T business environment T&T human, cultural, OVERALL INDEX T&T regulatory framework and infrastructure and natural resources
Country/Economy Rank Score Rank Score Rank Score Rank Score
Taiwan, China 37 4.56 46 4.95 31 4.73 55 4.00Tajikistan 118 3.34 88 4.28 130 2.60 128 3.13Tanzania 110 3.42 121 3.67 127 2.62 56 3.97Thailand 41 4.47 77 4.45 43 4.32 21 4.64Timor-Leste 134 2.99 123 3.64 138 2.42 134 2.90Trinidad and Tobago 79 3.91 100 4.18 51 4.13 111 3.42Tunisia 47 4.39 31 5.17 54 4.05 59 3.94Turkey 50 4.37 66 4.58 55 4.02 28 4.50Uganda 115 3.36 116 3.75 125 2.65 80 3.67Ukraine 85 3.83 64 4.63 76 3.53 118 3.33United Arab Emirates 30 4.78 57 4.77 9 5.32 42 4.24United Kingdom 7 5.30 21 5.35 11 5.27 3 5.28United States 6 5.30 44 5.01 3 5.42 1 5.48Uruguay 58 4.24 30 5.19 71 3.62 60 3.93Venezuela 106 3.46 120 3.67 96 3.15 99 3.55Vietnam 80 3.90 89 4.28 89 3.31 46 4.12Zambia 111 3.40 104 4.02 131 2.60 95 3.58Zimbabwe 119 3.31 118 3.71 126 2.64 96 3.57
Appendix B: Travel & Tourism Competitiveness Index 2011 detailed rankings (cont’d.)
1.1: The
Trave
l & Tou
rism Com
petit
iven
ess Inde
x 20
11
27
The Travel & Tourism Competitiveness Report 2011 © 2011 World Economic Forum

Appendix A: Structure of the Global Competitiveness Index 2008–2009
28
1.1: The
Trave
l & Tou
rism Com
petit
iven
ess Inde
x 20
11
Appendix B: Travel & Tourism Competitiveness Index 2011 detailed rankings (cont’d.)
Table B2: The Travel & Tourism Competitiveness Index: Regulatory framework
PILLARS
T&T REGULATORY 1. Policy rules 2. Environmental 3. Safety 4. Health 5. Prioritization ofFRAMEWORK and regulations sustainability and security and hygiene Travel & Tourism
Country/Economy Rank Score Rank Score Rank Score Rank Score Rank Score Rank Score
Albania 53 4.79 46 4.65 72 4.52 44 5.27 66 4.87 55 4.67Algeria 112 3.87 118 3.68 120 4.00 95 4.38 84 4.21 130 3.07Angola 138 3.07 137 2.83 119 4.02 111 4.05 129 1.81 136 2.64Argentina 72 4.51 89 4.17 130 3.84 77 4.62 40 5.71 92 4.23Armenia 58 4.75 92 4.12 111 4.12 51 5.18 37 5.88 76 4.46Australia 36 5.08 30 4.87 59 4.70 18 5.76 58 5.13 37 4.95Austria 3 5.89 28 4.95 5 5.78 10 6.14 3 6.92 16 5.67Azerbaijan 59 4.72 74 4.37 92 4.22 57 5.10 54 5.22 54 4.68Bahrain 62 4.66 58 4.53 123 3.96 32 5.47 60 5.00 84 4.35Bangladesh 130 3.45 116 3.70 135 3.65 105 4.17 114 2.63 131 3.07Barbados 20 5.45 75 4.36 30 5.06 34 5.46 33 5.95 3 6.41Belgium 18 5.48 26 5.00 13 5.53 15 5.87 14 6.55 77 4.44Benin 119 3.68 117 3.68 39 4.92 101 4.22 128 1.85 113 3.73Bolivia 133 3.36 138 2.81 128 3.90 112 4.02 110 2.74 124 3.34Bosnia and Herzegovina 92 4.24 129 3.55 108 4.14 40 5.37 61 4.99 128 3.18Botswana 86 4.32 64 4.45 58 4.71 87 4.46 100 3.54 73 4.47Brazil 80 4.40 114 3.72 29 5.06 75 4.67 73 4.61 108 3.95Brunei Darussalam 96 4.20 120 3.65 136 3.56 23 5.73 70 4.73 127 3.31Bulgaria 54 4.79 94 4.10 99 4.18 81 4.55 10 6.65 71 4.48Burkina Faso 117 3.71 104 3.82 80 4.36 93 4.39 127 1.96 104 4.01Burundi 137 3.08 133 3.09 91 4.23 132 3.40 120 2.21 138 2.48Cambodia 110 3.92 132 3.42 82 4.34 79 4.57 133 1.47 13 5.83Cameroon 127 3.49 125 3.60 96 4.20 99 4.25 116 2.51 135 2.88Canada 25 5.28 4 5.40 35 4.98 24 5.73 52 5.38 40 4.91Cape Verde 85 4.33 73 4.37 56 4.72 85 4.47 105 3.22 45 4.85Chad 139 2.88 139 2.69 89 4.24 136 3.33 138 1.07 129 3.08Chile 48 4.91 12 5.20 73 4.49 27 5.70 71 4.65 66 4.53China 71 4.52 80 4.33 95 4.21 58 5.09 96 3.89 35 5.08Colombia 102 4.17 60 4.50 77 4.41 126 3.74 95 3.93 89 4.28Costa Rica 47 4.92 66 4.43 25 5.14 63 4.94 74 4.55 19 5.52Côte d’Ivoire 135 3.22 122 3.62 104 4.16 122 3.83 126 2.01 139 2.47Croatia 42 5.02 77 4.33 46 4.87 33 5.47 32 5.97 72 4.47Cyprus 23 5.33 79 4.33 51 4.81 26 5.71 43 5.59 6 6.19Czech Republic 26 5.26 52 4.60 28 5.06 41 5.36 6 6.81 74 4.47Denmark 15 5.51 17 5.16 3 5.88 8 6.22 38 5.87 81 4.40Dominican Republic 63 4.66 32 4.84 93 4.22 116 3.95 86 4.13 7 6.15Ecuador 93 4.24 124 3.60 75 4.47 90 4.41 82 4.31 82 4.40Egypt 70 4.53 49 4.62 113 4.09 135 3.35 56 5.17 22 5.45El Salvador 84 4.35 39 4.74 63 4.63 118 3.93 92 3.95 67 4.51Estonia 17 5.50 25 5.00 24 5.19 25 5.72 24 6.20 25 5.38Ethiopia 132 3.42 93 4.12 87 4.26 102 4.20 139 1.03 119 3.52Finland 5 5.74 5 5.39 7 5.69 1 6.48 12 6.60 65 4.53France 7 5.71 22 5.03 9 5.66 20 5.76 5 6.84 28 5.26Gambia, The 76 4.46 86 4.30 44 4.88 88 4.44 103 3.31 26 5.36Georgia 35 5.11 54 4.58 69 4.54 47 5.26 31 5.99 31 5.16Germany 12 5.67 20 5.09 4 5.84 9 6.19 7 6.80 83 4.39Ghana 115 3.82 72 4.37 47 4.87 98 4.30 123 2.16 123 3.41Greece 34 5.11 82 4.32 68 4.54 73 4.70 20 6.41 17 5.57Guatemala 103 4.08 57 4.54 118 4.03 131 3.47 94 3.93 78 4.44Guyana 91 4.25 99 3.89 34 4.98 110 4.07 91 3.98 86 4.31Honduras 90 4.27 50 4.61 66 4.56 106 4.10 101 3.33 51 4.72Hong Kong SAR 4 5.80 2 5.69 109 4.13 5 6.32 1 7.00 12 5.85Hungary 24 5.29 29 4.90 31 5.04 43 5.32 18 6.46 53 4.71Iceland 2 5.90 33 4.83 15 5.42 4 6.34 4 6.91 9 6.00India 114 3.84 128 3.56 107 4.15 78 4.62 112 2.64 91 4.24Indonesia 94 4.21 88 4.18 127 3.90 72 4.70 115 2.59 15 5.68Iran, Islamic Rep. 131 3.43 112 3.74 83 4.33 121 3.86 121 2.19 133 3.05Ireland 10 5.68 7 5.33 12 5.53 12 6.10 25 6.19 29 5.26Israel 41 5.04 62 4.47 74 4.49 46 5.26 16 6.52 75 4.46Italy 45 5.00 84 4.31 60 4.69 48 5.23 27 6.16 56 4.62Jamaica 55 4.79 11 5.22 116 4.07 104 4.18 87 4.12 4 6.36Japan 27 5.24 51 4.61 52 4.79 19 5.76 22 6.29 50 4.75Jordan 37 5.08 47 4.63 54 4.78 64 4.92 57 5.14 10 5.91Kazakhstan 65 4.59 95 4.02 129 3.89 108 4.08 9 6.74 93 4.22Kenya 113 3.87 103 3.83 26 5.12 139 3.17 130 1.64 18 5.56Korea, Rep. 50 4.86 53 4.59 81 4.35 60 5.05 28 6.08 94 4.22Kuwait 108 3.94 127 3.56 139 2.95 31 5.59 62 4.99 137 2.61Kyrgyz Republic 95 4.21 96 3.99 100 4.18 120 3.90 51 5.43 118 3.53Latvia 38 5.07 59 4.51 21 5.20 53 5.16 26 6.17 87 4.30
(Cont’d.)
The Travel & Tourism Competitiveness Report 2011 © 2011 World Economic Forum

Appendix A: Structure of the Global Competitiveness Index 2008–2009 (cont’d.)
29
1.1: The
Trave
l & Tou
rism Com
petit
iven
ess Inde
x 20
11
Appendix B: Travel & Tourism Competitiveness Index 2011 detailed rankings (cont’d.)
Table B2: The Travel & Tourism Competitiveness Index: Regulatory framework (cont’d.)
PILLARS
T&T REGULATORY 1. Policy rules 2. Environmental 3. Safety 4. Health 5. Prioritization ofFRAMEWORK and regulations sustainability and security and hygiene Travel & Tourism
Country/Economy Rank Score Rank Score Rank Score Rank Score Rank Score Rank Score
Lebanon 78 4.42 98 3.91 125 3.93 123 3.82 48 5.52 39 4.91Lesotho 125 3.54 121 3.63 106 4.15 114 4.01 118 2.39 120 3.49Libya 122 3.64 135 2.98 134 3.69 100 4.22 83 4.27 132 3.07Lithuania 33 5.14 83 4.32 19 5.22 59 5.06 1 7.00 97 4.09Luxembourg 14 5.51 6 5.37 16 5.40 11 6.14 21 6.32 85 4.32Macedonia, FYR 56 4.78 78 4.33 65 4.58 42 5.36 42 5.65 106 3.99Madagascar 126 3.49 101 3.88 103 4.16 137 3.26 135 1.24 41 4.91Malawi 109 3.93 102 3.84 42 4.89 74 4.67 111 2.73 117 3.54Malaysia 60 4.71 21 5.07 64 4.61 83 4.50 75 4.53 46 4.85Mali 128 3.47 130 3.48 102 4.17 107 4.08 132 1.53 100 4.07Malta 9 5.69 69 4.39 53 4.79 6 6.27 8 6.76 5 6.24Mauritania 136 3.16 113 3.74 110 4.13 130 3.50 137 1.13 125 3.32Mauritius 28 5.24 27 4.99 62 4.64 45 5.27 68 4.83 1 6.44Mexico 74 4.48 56 4.56 114 4.08 128 3.60 64 4.93 30 5.24Moldova 68 4.57 81 4.32 78 4.39 65 4.91 49 5.50 115 3.72Mongolia 97 4.20 87 4.21 138 3.29 67 4.85 76 4.46 96 4.17Montenegro 32 5.15 10 5.25 45 4.87 37 5.40 53 5.32 42 4.89Morocco 69 4.55 48 4.62 36 4.95 84 4.50 104 3.22 23 5.44Mozambique 124 3.64 109 3.76 32 4.99 125 3.76 136 1.15 63 4.55Namibia 83 4.37 55 4.56 22 5.20 86 4.47 106 3.06 62 4.56Nepal 106 3.97 115 3.71 84 4.32 127 3.61 102 3.33 43 4.89Netherlands 16 5.50 19 5.11 10 5.62 16 5.86 19 6.42 68 4.50New Zealand 13 5.60 3 5.40 20 5.21 14 5.88 30 6.03 21 5.46Nicaragua 105 3.99 105 3.80 55 4.76 92 4.41 109 2.89 99 4.08Nigeria 134 3.22 131 3.46 61 4.69 133 3.38 131 1.61 134 2.98Norway 8 5.71 15 5.18 6 5.70 3 6.39 23 6.23 36 5.04Oman 61 4.67 41 4.72 76 4.46 17 5.78 78 4.45 109 3.94Pakistan 129 3.45 106 3.80 133 3.79 138 3.19 107 2.99 121 3.49Panama 52 4.84 24 5.01 38 4.94 71 4.70 85 4.16 24 5.39Paraguay 107 3.95 110 3.75 121 3.99 124 3.78 99 3.64 57 4.61Peru 87 4.30 45 4.67 79 4.38 119 3.91 98 3.70 47 4.84Philippines 98 4.18 70 4.38 94 4.21 109 4.07 97 3.76 70 4.49Poland 49 4.86 61 4.48 37 4.94 50 5.21 44 5.59 98 4.09Portugal 19 5.47 35 4.79 17 5.36 22 5.74 34 5.95 20 5.49Puerto Rico 40 5.05 14 5.19 14 5.43 61 5.05 69 4.74 48 4.83Qatar 43 5.02 37 4.75 67 4.55 28 5.69 47 5.52 58 4.61Romania 51 4.85 63 4.46 50 4.82 35 5.45 59 5.10 80 4.43Russian Federation 73 4.49 126 3.57 98 4.18 113 4.01 11 6.62 102 4.04Rwanda 75 4.46 40 4.72 8 5.68 39 5.37 119 2.36 95 4.19Saudi Arabia 81 4.38 43 4.70 131 3.82 52 5.17 93 3.94 88 4.29Senegal 111 3.90 108 3.77 86 4.30 70 4.71 124 2.15 59 4.58Serbia 67 4.57 68 4.39 124 3.95 66 4.85 41 5.65 105 4.01Singapore 6 5.72 1 6.00 41 4.90 13 6.10 55 5.19 2 6.42Slovak Republic 39 5.05 36 4.78 27 5.09 49 5.23 15 6.53 116 3.64Slovenia 29 5.19 65 4.44 23 5.19 29 5.65 39 5.81 44 4.88South Africa 82 4.37 31 4.85 48 4.86 129 3.52 88 4.10 64 4.53Spain 22 5.34 85 4.30 33 4.99 36 5.44 29 6.08 11 5.90Sri Lanka 79 4.41 91 4.14 117 4.06 91 4.41 81 4.33 32 5.12Swaziland 99 4.18 90 4.17 57 4.71 76 4.67 113 2.63 52 4.72Sweden 11 5.67 8 5.31 1 6.26 7 6.27 36 5.93 60 4.58Switzerland 1 5.99 18 5.11 2 6.06 2 6.42 13 6.58 14 5.80Syria 101 4.17 123 3.61 126 3.92 69 4.83 90 4.07 79 4.44Taiwan, China 46 4.95 9 5.29 112 4.11 38 5.39 50 5.48 69 4.49Tajikistan 88 4.28 119 3.67 90 4.23 55 5.13 63 4.95 122 3.43Tanzania 121 3.67 97 3.92 43 4.89 115 4.00 134 1.28 90 4.26Thailand 77 4.45 76 4.35 97 4.19 94 4.39 80 4.40 38 4.93Timor-Leste 123 3.64 111 3.74 132 3.80 89 4.44 117 2.47 112 3.76Trinidad and Tobago 100 4.18 42 4.70 137 3.34 103 4.19 72 4.63 103 4.04Tunisia 31 5.17 23 5.01 18 5.31 56 5.11 79 4.41 8 6.02Turkey 66 4.58 34 4.80 85 4.30 97 4.37 67 4.86 61 4.58Uganda 116 3.75 100 3.89 40 4.90 117 3.93 125 2.07 110 3.94Ukraine 64 4.63 107 3.78 88 4.24 82 4.54 17 6.51 101 4.06United Arab Emirates 57 4.77 38 4.74 122 3.98 54 5.13 65 4.88 34 5.09United Kingdom 21 5.35 13 5.19 11 5.54 30 5.63 46 5.57 49 4.81United States 44 5.01 16 5.18 105 4.15 62 5.01 45 5.58 33 5.11Uruguay 30 5.19 71 4.38 70 4.52 21 5.75 35 5.94 27 5.34Venezuela 120 3.67 134 3.07 101 4.17 134 3.36 77 4.46 126 3.31Vietnam 89 4.28 67 4.41 115 4.07 68 4.84 89 4.07 107 3.98Zambia 104 4.02 44 4.70 49 4.84 80 4.56 122 2.16 111 3.81Zimbabwe 118 3.71 136 2.93 71 4.52 96 4.38 108 2.98 114 3.72
The Travel & Tourism Competitiveness Report 2011 © 2011 World Economic Forum

Table B3: The Travel & Tourism Competitiveness Index: Business environment and infrastructure
PILLARS
T&T BUSINESS ENVIRONMENT 6. Air transport 7. Ground transport 8. Tourism 9. ICT 10. Price competitiveness AND INFRASTRUCTURE infrastructure infrastructure infrastructure infrastructure in T&T industry
Country/Economy Rank Score Rank Score Rank Score Rank Score Rank Score Rank Score
Albania 91 3.30 96 2.52 97 3.08 77 3.35 71 3.20 94 4.33Algeria 110 2.89 103 2.44 105 2.96 122 1.72 107 2.30 35 5.02Angola 121 2.72 126 2.14 139 2.03 103 2.33 126 1.86 13 5.24Argentina 70 3.66 73 2.90 107 2.91 55 4.35 53 3.62 70 4.51Armenia 100 3.09 95 2.59 106 2.96 92 2.77 97 2.52 61 4.61Australia 17 5.11 3 5.84 51 4.22 16 6.31 24 5.08 113 4.07Austria 12 5.19 26 4.37 15 5.64 1 7.00 25 5.03 121 3.93Azerbaijan 87 3.33 83 2.73 58 4.08 96 2.61 88 2.76 76 4.48Bahrain 20 5.06 28 4.36 11 5.78 26 5.61 37 4.39 21 5.18Bangladesh 113 2.82 120 2.23 62 3.92 132 1.31 129 1.80 50 4.83Barbados 21 4.99 25 4.40 10 5.92 28 5.18 27 4.96 74 4.49Belgium 35 4.66 32 4.30 9 6.03 60 4.24 16 5.26 136 3.45Benin 117 2.75 124 2.16 99 3.07 112 2.05 118 1.96 68 4.52Bolivia 111 2.87 100 2.47 134 2.38 109 2.09 102 2.35 33 5.05Bosnia and Herzegovina 97 3.14 134 1.87 137 2.27 62 4.12 70 3.22 103 4.22Botswana 85 3.34 91 2.61 73 3.43 90 2.85 104 2.33 8 5.45Brazil 75 3.55 42 3.91 116 2.80 76 3.49 56 3.49 114 4.07Brunei Darussalam 50 4.14 41 4.00 49 4.22 91 2.84 47 3.87 1 5.75Bulgaria 44 4.32 89 2.66 90 3.15 6 6.82 43 4.12 46 4.85Burkina Faso 135 2.50 135 1.85 110 2.87 120 1.91 134 1.74 112 4.13Burundi 134 2.52 129 2.06 84 3.21 134 1.29 137 1.60 78 4.46Cambodia 118 2.73 113 2.30 103 3.01 131 1.36 123 1.92 31 5.07Cameroon 129 2.61 130 2.06 111 2.86 114 2.02 121 1.95 110 4.16Canada 5 5.38 1 6.68 33 4.77 21 5.89 14 5.38 105 4.19Cape Verde 73 3.61 48 3.66 64 3.83 63 4.11 90 2.70 126 3.75Chad 139 2.09 137 1.76 132 2.39 133 1.30 139 1.53 133 3.49Chile 56 3.99 52 3.50 55 4.11 68 3.84 54 3.61 41 4.91China 64 3.84 35 4.24 59 4.05 95 2.62 73 3.15 24 5.12Colombia 92 3.30 70 2.99 120 2.73 83 3.05 64 3.34 88 4.37Costa Rica 58 3.95 44 3.85 93 3.12 39 4.98 72 3.19 62 4.60Côte d’Ivoire 124 2.67 114 2.29 80 3.28 106 2.23 117 1.97 131 3.55Croatia 36 4.58 66 3.09 54 4.12 4 6.96 35 4.47 101 4.24Cyprus 14 5.15 21 4.69 20 5.26 1 7.00 31 4.63 109 4.17Czech Republic 37 4.56 50 3.59 22 5.15 27 5.30 40 4.29 77 4.48Denmark 16 5.11 17 4.93 7 6.13 24 5.73 10 5.66 139 3.10Dominican Republic 69 3.66 49 3.63 81 3.26 61 4.12 83 2.80 72 4.50Ecuador 93 3.26 76 2.84 118 2.75 86 2.93 86 2.79 36 4.97Egypt 74 3.59 55 3.47 76 3.37 88 2.87 93 2.66 5 5.59El Salvador 79 3.49 79 2.80 70 3.55 79 3.14 77 2.92 34 5.02Estonia 19 5.09 54 3.47 29 4.96 11 6.69 13 5.45 44 4.86Ethiopia 114 2.81 87 2.70 98 3.07 128 1.59 138 1.54 23 5.14Finland 30 4.75 16 4.94 21 5.19 42 4.81 17 5.20 128 3.62France 8 5.35 6 5.50 4 6.45 18 6.19 12 5.46 138 3.15Gambia, The 90 3.31 82 2.75 52 4.22 127 1.63 108 2.27 2 5.66Georgia 94 3.21 105 2.40 69 3.57 87 2.89 82 2.81 91 4.36Germany 2 5.57 7 5.48 3 6.52 15 6.33 7 5.72 125 3.80Ghana 105 3.01 101 2.46 94 3.10 102 2.34 114 2.05 26 5.10Greece 29 4.75 19 4.76 61 4.00 5 6.89 39 4.29 123 3.82Guatemala 81 3.40 71 2.97 102 3.05 85 2.99 78 2.91 27 5.09Guyana 99 3.10 115 2.29 104 2.97 97 2.61 87 2.79 43 4.86Honduras 80 3.41 69 3.01 85 3.20 80 3.13 92 2.66 32 5.07Hong Kong SAR 13 5.19 12 5.10 1 6.74 70 3.68 4 5.90 67 4.53Hungary 45 4.28 75 2.86 37 4.63 30 5.15 38 4.35 87 4.40Iceland 6 5.36 18 4.87 32 4.79 7 6.72 3 5.93 71 4.50India 68 3.71 39 4.11 43 4.30 89 2.86 111 2.16 28 5.09Indonesia 86 3.33 58 3.35 82 3.22 116 1.96 96 2.54 4 5.59Iran, Islamic Rep. 103 3.03 94 2.59 86 3.18 136 1.11 89 2.73 7 5.53Ireland 23 4.88 24 4.42 38 4.56 10 6.71 29 4.89 122 3.84Israel 42 4.33 51 3.59 47 4.25 44 4.57 22 5.15 115 4.07Italy 27 4.79 29 4.35 39 4.54 1 7.00 34 4.47 129 3.59Jamaica 59 3.93 64 3.23 23 5.14 75 3.53 60 3.37 90 4.36Japan 32 4.72 22 4.61 6 6.14 48 4.53 28 4.90 137 3.40Jordan 72 3.61 60 3.30 75 3.41 64 4.01 85 2.79 65 4.55Kazakhstan 88 3.32 86 2.71 96 3.08 81 3.11 61 3.35 92 4.34Kenya 106 2.93 72 2.94 87 3.18 111 2.05 112 2.14 93 4.33Korea, Rep. 28 4.76 40 4.00 18 5.49 56 4.30 8 5.70 96 4.32Kuwait 60 3.92 67 3.08 57 4.09 65 3.96 69 3.23 12 5.25Kyrgyz Republic 132 2.59 132 1.96 129 2.55 135 1.16 91 2.70 64 4.58Latvia 39 4.36 63 3.25 42 4.31 35 5.07 36 4.40 53 4.78
(Cont’d.)
Appendix B: Travel & Tourism Competitiveness Index 2011 detailed rankings (cont’d.)
1.1: The
Trave
l & Tou
rism Com
petit
iven
ess Inde
x 20
11
30
Appendix B: Travel & Tourism Competitiveness Index 2011 detailed rankings (cont’d.)
The Travel & Tourism Competitiveness Report 2011 © 2011 World Economic Forum

Table B3: The Travel & Tourism Competitiveness Index: Business environment and infrastructure (cont’d.)
PILLARS
T&T BUSINESS ENVIRONMENT 6. Air transport 7. Ground transport 8. Tourism 9. ICT 10. Price competitiveness AND INFRASTRUCTURE infrastructure infrastructure infrastructure infrastructure in T&T industry
Country/Economy Rank Score Rank Score Rank Score Rank Score Rank Score Rank Score
Lebanon 63 3.86 56 3.46 100 3.06 29 5.15 80 2.88 55 4.76Lesotho 123 2.70 139 1.70 112 2.86 113 2.03 132 1.74 22 5.17Libya 107 2.92 99 2.50 127 2.59 107 2.19 101 2.39 39 4.93Lithuania 46 4.21 107 2.38 26 5.03 50 4.51 32 4.63 73 4.50Luxembourg 7 5.35 36 4.18 12 5.77 12 6.55 5 5.86 86 4.40Macedonia, FYR 78 3.49 127 2.11 88 3.17 69 3.82 55 3.53 49 4.83Madagascar 116 2.76 106 2.39 126 2.62 100 2.53 131 1.80 79 4.46Malawi 133 2.54 133 1.94 91 3.14 129 1.50 128 1.81 95 4.32Malaysia 40 4.35 34 4.25 36 4.65 74 3.58 52 3.68 3 5.60Mali 137 2.42 131 2.04 113 2.84 117 1.93 135 1.73 130 3.56Malta 22 4.93 27 4.37 30 4.87 20 6.09 19 5.18 111 4.16Mauritania 136 2.44 138 1.74 125 2.62 124 1.69 119 1.96 107 4.17Mauritius 48 4.15 61 3.27 41 4.49 47 4.54 66 3.27 18 5.20Mexico 61 3.91 47 3.72 79 3.28 43 4.62 75 3.09 45 4.85Moldova 98 3.11 128 2.10 124 2.65 93 2.73 65 3.30 54 4.78Mongolia 112 2.82 77 2.83 133 2.39 121 1.75 99 2.44 59 4.69Montenegro 49 4.15 62 3.26 109 2.88 25 5.67 42 4.13 48 4.84Morocco 77 3.50 68 3.02 72 3.46 71 3.68 79 2.89 83 4.43Mozambique 119 2.73 112 2.30 128 2.57 99 2.57 127 1.85 89 4.37Namibia 67 3.71 59 3.34 44 4.29 67 3.85 109 2.21 47 4.84Nepal 128 2.62 116 2.28 135 2.35 130 1.43 133 1.74 10 5.28Netherlands 18 5.10 15 4.99 8 6.09 31 5.13 6 5.76 132 3.53New Zealand 25 4.80 11 5.17 50 4.22 36 5.05 23 5.14 84 4.42Nicaragua 104 3.03 108 2.33 122 2.70 84 3.03 116 1.97 25 5.11Nigeria 115 2.76 102 2.45 131 2.45 105 2.27 105 2.32 98 4.31Norway 26 4.79 9 5.25 63 3.91 23 5.78 11 5.53 134 3.49Oman 47 4.18 53 3.47 40 4.51 59 4.24 58 3.47 19 5.20Pakistan 102 3.06 98 2.52 71 3.47 119 1.92 113 2.10 11 5.27Panama 52 4.08 33 4.29 68 3.65 66 3.92 57 3.48 30 5.08Paraguay 122 2.72 136 1.79 138 2.19 101 2.37 100 2.43 52 4.80Peru 82 3.40 78 2.81 121 2.70 58 4.24 84 2.80 81 4.46Philippines 95 3.18 80 2.79 114 2.83 98 2.59 98 2.52 20 5.19Poland 65 3.81 88 2.67 78 3.30 52 4.47 44 4.07 66 4.54Portugal 24 4.84 38 4.15 24 5.11 14 6.34 33 4.61 116 4.00Puerto Rico 38 4.55 31 4.30 19 5.48 32 5.12 63 3.34 69 4.51Qatar 34 4.68 20 4.70 35 4.66 34 5.10 45 3.99 38 4.93Romania 66 3.80 81 2.76 101 3.06 38 4.99 49 3.75 80 4.46Russian Federation 53 4.07 30 4.32 95 3.09 45 4.57 46 3.87 75 4.48Rwanda 120 2.73 109 2.32 67 3.72 139 1.05 120 1.95 63 4.59Saudi Arabia 41 4.35 45 3.77 53 4.18 46 4.55 51 3.68 6 5.56Senegal 108 2.92 92 2.60 89 3.16 94 2.65 103 2.35 124 3.81Serbia 84 3.39 111 2.31 115 2.82 49 4.51 62 3.35 118 3.96Singapore 4 5.39 14 5.01 2 6.56 33 5.12 20 5.16 29 5.09Slovak Republic 57 3.96 122 2.17 45 4.27 41 4.89 41 4.23 102 4.23Slovenia 33 4.70 74 2.90 25 5.08 17 6.27 26 4.96 99 4.28South Africa 62 3.88 43 3.89 66 3.73 57 4.27 95 2.59 37 4.94Spain 10 5.32 8 5.28 13 5.72 8 6.71 30 4.70 106 4.18Sri Lanka 83 3.40 90 2.62 34 4.76 104 2.28 94 2.64 60 4.68Swaziland 101 3.07 123 2.16 65 3.81 108 2.10 115 2.02 14 5.24Sweden 15 5.15 10 5.23 16 5.58 37 5.01 1 5.99 120 3.94Switzerland 1 5.58 13 5.08 5 6.45 8 6.71 2 5.96 127 3.68Syria 109 2.91 110 2.31 92 3.13 115 1.99 106 2.31 51 4.82Taiwan, China 31 4.73 46 3.75 14 5.64 72 3.66 15 5.38 17 5.21Tajikistan 130 2.60 117 2.27 117 2.80 138 1.08 110 2.17 58 4.70Tanzania 127 2.62 121 2.19 123 2.69 125 1.68 130 1.80 56 4.75Thailand 43 4.32 23 4.49 56 4.09 40 4.94 81 2.88 15 5.21Timor-Leste 138 2.42 104 2.42 130 2.49 137 1.10 136 1.66 85 4.41Trinidad and Tobago 51 4.13 57 3.40 27 5.02 73 3.61 50 3.75 42 4.90Tunisia 54 4.05 65 3.17 48 4.24 51 4.48 76 3.05 9 5.30Turkey 55 4.02 37 4.16 60 4.03 54 4.38 59 3.38 108 4.17Uganda 125 2.65 119 2.25 119 2.73 126 1.66 125 1.90 57 4.71Ukraine 76 3.53 93 2.60 74 3.41 53 4.43 68 3.25 119 3.95United Arab Emirates 9 5.32 4 5.83 31 4.86 22 5.79 18 5.18 40 4.93United Kingdom 11 5.27 5 5.51 17 5.54 19 6.16 9 5.70 135 3.46United States 3 5.42 2 6.17 28 4.97 13 6.54 21 5.16 100 4.25Uruguay 71 3.62 97 2.52 46 4.26 82 3.10 48 3.75 82 4.45Venezuela 96 3.15 84 2.72 136 2.33 78 3.25 74 3.13 97 4.31Vietnam 89 3.31 85 2.72 77 3.31 110 2.07 67 3.25 16 5.21Zambia 131 2.60 118 2.26 108 2.88 123 1.71 122 1.95 104 4.19Zimbabwe 126 2.64 125 2.16 83 3.21 118 1.93 124 1.92 117 3.99
Appendix B: Travel & Tourism Competitiveness Index 2011 detailed rankings (cont’d.)
1.1: The
Trave
l & Tou
rism Com
petit
iven
ess Inde
x 20
11
Appendix B: Travel & Tourism Competitiveness Index 2011 detailed rankings (cont’d.)
31
The Travel & Tourism Competitiveness Report 2011 © 2011 World Economic Forum
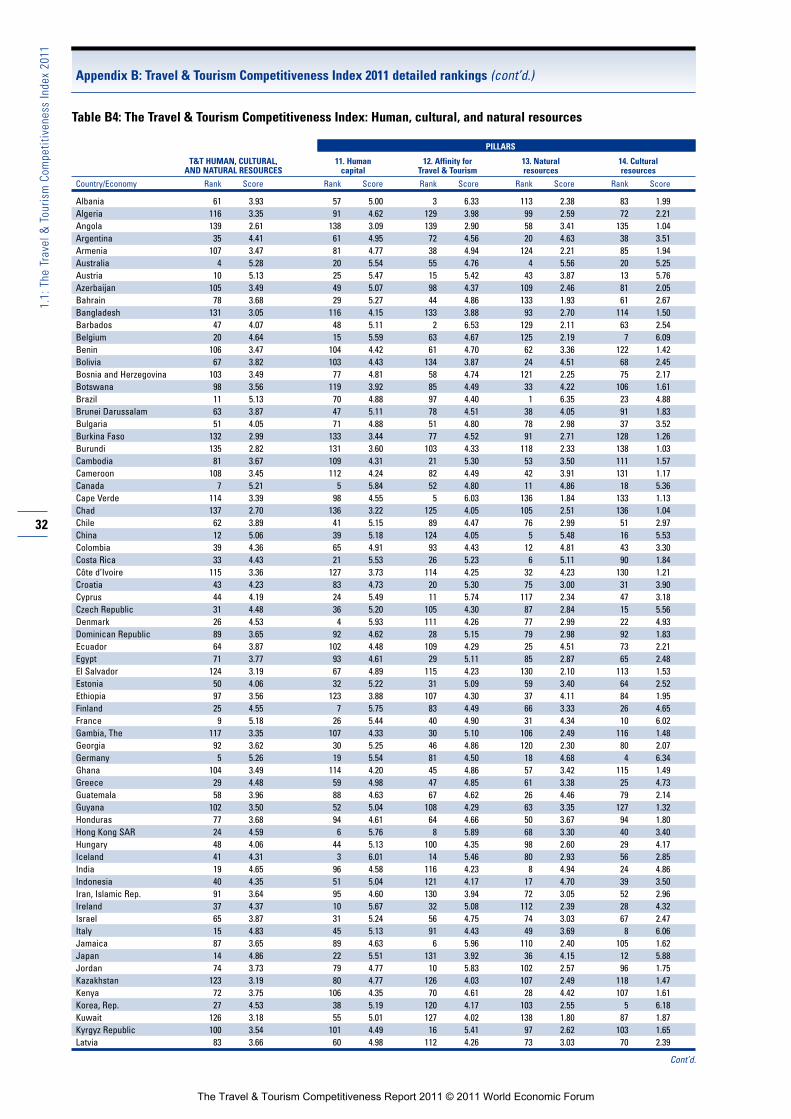
Table B4: The Travel & Tourism Competitiveness Index: Human, cultural, and natural resources
PILLARS
T&T HUMAN, CULTURAL, 11. Human 12. Affinity for 13. Natural 14. CulturalAND NATURAL RESOURCES capital Travel & Tourism resources resources
Country/Economy Rank Score Rank Score Rank Score Rank Score Rank Score
Albania 61 3.93 57 5.00 3 6.33 113 2.38 83 1.99Algeria 116 3.35 91 4.62 129 3.98 99 2.59 72 2.21Angola 139 2.61 138 3.09 139 2.90 58 3.41 135 1.04Argentina 35 4.41 61 4.95 72 4.56 20 4.63 38 3.51Armenia 107 3.47 81 4.77 38 4.94 124 2.21 85 1.94Australia 4 5.28 20 5.54 55 4.76 4 5.56 20 5.25Austria 10 5.13 25 5.47 15 5.42 43 3.87 13 5.76Azerbaijan 105 3.49 49 5.07 98 4.37 109 2.46 81 2.05Bahrain 78 3.68 29 5.27 44 4.86 133 1.93 61 2.67Bangladesh 131 3.05 116 4.15 133 3.88 93 2.70 114 1.50Barbados 47 4.07 48 5.11 2 6.53 129 2.11 63 2.54Belgium 20 4.64 15 5.59 63 4.67 125 2.19 7 6.09Benin 106 3.47 104 4.42 61 4.70 62 3.36 122 1.42Bolivia 67 3.82 103 4.43 134 3.87 24 4.51 68 2.45Bosnia and Herzegovina 103 3.49 77 4.81 58 4.74 121 2.25 75 2.17Botswana 98 3.56 119 3.92 85 4.49 33 4.22 106 1.61Brazil 11 5.13 70 4.88 97 4.40 1 6.35 23 4.88Brunei Darussalam 63 3.87 47 5.11 78 4.51 38 4.05 91 1.83Bulgaria 51 4.05 71 4.88 51 4.80 78 2.98 37 3.52Burkina Faso 132 2.99 133 3.44 77 4.52 91 2.71 128 1.26Burundi 135 2.82 131 3.60 103 4.33 118 2.33 138 1.03Cambodia 81 3.67 109 4.31 21 5.30 53 3.50 111 1.57Cameroon 108 3.45 112 4.24 82 4.49 42 3.91 131 1.17Canada 7 5.21 5 5.84 52 4.80 11 4.86 18 5.36Cape Verde 114 3.39 98 4.55 5 6.03 136 1.84 133 1.13Chad 137 2.70 136 3.22 125 4.05 105 2.51 136 1.04Chile 62 3.89 41 5.15 89 4.47 76 2.99 51 2.97China 12 5.06 39 5.18 124 4.05 5 5.48 16 5.53Colombia 39 4.36 65 4.91 93 4.43 12 4.81 43 3.30Costa Rica 33 4.43 21 5.53 26 5.23 6 5.11 90 1.84Côte d’Ivoire 115 3.36 127 3.73 114 4.25 32 4.23 130 1.21Croatia 43 4.23 83 4.73 20 5.30 75 3.00 31 3.90Cyprus 44 4.19 24 5.49 11 5.74 117 2.34 47 3.18Czech Republic 31 4.48 36 5.20 105 4.30 87 2.84 15 5.56Denmark 26 4.53 4 5.93 111 4.26 77 2.99 22 4.93Dominican Republic 89 3.65 92 4.62 28 5.15 79 2.98 92 1.83Ecuador 64 3.87 102 4.48 109 4.29 25 4.51 73 2.21Egypt 71 3.77 93 4.61 29 5.11 85 2.87 65 2.48El Salvador 124 3.19 67 4.89 115 4.23 130 2.10 113 1.53Estonia 50 4.06 32 5.22 31 5.09 59 3.40 64 2.52Ethiopia 97 3.56 123 3.88 107 4.30 37 4.11 84 1.95Finland 25 4.55 7 5.75 83 4.49 66 3.33 26 4.65France 9 5.18 26 5.44 40 4.90 31 4.34 10 6.02Gambia, The 117 3.35 107 4.33 30 5.10 106 2.49 116 1.48Georgia 92 3.62 30 5.25 46 4.86 120 2.30 80 2.07Germany 5 5.26 19 5.54 81 4.50 18 4.68 4 6.34Ghana 104 3.49 114 4.20 45 4.86 57 3.42 115 1.49Greece 29 4.48 59 4.98 47 4.85 61 3.38 25 4.73Guatemala 58 3.96 88 4.63 67 4.62 26 4.46 79 2.14Guyana 102 3.50 52 5.04 108 4.29 63 3.35 127 1.32Honduras 77 3.68 94 4.61 64 4.66 50 3.67 94 1.80Hong Kong SAR 24 4.59 6 5.76 8 5.89 68 3.30 40 3.40Hungary 48 4.06 44 5.13 100 4.35 98 2.60 29 4.17Iceland 41 4.31 3 6.01 14 5.46 80 2.93 56 2.85India 19 4.65 96 4.58 116 4.23 8 4.94 24 4.86Indonesia 40 4.35 51 5.04 121 4.17 17 4.70 39 3.50Iran, Islamic Rep. 91 3.64 95 4.60 130 3.94 72 3.05 52 2.96Ireland 37 4.37 10 5.67 32 5.08 112 2.39 28 4.32Israel 65 3.87 31 5.24 56 4.75 74 3.03 67 2.47Italy 15 4.83 45 5.13 91 4.43 49 3.69 8 6.06Jamaica 87 3.65 89 4.63 6 5.96 110 2.40 105 1.62Japan 14 4.86 22 5.51 131 3.92 36 4.15 12 5.88Jordan 74 3.73 79 4.77 10 5.83 102 2.57 96 1.75Kazakhstan 123 3.19 80 4.77 126 4.03 107 2.49 118 1.47Kenya 72 3.75 106 4.35 70 4.61 28 4.42 107 1.61Korea, Rep. 27 4.53 38 5.19 120 4.17 103 2.55 5 6.18Kuwait 126 3.18 55 5.01 127 4.02 138 1.80 87 1.87Kyrgyz Republic 100 3.54 101 4.49 16 5.41 97 2.62 103 1.65Latvia 83 3.66 60 4.98 112 4.26 73 3.03 70 2.39
Cont’d.
Appendix B: Travel & Tourism Competitiveness Index 2011 detailed rankings (cont’d.)
1.1: The
Trave
l & Tou
rism Com
petit
iven
ess Inde
x 20
11
32
Appendix B: Travel & Tourism Competitiveness Index 2011 detailed rankings (cont’d.)
The Travel & Tourism Competitiveness Report 2011 © 2011 World Economic Forum

Table B4: The Travel & Tourism Competitiveness Index: Human, cultural, and natural resources (cont’d.)
PILLARS
T&T HUMAN, CULTURAL, 11. Human 12. Affinity for 13. Natural 14. CulturalAND NATURAL RESOURCES capital Travel & Tourism resources resources
Country/Economy Rank Score Rank Score Rank Score Rank Score Rank Score
Lebanon 69 3.80 64 4.92 1 6.79 139 1.76 98 1.75Lesotho 138 2.63 137 3.19 106 4.30 135 1.88 132 1.14Libya 125 3.18 115 4.19 122 4.16 134 1.92 66 2.47Lithuania 85 3.66 62 4.94 84 4.49 114 2.37 57 2.83Luxembourg 38 4.37 17 5.57 13 5.60 65 3.33 50 2.97Macedonia, FYR 93 3.62 75 4.82 53 4.77 92 2.70 74 2.18Madagascar 120 3.29 110 4.30 62 4.68 82 2.88 126 1.32Malawi 112 3.42 121 3.89 92 4.43 46 3.80 112 1.55Malaysia 18 4.72 37 5.20 17 5.39 22 4.53 33 3.75Mali 121 3.26 130 3.65 59 4.72 104 2.52 78 2.15Malta 54 4.02 28 5.32 9 5.84 137 1.82 48 3.09Mauritania 133 2.95 132 3.54 76 4.52 108 2.48 129 1.25Mauritius 79 3.67 53 5.03 4 6.11 131 1.97 110 1.59Mexico 13 4.90 73 4.86 73 4.56 10 4.89 19 5.31Moldova 129 3.12 97 4.57 75 4.53 132 1.96 121 1.42Mongolia 86 3.65 99 4.52 36 4.99 84 2.88 71 2.23Montenegro 36 4.38 35 5.21 7 5.92 71 3.23 46 3.18Morocco 73 3.74 90 4.63 22 5.27 126 2.15 54 2.90Mozambique 127 3.15 135 3.24 94 4.42 55 3.47 117 1.47Namibia 109 3.45 124 3.83 50 4.81 47 3.78 123 1.36Nepal 101 3.52 129 3.71 48 4.84 34 4.20 124 1.36Netherlands 16 4.78 9 5.69 79 4.50 67 3.32 14 5.59New Zealand 22 4.60 14 5.64 18 5.38 30 4.36 49 3.02Nicaragua 84 3.66 85 4.70 101 4.34 39 4.00 108 1.61Nigeria 119 3.30 126 3.78 123 4.06 52 3.52 89 1.84Norway 32 4.45 16 5.57 88 4.48 60 3.40 27 4.34Oman 76 3.69 84 4.72 71 4.58 69 3.28 77 2.16Pakistan 122 3.21 122 3.89 137 3.48 83 2.88 62 2.58Panama 57 3.97 87 4.69 42 4.89 19 4.67 104 1.64Paraguay 130 3.11 105 4.40 135 3.69 89 2.73 109 1.60Peru 34 4.42 66 4.89 74 4.55 7 4.95 44 3.29Philippines 75 3.69 86 4.69 65 4.64 70 3.26 76 2.17Poland 30 4.48 43 5.14 132 3.89 54 3.49 17 5.41Portugal 17 4.73 40 5.16 33 5.02 86 2.85 11 5.89Puerto Rico 88 3.65 33 5.21 27 5.16 111 2.40 93 1.81Qatar 90 3.64 18 5.55 118 4.21 127 2.14 60 2.68Romania 66 3.84 63 4.93 95 4.42 94 2.69 41 3.33Russian Federation 45 4.15 78 4.78 136 3.65 27 4.44 35 3.72Rwanda 110 3.43 100 4.50 60 4.72 56 3.42 134 1.06Saudi Arabia 70 3.77 34 5.21 102 4.34 48 3.77 97 1.75Senegal 82 3.67 117 4.02 39 4.94 40 3.96 95 1.75Serbia 94 3.60 76 4.81 66 4.62 123 2.23 59 2.72Singapore 23 4.59 2 6.13 12 5.68 96 2.64 30 3.91Slovak Republic 52 4.04 50 5.04 110 4.27 41 3.93 53 2.92Slovenia 53 4.03 42 5.14 49 4.83 64 3.34 58 2.82South Africa 49 4.06 128 3.73 43 4.87 14 4.76 55 2.89Spain 6 5.22 46 5.11 37 4.99 35 4.19 2 6.58Sri Lanka 68 3.81 54 5.02 99 4.37 44 3.84 82 2.00Swaziland 136 2.81 139 2.89 69 4.61 90 2.72 137 1.03Sweden 8 5.21 13 5.64 54 4.77 45 3.81 1 6.63Switzerland 2 5.48 1 6.17 34 5.00 16 4.70 9 6.03Syria 113 3.39 108 4.32 23 5.27 128 2.11 88 1.85Taiwan, China 55 4.00 23 5.51 68 4.61 100 2.57 42 3.33Tajikistan 128 3.13 82 4.73 128 3.99 115 2.35 120 1.43Tanzania 56 3.97 125 3.83 80 4.50 2 5.86 101 1.70Thailand 21 4.64 74 4.82 24 5.26 21 4.59 32 3.86Timor-Leste 134 2.90 118 3.96 96 4.41 122 2.24 139 1.01Trinidad and Tobago 111 3.42 58 4.98 119 4.18 88 2.79 100 1.74Tunisia 59 3.94 27 5.39 19 5.30 95 2.64 69 2.44Turkey 28 4.50 69 4.88 35 5.00 81 2.91 21 5.23Uganda 80 3.67 113 4.22 57 4.75 29 4.38 125 1.35Ukraine 118 3.33 68 4.88 117 4.23 119 2.31 86 1.90United Arab Emirates 42 4.24 12 5.65 25 5.25 116 2.35 34 3.73United Kingdom 3 5.28 8 5.70 86 4.48 23 4.51 3 6.42United States 1 5.48 11 5.66 104 4.31 3 5.81 6 6.15Uruguay 60 3.93 56 5.01 41 4.89 101 2.57 45 3.25Venezuela 99 3.55 111 4.29 138 3.25 9 4.91 99 1.75Vietnam 46 4.12 72 4.86 87 4.48 51 3.57 36 3.57Zambia 95 3.58 120 3.89 113 4.25 15 4.73 119 1.46Zimbabwe 96 3.57 134 3.38 90 4.46 13 4.77 102 1.68
Appendix B: Travel & Tourism Competitiveness Index 2011 detailed rankings (cont’d.)
1.1: The
Trave
l & Tou
rism Com
petit
iven
ess Inde
x 20
11
Appendix B: Travel & Tourism Competitiveness Index 2011 detailed rankings (cont’d.)
33
The Travel & Tourism Competitiveness Report 2011 © 2011 World Economic Forum