th jubilant life sciences limited… · purchase of stock in trade 591.10 382.20 55% excise duty on...
TRANSCRIPT

Document code: FOTL_180920185_1 Copyright © 2016 Firstobject Technologies Ltd. All rights reserved
JUBILANT LIFE SCIENCES LIMITEDResult Update (CONSOLIDATED BASIS): Q1 FY19
CMP: 789.05 SEP 18th, 2018
Overweight ISIN:INE700A01033
Index DetailsSYNOPSIS
Jubilant Life Sciences Ltd is an integrated globalpharmaceutical and life sciences company engagedin Pharmaceuticals, Life Science Ingredients andDrug Discovery Solutions.The company achieved a consolidated turnover ofRs. 20786.50 mn for Q1 FY19 as against Rs.15960.50 mn Q1 FY18, an increase of 30.24%.Pharmaceuticals revenue at Rs. 11812.60 mn,contributing 46% to revenue, up 57% YoY and 4%QoQ.Life Science Ingredients revenue at Rs. 8468.40 mn,contributing 41% to revenue, up 21% YoY and 12%QoQ.During the quarter, consolidated EBIDTA stood atRs. 4470.70 mn as against Rs. 3444.20 mn in thecorresponding period of the previous year, up by29.80%.During the quarter, consolidated PBT stood at Rs.2863.70 as against Rs. 2032.10 mn in Q1 FY18.During the quarter, consolidated net profit stood atRs. 2025.00 mn as against Rs. 1471.40 mn in thecorresponding quarter ending of previous year.EPS of the company stood at Rs. 13.00 in Q1 FY19against Rs. 9.45 in the corresponding quarter of theprevious year.The Company has a total of 976 filings acrossgeographies including 898 filings in Dosage (Orals)and 78 filings in Sterile products including JDI. Ofthis, 655 Dosage (Orals) and 71 Sterile Productshave been approved while 250 filings (243 Dosage(Orals) and 7 sterile products) are pending approval.International markets share stood at Rs. 3050 mn,36% in LSI Business Revenues.R&D spent during the quarter of Rs. 580 mn – 4.9%to segment sales.Net sales and PAT of the company are expected togrow at a CAGR of 14% and 28% over 2017 to2020E, respectively.
Stock DataSector PharmaceuticalsBSE Code 530019Face Value 1.0052wk. High / Low (Rs.) 1039.00/600.00Volume (2wk. Avg.) 77000Market Cap (Rs. in mn.) 122933.99
Annual Estimated Results(A*: Actual / E*: Estimated)Years (Rs. in mn) FY18A FY19E FY20ENet Sales 75578.10 86914.82 99082.89EBITDA 15584.10 18210.98 21079.38Net Profit 6428.10 8193.17 10338.13EPS 41.26 52.59 66.36P/E 19.12 15.00 11.89
Shareholding Pattern (%)
As on Jun 2018 As on Mar 2018
Promoter 50.68 50.68
Public 47.12 47.12
Others 2.20 2.20
1 Year Comparative Graph
JUBILANT LIFE SCIENCES LIMITED S&P BSE SENSEX
PEER GROUPS CMP MARKET CAP EPS(TTM) P/E (X)(TTM) P/BV(X) DIVIDENDCompany Name (Rs.) Rs. in mn. (Rs.) Ratio Ratio (%)Jubilant Life Sciences Ltd 789.05 122933.99 44.83 17.60 3.01 300.00Natco Pharma Ltd 813.35 150057.70 42.48 19.15 4.88 412.50Divi's Laboratories Ltd 1363.75 362032.80 36.13 37.75 6.07 500.00Shilpa Medicare Ltd 524.55 42764.90 14.23 36.86 3.96 70.00

Document code: FOTL_180920185_1 Copyright © 2016 Firstobject Technologies Ltd. All rights reserved
QUARTERLY HIGHLIGHTS (CONSOLIDATED BASIS)
Results update- Q1 FY19,
(Rs. in million) Jun-18 Jun-17 % Change
Revenue 20786.50 15960.50 30.24%
Net Profit 2025.00 1471.40 37.62%
EPS 13.00 9.45 37.54%
EBIDTA 4470.70 3444.20 29.80%
Jubilant Life Sciences Limited has achieved a turnover of Rs. 20786.50 million for the 1st quarter of the FY 2018-19 as
against Rs. 15960.50 million in the corresponding quarter of the previous year, an increase of 30.24%. During the 1st
quarter, net profit stood at Rs. 2025.00 million against Rs. 1471.40 million in the corresponding quarter ending of
previous year. Reported earnings per share of the company stood at Rs. 13.00 in Q1 FY19 as against Rs. 9.45 in the
corresponding quarter of the previous year. Profit before interest, depreciation and tax stood at Rs. 4470.70 million as
against Rs. 3444.20 million in the corresponding period of the previous year.
Break up of Expenditure
Break up ofExpenditure
Value in Rs. Million
Q1 FY19 Q1 FY18 %Change
Cost of MaterialsConsumed 7823.90 5493.80 42%
Purchase of stock inTrade 591.10 382.20 55%
Excise duty on sales 0.00 397.50 --
Employee benefitsexpenses 4515.80 3103.20 46%
Depreciation andamortization expenses 880.00 724.80 21%
Power and Fuelexpenses 997.00 904.60 10%
Others 2935.30 2343.60 25%

Document code: FOTL_180920185_1 Copyright © 2016 Firstobject Technologies Ltd. All rights reserved
Segment Revenue
Pharmaceuticals Business Highlights:
Successful USFDA inspection of Jubilant Cadista and CMO Montreal facilities; Establishment Inspection Report
(EIR) received for CMO Montreal.
Started I-131 MIBG OPTIMUM Phase II Trials in July 2018 with two sites initiated.
The information collected from this study to be submitted to the USFDA under the Orphan Drug Designation
program for Jubilant’s NDA filing.
Eligible for accelerated approval if the clinical trials are successful.
Jubilant’s MIBG has already been used for over a decade in USFDA approved expanded access trials and two
Pediatric Oncology academic consortiums – NANT (New Approaches to NeuroblastomaTherapy) and COG
(Children’s Oncology Group).
Rubyfill installations in the US market progressing as per plan.
Capacity addition underway at Roorkee for Generics as per plan.
LSI Business Highlights:
Specialty Intermediates:
New multipurpose Chlorinated Pyridine plant got commissioned in Q1’FY19.
On track for 6 new product launches in FY19; Commercialized one product and expect to commercialize the
balance during the quarter.
Life Science Chemicals:

Document code: FOTL_180920185_1 Copyright © 2016 Firstobject Technologies Ltd. All rights reserved
New Acetic Anhydride plant is progressing as per plan to be commissioned by end Q3’FY19. This will provide
additional revenues of Rs. 300 Crore per annum at full capacity
Favorable prices maintained during the quarter as compared to Q1’FY18.
4th largest Ethanol supplier in the government blending program. Government of India has decided to raise the
price of Ethanol for blending program by Rs. 2.85 per litre; applicable for supply starting from December 1, 2018.
Nutritional Products:
Non-availability of Vitamin A & Vitamin E led to commensurate lower demand of Vitamin B in Feed
applications leading to higher inventory and lower prices.
Portfolio of R&D products – Filings and Approvals:
The Company has a total of 976 filings across geographies including 898 filings in Dosage (Orals) and 78 filings in Sterile
products including JDI. Of this, 655 Dosage (Orals) and 71 Sterile Products have been approved while 250 filings (243
Dosage (Orals) and 7 sterile products) are pending approval.
I. Portfolio of Dosage (Orals), Injectables and Others – Filings and Approvals
a. Dosage (Orals)
i. Filed 95 ANDAs in the US
• 60 ANDAs have been approved and 35 ANDAs are pending approval
• Filed 2 ANDAs in Q1’FY19; expect to file around 10 ANDAs during the year
ii. Made 803 filings in ROW markets including Canada, Europe and Japan
• 595 filings in ROW have been approved and 208 filings are pending approval
b. Injectables and Others
i. Total 4 ANDAs filed and approvals for 2 have been received
II. Portfolio of Radiopharmaceuticals – Filings and Approvals
a. Filing status as on June 30, 2018:
i. 8 approved registrations in the US
ii. 14 registrations in Canada which all are approved
iii. 8 registrations in Europe of which 7 are approved
iv. In ROW, the company has a total of 44 registrations/licenses, of which 4 are pending for approval.
Document code: FOTL_180920185_1 Copyright © 2016 Firstobject Technologies Ltd. All rights reserved
COMPANY PROFILE
Jubilant Life Sciences Ltd is an integrated global pharmaceutical and life sciences company engaged in Pharmaceuticals,
Life Science Ingredients and Drug Discovery Solutions. The Pharmaceuticals segment, through its wholly owned
subsidiary Jubilant Pharma Limited, is engaged in manufacture and supply of APIs, Solid Dosage Formulations,
Radiopharmaceuticals, Allergy Therapy Products and Contract Manufacturing of Sterile and Non‐sterile products through
6 USFDA approved manufacturing facilities in India, USA and Canada and a network of over 50 radio‐pharmacies in the
US. The Life Science Ingredients segment is engaged in Specialty Intermediates, Nutritional Products and Life Science
Chemicals through 5 manufacturing facilities in India. The Drug Discovery Solutions segment provides proprietary
in‐house innovation & collaborative research and partnership for out‐licensing through 3 world class research centres in
India and USA. Jubilant Life Sciences Limited has a team of around 7,600 multicultural people across the globe and is
committed to deliver value to its customers across over 100 countries. The Company is well recognized as a ‘Partner of
Choice’ by leading pharmaceuticals and life sciences companies globally.
Document code: FOTL_180920185_1 Copyright © 2016 Firstobject Technologies Ltd. All rights reserved
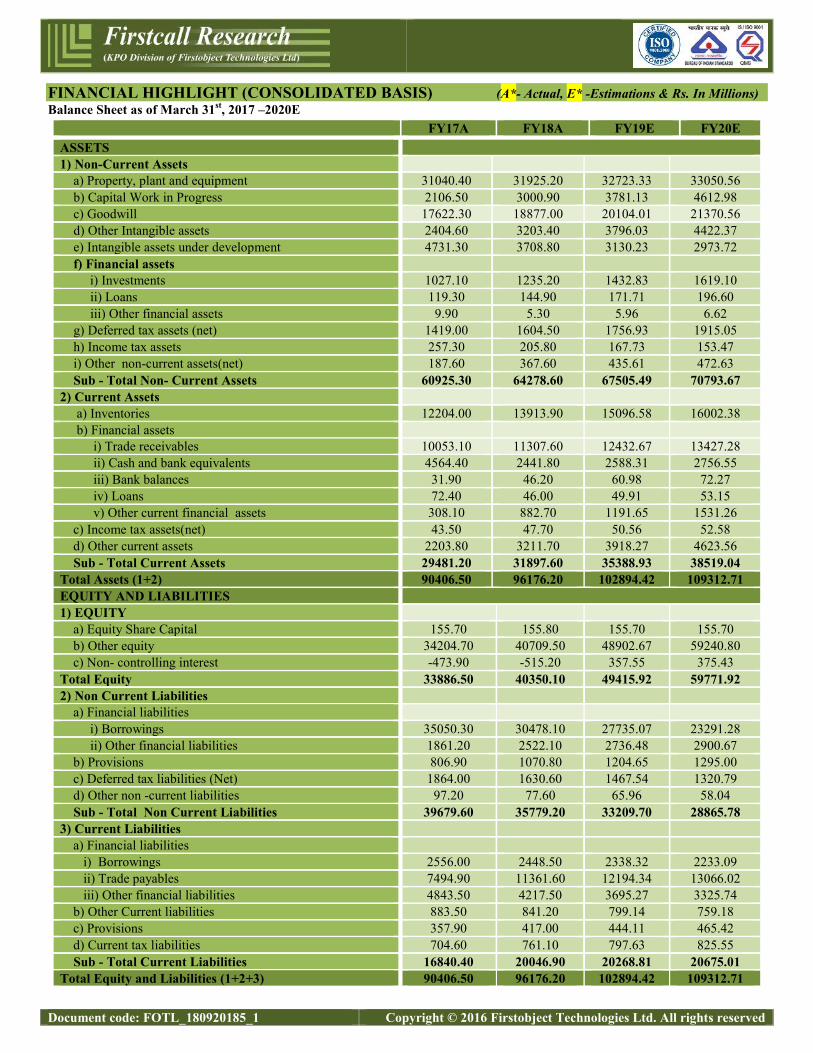
FINANCIAL HIGHLIGHT (CONSOLIDATED BASIS) (A*- Actual, E* -Estimations & Rs. In Millions)Balance Sheet as of March 31st, 2017 –2020E
FY17A FY18A FY19E FY20EASSETS1) Non-Current Assets
a) Property, plant and equipment 31040.40 31925.20 32723.33 33050.56b) Capital Work in Progress 2106.50 3000.90 3781.13 4612.98c) Goodwill 17622.30 18877.00 20104.01 21370.56d) Other Intangible assets 2404.60 3203.40 3796.03 4422.37e) Intangible assets under development 4731.30 3708.80 3130.23 2973.72f) Financial assets
i) Investments 1027.10 1235.20 1432.83 1619.10ii) Loans 119.30 144.90 171.71 196.60iii) Other financial assets 9.90 5.30 5.96 6.62
g) Deferred tax assets (net) 1419.00 1604.50 1756.93 1915.05h) Income tax assets 257.30 205.80 167.73 153.47i) Other non-current assets(net) 187.60 367.60 435.61 472.63Sub - Total Non- Current Assets 60925.30 64278.60 67505.49 70793.67
2) Current Assetsa) Inventories 12204.00 13913.90 15096.58 16002.38b) Financial assets
i) Trade receivables 10053.10 11307.60 12432.67 13427.28ii) Cash and bank equivalents 4564.40 2441.80 2588.31 2756.55iii) Bank balances 31.90 46.20 60.98 72.27iv) Loans 72.40 46.00 49.91 53.15v) Other current financial assets 308.10 882.70 1191.65 1531.26
c) Income tax assets(net) 43.50 47.70 50.56 52.58d) Other current assets 2203.80 3211.70 3918.27 4623.56Sub - Total Current Assets 29481.20 31897.60 35388.93 38519.04
Total Assets (1+2) 90406.50 96176.20 102894.42 109312.71EQUITY AND LIABILITIES1) EQUITY
a) Equity Share Capital 155.70 155.80 155.70 155.70b) Other equity 34204.70 40709.50 48902.67 59240.80c) Non- controlling interest -473.90 -515.20 357.55 375.43
Total Equity 33886.50 40350.10 49415.92 59771.922) Non Current Liabilities
a) Financial liabilitiesi) Borrowings 35050.30 30478.10 27735.07 23291.28ii) Other financial liabilities 1861.20 2522.10 2736.48 2900.67
b) Provisions 806.90 1070.80 1204.65 1295.00c) Deferred tax liabilities (Net) 1864.00 1630.60 1467.54 1320.79d) Other non -current liabilities 97.20 77.60 65.96 58.04Sub - Total Non Current Liabilities 39679.60 35779.20 33209.70 28865.78
3) Current Liabilitiesa) Financial liabilities
i) Borrowings 2556.00 2448.50 2338.32 2233.09ii) Trade payables 7494.90 11361.60 12194.34 13066.02iii) Other financial liabilities 4843.50 4217.50 3695.27 3325.74
b) Other Current liabilities 883.50 841.20 799.14 759.18c) Provisions 357.90 417.00 444.11 465.42d) Current tax liabilities 704.60 761.10 797.63 825.55Sub - Total Current Liabilities 16840.40 20046.90 20268.81 20675.01
Total Equity and Liabilities (1+2+3) 90406.50 96176.20 102894.42 109312.71

Document code: FOTL_180920185_1 Copyright © 2016 Firstobject Technologies Ltd. All rights reserved
Annual Profit & Loss Statement for the period of 2017 to 2020E
Value(Rs.in.mn) FY17A FY18A FY19E FY20E
Description 12m 12m 12m 12mNet Sales 60063.20 75578.10 86914.82 99082.89Other Income 248.60 400.30 480.36 569.23Total Income 60311.80 75978.40 87395.18 99652.12Expenditure -46610.30 -60394.30 -69184.19 -78572.73Operating Profit 13701.50 15584.10 18210.98 21079.38Interest -3411.10 -2842.80 -2672.23 -2538.62Gross profit 10290.40 12741.30 15538.75 18540.76Depreciation -2914.00 -4150.50 -4316.52 -4618.68Profit Before Tax 7376.40 8590.80 11222.23 13922.09Tax -1630.20 -2246.60 -3086.11 -3636.45Profit After Tax 5746.20 6344.20 8136.12 10285.64Minority Interest 10.30 83.90 57.05 52.49Net Profit 5756.50 6428.10 8193.17 10338.13Equity capital 155.70 155.80 155.80 155.80Reserves 34204.70 40709.50 48902.67 59240.80Face value 1.00 1.00 1.00 1.00EPS 36.97 41.26 52.59 66.36
Quarterly Profit & Loss Statement for the period of 31st Dec, 2017 to 30th Sep, 2018E
Value(Rs.in.mn) 31-Dec-17 31-Mar-18 30-Jun-18 30-Sep-18EDescription 3m 3m 3m 3mNet sales 20677.60 22519.60 20786.50 21202.23Other income 32.20 229.10 94.70 97.54Total Income 20709.80 22748.70 20881.20 21299.77Expenditure -16509.20 -17940.90 -16410.50 -16951.18Operating profit 4200.60 4807.80 4470.70 4348.59Interest -770.60 -724.80 -727.00 -705.19Gross profit 3430.00 4083.00 3743.70 3643.40Depreciation -818.20 -1817.40 -880.00 -915.20Profit Before Tax 2611.80 2265.60 2863.70 2728.20Tax -483.40 -741.60 -860.00 -778.90Profit After Tax 2128.40 1524.00 2003.70 1949.30Minority Interest -3.00 24.70 21.30 17.47Net Profit 2125.40 1548.70 2025.00 1966.76Equity capital 155.70 155.80 155.80 155.80Face value 1.00 1.00 1.00 1.00EPS 13.65 9.94 13.00 12.62
Document code: FOTL_180920185_1 Copyright © 2016 Firstobject Technologies Ltd. All rights reserved
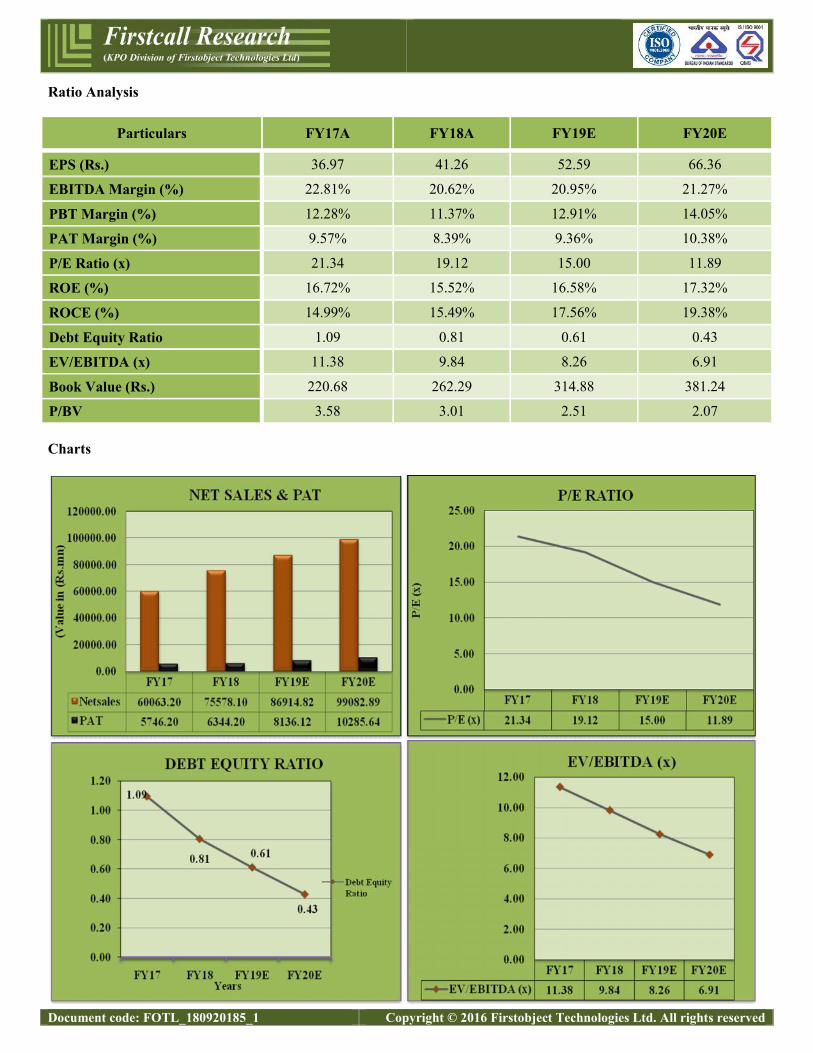
Ratio Analysis
Particulars FY17A FY18A FY19E FY20E
EPS (Rs.) 36.97 41.26 52.59 66.36
EBITDA Margin (%) 22.81% 20.62% 20.95% 21.27%
PBT Margin (%) 12.28% 11.37% 12.91% 14.05%
PAT Margin (%) 9.57% 8.39% 9.36% 10.38%
P/E Ratio (x) 21.34 19.12 15.00 11.89
ROE (%) 16.72% 15.52% 16.58% 17.32%
ROCE (%) 14.99% 15.49% 17.56% 19.38%
Debt Equity Ratio 1.09 0.81 0.61 0.43
EV/EBITDA (x) 11.38 9.84 8.26 6.91
Book Value (Rs.) 220.68 262.29 314.88 381.24
P/BV 3.58 3.01 2.51 2.07
Charts

Document code: FOTL_180920185_1 Copyright © 2016 Firstobject Technologies Ltd. All rights reserved
OUTLOOK AND CONCLUSION
At the current market price of Rs. 789.05, the stock P/E ratio is at 15.00 x FY19E and 11.89 x FY20E respectively.
Earning per share (EPS) of the company for the earnings for FY19E and FY20E is seen at Rs. 52.59 and Rs.66.36
respectively.
Net sales and PAT of the company are expected to grow at a CAGR of 14% and 28% over 2017 to 2020E,
respectively.
On the basis of EV/EBITDA, the stock trades at 8.26 x for FY19E and 6.91 x for FY20E.
Price to Book Value of the stock is expected to be at 2.51 x and 2.07 x for FY19E and FY20E respectively.
The company expects to deliver higher revenues and operating profits in FY19. New products and current contract
execution in Radiopharmaceuticals is expected to drive growth of Specialty Pharmaceuticals business. Addition of new
capacities to meet existing strong demand is expected to drive growth in CMO. Allergy Therapy Products to witness
higher sales due to existing products like Venom and new capacities. API & Generics segment growth to be driven by
higher volumes from new product launches and market expansions and also from initiatives to optimize costs from higher
efficiencies. Life Science Ingredients revenue growth expected to continue backed by healthy demand; Growth in
revenues from new product launches, new orders, new capacities coming on stream and debottlenecking of existing
plants. The company will continue its efforts to strengthen balance sheet by reducing debt and improving financial ratios.
Hence, we say that, we are Overweight in this particular script for Medium to Long term investment.

Document code: FOTL_180920185_1 Copyright © 2016 Firstobject Technologies Ltd. All rights reserved
INDUSTRY OVERVIEW
India is the largest provider of generic drugs globally. Indian pharmaceutical sector industry supplies over 50 per cent of
global demand for various vaccines, 40 per cent of generic demand in the US and 25 per cent of all medicine in UK.
India enjoys an important position in the global pharmaceuticals sector. The country also has a large pool of scientists and
engineers who have the potential to steer the industry ahead to an even higher level. Presently over 80 per cent of the
antiretroviral drugs used globally to combat AIDS (Acquired Immuno Deficiency Syndrome) are supplied by Indian
pharmaceutical firms.
The pharmaceutical sector was valued at US$ 33 billion in 2017. The country’s pharmaceutical industry is expected to
expand at a CAGR of 22.4 per cent over 2015–20 to reach US$ 55 billion. India’s pharmaceutical exports stood at US$
17.27 billion in 2017-18 and are expected to reach US$ 20 billion by 2020.
Indian companies received 304 Abbreviated New Drug Application (ANDA) approvals from the US Food and Drug
Administration (USFDA) in 2017. The country accounts for around 30 per cent (by volume) and about 10 per cent (value)
in the US$ 70-80 billion US generics market.
The Union Cabinet has given its nod for the amendment of the existing Foreign Direct Investment (FDI) policy in the
pharmaceutical sector in order to allow FDI up to 100 per cent under the automatic route for manufacturing of medical
devices subject to certain conditions.
The drugs and pharmaceuticals sector attracted cumulative FDI inflows worth US$ 15.59 billion between April 2000 and
December 2017, according to data released by the Department of Industrial Policy and Promotion (DIPP).
Government Initiatives
Some of the initiatives taken by the government to promote the pharmaceutical sector in India are as follows:
The National Health Protection Scheme is largest government funded healthcare programme in the world, which
is expected to benefit 100 million poor families in the country by providing a cover of up to Rs 5 lakh (US$
7,723.2) per family per year for secondary and tertiary care hospitalisation. The programme was announced in
Union Budget 2018-19.
In March 2018, the Drug Controller General of India (DCGI) announced its plans to start a single-window facility
to provide consents, approvals and other information. The move is aimed at giving a push to the Make in India
initiative.
The Government of India is planning to set up an electronic platform to regulate online pharmacies under a new
policy, in order to stop any misuse due to easy availability.
The Government of India unveiled 'Pharma Vision 2020' aimed at making India a global leader in end-to-end drug
manufacture. Approval time for new facilities has been reduced to boost investments.

Document code: FOTL_180920185_1 Copyright © 2016 Firstobject Technologies Ltd. All rights reserved
The government introduced mechanisms such as the Drug Price Control Order and the National Pharmaceutical
Pricing Authority to deal with the issue of affordability and availability of medicines.
Road Ahead
Medicine spending in India is expected to increase at 9-12 per cent CAGR between 2018-22 to US$ 26-30 billion, driven
by increasing consumer spending, rapid urbanisation, and raising healthcare insurance among others.
Going forward, better growth in domestic sales would also depend on the ability of companies to align their product
portfolio towards chronic therapies for diseases such as such as cardiovascular, anti-diabetes, anti-depressants and anti-
cancers that are on the rise.
The Indian government has taken many steps to reduce costs and bring down healthcare expenses. Speedy introduction of
generic drugs into the market has remained in focus and is expected to benefit the Indian pharmaceutical companies. In
addition, the thrust on rural health programmes, lifesaving drugs and preventive vaccines also augurs well for the
pharmaceutical companies.

Document code: FOTL_180920185_1 Copyright © 2016 Firstobject Technologies Ltd. All rights reserved
Disclosure Section
The information and opinions in Firstcall Research was prepared by our analysts and it does not constitute an offer orsolicitation for the purchase or sale of any financial instrument including any companies scrips or this is not an officialconfirmation of any transaction. The information contained herein is from publicly available secondary sources and dataor other secondary sources believed to be reliable but we do not represent that it is accurate or complete and it should notbe relied on as such. Firstcall Research or any of its affiliates shall not be in any way responsible for any loss or damagethat may arise to any person from any inadvertent error in the information contained in this report. Firstcall Research and/or its affiliates and/or employees will not be liable for the recipients’ investment decision based on this document.
Analyst Certification
The following analysts hereby state that their views about the companies and sectors are on best effort basis to the best oftheir knowledge. Unless otherwise stated, the individuals listed on the cover page of this report are research analysts. Theanalyst qualifications, sectors covered and their exposure if any are tabulated hereunder:
Name of the Analyst Qualifications SectorsCovered
Exposure/Interest tocompany/sector UnderCoverage in the CurrentReport
Dr.C.V.S.L. Kameswari M.Sc, PGDCA,M.B.A,Ph.D (Finance)
Pharma &Diversified
No Interest/ Exposure
U. Janaki Rao M.B.A CapitalGoods
No Interest/ Exposure
B. Anil Kumar M.B.A Auto, IT &FMCG
No Interest/ Exposure
M. Vijay M.B.A Diversified No Interest/ ExposureV. Harini Priya M.B.A Diversified No Interest/ ExposureB. Srikanth M.B.A Diversified No Interest/ Exposure
Important Disclosures on Subject Companies
In the next 3 months, neither Firstcall Research nor the Entity expects to receive or intends to seek compensation for anyservices from the company under the current analytical research coverage. Within the last 12 months, Firstcall Researchhas not received any compensation for its products and services from the company under the current coverage. Within thelast 12 months, Firstcall Research has not provided or is providing any services to, or has any client relationship with, thecompany under current research coverage.
Within the last 12 months, Firstcall Research has neither provided or is providing any services to and/or in the past has notentered into an agreement to provide services or does not have a client relationship with the company under the researchcoverage.
Certain disclosures listed above are also for compliance with applicable regulations in various jurisdictions. FirstcallResearch does not assign ratings of Buy, Hold or Sell to the stocks we cover. Overweight, Equal-weight, No-Weight andUnderweight are not the equivalent of buy, hold and sell. Investors should carefully read the definitions of all weightsused in Firstcall Research. In addition, since Firstcall Research contains more complete information concerning theanalyst's views, investors should carefully read Firstcall Research, in its entirety, and not infer the contents from theweightages assigned alone. In any case, weightages (or research) should not be used or relied upon as investment advice.

Document code: FOTL_180920185_1 Copyright © 2016 Firstobject Technologies Ltd. All rights reserved
An investor's decision to buy or sell should depend on individual circumstances (such as the investor's own discretion, hisability of understanding the dynamics, existing holdings) and other considerations.
Analyst Stock Weights
Overweight (O): The stock's total return is expected to exceed the average total return of the analyst's industry (orindustry team's) coverage universe, on a risk-adjusted basis, over the next 12-18 months.
Equal-weight (E): The stock's total return is expected to be in line with the average total return of the analyst's industry(or industry team's) coverage universe, on a risk-adjusted basis, over the next 12-18 months.
No-weight (NR): Currently the analyst does not have adequate conviction about the stock's total return relative to theaverage total return of the analyst's industry (or industry team's) coverage universe, on a risk-adjusted basis, over the next12-18 months.
Underweight (U): The stock's total return is expected to be below the average total return of the analyst's industry (orindustry team's) coverage universe, on a risk-adjusted basis, over the next 12-18 months.
Unless otherwise specified, the weights included in Firstcall Research does not indicate any price targets. The statisticalsummaries of Firstcall Research will only indicate the direction of the industry perception of the analyst and theinterpretations of analysts should be seen as statistical summaries of financial data of the companies with perceivedindustry direction in terms of weights.
Firstcall Research may not be distributed to the public media or quoted or used by the public media without the expresswritten consent of Firstcall Research. The reports of Firstcall Research are for Information purposes only and is not to beconstrued as a recommendation or a solicitation to trade in any securities/instruments. Firstcall Research is not abrokerage and does not execute transactions for clients in the securities/instruments.
Firstcall Research - Overall StatementS.No Particulars Remarks1 Comments on general trends in the securities market Full Compliance in Place2 Discussion is broad based and also broad based indices Full Compliance in Place3 Commentaries on economic, political or market conditions Full Compliance in Place4
Periodic reports or other communications not for public appearanceFull Compliance in Place
5 The reports are statistical summaries of financial data of the companies as and whereapplicable
Full Compliance in Place
6 Analysis relating to the sector concerned Full Compliance in Place7 No material is for public appearance Full Compliance in Place8 We are no intermediaries for anyone and neither our entity nor our analysts have any
interests in the reportsFull Compliance in Place
9 Our reports are password protected and contain all the required applicable disclosures Full Compliance in Place
10 Analysts as per the policy of the company are not entitled to take positions either fortrading or long term in the analytical view that they form as a part of their work
Full Compliance in Place
11 No conflict of interest and analysts are expected to maintain strict adherence to thecompany rules and regulations.
Full Compliance in Place
12As a matter of policy no analyst will be allowed to do personal trading or deal andeven if they do so they have to disclose the same to the company and take priorapproval of the company
Full Compliance in Place

Document code: FOTL_180920185_1 Copyright © 2016 Firstobject Technologies Ltd. All rights reserved
13Our entity or any analyst shall not provide any promise or assurance of any favorableoutcome based on their reports on industry, company or sector or group
Full Compliance in Place
14 Researchers maintain arms length/ Chinese wall distance from other employees of theentity
Full Compliance in Place
15No analyst will be allowed to cover or do any research where he has financial interest
Full Compliance in Place
16 Our entity does not do any reports upon receiving any compensation from anycompany
Full Compliance in Place
Firstcall Research Provides
Industry Research on all the Sectors and Equity Research on Major Companiesforming part of Listed and Unlisted Segments
For Further Details Contact:Mobile No: 09959010555
E-mail: [email protected]@firstcallresearch.comwww.firstcallresearch.com