th latin america eu symposium on ict regulation sources: nsn and cisco vni mobile forecast, 2013...
TRANSCRIPT
4th Latin America – EU Symposium on ICT Regulation
Marcelo Mejias November 19th, 2013
1
2
Agenda
Brazilian telecommunications: a case of success Big sport events, big data, big challenges
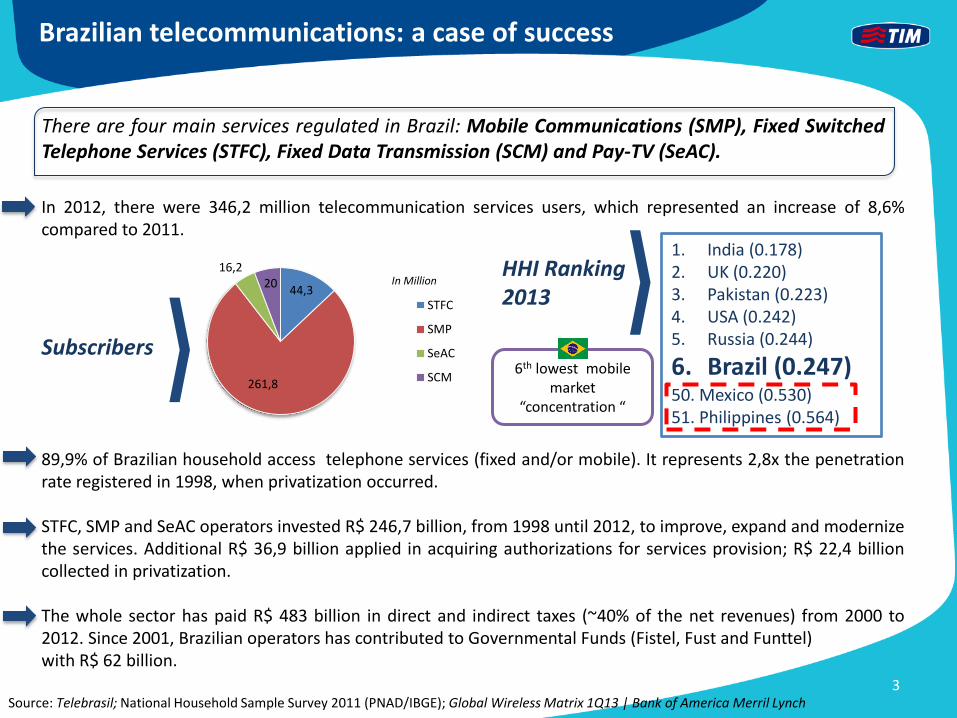
In 2012, there were 346,2 million telecommunication services users, which represented an increase of 8,6% compared to 2011.
89,9% of Brazilian household access telephone services (fixed and/or mobile). It represents 2,8x the penetration rate registered in 1998, when privatization occurred. STFC, SMP and SeAC operators invested R$ 246,7 billion, from 1998 until 2012, to improve, expand and modernize the services. Additional R$ 36,9 billion applied in acquiring authorizations for services provision; R$ 22,4 billion collected in privatization. The whole sector has paid R$ 483 billion in direct and indirect taxes (~40% of the net revenues) from 2000 to 2012. Since 2001, Brazilian operators has contributed to Governmental Funds (Fistel, Fust and Funttel) with R$ 62 billion.
There are four main services regulated in Brazil: Mobile Communications (SMP), Fixed Switched Telephone Services (STFC), Fixed Data Transmission (SCM) and Pay-TV (SeAC).
44,3
261,8
16,2 20
STFC
SMP
SeAC
SCM
In Million
Source: Telebrasil; National Household Sample Survey 2011 (PNAD/IBGE); Global Wireless Matrix 1Q13 | Bank of America Merril Lynch
Brazilian telecommunications: a case of success
3
1. India (0.178) 2. UK (0.220) 3. Pakistan (0.223) 4. USA (0.242) 5. Russia (0.244)
6. Brazil (0.247)
50. Mexico (0.530) 51. Philippines (0.564)
HHI Ranking 2013
Subscribers 6th lowest mobile
market “concentration “
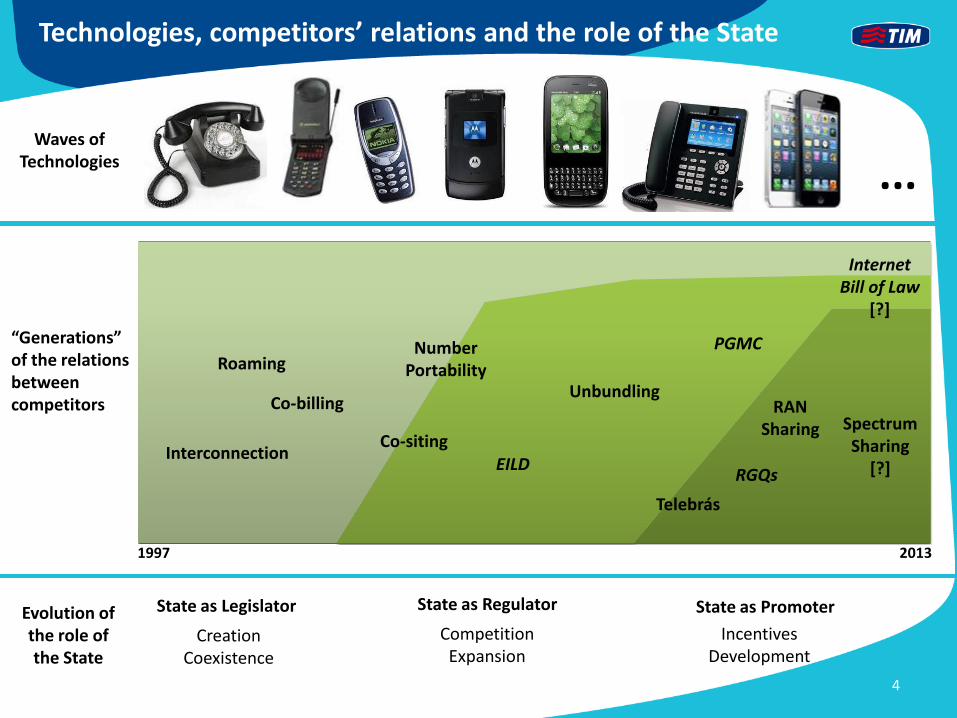
... Waves of
Technologies
Evolution of the role of the State
State as Legislator State as Regulator State as Promoter
Creation Coexistence
Competition Expansion
Incentives Development
“Generations” of the relations between competitors RAN
Sharing
Interconnection RGQs
Spectrum Sharing
[?] EILD
Unbundling
Co-siting
Co-billing
Roaming
1997 2013
PGMC
Telebrás
Internet Bill of Law
[?]
Number Portability
Technologies, competitors’ relations and the role of the State
4
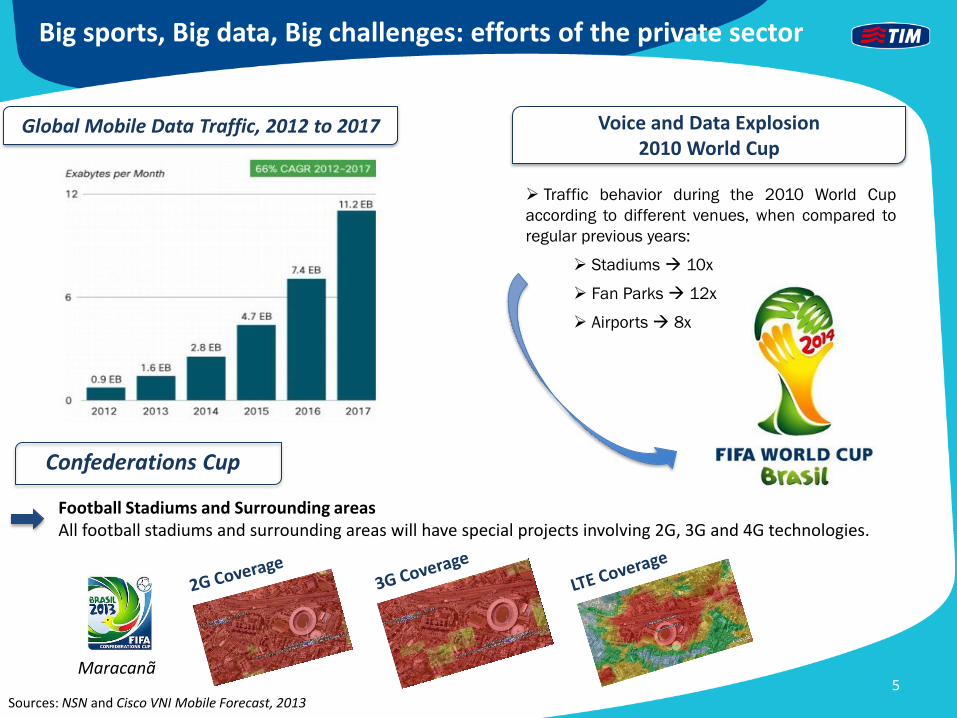
Global Mobile Data Traffic, 2012 to 2017
Sources: NSN and Cisco VNI Mobile Forecast, 2013
Voice and Data Explosion
2010 World Cup
Football Stadiums and Surrounding areas All football stadiums and surrounding areas will have special projects involving 2G, 3G and 4G technologies.
Confederations Cup
Maracanã
Traffic behavior during the 2010 World Cup
according to different venues, when compared to
regular previous years:
Stadiums 10x
Fan Parks 12x
Airports 8x
Big sports, Big data, Big challenges: efforts of the private sector
5
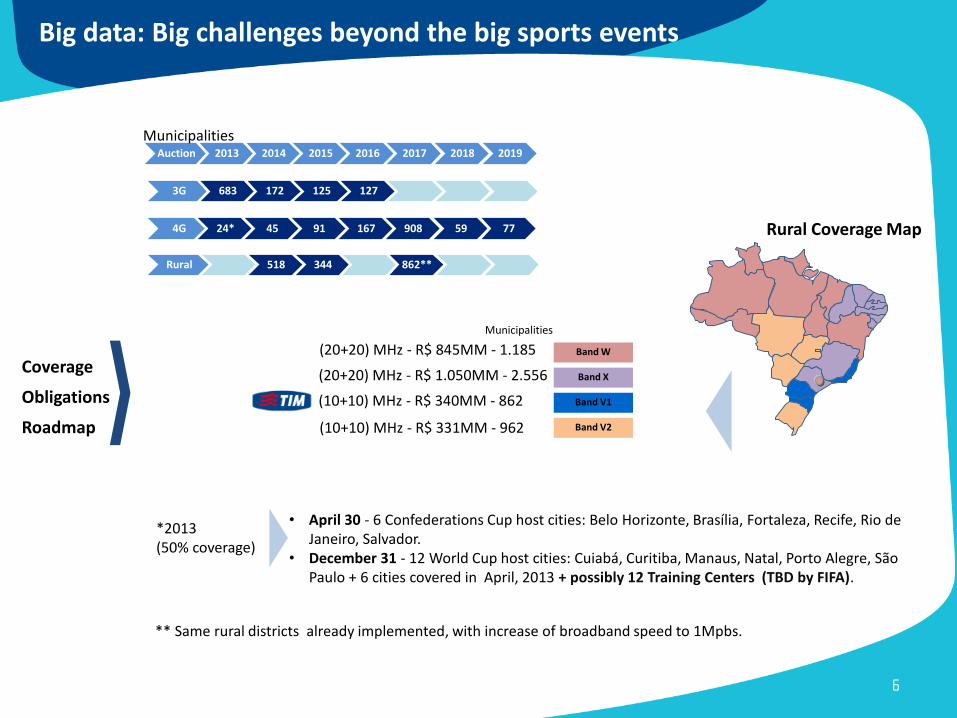
Coverage
Obligations
Roadmap
Auction 2013 2014 2015 2016 2017 2018 2019
3G 683 172 125 127
4G 24* 45 91 167 908 59 77
Rural 518 344 862**
• April 30 - 6 Confederations Cup host cities: Belo Horizonte, Brasília, Fortaleza, Recife, Rio de Janeiro, Salvador.
• December 31 - 12 World Cup host cities: Cuiabá, Curitiba, Manaus, Natal, Porto Alegre, São Paulo + 6 cities covered in April, 2013 + possibly 12 Training Centers (TBD by FIFA).
*2013 (50% coverage)
** Same rural districts already implemented, with increase of broadband speed to 1Mpbs.
Rural Coverage Map
Band W
Band X
Band V1
Band V2
(20+20) MHz - R$ 845MM - 1.185
(20+20) MHz - R$ 1.050MM - 2.556
(10+10) MHz - R$ 340MM - 862
(10+10) MHz - R$ 331MM - 962
Municipalities
Municipalities
Big data: Big challenges beyond the big sports events
6
Sources: ANATEL and TIM - National Improvement Plan 2012-2014
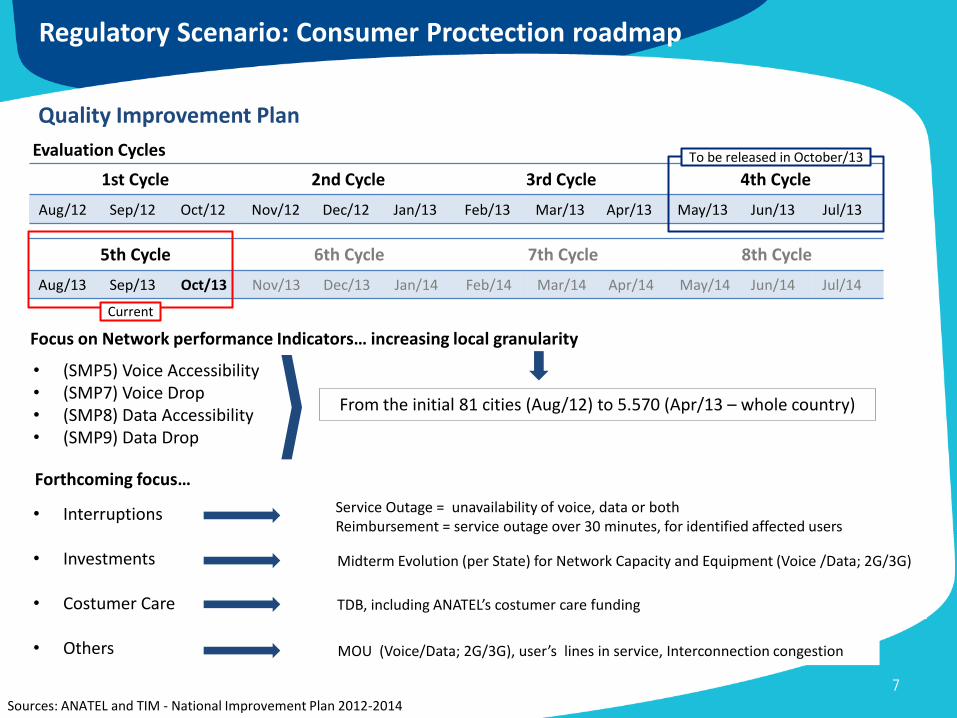
Quality Improvement Plan
• (SMP5) Voice Accessibility • (SMP7) Voice Drop • (SMP8) Data Accessibility • (SMP9) Data Drop
• Interruptions
• Investments
• Costumer Care
• Others
Midterm Evolution (per State) for Network Capacity and Equipment (Voice /Data; 2G/3G)
Service Outage = unavailability of voice, data or both Reimbursement = service outage over 30 minutes, for identified affected users
MOU (Voice/Data; 2G/3G), user’s lines in service, Interconnection congestion
1st Cycle 2nd Cycle 3rd Cycle 4th Cycle
Aug/12 Sep/12 Oct/12 Nov/12 Dec/12 Jan/13 Feb/13 Mar/13 Apr/13 May/13 Jun/13 Jul/13
5th Cycle 6th Cycle 7th Cycle 8th Cycle
Aug/13 Sep/13 Oct/13 Nov/13 Dec/13 Jan/14 Feb/14 Mar/14 Apr/14 May/14 Jun/14 Jul/14
Evaluation Cycles
Focus on Network performance Indicators… increasing local granularity
Forthcoming focus…
From the initial 81 cities (Aug/12) to 5.570 (Apr/13 – whole country)
TDB, including ANATEL’s costumer care funding
Current
To be released in October/13
Regulatory Scenario: Consumer Proctection roadmap
7
Sources: TIM – Investor Relations
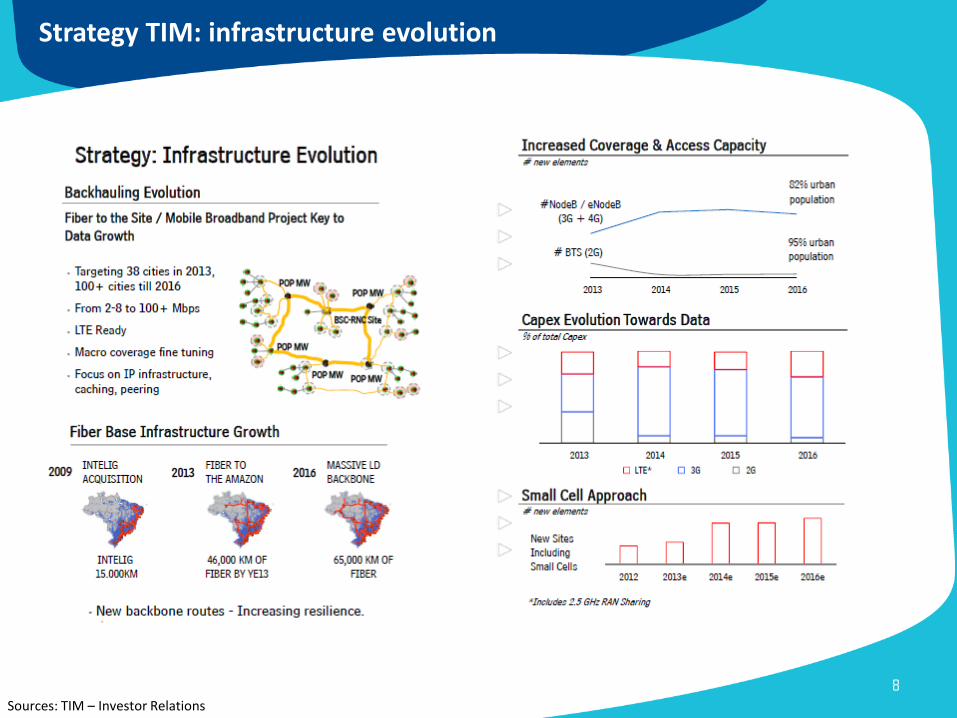
Strategy TIM: infrastructure evolution
8
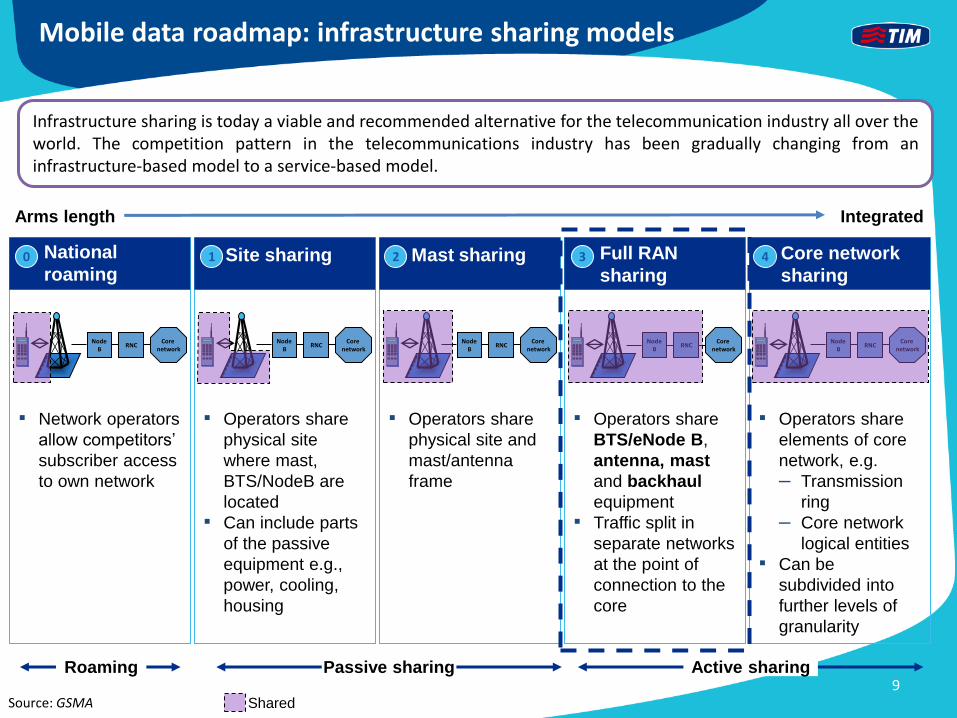
National
roaming 0 Site sharing 1 Mast sharing 2 Full RAN
sharing 3 Core network
sharing 4
▪ Network operators
allow competitors’
subscriber access
to own network
Node B
Core network
RNC
▪ Operators share
physical site
where mast,
BTS/NodeB are
located
▪ Can include parts
of the passive
equipment e.g.,
power, cooling,
housing
Node B
Core network
RNC
▪ Operators share
physical site and
mast/antenna
frame
▪ Operators share
BTS/eNode B,
antenna, mast
and backhaul
equipment
▪ Traffic split in
separate networks
at the point of
connection to the
core
Node B
Core network
RNC Node
B Core
network RNC
Node B
Core network
RNC
▪ Operators share
elements of core
network, e.g.
– Transmission
ring
– Core network
logical entities
▪ Can be
subdivided into
further levels of
granularity
Arms length Integrated
Passive sharing Active sharing Roaming
Source: GSMA Shared
Infrastructure sharing is today a viable and recommended alternative for the telecommunication industry all over the world. The competition pattern in the telecommunications industry has been gradually changing from an infrastructure-based model to a service-based model.
Mobile data roadmap: infrastructure sharing models
9
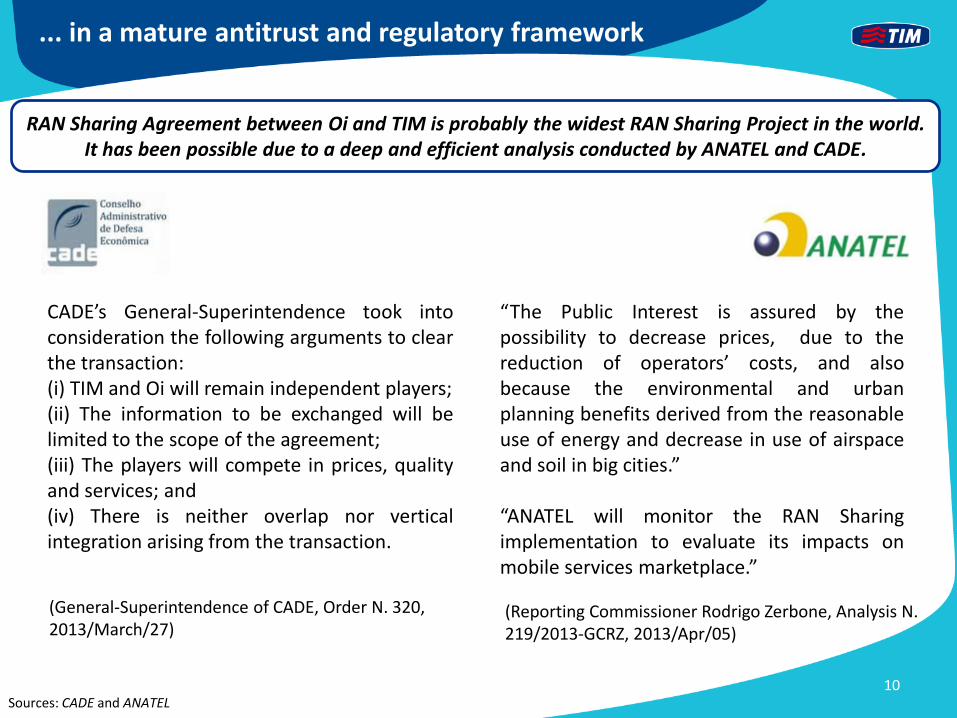
CADE’s General-Superintendence took into consideration the following arguments to clear the transaction: (i) TIM and Oi will remain independent players; (ii) The information to be exchanged will be limited to the scope of the agreement; (iii) The players will compete in prices, quality and services; and (iv) There is neither overlap nor vertical integration arising from the transaction.
“The Public Interest is assured by the possibility to decrease prices, due to the reduction of operators’ costs, and also because the environmental and urban planning benefits derived from the reasonable use of energy and decrease in use of airspace and soil in big cities.” “ANATEL will monitor the RAN Sharing implementation to evaluate its impacts on mobile services marketplace.”
RAN Sharing Agreement between Oi and TIM is probably the widest RAN Sharing Project in the world. It has been possible due to a deep and efficient analysis conducted by ANATEL and CADE.
... in a mature antitrust and regulatory framework
Sources: CADE and ANATEL 10
(General-Superintendence of CADE, Order N. 320, 2013/March/27)
(Reporting Commissioner Rodrigo Zerbone, Analysis N. 219/2013-GCRZ, 2013/Apr/05)
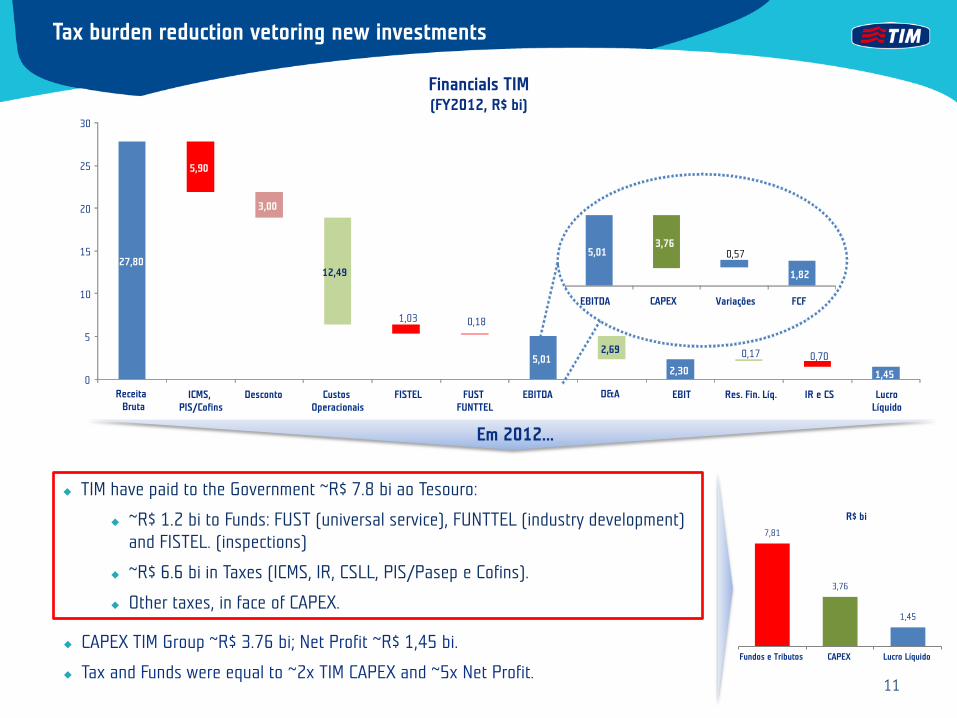
Tax burden reduction vetoring new investments
Financials TIM (FY2012, R$ bi)
TIM have paid to the Government ~R$ 7.8 bi ao Tesouro:
~R$ 1.2 bi to Funds: FUST (universal service), FUNTTEL (industry development) and FISTEL. (inspections)
~R$ 6.6 bi in Taxes (ICMS, IR, CSLL, PIS/Pasep e Cofins).
Other taxes, in face of CAPEX.
7,81
3,76
1,45
Fundos e Tributos CAPEX Lucro Líquido
R$ bi
CAPEX TIM Group ~R$ 3.76 bi; Net Profit ~R$ 1,45 bi.
Tax and Funds were equal to ~2x TIM CAPEX and ~5x Net Profit.
Em 2012...
5,90
3,00
12,49
1,03 0,18
2,69 0,17 0,70
0
5
10
15
20
25
30
Receita Bruta
ICMS, PIS/Cofins
Desconto Custos Operacionais
FISTEL FUST FUNTTEL
EBITDA D&A EBIT Res. Fin. Líq. IR e CS Lucro Líquido
3,76 0,57
EBITDA CAPEX Variações FCF
27,80
5,01 2,30 1,45
5,01
1,82
11
Thank you!
12