th - mb.cision.com
TRANSCRIPT

ANNUAL REPORT 2019 Otello Corporation ASATURNAROUND
& GROWTH

2 3OTELLO CORPORATION ASA - ANNUAL REPORT 2019 OTELLO CORPORATION ASA - ANNUAL REPORT 2019
$ 52 M
$ 108 M
$ 171 M
$ 240.7 M
$ 56 M
$ 63 M
$ 70 M
Q1
Q2
Q3
Q4
Revenue of 2019
Strong growth th
roughout the year
Table of contentsOtello Corporation ASA Annual Report 2019
Key figures 06
Group Overview 10
CEO Letter 12
AdColony Back to the future 14
Bemobi Subscribe to premium apps in a world of opportunities 26
Skyfire 40
Vewd 44
Shareholder information 48
Representation of Board of Directors 54
Report from the Board of Directors 56
Otello Group financial statements 78
Parent company financial statements 132
Auditor’s Report 158
Declaration of executive compensation policies 162
Principles of corporate governance 166

1995OPERA SOFTWARE FOUNDED
2004OPERA LISTED ON OSLO STOCK EXCHANGE
2014ACQUIRED
ADCOLONY
2015ACQUIREDSURFEASY
2017SURFEASYSOLD TO SYMANTEC
2013ACQUIREDSKYFIRE
2015ACQUIREDBEMOBI
2016OPERABROWSERBUSINESSSOLD
1997FIRST WEBBROWSERRELEASED
2005OPERA MINIRELEASED
2010ACQUIREDADMARVEL
2016MAJORITYSTAKE IN VEWDSOLD
2018CHANGEDNAME TO
OTELLOCORPORATION
2019ACQUIREDNOVITECH
The story continuesAcquisition of NovitechDuring 2019, Otello’s Bemobi business acquired certain assets from a Brazilian company, Novitech. The trans action included the following assets: hardware and software, intellectual property, commercial agreements with major Brazilian and Central American telecommunication carriers, as well as a few selected employees.
Bemobi regards this is an important strategic acquisition in many aspects. It enhances our channel offer and our current distribution platform, bringing a more diverse set of channels to our portfolio beyond the NDNC portals by adding a Voice based No Credit Portal. Further, it considerably raises our service distribution scale for our own services.

6 7OTELLO CORPORATION ASA - ANNUAL REPORT 2019 OTELLO CORPORATION ASA - ANNUAL REPORT 2019
OTELLO CORPORATION
Key numbers of 2019
RevenueUSD million
Total reachAdColony
Total reachBemobi
Paying subscribersBemobi
Bemobi paid subscribersNumbers in million
Bemobi paid subscribersNumbers in million
Adj. EBITDAUSD million
Revenue per currencyNumbers in percent
ShareholdersNumbers in percent
Revenue per regionUSD million
Revenue per regionUSD million
EPSUSD million
Revenue SourceUSD million
Mix of RevenueAdColony
Sales BreakdownAdColony
Operating systemBemobi
EmployeesOtelle Corporation
2018 20182019 2019
240.8
19.4275.4
9.4183.9
66.7%
48%
16.3%
47%
6.2%
5%
5.5%
0.9%
4.5%82.6EMEA
AMERICASASIA PACIFIC
132.226.0
44.0%
37%
70%
90%
56.2
0.9
$ 0.16
1.5
37
6750
27596
BILLION USERS GLOBALLY
NATIONALITIES REPRESENTED IN THE GROUP
CARRIERS
COUNTRIES
OFFICES AROUND THE WORLD
FULLTIME EMPLOYEES AND EQUIVALENTS
SUPPORTING MORE THAN
ACROSS MORE THAN
WIFI IS THE PRIMARY DATA SOURCE FOR MOST CONSUMERS
64% OF AD REQU-ESTS COM FROM WIFI VS 29% WITH MOBILE DATA
*The remaining percentage are users whose connections jumped between wifi and celluar mid-ad request! People are always on the move!
WE CONTINUALLY WORK TO IMPROVE THE GENDER BALANCE IN THE COMPANY. AT THE END OF 2019
OF OUR STAFF MEMBERS WERE WOMAN
NORWAY-BASED SHAREHOLDER ACCOUNTS
VIDEO
ANDROID
AdColony (Mobile Advertising)
USD
Instant Play
BRL
DKK
Spotify
TRY
INR
Other
INTERNATIONAL
Bemobi (Apps & Games)
LATAM
Corporate
Revenue source
USD million
34.6million
By Adweek Readers, AdColony was in 2019 named:
Best Mobile Ad Network13.1
17.020.3
26.7
41.2
34.6
15.0
2015 2016 2017 2018 2019
AS OF DECEMBER 31, 2019, OTELLO HAD A SHARE CAPITAL OF
NOK 2,809,549.58 (USD 319 502)
GROWTH IN PAYING SUBSCRIBERS IN 2019
▲29.7%
2.2 BILLION POTENTIAL CONSUMERS
Q4 2019Sales Breakdown
by Product
24.9
9.7
LATAM
International
Share- holders
44.0%Norwaybased accounts
36.5%U.K.based
accounts
6.8%Luxembourg
based accounts
3.8%U.S.based
accounts
2.8%Francebased
accounts
6.2%Accounts based elsewhere
MOBILE GAME PUBLISHERS ARE NOW INTEGRATED WITH ADCOLONY
42/100OF THE TOP

8 9OTELLO CORPORATION ASA - ANNUAL REPORT 2019 OTELLO CORPORATION ASA - ANNUAL REPORT 2019
Turnaround & GrowthTurnaround & Growth is not only this year’s concept for the Annual Report. It also reflects Otello’s financial year of 2019. We have seen a year with a strong growth and a complete turnaround for AdColony, one of our subsidiaries. This was the first back to YoY-growth since 3Q16. The Brand and Programmatic revenue was strong while Performance is still volatile. In addition, the cost for AdColony has been lower and the OPEX is reduced by over 50% the last 2 years and we are now at a sustainable level from where we can scale revenue.
For Bemobi, we have seen a coowned channel growth in international markets consistent with our strategy (34% of total new users). Our new voice based channels and omnichannel platform are getting traction in Brazil and are about to begin international rollout.
Over the past years, we have been on a journey where Otello has been taking a lead within mobile advertising and mo bile gaming. It’s all about the digital and mobile life we are living. Emerging markets are getting better availability and connectivity to the world due to our technology. We believe that our longterm strategy has been working well and that we can now start to climb new mountains.
This past year, we are more than happy to have climbed the mountain after periods in the val ley. Otello as a brand and a com pany ended 2019 with a turnaround complete and with growth, and in order to make sure we are ready for the future, we are eager to continue the journey we are on

10 11OTELLO CORPORATION ASA - ANNUAL REPORT 2019 OTELLO CORPORATION ASA - ANNUAL REPORT 2019
Otello Corporation ASA
• Otello is a holding company, listed on the Oslo Stock Exchange, holding the assets of AdColony, Bemobi, Skyfire and a share in Vewd
• Otello was formerly known as Opera Software ASA and has over 20 years of history
• Otello’s journey started in 1995 when Opera was established as a browser company
• Otello might have been known as an opera for some time, however, it is now a collection of companies within mobile advertising and apps & games with a reach of more than 2 billion users
Who is
100% ownership
AdColony is a mobile advertising platform focused on delivering performance and outcomes for brands, agencies, publishers and app developers, through high
quality advertising on mobile devices with a global consumer audience reach that exceeds 1.5 billion.
Revenue: $183.9 M / Adj. EBITDA: $0.3 M
88.8% ownership
Bemobi is a mobile media and entertainment company integrating people and mobile content through technology and distruptive services with presence in
more than 50 countries and a reach of over 34.6 million subscribers around the world.
Revenue: $56.2 M / Adj. EBITDA: $23.9 M
100% ownership
Skyfire enables mobile operators to optimize their network performance and quality as data traffic and the consump
tion of mobile video is exploding. The unique compression technology opens up new business models and revenue
streams for operators.
27% ownership
Vewd is the market leader in enabling the transition to OTT (over the top). Vewd’s suite of OTT solutions enable customers and partners to reach connected device viewers. Among others, companies like Sony, Verizon, Samsung and TiVo utilize
Vewd’s solutions.
Revenue: $47.1 M / EBIT: $20.6 M

12 13OTELLO CORPORATION ASA - ANNUAL REPORT 2019 OTELLO CORPORATION ASA - ANNUAL REPORT 2019Lars BoilesenChief Executive Officer
CEO letterFinancial summary of 2019Otello’s operating revenues fell by 13% to $240.8 million in 2019 (2018: 275.4 million), driven by a decline in AdColony, which was partly offset by growth in Bemobi. The decrease in revenue in AdColony was mainly due to slower product launches and ramp up of new products in addition to a general streamlining of the business and more focused operations. The significant cost focus paid off during 2019 and we have lowered the revenue breakeven point substantially as we enter 2020. 2019 was a turnaround year for AdColony and we excited the year being back to yearonyear revenue growth in 4Q19. AdColony reached its financial goal of the year of being Adj. EBITDA profitable for 2019.
Bemobi delivered growth in revenue and profit in 2019 vs 2018. Revenue growth of 4% and Adj. EBITDA growth of 10% would have been significantly stronger had it not been for adverse FX impact due in particular to a weaker BRL vs USD in 2019 vs 2018. During the year, we have added new services such as voice and financial, and achieved an increase in 8 million subscribers, a 30% growth over 2018. By the end of 2019 Bemobi was working with over 60 mobile operators, the majority outside LATAM, and with a total of 34.6 million subscribers, we are well on our way to taking this Brazilian success global. Based on positive feedback from investor meetings carried out throughout 2019, we continue to evaluate a separate listing of Bemobi in 2020, though the timing and completion of any listing is subject to market conditions and further investor feedback, and no assurances can be given that a listing will be achieved.
Moving forward, Otello will continue to focus on running efficient operations while developing unique and relevant products, and scalable business models which combined should generate revenue growth and margin expansion.
Lars Boilesen
In 2019, Otello delivered on its key objectives, including making AdColony adjusted EBITDA profitable and seeing revenue and adjusted EBITDA growth in Bemobi versus 2018. The turnaround in AdColony started to bear fruit and we reached yearonyear growth for AdColony in Q4. We were also able to negotiate an extension of the earnout agreement with the former owners in Bemobi and a new longterm CEO agreement with Pedro Ripper, which were finalized and signed in early 2020.
During 2019, Bemobi continued to meet with international investors, in order to consider whether an IPO of Bemobi could represent a realistic and value enhancing opportunity. Feedback from investor meetings has been positive and supportive of a potential IPO and based on this feedback we have continued to explore the proper jurisdiction to carry out an IPO.
We continued our share repurchases in 2019, buying back a total 0.9 million in shares, at $1.5 million, and ultimately canceling a total of 9 million shares in 2019 and 2 million shares in early 2020. Otello now finds itself in a strong financial position having limited debt and a net cash position as we enter 2020.
As we enter 2020 the world is grappling with the direct and indirect impacts of the Covid 19 virus. In this challenging situation, the primary focus of Otello has been the health and safety of our employees. Since midMarch, the Group entities have successfully managed to shift the vast majority of the operations to remote home offices. The operational impact is limited to a minimum and all business activities continue to operate as before the crisis. Due to the nature of our business in both AdColony and Bemobi, in terms of not having physical products and being reliant on the use of consumers mobile phones, we are in a relatively fortunate position. However, as our revenue is linked to the advertising spend of companies (AdColony) and subscriptions bought by consumers (Bemobi), we expect Covid19 to negatively impact revenue and profit in 2020. At this stage, it is still too early to tell how great this impact will be. Ultimately, it will be linked to the duration of the crisis and the knockon effect of the changed behavior of our customers.

14 15OTELLO CORPORATION ASA - ANNUAL REPORT 2019 OTELLO CORPORATION ASA - ANNUAL REPORT 2019
MOBILE ADVERTISING
AdColony

16 17OTELLO CORPORATION ASA - ANNUAL REPORT 2019 OTELLO CORPORATION ASA - ANNUAL REPORT 2019
AdColony is one of the largest mobile advertising platforms in the world with a reach of more than 1.5 billion monthly users globally. AdColony’s mission is to drive business outcomes that matter for advertisers and publishers using its bestinclass mobile technology, the highestquality mobile ad experiences and leveraging its curated reach.
Originally founded in 2008 as a mobile app developer, AdColony has been an innovation leader in mobile advertising and monetization since Apple first introduced the App Store. AdColony is passionate about delivering the highest quality video advertising, full screen interactive rich media ads, and beyond. AdColony is committed to delivering an experience that makes inapp mobile advertising a win for advertisers, developers, and users alike.
AdColony is known throughout the mobile industry for its unparalleled third-party verified viewability rates, exclusive InstantPlay™ and Aurora™ HD video technologies, rich media formats, global performance advertising business, programmatic marketplace, and extensive SDK footprint in the Top 1000 apps worldwide.
The Mobile Advertising Industry
AdColony’s PlaceBrand advertisers from the bestknown companies in the world woke up in 2019 to the power and reach of inapp advertising, and especially to mobile gaming. As privacy regulation across Europe, the United States and elsewhere continued to push social targeting ROIs lower, and the impending deprecation of legacy tracking standards like the Internet
Cookie brought significant turmoil to industry resellers and middlemen, AdColony’s owned supply of SDK inventory allowed it to not only survive a turbulent industry year but thrive.
As a vote of confidence from the industry, AdColony won the Best Mobile Ad Network award in the 2019 Readers Choice Awards presented by Adweek (one of the largest industry publications in the advertising space) with over 15,000 votes cast by industry peers. AdColony beat competitors including Google and Unity Ads for the award. This recognition is a significant milestone for AdColony and reinforces the commercial teams’ approach of maintaining strong client and partner relationships even as we transition to a more programmatic and automated industry.
For Brand AdvertisersWhat we call “brand advertisers” are the nongaming advertisers most nonindustry people think of when they think of digital ads. AdColony gives today’s biggest brand advertisers like Disney, Starbucks, Unilever, Toyota, and many more, the opportunity to reach consumers where they’re spending the most time — on their mobile devices.
AdColony operates both direct and programmatically for brands worldwide, giving more options to brands and agencies. Mobile gaming’s audience has long had the same [incorrect] stigma as console and PC gaming: young, male, with lowbuying power. Mobile gaming flips this on its head. Globally, research indicates that mobile gamers skew slightly female (51%), index higher for average household income (37% higher in the United States), like
ADCOLONY – A YEAR OF TURNAROUND AND GROWTH:
Back to the futureAfter a couple of years with restructuring and turnaround, AdColony is back where it belongs, ready for growth and mobile experiences of the future. AdColony is shaping the digital marketing ecosystems of tomorrow by delivering primetime advertising for today’s mobile world.
EXTENSIVE SDK FOOTPRINT IN THE TOP 1000 APPS WORLDWIDE
1.5 BILLION MONTHLY USERS GLOBALLY
AdColony is one of the largest mobile advertising platforms in the world with a reach of more than

18 19OTELLO CORPORATION ASA - ANNUAL REPORT 2019 OTELLO CORPORATION ASA - ANNUAL REPORT 2019
lihood to have a bachelor’s degree or higher (nearly 2x!) and identify as the primary household decisionmaker almost a third more often than the general population.
Mobile gamers are an audience that brand advertisers want and need.
AdColony has them, and thanks to its excellent relationships with brands, agencies, and agency holding companies, it is the premier mobile ad network for brands on this channel.
For PublishersAt the heart of AdColony’s advertising business is its supply, powered primarily by its SDK. A Software Development Kit (SDK) is a package of tools app developers use to perform a task, in the case of AdColony, to show ads to a user. Promoted by AdColony’s international publishing team, AdColony’s first-party SDK inventory offers advertisers access to audiences and optimizations no other platform can offer and sets AdColony apart from other competitors by owning much of its supply directly. This distinction is important in a more programmatic space and
gives AdColony significant value to advertisers. For publishers, the ability of AdColony’s SDK to show programmatic demand in addition to directsold campaigns is a huge advantage.
AdColony’s SDK is integrated into thousands of the top apps across iOS and Android around the world. Known for its video technology, AdColony’s SDK now features several Interactive Advertising Bureau (IAB) standard banner display options, making it amongst the most flexible monetization platforms for developers. The latest version of the SDK is also certified by the IAB’s Open Measurement Group, adding an additional layer of transparency for all clients and partners.
Using key thirdparty data partnerships, we are able to leverage our historical SDK data to deliver better results for our advertisers, including across programmatic campaigns.
For Mobile App User AcquisitionThe term “performance” for AdColony refers to gaming app install marketers running ads to get more installs for their gaming apps. The
best way for today’s hottest mobile games to maintain long-term growth and financial success is to acquire users in other apps. AdColony’s wide network of apps using its SDK for monetization gives user acquisition (UA) managers targeting options to find the perfect users for their own apps. In addition to video ads with unique endcards, UA campaigns can take advantage of Aurora™ HD Playables, and , with the introduction of AdColony SDK 4 late in the year, banner display ads. This makes AdColony a “onestopshop” for performance advertiser needs.
Brand & ExchangeIn 2019, AdColony’s brand business asserted itself as the driving margin and profit center for the business. With the significant 2018 restructure and costsavings realized across the year of 2019, the brand side of the company has grown from strength to strength around the world.
AdColony’s brand business is built on strong relationships with agencies (including with all major holding companies) and brands. These relationships are built on top of our technolo
gy, algorithms, and programmatic knowledge. Brand clients have overwhelmingly voiced their support for this humancentered approach to an automated industry.
Investment for GrowthWith profitability comes growth, and growth requires smart investment. Though AdColony’s brand revenue per head is higher than ever, we still need the right “boots on the ground” to make strategic growth moves. We have continued to invest in the right places across the brand organization.
In EMEA and APAC, new relationships with reseller partners in France, Germany, Russia, Myanmar, and New Zealand have broadened our reach considerably with minimal additional investment. We look forward to these relationships bearing further fruit in much the same way that our excellent partnerships in Latin America, Spain, and South Africa have done. From a technical perspective, the launch of a programmatic endpoint in APAC enabled the APAC brand sales team to deliver programmatic revenue more effectively in the region.

20 21OTELLO CORPORATION ASA - ANNUAL REPORT 2019 OTELLO CORPORATION ASA - ANNUAL REPORT 2019
Award-Winning RelationshipsHigh quality creative is key to AdColony’s value. AdColony won 48 awards in 2019 and was frequently cited as raising the bar for mobile creativity In North America, judicious selection of campaigns secured first-place wins in all three entered ceremonies. In EMEA, the AdColony received 31 awards across multiple award shows. In APAC, a region where awards are extremely important to ongoing client review and business relationships, AdColony brought home 14 awards across the region.
Performance & Publishing
AdColony was founded as an appinstall (performance) and monetization company, by mobile app developers who saw a need for both. Performance has remained a core part of AdColony’s business model even as our brand & exchange business has risen to prominence recently. A lot has changed within performance the 11 years since AdColony was established. According to reports from SensorTower and App Annie, the mobile apps market grew from a total of 8 billion downloads in 2010 to over 200 billion in 2019.
The App Install IndustryMajor changes have come to the appinstall industry in recent years. 2019 saw both Apple and Google take a privacycentric approach to their operating systems. Apple introduced new guidelines that prevent any advertisements in apps designed for children, and Google introduced its Designed for Families (DFF) program that only allows certified ad networks to show advertisements in Apps designed for children.
As a certified ad network under Google’s DFF program, AdColony does not expect any significant business impact on Android. Since Apple guidelines prevent AdColony from advertising in children’s apps we do expect a small business impact on the Apple iOS platform.
AdColony already limits the amount of personal data we collect and has one of the most consumerfriendly privacy and data rights policies in adtech. Because of this proactive approach to user privacy, many of Apple and Google’s privacy changes will have a minimal impact on AdColony’s business relative to other advertising partners. Our privacycentric approach and limited data collection positions AdColony well for GDPR, CCPA and similar privacy legislation.
Reforming Performance2019 saw continued work to consolidate operational roles to Turkey, including most nonclientfacing roles on the business development side. Teams in North America, EMEA, and APAC were also consolidated to align our demand and supply resources and drive superior results for performance clients, as well as publishing partners.
As a result of the continued reorganization of our performance business, margins have returned to the ’20s, a noted improvement from FY18, when margins had taken a hit and dipped to less than 20%. The teams have been diligently working to streamline contracts with both supply and demand partners on the performance side, leading to more consistent reporting and more straightforward handling of customer accounts.
To enhance performance results, AdColony also partnered with a thirdparty data science company during 2019 to explore and build new models to improve demand and supply matches. This led to an increase in install rates and eCPM (Effective cost per thousand impressions).
SDK Results & Penetration2019 saw the introduction of our latest SDK version 4.1, which includes display ads for the first time ever, and represents a massive potential revenue opportunity for advertisers and publishers of all kinds. This launch was successful and reached a ~50% adoption rate by the end of 2019, exceeding our expectations The Publishing team will be making the addition of display zones to our publisher partners a priority in 2020.
The growth of advanced mediation amongst publishers has also greatly benefitted AdColony. We have long been at the forefront of this space through our partnerships with Fyber, MoPub, MAX, and Facebook, but the end of the year saw the percent of total revenue handled by advanced mediation reach 16.4%, double what we saw previously. 2020 has started strongly as well with the most recent results hitting 21%. These more transparent and event auctions for impressions mean better results for advertisers and higher eCPMs for publishers.
Continued emphasis on margin management remained a focus last year. AdColony’s product team rolled out several new iterations of our Core™ model over the course of the year that
AdColony Named “Best Mobile Ad Network” by Adweek Readers
During 2019, AdColony, the inapp marketplace for brands, were proud to accept the award for “Best Mobile Ad Network” from the 2019 Adweek Readers’ Choice: Best of Tech awards. The renowned trade publication for the advertising and marketing industry asked its readers to recognize the top providers across 24 categories of advertising and marketing technology.
The Readers’ Choice award indicates strong support from the advertising and marketing community at large, and the company plans to sustain its positive brand reputation by providing ongoing value for brand advertisers and publishers, with particular focus on its hightouch approach to client service.
Driving consumer reach in a way that is scalable, effective, entertaining and brand safe is becoming increasingly hard for marketers. AdColony has strategically positioned themselves as a leader in providing brands a platform to check all of those
Independent marketplace for mobile campaigns recognized for the strength of its client services, creative executions, and technology platform.
boxes. Adweek’s readers chose well; this award was well deserved and it’s an honor to be in the same category as Google and Unity, two undisputed leaders in the advertising and gaming space.
At a time when the industry is focused on automation more than ever, we firmly believe in the continued value of relationships and providing unparalleled support to our partners. AdColony’s new SDK is an allinone solution for display and video, and we feel confident it will produce superior results for all of their partners.
While improvements to its mobile ad technology platform are a top priority, AdColony will continue to invest in its other clear strengths: creative executions for brands and its powerful relationships with publishers and advertisers.
Latin America, where AdColony has had programmatic sales for 2 years managed to have programmatic revenue growth of
Growth in EMEA has also been buoyed by strong LinkedIn and Spotify partnership sales, which had a
50% growth from FY18 to FY19
ADCOLONY WON
48 AWARDS IN 2019
▲258%

22 23OTELLO CORPORATION ASA - ANNUAL REPORT 2019 OTELLO CORPORATION ASA - ANNUAL REPORT 2019
resulted in more stable margins that require less manual optimization, allowing our publishing growth teams to focus on other priorities to actively grow the business.
AdColony remains the only major network that delivers both performance and brand demand at scale for publishers. For the first time, the end of 2019 saw an even balance between performance and brand both direct and programmatic. This remains a key point of differentiation when speaking with our publishers, and both business development and marketing messaging in the next year will see that focus grow.
Additional Growth2019 also saw the formation of a dedicated New Business Team based primarily in Turkey, focused on driving access to supply with leading gaming publishers. 42 of the Top 100 mobile game publishers are now integrated with AdColony. Some of the biggest names include Kwalee, Playgendary, FGFF, and Codi games. Significantly impacting this growth was the AdColony Advanced Monetization Fund (AMP) promotion in the first half of 2019. Devised and implemented by AdColony’s marketing team, AMP brought in multiple Top 100 publishers as well as significant long-tail, smaller publishers, to the AdColony platform.
Also important to this growth was an emphasis by the team on bringing in hypercasual publishers, a relatively new genre of incredibly quicksession, easytoplay apps that AdColony has historically had a minimal presence in.
Looking Forward2019 was a rebuilding year for AdColony’s Performance business, and a return to form for our publishing teams and we hope these trends continue into 2020, bringing yet more positive results.
The new revenue opportunity brought with the integration of display into the AdColony SDK is critical to our longterm health and driving additional value for publishers and advertisers on both sides of the business. Continued work on new models and leveraging our relationship with data science partners will also incorporate display formats and improve our ad delivery algorithms as time goes on.
As the consolidation of growth, account management and creative roles for the performance business in our Istanbul office continues, these costsavings will enable faster more centralized responses to everyday client needs and greater outcomes for publishers and advertisers. These cost savings will allow for growth and reinvestment in international sales teams to drive revenue growth.
Under The Microscope: Mobile Gaming in Norway
Mobile gaming consumers are as diverse as it gets. That’s why this audience is a huge opportunity for advertisers to tap into. Some of the biggest mobile publishers have come out of the Nordic territories but is their audience just as into mobile gaming as they are?
Statista estimates that mobile game revenue in Norway is expected to reach $84m by the end of this year. While this is still a developing market, Norwegians have an enthusiasm for mobile gaming that shouldn’t be overlooked. In our Under the Microscope series, we look at mobile gamers from countries across the globe to see the common threads and differences across audiences. We’ve partnered with On Device Research to take a look at the preferences and habits of Norwegian mobile gamers. Read on for highlights from our survey.
Highlights from Norway:
• 80% of users play games on their device every day• Typical gaming sessions occur during the early evening
(5 pm – 8 pm)• The majority of both males and females spending 1 hour
or more per day playing mobile games• 66% of respondents stated they consider the mobile
gaming environment safe• Top reasons Norwegian users play mobile games include
fun/enjoyment, relaxation, and to exercise the mind.• 87% prefer to watch video ads for extra lives, rather than
paying money.
Majority of the sample group (83%) prefer watching videoes for extra lives in mobile games.
87% of our sample prefer watching video ads for extra lives in mobile games, rather than paying money for it.
How often do you play mobile games on your smartphone?
Top reasons for playing games
Multiple times per
week
Every day
Relaxation
Improve reflexes/focus
To winSocializing
Fun/enjoyment
Mind exercise
Makes your aging slower
Multiple times per
month
Once a week
Once a month
Less than once a month
1%1%4%
9%
23%
69%
50%
12%11%
11%
5%
26%
70%
MOBILE GAME PUBLISHERS ARE NOW INTEGRATED WITH ADCOLONY
42/100OF THE TOP

24 25OTELLO CORPORATION ASA - ANNUAL REPORT 2019 OTELLO CORPORATION ASA - ANNUAL REPORT 2019
Product & Engineering
In 2019, AdColony’s product and engineering teams continued to make AdColony an open and standardized ad marketplace, improving access to programmatic inventory sources for publishers and giving greater options for advertisers.
As part of our commitment to standardization, AdColony continued its push towards realtime ad serving by implementing a cacheless advanced bidding solution. By bidding on ad auctions before the ad is cached AdColony is able to participate in more ad auctions and secure more ad inventory.
During 2019, AdColony launched SDK 4, adding support for the IAB’s Open Measurement SDK, allowing more viewability and transparency partners to work without AdColony without the need for publisher SDK updates.
By the end of 2019, the overall adoption rate of SDK 4 across the network exceeded 50%, highly exceeding our expectations and outpacing previous SDK adoption rates. The high adop
tion rate of SDK 4 puts AdColony in a strong position to pursue additional business opportunities for banners and display ad integrations with our publishers.
New Core™ models for optimization were also continually deployed throughout the quarter, leading to significantly stabilized margins across the performance business. The Core™ team also kicked off two new projects eCPI and eROAS. These new products allow AdColony to develop better bidding strategies that deliver CostPerInstall (CPI) and Return on Ad Spend (ROAS) outcomes that align with advertiser goals.
AdColony also joined the Advertising ID Consortium, as part of our ongoing efforts toward improving targeting and campaign performance for all of our partners. This increased transparency for advertisers will only serve to help AdColony stand out as one of the most trustworthy ad platforms for advertisers. AdColony also kicked off an ad, supply and demand classification migration that aligns our internal taxonomy and content definitions with that of the IAB.
Once people wake up in the morning, mobile device usage rises steadily as the day goes on. Lunchtime to about 3 pm marks the high point, whilst the commute home from work and school creates a shallow drop into the evening, as those consumers diving deep on public transport in some regions are offset by those driving in others.
There’s an uptick as we approach midnight and into the wee hours of the morning too, as nightowls plug away at their favorite mobile games and apps, even while their loved ones might be asleep!
Evenings are Mobile Primetime

26 27OTELLO CORPORATION ASA - ANNUAL REPORT 2019 OTELLO CORPORATION ASA - ANNUAL REPORT 2019
APPS & GAMES
Bemobi

28 29OTELLO CORPORATION ASA - ANNUAL REPORT 2019 OTELLO CORPORATION ASA - ANNUAL REPORT 2019
BEMOBI
Subscribe to premium apps in a world of opportunitiesThe market for streaming of music as well as movies and TV series has been revolutionized during the last few years. Now people want to subscribe to apps as well. This opens up a world of opportunity for Bemobi, the leading provider of subscriptionbased apps and games.
Apps and games are not just great fun, they are considered to be a core part of the mobile experience for an increasing number of users. The cornerstone of Otello’s Apps & Games offering is Apps Club by Bemobi, a leading subscriptionbased discovery service for mobile apps across developing markets. In short, it is a “Netflix-style” subscription service for premium mobile apps.
The world is turning to smartphones and almost all the smartphone growth is now coming in emerging markets. People are spending more time on their mobile devices and many are playing mobile games. This year, the mobile gaming industry is predicted to be approximately USD 75 billion, growing to more than USD 100 billion over the next 3 years. In emerging markets, mobile phones are becoming smarter while people are playing more and more games on their smartphones. People also want to subscribe to apps. Bemobi is playing into this market in a smart way.
Working with mobile operators, Bemobi’s proprietary appwrapping technology allows smartphone users access to unlimited use of premium mobile apps for a flat subscription fee. Users pay for this service through their mobile operator’s billing system, making the service highly effective in emerging markets, where credit and debit card penetration is low.
Bemobi provides a comprehensive distribution and monetization service for premium, freemium and free application developers. Apps & Games is a rapidly growing business area in Otello. The pace is picking up fast, and only during the last year, the revenue growth has increased substantially. This has been possible due to Bemobi’s strength in distribution and monetization of premium mobile applications.
Bemobi in a nutshellIn a nutshell, Bemobi is a socalled B2B2C company. Instead of selling directly to a consumer, socalled traditional B2C, Bemobi typically partners with large companies, mostly mobile carriers or in some cases smartphone OEMs. Through partnerships with these companies, Bemobi is able to offer its service to the consumers. Going into 2019, Bemobi has a wide range of partnerships with various carriers spread across the world, which makes it possible to offer subscriptionbased services and provide access to apps and games for over 2.2 billion potential consumers.
In music and video, you have Spotify and Netflix who offer subscription-based models. However, in apps and games, we have not had the same kind of offering until quite recently. It is a huge global market, and with little competition from the big tech players so far, Bemobi has a first-mover advantage combined with a clear focus on emerging markets.
2.2 BILLION POTENTIAL CONSUMERS
Bemobi is able to offer subscriptionbased services and provide access to apps and games for over

30 31OTELLO CORPORATION ASA - ANNUAL REPORT 2019 OTELLO CORPORATION ASA - ANNUAL REPORT 2019
Geographical Expansion In 2019 the company kept launching new mobile carriers in the global expansion of the apps and games subscription services. Bemobi further expanded its distribution partnership, growing from 54 mobile carriers at the end of 2017 to 61 carriers covering most emerging countries at the end of 2018 and achieving 67 carriers by the end of the year.
In 2019 Bemobi launched Apps Club in three more countries, Armenia, Thailand and Uzbekistan, increasing even more the footprint in CIS and South Asia regions.
With these new launches, the addressable market of users for our paid services reached over 2.2billion mobile subscribers. The total number of subscribers to Bemobi’s paid services grew 29.7% from 26.7 million paying subscribers to 34.6 million by the end of 2019.
An evolution in channel mix2019 was also a very important year in evolving the channel mix used to acquire new subscribers for Bemobi.
Bemobi’s NoData & NoCredit smart captive portal platform that is used as a key acquisition
channel in partnership with mobile carriers in Brazil was launched with three new partners across multiple countries in 2019. New deployments in 2019 with Robi Bangladesh, Jazz Pakistan and Telenor Myanmar bring the total count of captive portal deployments outside of LATAM to 13. These successful launches are a very important milestone as they validate that the model that proved very successful in driving growth for Bemobi in Brazil can be replicated and scaled in geographies beyond LATAM. 2019 also saw further tentative steps into the monetization of the captive portals as digital ad inventory (i.e. selling ad space on the por
tal), with the first commercial sales of ad space taking place on NCell in Nepal, on Telenor and Jazz in Pakistan and some other markets.
In addition to the NoData & NoCredit portals, Bemobi has expanded its investment in other thirdparty acquisition channels beyond Opera Mini. These new channels not only provide a healthy diversification from Opera Mini but helps Bemobi to reach more users that it was not able to access before.
User growth accelerated in 2019 in all key geographies due to optimizations and a more
MOBILE CARRIERS BY THE END OF THE YEAR
67 GROWTH IN PAYING SUBSCRIBERS IN 2019
▲29.7%

32 33OTELLO CORPORATION ASA - ANNUAL REPORT 2019 OTELLO CORPORATION ASA - ANNUAL REPORT 2019
Music
FreeAd based
Paid Subscription”Unlimited usage”
Untapped opportunity
Next phase of “streaming”
PaidTransactional
Video
Apps
SINCE 2016, BEMOBI IS RECOGNIZED AS A GREAT PLACE TO WORK
By uniting determination with fun, we create a routine filled with development and engagement programs. After all, we also want to invest in people.
balanced channel mix as we further invest in paid digital acquisitions and grow our NDNC portals. We have started to run thirdparty paid advertising on the NDNC portal in Ncell in Nepal. This offers an interesting, new potential revenue source. New launchesIn 2019, Bemobi launched Apps Clubs with partners in three new countries – AIS Thailand, MTS Armenia and Ucell Uzbekistan. There were also new Apps Club launches in Russia with Beeline, in South Africa with Vodacom and in Pakistan with Zong.
Bemobi also launched three NoCredit portals, including the launch with Telenor Myanmar, this being our first NDNC portal in Myanmar.
In International markets, we have started rolling out new products, having launched 11 Kids Clubs in 2019 in South Asia, SouthEastern Asia and CIS. 20 Kids Clubs in total have now been launched and we will proceed with launches in other International markets. Further, in 2019, we have launched 9 Health Clubs in South Asia, SouthEastern Asia and CIS. We have also started to roll out other standalone apps ser
vices such as Discount Club, Busuu Language Learning, Football Zone and Fantasy League. New products paving the way aheadAs part of the continuing growth of bundle agreements, Bemobi closed a new agreement and launched a version of our Games Club offer to mobile carrier Claro’s postpaid subscribers.
Bemobi signed many new high-profile game/content publishers to join its distribution platform, including leading brands such as Disney and Viacom during the year.
Further, Bemobi expanded the specialized stores catering for kids as well as fitness and health audiences. During 2019 the groundwork has been laid for additional services to be launched during 2020 in areas like security, discount and sports.
Acquisition of NovitechDuring 2019, Bemobi acquired certain assets from a Brazilian company, Novitech. The transaction included the following assets: physical assets such as hardware and software, intellectual property, a few commercial agreements related to the development, deployment, maintenance
and technical support with major Brazilian and Central American telecommunication carriers as well as a few selected employees.
Bemobi regards this is an important strategic acquisition in many aspects. It enhances our channel offer and our current distribution platform, bringing a more diverse set of channels to our portfolio beyond the NDNC portals by adding a Voice based No Credit Portal. Further, it considerably raises our service distribution scale for our own services.
New opportunitiesIn most countries where Bemobi is offering its services, Android is the dominant mobile operating system with a market share of close to 90 per cent. At the same time, with the exception of the US, emerging countries dominate in terms of app downloads. However, in these markets monetization is difficult for app developers, as not everyone has a credit card. But in many developing countries, almost everyone has a mobile phone. In short, this provides an interesting opportunity for Bemobi, as it offers a totally new way of distributing apps and games by connecting users, mobile carriers and app developers to the benefit of all parties.
It is mostly prepaid plans, and through Bemobi, customers are given the opportunity to use airtime as a way of paying for digital content. Bemobi is based on the strategy of closing the gap between all of these differences and difficulties. The result is more fun for mobile customers, new revenue streams for mobile operators and increased monetization for mobile app developers. The result has become a very scalable, rapidly growing and profitable business.
As an example, limited data packages as a bundled part of the mobile plans in emerging markets could create difficulties, if it would result in customers not downloading apps and games even though they wanted to do so. In order to resolve this, Bemobi has developed a solution that makes it possible to deliver apps in smaller sizes, partly leveraging WIFI for free access to download and distribution. At the same time, Bemobi is able to offer mobile operators a platform for interacting with its customers offering additional data packages and other services which is tailormade and delivered by Bemobi. In this way, Bemobi also adds value to the mobile operators, contributing to creating new and additional revenue streams across its customer base. At the same time, Bemobi benefits
In most countries where Bemobi is offering its services, Android is the dominant mobile operating system with a market share of close to
90%

34 35OTELLO CORPORATION ASA - ANNUAL REPORT 2019 OTELLO CORPORATION ASA - ANNUAL REPORT 2019
The right offer at the right channel at the right time
Bemobi’s turnkey platform for mobile carriers captures users browsing and voice sessions when they are out of credit/data to promote its services
NO CREDIT AND NO DATA PORTALSCustomers will run out of balance or burst their data packets monthly. Have fully customizable portals that allow the sale of topups, data packages and digital services for these customers with the full support of our platforms and digital sales performance team.
NO CREDIT VOICE PORTALSTake advantage of our call management solutions to turn missed opportunities into incremental revenue streams. Bemobi Voice Portal solutions support and intercept billions of calls monthly, turning it into digital and Telecom product sales leads.
Bemobi provides an end to end, fully managed distribution platform, delivering top performance revenuegenerating services. Powered by a datadriven and rulebased decision engine, together with an omnichannel orchestration platform.
VOICE MESSAGING PLATFORMAllows users to redirect calls to voicemail if the device is off, out of range or unavailable. Whenever a voice message is received, a notification will ensure that the message is not lost.
MISSED CALL NOTIFICATIONMake sure users do not miss a call, even when the phone is off or out of range. The missed call alert sends an SMS notification, with details of the missed calls immediately after the phone is reconnected.
CALL ADVANCE AND DATA ADVANCEGot out of credit in the middle of a call or while surfing the net? Call and Data Advance provides a small loan that allows prepaid users to continue their call or use the internet without interruption.
Co-owned digital channels with mobile carriers
Live channel platform
in 18 Carriers (4 LATAM + 14 INTL)
No Credit No Data WEB PORTAL
No Credit VOICE PORTALLive channel platform
in 4 Carriers (4 Brazil)
BEMOBI CHANNELS PLATFORMS MANAGE OVER
HALF A BILLION MONTHLY LEADS RESULTING IN 20MM+ MONTHLY SALES OF DIGITAL SUBSCRIPTION, VOICE AND FINANCIAL SERVICES
Bemobi is closing the monetization-gapOtello’s focus within apps and games is on emerging markets. In many ways, Bemobi is offering to close the socalled monetizationgap between the western world and emerging markets when it comes to apps and games. In the western world, you typically have a credit card or you have a lot of advertisement in the games itself, meaning it is very easy for the developers to make money. You can either sell the game for a dollar or so, or you can let people download the game for free, and you can monetize through advertisement.
However, in emerging markets, these mechanisms play out differently, as it is difficult to monetize a free game through mobile advertising. At the same time, consumers typically might not have a credit card or they do not want to buy a game, meaning it is very difficult for game developers to make money. Bemobi offer game and app developers to put their games and app into Bemobi’s AppsClub, which is a subscriptionbased app store, which becomes a hub of getting access to attractive games and apps for the consumers. This opens up a unique opportunity for game and app developers who are able to monetize in a way they have not been able to do so far.
Bemobi LoopDatadriven
and rulebaseddecision engine
Righ
t Tim
e
Alig
n w
ith u
sers
mic
rom
omen
ts
Om
nichannel
engagement engine
Premium Digital Services, Financial Telecom and Voice Services
Right Channel
Right Offer
36 37OTELLO CORPORATION ASA - ANNUAL REPORT 2019 OTELLO CORPORATION ASA - ANNUAL REPORT 2019
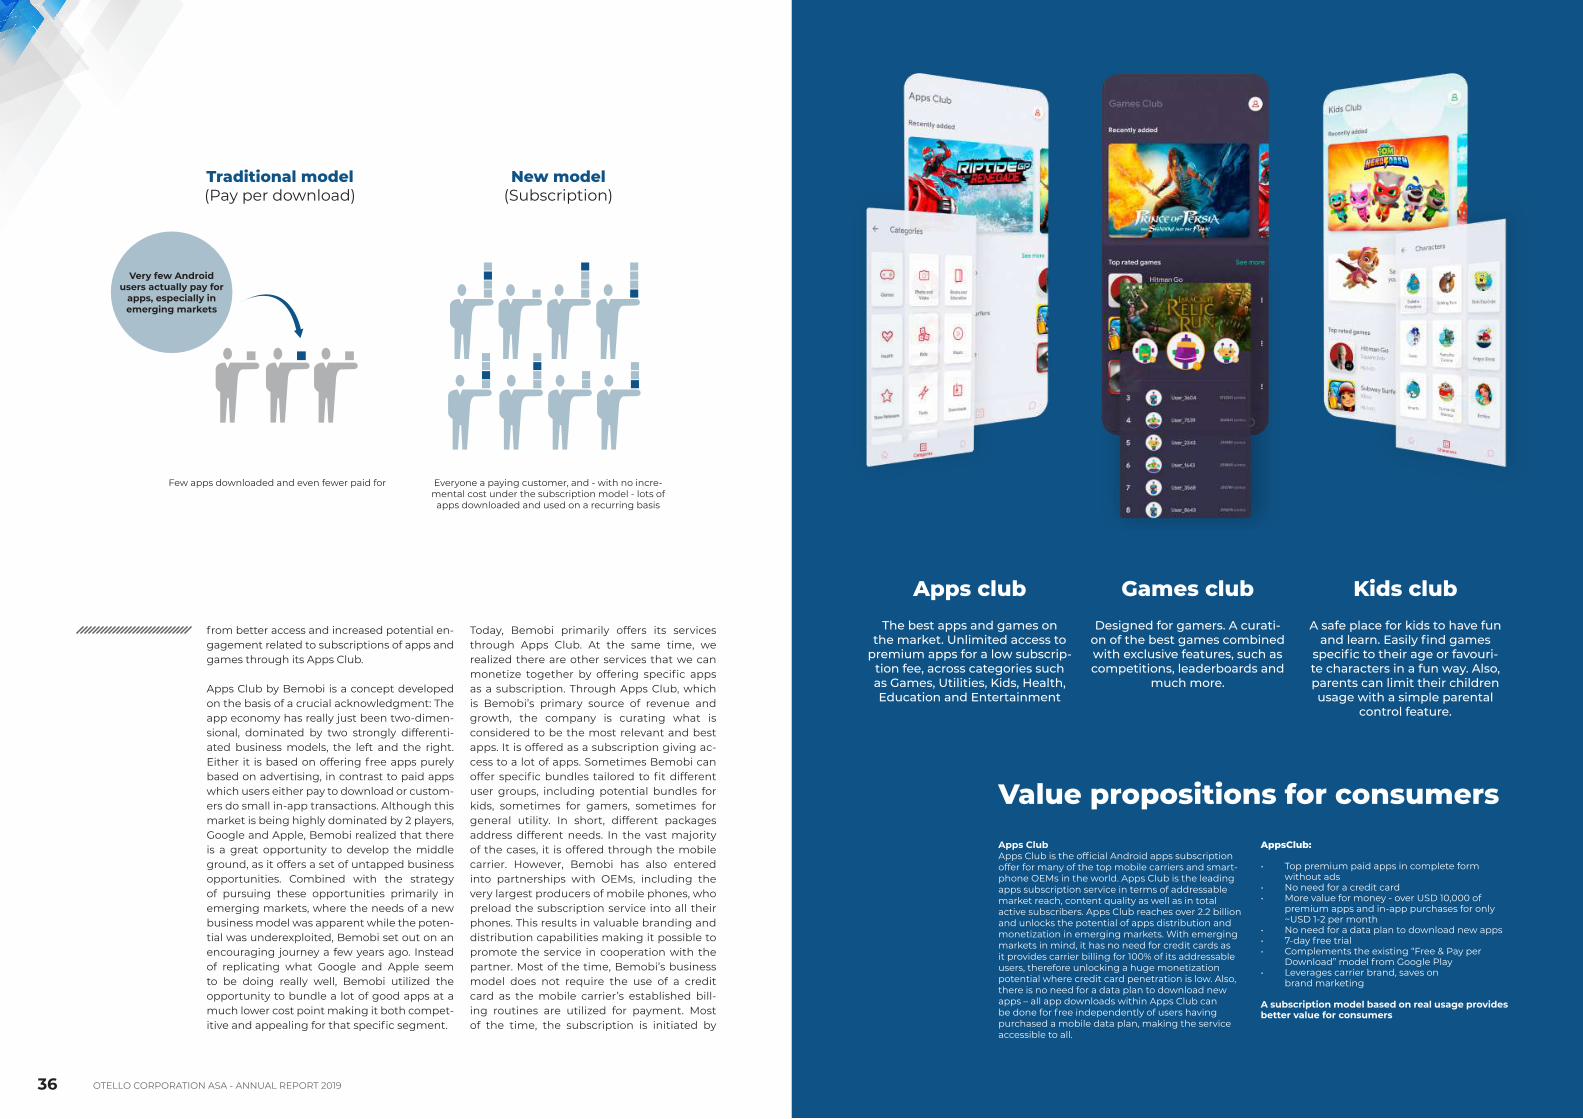
Traditional model(Pay per download)
Few apps downloaded and even fewer paid for Everyone a paying customer, and with no incremental cost under the subscription model lots of
apps downloaded and used on a recurring basis
New model(Subscription)
Very few Android users actually pay for
apps, especially in emerging markets
from better access and increased potential engagement related to subscriptions of apps and games through its Apps Club.
Apps Club by Bemobi is a concept developed on the basis of a crucial acknowledgment: The app economy has really just been twodimensional, dominated by two strongly differentiated business models, the left and the right. Either it is based on offering free apps purely based on advertising, in contrast to paid apps which users either pay to download or customers do small inapp transactions. Although this market is being highly dominated by 2 players, Google and Apple, Bemobi realized that there is a great opportunity to develop the middle ground, as it offers a set of untapped business opportunities. Combined with the strategy of pursuing these opportunities primarily in emerging markets, where the needs of a new business model was apparent while the potential was underexploited, Bemobi set out on an encouraging journey a few years ago. Instead of replicating what Google and Apple seem to be doing really well, Bemobi utilized the opportunity to bundle a lot of good apps at a much lower cost point making it both competitive and appealing for that specific segment.
Today, Bemobi primarily offers its services through Apps Club. At the same time, we realized there are other services that we can monetize together by offering specific apps as a subscription. Through Apps Club, which is Bemobi’s primary source of revenue and growth, the company is curating what is considered to be the most relevant and best apps. It is offered as a subscription giving access to a lot of apps. Sometimes Bemobi can offer specific bundles tailored to fit different user groups, including potential bundles for kids, sometimes for gamers, sometimes for general utility. In short, different packages address different needs. In the vast majority of the cases, it is offered through the mobile carrier. However, Bemobi has also entered into partnerships with OEMs, including the very largest producers of mobile phones, who preload the subscription service into all their phones. This results in valuable branding and distribution capabilities making it possible to promote the service in cooperation with the partner. Most of the time, Bemobi’s business model does not require the use of a credit card as the mobile carrier’s established billing routines are utilized for payment. Most of the time, the subscription is initiated by
Apps clubThe best apps and games on
the market. Unlimited access to premium apps for a low subscrip-
tion fee, across categories such as Games, Utilities, Kids, Health, Education and Entertainment
Games clubDesigned for gamers. A curati-
on of the best games combined with exclusive features, such as competitions, leaderboards and
much more.
Kids clubA safe place for kids to have fun
and learn. Easily find games specific to their age or favouri-te characters in a fun way. Also, parents can limit their children usage with a simple parental
control feature.
Value propositions for consumersApps ClubApps Club is the official Android apps subscription offer for many of the top mobile carriers and smartphone OEMs in the world. Apps Club is the leading apps subscription service in terms of addressable market reach, content quality as well as in total active subscribers. Apps Club reaches over 2.2 billion and unlocks the potential of apps distribution and monetization in emerging markets. With emerging markets in mind, it has no need for credit cards as it provides carrier billing for 100% of its addressable users, therefore unlocking a huge monetization potential where credit card penetration is low. Also, there is no need for a data plan to download new apps – all app downloads within Apps Club can be done for free independently of users having purchased a mobile data plan, making the service accessible to all.
AppsClub:
• Top premium paid apps in complete form without ads
• No need for a credit card• More value for money over USD 10,000 of
premium apps and inapp purchases for only ~USD 12 per month
• No need for a data plan to download new apps• 7day free trial• Complements the existing “Free & Pay per
Download” model from Google Play• Leverages carrier brand, saves on
brand marketing
A subscription model based on real usage provides better value for consumers

38 39OTELLO CORPORATION ASA - ANNUAL REPORT 2019 OTELLO CORPORATION ASA - ANNUAL REPORT 2019
BEMOBI’S KEY SUBSCRIPTION SERVICE OFFERING BEMOBI’S DISTRIBUTION CHANNELS
1. AppsClubBundles of top apps & games in a low price point subscription model
2. Paid online campaigns Partnering with leading apps and web properties in emerging markets to promote Bemobi’s service offering.
• Revenue share based (e.g. Opera Mini)• Paid per acquisition CPA
3. Co-owned channels with mobile carriers Bemobi’s turnkey platform for mobile carriers captures users browsing and voice sessions when they are out of credit/data to promote its services
• NCND portals and interactive voice response
1. Mobile carriers promotionsWhen a deal is signed, the mobile carrier commits to doing marketing and promotion of the new service
• SMS/MMS/RCS/ messages campaigns• App Push Notifications• Billing insert campaigns• Store promotions and bundles• Magazine inserts and TV spots
2. Standalone subscription appsDistribution of standalone subscription apps
3. Voice & financial servicesMarketleading on Voice Messaging provider in Brazil
Subcription services
Bridging the gap in emerging countries for monetizing digital subscription services Control increases
PROTECTION
It protects the premium apps from being copied to non-autho-
rized devices and against usage of non-paying users
DMR works both Online & Offline
MULTIPLE BUSINESS MODELS
A wrapper version is available for developers that don’t want to adapt existing apps
FLEXIBLE AND LIGHTWEIGHT
A wrapper version is available for developers
that don’t want to adapt existing apps
USAGE TRACKING
It tracks usage and overrall engagement of each individual app while keeping individual user
activity private
NO CODE CHANGE REQUIRED
A wrapper version is available for developers that don’t want to adapt existing apps
Control App Updates without requiring Google Play
Compatible with Facebook, Google+ and Google Game Services and with Amazon APK’s
an offer of a free trial period, meaning that no payment is due upfront. Typically, Bemobi could offer access to a glimpse of the content that the customer would consider to be of great value for a week or two weeks, and after that period of time, it becomes a paid subscription.
Bemobi has partnerships in two different parts of the value chain. Carriers are offering distribution while content partners or app developers are offering access to apps and games. Bemobi manages the settlement of revenue share, including dozens of revenue flows coming from different carriers as well as millions of
consumers. The revenue is divided, based on agreed metrics, such as usage, and it is split between the different providers across nearly 60 countries. Bemobi provides the technology platform, and the apps, connecting users with great content from publishers who make their best apps available so that Bemobi can bring
them to the consumers of mobile operators across the world. The value proposition is clear for all parties and the model is sustainable.

40 41OTELLO CORPORATION ASA - ANNUAL REPORT 2019 OTELLO CORPORATION ASA - ANNUAL REPORT 2019
COMPRESSION
Skyfire

42 43OTELLO CORPORATION ASA - ANNUAL REPORT 2019 OTELLO CORPORATION ASA - ANNUAL REPORT 2019
The need for speed is increasing. Today, typically 60 percent or more of total mobile data consumption is video content, putting pressure on the operator’s existing network capacity. Skyfire en-ables mobile operators to optimize its network performance and quality as data traffic and the consumption of mobile video is exploding among mobile users. The unique technology also enables operators to pursue new business models and revenue streams while benefiting from increased technological flexibility as customer data is compressed.
At the same time, mobile operators face increasing downward pressure on average voice revenue per subscriber, and as competition heightens, operators around the world are looking for new sources of revenue, differentiation via data services as well as network performance and quality, and solutions to manage the explosion of mobile video and multimedia data network traffic spurred by the rapid adoption of smartphones and tablets.
Fast as a rocketDuring 2017, Skyfire began marketing itself under the RocketColony name – a break from the original Skyfire name just as the company has shifted its focus to new encrypted video optimization technologies. Skyfire remains the legal name of the company.
Rocket Optimizer is Skyfire’s flagship product addressing operator needs in regards to
SKYFIRE – NEED FOR SPEED:
Fast Forward in a New Reality
managing the explosion of mobile video data traffic. It is designed for operator deployment and it provides operators with an instant 60 percent boost in bandwidth capacity across smartphones, tablets and laptops. Rocket Optimizer allows mobile operators to leverage cloud computing to optimize and compress video and other multimedia traffic, for example on congested 3G and 4G LTE cell towers, enabling operators to boost the capacity of their networks significantly while at the same time offering better network performance and quality to their mobile customers.
In addition to optimization, Rocket Optimizer enables myriad new monetization use cases by
allowing operators to set and control a target video quality for different classes of users or for different data packages. For example, an operator might ensure the highest possible video quality for “Gold” users, 480p quality video for “Silver” users and 360p video for “Bronze” users. Alternatively, a new “Free Video OffPeak” data package could be introduced that limits video to 480p and allows unlimited video consumption in offpeak hours – thereby winning videohungry customers from competing operators while ensuring the network is protected. These are just a few examples of the many monetization options enabled by the very flexible Rocket Optimizer system.
From 2019, licensing of Rocket Optimizer™ technology from Skyfire (RocketColony) is rolled into the corporate function of Otello.

44 45OTELLO CORPORATION ASA - ANNUAL REPORT 2019 OTELLO CORPORATION ASA - ANNUAL REPORT 2019
OTT SOLUTIONS
Vewd

46 47OTELLO CORPORATION ASA - ANNUAL REPORT 2019 OTELLO CORPORATION ASA - ANNUAL REPORT 2019
One size doesn’t fit allWhether you want a complete turnkey solution, or prefer to mixandmatch from a combination of Vewd’s worldclass products and modules, it’s never been easier or more flexible to build a differentiated and modern Smart TV experience.
Deep analyticsGain insights into how viewers interact not only with the product, but also with the apps and content available through Vewd OS. Those analytics can then be used to further test, refine and deploy new user experiences on devices.
Puts the brand in focusAn easytouse toolkit allows comprehensive alterations to the look, feel and branding to make every device portfolio distinct and unique.
After-sale monetizationThe story doesn’t have to end once the TV is sold. Vewd OS lets manufacturers share revenue after the sale, tapping into significant recurring revenue opportunities.
VEWD – THE FUTURE OF CONTENT
A seamless and entertaining experience for everyoneVewd Software is the market leader in enabling the transition to OTT. Vewd’s suite of OTT solutions enable our customers and partners to reliably, seamlessly and efficiently reach connected device viewers. We help companies like Sony, Verizon, Samsung and TiVo benefit from the growing number of consumers who watch content on connected devices.
With over 15 years experience in the connected TV device and OTT industry, we boast technological expertise to continuously satisfy the everevolving demands of the marketplace. Our marketleading products help enable the best streaming video services and unparalleled user experiences on all types of devices for audiences around the world.
Vewd offers proven and flexible solutions for overcoming the difficult challenges and escalating costs associated with the rapidly evolving OTT space. As experts in developing software solutions spanning client to cloud, we provide customers and partners the products they need to connect consumers with the content they love.
300MILLION DEVICES IN TOTAL
Otello’s case regarding the potential sale of Vewd minority stake: As reported to the market on September 14, 2018, Otello was successful in its claim in the High Court of Justice of England and Wales. A trial to determine the relief to which Otello is entitled was listed to take place in a rolling five day window from March 23, 2020. However, on March 18, 2020 the Court decided to postpone the trial until the court term commencing in October 2020 because of the impact of the ongoing corona virus pandemic. The Court has listed the trial to commence in a rolling five-day window from October 5, 2020. See note 21 for further information regarding the legal dispute.

48 49OTELLO CORPORATION ASA - ANNUAL REPORT 2019 OTELLO CORPORATION ASA - ANNUAL REPORT 2019
SHAREHOLDER INFORMATION

50 51OTELLO CORPORATION ASA - ANNUAL REPORT 2019 OTELLO CORPORATION ASA - ANNUAL REPORT 2019
INVESTOR RELATIONS POLICYCommunication with shareholders, investors and analysts, both in Norway and abroad, is a high priority for Otello. The company’s objective is to ensure that the financial markets have sufficient information about the company in order to be able to make informed decisions about the company’s underlying value. Otello arranges regular presentations in Europe and the United States and holds frequent meetings with investors and analysts. Important events affecting the company are reported immediately.
LARGEST SHAREHOLDERS at December 31, 2019
ShareholderOwners and voting share
GOLDMAN SACHS INTERNATIONAL 27.4%
LUDVIG LORENTZEN AS 8.5%
SUNDT AS 5.5%
AREPO AS 5.3%
VERDIPAPIRFONDET DNB TEKNOLOGI 4.6%
VERDIPAPIRFONDET DNB NORGE (IV) 3.8%
BANK OF NEW YORK MELLON SA/NV 3.8%
J.P. MORGAN BANK LUXEMBOURG S.A 3.5%
VERDIPAPIRFONDET NORDEA NORGE VERD 2.9%
SOCIETE GENERALE PARIS 2.3%
Country breakdown shareholders:Norwaybased accounts
U.K.based accountsLuxembourgbased accounts
U.S.based accountsFrancebased accounts
Accounts based elsewhere
201847.5 %28.3 %
7.1 %4.1 %3.4 %9.7 %
2019 44.0 %36.5 %6.8 %3.8 %2.8 %6.2 %
Company Analyst Telephone
Arctic Securities ASA Henriette Trondsen +47 21 01 32 84
DnB NOR Markets Christoffer Wang Bjørnsen +47 24 16 91 43
Pareto Fredrik Steinslien +47 24 13 21 54
ABG Sundal Collier ASA Aksel Engebakken +47 22 01 61 11
Share- holders
44.0%Norwaybased accounts
36.5%U.K.based
accounts
6.8%Luxembourg
based accounts
3.8%U.S.based
accounts
2.8%Francebased
accounts
6.2%Accounts based elsewhere
SHAREHOLDER INFORMATION
Investor Relations
Petter LadeChief Financial Officer
*Excluding the consumer and TV business**Excluding the consumer, TV and SurfEasy businesses
KPI [2015-2019] 2015 2016 2017 2018 2019
Revenue ($ million) 454.2* 532.2* 419.0** 275.4 240.7
Adjusted EBITDA ($ million) 55.9* 49.4* 13.5** 9.4 19.4
Operating cash flow ($ million) 56.0* 41.4* 6.7** (0.2) (0.2)
Adjusted EBITDA represents EBITDA excluding stockbased compensation expenses, impairment and expenses

52 53OTELLO CORPORATION ASA - ANNUAL REPORT 2019 OTELLO CORPORATION ASA - ANNUAL REPORT 2019
Lars BoilesenChief Executive Officer
Lars Boilesen is the Chief Executive Officer at Otello Corporation ASA, a position he has held since 2010. He also serves as CEO of Otello’s subsidiary AdColony, Inc. Lars has extensive experience in the software and tech industry and has held executive positions in various corporations prior to joining Otello. He was Executive Vice President of Sales & Distribution at Opera Software ASA from 2000 to 2005 and served on the Board of Directors of Opera Software ASA from 2007 to 2009.
From 20052008 he was Chief Executive Officer for the Nordic and Baltic Region at AlcatelLucent. Lars started his career in the LEGO Group as Sales and Marketing Manager for Eastern Europe. After that, he headed the Northern Europe and Asia Pacific markets for Tandberg Data. He has been Chairman of the Board of Directors of Napatech since September 2017 and currently serves as Chairman of the Board of Directors at Cobuilder AS.
Lars holds a Bachelor’s Degree in Business Economics from Aarhus Business School, and postgraduate diploma from Kolding Business School.
Petter LadeChief Financial Officer
Petter Lade was appointed Chief Financial Officer in January 2017. He is responsible for the financial management of the Group and oversees financial planning and analysis, treasury, M&A and investor relations. Petter comes from the position as Director, IR & Corporate Development and has held several key roles within controlling, M&A and IR since joining Otello in 2006.
Before joining Otello, Petter was Finance & Commercial Consultant at Dell EMEA and responsible for the financial and commercial element for panEMEA or Global Dell Managed Services (DMS) deals. Prior to that, Petter worked as Business Controller/Bid Analyst for Dell Norway. He began his career with Verdens Gang (Schibsted) as a controller.
Petter obtained a Siviløkonom degree (four year program in economics and business administration consisting of three years at bachelor level and one year at master level) from BI Norwegian Business School.
Executive Teamof Otello Corporation ASA

54 55OTELLO CORPORATION ASA - ANNUAL REPORT 2019 OTELLO CORPORATION ASA - ANNUAL REPORT 2019
The Board of DirectorsOtello Corporation ASA
André ChristensenChairman
André Christensen has extensive strategic and operational experience from the Media, Internet, and High Tech industries across Europe, North America and Asia from the last 25 years. He is currently the CEO and Founder of the IPTV/OTT entertainment platform provider Firstlight Media based in Toronto/Los Angeles/Chennai. Prior to this he headed product development for AT&T Entertainment Group following the acquisition of Quickplay Media where he was the COO and coowner. He has also been the SVP Business Operations and Strategy at Yahoo globally after 12 years with McKinsey & Company as a partner establishing and leading the Business Technology practice in Canada as well as the Global Operating Model service line worldwide. Mr. Christensen currently holds a board position with Intermedia in Sunnyvale. He has a MSc/DiplKfm degree from University of Mannheim, Germany.
Birgit MidtbustMemberBirgit Midtbust is a senior lawyer in Advokatfirmaet Schjødt AS, the largest law firm in Norway, and a member of their M&A and Capital Markets department. She joined the firm in 2007, and specializes in acquisitions and sales of companies, mergers, investment structures and ownership structures. She has a broad practice area, with main focus on oil service, offshore, maritime and technology. Birgit has advised on a substantial number of transactions
involving Norwegian and foreign listed and unlisted companies. She has substantial experience with transactions and works regularly for reputable financial and industrial clients in Norway and abroad. Birgit holds a Master in law from the University of Bergen, Norway.
Frode Jacobsen MemberFrode Jacobsen is the CFO of Opera Limited, the Nasdaq listed company that now owns the Opera browser business, which was spun off by Otello in 2016. During the four years prior to the sale of the browser business, Frode held various roles in the Otello group, ultimately serving as CFO. In the period 2008-2013, he was a management consultant with McKinsey & Company, based in Oslo and San Francisco. Through his professional roles, Frode has developed substantial expertise in strategic planning and processes, including endtoend acquisition and divestment initiatives, and a thorough understanding of Otello’s businesses. Frode holds a BSc of Economics and Business Administration from NHH in Norway, and a MSc of Management from HEC Paris.
Maria Borge AndreassenMemberMaria Borge Andreassen is Commercial Director in Jernia AS, a specialist retailer chain in Norway with approximately 130 stores. She
is leading the departments responsible for space, category strategy and sourcing. Before that, Maria was part of the Executive Team in Europris, the largest discount variety retailer in Norway and listed on the Oslo Stock Exchange. In her position as the Director of Strategy and Business Development, Maria was responsible for the overall strategy, including project portfolio, new growth initiatives, OMNI channel strategy, digital roadmap and sustainability. Prior to joining Europris, Maria served as Marketing and Innovation Director in the central unit and as Corporate Business Advisor to the President and CEO of Orkla ASA, the leading Nordic based branded consumer goods company. She held internal board positions and started many new growth initiatives. Maria started her career as a consultant in McKinsey & Company, Inc., where she worked with strategy and organizational topics, and served clients in many industries in Scandinavia, UK and South Africa. Maria holds an MBA from
INSEAD and a Bachelor in Business Administration from the University of Strathclyde.
Anooj UnarketMemberAnooj Unarket is a Senior Member at Sand Grove Capital Management. Prior to Sand Grove’s inception in 2014, from 2010-2014, he was a Partner and Analyst in the Event Driven division at Cheyne Capital investing in event driven situations across the capital structure. Prior to Cheyne Capital, from 20072010, he was a member of the European Mezzanine team at GSC Group sourcing and analysing investments in subordinated private debt in subinvestment grade companies throughout Europe. He began his career in 2005 at Merrill Lynch as an Analyst in the TMT investment banking team based in London. He graduated in 2005 with an MA (Hons) in Economics from Trinity College, University of Cambridge.
CHAIRMAN: ANDRÉ CHRISTENSEN
MEMBER: FRODE JACOBSEN MEMBER: MARIA BORGE ANDREASSENMEMBER: BIRGIT MIDTBUST
56 57OTELLO CORPORATION ASA - ANNUAL REPORT 2019 OTELLO CORPORATION ASA - ANNUAL REPORT 2019
Report from the Board of DirectorsIn 2019, Otello delivered on its key objectives, including making AdColony adjusted EBITDA profitable and seeing revenue and adjusted EBITDA growth in Bemobi versus 2018. The turnaround in AdColony started to bear fruit and we reached yearonyear growth for AdColony in Q4. We were also able to negotiate an extension of the earnout agreement with the former owners in Bemobi and a new longterm CEO agreement with Pedro Ripper, which were finalized and signed in early 2020.
During 2019, Bemobi continued to meet with international investors, in order to consider whether an IPO of Bemobi could represent a realistic and value enhancing opportunity. Feedback from investor meetings has been positive and supportive of a potential IPO and based on this feedback we have continued to explore the proper jurisdiction to carry out an IPO. The timing and completion of any listing is subject to market conditions and further investor feedback, and no assurances can be given that a listing will be achieved.
We continued our share repurchases in 2019, buying back a total 0.9 million in shares, at $1.5 million, and ultimately canceling a total of 9 million shares in 2019 and 2 million shares in early 2020. Otello now finds itself in a strong financial position having limited debt and a net cash position as we enter 2020.
As we enter 2020 the world is grappling with the direct and indirect impacts of the Covid 19 virus. In this challenging situation, the primary focus of Otello has been the health and safety of our employees. Since midMarch, the Group entities have successfully managed to shift the vast majority of the operations to remote home offices. The operational impact is limited to a minimum and all business activities continue to operate as before the crisis. Due to the nature of our business in both AdColony and Bemobi, in terms of not having physical products and being reliant on the use of consumers mobile phones, we are in a relatively
fortunate position. However, as our revenue is linked to the advertising spend of companies (AdColony) and subscriptions bought by consumers (Bemobi), we expect Covid19 to negatively impact revenue and profit in 2020. At this stage, it is still too early to tell how great this impact will be. Ultimately, it will be linked to the duration of the crisis and the knockon effect of the changed behavior of our customers.
COMPANY OVERVIEWOtello Corporation ASA, the parent company of the Group, is domiciled in Norway. The Company’s principal offices are located at Gjerdrums vei 19, Oslo, Norway. The company is a public limited company that is listed on the Oslo Stock Exchange under the ticker OTELLO.
Otello’s business activities comprise mobile advertising via its AdColony business, mobileapp subscription services via its Bemobi business, and licensing of Rocket Optimizer™ technology via its Skyfire business.
AdColony is a global business headquartered in the United States, in addition to larger offices in Turkey and Singapore. Bemobi is headquartered in Brazil, with offices in Ukraine and Norway. The Skyfire business is based in the United States.
The following are Otello’s segments as at December 31, 2019:
AdColony (Mobile Advertising)AdColony is one of the largest mobile advertising platforms in the world with a reach of more than 1.5 billion users globally. AdColony provides an endto end platform for brands, agencies, publishers and application developers to deliver advertising to consumers on mobile devices around the world. AdColony delivers highly interactive and engaging advertising experiences across all mobile formats with particular strength in video and full screen interactive rich media ads.

58 59OTELLO CORPORATION ASA - ANNUAL REPORT 2019 OTELLO CORPORATION ASA - ANNUAL REPORT 2019
AdColony revenue is primarily based on the activity of mobile users viewing ads through 3rd Party Publishers, such as developer applications and mobile websites. Revenue is recognized when advertising services are delivered based on the specific terms of the advertising contract, which are commonly based on the number of ads delivered, or views, clicks or actions by users of mobile advertisements.
Bemobi (Apps & Games)The cornerstone of Otello’s Bemobi offering is Apps Club, a leading subscriptionbased discovery service for mobile apps in Latin America and beyond. Apps Club offers a unique, “Netflix-style” subscription service for premium Android apps. Working with mobile operators, Bemobi’s proprietary appwrapping technology allows smartphone users access to unlimited use of premium mobile apps for a small daily, weekly or monthly fee. Users pay for this service through their mobile operator billing systems, making the service highly effective in emerging markets, where creditcard and debitcard penetration is low.
Bemobi revenue is primarily comprised of: i) subscription revenue when an Android user purchases a subscription from a “cobranded” mobile store, or a whitelabel operatorcontrolled version of the mobile store, known as Apps Club, and ii) the Bemobi Mobile Store (formerly Opera Mobile Store), a feature phone platform, when a user purchases a premium app. This feature phone platform, acquired by Bemobi’s parent Otello from the acquisition of Handster in 2011, is to be phased out.
See note 1 for further information regarding revenue recognition.
Corporate CostsCorporate costs comprise primarily i) costs related to personnel working in functions that serve the Group as a whole including CEO, Board of Directors, corporate finance and accounting, legal, HR and IT, and ii) certain costs related to business combinations and restructuring processes. As from 2019, the Group has no longer reported Skyfire (Performance & Privacy) as a separate segment but rolled this into the Corporate segment due to its very limited size.
In addition, Otello has retained preferred shares equivalent to 27% of the common equity of the new parent of Vewd Software AS (formerly Opera TV AS).
FINANCIAL SUMMARY
Income statementOtello’s operating revenues fell by 13% to $240.8 million in 2019 (2018: $275.4 million), driven by a decline in the AdColony business, offset somewhat by steady growth in Bemobi. Operating expenses, excluding impairment and restructuring expenses, decreased by 14% to $253.4 million (2018: $296.1 million), with publisher and revenue share cost decreasing by 15%. Otello delivered EBIT (excluding impairment and restructuring expenses) of $12.6 million (2018: $20.7 million), due primarily to weak performance from AdColony.
A loss before income taxes (including impairment and restructuring expenses) of $-13.5 million was recognized in 2019 (2018: $117.2 million). Provision for taxes resulted in an expense of $2.6 million in 2019 (2018: tax income of $24.5 million due primarily to the tax effect of a merger of entities in the Bemobi business and increased deferred tax assets). The loss for the period was $16.1 million (2018: $92.7 million). Basic and diluted earnings per share were both $0.16 (2018: $0.66).
Revenues Otello’s operating revenues fell by 13% to $240.8 million in 2019 (2017: $275.4 million).
In 2019, Bemobi experienced revenue growth in spite of currency headwinds, whilst AdColony experienced a decline in revenue.
AdColony was the largest source of revenue in 2019 as in 2018. AdColony revenues fell by 17% compared to 2018. The decrease in revenue in AdColony was mainly due to slower product launches and ramp up of new products in addition to a general streamlining of the business and more focused operations. However, the significant cost focus paid off during 2019 and we have lowered the revenue breakeven point substantially as we enter 2020. 2019 was a turnaround year for AdColony and we excited the with yearonyear revenue growth in the last quarter of 2019. AdColony reached its financial goal of being Adj. EBITDA profitable in 2019.
Bemobi delivered growth in revenue and profit in 2019 vs 2018, delivering on its financial goal for the year. Revenue growth of 4% and Adj. EBITDA growth of 10% would have been significantly stronger had it not been for adverse FX impact due in particular to a weaker BRL vs
USD in 2019 vs 2018. During the year, we have added new services such as voice and financial, and achieved an increase of 8 million subscribers, a 30% growth over 2018. By the end of 2019 Bemobi was working with over 60 mobile operators, the majority outside LATAM, and with a total of 34.6 million subscribers, we are well on our way to taking this Brazilian success global. Based on positive feedback from investor meetings carried out throughout 2019, we continue to evaluate a separate listing of Bemobi in 2020, though the timing and completion of any listing is subject to market conditions and further investor feedback, and no assurances can be given that a listing will be achieved.
Cash flowNet cash flow from operating activities in 2019 totaled $2.7 million, (2018: $0.2 million). Otello’s operating cash flow was impacted negatively by a buildup of working capital due to revenue growth in AdColony and Bemobi.
Otello’s cash balance was also impacted positively in 2019 by the drawing of $20.0 million of its credit facility, and by $5.6 million of escrow payments, the final payment from the sale of SurfEasy to Symantec. The cash balance was impacted neg
atively by the following: capitalized R&D of $10.8 million, payment of financial lease liabilities of $3.8 million, acquisition of assets of $3.1 million, capex of $2.5 million, and share repurchases of $1.5 million.
As of December 31, 2019, the Group had a cash balance of $28.3 million (2018: $27.5 million), $20 million (2018 : 0) I interest bearing debt and thus, $8.3 million in net cash.
Balance sheetAs of 31 December 2019, the Group had total assets of $435.4 million (2018: $434.2 million). Non-current assets represented $317.2 million of this total, and primarily consisted of goodwill ($230.7 million), deferred tax assets ($32.2 million), intangible assets ($22.4 million) and other investments ($16.8 million). Current assets such as cash and receivables represented $118.2 million of total assets.
The Group had total liabilities of $96.3 million as of 31 December 2019 (2018: $70.2 million), of which $72.1 million were current liabilities. Shareholders’ equity was $339.1 million at the end of 2019, compared with $364.0 million at the end of the previous year. Otello’s equity ratio at year end was 78% (2018: 84%).

60 61OTELLO CORPORATION ASA - ANNUAL REPORT 2019 OTELLO CORPORATION ASA - ANNUAL REPORT 2019
AdColony: Financial OverviewOverall AdColony’s revenue for 2019 was USD 183.9 million, down by 17 % compared to 2018, However the last quarter of 2019 delivered the first YoY revenue growth since 3Q16. AdColony was adjusted EBITDA profitable for 2019 as a whole, and the last half of the year saw a continued strong contribution from our Brand business and a ramp up in programmatic revenues. Total operating expenses continued to decline YoY as AdColony has continued to streamline the organization, especially in the performance business, while investing in the roles and individuals driving growth. In addition to continuing the transition to moving noncustomer facing roles to lower cost locations, AdColony
continued a heavy focus on programmatic and automated delivery of our customers ad spend.
Adjusted EBITDA amounted to USD 0.3 million for 2019, an improvement vs negative USD 5.1 million in 2018. Gross margin for 2019 was 34.5% versus 34.0% in 2018. Gross margin in the Performance business was down versus 2018, but overall gross margins were positively impacted by strong gross margins in the Brand business and positive revenue mix.
PerformanceAt AdColony, the term “performance” currently encompasses both our user acquisition (UA) business and our publishing monetization business. For most mobile app developers,
growing the number of users comes from advertising in other apps, and monetizing those users comes from integrating ads. The ads AdColony shows to users in those publishers’ apps are a mix of both UA and brand.
AdColony’s Performance revenue was USD 61.8 million in 2019, down 32% relative to 2018, and therefore underperformed during 2019. This can also be attributed to significant growth in the performance programmatic industry, with some partners shifting spend to Performance DSPs, and a oneoff technical issue with the live version of Apple’s iOS13 operating system that was not present in beta releases causing high performance creatives to not be compatible.
Overall, AdColony’s performance business is looking healthier moving into 2020, with impressions up by 5.5% and unique views up 4.8% across apps in the Top 100 globally in 4Q19 versus 3Q19, with over 150 new publishers onboarded during 4Q19. Adoption of SDK4 has been the fastest ever in AdColony’s history with nearly 50% of publishers integrating by the end of the quarter. Advanced bidding support which AdColony has been at the forefront of, is finally seeing wider industry adoption, now contributing to 16% of revenue.
Brand/Exchange Mobile games are where consumers are spending more and more time daily. AdColony has been giving brands like Disney, Starbucks, Unilever, Toyota, and many more, the opportunity to reach consumers in that channel for years. Coupled with a strong emphasis on programmatic (built into our monetization SDK) and strong relationships with all the major advertising agency holding companies like Havas, Omnicom, Publicis, and more, AdColony’s brand business has never been stronger, and is the leading factor in AdColony’s continued growth and stability into the next decade.
Overall, the Brand business experienced healthy growth across all regions in the second half of 2019. For the year as a whole, revenue decreased by 6% compared to 2018.
Regionally, AdColony’s North America business had its strongest quarter in nearly four years with revenue of USD 27.3 million in 4Q19, up 19% versus 4Q18. EMEA Brand revenue was USD 11.8 million in the same quarter, an increase of 23% versus 4Q18 and up 55% from 3Q19, with a highlight of Instant-Play™
Programmatic revenue growth of 271% in 4Q19 compared to the same quarter last year. Across APAC, investments in growing the business in new markets, including New Zealand, Japan and Myanmar, as well as programmatic sales support resulted in regional revenues of USD 3.3 million, flat versus 4Q18 and up 14% from 3Q19.
Product updateIn 2019, AdColony’s product and engineering teams continued to make AdColony an open and standardized ad marketplace, improving access to programmatic inventory sources for publishers, and giving greater options for advertisers.
As part of our commitment to standardization, AdColony continued its push towards realtime ad serving by implementing a cacheless advanced bidding solution. By bidding on ad auctions before the ad is cached AdColony is able to participate in more ad auctions and secure more ad inventory. AdColony also joined the Advertising ID Consortium, as part of our ongoing efforts toward improving targeting and campaign performance for all of our partners. This increased transparency for advertisers will only serve to help AdColony stand out as one of the most trustworthy ad platforms for advertisers. AdColony also an ad supply and demand classification migration that aligns our internal taxonomy and content definitions with that of the Interactive Advertising Bureau (IAB).
AdColony’s SDK 4.1 launch was successful and reached ~50% adoption rate at the end of 2019 exceeded expectations. Apple’s release of iOS 13.2 led to unexpected incompatibility issues with SDK 3.x. The development teams were able to minimize the impact of the issue on SDK 3 by implementing a workaround solution. The high adoption rate of SDK 4 puts AdColony in a strong position to pursue additional business opportunities for banners and display ad integrations with our publishers.
New Core™ models for optimization were also continually deployed throughout the quarter, leading to significantly stabilized margins across the performance business. The CORE team also kicked off two new projects eCPI and eROAS. These new products allow AdColony to develop better bidding strategies that deliver CostPerInstall and Return on Ad Spend outcomes that align with advertiser goals.
ADCOLONY OVERVIEW AND PRODUCT UPDATE
AdColony per business area 2019 2018
Total 183.9 220.6
Performance 61.8 90.7
BrandManaged IO 65.6 71.6
BrandPerformance 27.6 30.5
BrandProgrammatic 28.9 27.8
Gross profit 63.4 75.1
Adjusted EBITDA 0.3 (5.1)
EBITDA (0.6) (6.6)
EBIT (21.8) (125.5)

62 63OTELLO CORPORATION ASA - ANNUAL REPORT 2019 OTELLO CORPORATION ASA - ANNUAL REPORT 2019
Financial Overview Bemobi delivered growth in revenue and profit in 2019 vs 2018. Revenue growth of 4% and Adj. EBITDA growth of 10% would have been significantly stronger had it not been for adverse FX impact due in particular to a weaker BRL vs USD in 2019 vs 2018.
The gross margin for 2019 as a whole was 69.4%, down from 71.3% for 2018. However, from the second half of 2018 and moving forward, the gross margin includes CPA (cost of user acquisition), since this is now recognized as publisher and revenue share cost (COGS), instead of Opex, as previously. COGS are increased and Opex is reduced by the same amount. Gross margin in 4Q2019 was a record 72.3%, over 4 percentage points higher than 4Q18 (67.8%), driven in particular by high gross margin revenue from Voice (IVR) and Financial services.
The total number of subscribers to Bemobi’s paid services grew 29.7% from 26.7 million paying subscribers to 34.6 million by the end of 2019. LATAM subscribers were up from 20.5 million at the end of 2018 to 24.9 million at the end of 2019 (up 21%) with strong growth from new services such as Voice (IVR) and Financial services. International subscribers rose from 6.2 million to 9.7 million in the same period (up 56%) driven by growth in AppsClub subscribers.
Adjusted EBITDA was up from USD 21.8 million in 2018 to USD23.9 million in 2019. Strong revenue growth combined with record gross margins, partly offset by growth in OPEX fueled this continued growth.
Product updates On the new acquisition channels development front, Bemobi is investing in expanding its No Credit and No Data web captive portal to include an interactive voice portal platform. This new interactive voice platform is now live in four of the largest carriers in Brazil and shows a
lot of promise as Bemobi prepares to scale this new channel internationally.
In International markets, we have started rolling out new products, having launched 11 Kids Clubs in 2019 in South Asia, SouthEastern Asia and CIS. 20 Kids Clubs in total have now been launched and we will proceed with launches in other International markets. Further, in 2019, we have launched 9 Health Clubs in South Asia, SouthEastern Asia and CIS. We have also started to roll out other standalone apps services such as Discount Club, Busuu Language Learning, Football Zone and Fantasy League.
In 2019, Bemobi launched Apps Clubs with partners in three new countries – AIS Thailand, MTS Armenia and Ucell Uzbekistan. There were also new Apps Club launches in Russia with Beeline, in South Africa with Vodacom and in Pakistan with Zong.
Bemobi also launched three NoCredit portals, including the launch with Telenor Myanmar, this being our first NDNC portal in Myanmar.
Acquisition of NovitechDuring 2019, Otello’s Bemobi business acquired certain assets from a Brazilian company, Novitech. The trans action included the following assets: hardware and software, intellectual property, commercial agreements with major Brazilian and Central American telecommunication carriers, as well as a few selected employees.
Bemobi regards this is an important strategic acquisition in many aspects. It enhances our channel offer and our current distribution platform, bringing a more diverse set of channels to our portfolio beyond the NDNC portals by adding a Voice based No Credit Portal. Further, it considerably raises our service distribution scale for our own services.
BEMOBI OVERVIEW AND PRODUCT UPDATE
AdColony per business area 2019 2018
Total 56.2 54.0
Gross profit 39.0 37.8
Adjusted EBITDA 23.9 21.8
EBITDA 20.9 21.2
EBIT 14.6 17.4

64 65OTELLO CORPORATION ASA - ANNUAL REPORT 2019 OTELLO CORPORATION ASA - ANNUAL REPORT 2019
SKYFIREFrom 2019, Skyfire was rolled into the Corporate segment of Otello, for reporting purposes, due to its size.
Video is expected to be 78% of traffic on mobile networks by 2021, adding to the pressure on mobile operators around the world. Skyfire’s Rocket Optimizer platform targets both encrypted and unencrypted video streams in congested parts of the network – helping operators to manage congestion while ensuring a high quality of experience. The unique technology also enables operators to pursue new business models and revenue streams while benefiting from increased technological flexibility as customer data is optimized. Rocket Optimizer is designed for operator deployment and provides operators with an instant 60 percent boost in bandwidth capacity across smartphones, tablets and laptops.
INVESTMENT IN VEWD SOFTWARE (FORMERLY OPERA TV)Otello holds a 27% share of Vewd Software (formerly Opera TV), the market leader in OTT solutions that enable customers and partners to reach connected device viewers. Among others, companies like Sony, Verizon, Samsung and TiVo utilize Vewd’s solutions.
As reported to the market on September 14, 2018, Otello was successful in its claim in the High Court of Justice of England and Wales against Moore Frères & Co LLC (“MFC”) and Last Lion Holdings Limited (“Last Lion”), arising from the refusal of the Board of Last Lion, which is controlled by appointees of MFC, to approve the sale of Otello’s remaining ownership stake in Last Lion, being approximately 2728.5% in the Vewd Software business. The judge granted Otello the injunction it sought requiring the Board to approve the buyer.
The buyer did not purchase the shares on the terms of the expired Share Purchase Agreement. In 2019, Otello restored the proceedings in order to pursue alternative remedies, including (1) an order from the Court that MFC be required to buy Otello’s shares (and related Loan Note) at the higher of the current valuation of those shares and the price that the buyer was prepared to pay, and (2) that in the event that MFC is unable to purchase the shares at such price, an order that all shares in Last Lion (or Last Lion’s shares in Last Lion Holdco AS) be sold and Otello be paid the sum found to be
due to it out of the proceeds of such sale. A trial to determine the relief to which Otello is entitled was listed to take place in a rolling five-day window from March 23, 2020. On March 18, 2020 the Court decided to postpone the trial until the court term commencing in October 2020, because of the impact of the ongoing corona virus pandemic. The Court has now listed the trial to commence in a rolling five-day window from October 5, 2020. The trial is expected to last for five days plus one day of prereading.
CORPORATE OVERVIEW
OrganizationAt the close of 2019, the Otello group had 596 fulltime employees and equivalents, compared to 493 full-time employees and equivalents at the end of 2018.
Board of Directors compositionAt the Annual General Meeting on June 4, 2019, André Christensen was elected as the chairman of the Board of Directors, replacing Audun Wickstrand Iversen. Maria Borge Andreassen and Anooj Unarket were elected to the Board of Directors. Frode Jacobsen and Birgit Midtbust were reelected to the Board of Directors.
Corporate governanceThe Company’s guidelines for corporate governance are in accordance with the Norwegian Code of Practice for Corporate Governance, dated October 17, 2018, as required by all listed companies on the Oslo Stock Exchange. Furthermore, the guidelines meet the disclosure requirements of the Norwegian Accounting Act and the Securities Trading Act. The guidelines are included separately in the annual report. Please see the section entitled “Principles of corporate governance” for further information.
Shareholders and equity-related issuesAs of December 31, 2019, Otello Corporation ASA had 140,477,429 outstanding shares. As of December 31, 2019, the Group’s equity was $345.7 million (parent company: $418.4 million), of which $1.7 million is owned by Noncontrolling interests. See note 16 in the consolidated financial statements for further information regarding Noncontrolling interests.
Share Buyback ProgramDuring 2019, Otello purchased 943 691 (2018: 2 495 745) treasury shares for $1.6 million (2018: 5.6 million) and sold 152 691 (2018: 203 745) treasury shares.
ShareholdersThe Company had 3,067 (2018: 3,269) shareholders at year end. At that time, 44.0% (2018: 47.5%) of the shares were held in Norway-based accounts, 36.5% (2018: 28.3%) in U.K.-based accounts,6.8% (2018: 7.1%) in Luxembourgbased accounts, 3.8% (2018: 3.7%) in Sweden-based accounts, 2.8% (2018: 3.4%) in France-based accounts and 6.2% (2018: 10.1%) in accounts based elsewhere.
Allocation of the annual profit / coverage of lossThe total comprehensive result for the period for the parent company, Otello Corporation ASA, was a profit of $85.4 million (2018: $ -413.4 million). The Board of Directors recommends that no dividend be paid for the 2019 financial year. The Board proposes that of the 2019 total comprehensive income, $91.6 million is transferred to other equity, and $-6.3 million is transferred to the translation reserve.
Going concernIn accordance with section 3-3a of the Norwegian Accounting Act, the Board confirms that the prerequisites for the going concern assumption exist and that the financial statements have been prepared based on the going concern principle.
Events after the reporting periodFor further information on subsequent events, see note 21 of the “Consolidated financial statements”.
For further information, please see the announcements published on the Oslo Stock Exchange website (www.oslobors.no).
CORPORATE SOCIAL RESPONSIBILITY
Creating a responsible and sustainable business is an integral part of everything we do at Otello. We are committed to the highest standard of social responsibility and believe that transparency and openness are key elements in obtaining a sustainable and responsible operation.
In this part of the Board of Directors report, we describe Otello’s effort and results related to corporate social responsibility (CSR). Our CSR work is focused around the following areas: Our employees, anticorruption and the environment.
Our employeesOtello’s success and innovation springs from the minds and teamwork of its employees. Our employees are our most valuable resource, and we are committed to interacting with our employees in the same way as we strive to interact with our customers, following the highest ethical standards and respect for individuality.
Equal opportunities and nondiscriminationOtello strongly condemns discrimination. We believe that people should be treated with respect and insist on fair, nondiscriminative treatment, regardless of irrelevant factors such as nationality, political views, religion, sexual orientation and gender.
We promote cultural diversity and we are proud to have 37 nationalities represented within the Group. We pride ourselves in being an international organization, where innovation and teamwork take place across borders and time zones.
We continually work to improve the gender balance in the company. At the end of 2019, 37% of the Group’s staff members were women. In addition, 2 of the 5 Board of Directors of the Group are female. The principles of equal opportunities and nondiscrimination are present throughout the organization and in all company activities. When recruiting, we use assessment methods such as programming tests and test cases to give equal opportunities to all qualified applicants. Similar approaches are exercised when promoting, offering training opportunities, etc.
Labor rights at Otello Otello respects and observes the fundamental labor rights set out in the international conventions, such as the conventions of the International Labor Organization and the United Nations.
Health and safety At Otello, we strive to offer our staff members a safe, healthy and inspiring workplace. We have a highly international workforce, where we combine the responsiveness of a flat structure with an extreme focus on results and innovation. All employees are expected to comply with safety and health regulations that apply to our business activities.
Discrimination on the bases of sickness or disability shall not occur at Otello. We work hard

66 67OTELLO CORPORATION ASA - ANNUAL REPORT 2019 OTELLO CORPORATION ASA - ANNUAL REPORT 2019
to meet all our employees’ needs. We offer shorter working hours and other services to accommodate our employees with disabilities or other particular needs.
Otello had an average rate of absence due to sick leave of 1.2% in the parent company in 2019 (2018: 3.8%), and an estimated rate of 1.4% for the Group as a whole (2018: 4%).
In 2019, Otello had a global turnover of 34% (2018: 47 %), of which 70 % were voluntary and 30% were involuntary terminations.
There have been no reports of workrelated accidents or injuries in 2019.
Anti-corruptionOtello abstains from and works actively to combat corruption and bribery. Corruption distorts economic decisionmaking, deters investment, undermines competitiveness and, ultimately, weakens economic growth.
There is no single, comprehensive, universally accepted definition of corruption. Therefore, each Otello employee must adhere to the existing laws and regulations in their country of operation. As a minimum, Otello’s internal regulations apply to all employees. Controls are made to ensure that the rules are followed. Otello has put in place internal guidelines to help employees in their daytoday operations. The following is an extract of these guidelines.
BriberyNo person acting on behalf of Otello shall attempt to influence someone in the conduct of their post, office or commission by offering an improper advantage. Nor shall improper advantage be offered to anyone for the purpose of influencing third parties in the conduct of their post, office, or commission. This includes all forms of facilitation payments.
Correspondingly, no person acting on behalf of Otello shall request, accept or receive improper advantage in connection with his/her position or assignment or for the purpose of influencing a third party. Improper advantage can take different forms, including but not limited to money, objects, credits, discounts, travel, accommodation and other services.
GiftsIt is a normal part of business life to exchange business courtesies, such as meals, transporta
tion, recreation, facilities or small gifts. Such an exchange of business courtesies must always follow local laws and regulations and not put any Otello employee in the position of a sense of obligation to return the favor, compromise professional judgment or create the appearance of compromise or corruption. Otello employees should always check with their manager or the HR department, if in doubt, and consider whether the exchange of business courtesy would be acceptable if it should become publicly known.
No person acting on behalf of Otello is allowed to accept any amount of cash or cash equivalents (such as gift certificates or market securities and similar), regardless of sum. Correspondingly, cash or cash equivalents may never be offered by Otello employees as a business courtesy, regardless of sum.
WhistleblowingOtello encourages freedom of speech and blowing the whistle on malpractice, fraud, illegality, or breaches of rules, regulations, and procedures or raising health and safety issues. Any Otello staff member making a whistleblowing report is protected from any repercussions, such as dismissal and other forms of reprisal. To secure an effective procedure, staff members may blow the whistle either in person or anonymously to the Work Environment committee.
To improve communication and ensure that issues do not escalate to the point where they become a whistleblowing case, Otello focuses on the following practices:
• Communicate the Company’s norms, values, and rules and regulations regarding
• ethical conduct.• Create an open atmosphere by making sure
that staff members have the opportunity and possibility to meet and discuss issues in formal and informal settings.
• Discuss and put questions regarding freedom of speech and whistleblowing on the agenda in internal communications.
The EnvironmentOtello understands the importance of supporting the environment and seeks to prevent any negative environmental impact our activities might have. Otello has incorporated its environmental policy as a part of the Ethical Code of Conduct.

68 69OTELLO CORPORATION ASA - ANNUAL REPORT 2019 OTELLO CORPORATION ASA - ANNUAL REPORT 2019
Otello is committed to using environmentally safe products in the workplace, to evaluating the consumption of energy and other resources to ensure efficient use, and to ensuring the development of environmentally protective procedures.
Otello has implemented the following guidelines and reporting schemes to ensure a high ethical standard throughout the organization.
The Ethical Code of Conduct is created to help employees, clients and business partners understand Otello’s values and standards. Otello’s reputation is created by the conduct of each individual staff member. Therefore, all staff members are obliged to familiarize themselves with the Ethical Code of Conduct when joining the company.
The Ethical Code of Conduct focuses on the following key areas: the rights and obligations of our employees; a healthy and safe working environment; anticorruption; and theexternal environment.
A violation of the Ethical Code of Conduct may result in disciplinary action, up to and including termination of employment. Several of the guidelines concern actions that are also punishable offenses. The Human Resources de
partment is responsible for following up any possible breaches.
RISK FACTORS
Otello has operations across multiple markets and is therefore exposed to a range of risks that may affect its business. Below are some key risks areas discussed and described.
Financial risk
Currency riskBoth revenue and operating expenses are exposed to foreign exchange rate fluctuations. The majority of revenues and operating expenses are in USD. Although an increasing portion of revenues are in Brazilian real (Bemobi), Danish kroner and Turkish lira (AdColony EMEA), most of the corresponding publisher and revenue share cost, and other operating expenses from these operations are denominated in the same currency, thereby limiting Otello’s exposure to some extent. Further, there is some exposure related to fluctuations in the USD v NOK exchange rate due to the amount of operating expenses in NOK, and certain items in the statement of financial position being denominated in NOK. See the tables below for a breakdown of revenues and operating expenses by currency.
Credit riskCredit risk is the loss that the Group would suffer if a counterparty fails to perform its financial obligations. The Group’s exposure to credit risk is mainly related to external receivables. Credit risk is assessed for each specific customer. No single customer accounted for more than 10% of the Group’s revenue during the financial year. Further, the Group conducts much of its business with large global companies and has not experienced significant credit-related losses during this or previous financial years. The Group applies the IFRS 9 simplified approach to measuring expected credit losses which uses a lifetime expected loss allowance for all trade receivables and contract assets. To measure the expected credit losses, trade receivables and contract assets have been grouped based on shared credit risk characteristics and the days past due. The contract assets relate to unbilled work in progress and have substantially the same risk characteristics as the trade receivables for the same types of contracts. The Group has therefore concluded that the expected loss rates for trade receivables are a reasonable approximation of the loss rates for the contract assets. Individual assessments per customer are also carried out by financial management.
Liquidity riskOtello considers its liquidity risk to be limited. Otello has significant liquidity reserves available through credit facilities with its primary bank.
In May 2018, Otello signed an agreement for a new 3-year Revolving Credit Facility (RCF) of $100 million with DNB Bank ASA. As at December 31, 2019, $20 million of the revolving credit facility had been drawn up. The credit facility has the following financial covenants: i) the Leverage Ratio to be below 2.00:1. ii) the Equity Ratio to hold the minimum level of 35%. The Group is compliant as of December 31, 2019.As of December 31, 2019, Otello therefore had $20.0 million in interestbearing debt, and the cash balance was $28.3 million (parent company: $1.2 million).
In March 2020, Otello signed an amendment to the 3 year Revolving Credit Facility (RCF) agreement of 2018 with DNB Bank ASA, reducing the facility to $50 million. However, as part of this amendment, Otello has secured a payment guarantee of an amount equal to $18.6 million in favour of Pedro Ripper, CEO of Bemobi, in order to support the Otello’s earnout obligations under the agreement signed between Bemobi Holding AS, the holding company of Otello’s
2019 2018
Revenues per currency [$ million] % [$ million] %
USD 160.5 66.7% 199.4 72.4%
BRL 39.2 16.3% 38.4 14.0%
DKK 15.0 6.2% 9.2 3.3%
TRY 13.2 5.5% 12.1 4.4%
INR 2.1 0.9% 2.7 1.0%
Other 10.7 4.5% 13.6 4.9%
Total 240.8 275.4
2019 2018
Opex per currency [$ million] % [$ million] %
USD (178.1) 70.3% (229.6) 77.6%
BRL (24.0) 9.5% (21.3) 7.2%
DKK (13.1) 5.2% (7.7) 2.6%
TRY (12.5) 4.9% (11.3) 3.8%
INR (12.4) 4.9% (11.0) 3.7%
Other (13.2) 5.2% (22.9) 7.7%
Total (253.4) (296.1)
70 71OTELLO CORPORATION ASA - ANNUAL REPORT 2019 OTELLO CORPORATION ASA - ANNUAL REPORT 2019
Bemobi business and Bemobi’s originally dated 28 May 2018 and amended on 10 January 2020. See note 16 of the consolidated financial statements for further information.
Although Otello does invest its money conservatively, all our investments are subject to risk. For example, Otello’s cash and other investments placed in Norwegian financial institutions are not guaranteed by the government above NOK 2 million per institution. If the financial institution were to go bankrupt, a portion of Otello’s cash or investment could be lost.
Operational risk
Covid 19In addition to the serious implications for people’s health and the healthcare services, the Coronavirus (COVID19) is having a significant impact on businesses and economies around the world. Since early 2020, Otello has assessed the potential risks on its business activities of COVID19. As mentioned, Otello expects Covid19 to negatively impact revenue and profit in 2020. It is too early to have a firm opinion on how great the impacts will be. The following factors are relevant when assessing this impact:
• An expected reduction in marketing spend• A reduction in disposable income for Otello’s
customers• A general worsening of economic conditions• Otello does not sell, market or distribute
physical products• Otello’s ability to serve its customers is not
adversely affected by its employees not being able to operate from their offices
• Marketing spend, that particularly the AdColony business is reliant upon, tends to return quickly to prior levels following financial or similar crises or downturns
• Much of Bemobi’s revenue is dependent on the consumption of services via mobile phones, which is expected to remain resilient during the coronavirus crisis
• The ability of Otello’s partners and customers to meet their obligations to Otello (including if any governmental actions designed to stimulate and support the telecom sector are introduced)
External risk factorsOur international operations expose us to additional risks that could harm our business, operating results and financial condition. In certain
international markets, we have limited operating experience and may not benefit from any first-to-market advantages. Our international operations expose us to risks, arising from changes in local political, economic, regulatory, social and labor conditions, which may adversely harm our operations. Some of the markets in which Otello operates are emerging economies with potentially complex and sensitive political and social contexts. Further, any restrictions on foreign ownership and investments, as well as stringent foreignexchange controls might prevent us from repatriating cash earned in certain foreign countries. In certain countries where Otello operates, longer payment cycles than experienced in our principle markets are the norm.
Otello’s competitors include some of the largest technology, advertising, internet and telecommunication companies in the world, with significantly larger financial resources, headcount and broader distribution channels than Otello. These large companies therefore have a greater financial capacity than Otello to make strategic acquisitions, invest in new technology and research and development, market their products, and compete for customers.
Otello’s revenue is dependent on expanding our user base and customer base by developing and marketing products that are more attractive than our competitors’ products. If the attractiveness of our products does not continuously improve and evolve to keep pace with the industry, we will have challenges retaining our current user base and gaining new customers. Our competitors are constantly improving their products and associated services. In order to stay competitive, Otello has to invest significant resources in research and development. Investing significantly in R&D is, however, no guarantee that consumers and customers will, in fact, find our products to be attractive enough to begin or continue using them, as it is impossible to accurately predict the behavior of our consumer and business customers.
Data riskMany of our products and services are dependent on the continuous operation of data centers and computer hosting and telecommunications equipment. If Otello’s internal or our service provider IT systems fail or are damaged, or if a third party gains unauthorized access to such systems and data is lost or compromised, it could have a material impact on

72 73OTELLO CORPORATION ASA - ANNUAL REPORT 2019 OTELLO CORPORATION ASA - ANNUAL REPORT 2019
Otello’s operations. Downtime can, for example, hurt our reputation with our customers, as well as increase the risk of damage claims and monetary penalties from our customers. If our centers or systems are subject to a security breach, customers’ confidential or personal information could be obtained and used by third parties, which could have a negative impact on our brand and the market perception that we are a reliable company, as well as subjecting us to significant regulatory fines or claims or damages from our customers.
For certain business models, we depend on internal systems to collect and produce accurate statistics regarding the use of our products and services, especially for products that rely on an active user royalty model. Failures or malfunctioning of these systems can have a significant impact on our financial results. Failure to adequately back up our internal systems can also have a material impact on the running of our business.
Otello handles substantial volumes of personal data. Loss, alteration or unauthorized disclosure of such information may adversely affect the Group’s business and reputation. The European Data Protection Regulation (GDPR), which entered into force in May 2018 introduces significant fines for breaches of data protection regulation in Europe.
As reported in the media, on January 14, the Norwegian Consumer Council (NCC) filed a complaint to the Norwegian Data Protection Authority (DPA) against Grindr and five other companies, including AdColony, who is a supplier to Grindr. The NCC requests that the DPA investigate certain alleged breaches of the General Data Protection Regulation (GDPR) relating to the processing of personal data about Grindr users received from Grindr through the Grindr app. As of the date of this notification, AdColony has not received any formal notification or complaint from the DPA. AdColony is currently looking into the NCC’s complaint and will provide further information if and when necessary. Otello has not recognized any contingent liabilities in the financial statements related to this matter.
Regulatory and litigation riskOtello’s operations are subject to requirements through sector specific laws, regulations and national licenses. Regulatory developments and regulatory uncertainty could affect the
Group’s results and business prospects. In several of the countries where Otello operates, the government has imposed sector specific taxes and levies, as a measure to improve state finances. The introduction of, or increase in, sector specific taxes and levies may impact Otello’s business. Further, it is a challenge for a company the size of Otello to remain updated on all the regulatory regimes that may apply to Otello at any one time.
Otello has many customers, partners and end users around the world, and, as a result, we can be exposed to lawsuits, government investigations and other claims or proceedings on a global basis. Such lawsuits, investigations and proceedings could be related to, for example, intellectual property (issues including trademark and patent suits), labor law issues, commercial lawsuits, data protection and privacy matters, consumer law, marketing law, tax issues and so forth. All such proceedings can have a significant impact on Otello, whether or not we are ultimately successful, due to the legal cost and the internal resources we would have to employ to defend ourselves. In the event of an adverse result against Otello in such a proceeding, Otello could be required to pay significant monetary damages or fines and/or redesign our products or services, causing a material impact on Otello’s business, financial results, operations and cash flow.
Intellectual property lawsuits are very common in the market within which Otello operates. Regardless of the merits of such lawsuits, they are extremely expensive to defend and litigate, and the damages awarded in such suits can be high. In addition, Otello has contractually undertaken to indemnify certain of our customers and partners, so, in the event they are sued for alleged intellectual property infringement, Otello would be required to defend them and pay their damages. Furthermore, an adverse judgment could require Otello to cease using certain technologies in our products or names for our products, requiring Otello to reengineer or rename our products. Compared to Otello, many of our competitors own large numbers of patents and other intellectual property rights. Although we do seek patent protection for certain innovations, we may not have sufficient protection for important innovations. Furthermore, because many large companies are able to settle intellectual property lawsuits by crosslicensing each other’s technology, the fact that our patent port
folio is not as extensive as our competitors’ portfolios could have a negative impact in a crosslicensing situation.
OUTLOOK
Otello’s strategic focus is to develop unique and relevant products, and scalable business models which combined should generate revenue growth and margin expansion. Otello remains positive about the Group’s overall growth prospects, with the following perspective on the Group as a whole:
AdColony operates in a global advertising industry which continues to experience a macro shift in advertising spend from traditional channels to digital online channels. AdColony is well positioned to take advantage of the macro trends and become the highest quality mobile advertising platform in the world. Otello expects AdColony revenue to grow by more than 10% in 2020 versus 2019 driven by our Brand and Programmatic business. Longer term growth will be driven by our move to
more automated delivery of ads and new technology and standardization which enables additional ad formats and provides the possibility to tap into new markets.
Bemobi operates in a rapidly growing market of app subscriptions. It takes advantage of the increased use of mobile phones combined with the low penetration of credit cards in emerging markets. Otello expects to see revenue growth of more than 10% in local currency in 2020 versus 2019 driven by both new services and continued global rollout.
Otello’s revenue is linked to the advertising spend of brands and game developers (AdColony) and subscriptions bought by consumers (Bemobi), and we expect Covid19 to negatively impact revenue and profit in 2020. At this stage, it is still too early to tell how great this impact will be. Ultimately, it will be linked to the duration of the crisis and the knockon effect of the changed behavior of our customers. The continued impact of Covid19 therefore poses risks to the 2020 guidance provided above.

74 75OTELLO CORPORATION ASA - ANNUAL REPORT 2019 OTELLO CORPORATION ASA - ANNUAL REPORT 2019
Report from the Board of Directors– Parent company information only
Below, please find financial information and commentary on Otello Corporation ASA, the parent company (“Company”) of the Otello Group (“Group”). Please note that the numbers and comments below are only applicable to the Company and not for the Group. However, the information described above for the Group is also applicable for the Company.
FINANCIAL SUMMARYThe Company’s main activities are to serve the Group as a whole, through the following functions and services: CEO, Board of Directors, corporate finance and accounting, legal, HR and IT. The Company charges some of the costs related to these functions to subsidiaries. There was limited operational activity in both 2019 and 2018. The Company had 14 full-time employees and equivalents in 2019 (2018:15).
Operating expenses decreased by 9% in 2019. This is primarily due to a decrease in payroll and related expenses as the Company’s headcount decreased during the year; and decrease in office rent expenses following the implementation of IFRS 16 Leases; offset by an increase in stockbased compensation expenses. The Company’s operating loss excluding impairment and restructuring expenses of $7.8 million (2018: 8.6 million) is in line with operating expense due to the limited amount of revenues.
The Company recognized an impairment loss of $29.0 million in 2019 related to its invest
ments in subsidiaries. This is based on the impairment testing carried out at Group level albeit with differing values for investment in subsidiaries at the Company level compared to the goodwill at Group level.
The Company reported a profit before income taxes of $91.5 million (2018: loss of 379.6 million). The profit was almost entirely due to the dividend received, offset by the impairment loss recognized. The Company reported a profit for the period of $91.6 million (2018: loss of 375.2 million) with a tax income related to increases in deferred tax assets.
Net cash flow from operating activities in 2019 totaled $9.9 million (2018: 11.8 million). The Company’s cash balance was impacted negatively in 2019 by operating losses, repayment of loans to subsidiaries, and loans given to subsidiaries, and positively by the drawing of $20 million from the credit facility and repayments of loans from subsidiaries. The cash balance was reduced by $0.7 million in 2019. As of December 31, 2019, the Company had a cash balance of $1.2 million (2018: 1.9).
The Company has $25.5 million in interestbearing debt at year end, the Company’s equity ratio was 93% (2018: 97%).
It is the Board’s opinion that the annual accounts provide a true and fair view of the Company’s activities in 2019.
Oslo, April 21, 2020
Andre ChristensenChairman
Frode Fleten Jacobsen Birgit Midtbust
Lars BoilesenCEO
Maria Borge Andreassen Anooj Unarket

76 77OTELLO CORPORATION ASA - ANNUAL REPORT 2019 OTELLO CORPORATION ASA - ANNUAL REPORT 2019
Statement by the Board of Directors and the Chief Executive Officer
The Board of Directors and the Chief Executive Officer (CEO) have reviewed and approved the Board of Directors’ report and the financial statements for Otello Group and Otello Corporation ASA as of December 31, 2019, (Annual Report for 2019).
The consolidated financial statements and the financial statements for the parent company have been prepared in accordance with the International Financial Reporting Standards (IFRS) as adopted by the EU and accompanying interpretations. The consolidated financial statements and the financial statements for the parent company also include certain disclosures in order to comply with certain regulations and paragraphs in the Norwegian Accounting Act and the Securities Trading Act.
To the best of our knowledge: • The consolidated financial statements and
the financial statements for the parent company for 2019 have been prepared in accordance with applicable accounting standards.
• The consolidated financial statements and the financial statements for the parent company give a true and fair view of the assets, liabilities, financial position and profits as a whole as of December 31, 2019, for the Group and the parent company.
• The Board of Directors’ report for the group and the parent company includes a true and fair review of:◊ The development and performance of the
business and the position of the Group and the parent company
◊ The principal risks and uncertainties the Group and the parent company face
Oslo, April 21, 2020
Andre ChristensenChairman
Frode Fleten Jacobsen Birgit Midtbust
Lars BoilesenCEO
Maria Borge Andreassen Anooj Unarket

78 79OTELLO CORPORATION ASA - ANNUAL REPORT 2019 OTELLO CORPORATION ASA - ANNUAL REPORT 2019
Consolidated statement of
Comprehensive Income(USD million, except per share amounts) Note 2019 2018
Revenue 4, 5 240.8 275.4
Total operating revenue 240.8 275.4
Publisher and revenue share cost 4, 5 (137.6) (161.0)
Payroll and related expenses, excluding stockbased compensation expenses 6, 9 (50.9) (57.7)
Stockbased compensation expenses 6 (3.8) 0.2
Depreciation and amortization expenses 11, 12, 13, 14 (28.1) (30.2)
Other operating expenses 7 (33.0) (47.4)
Total operating expenses (253.4) (296.1)
Operating profit (loss), excluding impairment and restructuring expenses (12.6) (20.7)
Impairment losses and restructuring expenses 9, 11, 12 (2.3) (97.4)
Operating profit (loss) (14.9) (118.0)
Interest income 5 1.0 1.0
Interest expenses 5 (1.4) (1.1)
Net FX gain (loss) 5 (0.6) 4.8
Other financial income (expense) (1.8) (2.1)
Negative goodwill 2.8
Interest expense related to contingent consideration 16 (1.6)
FX gains (losses) related to contingent consideration, net 16 0.0
Revaluation of contingent consideration 16 (0.1)
Share of the profit (loss) from associated companies 15 2.1 (0.0)
Net financial items 2.1 0.9
Profit (loss) before income taxes (12.8) (117.2)
Income taxes 8 (9.8) 24.5
Profit (loss) (22.6) (92.7)
Other comprehensive income:
Items that may or will be transferred to profit (loss)
Foreign currency translation differences (4.1) (21.0)
Total comprehensive income (loss) (26.8) (113.7)
Profit (loss) attributable to:
Owners of Otello Corporation ASA (23.7) (93.4)
Noncontrolling interests 1.1 0.8
Total comprehensive income (loss) attributable to:
Owners of Otello Corporation ASA (27.5) (113.3)
Noncontrolling interests 0.7 (0.4)
Earnings per share (profit/loss):
Basic earnings per share (USD) 15 (0.16) (0.66)
Diluted earnings per share (USD) 15 (0.16) (0.66)
Consolidated Group Financial Statements 2019Otello Corporation ASA
Consolidated statement of comprehensive income 79
Consolidated statement of financial position 80
Consolidated statement of cash flows 82
Consolidated statement of changes in equity 84
Note 1: General information 86
Note 2: Summary of significant accounting principles 86
Note 3: Critical accounting estimates and significant judgments 92
Note 4: Operating and segment information 93
Note 5: Financial risk, financial instruments, accounts and other receivables 98
Note 6: Payroll expenses and remuneration to management 104
Note 7: Other operating expenses 113
Note 8: Taxes 114
Note 9: Impairment and restructuring expenses 117
Note 10: Earnings per share 117
Note 11: Goodwill and impairment testing 118
Note 12: Intangible assets 120
Note 13: Property, plant and equipment 122
Note 14: Right-of-use assets and lease liabilities 124
Note 15: Other investments 126
Note 16: Contingent considerations 127
Note 17: Other current liabilities 127
Note 18: Shareholders and shareholder information 128
Note 19: Related parties 129
Note 20: Corporate Structure of Otello Group 130
Note 21: Events after the reporting period 131

80 81OTELLO CORPORATION ASA - ANNUAL REPORT 2019 OTELLO CORPORATION ASA - ANNUAL REPORT 2019
Consolidated statement of
Financial PositionConsolidated statement of
Financial Position
USD million Note 12/31/2019 12/31/2018
Assets
Deferred tax assets 8 32.2 40.5
Goodwill 11 230.7 232.4
Intangible assets 11, 12 22.4 28.3
Property, plant and equipment 13 8.0 8.0
Right of use assets 14 4.6
Lease receivables 14 1.9
Other investments 15 16.8 14.4
Other noncurrent assets 0.5 0.6
Total non-current assets 317.2 324.3
Accounts receivable 5 80.9 67.1
Lease receivables 14 0.5
Other receivables 5 8.6 15.3
Cash and cash equivalents 5 28.3 27.5
Total current assets 118.2 109.9
Total assets 435.4 434.2
USD million Note 12/31/2019 12/31/2018
Shareholders’ equity and liabilities
Equity attributable to owners of the company 18 337.2 362.7
Noncontrolling interests 6, 20 1.9 1.2
Total equity 339.1 364.0
Liabilities
Deferred tax liabilities 8 0.0 0.1
Lease liabilities 14 3.0
Loans and borrowings 5 20.0
Other noncurrent liabilities 5 1.1 2.1
Contingent consideration, noncurrent 16
Total non-current liabilities 24.1 2.1
Loans and borrowings 5
Lease liabilities 14 4.0
Accounts payable 5 22.8 23.4
Taxes payable 8 0.5 1.4
Public duties payable 1.4 1.8
Contract liabilities 5 1.3 2.1
Stockbased compensation liability 6 0.0 0.0
Other current liabilities 17 41.6 39.5
Contingent consideration, current 16 0.5
Total current liabilities 72.1 68.1
Total liabilities 96.3 70.2
Total equity and liabilities 435.4 434.2
Oslo, April 21, 2020
Andre ChristensenChairman
Frode Fleten Jacobsen Birgit Midtbust
Lars BoilesenCEO
Maria Borge Andreassen Anooj Unarket

82 83OTELLO CORPORATION ASA - ANNUAL REPORT 2019 OTELLO CORPORATION ASA - ANNUAL REPORT 2019
USD million Note 2019 2018
Cash flow from operating activities
Profit (loss) before taxes (12.8) (117.2)
Income taxes paid 8 (0.5) (5.4)
Depreciation and amortization expense 12, 13, 14 28.1 30.2
Net (gain) loss from disposals of PP&E, and intangible assets 0.1 (0.0)
Impairment of intangible assets and goodwill 9, 11 93.3
Changes in inventories, accounts receivable, accounts and other payables 1) 5 (11.1) 17.1
Other net finance items 0.5 0.5
Changes in other operating working capital (8.5) (17.7)
Share of net income (loss) from associated companies 15 (2.1) 0.0
Sharebased remuneration 6 3.6 (0.2)
Earnout cost and cost for other contingent payments 16 1.9
FX differences related to changes in balance sheet items 0.1 (2.7)
Net cash flow from operating activities (2.7) (0.2)
Cash flow from investment activities
Proceeds from sale of property, plant, and equipment (PP&E) and intangible assets 12, 13 (0.0) 0.0
Purchases of property, plant and equipment (PP&E) and intangible assets 12, 13 (2.5) (0.6)
Capitalized development costs 12 (10.8) (11.5)
Proceeds from disposal of subsidiaries and associated companies, net of cash disposed 1) 5.6
Purchases of subsidiaries and associated companies, net of cash acquired 16 (3.1)
Earnout payments 2) 16 (36.5)
Net cash flow from investment activities (10.7) (48.6)
Cash flow from financing activities
Proceeds from exercise of treasury shares (incentive program) 18 0.1 0.0
Purchase of treasury shares 18 (1.5) (5.5)
Proceeds from issuance of shares, net (incentive program) 18 (0.0) (0.1)
Proceeds from loans and borrowings 5 20.0
Repayments of loans and borrowings 5 (0.1)
Payment of finance lease liabilities, net 14 (3.8)
Net cash flow from financing activities 14.8 (5.7)
Net change in cash and cash equivalents 1.5 (54.5)
Cash and cash equivalents (beginning of period) 27.5 86.0
Effects of exchange rate changes on cash and cash equivalents (0.6) (4.1)
Cash and cash equivalents 3) 28.3 27.5
Consolidated statement of
Cash Flows
1) In 2019, Otello received $5.6 million of escrow payments. This was the final payment from the sale of SurfEasy to Symantec that took place in 2017.2) For 2018, this includes an investment of of $0.1 million in other shares.3) Of which $0.9 million (2018: 1.3 million) is restricted cash as of December 31, 2019.

84 85OTELLO CORPORATION ASA - ANNUAL REPORT 2019 OTELLO CORPORATION ASA - ANNUAL REPORT 2019
Consolidated statement of
Changes in EquityConsolidated statement of
Changes in Equity
USD million (except number of shares)
Number of shares
outstanding (million)
Paid-in capital
Other reserves
Reserve for treasury
sharesTranslation
reserveOther
equity
Non-con-trolling
interestsTotal
equity
Balance as of 12/31/2018 138.7 348.2 51.6 (67.6) (10.3) 40.8 1.2 364.0
Comprehensive income for the period
Profit (loss) (23.7) 1.1 (22.6)
Other comprehensive income
Foreign currency translation differences (3.8) (0.3) (4.1)
Total comprehensive income for the period - - - (3.8) (23.7) 0.7 (26.8)
Issue of share capital (0.0) (0.0)
Capital decrease 0.0
Treasury shares purchased (0.9) (1.6) (1.6)
Treasury shares sold 0.2 0.2 0.2
Sharebased payment transactions 3.4 3.4
Balance as of 12/31/2019 137.9 348.1 54.9 (69.0) (14.1) 17.2 1.9 339.1
Face value of the sharesThe face value of the shares is NOK 0.02.
Other reservesOther reserves consist of option and RSU costs recognized according to the equitysettled method.
Reserve for treasury sharesThe reserve for the Company’s own shares comprises the face value cost and excess value of own shares held by the Company.
Translation reserveThe translation reserve consists of all foreign currency differences arising from the translation of the financial statements of group companies with a functional currency that is not USD.
Other equityOther equity consists of all other transactions, including but not limited to, total recognized income and expense for the current period.
USD million (except number of shares)
Number of shares
outstanding (million)
Paid-in capital
Other reserves
Reserve for treasury
sharesTranslation
reserveOther
equity
Non-con-trolling
interestsTotal
equity
Balance as of 12/31/2017 141.0 348.5 51.0 (62.1) 9.5 121.1 - 468.0
Comprehensive income for the period
Profit (loss) (93.4) 0.8 (92.7)
Other comprehensive income
Foreign currency translation differences (19.8) (1.2) (21.0)
Total comprehensive income for the period - - - (19.8) (93.4) (0.4) (113.7)
Issue of share capital (0.3) (0.3)
Capital decrease (0.0) 0.0 0.0
Treasury shares purchased (2.5) (0.0) (5.5) (5.5)
Treasury shares sold 0.2 0.0 0.0 0.0
Sharebased payment transactions 0.5 0.5
Divestment of a subsidiary 0.0 13.3 1.7 14.9
Balance as of 12/31/2018 138.7 348.2 51.6 (67.6) (10.3) 40.8 1.2 364.0
Divestment of a subsidiary On May 29, 2018, Otello Corporation ASA divested 11.2% of the shares in Bemobi Holding AS. Please see note 16 for further information.
Face value of the sharesThe face value of the shares is NOK 0.02.
Other reservesOther reserves consist of option and RSU costs recognized according to the equitysettled method.
Reserve for treasury sharesThe reserve for the Company’s own shares comprises the face value cost and excess value of own shares held by the Company.
Translation reserveThe translation reserve consists of all foreign currency differences arising from the translation of the financial statements of group companies with a functional currency that is not USD.
Other equityOther equity consists of all other transactions, including but not limited to, total recognized income and expense for the current period.

86 87OTELLO CORPORATION ASA - ANNUAL REPORT 2019 OTELLO CORPORATION ASA - ANNUAL REPORT 2019
Note 1General information
Note 2Summary of significant accounting policies
General informationThe Otello Group’s (“Otello”) main business activities comprise mobile advertising via its AdColony business, and mobile app subscription services via its Bemobi business. The principal activities for Otello’s various business areas are described in more details in Note 4 – Operating and geographic segment information
Otello Corporation ASA (the “Company”) is a public limited company domiciled in Norway. The Company’s principal offices are located at Gjerdrums vei 19, Oslo, Norway. The company is listed on the Oslo Stock Exchange under the ticker OTELLO.
Statement of compliance and basis of the consolidated finan-cial statementsThe consolidated financial statements have been prepared in accordance with International Financial Reporting Standards (IFRS) as adopted by the EU and accompanying interpretations. The consolidated financial statements also include certain disclosures in order to comply with certain regulations and paragraphs in the Norwegian Accounting Act and the Securities Trading Act.
New and amended International Financial Reporting Standards (IFRS) adopted by the Group The Group adopted IFRS 16 Leasing effective for accounting periods beginning on or after January 1, 2019. See below for further details.
IFRS 16 Leasing: effective for accounting periods beginning on or after January 1, 2019This standard has significantly changed how the Group accounts for its lease contracts for offices and other assets previously accounted for as operating leases. The standard requires lessees to recognize most leases on their balance sheets as lease liabilities with corresponding assets for all leases with a lease term of more than 12 months, unless the underlying asset is of low value.
Further, a lessee recognizes depreciation of the rightofuse asset (ROU asset) and interest expense on the lease liability, instead of recognizing the expenses in Other operating expenses as per today. This has, therefore, lead to changes in the overall reporting of costs of the Group, with a reduction in operating expenses, increased depreciation expenses, and increased finance costs as a result of the effect of discounting the lease liability. See note 14 for information regarding the impacts on the financial statements in 2019.
For subsequent measurement, the Group remeasures the lease liability in the case of certain events taking place (e.g., a change in the lease term). Generally, the amount of the remeasurement of the lease liability is recognized as an adjustment to the rightofuse asset.
Otello is using the modified approach and, therefore, only recognize leases in the statement of financial position as of January 1, 2019. Prior periods have not been restated.
The consolidated financial statements of the Group for the year ended December 31, 2019, comprise the Company and its subsidiaries.
These consolidated financial statements have been approved and issued by the Board of Directors on April 21, 2020 for approval by the Annual General Meeting on June 2, 2020.
Leases classified as operating leases under IAS 17: At the date of initial application of IFRS 16, January 1, 2019, the Group recognized a lease liability for leases classified as operating leases according to IAS 17, in compliance with transition requirements. The Group measured the lease liabilities at the present value of the remaining lease payments, discounted using the Group’s incremental borrowing rate at January 1, 2019.
At the inception of a contract, the Group assesses whether a contract is, or contains a lease. A contract is or contains a lease if the contract conveys the right to control the use of an identified asset for a period of time in exchange for consideration.
Sublease contracts, where the Group is the lessor:For subleasing contracts, the group recognizes a lease receivable in the statement of financial position, with a corresponding reduction in the ROU asset. Shortterm and low value sublease contracts are not capitalized.
Contracts with renewal options: Some office leases contain renewal options exercisable by the Group. The renewal options held are exercisable only by the Group, and not by the lessors. The Group includes a renewal of the contracts in the lease valuation if it is considered reasonably certain that the Group will renew the contracts. It is not considered as reasonably certain that the Group will renew any contracts for more than 3 years.
Discount rates:Otello chose to use the modified approach for implementation of IFRS 16, and therefore use the incremental borrowing rate (IBR) as a discount rate on the opening balance. Going forward, the IBR will be used for subsequent measurement for new contracts, as long as the implicit interest rate is not readily determined.
As a basis for the discount rate calculation, Otello has used its credit facility agreement. This bears an interest rate of LIBOR, 3 months plus a margin of 2.50 % p.a. The margin has been adjusted according to the value of a lease. Specific country-based discount rates are used.
Interest rates are, therefore, adjusted to take into account the economic environment in the country where the lease is entered into. Rates are modified with a country risk premium, and with an inflation difference compared to Norway, where the credit facility agreement is held. The range of IBRs used is 2.8 % to 16.5 %.
IFRS 16, ‘Leases’ - Practical expedients: The Group has made the following accounting policy choices and elected to apply the following practical expedients related to the implementation of IFRS 16:
- Determining whether a contract is a lease or contains a lease: On the transition to IFRS 16, the Group elected to not reassess whether a contract is a lease or contains a lease. The Group only applies IFRS 16 to contracts that were previously identified as leases. The Group’s contracts that were not previously identified as leases were therefore not reassessed for whether they contain a lease.
- Short-term leases:Leases with a lease term of 12 months or less, are not capitalized. This also includes leases with a remaining lease term of 12 months at the date of initial application on January 1, 2019.
- Low-value leases:Lowvalue leases with an underlying value of USD 10,000 or less, are not capitalized.
Other standards and changesIn 2019 the Group revised its assessment of the accounting for the contingent liability arrangement to the former owners of Bemobi. This caused a revision to the statement of financial position in 2018, but without any change to equity. See note 3 for a more detailed description. Apart from the changes described above, the Group has not changed its accounting policies or adopted new standards that significantly affect the consolidated financial statements for this or prior periods.
Operating lease commitments as at 31 December 2018 10.7
Short term leases recognized on a straightline basis as expense 0.3
Lowvalue leases recognized in a straightline basis as expense
Contracts reassessed as service agreements
Adjustments as a result of different treatment of extension and termination options
Adjustments relating to changes in the index or rate affecting variable payments
Effect of discounting using the Group’s weighted average incremental borrowing rate 0.4
Lease liability recognized upon implementation of IFRS 16 10.0
Additions:
IAS 17 financial lease liabilities recognized as at 31 December 2018
Total lease liability as at 1. January 2019 10.0
Of which are:
Current lease liabilities 4.8
Noncurrent lease liabilities 5.2
Total lease liability as at 1 January 2019 10.0
There are no other IFRSs or IFRIC Interpretations that are not yet effective that would be expected to have a material impact on the Group in future periods.
Basis of preparationThe consolidated financial statements have been prepared on a historical cost basis, and are presented in US dollars (USD), rounded to the nearest hundred thousand, unless otherwise stated. As a result of rounding differences, amounts and percentages may not add up to the total.
Except for cashsettled, sharebased payment arrangements and contingent considerations recognized in business combinations, no other assets or liabilities are subsequently measured at fair value. Assets and liabilities recognized in business combinations are measured at fair value at the acquisition date according to IFRS 3. Receivables and debts are assumed to have a market value equal to the carrying amount.
The accounting policies set out below have been applied consistently to all periods presented in these consolidated financial statements. The accounting policies have been applied consistently by Group entities.
Consolidation principles
Business combinations:Business combinations are accounted for using the acquisition method. Subsidiaries are included in the consolidated financial statements from the date the Group effectively obtains control of the subsidiary (acquisition date) and until the date the Group ceases to control the subsidiary. Control is the power to govern the financial and operating policies of an entity so as to obtain benefits from its activities. In assessing control, the Group takes into consideration potential voting rights that currently are exercisable.
The Group measures goodwill at the acquisition date as:• The fair value of the consideration transferred; plus • The recognized amount of any noncontrolling interests in the
acquiree, plus if the business combination is achieved in stages, the fair value of the existing equity interest in the acquiree; less
• The net recognized amount (generally, fair value) of the identifiable assets acquired and liabilities assumed.
Costs related to the acquisition, other than those associated with the issue of debt or equity securities that the Group incurs in connection with a business combination are expensed as incurred. Any contingent consideration payable is recognized at fair value at the acquisition date. If the contingent consideration is classified as equity, it is not remeasured, and settlement is accounted for within equity. Otherwise, subsequent changes to the fair value of the contingent consideration are recognized in the profit or loss.
When sharebased payment awards (replacement awards) are required to be exchanged for awards held by the acquiree’s employees (acquirer’s awards) and relate to past services, then all or a portion of the amount of the acquiree’s replacement awards is included in measuring the consideration transferred in the business combination. This determination is based on the marketbased value of the replacement awards compared with the marketbased value of the acquiree’s awards and the extent to which the replacement awards relate to past and/or future service.
Subsidiaries – consolidated financial statements:Subsidiaries are entities controlled by the Group. Control exists when the Group has the power, directly or indirectly, to govern the financial and operating policies of an entity so as to obtain benefits from its activities. In assessing control, potential voting rights that presently are exercisable or convertible are taken into account. The financial statements of subsidiaries are included in the consolidated financial statements from the date on which control commences until the date on which control ceases.
Investments in associates:Associates are those entities in which the Group has significant influence, but not control, over the financial and operating policies.

88 89OTELLO CORPORATION ASA - ANNUAL REPORT 2019 OTELLO CORPORATION ASA - ANNUAL REPORT 2019
Significant influence is presumed to exist when the Group holds between 20 and 50 percent of the voting power of another entity. Investments in associates are accounted for using the equity method (equityaccounted investees) and are recognized initially at cost. The cost of the investment includes transaction costs.
The consolidated financial statements include the Group’s share of the profit or loss and other comprehensive income, after fair value adjustments, and to align the accounting policies of the associate with those of the Group.
When the Group’s share of losses exceeds its interest in an equityaccounted investee, the carrying amount of that interest is reduced to zero, and the recognition of further losses is discontinued except to the extent that the Group has an obligation or has made payments on behalf of the investee. Other longterm investments in the associate are measured at amortized cost with allowances for credit losses as appropriate.
Loss of control:Upon the loss of control, the Group derecognizes the assets and liabilities of the subsidiary, any noncontrolling interests, and the other components of equity related to the subsidiary. Any surplus or deficit arising on the loss of control is recognized in profit or loss. If the Group retains any interest in the previous subsidiary, then such interest is measured at fair value at the date that control is lost. Subsequently, it is accounted for as an equityaccounted investee or as an equity investment depending on the level of influence retained.
Intercompany balances and transactions eliminated on consolidation:Intercompany balances and transactions, any unrealized gains and losses, or income and expenses arising from intercompany transactions are eliminated in preparing the consolidated financial statements. Unrealized gains arising from transactions with equityaccounted investees are eliminated against the investment to the extent of the Group’s interest in the investee. Unrealized losses are eliminated in the same way as unrealized gains, but only to the extent that there is no evidence of impairment.
Segment reporting An operating segment is a component of the Group that engages in business activities from which it may earn revenues and incur expenses, including revenues and expenses that relate to transactions with any of the Group’s other components. Furthermore, the Group’s component’s operating results are regularly reviewed by the entity’s chief operating decision maker to make decisions about resources to be allocated to the segment and to assess its performance, and thus separate financial information is available. The company has determined that the Group’s executive management group is the chief operating decision maker. See note 4 for further information.
Foreign currency
Foreign currency transactions:Transactions in foreign currencies are translated at the foreign exchange rate prevailing on the date of the transaction. Monetary assets and liabilities denominated in foreign currencies at the balance sheet date are translated to functional currency at the foreign exchange rate prevailing on that date. Foreign exchange differences arising on translation are recognized in the statement of comprehensive income. Nonmonetary assets and liabilities that are measured in terms of historical cost in a foreign currency are translated using the exchange rate prevailing on the date of the transaction. Nonmonetary assets and liabilities denominated in foreign currencies that are recognized at fair value are translated to USD at foreign exchange rates prevailing on the date the fair value was determined. The functional currency for the majority of the group is USD, including the AdColony segment, whilst for the majority of the Bemobi segment, BRL is the functional currency.
Foreign operationsThe assets and liabilities of foreign operations, including goodwill and fair value adjustments arising from consolidation, are translat
ed to USD at foreign exchange rates prevailing on the balance sheet date. Revenues and expenses of foreign operations are translated to USD using the approximate foreign exchange rates prevailing on the transaction date. Foreign exchange differences arising from retranslation are recognized directly in a separate component of equity.
Property, plant and equipment
Owned assets:Property, plant and equipment are recognized at cost, less accumulated depreciation (see below) and impairment losses (see accounting policy regarding impairment).
Where parts of property, plant and equipment have different useful lives, the components are depreciated separately.
Right of use assets:At inception of a contract, the Group assesses whether a contract is, or contains, a lease. A contract is or contains a lease if the contract conveys the right to control the use of an identified asset for a period of time in exchange for consideration. To assess whether a contract conveys the right to control the use of an identified asset, the Group assesses whether:
- the contract involves the use of an identified asset, this may be specified explicitly or implicitly and should be physically distinct or represent substantially all of the capacity of a physically distinct asset. If the supplier has a substitution right, then the asset is not identified
the Group has the right to obtain substantially all of the economic benefits from use of the asset throughout the period of use, and
the Group has the right to direct the use of the asset.
As a lesseeThe Group recognizes a rightofuse asset and a lease liability at the lease commencement date. The rightofuse asset is initially measured at cost, which comprises the initial amount of the lease liability adjusted for any lease payments made at or before the commencement date, plus any initial direct costs incurred.
The rightofuse asset is subsequently depreciated using the straightline method from the commencement date to the earlier of the end of the useful life of the rightofuse asset or the end of the lease term. In addition, the rightofuse asset is periodically reduced by impairment losses, if any.
The lease liability is initially measured at the present value of the lease payments that are not paid at the commencement date, discounted using the interest rate implicit in the lease, or if that rate cannot be readily determined, the Group’s incremental borrowing rate.
Short-term leases and leases of low-value assets: The Group has elected not to recognize the rightofuse assets and liabilities for shortterm leases of equipment and lowvalue assets with an underlying value of USD 10,000 or less when they are new. This is not related to Financial subleases.
Lease paymentsPayments made under operating leases are recognized in the statement of comprehensive income on a straightline basis over the term of the lease. Lease incentives received are recognized in the statement of comprehensive income as an integral part of the total lease expense.
Subsequent costs:The Group recognizes, in the carrying amount of an item of property, plant and equipment, the cost of replacing part of such an item when that cost is incurred, if it is probable that the future economic benefits embodied with the item will flow to the Group, and the cost of the item can be measured reliably. All other costs are expensed as incurred.
Depreciation:Depreciation is calculated on a straightline basis over the estimated useful lives of each part of an item of property, plant and equipment. The estimated useful lives are as follows:• Leasehold improvements Over term of contract• Machinery and equipment Up to 10 years• Fixtures and fittings Up to 5 years • Right of use assets Over term of contract The residual value, if not insignificant, is reassessed annually.
Intangible assets Goodwill:Goodwill that arises upon the acquisition of subsidiaries is included in intangible assets. For the measurement of goodwill at initial recognition, see above.
Goodwill is recognized at cost, less any accumulated impairment losses. Goodwill is allocated to cashgenerating units (CGU) or groups of CGUs and tested at least annually for impairment (see accounting policy regarding impairment). A CGU is the smallest identifiable group of assets that generates cash inflows that are largely independent of cash inflows from other assets or groups of assets. In order to identify whether cash flows from an asset (or a group of assets) are independent of cash flows from other assets (or groups of assets), management assesses various factors, including how operations are monitored. Each CGU or group of CGUs to which goodwill has been allocated represent the lowest level in the entity where goodwill is monitored for internal management purposes. The group of CGUs may not be larger than an operating segment.
Please see note 3 for further information regarding accounting estimates and judgments related to impairment testing. Research and development:Expenses related to research activities, which are expected to lead to scientific or technological knowledge and understanding, are recognized as costs in the statement of comprehensive income in the period they are incurred.
Cost of building new features, together with significant and pervasive improvements of core platforms, provided that the significant and pervasive improvements of parts or main components of core platforms will generate probable future economic benefits, are capitalized as development costs and amortized on a straightline basis up to 5 years.
A significant portion of the work that engineering performs is related to the implementation of the ongoing updates that are required to maintain the platforms’ functionality. Examples of updates include “bug fixes”, updates made to comply with changes in laws and regulations, and updates made to keep pace with the latest trends. These costs are expensed as maintenance costs.
Please see note 3 for further information regarding accounting estimates and judgments related to development costs.
Other intangible assets:Other intangible assets that are acquired by the Group, are recognized at cost less accumulated amortization (see below) and impairment losses (see accounting policy regarding impairment).
Subsequent expenditure:Subsequent expenditure on capitalized intangible assets is capitalized only when it increases the future economic benefits embodied in the specific asset to which it relates. All other expenditures are expensed as incurred.
Amortization:Amortization is calculated on a straightline basis over the estimated useful lives of intangible assets, unless such lives are indefinite. Goodwill and intangible assets with indefinite useful lives are systematically tested for impairment at each balance sheet date.
Financial instruments
Non-derivative financial instruments:Non-derivative financial instruments comprise investments in equity and debt securities, trade and other receivables, cash and cash equivalents, loans and borrowings, and trade and other payables.
Non-derivative financial instruments are initially measured at fair value plus transaction costs, except for those non-derivative financial instruments classified as at fair value through profit or loss, which are initially measured at fair value without transaction costs. Subsequent to initial recognition, non-derivative financial instruments are measured as described below.
Trade and other receivables:Trade and other receivables are recognized at the invoiced amount less allowance for expected credit losses (see accounting policy regarding impairment).
Cash and cash equivalents:Cash and cash equivalents comprise cash balances and call deposits.
Impairment
Financial assets:
Trade receivablesThe Group applies the IFRS 9 simplified approach to measuring expected credit losses which uses a lifetime expected loss allowance for all trade receivables and contract assets. To measure the expected credit losses, trade receivables and contract assets have been grouped based on shared credit risk characteristics and the days past due. The contract assets relate to unbilled work in progress and have substantially the same risk characteristics as the trade receivables for the same types of contracts. The group has therefore concluded that the expected loss rates for trade receivables are a reasonable approximation of the loss rates for the contract assets. Individual assessments per customer are also carried out by financial management.
Loans and lease receivablesAll of the Group’s debt investments at amortized cost are considered to have low credit risk, and the loss allowance recognized during the period was therefore limited to 12 months expected losses.
Non-financial assets:The carrying amounts of the Group’s assets are reviewed annually to determine whether there is any indication of impairment. If any such indication exists, the asset’s recoverable amount is estimated (see below).
For goodwill, assets that have an indefinite useful life and intangible assets that are not yet available for use, the recoverable amount is nevertheless tested annually.
An impairment loss is recognized whenever the carrying amount of an asset, its cashgenerating unit or a group of units exceeds its recoverable amount. The cashgenerating unit is considered to be the acquired companies. Please see note 11 for further information. Impairment losses are recognized in the statement of comprehensive income.
Impairment losses recognized in respect of cashgenerating units are allocated first to reduce the carrying amount of any goodwill allocated to cashgenerating units (or group of units) and then to reduce the carrying amount of the other assets in the unit (group of units) on a prorata basis.
Calculation of recoverable amount:The recoverable amount of the Group’s assets is the greater of their fair value less cost of disposal and value in use. In assessing value in use, the estimated future cash flows are discounted to their present value using a pre-tax discount rate that reflects current market as

90 91OTELLO CORPORATION ASA - ANNUAL REPORT 2019 OTELLO CORPORATION ASA - ANNUAL REPORT 2019
sessments of the time value of money and the risks specific to the asset. For an asset that does not generate largely independent cash inflows, the recoverable amount is determined for the cash-generating unit to which the asset belongs.
Reversals of impairment:An impairment loss in respect of goodwill is not reversed. With respect to other assets, an impairment loss is reversed if there has been a change in the estimates used to determine the recoverable amount. An impairment loss is reversed only to the extent that the assets carrying amount do not exceed the carrying amount that would have been determined, net of depreciation or amortization, if no impairment loss had been recognized.
Dividends Dividends on shares are recognized as a liability in the period in which they are declared.
Employee benefits — Defined contribution plans A defined contribution plan is a post-employment benefit plan under which an entity pays fixed contributions into a separate entity and will have no legal or constructive obligation to pay further amounts. Obligations for contributions to defined contribution pension plans are recognized as an employee benefit expense in the profit or loss in the periods during which services are rendered by employees. Prepaid contributions are recognized as an asset to the extent that a cash refund or a reduction in future payments is available. Contributions to a defined contribution plan that are due more than 12 months after the end of the period in which the employees render the service are discounted to their present value.
RestructuringA provision for restructuring costs is recognized when the Group has approved a detailed and formal restructuring plan, and the restructuring either has commenced or has been publicly announced. Further, operating losses are not provided for.
Termination benefitsTermination benefits are expensed at the earlier of when the Group can no longer withdraw the offer of those benefits or when the Group recognizes costs for restructuring. If benefits are not expected to be settled within 12 months of the end of the reporting period, then they are discounted.
Share-based payment transactions The share option program allows Group employees to acquire shares of the Company. The fair value of options granted is recognized as an employee expense with a corresponding increase in equity. The fair value is measured at grant date and spread over the period during which the employees become unconditionally entitled to the options, with the offsetting amount against equity. The fair value of the options granted is measured using the Black & Scholes model, taking into account the terms and conditions upon which the options were granted. The amount recognized as an expense is adjusted to reflect the actual number of share options that vest, except where forfeiture is only due to share prices not achieving the threshold for vesting.
Restricted Stock Unit Plans are measured at the grant date using the current market value reduced by expected dividends paid before the vesting date, which is then further discounted.
Provisions A provision is recognized in the statement of financial position when the Group has a currently existing legal or constructive obligation as a result of a past event, and it is probable that a future outflow of economic benefits will be required to settle the obligation. If the effect is material, provisions are determined by discounting the expected future cash flows at a pre-tax rate that reflects current market assessments of the time value of money and, where appropriate, the risks specific to the liability.
Contingent considerationContingent consideration is measured at fair value using the ex
pected payment amounts and their associated probabilities (i.e., probabilityweighted). Since a part of the contingent consideration is longterm in nature, it is discounted to present value. Please see note 3 for further information regarding accounting estimates and judgments related to contingent considerations.
Trade and other payables Trade and other payables are recognized at amortized cost.
Revenue recognition The Company has the following primary sources of revenue:
• Advertising• Application and content
Revenue comprises the fair value of the consideration for the sale of goods and services, net of valueadded tax, rebates and discounts. Intercompany sales are eliminated. Revenue is recognized when a customer obtains control of a good or service and thus has the ability to direct the use and obtain the benefits from the good or service
AdvertisingAdvertising revenue is recognized each time a user views, or clicks a mobile ad, and/or installs a game. The performance obligations are satisfied on a point in time basis.
Advertising revenue is recognized based on certain different events and parameters;
i. when a user installs a game (i.e. a user plays a game, sees advertising, clicks on it and installs a game) based on CPI (cost per install);
ii. when a mobile ad is delivered to a user, based on CPM (cost per thousand) i.e every 1,000 impressions of a mobile ad inside the publisher’s inventory (which can be a mobile app or website);
iii. when a user plays a mobile video ad all the way to completion, based on CPCV (cost per completed video view);
iv. when a user clicks on a mobile ad, based on CPC (cost per click); i.e after each instance when an ad is clicked inside the publisher’s inventory,
For the revenue generated through Otelloowned properties, revenue is reported on a gross basis, as Otello is the principal in our transactions with advertisers. Otello is responsible for identifying and contracting with thirdparty advertisers, establishing the selling prices of the advertisements sold, and performing all billing and collection activities, including retaining credit risk, as well as bearing sole responsibility for fulfillment of the advertising. Accordingly, Otello acts as the principal in these arrangements and, therefore, reports revenue earned and costs incurred related to these transactions on a gross basis.
In the normal course of business, Otello acts as an intermediary in executing transactions with third parties. The determination of whether revenue should be reported on a gross or net basis is based on an assessment of whether Otello is acting as the principal or an agent in our transactions with advertisers. The determination of whether Otello is acting as a principal or an agent in a transaction involves judgment and is based on an evaluation of the terms of each arrangement. While none of the factors individually are considered presumptive or determinative, in reaching our conclusions on gross versus net revenue recognition, Otello places the most weight on the analysis of whether Otello is the primary obligor in the arrangement. For agreements where Otello has a contractual relationship with both the publisher and the associated advertisement supplier, Otello is responsible for identifying and contracting with thirdparty advertisers, establishing the selling prices of the advertisements sold and performing all billing and collection activities, including retaining credit risk, as well as bearing sole responsibility for fulfillment of the advertising. Accordingly, Otello acts as the principal in these arrangements and, therefore, reports revenue earned and costs incurred related to these transactions on a gross basis. For agreements where the publisher has a direct contractual relationship with the advertiser, revenue is recognized on a net basis, as Otello is not the primary obligor and does not assume the fulfillment and credit risk.
Application and contentApplication and Content revenue comprises i) Subscription revenue when a user purchases a subscription from a “cobranded” mobile store, or a whitelabel operatorcontrolled version of the mobile store, which is also known as Apps Club, and ii) the Bemobi Mobile Store (formerly OMS), when a user purchases a premium app.
When a transaction occurs in Bemobi Mobile Store, Otello collects the payment and shares a percentage of the revenue with the developer. When a transaction occurs in a “cobranded” or an operatorcontrolled version of the mobile store, two payment methods will exist. The user may pay using the Otello Payment Exchange, in which case Otello would collect and share a percentage of the revenue with both the operator and the developer, or the user may use a form of carrier billing, where the operator would collect the payment and share a portion of the revenue with Otello, who would in turn share a percentage of revenue with the developer. The revenue occurs on a transaction basis and is recognized in the period in which the transaction occurs.
Publisher and revenue share costsCost of goods sold comprises publisher costs and the cost of licenses purchased from thirdparty suppliers. Publisher costs consist of the agreedupon payments Otello makes to publishers for their advertising space, in which we deliver mobile ads. These payments are typically determined in advance as either a fixed percentage of the advertising revenue we earn from mobile ads placed on the publisher’s application or website or as a fixed fee for that ad space. Otello recognizes publisher cost at the same time we recognize the associated revenue. License costs are the costs of licenses purchased from thirdparty suppliers.
Other income (costs)Material income and costs, which are not related to the normal course of business, are classified as other operating income (cost).
Net financing costs Other finance income and costs comprise primarily foreign exchange gains and losses and changes in estimates of contingent considerations.
Interest income is recognized using the effective interest method.
Dividend income is recognized on the date upon which the entity’s right to receive payments is established.
Income taxIncome tax on the profit or loss for the year comprises current and deferred taxes. Income tax is recognized in profit or loss or other comprehensive income, except to the extent that it relates to items recognized directly in equity, in which case it is recognized in equity. Current tax is the expected tax payable on the taxable income for the year, using tax rates enacted or substantially enacted at the balance sheet date, and any adjustment to tax payable in respect of previous years.
Deferred tax is provided using the liability method, providing for temporary differences between the carrying amounts of assets and liabilities for financial reporting purposes and the amounts used for taxation purposes. The amount of deferred tax provided is based on the expected manner of realization or settlement of the carrying amount of assets and liabilities, using tax rates enacted or substantively enacted at the balance sheet date. A deferred tax asset is only recognized to the extent that it is probable that future taxable profits will be available against which the asset can be utilized. Deferred tax assets are reduced to the extent that it is no longer probable that the related tax benefit will be realized. Please see note 3 for further information regarding accounting estimates and judgments related to deferred tax assets.
Additional income taxes that arise from the distribution of dividends are recognized at the same time as the liability to pay the related dividend.
Earnings per shareThe Group presents basic and diluted earnings per share (EPS) data for its ordinary shares. Basic EPS is calculated by dividing the profit or loss attributable to ordinary shareholders of the Company by the weighted average number of ordinary shares outstanding during the period. Diluted EPS is determined by adjusting the profit or loss attributable to ordinary shareholders and the weighted average number of ordinary shares outstanding for the effects of all dilutive potential ordinary shares, which include share options granted to employees.

92 93OTELLO CORPORATION ASA - ANNUAL REPORT 2019 OTELLO CORPORATION ASA - ANNUAL REPORT 2019
Note 3Critical accounting estimates and significant judgments
The preparation of consolidated financial statements in accordance with IFRS requires management to make judgments, estimates and assumptions that affect the reported amounts of revenues, expenses, assets and liabilities, and the disclosures of contingent liabilities, at the end of the reporting period. However, uncertainty about these assumptions and estimates could result in outcomes that require a material adjustment to the carrying amount of the asset or liability affected within the next financial year.
Estimates and judgments are evaluated on an ongoing basis, based upon historical results and experience, consultations with experts, trends and other methods which management considers reasonable under the circumstances, as well as forecasts as to how these might change in the future.
Critical accounting estimatesThe main estimates that have a significant risk of causing a material adjustment to the carrying amounts of assets and liabilities within the next financial year are specified below.
Impairment, see note 11In accordance with IAS 36, the Group tests annually whether goodwill has suffered any impairment. Assets that are subject to amortization are reviewed for impairment whenever events or changes in circumstances indicate that the carrying amount may not be recoverable.
The recoverable amounts of cashgenerating units have been determined based on a value-in-use calculation for the most significant cashgenerating units. see note 11 for further information on recoverable amounts.
Value in use, particularly when discounted cash flow methods are used, must in part be based on management’s evaluations, including determining appropriate cashgenerating units, determining the discount rate, estimates of future performance, revenue generating capacity of the assets, margins, and assumptions of the future market conditions. For assumptions used, external evidence has been taken into consideration. Discount rates have been sourced from a thirdparty expert.
Management compares the estimates of value in use with the market valuation for reasonableness. In addition, a retrospective analysis of forecasts used in prior years is carried out in order to provide further input for the estimates that are made regarding future cash flows.
A sensitivity analysis for changes in key assumptions and whether they would lead to an impairment loss is included in note 11.
Significant judgmentsSignificant judgements in applying the entity’s accounting policies are specified below.
Capitalized development costs, see note 12Cost of building new features, together with significant and pervasive improvements of core platforms, provided that the significant and pervasive improvements of parts or main components of core platforms will generate probable future economic benefits, are capitalized as development costs and amortized on a straightline basis up to 5 years.
On a quarterly basis, engineering work is assessed on a project basis. Projects are categorized as 1) those that have met the technological feasibility date but have not yet gone live 2) those that have launched and begun amortization, and 3) research/operations/maintenance
projects. An allocation of a percentage of each employee’s time across the various projects is made. Any new projects are assessed according to the criteria in IAS 38, and previously categorized projects are assessed in terms of changes in assumptions. Capitalized costs are calculated by using the time allocations made. These calculations are reviewed by management before being capitalized.
Some of the work that engineering employees perform is related to the implementation of the ongoing updates that are required to maintain the platforms’ functionality. Examples of updates include “bug fixes”, updates made to comply with changes in laws and regulations, and updates made to keep pace with the latest trends. These costs are expensed as maintenance expenses.
Deferred tax assets, see note 8The recognition of deferred tax assets and liabilities requires the exercise of judgment. Otello recognizes deferred tax assets related to tax losses in the statement of financial position when it is considered probable that taxable profit will be generated in future periods against which these tax loss carry forwards can be utilized. The main part of the USD 32.2 million in recognized deferred tax assets as of December 31, 2019, relates to tax loss carry forwards in the US, and the tax effect of a merger between two Brazilian entities in 2018. Regarding tax loss carry forwards in the US, management has assessed forecast taxable profit for the coming years, and concluded that the tax loss carry forward generated in 2019 should not be reognized. However, management considers that sufficient future taxable profits will be generated against which the US tax loss carry forwards for the period up until 2019 can be utilized.
See note 8 for a breakdown of tax loss carry forwards and relevant expirations dates of these.
Contingent considerations, see note 16The Group has previously entered into earnout agreements in connection with acquisitions. An analysis is given in note 16 of how the provisions related to contingent considerations have been calculated. The net present value amount is based on management’s assumptions by discounting probability weighted cash flows. Key assumptions applied by management are future revenues and earnings before financial items, interest, taxes, depreciation and amortization (EBITDA) results, and revenue and EBITDA from synergies with existing businesses, and the estimated timing of cash flows. Changes in the chosen assumptions can have a significant impact on the size of the provision and earnout costs recognized.
The Group has a contingent liability to pay the 11.2 % noncontrolling shareholders of Bemobi Holding AS an amount of USD 18.1 million if a major transaction in the form of an IPO or a qualified sale of Bemobi does not take place within December 31, 2020. The Group is of the opinion that it controls the decision to sell the subsidiary, and has therefore not recognized the liability in the statement of financial position. In the 2018 financial statements, the liability was recognized with a corresponding financial asset for the same amount. During 2019 the accounting for this arrangement was revisited. The comparative figures for 2018 have therefore been revised as described below. The revision had no effect on equity.
Note 4Operating and segment information
The Group’s business activities comprise mobile advertising via its AdColony business, mobileapp subscription services via its Bemobi business, and licensing of Rocket Optimizer™ technology via its Skyfire business. Skyfire, due to materiality, is reported as part of Otello’s corporate segment.
The following are Otello’s segments as at December 31, 2019:
AdColony (Mobile Advertising)AdColony is one of the largest mobile advertising platforms in the world with a reach of more than 1.5 billion users globally. AdColony provides an endto end platform for brands, agencies, publishers and application developers to deliver advertising to consumers on mobile devices around the world. AdColony delivers highly interactive and engaging advertising experiences across all mobile formats with particular strength in video and full screen interactive rich media ads.
AdColony’s advertising revenue is primarily based on the activity of mobile users viewing ads through 3rd party publishers, such as developer applications and mobile websites. Revenue is recognized when Otello’s advertising services are delivered based on the specific terms of the advertising contract, which are commonly based on the number of ads delivered, or views, clicks or actions by users of mobile advertisements.
See note 2 for further information regarding revenue recognition.
Bemobi (Apps & Games)Bemobi’s revenues are primarily generated from Apps Club, a subscriptionbased discovery service for mobile apps. Apps Club offers a unique, “Netflix-style” subscription service for premium Android apps. Working with mobile operators, Bemobi’s proprietary app-wrapping technology allows smartphone users access to unlimited use of premium mobile apps for a daily, weekly or monthly fee. Users pay for this service through their mobile operator billing systems. Bemobi is a socalled B2B2C company. Instead of selling directly to a consumer, Bemobi typically partners with large companies, mostly mobile operators or in some cases smartphone original equipment manufacturers (OEMs). Through partnerships with these companies, Bemobi can offer its service to consumers.
Bemobi revenue is primarily comprised of: i) subscription revenue when an Android user purchases a subscription from a ”cobranded” mobile store, or a whitelabel operatorcontrolled version of the mobile store, known as Apps Club, and ii) the Bemobi Mobile Store (formerly Opera Mobile Store), a feature phone platform, when a user purchases a premium app. This feature phone platform, acquired by Bemobi’s parent Otello from the acquisition of Handster in 2011, is to be phased out.
See note 2 for further information regarding revenue recognition.
Corporate costsCorporate costs comprise primarily i) costs related to personnel working in functions that serve the Group as a whole, including CEO/Board of Directors, corporate finance and accounting, legal, HR and IT, and ii) legal and other costs related to business combinations and restructuring processes.
See note 2 for further information regarding revenue recognition.
Line2018
as issued2018 as revised
Other receivables 27.2 million 5.9 million
Contingent consideration, current 21.3 million nil

94 95OTELLO CORPORATION ASA - ANNUAL REPORT 2019 OTELLO CORPORATION ASA - ANNUAL REPORT 2019
Revenue [USD million] 2019 2018
AdColony (Mobile Advertising) 183.9 220.6
Bemobi (Apps & Games) 56.2 54.0
Corporate 0.9 0.8
Eliminations (0.3) 0.0
Total Group 240.8 275.4
Gross profit [USD million] 2019 2018
AdColony (Mobile Advertising) 63.4 75.1
Bemobi (Apps & Games) 39.0 38.5
Corporate 0.9 0.8
Eliminations (0.0) (0.0)
Total Group 103.2 114.4
Adjusted EBITDA 2) [USD million] 2019 2018
AdColony (Mobile Advertising) 0.3 (5.1)
Bemobi (Apps & Games) 23.9 21.8
Corporate (5.0) (7.3)
Eliminations 0.0 (0.0)
Total Group 19.3 9.4
From 2019, figures for Skyfire (Performance & Privacy) are presented together with the segment Corporate due to its very limited size and impact on the consolidated financial statements. Figures for 2018 for Skyfire are therefore also combined with Corporate.
Alternative performance measuresOtello discloses alternative performance measures as part of its financial reporting as a supplement to the financial statements prepared in accordance with IFRS. Otello believes that the alternative performance measures provide useful supplemental information to management, investors, financial analysts and other stakeholders, and are meant to provide an enhanced insight into the financial development of its’ business operations and to improve comparability between periods.
Definitions of alternative performance measures used by Otello are presented below:
Gross profit:This comprises revenues minus publisher and revenue share cost.
EBITDA:This is short for Earnings before financial items, taxes, depreciation and amortization. EBITDA corresponds to Operating profit (loss) in the Consolidated statement of comprehensive income excluding depreciation and amortization.
Adjusted EBITDA:This represents EBITDA excluding stockbased compensation expenses, restructuring and impairment costs. Adjusted EBITDA corresponds, therefore, to Operating profit (loss) in the Consolidated statement of comprehensive income excluding depreciation and amortization, stockbased compensation expenses, restructuring and impairment expenses.
Certain items are excluded in the alternative performance measure Adjusted EBITDA to provide enhanced insight into the performance of the business and to improve comparability between different periods. Adjusted EBITDA is reviewed regularly by Group management, since it is considered to represent an appropriate measure showing the underlying operational performance excluding nonrecurring items.
Reconciliation of Adjusted EBITDA [USD million] 2019 2018
Profit (loss) (22.6) (92.7)
Income taxes 9.8 (24.5)
Profit (loss) before income taxes (12.8) (117.2)
Net financial items (2.1) (0.9)
Operating profit (loss) (14.9) (118.0)
Depreciation and amortization expenses 28.1 30.2
Impairment and restructuring expenses 2.3 97.4
Stockbased compensation expenses 3.8 (0.2)
Adjusted EBITDA 19.3 9.4
The table below presents key financial figures for 2019 and 2018. The table below presents a reconciliation of profit (loss) to Adjusted EBITDA.
Revenues
Revenue by region [USD million] 2019 2018
USA 86.8 114.6
EMEA, excluding Norway 80.4 93.4
Brazil 39.2 38.4
Asia Pacific 26.0 21.3
Americas, excluding USA and Brazil 6.2 6.1
Norway 2.2 1.7
Total 240.8 275.4
The breakdown of revenue by region reflects the customer or partner’s (mobile operator, OEM) country of domicile. Consequently, the revenue breakdown reflects the location of Otello’s customers and partners. The breakdown above does not accurately reflect, therefore, where Otello’s derivative products and services are used by the end user (partner’s customer).
In 2019, no customer accounted for more than 10 % of Group revenues. In 2018, one customer accounted for approximately 10 % of total Group revenue.

96 97OTELLO CORPORATION ASA - ANNUAL REPORT 2019 OTELLO CORPORATION ASA - ANNUAL REPORT 2019
Assets
Advertising (point in time) [USD million] 2019 2018
USA 86.2 114.1
EMEA, excluding Norway 75.7 87.3
Brazil
Asia Pacific 16.0 13.7
Americas, excluding USA and Brazil 4.1 4.2
Norway 2.2 1.3
Total 184.2 220.6
Application and content (over time) [USD million] 2019 2018
USA
EMEA, excluding Norway 4.6 6.0
Brazil 39.2 38.4
Asia Pacific 10.0 7.6
Americas, excluding USA and Brazil 2.0 1.9
Norway 0.0
Africa 0.1 0.1
Total 56.0 54.0
Unsatisfied performance obligations are not material enough to be disclosed.
Revenues from the Corporate segment (including Skyfire) are not considered material enough to be presented disaggregated.
Total assets by segment [USD million] 2019 2018
AdColony 296.5 302.1
Bemobi (Apps & Games) 113.5 101.7
Corporate (including parent company) 43.9 51.7
Total 454.0 455.5
Non-current assets by segment [USD million] 2019 2018
AdColony 199.9 204.2
Bemobi (Apps & Games) 65.8 62.4
Corporate (including parent company) 19.3 17.2
Total 284.9 283.8
From 2019, figures for Skyfire (Performance & Privacy) are presented together with the segment Corporate due to its very limited size and impact on the consolidated financial statements. Figures for 2018 for Skyfire are therefore also combined with Corporate.
See note 11 for information regarding impairment of noncurrent assets per segment.
Non-current assets by location [USD million] 2019 2018
Noncurrent assets located in Norway 21.1 17.7
Noncurrent assets located in United States 198.5 202.1
Noncurrent assets located in other countries 65.4 64.1
Total 284.9 283.8
The breakdown of non-current assets above does not include financial instruments and deferred tax assets.
The vast majority of the value of noncurrent assets is related to acquisitions. See note 11 and 12 for further information.
Disaggregation of revenue
In the following tables, the major revenue types are disaggregated by region as disclosed above.

98 99OTELLO CORPORATION ASA - ANNUAL REPORT 2019 OTELLO CORPORATION ASA - ANNUAL REPORT 2019
Note 5Financial risk, financial instruments, accounts and other receivables
2019 2018
Revenues per currency: [USD million] Revenues % Revenues %
USD 160.5 66.7% 199.4 72.4%
BRL 39.2 16.3% 38.4 14.0%
DKK 15.0 6.2% 9.2 3.3%
TRY 13.2 5.5% 12.1 4.4%
INR 2.1 0.9% 2.7 1.0%
Other 10.7 4.5% 13.6 4.9%
Total 240.8 275.4
Operating expenses (OPEX) per currency: 2019 2018
[USD million] OPEX % OPEX %
USD (178.1) 70.3% (229.6) 77.6%
BRL (24.0) 9.5% (21.3) 7.2%
DKK (13.1) 5.2% (7.7) 2.6%
NOK (12.5) 4.9% (11.3) 3.8%
TRY (12.4) 4.9% (11.0) 3.7%
Other (13.2) 5.2% (22.9) 7.7%
Total (253.4) (296.1)
Financial riskRisk management in the Group is carried out by management and approved by the Board of Directors. Potential risks are evaluated on a regular basis and management determines appropriate strategies related to how these risks are to be handled within the Group under the approved policies. The Group is exposed to market (currency) risk, credit risk and liquidity risk.
Currency riskThe majority of the financial risk that the Group is exposed to relates to currency risk. Both revenue and operating expenses are exposed to foreign exchange rate fluctuations. Please note that some revenue numbers are impacted by changes in local currencies which are the basis for invoicing of customers. These effects are not specified in the table below.
Conversion of the Group’s revenues from foreign currencies into USD yields the following average exchange rates:
2019 2018
BRL 0.254 0.276
DKK 0.150 0.158
TRY 0.176 0.213
INR 0.014 0.015
Revenues and expenses for the current year recalculated on a constant currency basis, are presented below:
[USD million]Recalculated with prior
year average ratesFX effect using prior year rates Effect in %
Revenue 246.0 5.3 2.2 %
Expenses (259.6) (6.2) 2.4 %
Loans and receivablesThe Group has limited exposure in terms of credit risk related to loans and receivables.
Foreign exchange contracts During 2019 and 2018, the Group did not use forward exchange contracts to hedge its currency risk, and Otello had not entered into any foreign exchange contracts as of December 31, 2019.
FX gain (loss) and other financial income (expense)The table below shows the breakdown of FX gains and losses, and other financial income and expense.
2019 2018
FX gain 5.1 12.5
FX loss (5.7) (7.7)
Other finance income (expense) (1.8) (2.1)
Total (2.4) 2.7
Other finance income (expense) includes $1.1 million (2018: 2.2) in legal costs related to the sale of the TV business and Otello’s ongoing case regarding the potential sale of its minority stake (see notes 15 and 21 for further information).
Credit riskCredit risk is the risk of losses that the Group would suffer if a counterparty fails to perform its financial obligations. The Group’s exposure to credit risk is mainly related to external receivables. Credit risk is assessed for each specific customer. No single customer accounted for more than 10% of the Group’s revenue during the financial year. Further, the Group conducts much of its business with large global companies and has not experienced significant credit-related losses during this or previous financial years. The group applies the IFRS 9 simplified approach to measuring expected credit losses which uses a lifetime expected loss allowance for all trade receivables and contract assets. To measure the expected credit losses, trade receivables and contract assets have been grouped based on shared credit risk characteristics and the days past due. The contract assets relate to unbilled work in progress and have substantially the same risk characteristics as the trade receivables for the same types of contracts. The group has therefore concluded that the expected loss rates for trade receivables are a reasonable approximation of the loss rates for the contract assets. Individual assessments per customer are also carried out by financial management.
Accounts receivable
Gross accounts receivable per currency:
The numbers below are presented in local currencies (million)
% of gross AR2019 % of gross AR 2018
USD 31.8 60.0% 30.6 58.4%
TRY 42.4 13.4% 32.8 11.9%
BRL 24.6 11.6% 22.6 11.1%
DKK 29.2 8.3% 19.6 6.0%
Other n/a 6.7% n/a 12.6%

100 101OTELLO CORPORATION ASA - ANNUAL REPORT 2019 OTELLO CORPORATION ASA - ANNUAL REPORT 2019
The accounts receivable are converted, as of December 31, at the following exchange rates:
2019 2018
TRY 0.168 0.189
BRL 0.249 0.258
DKK 0.150 0.153
Gross accounts receivable per region: [USD million] 2019 2018
Americas 27.3 22.8
EMEA 17.8 17.4
Asia Pacific 7.9 12.1
Total 53.0 52.4
Loss allowance as at December 31, 2019 and December 31, 2018 was determined as follows for both trade receivables and contract assets:
2019
[USD million]
Gross carrying amount -
accounts receivable
Gross carrying amount -
contract assetsExpected loss rate Loss allowance
Current 25.0 30.3 0.6 % (0.2)
Past due 0-30 days 13.5 5.9 % (0.8)
Past due 31-60 days 4.3 0.0 % (0.0)
Past due 6190 days 2.0 0.2 % (0.0)
More than 90 days 8.3 16.7 % (1.4)
Total 53.0 30.3 (2.3)
2018
[USD million]
Gross carrying amount -
accounts receivable
Gross carrying amount -
contract assetsExpected loss rate Loss allowance
Current 19.5 21.5 0.3 % (0.1)
Past due 0-30 days 14.5 2.0 % (0.3)
Past due 31-60 days 4.1 0.5 % (0.0)
Past due 6190 days 3.1 1.8 % (0.1)
More than 90 days 11.1 56.8 % (6.3)
Total 52.4 21.5 (6.7)
Accounts receivable and other receivables [USD million] 2019 2018
Accounts receivable (including provision for bad debt) 50.6 45.6
Contract assets 30.3 21.5
Other receivables 8.6 15.3
Total 90.0 82.5
Accounts receivable represent the part of receivables that is invoiced to customers but not yet paid. Contract assets represents revenue recognized in the year which was not invoiced to the customers at year end and which will be invoiced to customers subsequent to the balance sheet date.
Other receivables Other receivables consists of payments held in escrow related to sales and acquisitions, nontrade receivables including tax receivables, and prepayments.
Contract liabilitiesDeferred revenue consists of and prepaid advertising campaigns, and prepaid license/royalty payments.
Liquidity reserve [USD million] 2019 2018
Cash and cash equivalents
Cash in hand and on deposit 28.3 27.5
Less restricted funds 1) 0.9 1.3
Unrestricted cash 27.3 26.2
Unutilized credit facilities 80.0 100.0
Shortterm overdraft facility
Liquidity reserve 80.0 100.0
Breakdown of cash deposits by currency [USD million] 2019 2018
BRL 15.4 6.3
USD 6.4 12.5
NOK 1.3 2.0
EUR 1.1 0.6
TRY 0.1 1.1
Other 4.0 4.9
Total 28.3 27.5
Credit Facility [USD million] 2019 2018
Longterm cash credit 100.0 100.0
Utilized 20.0
Liquidity risk
Credit facilityIn May 2018, Otello signed an agreement for a new 3 year Revolving Credit Facility (RCF) of $100 million with DNB Bank ASA. As at December 31, 2019, $20 million of the revolving credit facility had been drawn.
The facility is primarily secured through a pledge in shares in Bemobi Holding AS, AdColony Holding AS, and Performance and Privacy Ireland Ltd, as well as charges over accounts receivable in the parent company.
The credit facility has the following financial covenants: i) the Leverage Ratio to be below 2.00:1. ii) the Equity Ratio to hold the minimum level of 35%. The Group is compliant as of December 31, 2019.
The RCF of $100 million bears an interest rate of LIBOR, 3 months + a Margin of 2.50 % p.a. There is no utilization fee. On the undrawn portion of the facility, a commitment fee of 35% of the Margin will be paid.

102 103OTELLO CORPORATION ASA - ANNUAL REPORT 2019 OTELLO CORPORATION ASA - ANNUAL REPORT 2019
Financial liabilitiesAll financial liabilities other than the credit facility (described above), and liabilities relating to contingent considerations (see note 16) are expected to be paid within 1 year of the balance sheet date.
Net debt reconciliationThe tables below set out an analysis of net debt and the movements in net debt for each of the periods
Capital managementThe Group’s policy has been to maintain a high equitytoasset ratio and to maintain a solid capital base so as to maintain investor, creditor and market confidence and to sustain future development of the business. The Group still possesses a business model that anticipates considerable cash flow in the future.
Neither the Company nor any of its subsidiaries are subject to externally imposed capital requirements
Financial instruments
Financial instruments, and contracts accounted for as such, are included in several line items in the statement of financial position and classified in categories for accounting treatment. A classification of financial instruments in Otello is presented below:
2019
[USD million]Amortised
costFair
value
Assets - current
Accounts receivable 80.9 80.9
Cash and cash equivalents 28.3 28.3
Liabilities - non-current
Loans and borrowings 20.0 20.0
Other noncurrent liabilities 1.1 1.1
Liabilities - current
Accounts payable 22.8 22.8
Other current liabilities 1) 0.8 0.8
Contingent consideration, current 19.1
2018
[USD million]Amortised
costFair
value
Assets - current
Accounts receivable 67.1 67.1
Cash and cash equivalents 27.5 27.5
Liabilities - non-current
Other noncurrent liabilities 2.1 2.1
Liabilities - current
Accounts payable 23.4 23.4
Other current liabilities 1) 0.5 0.5
Contingent consideration, current 21.3
1) Other current liabilities represents liabilities to entities in discontinued operations. See note 17 for further information.
[USD million] 2019 2018
Cash and cash equivalents 28.3 27.5
Borrowings (20.0)
Lease liabilities (7.1)
Net cash 1.2 27.5
Cash and cash equivalents 28.3 27.5
Gross debt - fixed interest rate
Gross debt variable interest rate (27.1)
Net cash 1.2 27.5
Liabilities from financing activities
Other assets
[USD million] Borrowings Leases
Cash and cash
equivalents Total
Net debt as of 1/1/2019 27.5 27.5
Leasing commitment IFRS 16 implementation (10.0) (10.0)
Additions leases (2.3) (2.3)
Cash flow (20.0) 5.3 1.5 (13.2)
Effects of exchange rate changes (0.6) (0.6)
Net debt as of 31/12/2019 (20.0) (7.1) 28.3 1.2

104 105OTELLO CORPORATION ASA - ANNUAL REPORT 2019 OTELLO CORPORATION ASA - ANNUAL REPORT 2019
Share compensation programOtello currently has two equitybased incentives: ordinary stock options and Restricted Stock Units (“RSU”), as most recently approved at an extraordinary general meeting held April 4, 2017.
Vesting criteria for existing RSUsFor members of the Executive Team, the RSUs are typically linked to achievement of further specified targets related to reported revenue and reported adjusted EBITDA. All RSUs previously granted to members of the Executive Team, have been issued with vesting criteria which are in accordance with the approvals given by the Annual General Meeting held in 2014, the Annual General Meeting in 2015, and/or the Extraordinary General Meeting held in January 2016.
Vesting criteria for existing optionsOptions granted to AdColony employees in accordance with the approval given by the shareholders at the extraordinary general meeting held on April 4, 2017, vest over three years with 1/3 each year.
Options granted to Otello Corporation ASA employees in accordance with the approval given by the shareholders at the extraordinary general meeting held on April 4, 2017, vest over four years with ¼ each year.
Options
Weighted average exercise priceThe number and weighted average exercise price of share options are as follows:
Weighted average exercise price
2019 (NOK)
Number of options
2019 (in thousands)
Weighted average exercise price
2018 (NOK)
Number of options
2018 (in thousands)
Outstanding at the beginning of the period 40.09 2 421 38.22 3 587
Terminated (employee terminations) 38.61 (1 157)
Forfeited during the period
Expired during the period 22.08 (25) 23.98 (9)
Exercised during the period 12.20 (80)
Granted during the period
Outstanding at the end of the period 41.26 2 316 40.09 2 421
Exercisable at the end of the period 40.33 1 291 858
The fair value of services received in return for stock options granted is measured by using the Black & Scholes option pricing model.
The expected volatility is based on historic volatility (calculated using the weighted average remaining life of the share options), adjusted for any expected changes to future volatility based on publicly available information.
Share options are granted under service conditions, not marketbased conditions. Such conditions are not taken into account in the grant date fairvalue measurement. There are no market conditions associated with the share option grants. An annual average attrition rate of 0% is used. This average attrition rate, and the employees’ responsibility for paying the Company’s contributions related to the options, are taken into consideration when estimating the cost of the options in accordance with IFRS 2. Given that employees have the right to exercise their options one or three years after the vesting date (depending on when the options were granted), the estimate is based on an assumption that the employees, on average, are exercising their options 18 months after the vesting date.
No options were granted in 2019 (2018: no options granted).
Note 6Payroll expenses and remuneration to management
Payroll expenses [USD million] 2019 2018
Salaries and bonuses (37.8) (43.4)
Social security cost (2.9) (3.5)
Pension cost (1.1) (1.6)
Stockbased compensation expense, including social security cost (3.8) 0.2
Insurance and other employee benefits (3.7) (4.5)
Payments to longterm contractual staff (5.3) (4.6)
Total (54.7) (57.5)
Average number of full time equivalents 546 548
The Norwegian companies in the Group are obligated to follow the Act on Mandatory company pensions and these companies’ pension schemes follow the requirement as set in the Act.
Compensation to the CEO and Chairman of the BoardThe CEO has waived his rights under Section 1516 of the Norwegian Working Environment Act of 2005 relating to employees’ protection, termination of employment contracts, etc.
As compensation, the CEO is entitled to receive a termination amount of two years’ base salary if the employment contract is terminated by the Company.
As of December 31, 2019, there was no existing severance agreement between Otello and the Chairman of the Board.
The Group has not given any loans or security deposits to the CEO, the Chairman of the Board or their related parties.
A bonus program exists for the senior executive team at Otello. For each individual executive, a limit is set for the amount of bonus that can be achieved. The size of the bonus payment is dependent on actual company performance compared to a set of predefined targets. The bonus program and predefined targets are approved by the Remuneration Committee and the Board of Directors.
An accrual for all 2019 bonuses for senior executives has been recognized in the consolidated financial statements. Bonuses will be paid in 2020.

106 107OTELLO CORPORATION ASA - ANNUAL REPORT 2019 OTELLO CORPORATION ASA - ANNUAL REPORT 2019
The table below shows the date, number and achieved selling price of options exercised.
Date of exerciseNumber of exercised
options (in thousands)Achieved
selling price (NOK)
7/8/2019 25 14.86
12/10/2019 55 16.42
Total 80
No options exercised in 2018.
Restricted stock units
No RSUs were granted to management and employees in 2019 or 2018.
2019 2018
Restricted Stock UnitsShares
(in thousands)Weighted Average
Exercise Price (NOK)Shares
(in thousands)Weighted Average
Exercise Price (NOK)
Outstanding at the beginning of period 15 0.02 355 0.02
Granted
Exercised
Released (15) 0.02 (204) 0.02
Cancelled
Forfeited (86) 0.02
Expired
Adjusted quantity
Performance adjusted (51) 0.02
Outstanding at the end of period 0 15 0.02
Vested RSUs
2019 2018
Shares (in thousands) Value in NOK
Shares (in thousands) Value in NOK
Weighted Average Fair Value of RSUs Granted during the period
Intrinsic value outstanding RSUs at the end of the period 15 195 184
Intrinsic value vested RSUs at the end of the period
There are no unvested RSUs left.The actual 2018 performance level was between 0 and 50 %.
The table below shows the number of options issued to employees at various strike prices and exercise dates.
2019 2019
TOTAL OUTSTANDING OPTIONS VESTED OPTIONS
Exercise price
Outstanding options per 12/31/2019
(in thousands)
Weighted average remaining
lifetime (years)
Weighted average exercise
price (NOK)
Vested options 12/31/2019
(in thousands)
Weighted average exercise
price (NOK)
0.00 10.00
10.00 - 12.30
12.30 - 15.00
15.00 20.00 55 0.63 19.28 55 19.28
20.00 25.00 25 0.43 22.08 25 22.08
25.00 - 30.00
30.00 - 35.00
35.00 - 40.00 538 0.20 38.50 538 38.50
40.00 - 45.00 1 563 2.17 41.61 538 40.04
45.00- 135 1.72 60.75 135 60.75
Total 2 316 1.63 41.26 1 291 40.33
2018 2018
TOTAL OUTSTANDING OPTIONS VESTED OPTIONS
Exercise price
Outstanding options per 12/31/2017
(in thousands)
Weighted average remaining
lifetime (years)
Weighted average exercise
price (NOK)
Vested options 12/31/2017
(in thousands)Weighted average
exercise price (NOK)
0.00 10.00
10.00 - 12.30 80 0.66 11.68 80 11.68
12.30 - 15.00
15.00 20.00 55 1.63 19.28 55 19.28
20.00 25.00 50 0.93 22.08 50 22.08
25.00 - 30.00
30.00 - 35.00
35.00 - 40.00 538 1.20 38.50 538 38.50
40.00 - 45.00 1 563 3.17 41.61
45.00- 135 2.72 60.75 135 60.75
Total 2 421 2.54 40.09 858 37.31
Exercise price = strike price

108 109OTELLO CORPORATION ASA - ANNUAL REPORT 2019 OTELLO CORPORATION ASA - ANNUAL REPORT 2019
Compensation to Executive Management in 2018
[USD million] Rem
un
erat
ion
Sala
ry
Bon
us
Oth
er
com
pen
sati
on
Pen
sion
co
mp
ensa
tion
Ben
efit
exer
cise
d
opti
ons/
RSU
s
Tota
l co
mp
ensa
tion
Executive Manangement
Lars Boilesen, CEO 0.52 0.52 0.04 0.07 0.11 1.26
Petter Lade, CFO 0.20 0.05 0.00 0.25
Roar Olbergsveen, CAO 0.20 0.03 0.00 0.02 0.26
The Board of Directors
Audun Wickstrand Iversen, Chairman 0.08 0.00 0.08
Frode Jacobsen, Board Member 0.04 0.04
Andre Christensen, Board Member 0.04 0.04
Sophie Charlotte Moatti, Board Member 0.04 0.04
Birgit Midtbust, Board Member 0.03 0.03
The Nomination Committee
Nils Foldal, Chairman 0.01 0.01
Jakob Iqbal, Member 0.00 0.00
Kari Stautland, Member 0.00 0.00
Total 0.24 0.93 0.60 0.05 0.09 0.11 2.01
Presented above are the bonuses earned in 2018 and paid in both 2018 and 2019, which are based on the 2018 results.
Compensation to Executive Management in 2019
[USD million] Rem
un
erat
ion
Sala
ry
Bon
us
Oth
er
com
pen
sati
on
Pen
sion
co
mp
ensa
tion
Ben
efit
exer
cise
d
opti
ons/
RSU
s
Tota
l co
mp
ensa
tion
Executive Manangement
Lars Boilesen, CEO 0.55 0.38 0.00 0.07 0.02 1.02
Petter Lade, CFO 0.20 0.09 0.00 0.01 0.01 0.31
The Board of Directors
Audun Wickstrand Iversen, Chairman until June 5 0.04 0.04
Andre Christensen, Board Member until June 5, Chairman from June 5 0.06 0.06
Frode Jacobsen, Board Member 0.04 0.00 0.04
Birgit Midtbust, Board Member 0.03 0.03
Maria Borge Andreassen, Board Member from June 5 0.02 0.02
Anooj Unarket, Board Member from June 5 0.00
Sophie Charlotte Moatti, Board Member until June 5 0.02 0.02
The Nomination Committee
Nils Foldal, Chairman 0.01 0.01
Jakob Iqbal, Member 0.00 0.00
Kari Stautland, Member 0.00 0.00
Total 0.22 0.75 0.47 0.01 0.07 0.03 1.55
Presented above are the bonuses earned in 2019 and paid in both 2019 and 2020, which are based on the 2019 results.
Members of Executive Management are included in the Company’s employee pension scheme, which is a defined contribution plan.
There has been no compensation or other economic benefit provided in 2018 or 2019 to any member of the Executive Team or Board of
Directors from the Company or any business owned by the Company, except that mentioned above. In 2018 and 2019, there has been no significant additional compensation given to directors with regard to special services performed outside of their normal function.

110 111OTELLO CORPORATION ASA - ANNUAL REPORT 2019 OTELLO CORPORATION ASA - ANNUAL REPORT 2019
There are no existing agreements regarding the dispensation of loans or security deposits to key personnel, members of the board or their related parties.
[In thousands of options] Op
enin
g b
alan
ce
Gra
nte
d o
pti
ons
Term
inat
ed o
pti
ons
Exer
cise
d o
pti
ons
Ave
rag
e ex
erci
se
pri
ce —
A (N
OK
)
Clo
sin
g b
alan
ce
Wei
gh
ted
ave
rag
e
exer
cise
pri
ce —
B (N
OK
)
Wei
gh
ted
ave
rag
e
lifet
ime
— C
Intr
insi
c V
alu
e of
ou
tsta
nd
-in
g o
pti
ons
($ m
illio
n)
IFR
S 2
cost
for
the
p
erio
d ($
mill
ion
)
Lars Boilesen, CEO 1 200 1 200 40.87 2.70 0.90 0.36
Petter Lade, CFO 290 290 37.77 2.54 0.77 0.00 0.08
Roar Olbergsveen, CAO 260 260 38.51 2.48 0.69 0.00 0.06
Total 1 750 1 750 0.00 0.50
A — average exercise price for options executed in the financial year
B — average exercise price for the number of options held by the end of the financial year
The table below shows option and RSU grants in 2018 and option and RSU costs in 2018
Granted RSUs
(in thousands of options and RSUs, cost in USD million) Options 2018 Cost Granted 2018 Cost
Executive Manangement
Lars Boilesen, CEO 0.36 (0.24)
Petter Lade, CFO 0.08
Roar Olbergsveen, CAO 0.06
Total 0.50 (0.24)
Options to Executive Management 2018
There are no existing agreements regarding the dispensation of loans or security deposits to key personnel, members of the board or their related parties.
[In thousands of options] Op
enin
g b
alan
ce
Gra
nte
d o
pti
ons
Term
inat
ed o
pti
ons
Exer
cise
d o
pti
ons
Ave
rag
e ex
erci
se
pri
ce —
A (N
OK
)
Clo
sin
g b
alan
ce
Wei
gh
ted
ave
rag
e
exer
cise
pri
ce —
B (N
OK
)
Wei
gh
ted
ave
rag
e lif
etim
e (y
ears
)
Wei
gh
ted
ave
rag
e re
mai
n-
ing
tim
e u
nti
l ves
tin
g
Intr
insi
c V
alu
e of
ou
tsta
nd
-in
g o
pti
ons
(USD
mill
ion
)
IFR
S 2
cost
for
the
per
iod
(U
SD m
illio
n)
Executive Manangement
Lars Boilesen, CEO 1 200 1 200 40.87 1.70 0.35 0.19
Petter Lade, CFO 290 (5) 12.20 285 38.22 1.57 0.31 0.04
Total 1 490 (5) 12.20 1 485 0.23
A — average exercise price for options executed in the financial year
B — average exercise price for the number of options held by the end of the financial year
The table below shows option and RSU grants in 2019 and option and RSU costs in 2019
Granted RSUs
(in thousands of options and RSUs, cost in USD million) Options 2019 Cost Granted 2019 Cost
Executive Manangement
Lars Boilesen, CEO 0.19 (0.22)
Petter Lade, CFO 0.04
Total 0.23 (0.22)
Options to Executive Management 2019

112 113OTELLO CORPORATION ASA - ANNUAL REPORT 2019 OTELLO CORPORATION ASA - ANNUAL REPORT 2019
Shares, options and RSUs owned by other members of Executive Management as of December 31, 2018
[In thousands of shares, options and RSUs]
Name Title Shares Options RSUs Total
Weighted average
strike price - options (NOK)
Petter Lade CFO 62 290 352 37.77
Roar Olbergsveen CAO 0 260 260 38.51
62 550 612
Note 7Other operating expenses
Other operating expenses [USD million] 2019 2018
Hosting expenses, excl. depreciation cost (15.6) (17.1)
Rent and other office expenses (1.7) (7.0)
Marketing expenses (2.6) (6.3)
Audit, legal and other advisory services (5.1) (5.4)
Purchase of equipment, not capitalized (2.7) (4.2)
Travel expenses (3.4) (3.7)
Bad debt expenses 2.9 0.9
Other expenses (4.7) (4.5)
Total (33.0) (47.4)
Auditor remunerationThe following table shows audit fees for the current and prior year. For all categories the reported fee is the recognized expense in other operating expenses for the year to the external auditor, PwC.
Audit fees [USD million] 2019 2018
Statutory audit (0.5) (0.5)
Assurance services (0.0) (0.1)
Taxrelated advice (0.1)
Other services (0.4)
Total (0.6) (0.7)
Shares, options, RSUs owned by members of the Board and the Chief Executive Officer as of December 31, 2019
[In thousands of shares, options and RSUs]
Name Commission Shares Options RSUs Total
Weighted average strike price -
options (NOK)
Weighted average strike price - RSUs (NOK)
Andre Christensen Chairman 24 24
Frode Jacobsen Board Member 21 21
Birgit Midtbust Board Member
Maria Borge Andreassen Board Member 11 11
Anooj Unarket Board Member
Lars Boilesen CEO 258 1 200 1 458 40.87
315 1 200 0 1 515
1) Audun Wickstrand Iversen holds 50,000 shares through Naben AS, 100% owned by Iversen.
Shares, options and RSUs owned by other members of Executive Management as of December 31, 2019
[In thousands of shares, options and RSUs]
Name Title Shares Options RSUs Total
Weighted average
strike price - options (NOK)
Petter Lade CFO 65 285 350 38,22
65 285 350
Shares, options, RSUs owned by members of the Board and the Chief Executive Officer as of December 31, 2018
[In thousands of shares, options and RSUs]
Name Commission Shares Options RSUs Total
Weighted average
strike price - options (NOK)
Weighted average
strike price - RSUs (NOK)
Audun Wickstrand Iversen 1) Chairman
Frode Jacobsen Board Member 10 10
Andre Christensen Board Member
Birgit Midtbust Board Member
Sophie Charlotte Moatti Board Member
Lars Boilesen CEO 252 1 200 15 1 466 40.87 0.02
262 1 200 15 1 477
1) Audun Wickstrand Iversen holds 50,000 shares through Naben AS, 100% owned by Iversen.

114 115OTELLO CORPORATION ASA - ANNUAL REPORT 2019 OTELLO CORPORATION ASA - ANNUAL REPORT 2019
Note 8Taxes
[USD million] 2019 2018
Income tax expense recognized in the statement of comprehensive income:
Current tax (1.3) (6.5)
Changes in deferred taxes (0.9) 27.2
Changes in deferred taxes related to nonrecognition of certain tax assets (7.3)
Changes in deferred tax related to amortization of excess values from business combinations 1.2 3.0
Write down of deferred tax related to write down of intangibles from business combinations 0.0 2.5
Changes in deferred tax related to changes in tax rates 1) (0.2)
Withholding tax expense (1.5) (1.5)
Income tax expense (9.8) (4.0)
Income tax expense discontinued operations (0.1)
1) Primarily the change in the federal tax rate in the US from 35% to 21% as from January 1, 2018
Recognized deferred tax assets and liabilities:Deferred tax balances presented in the statement of financial position comprise the following:
[USD million] 2019 2018
Deferred tax assets related to tax loss carry forwards 25.2 27.8
Deferred tax asset related to merger of entities in Brazil 7.1 14.3
Deferred tax assets related to other temporary differences 2.3 2.2
Deferred tax liabilities related to temporary differences (0.0) (0.1)
Deferred tax liabilities related to amortizable excess value from business combinations in the US 1) (0.1) (0.3)
Deferred tax liabilities related to amortizable excess value from business combinations outside the US 1) (2.3) (3.5)
Net deferred assets (liabilities) 32.2 40.5
1) In the statement of financial position, deferred tax liabilities related to amortizable excess value from business combinations in the US and Brazil are netted against deferred tax assets in the same US and Brazil tax jurisdictions, respectively.
All US entities are included in a US consolidated tax group.
As of December 31, 2019, deferred tax liabilities related to amortizable excess value from business combinations outside the US of $2.2 million (2018: 3.5) are netted against deferred tax assets in the same tax jurisdiction.
Otello recognizes deferred tax assets related to tax losses in the statement of financial position when it is considered probable that taxable profit will be generated in future periods against which these tax loss carry forwards can be utilized. The tax loss carry forwards are in the US and Norway. Regarding tax loss carry forwards in the US, management has assessed forecast taxable profit for the coming years, and concluded that the tax loss carry forward generated in 2019 should not be recognized. However, management considers that sufficient future taxable profits will be generated against which the US tax loss carry forwards for the period up until 2019 can be utilized. Regarding Norway, management considers that sufficient future taxable profits will be generated in future periods against which these tax loss carry forwards can be utilized. See below for a breakdown of tax loss carry forwards and relevant expirations dates of these.
In the tables below, the set off tax (or valuation allowance) is the amount recognized that reduces the tax loss carry forwards in the US for the portion that it is more likely than not to not be utilized in future periods. These amounts relate to the acquired losses from certain business combinations that will most likely not be able to be utilized due to rules limiting the amount of acquired losses a parent company can utilize.
Deferred tax assets (liabilities) and changes during the year
2019 [USD million]Balance
1/1/19
Posted to statement of
comprehensive income
Posteddirectly to the equity
Disposals to discontinued
operationsBalance12/31/19
Property, plant and equipment (2.7) 3.3 0.6
Intangible assets 7.5 (4.4) 3.2
Accounts receivable 0.3 (0.1) 0.2
Payroll tax on share options (3.4) 1.3 (2.1)
Provisions and accruals 0.5 (0.1) 0.4
Other 14.2 (7.1) 7.1
Total related to temporary differences 16.5 (8.4) 1.3 9.4
Deferred tax liabilities related to amortizable excess value from business combinations (3.8) 1.4 (2.4)
Tax loss carry forwards 33.6 4.3 37.9
Set off of tax (valuation allowance) (5.8) 0.3 (5.4)
Tax loss carry forwards not recognized in the statement of financial position (7.3) (7.3)
Tax loss carry forwards recognized in the statement of financial position 27.8 (2.7) 25.2
Net deferred tax assets (liabilities) recognized in the statement of financial position 40.5 (9.6) 1.3 32.2
2018 [USD million]Balance
1/1/18
Posted to statement of
comprehensive income
Posteddirectly to the equity
Disposals to discontinued
operationsBalance12/31/18
Property, plant and equipment (2.5) (0.2) (2.7)
Intangible assets 8.5 (0.9) 7.5
Accounts receivable 0.5 (0.2) 0.3
Payroll tax on share options (4.6) 1.4 (0.2) (3.4)
Provisions and accruals 1.5 (1.1) 0.5
Other 0.8 13.4 14.2
Total related to temporary differences 4.2 12.4 (0.2) 16.4
Deferred tax liabilities related to amortizable excess value from business combinations (10.2) 6.4 (3.8)
Tax loss carry forwards 25.0 8.6 33.6
Set off of tax (valuation allowance) (5.8) (5.8)
Tax loss carry forwards not recognized in the statement of financial position (2.7) 2.7
Tax loss carry forwards recognized in the statement of financial position 16.6 11.3 27.8
Net deferred tax assets (liabilities) recognized in the statement of financial position 10.6 30.1 (0.2) 40.5

116 117OTELLO CORPORATION ASA - ANNUAL REPORT 2019 OTELLO CORPORATION ASA - ANNUAL REPORT 2019
Change in deferred tax asset directly posted against the equity capital [USD million] 2019 2018
Other changes 1.3 (0.2)
Total deferred taxes posted directly against the equity 1.3 (0.2)
The Group’s gross tax loss carry forwards expire as follows:
[USD million] United States Norway Total
2026 0.4 0.4
2027 1.2 1.2
2032 2.1 2.1
2033 5.4 5.4
2034 1.9 1.9
2035 1.3 1.3
2036 11.6 11.6
2037 42.2 42.2
No expiration deadline 54.9 11.6 66.5
Total 121.0 11.6 132.2
Reconciliation of effective tax rate [USD million] 2019 2018
Profit (loss) before tax (12.8) (117.2)
Income tax using the corporate income tax rate in Norway (22% in 2019 /23% in 2018) 2.8 26.9
Effect of changes in tax rates 1) 0.2 (0.2)
Effect of tax rates outside Norway different from 22%/23% (1.4) 2.2
Effect of nontaxable and nondeductible items (4.1) (8.0)
Deferred tax assets from previously unrecognized tax losses 2.9
Effect of nonrecognition of certain deferred tax assets (7.3)
Other effects 0.6
Total tax expense for the year (9.8) 24.5
Effective tax rate 76,8 % 20.9 %
1) Primarily the change in the federal tax rate in the US from 35% to 21% as from January 1, 2018.
Permanent differencesPermanent differences comprise changes in the fair value of contingent considerations, amortization of acquired intangibles assets, impairment losses, sharebased remuneration costs and other nondeductable costs.
Note 10Earnings per share
Note 9Impairment and restructuring expenses
During 2019, Otello recognized restructuring expenses in connection with a strategic cost reduction that will better align costs with revenues, and for legal and other costs related to business combinations and restructuring processes. The restructuring expenses recognised this year relate mainly to new restructuring projects in 2019.
Impairment and restructuring expenses [USD million] 2019 2018
Impairment expense (93.3)
Salary restructuring expense (0.8) (3.3)
Legal and other costs related to business combinations and disposals (1.4) (1.5)
Other restructuring expenses (0.0)
Office restructuring cost (0.1) 0.8
Total (2.3) (97.4)
See note 11 for further information regarding impairment testing.
Earnings per share 2019 2018
Earnings (loss) per share (profit (loss)):
Basic earnings (loss) per share (USD) (0.16) (0.66)
Diluted earnings (loss) per share (USD) (0.16) (0.66)
Shares used in earnings per share calculation 137 689 419 140 088 891
Shares used in earnings per share calculation, fully diluted 137 689 419 140 088 891
Earnings per share is calculated by dividing the profit attributable to equity holders of the Company by the weighted ordinary shares in issue during the period.
In periods with negative net income, the dilutive instruments will have an antidilutive effect when calculating diluted earnings per share. For this reason, there is no difference between earnings per share and diluted earnings per share for these periods.

118 119OTELLO CORPORATION ASA - ANNUAL REPORT 2019 OTELLO CORPORATION ASA - ANNUAL REPORT 2019
Note 11Goodwill and impairment testing
2019
Goodwill [USD million] AdColony Bemobi Total
Acquisition cost
Acquisition cost as of 1/1/19 273.1 50.3 330.2
Acquisitions through business combinations
FX adjustment (1.8) (1.8)
Acquisition cost as of 12/31/19 273.1 48.5 328.4
Accumulated impairment losses
Accumulated impairment losses as of 1/1/19 (91.0) (97.7)
Impairment losses 0.0
FX adjustment 0.0
Accumulated impairment losses as of 12/31/19 (91.0) (97.7)
Carrying amount
As of December 31, 2019 182.2 48.5 230.7
See impairment testing below for further information regarding CGUs.
2018
Goodwill [USD million] AdColony Bemobi Total
Acquisition cost
Acquisition cost as of 1/1/18 276.0 58.8 341.6
Acquisitions through business combinations
FX adjustment (2.9) (8.5) (11.4)
Acquisition cost as of 12/31/18 273.1 50.3 330.2
Accumulated impairment losses
Accumulated impairment losses as of 1/1/18 (15.9) (19.0)
Impairment losses (76.4) (80.0)
FX adjustment 1.2
Accumulated impairment losses as of 12/31/18 (91.0) (97.7)
Carrying amount
As of December 31, 2018 182.2 50.3 232.4
Impairment testing
AdColony Bemobi
Revenue growth (average) 1) 12.0 % 10.0 %
EBITDA Margin growth (average) 2) 3.8 points 0.0 points
Discount rate after tax 8.7 % 16.3 %
Discount rate before tax 11.6 % 24.7 %
Nominal growth rate in terminal value 3.0 % 3.0 %
Otello has carried out impairment testing as of December 31, 2019, according to IAS 36. Based on the impairment testing, the Group has not recognized an impairment loss. Cash-generating unitsGoodwill acquired through business combinations has previously been allocated to individual cashgenerating units. The cashgenerating units are AdColony and Bemobi, and are the same as these segments as presented in note 4.
Recoverable amountThe recoverable amount of assets is the higher of value in use and fair value less cost of disposal. Discounted cash flow models have been applied to determine the value in use for all the cash-generating units. Management has projected cash flows based on financial forecasts and strategy plans covering a three year period. Beyond the explicit forecast period, the cash flows are extrapolated using constant nominal growth rates.
Key assumptionsKey assumptions used in the calculation of value in use are Revenue and EBITDA margin growth rates, Nominal growth rate in terminal value, and discount rates. The following key assumptions were used in determining the value in use:
1) Represents the compound annual growth rate during 20202022 (until the terminal year).2) Represents the average percentage point increase in EBITDA margin during 20202022.
Revenue growth (average)Revenue growth is estimated based on current levels and expected future market development.
EBITDA Margin growth (average)The EBITDA margin represents the operating margin before depreciation and amortization and is estimated based on the current margin level and expected future market development. Committed or implemented operational restructuring initiatives are included.
Discount ratesDiscount rates are based on Weighted Average Cost of Capital (WACC) derived from the Capital Asset Pricing Model (CAPM) methodology. The WACC calculations are based on a GlobalLocal approach, implying that a global riskfree rate is applied as a basis (US 20Y Government bond). The inflation difference between the respective country of the specific CGU and the US is added to reflect the local risk-free rate. Country risk premiums in addition to the US market risk premium are applied to correct for local risk. The discount rates also take into account gearing, the corporate tax rate, and the equity beta.
Growth ratesThe expected growth rates for a cashgenerating unit is derived from the level experienced over the last few years to the longterm growth level in the market the entity operates. The growth rates used to extrapolate cash flow projections beyond the explicit forecast period are based on management’s past experience, and assumptions in terms of expectations for the market development in which the entity operates. The growth rates used to extrapolate cash flows in the terminal year are not higher than the expected long-term growth in the market in which the entity operates.
Sensitivity analysis related to impairment testingFor each CGU, the following changes in forecasts and key assumptions, in isolation, would result in the recoverable amount being approximately equal to the carrying amount. Any changes beyond those described below may, therefore, lead to an impairment loss:
AdColony CGU:Discount rate after tax: 1)
An increase by 20 basis pointsFuture cash flows: 2)
A decrease by 3% in projected future cash flows for the 3 year forecast periodNominal growth rate in terminal value:A decrease by 20 basis points
Bemobi CGU:Discount rate after tax: 1)
An increase by 900 basis pointsFuture cash flows: 2)
A decrease by 40% in projected future cash flows for the 3 year forecast periodNominal growth rate in terminal value:
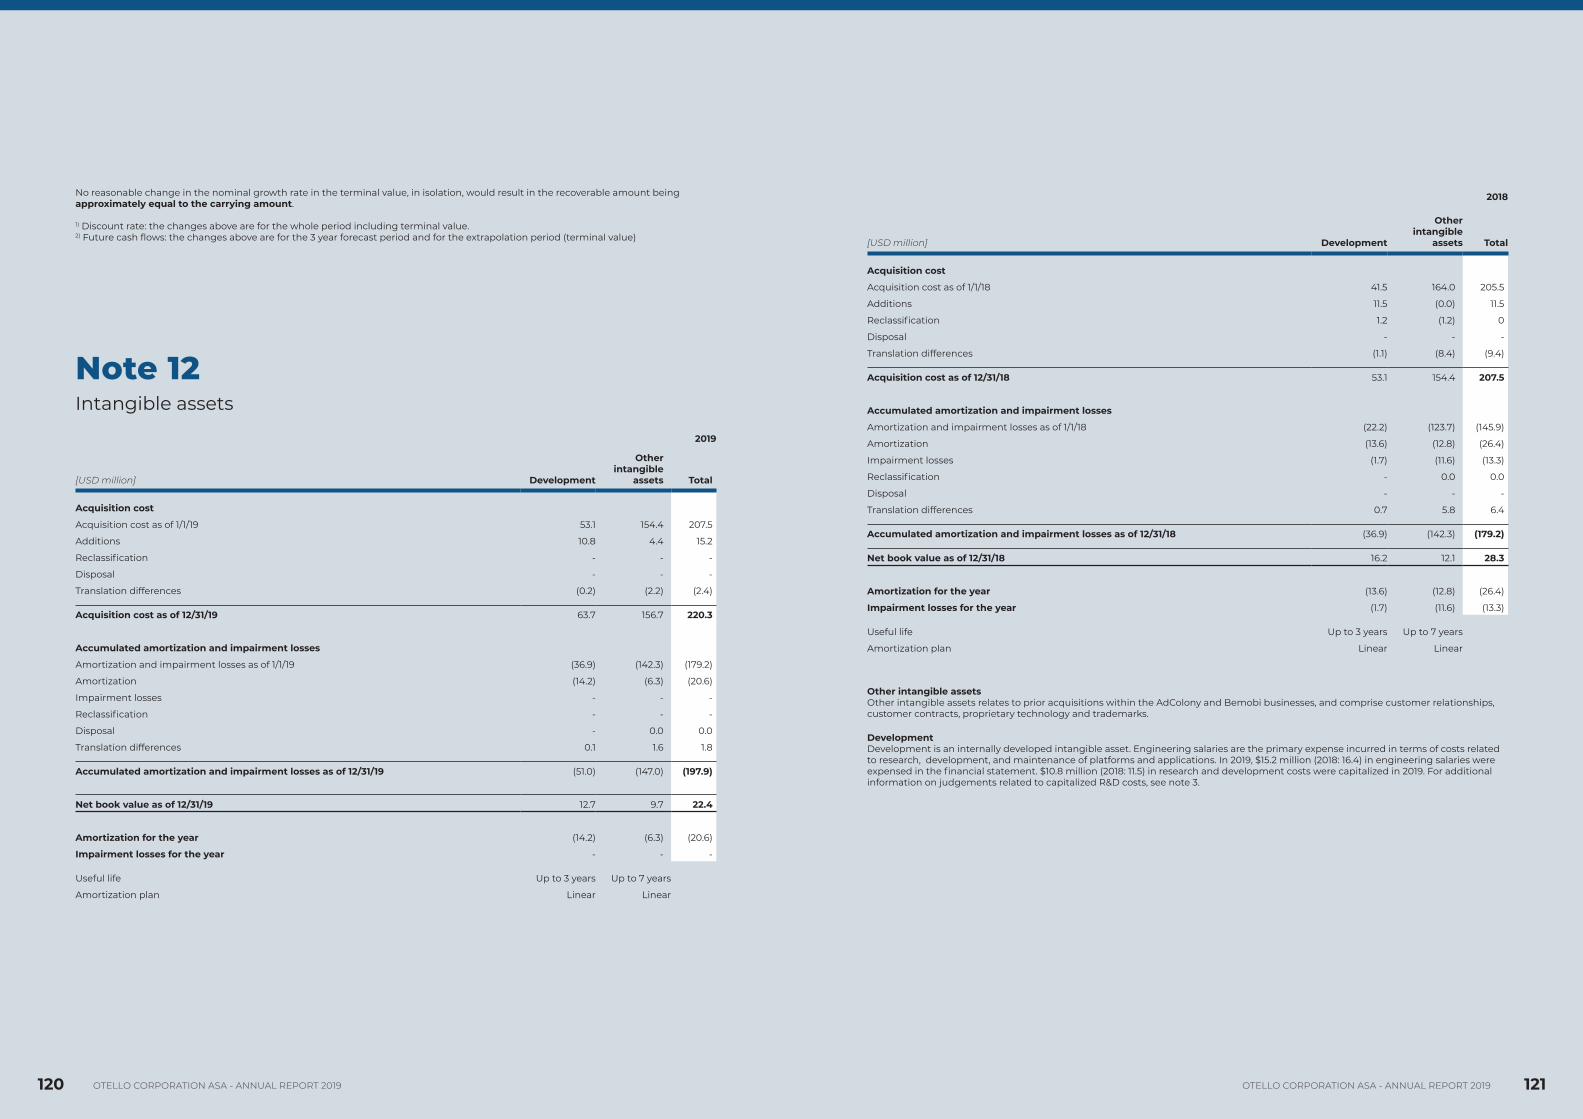
120 121OTELLO CORPORATION ASA - ANNUAL REPORT 2019 OTELLO CORPORATION ASA - ANNUAL REPORT 2019
No reasonable change in the nominal growth rate in the terminal value, in isolation, would result in the recoverable amount being approximately equal to the carrying amount.
1) Discount rate: the changes above are for the whole period including terminal value.2) Future cash flows: the changes above are for the 3 year forecast period and for the extrapolation period (terminal value)
Note 12Intangible assets
2019
[USD million] Development
Other intangible
assets Total
Acquisition cost
Acquisition cost as of 1/1/19 53.1 154.4 207.5
Additions 10.8 4.4 15.2
Reclassification
Disposal
Translation differences (0.2) (2.2) (2.4)
Acquisition cost as of 12/31/19 63.7 156.7 220.3
Accumulated amortization and impairment losses
Amortization and impairment losses as of 1/1/19 (36.9) (142.3) (179.2)
Amortization (14.2) (6.3) (20.6)
Impairment losses
Reclassification
Disposal 0.0 0.0
Translation differences 0.1 1.6 1.8
Accumulated amortization and impairment losses as of 12/31/19 (51.0) (147.0) (197.9)
Net book value as of 12/31/19 12.7 9.7 22.4
Amortization for the year (14.2) (6.3) (20.6)
Impairment losses for the year
Useful life Up to 3 years Up to 7 years
Amortization plan Linear Linear
2018
[USD million] Development
Other intangible
assets Total
Acquisition cost
Acquisition cost as of 1/1/18 41.5 164.0 205.5
Additions 11.5 (0.0) 11.5
Reclassification 1.2 (1.2) 0
Disposal
Translation differences (1.1) (8.4) (9.4)
Acquisition cost as of 12/31/18 53.1 154.4 207.5
Accumulated amortization and impairment losses
Amortization and impairment losses as of 1/1/18 (22.2) (123.7) (145.9)
Amortization (13.6) (12.8) (26.4)
Impairment losses (1.7) (11.6) (13.3)
Reclassification 0.0 0.0
Disposal
Translation differences 0.7 5.8 6.4
Accumulated amortization and impairment losses as of 12/31/18 (36.9) (142.3) (179.2)
Net book value as of 12/31/18 16.2 12.1 28.3
Amortization for the year (13.6) (12.8) (26.4)
Impairment losses for the year (1.7) (11.6) (13.3)
Useful life Up to 3 years Up to 7 years
Amortization plan Linear Linear
Other intangible assetsOther intangible assets relates to prior acquisitions within the AdColony and Bemobi businesses, and comprise customer relationships, customer contracts, proprietary technology and trademarks.
Development Development is an internally developed intangible asset. Engineering salaries are the primary expense incurred in terms of costs related to research, development, and maintenance of platforms and applications. In 2019, $15.2 million (2018: 16.4) in engineering salaries were expensed in the financial statement. $10.8 million (2018: 11.5) in research and development costs were capitalized in 2019. For additional information on judgements related to capitalized R&D costs, see note 3.

122 123OTELLO CORPORATION ASA - ANNUAL REPORT 2019 OTELLO CORPORATION ASA - ANNUAL REPORT 2019
Note 13Property, plant and equipment
2018
Property, plant and equipment [USD million]Fixtures
and fittingsMachinery
and equipmentLeasehold
improvements Total
Acquisition cost
Acquisition cost as of 1/1/18 2.1 20.5 2.1 24.8
Additions 0.1 0.5 0.0 0.6
Reclassification (0.0) (0.0)
Disposal
Translation differences (0.2) (0.5) (0.1) (0.7)
Acquisition cost as of 12/31/18 2.1 20.6 2.1 24.7
Accumulated depreciation and impairment losses
Depreciation and impairment losses as of 1/1/18 (1.1) (11.7) (0.6) (13.3)
Reclassification (0.0) (0.0)
Depreciation and impairment losses (0.3) (3.2) (0.2) (3.8)
Disposal
Translation differences 0.1 0.3 0.0 0.4
Accumulated depreciation and impairment losses as of 12/31/18 (1.3) (14.6) (0.8) (16.7)
Net book value as of 12/31/18 0.8 5.9 1.3 8.0
Depreciation for the year (0.3) (3.2) (0.2) (3.8)
Impairment losses for the year
Useful life Up to 6 years Up to 10 years Up to 5 years
Depreciation plan Linear Linear Linear
2019
Property, plant and equipment [USD million]Fixtures
and fittingsMachinery
and equipmentLeasehold
improvements Total
Acquisition cost
Acquisition cost as of 1/1/19 2.1 20.6 2.1 24.7
Additions 0.5 2.9 0.7 4.1
Reclassification
Disposal (0.0) (0.1) (0.1)
Translation differences (0.1) (0.2) (0.0) (0.3)
Acquisition cost as of 12/31/19 2.5 23.3 2.6 28.5
Accumulated depreciation and impairment losses
Depreciation and impairment losses as of 1/1/19 (1.3) (14.6) (0.8) (16.7)
Reclassification
Depreciation and impairment losses (0.4) (3.2) (0.2) (3.9)
Disposal (0.0) (0.0) (0.0)
Translation differences 0.0 0.0 0.0 0.1
Accumulated depreciation and impairment losses as of 12/31/19 (1.6) (17.8) (1.0) (20.5)
Net book value as of 12/31/19 0.9 5.5 1.6 8.0
Depreciation for the year (0.4) (3.2) (0.2) (3.9)
Impairment losses for the year
Useful life Up to 6 years Up to 10 years Up to 5 years
Depreciation plan Linear Linear Linear

124 125OTELLO CORPORATION ASA - ANNUAL REPORT 2019 OTELLO CORPORATION ASA - ANNUAL REPORT 2019
Note 14Rightofuse assets and lease liabilities
Lease liabilities (USD million) 2019
Balance as of 1/1/2019 10.0
Additions 2.3
Translation differences 0.1
Lease payments (5.6)
Interest expense on lease liabilities 0.3
Lease liabilities as of 12/31/2019 7.1
Of which:
Current lease liabilities (less than 1 year) 4.0
Noncurrent lease liabilities (more than 1 year) 3.0
Balance as of 12/31/2019 7.1
Right of use assets (USD million) 2019
Balance as of 1/1/2019 10.0
Lease receivable as of 1/1/2019 (4.1)
Additions 2.3
Adjustment to Lease receivables (4.1)
Depreciation (5.4)
Adjustment for depreciation related to Lease receivables 1.8
Translation differences
Right of use assets as of 12/31/2019 4.6
Depreciation is charged to the statement of comprehensive income on a straightline basis over the estimated useful life of each leased asset. The estimated useful life is considered to be the term of the contract for each leased asset.
Lease receivables (USD million) 2019
Balance as of 1/1/2019 4.1
Additions
Income from sublease (1.8)
Interest income 0.1
Translation differences
Lease receivables as of 12/31/2019 2.4
Of which:
Current contract assets (less than 1 year) 0.5
Noncurrent contract assets (more than 1 year) 1.9
Balance as of 12/31/2019 2.4
Translation differences arise due to translation of lease contracts in local currencies to USD.
IFRS 16 effects on the consolidated statement of comprehensive income for the year (USD million) 2019
Interest expense (0.3)
Expenses related to shortterm lease (0.6)
Expenses related to lowvalue leases
Income from sublease 1.8
Interest income from sublease 0.1
Depreciation (5.4)
IFRS 16 was implemented for the Group with effect as of January 1, 2019. On transition to IFRS 16, the Group recognized $10.0 million in right of use (ROU) assets and USD 10.0 million in lease liabilities. The ROU assets and lease liabilities comprise office lease contracts. For financial subleasing contracts, the Group has recognized a lease receivable in the statement of financial position, with a corresponding reduction in the ROU asset.
The movements of the Group’s right of use assets, lease receivables and lease liabilities are presented below:
The majority of the lease liabilities relate to office leases of AdColony’s offices in New York, San Francisco and Seattle, and Bemobi’s office lease in Rio de Janeiro.
Further information about the impact of IFRS 16, ‘Leases’, is provided in Note 1.
Future lease paymentsThe future minimum lease payments under noncancellable lease contracts are as follows:
2019 2018
Payments for leased premises:
Less than one year 4.0 5.7
Between one to five years 2.9 5.0
More than five years 0.3
Total 7.2 10.7

126 127OTELLO CORPORATION ASA - ANNUAL REPORT 2019 OTELLO CORPORATION ASA - ANNUAL REPORT 2019
Note 15Other investments
Note 16Contingent considerations
The table below gives a breakdown of the total amount of other investments recognized.
[USD million] 2019 2018
Investments in associated companies 10.1 8.0
Loans to associated companies 5.8 5.5
Investments in other shares 0.9 0.8
Total 16.8 14.4
Investments in associated companiesOtello finalized an agreement on December 19, 2016 to sell its TV business for $80 million. In 2017, Opera TV AS changed its name to Vewd Software AS. As part of the sale agreement, Otello retained an approximately 27% equity interest in Last Lion Holdings Ltd, through preferred shares, which indirectly owns Vewd Software AS through Last Lion Holdco AS.
Information regarding Last Lion Holdings Ltd [USD million] 2019 2018
Revenue 47.1 43.7
EBIT 20.6 17.5
Net profit (loss) 7.7 5.3
Assets 164.4 160.8
Noncurrent liabilities 117.5 119.8
Current liabilities 9.3 11.2
Equity 37.5 29.8
Otello’s share of equity 10.1 8.0
The investment in Last Lion Holdings Ltd is recognized using the equity method.
Carrying value [USD million] 2019 2018
At January 1 8.0 8.6
Investment during the financial year
FX adjustment 0.1 (0.6)
Adjustment from prior year
Share of the profit (loss) 2.1 (0.0)
Elimination
Total at December 31 10.1 8.0
Loans to associated companiesThe Group entered into a loan agreement in 2017 of $5 million with Vewd Software AS (formerly Opera TV AS). This loan is outstanding, with an accrued interest of $0.8 million, as at December 31, 2019.
Investments in other sharesOtello owns 6.5% of the shares in Alliance Venture Spring AS and 0.075% of the shares in Life360, Inc, which merged with Zen Labs, Inc during 2019. Otello owned shares in Zen Labs Inc prior to this merger. The recognised value of the shares is $0.9 million. Management has not determined the fair value of these investments, as they are not material for the Group. Alliance Venture Spring is a Norwegian venture capital firm investing in early stage technology companies. Life 360 provides location-based services, sharing and notifications application to consumers globally, including integrated driving safety features and tools like Crash Detection and Roadside Assistance. Investments in other shares are recognised at cost.
Contingent liability for Bemobi non-controlling shareholdersThe Group acquired the Brazilian subsidiary Bemobi Midia e Entretenimento Ltda in 2015. As part of the acquisition agreement, an earnout agreement was entered into with the former owners. In 2018, this earnout agreement was renegotiated with a partial cash settlement of USD 20 million and 11.2 % shares in the intermediate holding company Bemobi Holding AS. The shares are held in escrow until a major transaction in relation to Bemobi takes place (a qualified sale or an IPO). If such a major transaction does not take place within certain deadlines, the non-controlling shareholders may require Otello to acquire the shares at a fixed amount. The deadline and amount was renegotiated ultimo 2019 and signed on January 10, 2020 and is now set at December 31, 2020 and the fixed amount is USD 18.6 million. Until the renegotiation, the dates were March 31 and/or October 1, and the fixed amount was USD 21.3 million.
As the Group’s judgment is that it controls the process of selling Bemobi within the timeframe, the amount is not recognised as a liability in the statement of financial position, and that it is probable that a major transaction will take place within the deadline. If, during 2020, the circumstances change so that it is no longer probable that a major transaction will take place within the deadline, the liability will be recognized with a corresponding reduction in equity (no effect on the income statement). Upon a potential payment of the contingent consideration, this will be recognized directly in equity as a redemption of noncontrolling interests.
Novitech acquisitionIn 2019, the Group acquired certain assets from a Brazilian company, Novitech, including hardware and software, intellectual property, commercial agreements with major Brazilian and Central American telecommunication carriers, as well as a few selected employees. The acquisition included an earn-out mechanism that is recognized as a liability at fair value in the statement of financial position of USD 0.5 million.
Bemobi acquisitionIn April 2018, the earnout agreement (subsequently renegotiated) with the former owners of Bemobi gave a payment of USD 11.8 million.
Note 17Other current liabilities
[USD million] 2019 2018
Accruals for publisher invoices not yet received 23.5 19.6
Accrued operating expenses 9.2 9.3
Accrued bonuses, commission and other employee benefits 5.6 6.1
Accrued restructuring costs 2.7 4.1
Liabilities to entities in discontinued operations 0.8 0.5
Other current liabilities (0.7) (0.4)
Total 41.6 39.5

128 129OTELLO CORPORATION ASA - ANNUAL REPORT 2019 OTELLO CORPORATION ASA - ANNUAL REPORT 2019
Note 18Shareholders and shareholder information
Note 19Related parties
As of December 31, 2019, Otello had a share capital of NOK 2 809 549.58 (USD 319 502) divided into 140 477 429 ordinary shares with a nominal value of NOK 0.02 each (USD 0.002). All ordinary shares have equal voting rights and the right to receive dividends.
The Company’s Annual General Meeting on June 4, 2019, authorized the Board of Directors of Otello Corporation ASA (the ”Company”) to acquire shares in the Company. The maximum value of the shares which the Company may acquire pursuant to the authorization is a total face value of NOK 280 958. The minimum amount which may be paid for each share acquired pursuant to this power of attorney is NOK 5, and the maximum amount is NOK 200. The shares purchased through the share buyback program may be disposed of to meet obligations under employee incentive schemes, as part of consideration payable for acquisitions made by the Company, as part of consideration for any mergers, demergers or acquisitions involving the Company, to raise funds for specific investments, for paying down loans, or in order to strengthen the Company’s capital base.
The above authorization is valid up to and including June 30, 2020.
During 2019, the Group purchased 943 691 (2018: 2 495 745) treasury shares for $1.6 million (2018: 5.6 million). In 2019 the Group sold 152 691 (2018: 203 745) treasury shares.
As of December 31, 2019, the Group owned 2 545 000 treasury shares (December 31, 2018: 1 754 000).
During 2018 and 2019, no ordinary shares were issued related to incentive programs, business combinations, or equity increases.
DividendsOtello did not pay a dividend in 2018 or 2019.The Board of Directors proposes that the 2019 Annual General Meeting does not approve any dividend payment.
Ownership structureThe 20 largest shareholders of Otello Corporation ASA shares as of December 31, 2019, were as follows:
2019 2019 2018
[In thousands of shares] SharesOwner’s and
voting share %Owner’s and
voting share %
GOLDMAN SACHS INTERNATIONAL 38 568 27.5 % 3.2 %
LUDVIG LORENTZEN AS 12 000 8.5 % 8.5 %
SUNDT AS 7 759 5.5 % 6.3 %
AREPO AS 7 437 5.3 % 5.3 %
VERDIPAPIRFONDET DNB TEKNOLOGI 6 397 4.6 % 4.2 %
VERDIPAPIRFONDET DNB NORGE 5 308 3.8 % 4.4 %
BANK OF NEW YORK MELLON SA/NV 5 293 3.8 % 2.8 %
J.P. MORGAN BANK LUXEMBOURG S.A 4 919 3.5 % 3.7 %
VERDIPAPIRFONDET NORDEA NORGE VERD 4 141 2.9 % 2.9 %
SOCIETE GENERALE 3 200 2.3 % 3.3 %
UBS AG 3 104 2.2 % 0.5 %
CACEIS BANK 2 849 2.0 % 1.8 %
EUROCLEAR BANK S.A./N.V. 2 816 2.0 % 2.9 %
SKANDINAVISKA ENSKILDA BANKEN AB 2 663 1.9 % 1.9 %
OTELLO CORPORATION ASA 2 531 1.8 % 1.2 %
SKANDIA TIME GLOBAL 2 092 1.5 % 1.4 %
VERDIPAPIRFONDET NORDEA KAPITAL 1 936 1.4 % 1.3 %
VERDIPAPIRFONDET NORDEA AVKASTNING 1 231 0.9 % 0.9 %
BONHEUR ASA 1 217 0.9 % 0.9 %
BANK OF NEW YORK MELLON SA/NV 1 205 0.9 % 0.0 %
Sum 116 664 83.0 % 57.5 %
Other shareholders 23 813 17.0 % 42.5 %
Total numbers of shares 140 477 100.0 % 100.0 %
Agreement with Bemobi earnout participantsPlease see note 16 for details of the transaction with the Bemobi earnout participants.
Vewd (Opera TV)The Group, as the creditor, entered into a loan agreement in 2017 of $5 million with Vewd Software AS (formerly Opera TV AS), the debtor. This loan is outstanding as at December 31, 2019. The Group holds a 27% equity interest in Last Lion Holdings Ltd, through preferred shares, which indirectly owns Vewd Software AS through Last Lion Holdco AS.
OtherThe Group has not engaged in any related party transactions with any members of the Board of Directors of Otello Corporation ASA or Otello Group Executive Management.
The Board of Directors and Executive ManagementMembers of the Board of Directors and Executive Management of the Group and their immediate relatives controlled 0.3% (2018: 0.2 %) of the Group’s voting share as per December 31, 2019.
Information regarding compensation for Executive Management and Board of Directors can be found in note 3.Executive Management also participate in the Group’s stock option and RSU program (see note 6).

130 131OTELLO CORPORATION ASA - ANNUAL REPORT 2019 OTELLO CORPORATION ASA - ANNUAL REPORT 2019
Note 20Corporate structure of Otello Group
Note 21Events after the reporting period
Below is a list of group companies in the Otello group as at December 31, 2019:
Entity name Location Country SegmentOwner and
voting share
Otello Corporation ASA Oslo Norway Corporate Listed
Directly owned subsidiaries
AdColony Holding AS Oslo Norway AdColony 100%
Bemobi Holding AS Oslo Norway Bemobi 88.8%
Bemobi Holding PLC London United Kingdom Bemobi 100%
Privacy & Performance Ireland Ltd Dublin Ireland Corporate 100%
Indirectly owned subsidiaries
AdAurora (Beijing) Technologies Co. Ltd (VIE) Beijing China AdColony 100%
AdColony AB Stockholm Sweden AdColony 100%
AdColony ApS Copenhagen Denmark AdColony 100%
AdColony AS Oslo Norway AdColony 100%
AdColony Beijing Co, Ltd. Beijing China AdColony 100%
AdColony Financing Ireland Limited Dublin Ireland AdColony 100%
AdColony GmbH Berlin Germany AdColony 100%
AdColony Holdings Ireland Ltd Dublin Ireland AdColony 100%
AdColony Holdings US, Inc. San Mateo United States AdColony 100%
AdColony India Private Ltd Gurgaon India AdColony 100%
AdColony Ireland Ltd Dublin Ireland AdColony 100%
AdColony Japan LLC Tokyo Japan AdColony 100%
AdColony Korea Ltd Seoul Republic of South Korea AdColony 100%
AdColony Singapore PTE. Ltd Singapore Singapore AdColony 100%
AdColony UK Ltd London United Kingdom AdColony 100%
AdColony, Inc. Los Angeles United States AdColony 100%
Advine Mobile Advertising Network Proprietary Ltd Cape Town South Africa AdColony 100%
Foriades Park SA Montevideo Uruguay AdColony 100%
Hunt Mobile Ads aplicativos para internet Ltda Sao Paulo Brazil AdColony 100%
Hunt Mobile Ads SA de CV Mexico City Mexico AdColony 100%
Huntmads SA Buenos Aires Argentina AdColony 100%
Mobilike Mobil Reklam Pazarlama Ve Ticaret A.S Istanbul Turkey AdColony 100%
Apps and Games Ireland Ltd Dublin Ireland Bemobi 88.8% 1
Apps Club de Argentina SRL Buenos Aires Argentina Bemobi 88.8% 1
Apps Club de Chile SPA Santiago Chile Bemobi 88.8% 1
Apps Club de Colombia S.A.S. Bogotá Colombia Bemobi 88.8% 1
Apps Club del Ecuador S.A Quito Ecuador Bemobi 88.8% 1
Apps Club del Mexico SA de CV Mexico Mexico Bemobi 88.8% 1
Bemobi International AS Oslo Norway Bemobi 88.8% 1
Bemobi Midia e Entretenimento Ltda Rio de Janeiro Brazil Bemobi 88.8% 1
LLC Bemobi Ukraine Odessa Ukraine Bemobi 88.8% 1
Open Markets AS Oslo Norway Bemobi 88.8% 1
Tulari Spain Sociedad Limitada Madrid Spain Bemobi 88.8% 1
Skyfire Labs, Inc. San Mateo United States Corporate 100%
Impact of COVID-19As we enter 2020 the world is grappling with the direct and indirect impacts of the Covid 19 virus. In this challenging situation, the primary focus of Otello has been the health and safety of our employees. Since midMarch, the Group entities have successfully managed to shift the vast majority of the operations to remote home offices. The operational impact is limited to a minimum and all business activities continue to operate as before the crisis. Due to the nature of our business in both AdColony and Bemobi, in terms of not having physical products and being reliant on the use of consumer’s mobile phones, we are in a relatively fortunate position. However, as our revenue is linked to the advertising spend of companies (AdColony) and subscriptions bought by consumers (Bemobi), we expect Covid19 to negatively impact revenue and profit in 2020. At this stage, it is still too early to tell how great this impact will be. Ultimately, this will be dependent on the duration of the crisis and the knockon effect of the changed behavior of our customers.
Credit facility agreementsIn March 2020, Otello signed an amendment to the 3-year Revolving Credit Facility (RCF) agreement of 2018 with DNB Bank ASA, reducing the facility to $50 million. However, as part of this amendment, Otello has secured a payment guarantee of an amount equal to USD 18,561,118 in favour of Pedro Ripper, CEO of Bemobi, (on behalf of the former owners of Bemobi) related to the agreement signed between Bemobi Holding AS, the holding company of Otello’s Bemobi business, and the former owners of Bemobi originally dated 28 May 2018 and amended on 10 January 2020. See note 16 for further information.
Amendment to the Bemobi security holders agreement from 2018On January 10, 2020, Otello signed an amendment to the agreement from 2018, with the former owners of Bemobi. Please see note 11 for further information.
Bemobi RSU award agreementIn 2020, an agreement has been signed between Bemobi Holding AS, the holding company of Otello’s Bemobi business and Bemobi’s CEO regarding a sharebased incentive program. Since this agreement was signed in 2020, Otello has not recognized this in these financial statements.
Otello’s case regarding the potential sale of Vewd minority stakeAs reported to the market on September 14, 2018, Otello was successful in its claim in the High Court of Justice of England and Wales against Moore Frères & Co LLC (“MFC”) and Last Lion Holdings Limited (“Last Lion”), arising from the refusal of the Board of Last Lion, which is controlled by appointees of MFC, to approve the sale of Otello’s remaining ownership stake in Last Lion, being approximately 2728.5% in the Vewd Software business. The judge granted Otello the injunction it sought requiring the Board to approve the buyer.
The buyer did not purchase the shares on the terms of the expired Share Purchase Agreement. Otello has now restored the proceedings in order to pursue alternative remedies, including (1) an order from the Court that MFC be required to buy Otello’s shares (and related Loan Note) at the higher of the current valuation of those shares and the price that the buyer was prepared to pay, and (2) that in the event that MFC is unable to purchase the shares at such price, an order that all shares in Last Lion (or Last Lion’s shares in Last Lion Holdco AS) be sold and Otello be paid the sum found to be due to it out of the proceeds of such sale. A trial to determine the relief to which Otello is entitled was listed to take place in a rolling five day window from March 23, 2020. On March 18, 2020 the Court decided to postpone the trial until the court term commencing in October 2020 because of the impact of the ongoing coronavirus pandemic. The Court has now listed the trial to commence in a rolling five-day window from October 5, 2020. The trial is expected to last for five days plus one day of prereading.
GDPRAs reported in the media, on January 14, 2020, the Norwegian Consumer Council (NCC) filed a complaint to the Norwegian Data Protection Authority (DPA) against Grindr and five other companies, including AdColony, who is a supplier to Grindr. The NCC requests that the DPA investigate certain alleged breaches of the General Data Protection Regulation (GDPR) relating to the processing of personal data about Grindr users received from Grindr through the Grindr app. As of the date of this notification, AdColony has not received any formal notification or complaint from the DPA. AdColony is currently looking into the NCC’s complaint and will provide further information if and when necessary. The Company has not recognized any contingent liabilities in the financial statements related to this matter.
Share capital decreaseReference is made to the resolution by the annual general meeting on June 4, 2019, where a resolution was passed to reduce the share capital of the parent company, Otello Corporation ASA, by cancellation of treasury shares. The share capital reduction has been registered with the Norwegian Register of Business Enterprises in February 2020, and the new registered share capital of the parent company is NOK 2 769 548.58, and the total share count is 138 477 429.
No events have occurred after the reporting date that would require the financial statements to be adjusted.
1) These entities are direct or indirect subsidiaries of Bemobi Holding AS, of which Otello owns 88.8%

132 133OTELLO CORPORATION ASA - ANNUAL REPORT 2019 OTELLO CORPORATION ASA - ANNUAL REPORT 2019
Statement of
Comprehensive IncomeParent Company Financial Statements 2019Otello Corporation ASA
Statement of comprehensive income 133
Statement of financial position 134
Statement of cash flows 136
Statement of changes in equity 138
Note 1: General information and significant accounting policies 140
Note 2: Company activities 140
Note 3: Financial risk and financial instruments 141
Note 4: Payroll expenses and remuneration to management 143
Note 5: Other operating expenses 146
Note 6: Taxes 147
Note 7: Investments in subsidiaries, and other investments 149
Note 8: Receivables, payables and transactions with group companies 151
Note 9: Property, plant & equipment 153
Note 10: Right-of-use assets and lease liabilities 154
Note 11: Contingent considerations 155
Note 12: Related parties 156
Note 13: Events after the reporting period 157
USD million Note 2019 2018
Revenue 2, 8 0.0 0.1
Total operating revenue 0.0 0.1
Cost of goods sold 0.0 (0.0)
Payroll and related expenses, excluding stockbased compensation expenses 4 (3.3) (4.2)
Stockbased compensation expenses 4 (1.7) (0.7)
Depreciation, amortization, and impairment expenses 9, 10 (0.6) (0.7)
Other operating expenses 5 (2.1) (3.0)
Total operating expenses (7.8) (8.6)
Operating profit (loss), excluding impairment and restructuring expenses (7.8) (8.5)
Impairment and restructuring expenses 7 (29.0) (393.3)
Operating profit (loss) (36.8) (401.9)
Interest income 3, 8 4.0 1.1
Interest expenses 3, 8 (1.5) (1.4)
Net financial income (expense) 3 2.2 0.5
Dividends received 8 122.5 20.0
Profit sale of shares (1.0) 2.2
Share of profit (loss) from associated companies 7 2.1 (0.0)
Net financial items 128.2 22.3
Profit (loss) before income taxes 91.5 (379.6)
Income taxes 6 0.2 4.3
Profit (loss) 91.6 (375.2)
Other comprehensive income:
Items that may or will be transferred to profit (loss)
Foreign currency translation differences (6.3) (38.1)
Total comprehensive income (loss) 85.4 (413.4)
Profit (loss) attributable to:
Owners of Otello Corporation ASA 91.6 (375.2)
Noncontrolling interests
Total comprehensive income (loss) attributable to:
Owners of Otello Corporation ASA 85.4 (413.4)
Noncontrolling interests

134 135OTELLO CORPORATION ASA - ANNUAL REPORT 2019 OTELLO CORPORATION ASA - ANNUAL REPORT 2019
Statement of
Financial PositionStatement of
Financial Position
USD million Note 12/31/2019 12/31/2018
Assets
Deferred tax assets 6 2.5 4.3
Property, plant and equipment 9 2.2 2.9
Investments in subsidiaries 7 297.7 307.9
Right of use assets 10 0.3
Contract assets sublease 10
Other investments 7 16.8 14.4
Receivables from group companies 8 124.8 7.5
Total non-current assets 444.2 336.9
Accounts receivable 3 0.0 0.1
Accounts receivable from group companies 8 0.0 0.5
Other receivables 11 0.9 3.4
Other receivables from group companies 8 2.0
Cash and cash equivalents 3 1.2 1.9
Total current assets 4.1 5.8
Total assets 448.3 342.6
USD million Note 12/31/2019 12/31/2018
Shareholders’ equity and liabilities
Equity attributable to owners of the company 418.4 332.8
Noncontrolling interests
Total equity 418.4 332.8
Liabilities
Noncurrent liabilities to group companies 8 5.5
Loans and borrowings 3 20.0
Financial lease liabilities 10 0.2
Total non-current liabilities 25.7
Financial lease liabilities 10 0.1
Accounts payable 1.2 0.5
Accounts payable to group companies 8 0.0 1.4
Other current liabilities to group companies 8 0.0 2.6
Taxes payable 6
Public duties payable 0.3 0.3
Deferred revenue 3 0.2 0.4
Other current liabilities 3 2.4 1.9
Contingent consideration, current 11 0.0 2.7
Total current liabilities 4.2 9.9
Total liabilities 29.9 9.9
Total equity and liabilities 448.3 342.6
Oslo, April 21, 2020
Andre ChristensenChairman
Frode Fleten Jacobsen Birgit Midtbust
Lars BoilesenCEO
Maria Borge Andreassen Anooj Unarket

136 137OTELLO CORPORATION ASA - ANNUAL REPORT 2019 OTELLO CORPORATION ASA - ANNUAL REPORT 2019
Statement of
Cash Flows
USD million Note1/1 - 12/31
20191/1 - 12/31
2018
Cash flow from operating activities
Profit (loss) before taxes 91.5 (379.6)
Income taxes paid 6 (1.0)
Depreciation and amortization expense 9, 10 0.6 0.7
Impairment of assets 7 29.0 393.3
Net (gain) loss from disposals of subsidiaries and other share investments 7 (0.0) (4.4)
Dividends received 8 (122.5) (20.0)
Other net finance items (3.2) 0.5
Changes in inventories, accounts receivable, accounts and other payables 1) 8 (2.2) 0.7
Changes in other operating working capital (1.4) (4.0)
Share of net income (loss) from associated companies 7 (2.1) 0.0
Sharebased remuneration 4 1.7 0.7
Earnout cost and cost for other contingent payments 11 0.0
FX differences related to changes in balance sheet items (1.3) 0.2
Net cash flow from operating activities (9.9) (11.8)
Cash flow from investment activities
Proceeds from sale of shares
Purchases of property, plant and equipment (PP&E) and intangible assets 9 (0.0)
Earnout and settlement of earnout agreement payments 11 (20.1)
Other investments 7 (0.1)
Proceeds from loans received from group companies 7 12.8 13.4
Repayment of loans to group companies (10.1)
Loans given to group companies 7 (12.2) (3.7)
Net cash flow from investment activities (9.6) (10.4)
Cash flow from financing activities
Proceeds from exercise of own shares (incentive program) 0.2 0.0
Purchase of treasury shares (1.6) (5.5)
Proceeds from issuance of shares, net (equity increase) (0.0) (0.1)
Proceeds from loans and borrowings 3 20.0
Net cash flow from financing activities 18.8 (5.6)
Net change in cash and cash equivalents (0.7) (27.8)
Cash and cash equivalents (beginning of period) 1.9 29.2
Effects of exchange rate changes on cash and cash equivalents (0.0) 0.4
Cash and cash equivalents 2) 1.2 1.9
1) This includes changes in intercompany balances. See note 8 for further information.
2) Of which $0.2 million (2018: 0.3 million) is restricted cash as of December 31, 2019.

138 139OTELLO CORPORATION ASA - ANNUAL REPORT 2019 OTELLO CORPORATION ASA - ANNUAL REPORT 2019
Statement of
Changes in EquityStatement of
Changes in Equity
USD million
Number of shares
outstanding (million)
Paid-in capital
Other reserves
Reserve for treasury
sharesTranslation
reserveOther
equityTotal
equity
Balance as of 12/31/2018 138.7 358.2 41.1 (73.2) (163.9) 170.6 332.8
Comprehensive income for the period
Profit for the period 91.6 91.6
Other comprehensive income
Foreign currency translation differences (6.3) (6.3)
Total comprehensive income for the period - - - (6.3) 91.6 85.4
Issue of share capital (0.0) (0.0)
Treasury shares acquired (1.6) (1.6)
Treasury shares sold 0.2 0.2
Sharebased payment transactions 1.7 1.7
Balance as of 12/31/2019 138.7 358.0 42.7 (74.5) (170.2) 263.3 418.4
Face value of the sharesThe face value of the shares is NOK 0.02.
Other reservesOther reserves consist of option and RSU costs recognized according to the equitysettled method.
Reserve for own sharesThe reserve for the Company’s own shares comprises the face value cost and excess value of own shares held by the Company.
Translation reserveThe translation reserve consists of all foreign currency differences arising from the translation of the financial statements of group companies with a functional currency that is not USD.
Other equityOther equity consists of all other transactions, including but not limited to, total recognized income and expense for the current period.
USD million
Number of shares
outstanding (million)
Paid-in capital
Other reserves
Reserve for treasury
sharesTranslation
reserveOther
equityTotal
equity
Balance as of 12/31/2017 141.0 358.3 40.3 (67.6) (125.8) 545.8 751.1
Comprehensive income for the period
Profit for the period (375.2) (375.2)
Other comprehensive income
Foreign currency translation differences (38.1) (38.1)
Total comprehensive income for the period - - - (38.1) (375.2) (413.4)
Issue of share capital (0.1) (0.1)
Treasury shares acquired (2.5) (5.5) (5.5)
Treasury shares sold 0.2 0.0 0.0
Sharebased payment transactions 0.7 0.7
Balance as of 12/31/2018 138.7 358.2 41.1 (73.2) (163.9) 170.6 332.8
Face value of the sharesThe face value of the shares is NOK 0.02.
Other reservesOther reserves consist of option and RSU costs recognized according to the equity settled method.
Reserve for own sharesThe reserve for the Company’s own shares comprises the face value cost and excess value of own shares held by the Company.
Translation reserveThe translation reserve consists of all foreign currency differences arising from the translation of the financial statements of group companies with a functional currency that is not USD.
Other equityOther equity consists of all other transactions, including but not limited to, total recognized income and expense for the current period.

140 141OTELLO CORPORATION ASA - ANNUAL REPORT 2019 OTELLO CORPORATION ASA - ANNUAL REPORT 2019
Note 1General information and significant accounting principles
Note 2Company activities
Note 3Financial risk and financial instruments
General informationThese are the financial statements of Otello Corporation ASA, which is the holding company for the Otello Group and includes the Group Executive Management (chief operating decision-makers) and associated staff functions. See also Note 1 in the Group’s consolidated financial statements.
Statement of complianceThe parent company financial statements have been prepared in accordance with International Financial Reporting Standards (IFRS) as adopted by the EU and accompanying interpretations. The parent company financial statements also include certain disclosures in order to comply with certain regulations and paragraphs in the Norwegian Accounting Act and the Securities Trading Act.
These parent company financial statements have been approved and issued by the Board of Directors on April 21, 2020 for approval by the Annual General Meeting on June 2, 2020.
The explanation of the accounting policies in the Consolidated financial statements also applies to the parent company, and the notes to the consolidated financial statements will in some cases cover the parent company.
Investments in subsidiaries – parent companyFor investments in subsidiaries, associates and jointly controlled entities, the cost method is applied. The cost price is increased when funds are added through capital increases or when group contributions are made to subsidiaries. Dividends received are initially taken as income. Dividends exceeding the portion of retained profit after the acquisition are reflected as a reduction in cost price. Dividend/group contribution from subsidiaries are reflected in the same year as the subsidiary makes a provision for the amount.
Investments in subsidiaries, associates and jointly controlled entities are reviewed for impairment whenever events or changes in circumstances indicate that the carrying amount may exceed the fair value of the investment. An impairment loss is reversed if the impairment situation is deemed to no longer exist.
The Company’s main activities are to serve the Group as a whole, through the following functions and services: CEO/Board of Directors, corporate finance and accounting, legal, HR and IT. The Company charges some of the costs related to these functions to subsidiaries.
The principal activities of the Group’s business areas are described in more detail in Note 4 Operating and segment information in the Group’s consolidated financial statements.
Breakdown of cash deposits by currency 2019 2018
NOK 1.0 1.7
USD 0.1 0.2
EUR 0.0 0.0
Other 0.0 0.0
Total 1.2 1.9
Currency riskThe majority of the financial risk that the Company is exposed to relates to currency risk due to exchange rate fluctuations. The majority of the Company’s operating expenses are in NOK. The lending and borrowing activities of the Company are primarily in USD.
Foreign exchange contracts During 2019 and 2018, the Company did not use forward exchange contracts to hedge its currency risk, and the Company had not entered any foreign exchange contracts as of December 31, 2019.
Liquidity reserve [USD million] 12/31/2019 12/31/2018
Cash and cash equivalents
Cash and cash equivalents 1.2 1.9
of which restricted funds 1) 0.2 0.2
Unrestricted cash 1.0 1.7
Credit Facility [USD million] 12/31/2019 12/31/2018
Longterm cash credit 100.0 100.0
of which utilized 20.0
Shortterm overdraft facility
of which utilized
Liquidity riskThe Company had the following liquidity reserve and credit facility as of December 31.

142 143OTELLO CORPORATION ASA - ANNUAL REPORT 2019 OTELLO CORPORATION ASA - ANNUAL REPORT 2019
Credit facilityIn May 2018, Otello signed an agreement for a new 3 year Revolving Credit Facility (RCF) of $100 million with DNB Bank ASA. As at December 31, 2019, $20 million of the revolving credit facility had been drawn.
The facility is primarily secured through a pledge in shares in Bemobi Holding AS, AdColony Holding AS, and Performance and Privacy Ireland Ltd, as well as charges over accounts receivable in the parent company.
The loan and credit facility have the following covenants: i) the Leverage Ratio to be below 2.00:1. ii) the Equity Ratio to hold the minimum level of 35%. The Group is compliant as of December 31, 2019.
The RCF bears an interest rate of LIBOR, 3 months + a Margin of 2.50 % p.a. There is no utilization fee.On the undrawn portion of the facility, a commitment fee of 35% of the Margin will be paid.
Financial liabilitiesAll financial liabilities other than the credit facility (described above), non-current financial lease liabilities, and the loan from subsidiary Performance & Privacy Ireland Ltd are expected to be paid within 1 year of the balance sheet date.
Capital managementThe Company’s policy has been to maintain a high equitytoasset ratio and to maintain a solid capital base so as to maintain investor, creditor and market confidence and to sustain future development of the business. Otello still possesses a business model that anticipates considerable cash flow in the future.
In 2019 and 2018, the Board of Directors has used its authorization to purchase treasury shares. Please see note 18 in the consolidated financial statements for more information.
Financial instrumentsFinancial instruments, and contracts accounted for as such, are included in several line items in the statement of financial position and classified in categories for accounting treatment. A classification of financial instruments in Otello Corporation ASA is presented below:
[USD million]Amortised
costFair
value
2019
Assets - current
Accounts receivable 0.0 0.0
Receivables from group companies 0.0 0.0
Cash and cash equivalents 1.2 1.2
Liabilities - current
Accounts payable 1.2 1.2
Accounts payable to group companies 0.0 0.0
Other current liabilities to group companies 0.0 0.0
Other current liabilities 0.8 0.8
Contingent consideration, current 0.0 0.0
[USD million]Amortised
costFair
value
2018
Assets - current
Accounts receivable 0.1 0.1
Receivables from group companies 0.5 0.5
Cash and cash equivalents 1.9 1.9
Liabilities - current
Accounts payable 0.5 0.5
Accounts payable to group companies 1.4 1.4
Other current liabilities to group companies 2.6 2.6
Other current liabilities 0.5 0.5
Contingent consideration, current 2.7 2.7
Note 4Payroll expenses and remuneration to management
Payroll expenses [USD million] 2019 2018
Salaries and bonuses (2.6) (3.3)
Social security cost (0.4) (0.5)
Pension cost (0.2) (0.2)
Sharebased remuneration including social security cost (1.7) (0.7)
Insurance and other employee benefits (0.1) (0.1)
Payments to longterm contractual staff (0.1) 0.0
Total (5.1) (4.9)
Average number of employees 14 15
The Company has incorporated the requirements set out by the Mandatory Occupational Pensions Act (“Obligatorisk Tjeneste Pensjon”).
Remuneration to key management personnelInformation about remuneration to key management personnel is given in the accompanying note 6 in the consolidated financial statements.
Sharebased compensationFor details of share-based compensation, see note 6 in the consolidated financial statements.
Options The number and weighted average exercise price of share options are as follows:
Weighted average exercise price 2019 (NOK)
Number of options 2019
(in thousands)
Weighted average exercise price 2018 (NOK)
Number of options 2018
(in thousands)
Outstanding at the beginning of the period 39.45 2 155 37.46 2 155
Terminated (employee terminations)
Forfeited during the period
Expired during the period 22.08 (25)
Exercised during the period 12.20 (80)
Granted during the period
Outstanding at the end of the period 40.74 2 050 39.45 2 155
Exercisable at the end of the period 39.25 1 100 730
No options were granted during 2018 and 2019.

144 145OTELLO CORPORATION ASA - ANNUAL REPORT 2019 OTELLO CORPORATION ASA - ANNUAL REPORT 2019
2019
TOTAL OUTSTANDING OPTIONS VESTED OPTIONS
Exercise price
Outstanding options per 12/31/2019
(in thousands)
Weighted average remaining
lifetime (years)
Weighted average exercise
price (NOK)
Vested options 12/31/2019
(in thousands)
Weighted average exercise
price (NOK)
0.00 10.00
10.00 - 12.30
12.30 - 15.00
15.00 20.00 55 0.63 19.28 55 19.28
20.00 25.00 25 0.43 22.08 25 22.08
25.00 - 30.00
30.00 - 35.00
35.00 - 40.00 475 0.20 38.50 475 38.50
40.00 - 45.00 1 425 2.20 41.66 475 40.04
45.00- 70 1.72 60.75 70 60.75
Total 2 050 1.66 40.74 1Ê100 39.25
2018
TOTAL OUTSTANDING OPTIONS VESTED OPTIONS
Exercise price
Outstanding options per 12/31/2018
(in thousands)
Weighted average remaining
lifetime (years)
Weighted average exercise
price (NOK)
Vested options 12/31/2018
(in thousands)
Weighted average exercise
price (NOK)
0.00 10.00
10.00 - 12.30 80 0.66 11.68 80 11.68
12.30 - 15.00
15.00 20.00 55 1.63 19.28 55 19.28
20.00 25.00 50 0.93 22.08 50 22.08
25.00 - 30.00
30.00 - 35.00
35.00 - 40.00 475 1.20 38.50 475 38.50
40.00 - 45.00 1 425 3.20 41.66
45.00- 70 2.72 60.75 70 60.75
Total 2 155 2.56 39.45 730 35.12
The table below shows the number of options issued to employees at various strike prices and exercise dates.
Exercise price = strike price
The table below shows the date, number and achieved selling price of options exercised.
Date of exerciseNumber of exercised
options (in thousands)Achieved selling
price (NOK)
7/8/2019 25 14.86
12/10/2019 55 16.42
Total 80
No options were exercised in 2018.
2019 2018
Restricted Stock UnitsShares
(in thousands)
Weighted Average Exercise
Price (NOK)Shares
(in thousands)
Weighted Average Exercise
Price (NOK)
Outstanding at the beginning of period 15 0.02 107 0.02
Granted
Exercised
Released (15) 0.02 (46) 0.02
Cancelled
Forfeited 0.02
Expired
Adjusted quantity
Performance adjusted (46) 0.02
Outstanding at the end of period 15 0.02
Vested RSUs 15 0.02
2019 2018
Shares (in thousands)
Value in NOK
Shares (in thousands)
Value in NOK
Weighted Average Fair Value of RSUs Granted during the period
Intrinsic value of outstanding RSUs at the end of the period 15 195 184
Intrinsic value of vested RSUs at the end of the period
There are no unvested RSUs left.
Restricted stock unitsNo RSUs were granted in 2019 or 2018.

146 147OTELLO CORPORATION ASA - ANNUAL REPORT 2019 OTELLO CORPORATION ASA - ANNUAL REPORT 2019
Note 5Other operating expenses
Note 6Taxes
Other expenses [USD million] 2019 2018
Audit, legal and other advisory services (1.6) (1.6)
Purchase of equipment, not capitalized (0.3) (0.5)
Travel expenses (0.1) (0.3)
Rent and other office expenses 0.2 (0.3)
Hosting expenses, excl. depreciation cost 0.0 (0.2)
Other expenses (0.3) (0.2)
Total (2.1) (3.0)
Remuneration to the statutory auditorsThe following table shows audit fees for 2019 and 2018. For all categories the reported fee is the recognized expense in other operating expenses for the year to the external auditor, PwC.
Audit fees [USD million] 2019 2018
Statutory audit (0.3) (0.3)
Assurance services (0.1)
Tax advisory services (0.0)
Other services (0.0)
Total (0.3) (0.4)
[USD million] 2019 2018
Income tax expense recognized in the statement of comprehensive income:
Current tax
Changes in deferred taxes 0.2 4.6
Tax expense related to change in tax rate (0.2)
Total 0.2 4.3
Recognized deferred tax assets and liabilities:
Deferred tax balances presented in the statement of financial position comprise the following:
[USD million] 2019 2018
Deferred tax assets related to tax loss carry forwards 2.3 4.1
Deferred tax assets related to temporary differences 0.2 0.2
Net deferred assets (liabilities) 2.5 4.3
The Company recognizes deferred tax assets related to tax losses in the statement of financial position when it is considered probable that taxable profit will be generated in future periods against which these tax losses carries forwards can be utilized.
Deferred tax assets (liabilities) and changes during the year
2019
[USD million]Balance
1/1/19
Posted to statement ofcomprehensive
income
Posteddirectly to the
equity
Disposalsto discontinued
operationsBalance12/31/19
Accounts receivable (1.0) 0.0 0.0
Provisions and accruals 0.2 0.0 0.2
Total 0.2 0.0 0.2
Temporary differences not recognized in the statement of financial position
Temporary differences recognized in the statement of financial position 0.2 0.0 0.2
Tax loss carry forwards 4.1 (1.8) 2.3
Tax loss carry forwards not recognized in the statement of financial position
Tax loss carry forwards recognized in the statement of financial position 4.1 (1.8) 2.3
Net deferred tax assets (liabilities) recognized in the statement of financial position 4.3 (1.8) 2.5
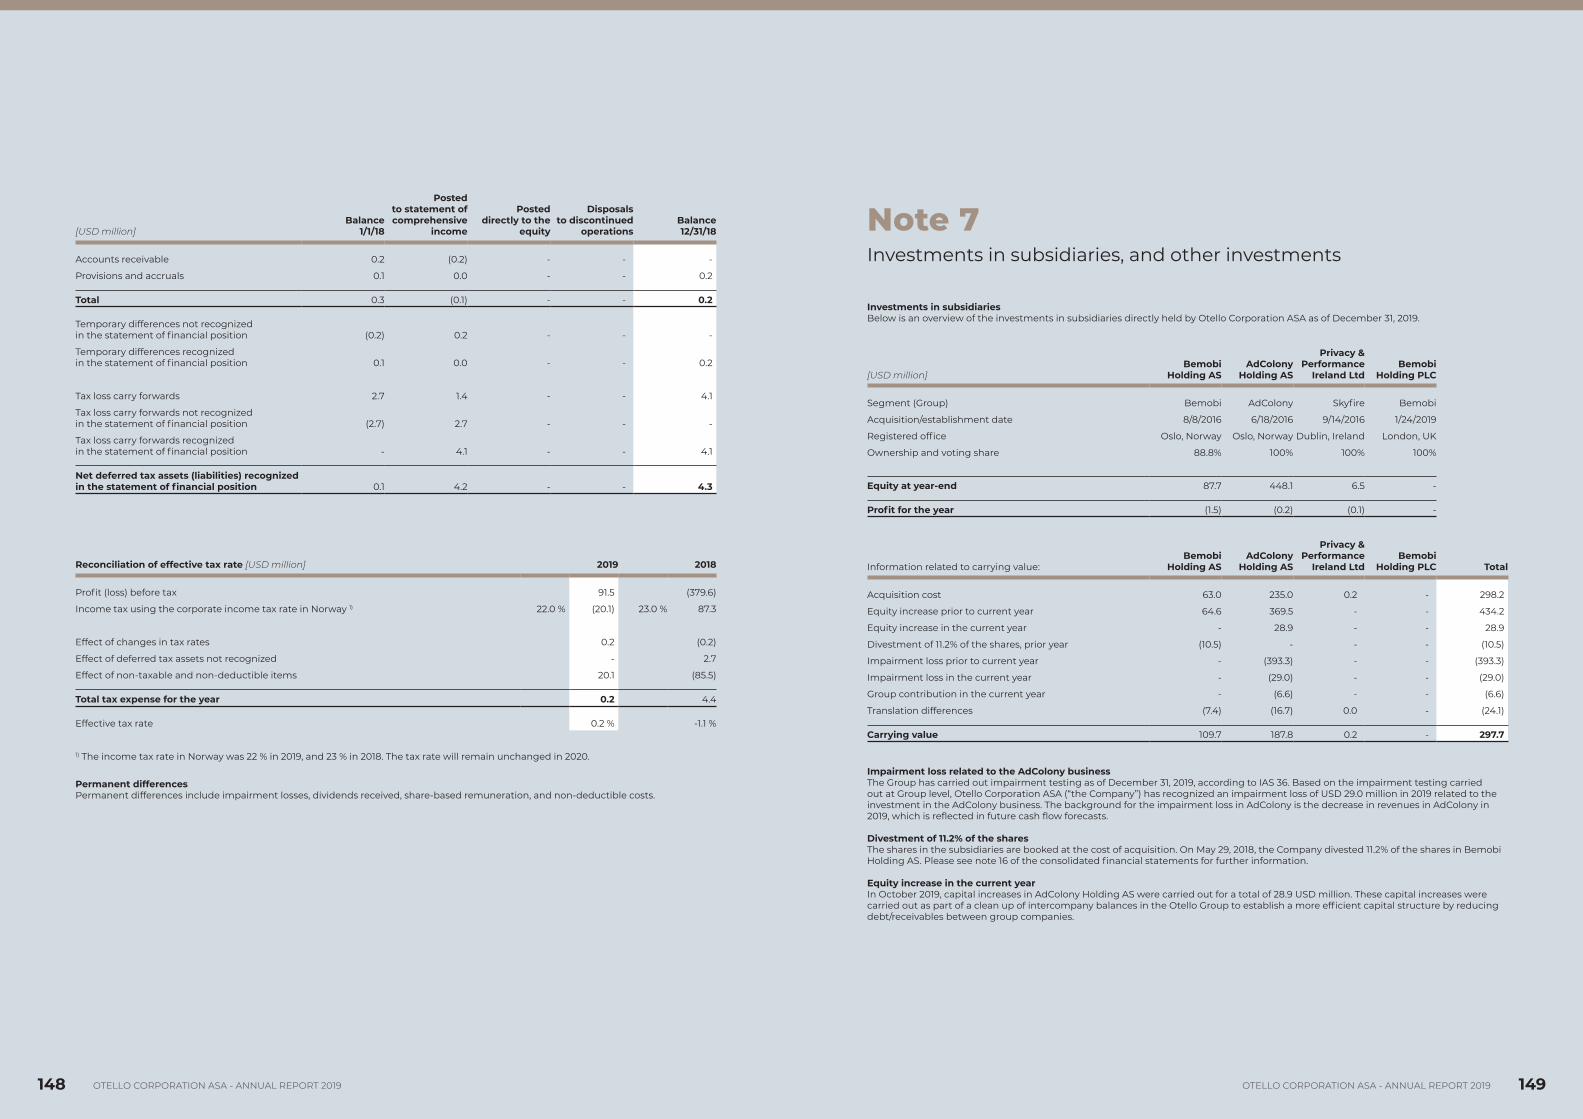
148 149OTELLO CORPORATION ASA - ANNUAL REPORT 2019 OTELLO CORPORATION ASA - ANNUAL REPORT 2019
[USD million]Balance
1/1/18
Posted to statement ofcomprehensive
income
Posteddirectly to the
equity
Disposalsto discontinued
operationsBalance12/31/18
Accounts receivable 0.2 (0.2)
Provisions and accruals 0.1 0.0 0.2
Total 0.3 (0.1) 0.2
Temporary differences not recognized in the statement of financial position (0.2) 0.2
Temporary differences recognized in the statement of financial position 0.1 0.0 0.2
Tax loss carry forwards 2.7 1.4 4.1
Tax loss carry forwards not recognized in the statement of financial position (2.7) 2.7
Tax loss carry forwards recognized in the statement of financial position 4.1 4.1
Net deferred tax assets (liabilities) recognized in the statement of financial position 0.1 4.2 4.3
Reconciliation of effective tax rate [USD million] 2019 2018
Profit (loss) before tax 91.5 (379.6)
Income tax using the corporate income tax rate in Norway 1) 22.0 % (20.1) 23.0 % 87.3
Effect of changes in tax rates 0.2 (0.2)
Effect of deferred tax assets not recognized 2.7
Effect of nontaxable and nondeductible items 20.1 (85.5)
Total tax expense for the year 0.2 4.4
Effective tax rate 0.2 % 1.1 %
1) The income tax rate in Norway was 22 % in 2019, and 23 % in 2018. The tax rate will remain unchanged in 2020.
Permanent differencesPermanent differences include impairment losses, dividends received, sharebased remuneration, and nondeductible costs.
Note 7Investments in subsidiaries, and other investments
Investments in subsidiariesBelow is an overview of the investments in subsidiaries directly held by Otello Corporation ASA as of December 31, 2019.
[USD million]Bemobi
Holding AS AdColony
Holding AS
Privacy & Performance
Ireland LtdBemobi
Holding PLC
Segment (Group) Bemobi AdColony Skyfire Bemobi
Acquisition/establishment date 8/8/2016 6/18/2016 9/14/2016 1/24/2019
Registered office Oslo, Norway Oslo, Norway Dublin, Ireland London, UK
Ownership and voting share 88.8% 100% 100% 100%
Equity at year-end 87.7 448.1 6.5
Profit for the year (1.5) (0.2) (0.1)
Information related to carrying value:Bemobi
Holding AS AdColony
Holding AS
Privacy & Performance
Ireland LtdBemobi
Holding PLC Total
Acquisition cost 63.0 235.0 0.2 298.2
Equity increase prior to current year 64.6 369.5 434.2
Equity increase in the current year 28.9 28.9
Divestment of 11.2% of the shares, prior year (10.5) (10.5)
Impairment loss prior to current year (393.3) (393.3)
Impairment loss in the current year (29.0) (29.0)
Group contribution in the current year (6.6) (6.6)
Translation differences (7.4) (16.7) 0.0 (24.1)
Carrying value 109.7 187.8 0.2 297.7
Impairment loss related to the AdColony businessThe Group has carried out impairment testing as of December 31, 2019, according to IAS 36. Based on the impairment testing carried out at Group level, Otello Corporation ASA (“the Company”) has recognized an impairment loss of USD 29.0 million in 2019 related to the investment in the AdColony business. The background for the impairment loss in AdColony is the decrease in revenues in AdColony in 2019, which is reflected in future cash flow forecasts.
Divestment of 11.2% of the shares The shares in the subsidiaries are booked at the cost of acquisition. On May 29, 2018, the Company divested 11.2% of the shares in Bemobi Holding AS. Please see note 16 of the consolidated financial statements for further information.
Equity increase in the current yearIn October 2019, capital increases in AdColony Holding AS were carried out for a total of 28.9 USD million. These capital increases were carried out as part of a clean up of intercompany balances in the Otello Group to establish a more efficient capital structure by reducing debt/receivables between group companies.

150 151OTELLO CORPORATION ASA - ANNUAL REPORT 2019 OTELLO CORPORATION ASA - ANNUAL REPORT 2019
Shares in subsidiaries
Below is a list of shares in subsidiaries owned by other group companies, and indirectly by the Company, as at December 31, 2019:
Entity name Location Segment CountryOwner and
voting share
AdAurora (Beijing) Technologies Co. Ltd (VIE) Beijing AdColony China 100%
AdColony AB Stockholm AdColony Sweden 100%
AdColony ApS Copenhagen AdColony Denmark 100%
AdColony AS Oslo AdColony Norway 100%
AdColony Beijing Co, Ltd. Beijing AdColony China 100%
AdColony Financing Ireland Limited Dublin AdColony Ireland 100%
AdColony GmbH Berlin AdColony Germany 100%
AdColony Holdings Ireland Ltd Dublin AdColony Ireland 100%
AdColony Holdings US, Inc. San Mateo AdColony United States 100%
AdColony India Private Ltd Gurgaon AdColony India 100%
AdColony Ireland Ltd Dublin AdColony Ireland 100%
AdColony Japan LLC Tokyo AdColony Japan 100%
AdColony Korea Ltd Seoul AdColony Republic of South Korea 100%
AdColony Singapore PTE. Ltd Singapore AdColony Singapore 100%
AdColony UK Ltd London AdColony United Kingdom 100%
AdColony, Inc. Los Angeles AdColony United States 100%
Advine Mobile Advertising Network Prorietary Ltd Cape Town AdColony South Africa 100%
Foriades Park SA Montevideo AdColony Uruguay 100%
Hunt Mobile Ads aplicativos para internet Ltda Sao Paulo AdColony Brazil 100%
Hunt Mobile Ads SA de CV Mexico City AdColony Mexico 100%
Huntmads SA Buenos Aires AdColony Argentina 100%
Mobilike Mobil Reklam Pazarlama Ve Ticaret A.S Istanbul AdColony Turkey 100%
Apps and Games Ireland Ltd Dublin Bemobi Ireland 88.8% 1
Apps Club de Argentina SRL Buenos Aires Bemobi Argentina 88.8% 1
Apps Club de Chile SPA Santiago Bemobi Chile 88.8% 1
Apps Club de Colombia S.A.S. Bogotá Bemobi Colombia 88.8% 1
Apps Club del Ecuador S.A Quito Bemobi Ecuador 88.8% 1
Apps Club del Mexico SA de CV Mexico Bemobi Mexico 88.8% 1
Bemobi International AS Oslo Bemobi Norway 88.8% 1
Bemobi Midia e Entretenimento Ltda Rio de Janeiro Bemobi Brazil 88.8% 1
LLC Bemobi Ukraine Odessa Bemobi Ukraine 88.8% 1
Open Markets AS Oslo Bemobi Norway 88.8% 1
Tulari Spain Sociedad Limitada Madrid Bemobi Spain 88.8% 1
Skyfire Labs, Inc. San Mateo Corporate United States 100%
Other investments The table below gives a breakdown of the total amount of other investments recognized.
[USD million] 2019 2018
Investments in associated companies 10.1 8.0
Loans to associated companies 5.8 5.5
Investments in other shares 0.9 0.8
Total 16.8 14.4
Please see note 15 in the Consolidated financial statements for further information regarding other investements.
Note 8Receivables, payables and transactions with group companies
Other receivables (noncurrent)
Accounts receivable Other receivables (current)
2019 2018 2019 2018 2019 2018
124.8 7.5 0.0 0.5 2.0
Liabilities (noncurrent)
Accounts payable Other liabilities (current)
2019 2018 2019 2018 2019 2018
0.0 1.4 5.5 2.6
Receivables and payablesThe table below presents a breakdown of receivables and payables with group companies. [USD million]
All outstanding balances with the related parties are priced on an arm’s-length basis and are to be settled in cash within five years of the reporting date. None of the balances are secured. The balances outstanding are specified as follows:
1) These entities are direct or indirect subsidiaries of Bemobi Holding AS, of which Otello owns 88.8%

152 153OTELLO CORPORATION ASA - ANNUAL REPORT 2019 OTELLO CORPORATION ASA - ANNUAL REPORT 2019
2019
Receivables from group companies [USD million] Payables to group companies [USD million]
AdColony Inc (USA) 125.4 Performance and Privacy Ireland Limited 5.5
Bemobi Holding AS 1.1 Other entities 0.0
Bemobi International AS 0.2
Other entities 0.1
Total receivables 126.8 Total payables 5.5
2018
Receivables from group companies [USD million] Payables to group companies [USD million]
AdColony Ireland Ltd 7.5 Bemobi Midia E Entretenimento Ltda (Brazil) 2.0
AdColony Inc (USA) 0.4 Performance and Privacy Ireland Limited 1.6
Other entities 0.1 AdColony Inc (USA) 0.3
Other entities 0.1
Total receivables 7.9 Total payables 4.0
Breakdown of intercompany receivables by currency: [USD million] 2019 2018
USD 125.4 7.8
NOK 0.9 0.1
GBP 0.4
Total 126.8 7.9
For the largest intercompany receivables described in detail above, an interest rate of 3 month LIBOR + 130 basis points is charged.
Breakdown of intercompany payables by currency: [USD million] 2019 2018
USD 5.5 1.6
NOK 0.0
BRL 2.0
EUR 0.2
GBP 0.2
Total 5.5 4.0
Transactions with group companies
Transactions [USD million] 2019 2018
Intercompany revenue 0.0 0.0
Intercompany costs of goods sold (0.0) (0.2)
Interest income from related parties 3.7 0.5
Interest expense to related parties (0.3) (0.3)
Loan agreement and dividend paymentDuring 2019, as part of a restructuring of intercompany balances within the AdColony business, the Company acquired from its subsidiary AdColony Holding AS a loan note of USD 122.5 million that AdColony Holding AS held as the creditor against AdColony Inc, the debtor. As at December 31, 2019, the outstanding balance of this loan note including accrued interest was USD 124.8 million. The loan was acquired in the form of a dividend contribution from AdColony Holding AS. This loan note originates from 2017 when AdColony Holding AS, as part of restructuring in the AdColony business, acquired AdColony Financing Ireland Ltd’s receivable against Opera Mediaworks LLC (merged into AdColony Inc during 2018) with the amount of USD 136 848 627. A net principal repayment of USD 15 996 978 was received during 2018.
Note 9Property, plant & equipment
2019
[USD million]Machinery
and equipment Total
Acquisition cost
Acquisition cost as of 1/1/19 5.6 5.6
Acquisitions 0.0
Currency differences (0.0) (0.0)
Acquisition cost as of 12/31/19 5.5 5.5
Depreciation and impairment losses
Acquisition cost as of 1/1/19 (2.7) (2.7)
Depreciation for the year (0.6) (0.6)
Currency differences 0.0 0.0
Accumulated depreciation as of 12/31/19 (3.3) (3.3)
Net book value as of 12/31/19 2.2 2.2
2018
[USD million]Machinery
and equipment Total
Acquisition cost
Acquisition cost as of 1/1/18 5.9 5.9
Acquisitions 0.0 0.0
Currency differences (0.3) (0.3)
Acquisition cost as of 12/31/18 5.6 5.6
Depreciation and impairment losses
Acquisition cost as of 1/1/18 (2.2) (2.2)
Depreciation for the year (0.7) (0.7)
Currency differences 0.2 0.2
Accumulated depreciation as of 12/31/18 (2.7) (2.7)
Net book value as of 12/31/18 2.9 2.9
Useful life Up to 10 years
Depreciation plan Linear
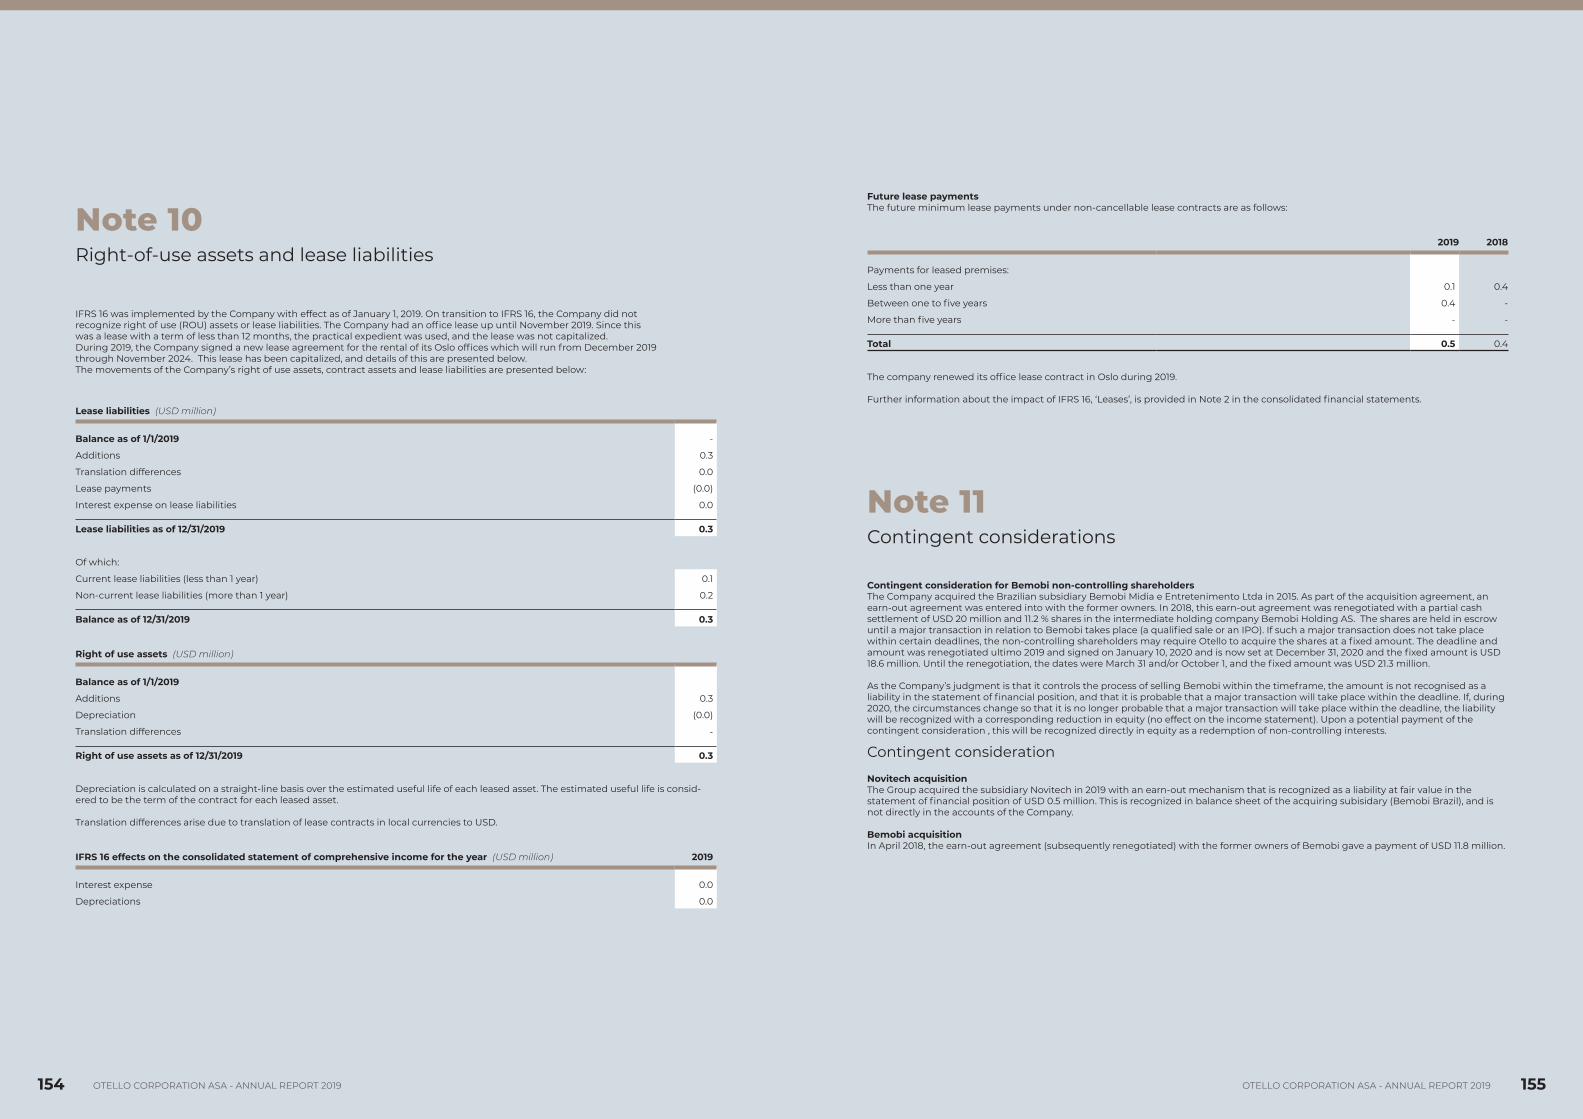
154 155OTELLO CORPORATION ASA - ANNUAL REPORT 2019 OTELLO CORPORATION ASA - ANNUAL REPORT 2019
Note 10Rightofuse assets and lease liabilities
Lease liabilities (USD million)
Balance as of 1/1/2019
Additions 0.3
Translation differences 0.0
Lease payments (0.0)
Interest expense on lease liabilities 0.0
Lease liabilities as of 12/31/2019 0.3
Of which:
Current lease liabilities (less than 1 year) 0.1
Noncurrent lease liabilities (more than 1 year) 0.2
Balance as of 12/31/2019 0.3
Right of use assets (USD million)
Balance as of 1/1/2019
Additions 0.3
Depreciation (0.0)
Translation differences
Right of use assets as of 12/31/2019 0.3
Depreciation is calculated on a straightline basis over the estimated useful life of each leased asset. The estimated useful life is considered to be the term of the contract for each leased asset.
Translation differences arise due to translation of lease contracts in local currencies to USD.
IFRS 16 effects on the consolidated statement of comprehensive income for the year (USD million) 2019
Interest expense 0.0
Depreciations 0.0
IFRS 16 was implemented by the Company with effect as of January 1, 2019. On transition to IFRS 16, the Company did not recognize right of use (ROU) assets or lease liabilities. The Company had an office lease up until November 2019. Since this was a lease with a term of less than 12 months, the practical expedient was used, and the lease was not capitalized. During 2019, the Company signed a new lease agreement for the rental of its Oslo offices which will run from December 2019 through November 2024. This lease has been capitalized, and details of this are presented below.The movements of the Company’s right of use assets, contract assets and lease liabilities are presented below:
Note 11Contingent considerations
Contingent consideration for Bemobi non-controlling shareholdersThe Company acquired the Brazilian subsidiary Bemobi Midia e Entretenimento Ltda in 2015. As part of the acquisition agreement, an earnout agreement was entered into with the former owners. In 2018, this earnout agreement was renegotiated with a partial cash settlement of USD 20 million and 11.2 % shares in the intermediate holding company Bemobi Holding AS. The shares are held in escrow until a major transaction in relation to Bemobi takes place (a qualified sale or an IPO). If such a major transaction does not take place within certain deadlines, the non-controlling shareholders may require Otello to acquire the shares at a fixed amount. The deadline and amount was renegotiated ultimo 2019 and signed on January 10, 2020 and is now set at December 31, 2020 and the fixed amount is USD 18.6 million. Until the renegotiation, the dates were March 31 and/or October 1, and the fixed amount was USD 21.3 million.
As the Company’s judgment is that it controls the process of selling Bemobi within the timeframe, the amount is not recognised as a liability in the statement of financial position, and that it is probable that a major transaction will take place within the deadline. If, during 2020, the circumstances change so that it is no longer probable that a major transaction will take place within the deadline, the liability will be recognized with a corresponding reduction in equity (no effect on the income statement). Upon a potential payment of the contingent consideration , this will be recognized directly in equity as a redemption of noncontrolling interests.
Contingent consideration
Novitech acquisitionThe Group acquired the subsidiary Novitech in 2019 with an earnout mechanism that is recognized as a liability at fair value in the statement of financial position of USD 0.5 million. This is recognized in balance sheet of the acquiring subisidary (Bemobi Brazil), and is not directly in the accounts of the Company.
Bemobi acquisitionIn April 2018, the earnout agreement (subsequently renegotiated) with the former owners of Bemobi gave a payment of USD 11.8 million.
Future lease paymentsThe future minimum lease payments under noncancellable lease contracts are as follows:
2019 2018
Payments for leased premises:
Less than one year 0.1 0.4
Between one to five years 0.4
More than five years
Total 0.5 0.4
The company renewed its office lease contract in Oslo during 2019.
Further information about the impact of IFRS 16, ‘Leases’, is provided in Note 2 in the consolidated financial statements.
156 157OTELLO CORPORATION ASA - ANNUAL REPORT 2019 OTELLO CORPORATION ASA - ANNUAL REPORT 2019
Note 13Events after the reporting period
Please see Note 21 in the Consolidated Financial Statements for information concerning events after the balance sheet date.
Note 12Related parties
Agreement with Bemobi earnout participantsPlease see note 11 for details of the transaction with the Bemobi earnout participants.
Vewd (Opera TV)The Company, as the creditor, entered into a loan agreement in 2017 of $5 million with Vewd Software AS (formerly Opera TV AS), the debtor. This loan is outstanding as at December 31, 2019. The Company holds a 27% equity interest in Last Lion Holdings Ltd, through preferred shares, which indirectly owns Vewd Software AS through Last Lion Holdco AS.
OtherApart from the above transactions, and for transactions with group companies in the normal course of business, the Company did not engage in any related party transactions, including with any members of the Board of Directors or Executive Management.
See note 8 for information regarding transactions with group companies.
The Company has not engaged in any related party transactions with any members of the Board of Directors of Otello Corporation ASA or Otello Group executive management.
Members of the Board of Directors and Executive Management of the Company and their immediate relatives controlled 0.3% (2018: 0.2 %) of the Company’s voting share as per December 31, 2019.
Compensation for Executive Management and Board of Directors can be found in note 6 of the consolidated financial statements. Executive Management also participate in the Group’s stock option and RSU program (see note 6 of the consolidated financial statements).

158 159OTELLO CORPORATION ASA - ANNUAL REPORT 2019 OTELLO CORPORATION ASA - ANNUAL REPORT 2019
PricewaterhouseCoopers AS, Dronning Eufemias gate 71, Postboks 748 Sentrum, NO-0106 Oslo T: 02316, org. no.: 987 009 713 VAT, www.pwc.no State authorised public accountants, members of The Norwegian Institute of Public Accountants, and authorised accounting firm
To the General Meeting of Otello Corporation ASA
Independent Auditor’s Report
Report on the Audit of the Financial Statements
Opinion
We have audited the financial statements of Otello Corporation ASA, which comprise:
• The financial statements of the parent company Otello Corporation ASA (the Company), which comprise the financial position as at 31 December 2019, the statements of comprehensive income, changes in equity and cash flows for the year then ended, and notes to the financial statements, including a summary of significant accounting policies, and
• The consolidated financial statements of Otello Corporation ASA and its subsidiaries (the Group), which comprise the consolidated statements of financial position as at 31 December 2019, comprehensive income, changes in equity and cash flows for the year then ended, and notes to the financial statements, including a summary of significant accounting policies.
In our opinion:
• The financial statements are prepared in accordance with the law and regulations.
• The accompanying financial statements give a true and fair view of the financial position of the Company as at 31 December 2019, and its financial performance and its cash flows for the year then ended in accordance with International Financial Reporting Standards as adopted by the EU.
• The accompanying consolidated financial statements give a true and fair view of the financial position of the Group as at 31 December 2019, and its financial performance and its cash flows for the year then ended in accordance with International Financial Reporting Standards as adopted by the EU.
Basis for Opinion
We conducted our audit in accordance with laws, regulations, and auditing standards and practices generally accepted in Norway, including International Standards on Auditing (ISAs). Our responsibilities under those standards are further described in the Auditor’s Responsibilities for the Audit of the Financial Statements section of our report. We are independent of the Company and the Group as required by laws and regulations, and we have fulfilled our other ethical responsibilities in accordance with these requirements. We believe that the audit evidence we have obtained is sufficient and appropriate to provide a basis for our opinion.
Key Audit Matters
Key audit matters are those matters that, in our professional judgment, were of most significance in our audit of the financial statements of the current period. These matters were addressed in the context of our audit of the financial statements as a whole, and in forming our opinion thereon, and we do not provide a separate opinion on these matters.
The Groups business activities are largely unchanged compared to last year. Valuation of goodwill and Intangible Assets remain a Key Audit Matter as they contain approximately the same complexity and risks as previous year.
Independent Auditor's Report - Otello Corporation ASA
(2)
Key Audit Matter How our audit addressed the Key Audit Matter
Valuation of Goodwill and Intangible assets
At the balance sheet date, the book value of goodwill and intangible assets were USD million 231 and 22 respectively distributed between two different cash generating units (CGU’s). The values involved are significant and constitute a major part of total assets in the balance sheet. No impairment charge was recognized for 2019.
The group operates within business sectors that experience rapid technological change and market disruptions; mobile advertising and apps & games.
We focused on the valuation of goodwill and intangible assets allocated to the mobile advertising business because valuation to a large extent depends on management judgement. The earnings in this part of the business is volatile and demanding to assess. The values involved were significant and even incremental changes to the assumptions and timing of cash flows in the estimate involved management judgement could lead to material changes in value.
See further information about management’s assessment in note 11 and 12 to the financial statements.
We evaluated the appropriateness of management’s allocation of goodwill and intangible assets to CGU’s and the Group’s controls over the impairment assessment.
Our procedures directed at challenging management’s impairment assessment included discussing and considering the suitability of the impairment model and the reasonableness of the assumptions as well as testing of the mathematical accuracy of the model.
We assessed the reliability of management’s cash flow forecasts through a comparison of actual performance in previous years to previous year’s forecasts. We obtained explanations from management to material deviations.
We compared estimates on future cash flows to long-term plans approved by the Board of Directors. Further, we challenged management’s expectations on future growth by comparing these expectations with historic results for the two CGU’s. We also compared the growth assumptions with relevant external sources such as PwC’s Global Entertainment & Media Outlook for growth within mobile advertising in the US.
We assessed the discount rate by comparing the key components used with external market data where possible. We considered that the discount rates were within an appropriate range. We considered the appropriateness of the related disclosures, including the sensitivities provided for the discount rate and growth expectations.
Based on our testing and considerations, we were able to conclude that management’s assumptions were reasonable. We evaluated the appropriateness of the related disclosures and satisfied ourselves that the disclosures appropriately explained the valuation.
Other information
Management is responsible for the other information. The other information comprises information in the annual report, except the financial statements and our auditor's report thereon.
Our opinion on the financial statements does not cover the other information and we do not express any form of assurance conclusion thereon.

160 161OTELLO CORPORATION ASA - ANNUAL REPORT 2019 OTELLO CORPORATION ASA - ANNUAL REPORT 2019
Independent Auditor's Report - Otello Corporation ASA
(3)
In connection with our audit of the financial statements, our responsibility is to read the other information and, in doing so, consider whether the other information is materially inconsistent with the financial statements or our knowledge obtained in the audit or otherwise appears to be materially misstated.
If, based on the work we have performed, we conclude that there is a material misstatement of this other information, we are required to report that fact. We have nothing to report in this regard.
Responsibilities of the Board of Directors and the Managing Director for the Financial Statements
The Board of Directors and the Managing Director (Management) are responsible for the preparation in accordance with law and regulations, including fair presentation of the financial statements in accordance with International Financial Reporting Standards as adopted by the EU, and for such internal control as management determines is necessary to enable the preparation of financial statements that are free from material misstatement, whether due to fraud or error.
In preparing the financial statements, management is responsible for assessing the Company’s and the Group’s ability to continue as a going concern, disclosing, as applicable, matters related to going concern and using the going concern basis of accounting unless management either intends to liquidate the Group or to cease operations, or has no realistic alternative but to do so.
Auditor’s Responsibilities for the Audit of the Financial Statements
Our objectives are to obtain reasonable assurance about whether the financial statements as a whole are free from material misstatement, whether due to fraud or error, and to issue an auditor’s report that includes our opinion. Reasonable assurance is a high level of assurance, but is not a guarantee that an audit conducted in accordance with laws, regulations, and auditing standards and practices generally accepted in Norway, including ISAs will always detect a material misstatement when it exists. Misstatements can arise from fraud or error and are considered material if, individually or in aggregate, they could reasonably be expected to influence the economic decisions of users taken on the basis of these financial statements.
As part of an audit in accordance with laws, regulations, and auditing standards and practices generally accepted in Norway, including ISAs, we exercise professional judgment and maintain professional scepticism throughout the audit. We also:
• identify and assess the risks of material misstatement of the financial statements, whether due to fraud or error. We design and perform audit procedures responsive to those risks, and obtain audit evidence that is sufficient and appropriate to provide a basis for our opinion. The risk of not detecting a material misstatement resulting from fraud is higher than for one resulting from error, as fraud may involve collusion, forgery, intentional omissions, misrepresentations, or the override of internal control.
• obtain an understanding of internal control relevant to the audit in order to design audit procedures that are appropriate in the circumstances, but not for the purpose of expressing an opinion on the effectiveness of the Company's or the Group's internal control.
• evaluate the appropriateness of accounting policies used and the reasonableness of accounting estimates and related disclosures made by management.
• conclude on the appropriateness of management’s use of the going concern basis of accounting and, based on the audit evidence obtained, whether a material uncertainty exists related to events or conditions that may cast significant doubt on the Company and the Group's ability to continue as a going concern. If we conclude that a material uncertainty exists, we are required to draw attention in our auditor’s report to the related disclosures in the financial statements or, if such disclosures are inadequate, to modify our opinion. Our conclusions are based on the
Independent Auditor's Report - Otello Corporation ASA
(4)
audit evidence obtained up to the date of our auditor’s report. However, future events or conditions may cause the Company and the Group to cease to continue as a going concern.
• evaluate the overall presentation, structure and content of the financial statements, including the disclosures, and whether the financial statements represent the underlying transactions and events in a manner that achieves fair presentation.
• obtain sufficient appropriate audit evidence regarding the financial information of the entities or business activities within the Group to express an opinion on the consolidated financial statements. We are responsible for the direction, supervision and performance of the group audit. We remain solely responsible for our audit opinion.
We communicate with the Board of Directors regarding, among other matters, the planned scope and timing of the audit and significant audit findings, including any significant deficiencies in internal control that we identify during our audit.
We also provide the Board of Directors with a statement that we have complied with relevant ethical requirements regarding independence, and to communicate with them all relationships and other matters that may reasonably be thought to bear on our independence, and where applicable, related safeguards.
From the matters communicated with the Board of Directors, we determine those matters that were of most significance in the audit of the financial statements of the current period and are therefore the key audit matters. We describe these matters in our auditor’s report unless law or regulation precludes public disclosure about the matter or when, in extremely rare circumstances, we determine that a matter should not be communicated in our report because the adverse consequences of doing so would reasonably be expected to outweigh the public interest benefits of such communication.
Report on Other Legal and Regulatory Requirements
Opinion on the Board of Directors’ report
Based on our audit of the financial statements as described above, it is our opinion that the information presented in the Board of Directors’ report and in the statements on Corporate Governance and Corporate Social Responsibility concerning the financial statements, the going concern assumption and the proposed allocation of the result is consistent with the financial statements and complies with the law and regulations.
Opinion on Registration and Documentation
Based on our audit of the financial statements as described above, and control procedures we have considered necessary in accordance with the International Standard on Assurance Engagements (ISAE) 3000, Assurance Engagements Other than Audits or Reviews of Historical Financial Information, it is our opinion that management has fulfilled its duty to produce a proper and clearly set out registration and documentation of the Company’s accounting information in accordance with the law and bookkeeping standards and practices generally accepted in Norway.
Oslo, 21 April 2020
PricewaterhouseCoopers AS
Eivind Nilsen
State Authorised Public Accountant

163OTELLO CORPORATION ASA - ANNUAL REPORT 2019
Declaration of executive compensation policies
PART 1: POLICIES AND EXECUTIVE COM-PENSATION EXCEPT SHARE-BASED INCENTIVES
The Board of Directors has, in accordance with the Public Limited Liability Companies Act § 616a, developed policies regarding compensation for the Executive Team.
The objectives of the Executive Team compensation program are, in particular, to (i) attract, motivate, retain and reward the individuals on the Executive Team and (ii) ensure alignment of the Executive Team with the longterm interests of the shareholders. The Company’s executive compensation program is intended to be performance driven and is designed to reward the Executive Team for both reaching key financial goals and strategic business objectives and enhancing shareholder value.
The most important components of Executive Team compensation are as follows: (i) base salary, (ii) cashincentive bonus and (iii) longterm, equitybased incentives. Only the statement in part 2 “Sharebased incentives”, below, will be binding for the Board of Directors.
1. Base salaryBase salary is typically the primary component of Executive Team compensation and reflects the overall contribution of the executive to the Company. The determination of base salaries for the executives considers a range of factors, including (i) job scope and responsibilities, (ii) competitive pay practices, (iii) background, training and experience of the executive, and (iv) past performance of the executive at the Company. Adjustments to base salary are ordinarily reviewed every 12 months or longer by the Board.
2. Cash incentive bonusThe Company uses a cashincentive bonus to focus the Executive Team members on, and reward the Executive Team members for, achieving key corporate objectives, which typically involve corporate, financial and operational performance. Cashincentive bonuses tied to strategic business objectives, which may be individual to or shared among the Executive Team members, may also be considered as part of the cashincentive bonus. The determination of the total bonus that can be potentially earned by an executive in a given year is based on, among other factors, the executive’s current and expected contributions to the Company’s performance, his or her position within the Executive Team, and competitive compensation practices.
Any cashincentive bonus is capped, typically so no member of the Executive Team can be awarded aggregate cash bonuses in excess of 200% of his or her annual, base salary, unless the Board of Directors makes exemptions in particular cases. As a starting point, the cashincentive bonus for FY 2019 for Executive Team members was based on corporate, financial and operational performance as well as individualized, strategic business targets linked to his or her particular area of responsibility.
For FY 2020, the Board has approved a cash bonus scheme which is focused on achieving key corporate objectives and individualized, strategic business targets. The bonus scheme includes targets relating to:
• Potential corporate or asset transaction agreements, as further identified by the Board, being signed
• The Company’s FY 2020 revenues and Adjusted EBITDA targets for AdColony and Bemobi

164 165OTELLO CORPORATION ASA - ANNUAL REPORT 2019 OTELLO CORPORATION ASA - ANNUAL REPORT 2019
3. Severance-payment arrangementsPursuant to Section 1516 second subsection of the Norwegian 2005 Act relating to Employees’ Protection, CEO Lars Boilesen has waived his rights under Chapter 15 of the Act. As compensation, he is entitled to a severance payment of two years’ base salary if his employment is terminated by the Company. If the CEO has committed a gross breach of his duty or other serious breach of the contract of employment, the employment can be terminated with immediate effect without any right for the CEO to the mentioned severance payment.
Except for the CEO as described above, the employment agreements for the members of the Executive Team have no provisions with respect to severance payments if a member of the Executive Team should leave his or her position, whether voluntarily or involuntarily. Severance payment arrangements, if any, will thus be based on negotiations between the Company and the relevant member of the Executive Team on a casebycase basis.
4. PensionMembers of Executive Team participate in regular pension programs available for all employees of Company. For members of the Executive Team based in Norway, an additional pension agreement is in place. This agreement is based on a defined-contribution scheme and contributes 20% of salary over 12G.
PART 2: SHARE-BASED INCENTIVES
1. Existing programsThe Company currently has two equitybased incentives: ordinary stock options and Restricted Stock Units (“RSU”), as most recently approved at an extraordinary general meeting held 4 April 2017.
2. Vesting criteria for existing RSUsFor members of the Executive Team, the RSUs are typically linked to achievement of further specified targets related to reported revenue and reported Adjusted EBITDA. All RSUs previously granted to members of the Executive
Team, have been issued with vesting criteria which are in accordance with the approvals given by the Annual General Meeting held in 2014, the Annual General Meeting in 2015, and/or the Extraordinary General Meeting held in January 2016.
2. Vesting criteria for existing optionsOptions granted to AdColony employees in accordance with the approval given by the shareholders at the extraordinary general meeting held 4 April 2017, vest over three years with ⅓ each year.
Options granted to Otello Corporation ASA employees in accordance with the approval given by the shareholders at the extraordinary general meeting held 4 April 2017, vest over four years with ¼ each year.
PART 3: 2019 COMPLIANCE
In 2019, the Executive Team received base salaries and cashincentive bonuses in line with the Executive Compensation Policy as presented to the 2019 Annual General Meeting. Otello reached all 3 financial targets communicated to the market at the beginning of the year (i) Revenue growth in Bemobi in 2019 vs 2018, (ii) Higher Adj. EBITDA in Bemobi in 2019 vs 2018, and (iii) FY 2019 Adj. positive for AdColony. During 2019, there was a considerable focus on corporate transactions and restructuring/cost efficiencies and Executive Team members as well as other employees have put a lot of time and efforts into these initiatives. Thus, combined with reaching 3 out of 3 financial targets, the Board has decided to approve a cash bonus for FY 2019 equal to 150% target achievement for each member of the Executive Team.
Total compensation earned for the Executive Team in FY 2019 is summarized in note 6 of the consolidated financial statements.
During 2019, no deviations from the existing sharebased compensation programs as previously approved were made with respect to the Executive Team.

166 167OTELLO CORPORATION ASA - ANNUAL REPORT 2019 OTELLO CORPORATION ASA - ANNUAL REPORT 2019
Principles of Corporate Governance at Otello Corporation ASA
General principles, implementation and reporting on corporate governanceOtello Corporation ASA (“Otello” or the “Company”) strongly believes that strong corporate governance creates higher shareholder value. As a result, Otello is committed to maintaining high standards of corporate governance. Otello’s principles of corporate governance have been developed in light of the Norwegian Code of Practice for corporate governance (the “Code”), dated October 17, 2018, as required for all listed companies on the Oslo Stock Exchange. The Code is available at www.nues.no. The principles are further developed and are in accordance with section 3-3b and section 3-3c of the Norwegian Accounting Act, which can be found at https://lovdata.no/dokument/NL/lov/1998071756. Otello views the development of high standards of corporate governance as a continuous process and will continue to focus on improving the level of corporate governance.
The Board of Directors has the overall responsibility for corporate governance at Otello and ensures that the Company implements sound corporate governance. The Board of Directors has defined Otello’s basic corporate values, and the Company’s ethical guidelines and guidelines on corporate social responsibility are in accordance with these values.
Otello’s activitiesOtello’s business activities comprise mobile advertising via its AdColony business, mobileapp subscription services via its Bemobi business, and licensing of Rocket Optimizer™ technology via its Skyfire business. Otello’s corporate objective is to drive shareholder value through developing these businesses.
Our business is based on close relationships with customers, partners, investors, employees, friends, and communities all over the world — relationships we are committed to developing
by conducting our business openly and responsibly. Our corporate policies are developed in order to be true to this commitment.
Corporate Social Responsibility guidelinesThe Board of Directors has adopted corporate social responsibility (“CSR”) guidelines. These guidelines cover a range of topics and are focused around the following areas: our employees, human rights, anticorruption and the environment. These general principles and guidelines apply to all employees and officers of the Group. See the Board of Directors report for further information.
Equity, capital structure and dividendsThe Company’s capital structure and financing is considered to be appropriate in terms of Otello’s objectives, strategy and risk profile.
Otello’s policy is to maintain a high equity ratio. Otello believes its needs for growth can be met while also allowing for a dividend distribution as long as the Company is reaching its targeted growth and cash generation levels. Dividend payments will be subject to approval by the shareholders at the Company’s Annual General Meetings.
Authorizations granted to the Board of Directors to increase the Company’s share capital will be restricted to defined purposes and will in general be limited in time to no later than the date of the next Annual General Meeting. To the extent that authorization to increase the share capital shall cover issuance of shares under employee share option schemes and other purposes, the Company will consider presenting the authorizations to the shareholders as separate items.
The Board of Directors may also be granted the authority to acquire own shares. Authorizations granted to the Board of Directors

168 169OTELLO CORPORATION ASA - ANNUAL REPORT 2019 OTELLO CORPORATION ASA - ANNUAL REPORT 2019
to acquire own shares will also be restricted to defined purposes. To the extent that authorization to acquire own shares shall cover several purposes, the Company will consider presenting the authorization to the shareholders as separate items. Such authority may by law apply for a maximum period of 2 years, and will state the maximum and minimum amount payable for the shares. In addition, an authorization to acquire own shares will state the highest nominal value of the shares which Otello may acquire, and the mode of acquiring and disposing of own shares. Otello may not at any time hold more than 10% of the total issued shares as own shares. Equal treatment of shareholders and trans-actions with related partiesA key concept in Otello’s approach to corporate governance is the equal treatment of shareholders. Otello has one class of shares and all shares are freely transferable (with possible exceptions due to foreign law restrictions on sale and offering of securities). All shares in the Company carry equal voting rights. The shareholders exercise the highest authority in the Company through the General Meeting. All shareholders are entitled to submit items to the agenda, and to meet, speak, and vote at the General Meeting.
Any decision to waive the preemption rights of existing shareholders to subscribe for shares in the event of an increase in share capital will be explained. Where the Board of Directors resolves to carry out an increase in the share capital and waive the preemption rights of the existing shareholders on the basis of a mandate granted to the board, an explanation will be publicly disclosed in a stock exchange announcement issued in connection with the increase of the capital.
In 2019 there have been no significant transactions with related parties. In early 2020, Otello signed an amendment to the 2018 agreement with the Bemobi earnout participants. See Note 16 of the consolidated financial statements for further information.
If the Company should enter into a not immaterial transaction with related parties within Otello or with companies in which a director or leading employee of Otello or close associates of these have a material direct or indirect vested interest, those concerned shall immediately notify the Board of Directors. Any such
transaction must be approved by the Board of Directors, and where required also as soon as possible publicly disclosed to the market.
In the event of not immaterial transactions between the Company and shareholders, a shareholder’s parent company, members of the Board of Directors, Executive Management or close associates of any such parties, the Board of Directors will arrange for a valuation to be obtained from an independent third party, unless the transaction requires the approval of the General Meeting.
Insider tradingThe Company has an established and closely monitored insider trading policy. Otello employees are prohibited from trading in Otello securities based on information that is material, nonpublic information; that is, the public does not yet have access to this information, and this information may be deemed interesting for an investor to use when deciding whether to buy or sell securities. This rule also applies to other companies, where Otello employees may have access to such nonpublic information. Please note that even a tip to family and friends is considered illegal, if this should be used as a basis for buying or selling securities.
Any transaction the Company carries out in its own shares will be carried out either through the stock exchange or at prevailing stock exchange prices if carried out in any other way.
Freely negotiable shares Otello has no limitations on the transferability of shares and has one class of shares. Each share entitles the holder to one vote.
General MeetingsThrough the General Meeting, the shareholders exercise the highest authority in the Company. General Meetings are held in accordance with the Code. All shareholders are entitled to submit items to the agenda, meet, speak and vote at General Meetings. The Annual General Meeting is held each year before the end of June. Extraordinary General Meetings may be called by the Board of Directors at any time. The Company’s auditor or shareholders representing at least five percent of the total share capital may demand that an Extraordinary General Meeting be called.
General Meetings are convened by written notice to all shareholders with known addresses
no later than 21 days prior to the date of the meeting. Proposed resolutions and supporting information, including information on how to be represented at the meeting, vote by proxy and the right to propose items for the General Meeting, is generally made available to the shareholders no later than the date of the notice. According to the Company’s Articles of Association, attachments to the calling notice may be posted on the Company’s website and not sent to shareholders by ordinary mail. Shareholders who wish to receive the attachments may request the Company to mail such attachments free of charge. Resolutions and the supporting information are sufficiently detailed, comprehensive and specific to allow shareholders to form a view on all matters to be considered in the meeting.
Shareholders who are unable to be present, are encouraged to participate by proxy and a person who will be available to vote on behalf of shareholders as their proxy will be nominated. Proxy forms will allow the proxyholder to cast votes for each item separately. A final deadline for shareholders to give notice of their intention to attend the meeting or vote by proxy will be set in the notice for the meeting. Such deadline will be set as close as possible to the date of the General Meeting and under every circumstance, in accordance with the principles of sec
tion 5-3 of the Public Limited Companies Act.The members of the Board of Directors, Chairman of the Nomination Committee, CEO, CFO and the auditor are all required to be present at the meeting in person, unless they have valid reasons to be absent. The Chairman for the meeting is generally independent. Notice, enclosures and protocol of meetings are available on Otello’s website.
The General Meeting elects the members of the Board of Directors (excluding employee representatives), determines the remuneration of the members of the Board of Directors, approves the annual accounts and decides such other matters which by law, by separate proposal or according to the Company’s Articles of Association, are to be decided by the General Meeting. The General Meeting will normally vote separately on each candidate for election for the Board of Directors, the Nomination Committee and any other corporate bodies to which members are elected by the General Meeting.
The Board of Directors may decide to allow electronic participation in General Meetings, and will consider this before each General Meeting.
The minutes from General Meetings will be posted on the Company’s website within 15

170 171OTELLO CORPORATION ASA - ANNUAL REPORT 2019 OTELLO CORPORATION ASA - ANNUAL REPORT 2019
days after the General Meeting has been held. Information that a General Meeting has been held will be made public as soon as possible after the end of the meeting.
Nomination CommitteeThe Nomination Committee is a body established pursuant to the Articles of Association and shall consist of three to five members. The members and the chairperson are elected by the General Meeting. Members of the Nomination Committee serve for a twoyear period, but may be reelected. The current members of the Nomination Committee are Nils Foldal (Chairman), Kari Stautland and Jakob Iqbal. The members of the Nomination Committee are independent of the Board of Directors and Executive Management. Currently, no member of the Nomination Committee is a member of the Board of Directors. Any member who is also a member of the Board of Directors will normally not offer himself or herself for reelection to the Board.
The tasks of the Nomination Committee are to propose candidates for election as shareholderelected members of the Board of Directors and members of the Nomination Committee. The Nomination Committee is encouraged to have contact with shareholders, the Board of Directors and the Company’s Chief Executive Officer as part of its work on proposing candidates for election to the Board of Directors. The Committee cannot propose its own Committee members as candidates for the Company’s Board of Directors. Further, the Committee shall make recommendations regarding the remuneration of the members of the Board of Directors. Its recommendations will normally be explained, and information about proposed candidates will normally be given, no later than 21 days before the General Meeting. The tasks of the Nomination Committee are further described in the Company’s Nomination Committee guidelines, as adopted by the Annual General Meeting held on June 14, 2011. Remuneration of the members of the Nomination Committee will be determined by the General Meeting. Information regarding deadlines for proposals for members to the Board of Directors and the Nomination Committee will be posted on Otello’s website.
Corporate assemblyOtello does not have a corporate assembly as the employees have voted, and the General Meeting in 2010 approved, that the Company should not have a corporate assembly.
The Board of DirectorsAppointed by Shareholders at the General Meeting, the Board of Directors is the central governing mechanism between shareholders and Executive Management. The members of the Board of Directors are selected in light of an evaluation of the Company’s need for expertise, capacity and balanced decision making, and with the aim of ensuring that the Board of Directors can operate independently of any special interests and function effectively as a collegial body. At least half of the members of Board of Directors shall be independent of the Company’s management and its main business connections. At least two of the shareholderelected members of the Board of Directors shall be independent of the Company’s main shareholder(s). The current Otello Board of Directors meets these criteria. Otello’s Board of Directors diligently performs its oversight function and closely monitors major developments. The principal tasks of the Board of Directors are outlined below:
• Ensuring compliance with applicable laws• Considering the interests of Otello’s different
stakeholders• Reviewing and guiding corporate strategy,
major plans of action, annual budget and business plans; setting performance objectives; monitoring implementation and corporate performance; and overseeing major capital expenditures.
• Selecting, monitoring, and, when necessary, replacing key executives and overseeing succession planning
• Reviewing key executive and Board remuneration
• Monitoring and managing potential conflicts of interest of management, Directors and shareholders, including misuse of corporate assets and abuse in related party transactions.
• Ensuring the integrity of Otello’s accounting and financial reporting systems, and that appropriate systems of control are in place.
• Monitoring the effectiveness of the governance practices under which it operates and making changes as needed
• Overseeing the process of disclosure and communications
• A more indepth description of the Board’s duties can be found in the Rules of Procedure section on the Otello website: https://www.otellocorp.com/ir/boardofdirectors/rulesofprocedurefortheboardofdirectorsofotello.

172 173OTELLO CORPORATION ASA - ANNUAL REPORT 2019 OTELLO CORPORATION ASA - ANNUAL REPORT 2019
The Board of Directors is entrusted with and responsible for the oversight of the assets and business affairs of Otello in an honest, fair, diligent and ethical manner. The Board of Directors has adopted a Code of Conduct and the directors are expected to adhere to the standards of loyalty, good faith, and the avoidance of conflict of interest that follow. The Code of Conduct should be read and applied in conjunction with the Rules of Procedure as applicable at any time, and other rules and guidelines relevant to and adopted by the Board of Directors and / or the shareholders of Otello.
The Board of Directors has further established a Remuneration Committee and an Audit Committee. Currently, the Remuneration Committee and the Audit Committee each consists of two members. According to the Code, a majority of the members of each Committee should be independent from the Company. If the requirements for independence are not met, Otello will explain the reasons in our Annual Report. Currently, Frode Jacobsen (Chairperson), and Anooj Unarket are members of the Audit Committee, and Andre Christensen (Chairperson), and Birgit Midtbust are members of the Remuneration Committee. The requirements for independence are thus met.
The Audit Committee’s main responsibilities include following up on the financial reporting process, monitoring the systems for internal control and risk management, having continuous contact with the appointed auditor, and reviewing and monitoring the independence of the auditor. The Board of Directors maintains responsibility and decision making in all such matters. Please see below under the section “Remuneration of the Executive Personnel” for information regarding the tasks to be performed by the Remuneration Committee.
The Board of Directors will consider carrying out selfevaluation processes, evaluating its work, performance and expertise annually. To the extent that such a process is carried out, it would normally also include an evaluation of the composition of the Board and the manner in which its members function, both individually and as a group, in relation to the objectives set out for its work. Any report will be more comprehensive if it is not intended for publication. However, any reports or relevant extracts there from should normally be made available to the nomination committee. The Board of Directors will also consider whether to use an
external person to facilitate the evaluation of its own work.
In order to ensure a more independent consideration of matters of a material character in which the Chairman of the Board of Directors is, or has been, personally involved, such matters will be chaired by some other member of the Board of Directors.
Risk management and internal controlThe Board of Directors has overall responsibility for the management of the Company. This includes a responsibility to supervise and exercise control of the Company’s activities. The Board has drawn up the rules of procedure for the Board of Directors of Otello. The purpose of these rules of procedure is to set out rules on the work and administrative procedures of the Board of Directors of Otello. The Board of Directors shall, among other things, ensure that the Company’s business activities are soundly organized, supervise the Company’s daytoday management, draw up plans and budgets for the Company’s activities, keep itself informed on the financial position of the Company, and be responsible for ensuring that the Company’s activities, accounts, and asset management are subject to adequate control. In its supervision of the business activities of Otello, the Board of Directors will ensure that:
• The Chief Executive Officer uses proper and effective management and control systems, including systems for risk management, which continuously provide a satisfactory overview of Otello’s risk exposure.
• The control functions work as intended and that necessary measures are taken to reduce extraordinary risk exposure.
• There exist satisfactory routines to ensure followup of principles and guidelines adopted by the Board of Directors in relation to ethical behavior, conformity to law, health, safety and working environment, and social responsibility.
• Otello has a competent finance department and accounting systems, capable of producing reliable and on-time financial reports
• Directives from the external auditor are obeyed and that the external auditor’s recommendations are given proper attention.
Executive TeamOtello’s Board of Directors has drawn up instructions for the Executive Team of the Company. The purpose of these instructions is to

174 175OTELLO CORPORATION ASA - ANNUAL REPORT 2019 OTELLO CORPORATION ASA - ANNUAL REPORT 2019
clarify the powers and responsibilities of the members of the Executive Team and their duty of confidentiality.
The Executive Team conducts an annual strategy meeting with the Board of Directors. The strategy meeting focuses on products, sales, marketing, financial and organizational matters, and the corporate development strategy for the Group.
The Board of Directors has ensured that the Company has sound internal control and systems for risk management that are appropriate in relation to the extent and nature of the Company’s activities. The Company has performed a scoping of the financial risks in the Company and has established written control descriptions and process descriptions. The controls are executed on a monthly, quarterly or yearly basis, depending on the specific control. The internal controls and systems also encompass the Company’s corporate values, ethical guidelines and guidelines for corporate social responsibility. The Board of Directors carries out an annual review of the Company’s most important areas of exposure to risk and its internal control arrangements. In 2019, all Board members confirmed that they had read and complied with the Code of Conduct during the term of their directorship.
The Group’s CFO is responsible for the Group’s control functions for risk management and internal control. Otello publishes four interim financial statements in addition to the annual report. The financials are published on the Oslo Stock Exchange. Given the importance of providing accurate financial information, a centralized corporate control function and risk management function has been established consisting of the group corporate and business controllers. The corporate and business controller tasks are, among other things, to perform management’s risk assessment and risk monitoring across the group’s activities, to administer the Company’s valuebased management system and to coordinate planning and budgeting processes and internal controls reporting to the Board of Directors and Executive Team. The corporate and business controllers report into the CFO.
The finance department prepares financial reporting for the Group and ensures that reporting is in accordance with applicable laws, accounting standards, established accounting
principles and the Board’s guidelines. The finance department provides a set of procedures and processes detailing the requirements with which local reporting units must comply. The Group has established processes and a variety of control measures that will ensure quality assurance of financial reporting. A series of risk assessment and control measures have been established in connection with the preparation of financial statements. Reporting instructions are communicated to the reporting units each month, following internal meetings when the reporting units have submitted their group reports, and the business controllers have reviewed the reporting package with the purpose of identifying any significant misstatements in the financial statements. Based on the reported numbers from the reporting units, the finance department consolidates the Group numbers. Several controls are established to ensure the correctness of the consolidation, e.g., control types such as reconciliation, segregation of duties, management review and authorization.
The CFO, the Group Chief Accounting Officer and leaders of the reporting units are responsible for (i) the ongoing financial reporting and for implementing sufficient procedures to prevent errors in the financial reporting, (ii) identifying, assessing and monitoring the risk of significant errors in the Group’s financial reporting, and (iii) implementing appropriate and effective internal controls in accordance with specified group requirements and for ensuring compliance with local laws and requirements. All reporting units have their own management, and the financial functions are adapted to the organization and activities. All monthly and quarterly operations reports are analyzed and assessed relative to budgets, forecasts and historical trends.
The Executive Team analyzes and comments on the financial reporting and business results of the Group on a quarterly basis. Critical issues and events that affect the future development of the business and optimal utilization of resources are identified, and action plans are put in place, if necessary.
The Audit Committee oversees the process of financial reporting and ensures that the Group’s internal controls and the risk management systems are operating effectively. The Audit Committee performs a review of the quarterly and annual financial statements, which ultimately are approved by the Board of Directors.
Other guidelines and policiesAs an extension of the general principles and guidelines, Otello has drawn up additional guidelines.
Information security guidelinesOtello has guidelines and information policies covering information security roles, responsibilities, training, contingency plans, etc.
Investor relations policyOtello is committed to reporting financial results and other relevant information based on openness and taking into account the requirement for equal treatment of all participants in the securities market. To ensure that correct information be made public, as well as ensuring equal treatment and flow of information, the Company’s Board of Directors has approved an Investor Relations policy. A primary goal of Otello’s investor relations activities is to provide investors, capitalmarket players and shareholders with reliable, timely and balanced information for investors, lenders and other interested parties in the securities market, to enhance understanding of our operations.
Remuneration of the Board of DirectorsRemuneration for members of the Board of Directors is a fixed annual sum proposed by the Nomination Committee and approved at the Annual General Meeting. The remuneration reflects the responsibility, qualifications, time commitment and the complexity of the tasks in general. No members of the Board of Di
rectors (or any company associated with such member) elected by the shareholders have assumed special tasks for the Company beyond what is described in this document, and no such member (or any company associated with such member) has received any compensation from Otello other than ordinary Board of Directors remuneration. All remuneration to the Board of Directors is disclosed in note 6 to the Annual Report.
Remuneration of executive personnelA Remuneration Committee has been established by the Board of Directors. The Committee shall act as a preparatory body for the Board of Directors with respect to (i) the compensation of the CEO and other members of the Executive Team and (ii) Otello’s corporate governance policies and procedures, which, in each case, are matters for which the Board of Directors maintains responsibility and decision making.
Details concerning remuneration of the executive personnel, including all details regarding the CEO’s remuneration, are given in note 6 to the Annual Report. The performancerelated remuneration to executive personnel is subject to an absolute limit. The Board of Directors assesses the CEO and his terms and conditions once a year. The General Meeting is informed about incentive programs for employees, and, pursuant to section 616 a) of the Public Limited Companies Act, a statement regarding remuneration policies for the Executive Team will be presented to the General Meeting. The Board of Direc

176 177OTELLO CORPORATION ASA - ANNUAL REPORT 2019 OTELLO CORPORATION ASA - ANNUAL REPORT 2019
tors’ statement on the remuneration of the Executive Team will be a separate appendix to the agenda for the General Meeting. The Company will also normally make clear which aspects of the guidelines are advisory and which, if any, are binding. The General Meeting will normally be able to vote separately on each of these aspects of the guidelines. In addition, the Board of Directors’ declaration on the compensation policies of the Executive Team is included in a separate section to the Annual Report.
Information and communicationsCommunication with shareholders, investors and analysts is a high priority for Otello. The Company believes that objective and timely information to the market is a prerequisite for a fair valuation of the Company’s shares and, in turn, the generation of shareholder value. The Company continually seeks ways to enhance our communication with the investment community.
Otello’s company website (https://www.otellocorp.com/ir) provides the investment community with information about the Company, including a comprehensive investor relations section. This section includes the Company’s investor relations policy, annual and quarterly reports, press releases and stock exchange announcements, share price and shareholder information, a financial calendar, an overview of upcoming investor events, and other relevant information.
During the announcement of quarterly and annual financial results, there is a forum for shareholders and the investment community to ask questions of the Company’s management team. Otello also arranges regular presentations in Europe and the United States, in addition to holding meetings with investors and analysts. Important events affecting the Company are reported immediately to the Oslo Stock Exchange in accordance with applicable legislation and posted on https://www.otellocorp.com/ir. All material information is disclosed to recipients equally in terms of content and timing.
The Board of Directors has further established an investor relations policy for contact with shareholders and others beyond the scope of the General Meeting.
Take-oversThe Board of Directors endorses the recommendations of the Code. Otello’s Articles of As
sociation do not contain any restrictions, limitations or defense mechanisms on acquiring the Company’s shares.
In accordance with the Securities Trading Act and the Code, the Board has adopted guidelines for possible takeovers.
In the event of an offer, the Board of Directors will not seek to hinder or obstruct takeover bids for Otello’s activities or shares. Any agreement with the bidder that acts to limit the Company’s ability to arrange other bids for the Company’s shares will only be entered into where the Board believes it is in the common interest of the Company and its shareholders.
Information about agreements entered into between the Company and the bidder that are material to the market’s evaluation of the bid will be publicly disclosed no later than at the same time as the announcement of an impending bid is published.
If an offer is made for the shares of Otello, the Board of Directors will make a recommendation as to whether the shareholders should or should not accept the offer and will normally arrange for a valuation from an independent expert.
AuditorThe auditor participates in meetings of the Board of Directors that deal with the annual accounts, as well as upon special request. Every year, the auditor presents to the Audit Committee a report outlining the audit activities in the previous fiscal year and highlighting the areas that caused the most attention or discussions with management, as well as a plan for the work related to the Company’s audit. The auditor also reports on internal control observations during the conduct of the audit, including identified weaknesses and proposals for improvement. The auditor will make himself available upon request for meetings with the Board of Directors during which no member of the Executive Management is present at least once each year, as will the Board of Directors upon the auditor’s request. The General Meeting is informed about the Company’s engagement and remuneration of the auditor and for fees paid to the auditor for services other than the annual audit, and details are given in note 7 to the Annual Report.

Otello Corporation ASA
Gjerdrums vei 19NO-0484 Oslo, Norway
Tel: +47 9190 9145
www.otellocorp.com
CO
NC
EPT, TEX
T, DESIG
N, P
RO
JECT M
AN
AG
EMEN
T, PH
OTO
, ILLUSTR
ATIO
NS: C
OX
IT // CO
XIT.N
O