thai beverage plc -...
TRANSCRIPT
Thai Beverage PLC1H18 Financial Results(First Half Ended 31 March 2018)
1Thai Beverage PLC1H18 (First Half Ended 31 March 2018)
1H18 (First Half Ended 31 March 2018) Thai Beverage PLC 2
Note on Forward Looking Statements• The following presentation may contain forward looking statements by the management of Thai Beverage Public
Company Limited (“ThaiBev"), relating to financial or other trends for future periods, compared to the resultsfor previous periods.
• Some of the statements contained in this presentation that are not historical facts are statements of futureexpectations with respect to the financial conditions, results of operations and businesses, and related plans andobjectives.
• Forward looking information is based on management's current views and assumptions including, but not limitedto, prevailing economic and market conditions. These statements involve known and unknown risks anduncertainties that could cause actual results, performance or events to differ materially from those in thestatements as originally made. Such statements are not, and should not be construed as a representation as tofuture performance of ThaiBev. In particular, such targets should not be regarded as a forecast or projection offuture performance of ThaiBev. It should be noted that the actual performance of ThaiBev may vary significantlyfrom such targets.
1H18 (First Half Ended 31 March 2018) Thai Beverage PLC 3
Understanding this PresentationAcquisitions
• In the second quarter ended 31 March 2018, the Company completed an acquisition of
• 75% shareholding interest in Havi Logistic Co.,Ltd. (Havi), which operates logistic businesses for food services in Thailand, byThai Beverage Logistics Co.,Ltd., a wholly owned subsidiary of the Company on 28 February 2018.
• The Company has included the assets and liabilities of Havi in the consolidated statements of financial position and the resultsof operations and cash flows in the consolidated statement of income and cash flows respectively from March 2018 onwards.
• Havi’s operations were recognized under the food business segment.
• In the first quarter ended 31 December 2017, the Company completed 4 acquisitions of
1. a 76% shareholding interest in Spice of Asia Co.,Ltd. (SOA) on 3 October 2017 to operate 10 stores of restaurants servinghotpot and Thai food
2. a 75% shareholding interest in Myanmar Supply Chain and Marketing Services Co.,Ltd. and Myanmar Distillery Co.,Ltd. (MSC &MDC), which incorporated in the Republic of the Union of Myanmar, on 12 October 2017 to operate spirits business inMyanmar
3. 252 existing KFC stores in Thailand by The QSR of Asia Co.,Ltd. (QSA), a wholly-owned subsidiary of the Company on 1December 2017
4. a 53.59% shareholding interest in Saigon Beer – Alcohol – Beverage Joint Stock Corporation (Sabeco), a company incorporatedin The Socialist Republic of Vietnam and currently listed in Ho Chi Minh Stock Exchange (HOSE), on 29 December 2017 tooperate mainly in beer business.
1H18 (First Half Ended 31 March 2018) Thai Beverage PLC 4
Understanding this PresentationAcquisitions
• The Company has included the assets and liabilities of SOA, MSC & MDC and QSA in the consolidated statements of financialposition as at 31 December 2017. The results of operations and cash flows for the period of October to December 2017 of SOA,MSC & MDC and QSA were included in the consolidated statements of income and cash flows respectively.
• Due to the acquisition of Sabeco was incurred close to the end of December 2017, only assets and liabilities were included in theconsolidated statements of financial position of the first quarter, but results of operations and cash flows were included in theconsolidated statements of income and cash flows of the second quarter ended 31 March 2018 onwards.
• SOA and QSA’s operations were recognized under food business. MSC & MDC’s operations were recognized under spirits business.Sabeco’s operations were recognized under beer business.
• The Company obtained bridging loans from various local and foreign banks to fund the acquisition in the first quarter ended 31December 2017. The Company has managed to take out short term debts to long term debts in March 2018 about Baht 50,000million which lowered short term debts and turned current ratio from under 1.0 in last quarter to be over 1.0 in this quarter.

1H18 (First Half Ended 31 March 2018) Thai Beverage PLC 5
Understanding this PresentationExcise tax
• Effective from 26 January 2018, all alcoholic beverages and tobacco products, both imported and domesticallyproduced, have been charged an additional 2% of excise tax by law to contribute to the Elderly Fund.
• The new Excise Tax Act is effective from 16 September 2017. The key change to alcoholic beverages is the tax collection method based on a suggested retail price instead of the last wholesale price. However, the excise tax calculation is still based on both ad valorem rates (a percentage of suggested retail price) and specific rates (Baht per litre of pure alcohol content). The excise tax rate is also changed per below:Beer- Prior: 155 Baht per litre of pure alcohol content and 48% of the last wholesale price exclude VAT.- New: 430 Baht per litre of pure alcohol content and 22% of the suggested retail price exclude VAT.White spirits- Prior: 145 Baht per litre of pure alcohol content and 4% of the last wholesale price exclude VAT.- New: 155 Baht per litre of pure alcohol content and 2% of the suggested retail price exclude VAT.Other distilled liquor- Prior: 250 Baht per litre of pure alcohol content and 25% of the last wholesale price exclude VAT.- New: 255 Baht per litre of pure alcohol content and 20% of the suggested retail price exclude VAT.
• For non-alcoholic beverages - artificial mineral water, soda water, carbonated soft drinks, fruit and vegetable juice which have no alcohol or have alcohol content not exceed 0.5% and are in airtight packaging, the key change is the tax collection method based on a suggested retail price instead of the ex-factory price and the excise sugar tax which is implemented for the first time ever. The excise tax is based on both ad valorem rates (a percentage of suggested retail price) and specific rates (Baht per gram of sugar content). The beverage with over 6 grams of sugar per 100 ml. will be subject to the new specific sugar tax which the rate will be increased every two years until 1 October 2023 onwards.
1H18 (First Half Ended 31 March 2018) Thai Beverage PLC 6
Understanding this Presentation• Current operations by business segments consist of spirits, beer, non-alcoholic beverages and food
• All monetary amounts in millions of Thai Baht unless otherwise stated
• Volumes in millions of liters unless otherwise stated
• EBITDA = Earnings from total revenues before interest expense, income tax, depreciation, and amortization

Thai Beverage PLC 71H18 (First Half Ended 31 March 2018)
Highlights
1H18 (First Half Ended 31 March 2018) Thai Beverage PLC 8
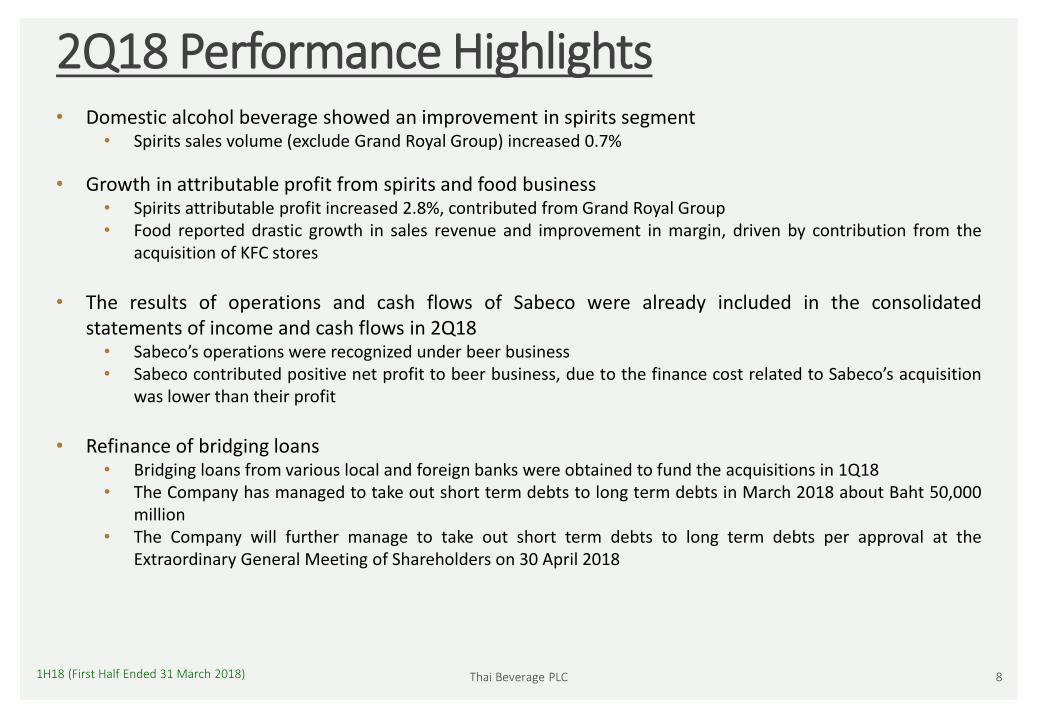
2Q18 Performance Highlights• Domestic alcohol beverage showed an improvement in spirits segment
• Spirits sales volume (exclude Grand Royal Group) increased 0.7%
• Growth in attributable profit from spirits and food business• Spirits attributable profit increased 2.8%, contributed from Grand Royal Group• Food reported drastic growth in sales revenue and improvement in margin, driven by contribution from the
acquisition of KFC stores
• The results of operations and cash flows of Sabeco were already included in the consolidatedstatements of income and cash flows in 2Q18• Sabeco’s operations were recognized under beer business• Sabeco contributed positive net profit to beer business, due to the finance cost related to Sabeco’s acquisition
was lower than their profit
• Refinance of bridging loans• Bridging loans from various local and foreign banks were obtained to fund the acquisitions in 1Q18• The Company has managed to take out short term debts to long term debts in March 2018 about Baht 50,000
million• The Company will further manage to take out short term debts to long term debts per approval at the
Extraordinary General Meeting of Shareholders on 30 April 2018
1H18 (First Half Ended 31 March 2018) Thai Beverage PLC 9
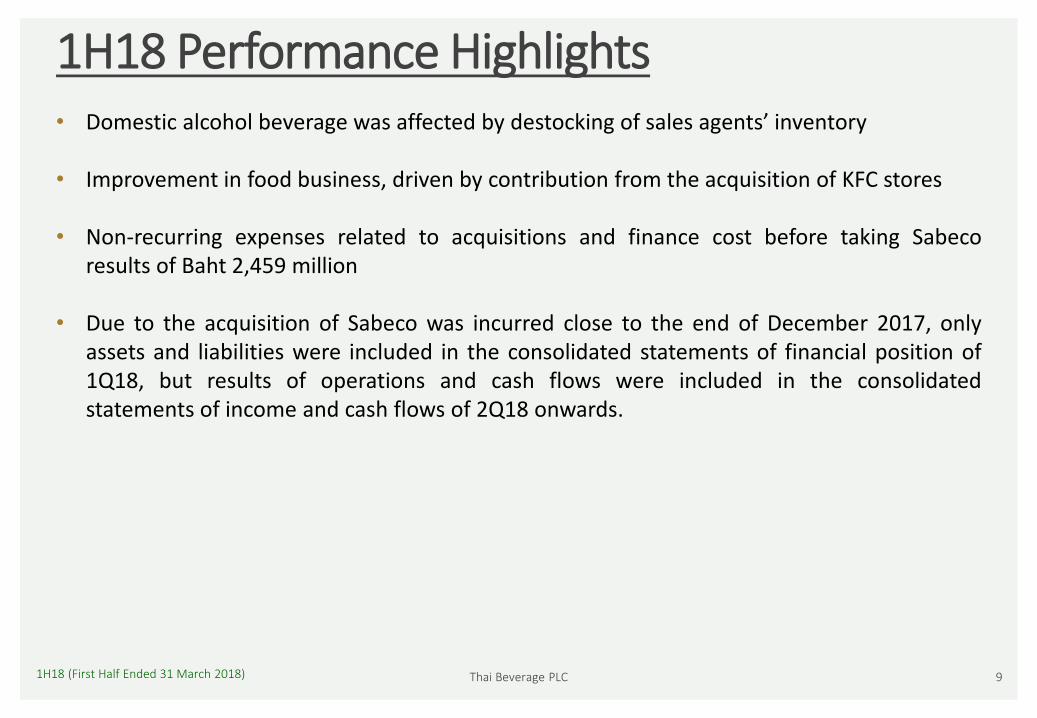
1H18 Performance Highlights• Domestic alcohol beverage was affected by destocking of sales agents’ inventory
• Improvement in food business, driven by contribution from the acquisition of KFC stores
• Non-recurring expenses related to acquisitions and finance cost before taking Sabecoresults of Baht 2,459 million
• Due to the acquisition of Sabeco was incurred close to the end of December 2017, onlyassets and liabilities were included in the consolidated statements of financial position of1Q18, but results of operations and cash flows were included in the consolidatedstatements of income and cash flows of 2Q18 onwards.
1H18 (First Half Ended 31 March 2018) Thai Beverage PLC 10
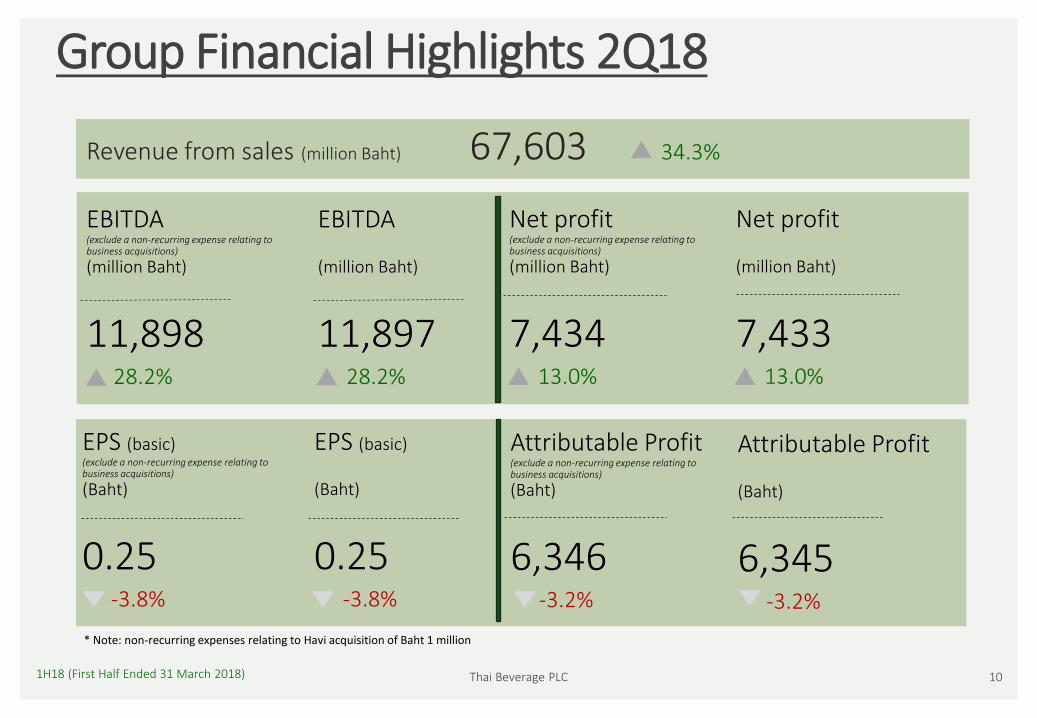
Group Financial Highlights 2Q18
EBITDA(exclude a non-recurring expense relating to business acquisitions)
(million Baht)
11,89828.2%
EBITDA
(million Baht)
11,89728.2%
Net profit(exclude a non-recurring expense relating to business acquisitions)
(million Baht)
7,43413.0%
Net profit
(million Baht)
7,43313.0%
EPS (basic)(exclude a non-recurring expense relating to business acquisitions)
(Baht)
0.25-3.8%
EPS (basic)
(Baht)
0.25-3.8%
Revenue from sales (million Baht) 67,603 34.3%
Attributable Profit (exclude a non-recurring expense relating to business acquisitions)
(Baht)
6,346-3.2%
Attributable Profit
(Baht)
6,345-3.2%
* Note: non-recurring expenses relating to Havi acquisition of Baht 1 million
1H18 (First Half Ended 31 March 2018) Thai Beverage PLC 11
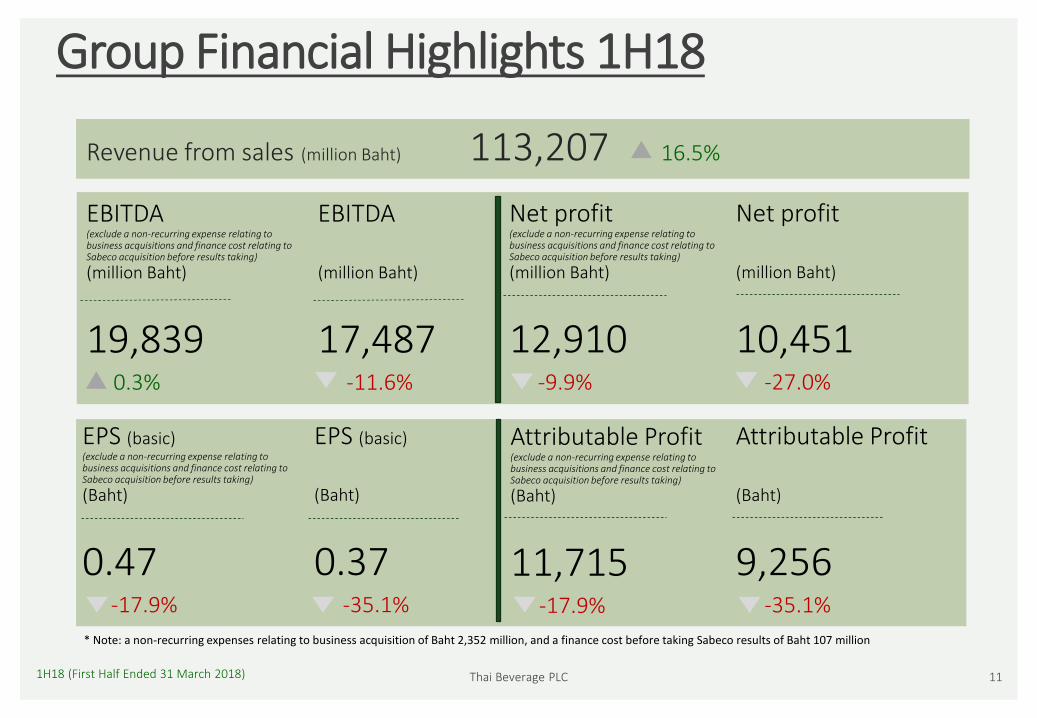
Group Financial Highlights 1H18
EBITDA(exclude a non-recurring expense relating to business acquisitions and finance cost relating to Sabeco acquisition before results taking)
(million Baht)
19,8390.3%
EBITDA
(million Baht)
17,487-11.6%
Net profit(exclude a non-recurring expense relating to business acquisitions and finance cost relating to Sabeco acquisition before results taking)
(million Baht)
12,910-9.9%
Net profit
(million Baht)
10,451-27.0%
EPS (basic)(exclude a non-recurring expense relating to business acquisitions and finance cost relating to Sabeco acquisition before results taking)
(Baht)
0.47-17.9%
EPS (basic)
(Baht)
0.37-35.1%
Revenue from sales (million Baht) 113,207 16.5%
Attributable Profit (exclude a non-recurring expense relating to business acquisitions and finance cost relating to Sabeco acquisition before results taking)
(Baht)
11,715-17.9%
Attributable Profit
(Baht)
9,256-35.1%
* Note: a non-recurring expenses relating to business acquisition of Baht 2,352 million, and a finance cost before taking Sabeco results of Baht 107 million
1H18 (First Half Ended 31 March 2018) Thai Beverage PLC 12
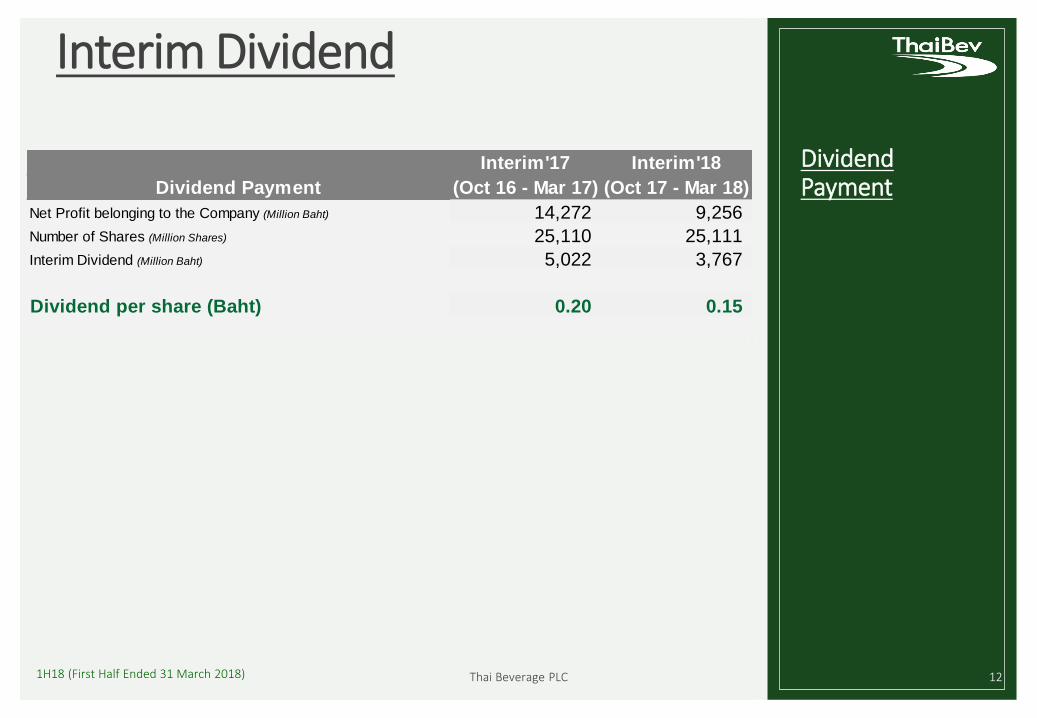
Dividend Payment
Interim Dividend
Interim'17 Interim'18
Dividend Payment (Oct 16 - Mar 17) (Oct 17 - Mar 18)
Net Profit belonging to the Company (Million Baht) 14,272 9,256
Number of Shares (Million Shares) 25,110 25,111
Interim Dividend (Million Baht) 5,022 3,767
Dividend per share (Baht) 0.20 0.15
Thai Beverage PLC 131H18 (First Half Ended 31 March 2018)
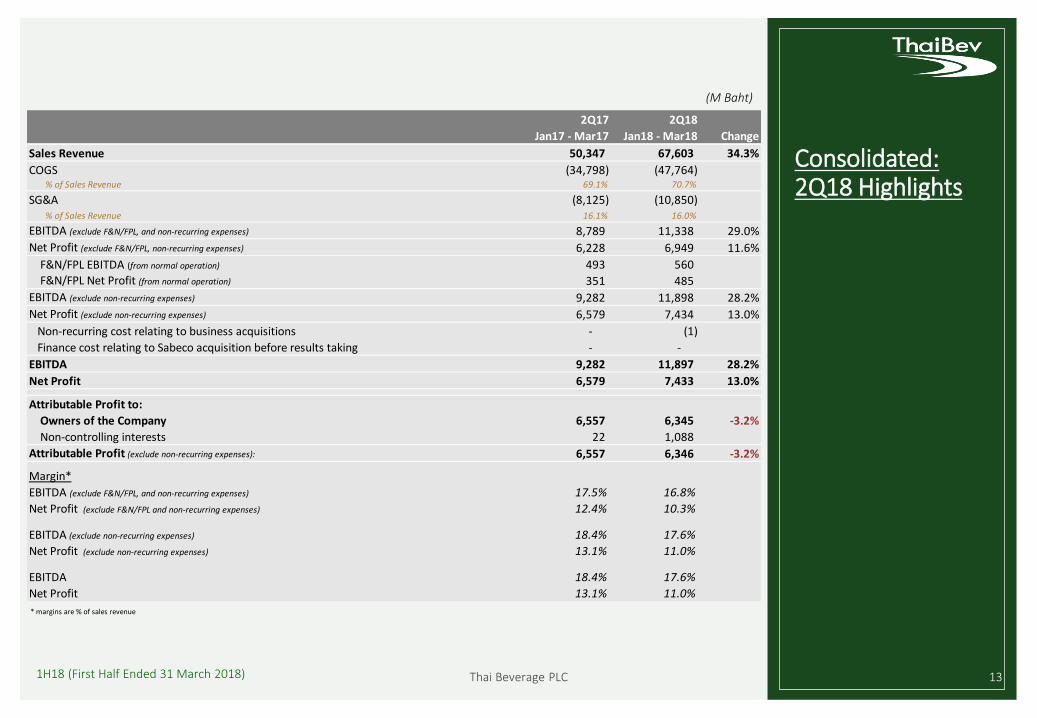
Consolidated: 2Q18 Highlights
(M Baht)
2Q17 2Q18
Jan17 - Mar17 Jan18 - Mar18 Change
Sales Revenue 50,347 67,603 34.3%
COGS (34,798) (47,764) % of Sales Revenue 69.1% 70.7%
SG&A (8,125) (10,850) % of Sales Revenue 16.1% 16.0%
EBITDA (exclude F&N/FPL, and non-recurring expenses) 8,789 11,338 29.0%
Net Profit (exclude F&N/FPL, non-recurring expenses) 6,228 6,949 11.6%
F&N/FPL EBITDA (from normal operation) 493 560
F&N/FPL Net Profit (from normal operation) 351 485
EBITDA (exclude non-recurring expenses) 9,282 11,898 28.2%
Net Profit (exclude non-recurring expenses) 6,579 7,434 13.0%
Non-recurring cost relating to business acquisitions - (1)
Finance cost relating to Sabeco acquisition before results taking - -
EBITDA 9,282 11,897 28.2%
Net Profit 6,579 7,433 13.0%
Attributable Profit to:
Owners of the Company 6,557 6,345 -3.2%
Non-controlling interests 22 1,088
Attributable Profit (exclude non-recurring expenses): 6,557 6,346 -3.2%
Margin*
EBITDA (exclude F&N/FPL, and non-recurring expenses) 17.5% 16.8%
Net Profit (exclude F&N/FPL and non-recurring expenses) 12.4% 10.3%
EBITDA (exclude non-recurring expenses) 18.4% 17.6%
Net Profit (exclude non-recurring expenses) 13.1% 11.0%
EBITDA 18.4% 17.6%
Net Profit 13.1% 11.0%
* margins are % of sales revenue

Thai Beverage PLC 141H18 (First Half Ended 31 March 2018)
Consolidated: 1H18 Highlights
(M Baht)
1H17 1H18
Oct16 - Mar17 Oct17 - Mar18 Change
Sales Revenue 97,176 113,207 16.5%
COGS (67,329) (79,480) % of Sales Revenue 69.3% 70.2%
SG&A (14,972) (19,862) % of Sales Revenue 15.4% 17.6%
EBITDA (exclude F&N/FPL, and non-recurring expenses) 17,510 18,487 5.6%
Net Profit (exclude F&N/FPL, non-recurring expenses, finance cost relating to Sabeco acquisition before results taking) 12,366 11,743 -5.0%
F&N/FPL EBITDA (from normal operation) 2,275 1,352
F&N/FPL Net Profit (from normal operation) 1,956 1,167
EBITDA (exclude non-recurring expenses) 19,785 19,839 0.3%
Net Profit (exclude non-recurring expenses, finance cost relating to Sabeco acquisition before results taking ) 14,322 12,910 -9.9%
Non-recurring cost relating to business acquisitions - (2,352)
Finance cost relating to Sabeco acquisition before results taking - (107)
EBITDA 19,785 17,487 -11.6%
Net Profit 14,322 10,451 -27.0%
Attributable Profit to:
Owners of the Company 14,272 9,256 -35.1%
Non-controlling interests 50 1,195
Attributable Profit (exclude non-recurring expenses, finance cost relating to Sabeco acquisition before results taking): 14,272 11,715 -17.9%
Margin*
EBITDA (exclude F&N/FPL, and non-recurring expenses) 18.0% 16.3%
Net Profit (exclude F&N/FPL, non-recurring expenses, finance cost relating to Sabeco acquisition before results taking) 12.7% 10.4%
EBITDA (exclude non-recurring expenses) 20.4% 17.5%
Net Profit (exclude non-recurring expenses, finance cost relating to Sabeco acquisition before results taking) 14.7% 11.4%
EBITDA 20.4% 15.4%
Net Profit 14.7% 9.2%
* margins are % of sales revenue
Thai Beverage PLC 151H18 (First Half Ended 31 March 2018)
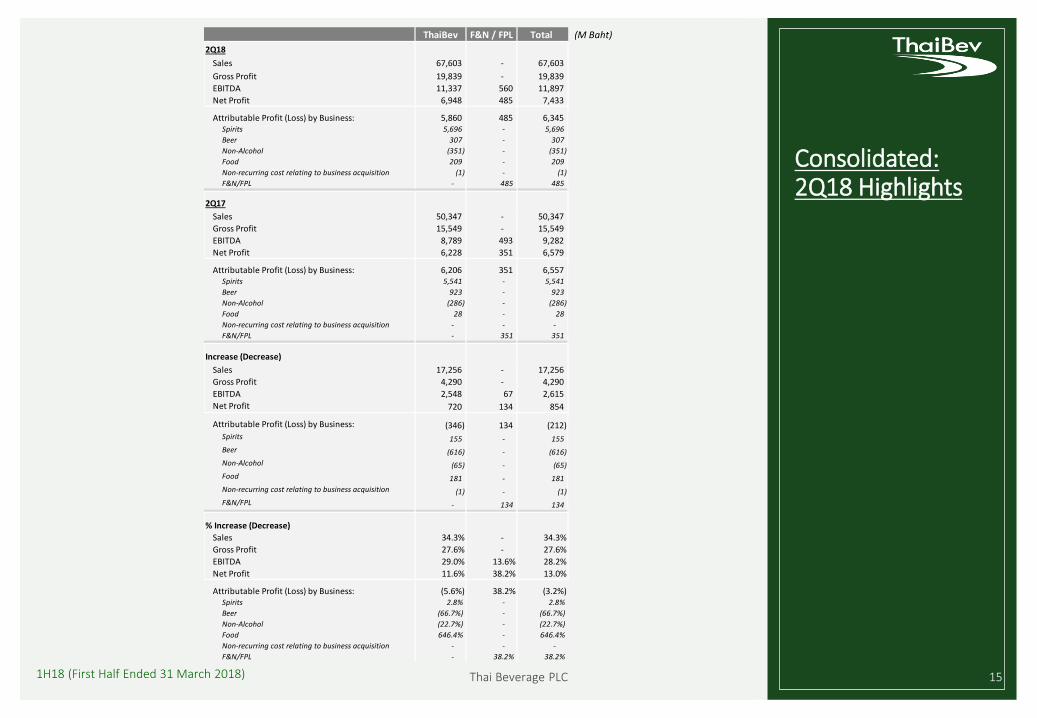
Consolidated: 2Q18 Highlights
ThaiBev F&N / FPL Total (M Baht)
2Q18
Sales 67,603 - 67,603
Gross Profit 19,839 - 19,839
EBITDA 11,337 560 11,897
Net Profit 6,948 485 7,433
Attributable Profit (Loss) by Business: 5,860 485 6,345 Spirits 5,696 - 5,696
Beer 307 - 307
Non-Alcohol (351) - (351)
Food 209 - 209
Non-recurring cost relating to business acquisition (1) - (1)
F&N/FPL - 485 485
2Q17
Sales 50,347 - 50,347
Gross Profit 15,549 - 15,549
EBITDA 8,789 493 9,282
Net Profit 6,228 351 6,579
Attributable Profit (Loss) by Business: 6,206 351 6,557 Spirits 5,541 - 5,541
Beer 923 - 923
Non-Alcohol (286) - (286)
Food 28 - 28
Non-recurring cost relating to business acquisition - - -
F&N/FPL - 351 351
Increase (Decrease)
Sales 17,256 - 17,256
Gross Profit 4,290 - 4,290
EBITDA 2,548 67 2,615
Net Profit 720 134 854
Attributable Profit (Loss) by Business: (346) 134 (212) Spirits 155 - 155
Beer (616) - (616)
Non-Alcohol (65) - (65)
Food 181 - 181
Non-recurring cost relating to business acquisition (1) - (1)
F&N/FPL - 134 134
% Increase (Decrease)
Sales 34.3% - 34.3%
Gross Profit 27.6% - 27.6%
EBITDA 29.0% 13.6% 28.2%
Net Profit 11.6% 38.2% 13.0%
Attributable Profit (Loss) by Business: (5.6%) 38.2% (3.2%) Spirits 2.8% - 2.8%
Beer (66.7%) - (66.7%)
Non-Alcohol (22.7%) - (22.7%)
Food 646.4% - 646.4%
Non-recurring cost relating to business acquisition - - -
F&N/FPL - 38.2% 38.2%

Thai Beverage PLC 161H18 (First Half Ended 31 March 2018)
Consolidated: 1H18 Highlights
ThaiBev F&N / FPL Total (M Baht)
1H18
Sales 113,207 - 113,207
Gross Profit 33,727 - 33,727
EBITDA 16,135 1,352 17,487
Net Profit 9,284 1,167 10,451 -
Attributable Profit (Loss) by Business: 8,089 1,167 9,256 Spirits 9,532 - 9,532
Beer 1,306 - 1,306
Non-Alcohol (597) - (597)
Food 307 - 307
Non-recurring cost relating to business acquisition (2,459) - (2,459)
F&N/FPL - 1,167 1,167
1H17
Sales 97,176 - 97,176
Gross Profit 29,847 - 29,847
EBITDA 17,510 2,275 19,785
Net Profit 12,366 1,956 14,322
Attributable Profit (Loss) by Business: 12,316 1,956 14,272 Spirits 10,653 - 10,653
Beer 2,183 - 2,183
Non-Alcohol (553) - (553)
Food 33 - 33
Non-recurring cost relating to business acquisition - - -
F&N/FPL - 1,956 1,956
Increase (Decrease)
Sales 16,031 - 16,031
Gross Profit 3,880 - 3,880
EBITDA (1,375) (923) (2,298)
Net Profit (3,082) (789) (3,871)
Attributable Profit (Loss) by Business: (4,227) (789) (5,016) Spirits (1,121) - (1,121)
Beer (877) - (877)
Non-Alcohol (44) - (44)
Food 274 - 274
Non-recurring cost relating to business acquisition (2,459) - (2,459)
F&N/FPL - (789) (789)
% Increase (Decrease)
Sales 16.5% - 16.5%
Gross Profit 13.0% - 13.0%
EBITDA (7.9%) (40.6%) (11.6%)
Net Profit (24.9%) (40.3%) (27.0%)
Attributable Profit (Loss) by Business: (34.3%) (40.3%) (35.1%) Spirits (10.5%) - (10.5%)
Beer (40.2%) - (40.2%)
Non-Alcohol (8.0%) - (8.0%)
Food 830.3% - 830.3%
Non-recurring cost relating to business acquisition - - -
F&N/FPL - (40.3%) (40.3%)
Thai Beverage PLC 171H18 (First Half Ended 31 March 2018)
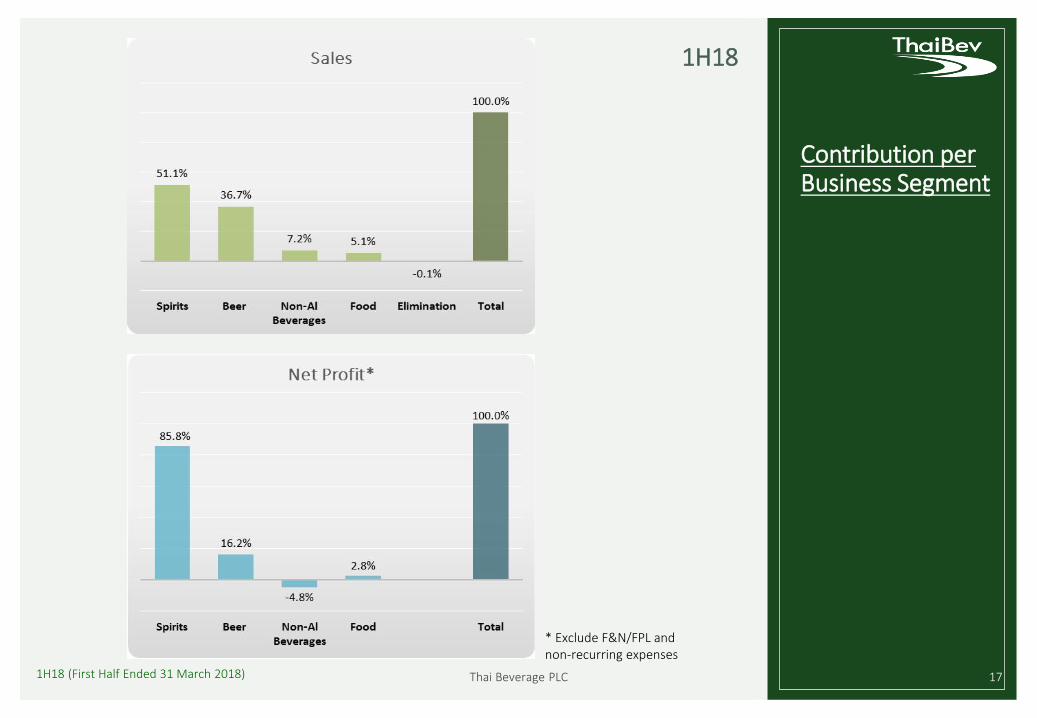
Contribution per Business Segment
* Exclude F&N/FPL and non-recurring expenses
1H18
Thai Beverage PLC 181H18 (First Half Ended 31 March 2018)
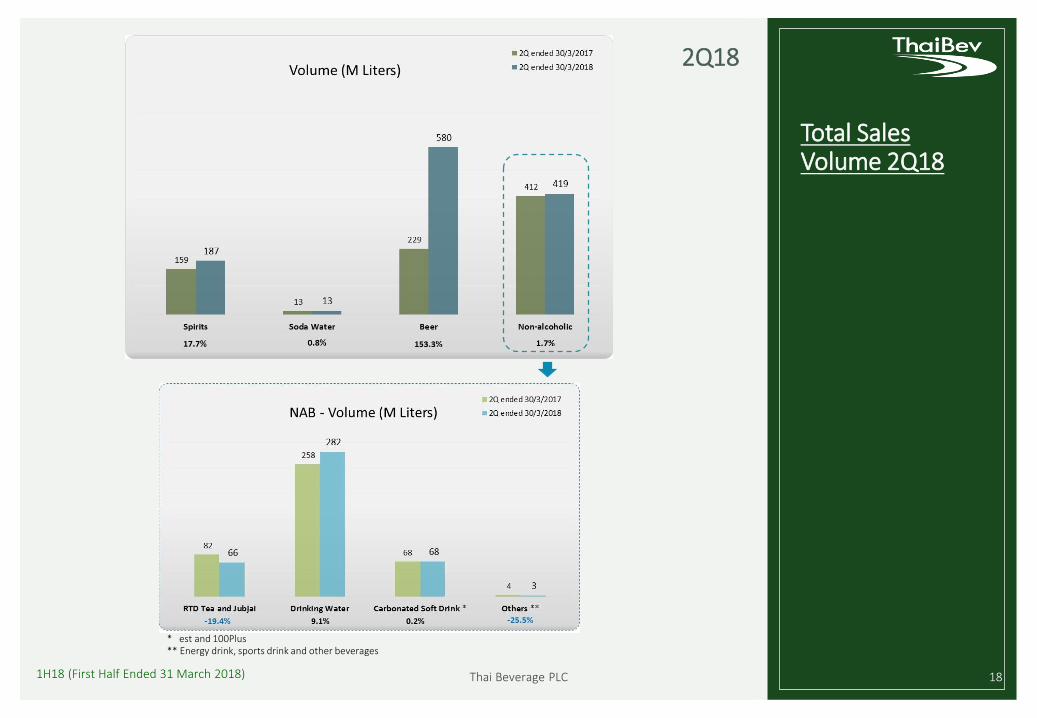
Total Sales Volume 2Q18
* est and 100Plus ** Energy drink, sports drink and other beverages
2Q18

Thai Beverage PLC 191H18 (First Half Ended 31 March 2018)
Total Sales Volume 1H18
* est and 100Plus ** Energy drink, sports drink and other beverages
1H18
Thai Beverage PLC 201H18 (First Half Ended 31 March 2018)
Business Segments

1H18 (First Half Ended 31 March 2018) Thai Beverage PLC 21
Spirits
(M Baht)
Sales Revenue UP an increase in sales volume COGS (%) DOWN a product mixSG&A (%) UP an increase in advertising and promotion expenses and staff costsEBITDA UP an increase in gross profit although there was an increase in advertising and promotion
expenses and staff costsNet Profit UP an increase in EBITDAAttributable Profit UP an increase in net profit from MSC & MDC’s spirits although there was a decrease in net
profit from the Company existing spirits
2Q17 2Q18
Spirits Jan17 - Mar17 Jan18 - Mar18 Change
Sales Revenue 28,898 33,043 14.3%
COGS (19,196) (21,896) % of Sales Revenue 66.4% 66.3%
SG&A (2,785) (3,644) % of Sales Revenue 9.6% 11.0%
EBITDA 7,359 8,046 9.3%
Net Profit 5,542 6,050 9.2%
Attributable Profit to Shareholders 5,541 5,696 2.8%
Margin*
EBITDA 25.5% 24.4%
Net Profit 19.2% 18.3%
* margins are % of sales revenue
1H18 (First Half Ended 31 March 2018) Thai Beverage PLC 22
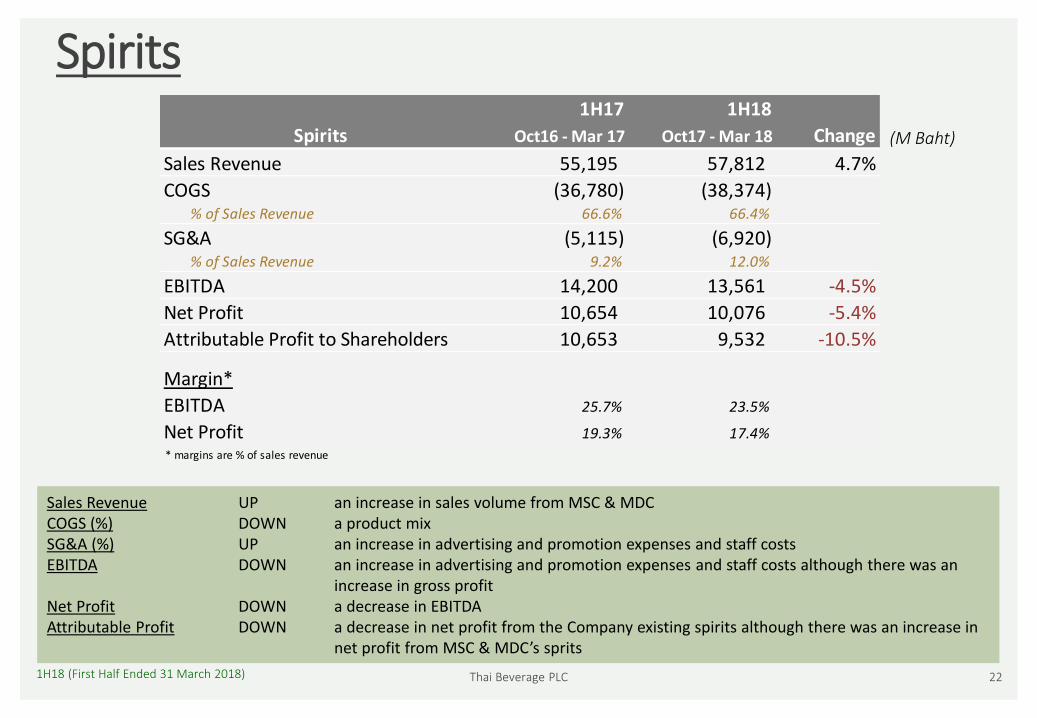
Spirits
(M Baht)
Sales Revenue UP an increase in sales volume from MSC & MDCCOGS (%) DOWN a product mixSG&A (%) UP an increase in advertising and promotion expenses and staff costsEBITDA DOWN an increase in advertising and promotion expenses and staff costs although there was an
increase in gross profitNet Profit DOWN a decrease in EBITDAAttributable Profit DOWN a decrease in net profit from the Company existing spirits although there was an increase in
net profit from MSC & MDC’s sprits
1H17 1H18
Spirits Oct16 - Mar 17 Oct17 - Mar 18 Change
Sales Revenue 55,195 57,812 4.7%
COGS (36,780) (38,374) % of Sales Revenue 66.6% 66.4%
SG&A (5,115) (6,920) % of Sales Revenue 9.2% 12.0%
EBITDA 14,200 13,561 -4.5%
Net Profit 10,654 10,076 -5.4%
Attributable Profit to Shareholders 10,653 9,532 -10.5%
Margin*
EBITDA 25.7% 23.5%
Net Profit 19.3% 17.4%
* margins are % of sales revenue
1H18 (First Half Ended 31 March 2018) Thai Beverage PLC 23
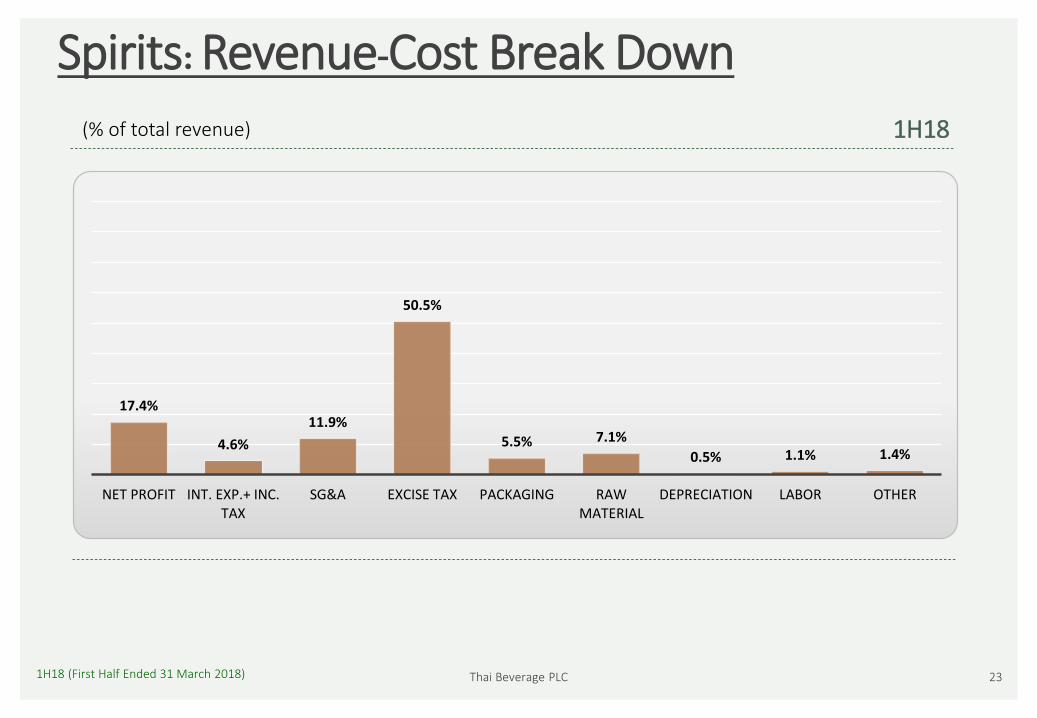
Spirits: Revenue-Cost Break Down
(% of total revenue) 1H18
17.4%
4.6%
11.9%
50.5%
5.5% 7.1%
0.5% 1.1% 1.4%
NET PROFIT INT. EXP.+ INC. TAX
SG&A EXCISE TAX PACKAGING RAW MATERIAL
DEPRECIATION LABOR OTHER
1H18 (First Half Ended 31 March 2018) Thai Beverage PLC 24
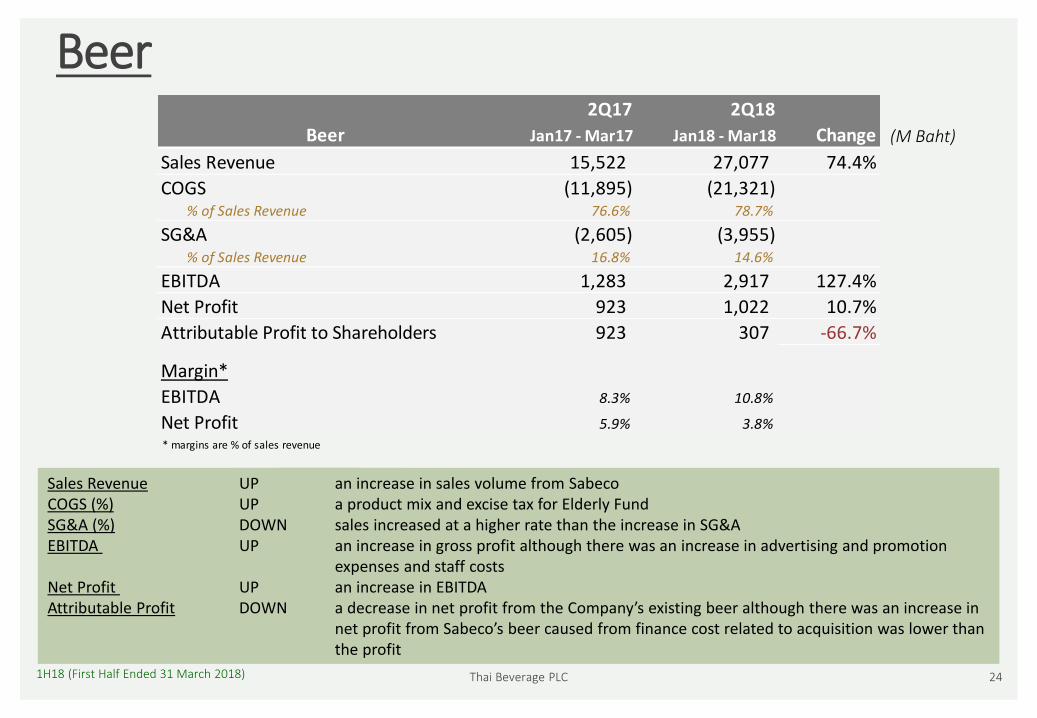
Beer
Sales Revenue UP an increase in sales volume from SabecoCOGS (%) UP a product mix and excise tax for Elderly FundSG&A (%) DOWN sales increased at a higher rate than the increase in SG&AEBITDA UP an increase in gross profit although there was an increase in advertising and promotion
expenses and staff costsNet Profit UP an increase in EBITDA Attributable Profit DOWN a decrease in net profit from the Company’s existing beer although there was an increase in
net profit from Sabeco’s beer caused from finance cost related to acquisition was lower than the profit
(M Baht)
2Q17 2Q18
Beer Jan17 - Mar17 Jan18 - Mar18 Change
Sales Revenue 15,522 27,077 74.4%
COGS (11,895) (21,321) % of Sales Revenue 76.6% 78.7%
SG&A (2,605) (3,955) % of Sales Revenue 16.8% 14.6%
EBITDA 1,283 2,917 127.4%
Net Profit 923 1,022 10.7%
Attributable Profit to Shareholders 923 307 -66.7%
Margin*
EBITDA 8.3% 10.8%
Net Profit 5.9% 3.8%
* margins are % of sales revenue
1H18 (First Half Ended 31 March 2018) Thai Beverage PLC 25
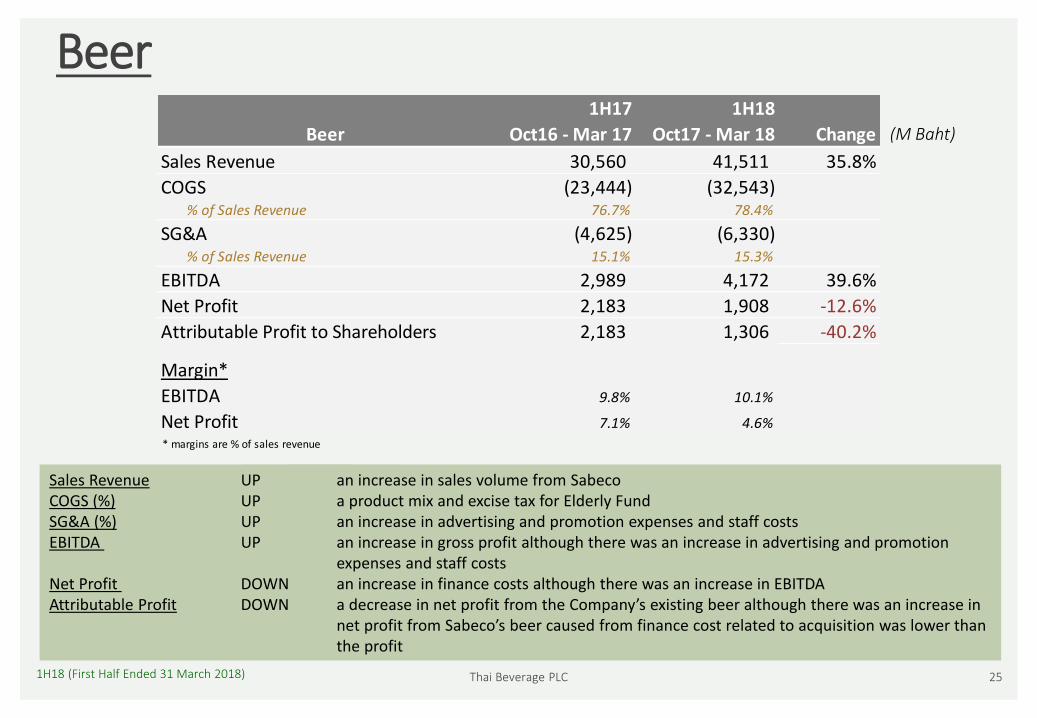
Beer
Sales Revenue UP an increase in sales volume from SabecoCOGS (%) UP a product mix and excise tax for Elderly FundSG&A (%) UP an increase in advertising and promotion expenses and staff costsEBITDA UP an increase in gross profit although there was an increase in advertising and promotion
expenses and staff costsNet Profit DOWN an increase in finance costs although there was an increase in EBITDAAttributable Profit DOWN a decrease in net profit from the Company’s existing beer although there was an increase in
net profit from Sabeco’s beer caused from finance cost related to acquisition was lower than the profit
(M Baht)
1H17 1H18
Beer Oct16 - Mar 17 Oct17 - Mar 18 Change
Sales Revenue 30,560 41,511 35.8%
COGS (23,444) (32,543) % of Sales Revenue 76.7% 78.4%
SG&A (4,625) (6,330) % of Sales Revenue 15.1% 15.3%
EBITDA 2,989 4,172 39.6%
Net Profit 2,183 1,908 -12.6%
Attributable Profit to Shareholders 2,183 1,306 -40.2%
Margin*
EBITDA 9.8% 10.1%
Net Profit 7.1% 4.6%
* margins are % of sales revenue
1H18 (First Half Ended 31 March 2018) Thai Beverage PLC 26
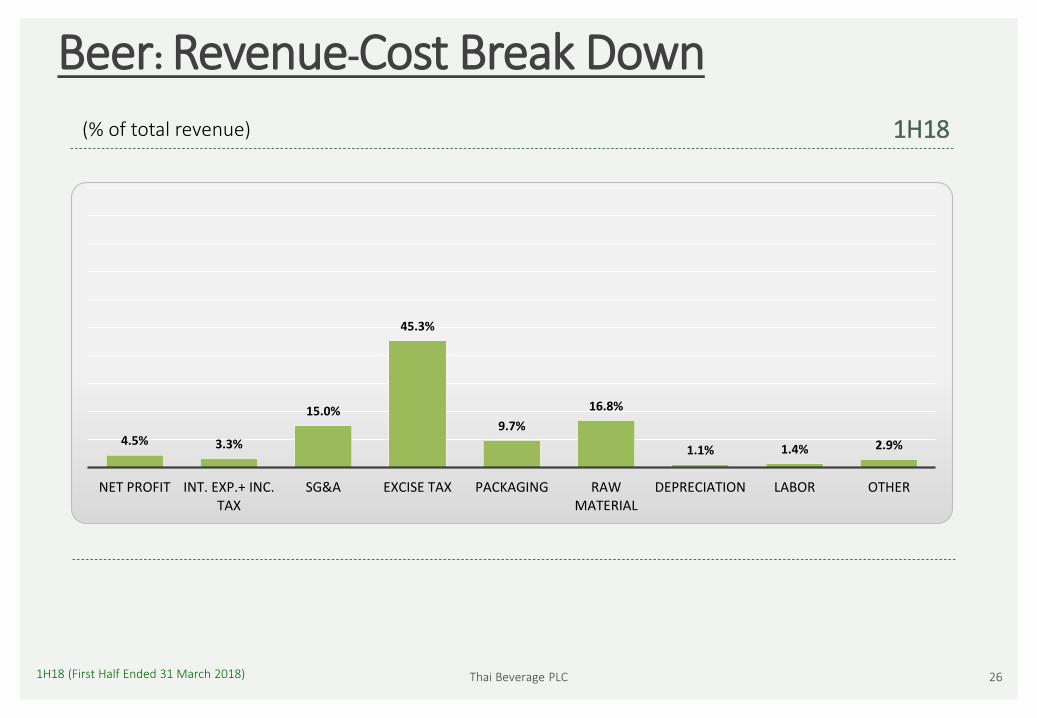
Beer: Revenue-Cost Break Down
(% of total revenue) 1H18
4.5% 3.3%
15.0%
45.3%
9.7%
16.8%
1.1% 1.4% 2.9%
NET PROFIT INT. EXP.+ INC. TAX
SG&A EXCISE TAX PACKAGING RAW MATERIAL
DEPRECIATION LABOR OTHER
1H18 (First Half Ended 31 March 2018) Thai Beverage PLC 27
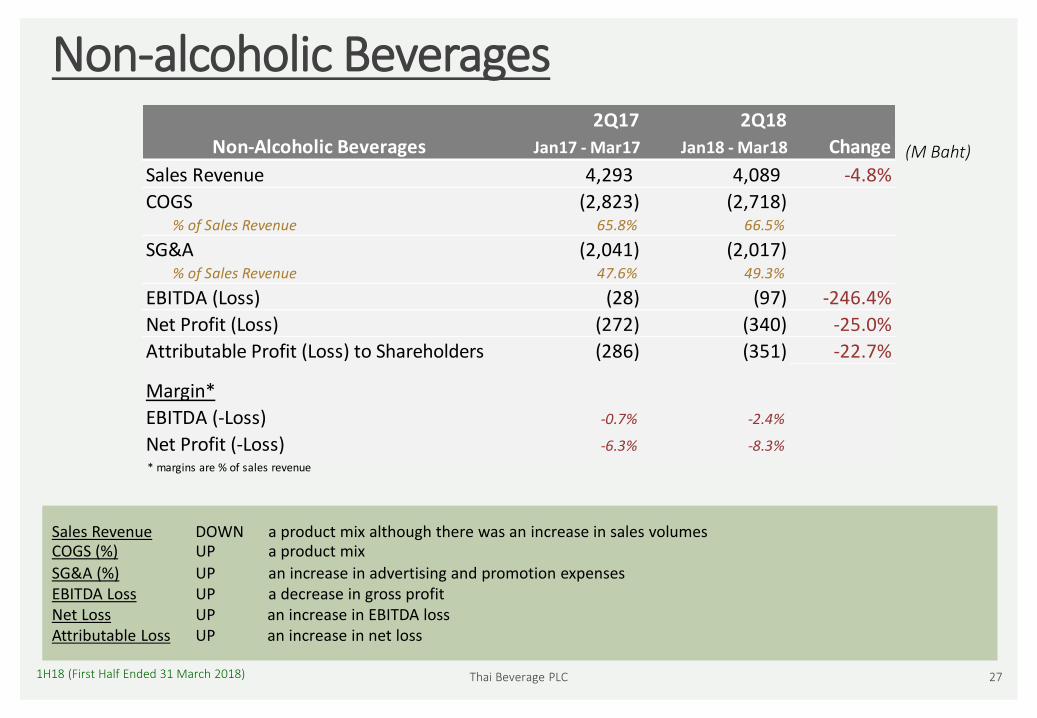
Non-alcoholic Beverages
(M Baht)
Sales Revenue DOWN a product mix although there was an increase in sales volumesCOGS (%) UP a product mix
SG&A (%) UP an increase in advertising and promotion expenses EBITDA Loss UP a decrease in gross profitNet Loss UP an increase in EBITDA lossAttributable Loss UP an increase in net loss
2Q17 2Q18
Non-Alcoholic Beverages Jan17 - Mar17 Jan18 - Mar18 Change
Sales Revenue 4,293 4,089 -4.8%
COGS (2,823) (2,718) % of Sales Revenue 65.8% 66.5%
SG&A (2,041) (2,017) % of Sales Revenue 47.6% 49.3%
EBITDA (Loss) (28) (97) -246.4%
Net Profit (Loss) (272) (340) -25.0%
Attributable Profit (Loss) to Shareholders (286) (351) -22.7%
Margin*
EBITDA (-Loss) -0.7% -2.4%
Net Profit (-Loss) -6.3% -8.3%
* margins are % of sales revenue

1H18 (First Half Ended 31 March 2018) Thai Beverage PLC 28
Non-alcoholic Beverages
(M Baht)
Sales Revenue UP an increase in sales volume COGS (%) UP a product mix and a cost increase from sugar tax
SG&A (%) UP property damages from fire incident at UHT RTD tea plant while insurance claims recoveryin other income
EBITDA Loss UP a decrease in gross profitNet Loss UP a decrease in EBITDAAttributable Loss UP an increase in net loss
1H17 1H18
Non-Alcoholic Beverages Oct16 - Mar 17 Oct17 - Mar 18 Change
Sales Revenue 8,181 8,202 0.3%
COGS (5,316) (5,479) % of Sales Revenue 65.0% 66.8%
SG&A (3,872) (4,494) % of Sales Revenue 47.4% 54.8%
EBITDA (Loss) 7 (47) -771.4%
Net Profit (Loss) (511) (567) -11.0%
Attributable Profit (Loss) to Shareholders (553) (597) -8.0%
Margin*
EBITDA (-Loss) 0.1% -0.6%
Net Profit (-Loss) -6.2% -6.9%
* margins are % of sales revenue
1H18 (First Half Ended 31 March 2018) Thai Beverage PLC 29
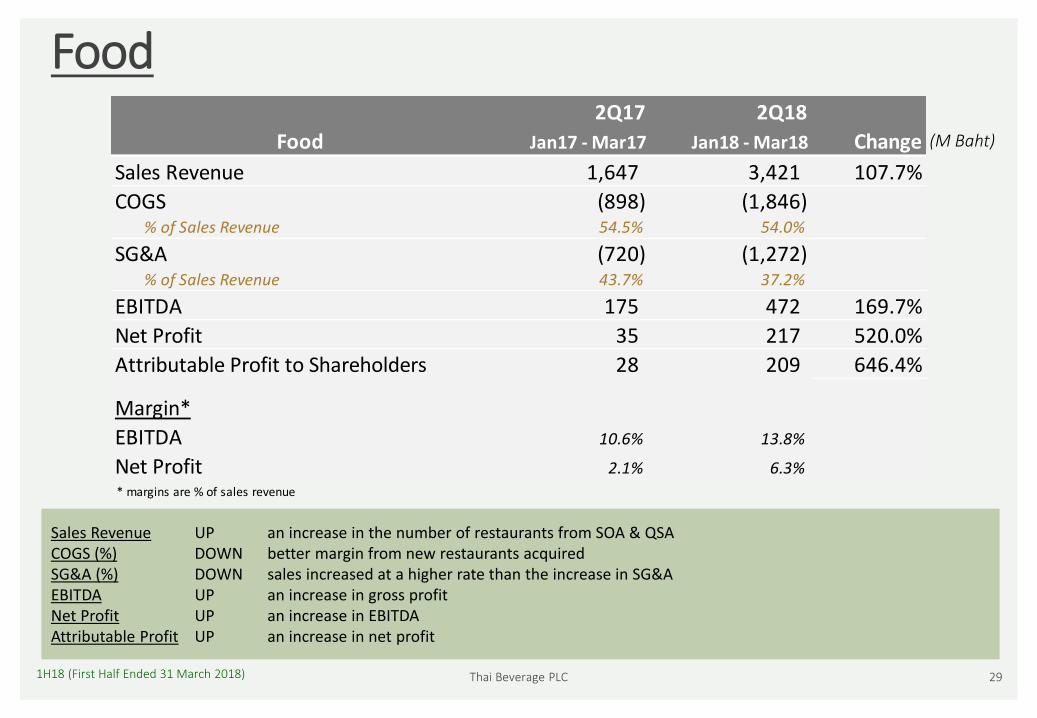
Food
(M Baht)
Sales Revenue UP an increase in the number of restaurants from SOA & QSACOGS (%) DOWN better margin from new restaurants acquiredSG&A (%) DOWN sales increased at a higher rate than the increase in SG&AEBITDA UP an increase in gross profitNet Profit UP an increase in EBITDAAttributable Profit UP an increase in net profit
2Q17 2Q18
Food Jan17 - Mar17 Jan18 - Mar18 Change
Sales Revenue 1,647 3,421 107.7%
COGS (898) (1,846) % of Sales Revenue 54.5% 54.0%
SG&A (720) (1,272) % of Sales Revenue 43.7% 37.2%
EBITDA 175 472 169.7%
Net Profit 35 217 520.0%
Attributable Profit to Shareholders 28 209 646.4%
Margin*
EBITDA 10.6% 13.8%
Net Profit 2.1% 6.3%
* margins are % of sales revenue

1H18 (First Half Ended 31 March 2018) Thai Beverage PLC 30
Food
(M Baht)
Sales Revenue UP an increase in the number of restaurants from SOA &QSACOGS (%) DOWN better margin from new restaurants acquired SG&A (%) DOWN sales increased at a higher rate than the increase in SG&AEBITDA UP an increase in gross profitNet Profit UP an increase in EBITDAAttributable Profit UP an increase in net profit
1H17 1H18
Food Oct16 - Mar 17 Oct17 - Mar 18 Change
Sales Revenue 3,283 5,749 75.1%
COGS (1,822) (3,130) % of Sales Revenue 55.5% 54.4%
SG&A (1,430) (2,198) % of Sales Revenue 43.6% 38.3%
EBITDA 314 801 155.1%
Net Profit 40 326 715.0%
Attributable Profit to Shareholders 33 307 830.3%
Margin*
EBITDA 9.6% 13.9%
Net Profit 1.2% 5.7%
* margins are % of sales revenue
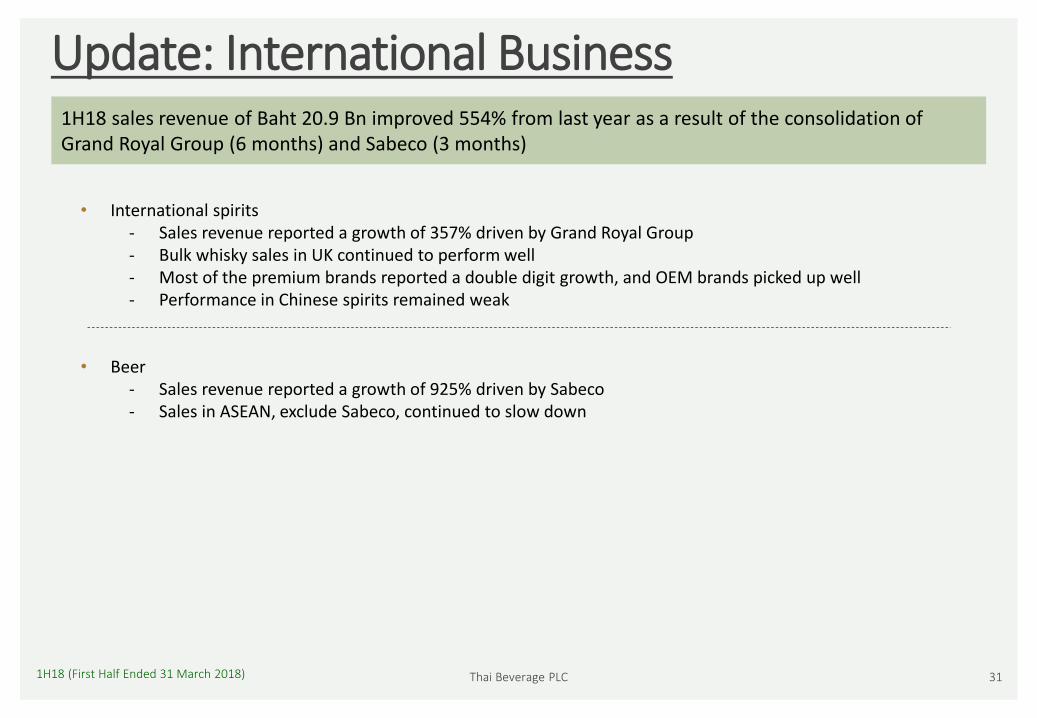
Update: International Business
31Thai Beverage PLC1H18 (First Half Ended 31 March 2018)
• International spirits- Sales revenue reported a growth of 357% driven by Grand Royal Group- Bulk whisky sales in UK continued to perform well- Most of the premium brands reported a double digit growth, and OEM brands picked up well- Performance in Chinese spirits remained weak
• Beer- Sales revenue reported a growth of 925% driven by Sabeco- Sales in ASEAN, exclude Sabeco, continued to slow down
1H18 sales revenue of Baht 20.9 Bn improved 554% from last year as a result of the consolidation of Grand Royal Group (6 months) and Sabeco (3 months)
Thai Beverage PLC 321H18 (First Half Ended 31 March 2018)
Financials
1H18 (First Half Ended 31 March 2018) Thai Beverage PLC 33
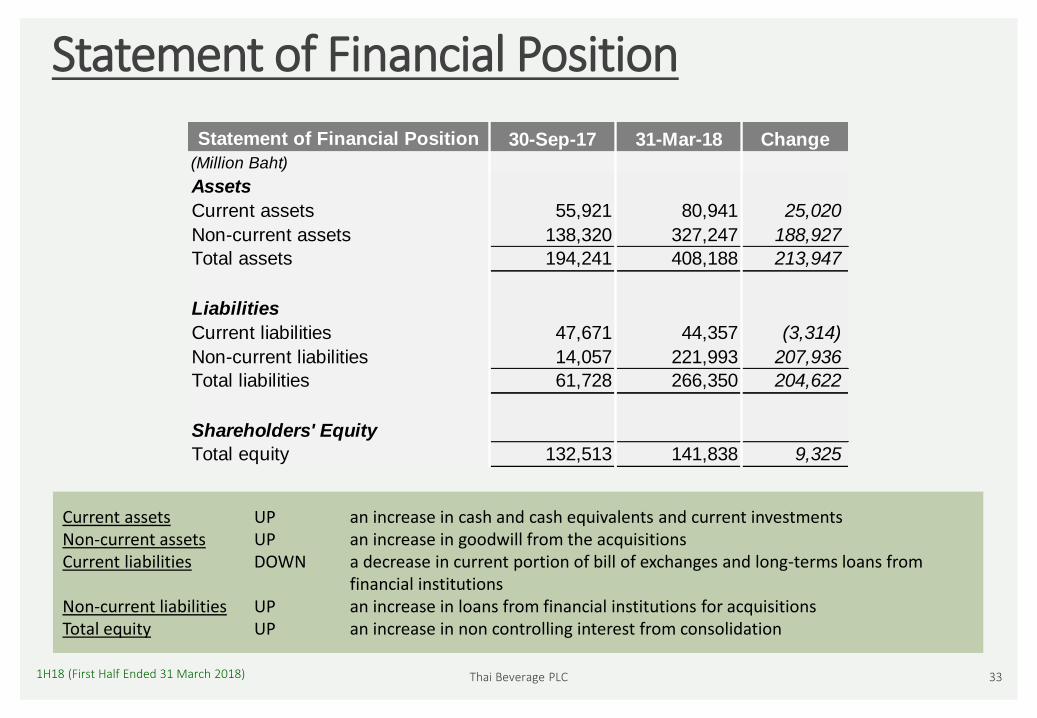
Statement of Financial Position
Current assets UP an increase in cash and cash equivalents and current investmentsNon-current assets UP an increase in goodwill from the acquisitionsCurrent liabilities DOWN a decrease in current portion of bill of exchanges and long-terms loans from
financial institutionsNon-current liabilities UP an increase in loans from financial institutions for acquisitionsTotal equity UP an increase in non controlling interest from consolidation
Statement of Financial Position 30-Sep-17 31-Mar-18 Change
(Million Baht)
Assets
Current assets 55,921 80,941 25,020
Non-current assets 138,320 327,247 188,927
Total assets 194,241 408,188 213,947
Liabilities
Current liabilities 47,671 44,357 (3,314)
Non-current liabilities 14,057 221,993 207,936
Total liabilities 61,728 266,350 204,622
Shareholders' Equity
Total equity 132,513 141,838 9,325
1H18 (First Half Ended 31 March 2018) Thai Beverage PLC 34
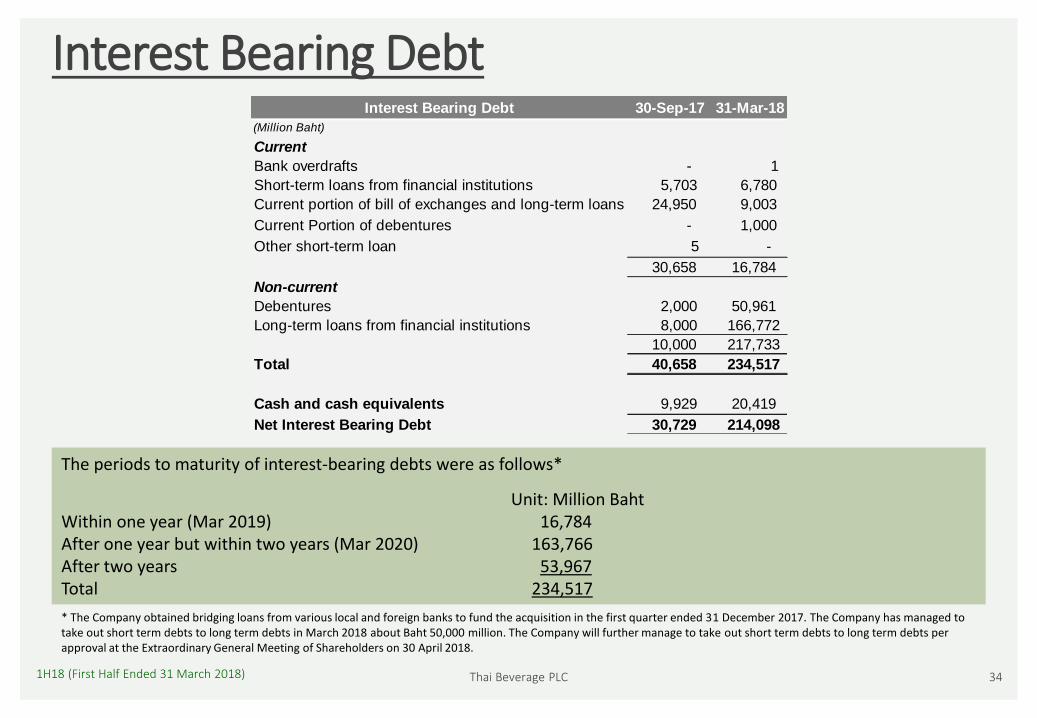
Interest Bearing Debt
The periods to maturity of interest-bearing debts were as follows*
Unit: Million BahtWithin one year (Mar 2019) 16,784 After one year but within two years (Mar 2020) 163,766After two years 53,967Total 234,517
* The Company obtained bridging loans from various local and foreign banks to fund the acquisition in the first quarter ended 31 December 2017. The Company has managed to take out short term debts to long term debts in March 2018 about Baht 50,000 million. The Company will further manage to take out short term debts to long term debts per approval at the Extraordinary General Meeting of Shareholders on 30 April 2018.
Interest Bearing Debt 30-Sep-17 31-Mar-18
(Million Baht)
Current
Bank overdrafts - 1
Short-term loans from financial institutions 5,703 6,780
Current portion of bill of exchanges and long-term loans 24,950 9,003
Current Portion of debentures - 1,000
Other short-term loan 5 -
30,658 16,784
Non-current
Debentures 2,000 50,961
Long-term loans from financial institutions 8,000 166,772
10,000 217,733
Total 40,658 234,517
Cash and cash equivalents 9,929 20,419
Net Interest Bearing Debt 30,729 214,098

1H18 (First Half Ended 31 March 2018) Thai Beverage PLC 35
Financial Ratios
Current Ratio UP an increase in cash and cash equivalents, trade account receivable and a decrease in current portion of bill of exchanges and long-terms loans from financial institutions
Liability to Equity Ratio UP an increase in loans from financial institutions for acquisitions
Note: use 365 days to calculate turnover
Ratios 30-Sep-17 31-Mar-18
Current Ratio (times) 1.17 1.82
Liability to Equity Ratio (Gearing Ratio) (times) 0.47 1.88
Interest Bearing Debt to Equity Ratio (times) 0.31 1.65
Net Interest Bearing Debt to Equity Ratio (times) 0.23 1.51
Net Interest Bearing Debt to EBITDA (times) 0.68 4.27
Net asset value per share (Baht) 5.13 4.96
Net asset value per share (SGD)* 0.22 0.21 * exchange rate at THB 23.5973 : SGD 1
EPS 31-Mar-17 31-Mar-18
Earnings per share for the quarter (Baht) 0.26 0.25
Earnings per share for the six-months period (Baht) 0.57 0.37
Turnover Oct 16 - Sep 17 Oct 17 - Mar 18
A/R Turnover (days) 5 7
Inventory Turnover (days)
Spirit Business: finished goods 56 49
Beer Business: finished goods 14 18
Non-alcohol Business: finished goods 26 23
Food Business: finished goods 2 3

Thai Beverage PLC 361H18 (First Half Ended 31 March 2018)
Thank You