thailand’s competitiveness: meeting the challenges of ... files/thailand_competitiveness... ·...
TRANSCRIPT

Thailand’s competitiveness: Meeting the challenges of globalization and
environmental sustainability
Dr. Christian H. M. KetelsInstitute for Strategy and Competitivenessgy p
Harvard Business SchoolAsia Competitiveness Institute
Lee Kuan Yew School of Public Policy

The Role of Competitiveness
Quality of Life (Prosperity)
Economic Outcomes (Productivity)
Competitiveness
2
Competitiveness is not everything that matters, but without competitiveness everything that matters is much harder to achieve

Traditional Views on Achieving Competitiveness
• Conceptual research has increasingly focused on endogenous growth-models
• Empirical literature has looked at “deep” drivers of prosperity differences; recent work at unsustainable “growth spurts”
• The general principles (Washington consensus, etc.) derived from this work provide often insufficient guidance to policy makers
• Emerging consensus for policy advice to become more context-, i.e. country-specificcountry-specific
• But without a clear framework, the move from general recipes to country-specific approaches opens the door for old-style intervention
• The competitiveness framework offers a systematic structure to make
3
• The competitiveness framework offers a systematic structure to make evidence-based policy choices in a concrete situation
© Christian Ketels, 2009

Mi i C titi
The Competitiveness Framework
Microeconomic Competitiveness
Quality of the NationalBusiness
Sophisticationof Company
Operations andState of ClusterDevelopment
Macroeconomic Competitiveness
BusinessEnvironment
Operations andStrategy
Development
Macroeconomic Competitiveness
Quality of Macroeconomic
Policy
SocialInfrastructure and PoliticalInstit tions yInstitutions
EndowmentsEndowments
SizeNaturalResources
GeographicLocation
4

Macroeconomic Competitiveness
Social Quality of Macroeconomic
Policy
SocialInfrastructure and PoliticalInstitutions
Political institutions• Set the context for policy
decisions on all dimensions of competitiveness
Monetary policy• Ensure the effectiveness of price
signals for economic choicescompetitiveness
Rule of law• Provide fundamental conditions
for the functioning of markets
Fiscal policy• Keep spending within government’s
intertemporal budget constraint• Reduce cyclical fluctuations of thefor the functioning of markets
Basic human capacity• Provide fundamental capacity
for economic activities beyond
• Reduce cyclical fluctuations of the economy
Financial system management• Avoid the build up of unsustainablefor economic activities beyond
the subsistence level• Avoid the build-up of unsustainable
internal and external imbalances
• Institutions critical in the long-term but hard to change in the short-term
5
Institutions critical in the long term but hard to change in the short term• Macroeconomic policies more amendable to reform but often unsustainable if
not matched by policy changes in other areas© Christian Ketels, 2009
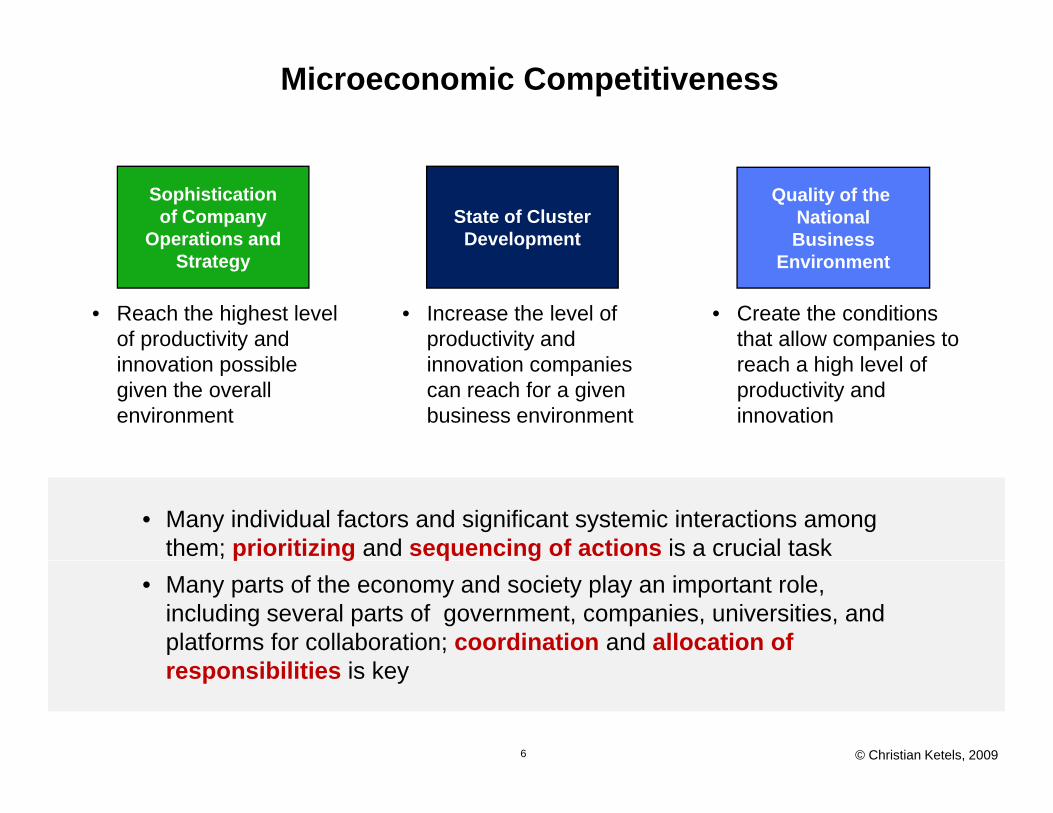
Microeconomic Competitiveness
Quality of the NationalBusiness
Sophisticationof Company
Operations andState of ClusterDevelopment
EnvironmentStrategy
• Create the conditions that allow companies to
• Reach the highest level of productivity and
• Increase the level of productivity and
reach a high level of productivity and innovation
innovation possible given the overall environment
innovation companies can reach for a given business environment
• Many individual factors and significant systemic interactions among them; prioritizing and sequencing of actions is a crucial task p g q g
• Many parts of the economy and society play an important role, including several parts of government, companies, universities, and platforms for collaboration; coordination and allocation of
ibiliti i k
6
responsibilities is key
© Christian Ketels, 2009

Microeconomic Foundations of DevelopmentTypical Company Weaknesses in Emerging Economies
Corporate Direction
• Opportunistic pursuit
Corporate Direction
• Opportunistic pursuit
Activities
• Labor intensive parts
Activities
• Labor intensive parts
Strategic Positioning
• Focus on the local
Strategic Positioning
• Focus on the localOpportunistic pursuit of new businesses, seizing profitable opportunities in whatever area they
Opportunistic pursuit of new businesses, seizing profitable opportunities in whatever area they
Labor intensive parts of the value chain are emphasized
• Low investment in
Labor intensive parts of the value chain are emphasized
• Low investment in
Focus on the localmarket
• Wide product linesserving all local industry
Focus on the localmarket
• Wide product linesserving all local industry
whatever area they arise
• Strategy driven by government and other
whatever area they arise
• Strategy driven by government and other
machinery, equipment, brands, R&D, and training
• Foreign partners
machinery, equipment, brands, R&D, and training
• Foreign partners
segments
• Price is the primary basis of competition
segments
• Price is the primary basis of competition
grelationships
• Conglomerate business groups
t i hi hl
grelationships
• Conglomerate business groups
t i hi hl
• Foreign partnersprovide many inputs, know how, and financing
• Foreign partnersprovide many inputs, know how, and financing
• Low input costs are primary competitive advantage
• Emulate foreign best
• Low input costs are primary competitive advantage
• Emulate foreign bestcompete in highly disparate businessescompete in highly disparate businesses
• Emulate foreign best practices
• Imitate products and services of foreign and
• Emulate foreign best practices
• Imitate products and services of foreign and
7
gother domestic competitors
gother domestic competitors

Context for Firm
Productivity and the Business Environment
Strategy and Rivalry
A local context and rules that encourage investment and
Factor(Input)
ConditionsDemand
Conditions
gsustained upgrading
–e.g., Intellectual property protection
Meritocratic incentive systems across all major institutions
Sophisticated and demanding local customer(s)Local customer needs that anticipatethose elsewhere
Presence of high quality, specialized inputs available to firms
Human resources
across all major institutionsOpen and vigorous competition among locally based rivals
Related and Supporting Industries
those elsewhereUnusual local demand in specialized segments that can be served nationally and globally
–Human resources–Capital resources–Physical infrastructure–Administrative infrastructure–Information infrastructure–Scientific and technological
infrastructure–Natural resources
Access to capable, locally based suppliersand firms in related fieldsPresence of clusters instead of isolated industries
8
• Successful economic development is a process of successive economic upgrading, in which the business environment in a nation evolves to support and encourage increasingly sophisticated ways of competing
Source: Michael Porter

3.5%
National Export PortfolioThailand, 1997 to 2007
Change In Thailand’s Overall
3.0%
7
gWorld Export Share: +0.044%
Plastics
Information TechnologyFishing & Fish Products(-2.2%, 6.5%)
2.5%
arke
t sha
re, 2
007
Construction Materials
Motor Driven Products
1.5%
2.0%
wor
ld e
xpor
t ma
AgriculturePublishing and Printing
Jewelry, Precious Metals and Collectibles
Sport
F t ( 1 53%)
Building Fixtures and Equipment
Entertainment and Reproduction Equipment
Analytical Instruments
Lighting and Electrical Equipment
1.0%Thai
land
’s
Thailand’s Average World Export Share: 1.08%
and PrintingApparel
Textiles
Transportation and LogisticsChemical Products
Communications Equipment
FurnitureFootwear (-1.53%)
LeatherProcessed FoodsPower Generation Automotive
Analytical Instruments
Aerospace Vehicles
Construction Services
0.5%Metal, Mining and Manufacturing
Communication Services
Oil & Gas
Transportation and Logistics
Biopharmaceuticals
Production TechnologyPrefabricated Enclosures and Structures
Business Services
Financial Services
Heavy MachineryForest Products
Marine Equipment
Construction Services
Medical Devices
Tobacco
9
0.0%-1.5% -1.0% -0.5% 0.0% 0.5% 1.0% 1.5%
Change in Thailand’s world export market share, 1997 to 2007Source: Prof. Michael E. Porter, International Cluster Competitiveness Project, Institute for Strategy and Competitiveness, Harvard Business School; Richard Bryden, Project Director. Underlying data drawn from the UN Commodity Trade Statistics Database and the IMF BOP statistics.
Exports of US$4.3 Billion =
Financial Services

The Thai Automotive Cluster: The Geographic Dimension
Ayudhaya
Pathumthani• Thai Suzuki Motor• and 39 suppliers
Chachoengsao• Toyota Motor Thailand• Isuzu Motors (Thailand)
Bangkok• Bangchan General Assembly
Samutprakarn• Toyota Motor Thailand• Isuzu Motors (Thailand)• Siam Nissan Automobile• Siam V M C Automobile
y y• Honda Automobile (Thailand)
• Bangchan General Assembly• Y.M.C. Assembly
• Thai Honda Manufacturing• and 232 suppliers
• Siam V.M.C. Automobile• Thai Auto Work
• International Vehicles• Thai Yamaha Motor
• Thai Swedish Assembly• Hino Motors (Thailand)• Thonburi AutomotiveThonburi Automotive
Assembly
Samutsakorn• Thai Rung Union Car
Rayong• Auto Alliance (Thailand)
Chonburi• 55 suppliers
• General Motors (Thailand)
• BMW Manufacturing (Thailand)
• Kawasaki Motors Enterprise (Thailand)
Samutprakarn• 158 suppliers
10Source: Vanichseni: Development of Automotive Industry Master Plan (2002)
• MMC Sittipol• and 41 suppliers
© Christian Ketels, 2009

The Thai Automotive Cluster: The Activity Dimension
A bl
Motor-cycles
Pickup Trucks
Steel
PlasticsFinance
DistributionAssemblers
Passenger Cars
Electronics
Rubber&Tires
Testing
Components and Module Makers(1st tier)
Engines, Drivetrains, Steering, Suspension, Brake, Wheel, Tire, Bodyworks, Interiors, Electronics and Electrical Systems
Specialized Consultants
Leather &Fabric
Glass
ServicesParts (2nd & 3rd tiers)
Stamping, Plastics, Rubber, Machining, Casting, Forging, Function, Electrical, Trimming
Fabric
Machinery
Services
Globally Competitive
Regionally Competitive
G tEducation and
T h i l A i ti
Tools
Mold&Die
Regionally Competitive
Nationally Significant
Nationally Insignificant
11
Government Technical Institutions
AssociationsJig&Fixture
Source: Sasin-team analysis, 2003 study

Clusters and Competitiveness
Static (Leverage)
Dynamic (Upgrade)
ENHANCE
(Leverage) (Upgrade)
Clusters Other Dimensions of Competitiveness
ENABLEENABLE
• Co-location of companies and other institutions affecting the potential for
• Economic fundamentals that set the productivity level companies can reach
local value creation within a given economic field through spillovers and linkages
within a given geographic location
12 © Christian Ketels, 2009

Clusters Enhancing Competitiveness:Leveraging Existing Assets
Local ExternalitiesLocal ExternalitiesProductivity
• Common labor markets• Specialized suppliers• Specialized infrastructure
New Business Formationp
• Knowledge Spillovers • Competitive pressure
Formation
Innovation
13 © Christian Ketels, 2009

POLICYPOLICYEnabling the
Emergence of Clusters
Location Existing ClustersLocation Existing Clusters
Business Environment
Natural Resources Entrepreneurs
C t t f titi i
14
Context for competition across regions
© Christian Ketels, 2009
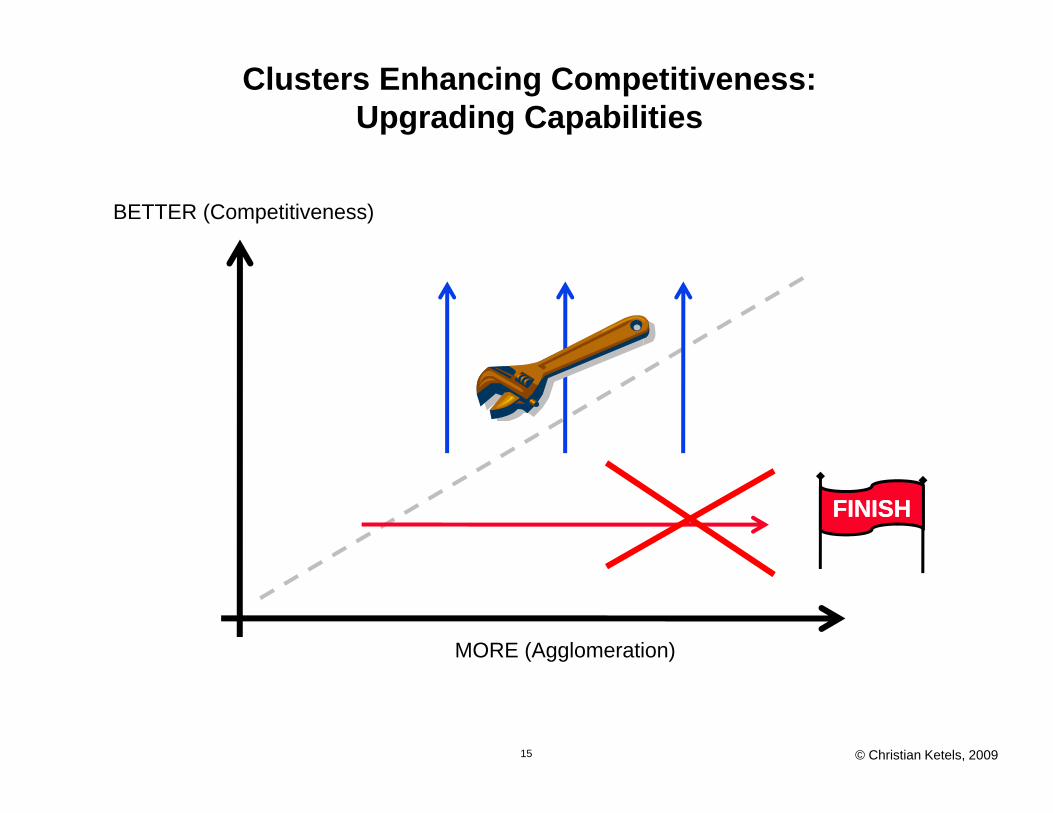
Clusters Enhancing Competitiveness:Upgrading Capabilities
BETTER (Competitiveness)
FINISHFINISH
MORE (Agglomeration)
15
1515
© Christian Ketels, 2009

Target Public Policy at Clusters
Science and TechnologyInfrastructure
Education and Workforce TrainingBusiness Attraction
Clusters
Infrastructure (e.g., centers, university departments, technology transfer)
Export Promotion
ClustersSetting standardsMarket Information
and Disclosure
Specialized Physical Infrastructure
Natural Resource Protection
Environmental Stewardship
Natural Resource Protection
16
• Clusters provide a framework for organizing the implementation of public policy and public investments towards economic development

What are Cluster Initiatives?
Cluster initiatives are collaborative activities by a group of companies, public sector entities, and other related institutions with the objective to improve the competitiveness of a
group of interlinked economic activities in a specific geographic region
• Upgrading of ti
• Upgrading of cluster-ifi b icompany operations
and strategies across a group of companies
specific business environment conditions
p
• Strengthening of networks to enhance
ill d th
17
spill-overs and other economic benefits of clusters
© Christian Ketels, 2009

Clusters and Structural Change
• Cluster policy is most effective if it focuses on existing clusters
BUTBUT
• For many economies the challenge is to broaden or change the portfolio of clusters they are inportfolio of clusters they are in
Direction of structural change• Natural structural change occurs
Management of structural change• Depending on their maturity, atu a st uctu a c a ge occu s
through growth in fields related to activities already present
• Encourage diversification into
epe d g o t e atu ty,clusters differ in their likelihood of success and policy needs
• Manage clusters as a portfolio
18
related clusters o Existing clusterso Emerging clusterso New clusters
© Christian Ketels, 2009

What is Different about Cluster-Based Policy?
Broader Set of Industries
RegionalPerspective
Public-PrivateCollaboration
ProductivityFFocus
EnhancingOwn Strength
Demand-driven
Approach
19
pp
© Christian Ketels, 2009

Policy Levels Influencing Competitiveness
World EconomyWorld Economy WTO
Broad Economic AreasBroad Economic Areas
G fG f
South-East Asia
G t M k
• The business environment at a given location is the cumulative outcome of
Groups of Groups of Neighboring Neighboring NationsNations
Greater Mekong Region policy at all levels of geography
• Microeconomic competitiveness raises the importance of lower levels of geography
NationsNations Thailandlevels of geography
• The allocation of responsibilities across levels of geography is a crucial policy challenge
States, ProvincesStates, Provinces Thai provinces
20
Metropolitan and Rural AreasMetropolitan and Rural Areas Bangkok
© Christian Ketels, 2009

The Process of Economic DevelopmentShifting Roles and Responsibilitiesg p
Old Model
G t d i i
New Model
E i d l t i• Government drives economic development through policy decisions and incentives
• Economic development is a collaborative process involving government at multiple levels, companies teaching andcompanies, teaching and research institutions, and private sector organizations
• Competitiveness is the result of both top-down and bottom-up
21
p p pprocesses in which many individuals, companies, and institutions take relevant decisions
© Christian Ketels, 2009

Observations so Far
• Many things matter for prosperity, but there are systematic differences between groups of factors
– Macroeconomic strengths create opportunitiesMacroeconomic strengths create opportunities– Microeconomic strengths translate opportunities into results
• The increasing importance of microeconomic factors requires a• The increasing importance of microeconomic factors requires a qualitatively different policy approach
– From identifying right policy targets to sequencing the right policy areas– From narrow interventions to integrated policiesg p– From “horizontal” policies to a mix of general and cluster-specific policies– From national policies to leveraging all geographic levels of government– From public-sector driven policy to public-private dialogue
• Economies need to make progress on all dimensions, but trying to move on all fronts simultaneously often leads to failure
C f f
22
– Crucial role of country analysis to arrive at a context-specific action strategy without compromising on standard economic logic
© Christian Ketels, 2009

From Analysis to Action
Analysis Integration Roll-OutPrioritizationAnalysis Integration Roll OutPrioritization
Integrated set of activitiesInternal
NationalWeaknesses Strengths
TargetedCampaigns:e g Cluster
Economy-wide roll-
EconomicStrategy
&+-
Threats Opportunities
e.g. Cluster, FDI, or SEZ out
NationalCompetitivenessAction Agenda
Institution with cross-cutting
authority
External
N ti l
23
National Competitiveness
Council
© Christian Ketels, 2009

Defining a National Economic Strategy
National Economic StrategyNational Economic Strategy
• What can be the unique competitive position of the country/region given its location legacy endowments andcountry/region given its location, legacy, endowments, and potential strengths?
– What is its unique value as a business location?– What role can it play with neighbors?
I h t f l t d th ti l?– In what range of clusters does the nation excel?
Developing Unique StrengthsDeveloping Unique Strengths Achieving and Maintaining Parity Achieving and Maintaining Parity with Peerswith Peers
• What are the key potential strengths that • What weaknesses must be neutralized toWhat are the key potential strengths that the country/region must preserve or build?
What weaknesses must be neutralized to achieve parity with peer countries?
• A national economic strategy provides strategic orientation on the type of business environment that the
24
gy p g ypcountry/region aims to provide; it is not a plan that sets production or investment targets
• A national economic strategy is only effective, if it reflects a consensus view; it fails, if its implementation is based on government action and incentives/sanctions alone
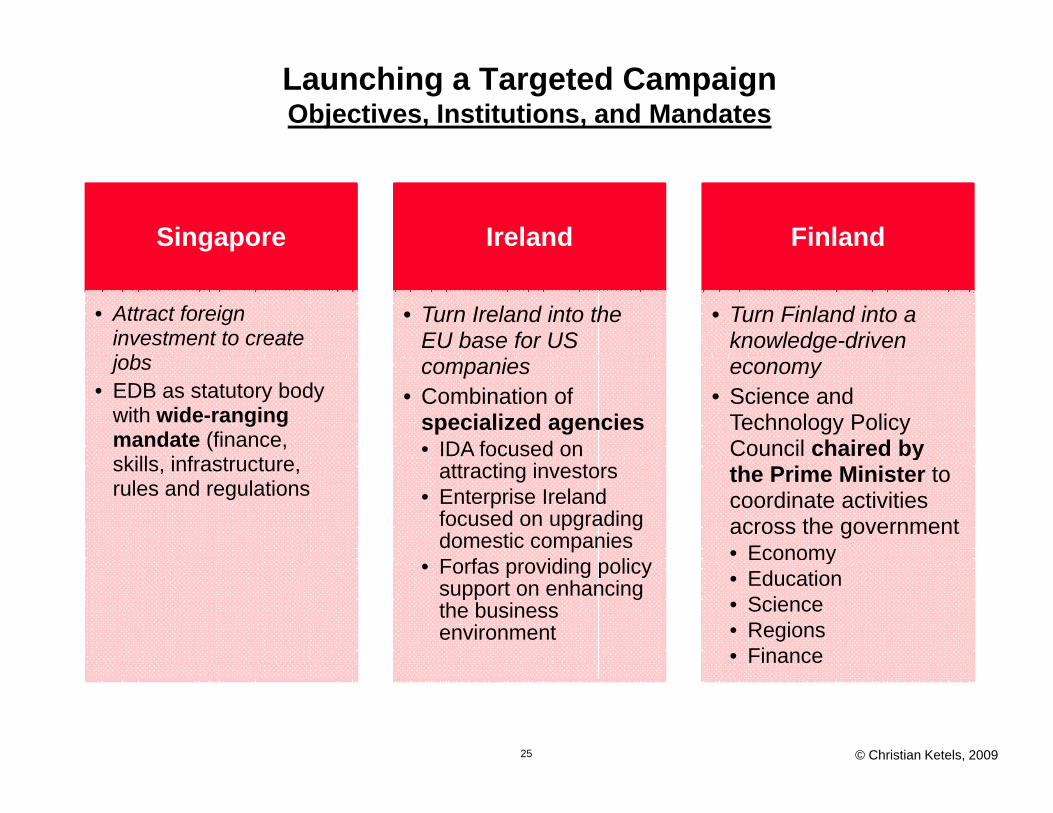
Launching a Targeted CampaignObjectives, Institutions, and Mandates
Singapore Ireland Finland
• Attract foreign investment to create j b
• Turn Ireland into the EU base for US
• Turn Finland into a knowledge-driven
jobs• EDB as statutory body
with wide-ranging mandate (finance, kill i f t t
companies• Combination of
specialized agencies• IDA focused on
economy• Science and
Technology Policy Council chaired by
skills, infrastructure, rules and regulations
attracting investors • Enterprise Ireland
focused on upgrading domestic companiesF f idi li
ythe Prime Minister to coordinate activities across the government • Economy• Forfas providing policy
support on enhancing the business environment
y• Education• Science• Regions• Finance
25
a ce
© Christian Ketels, 2009
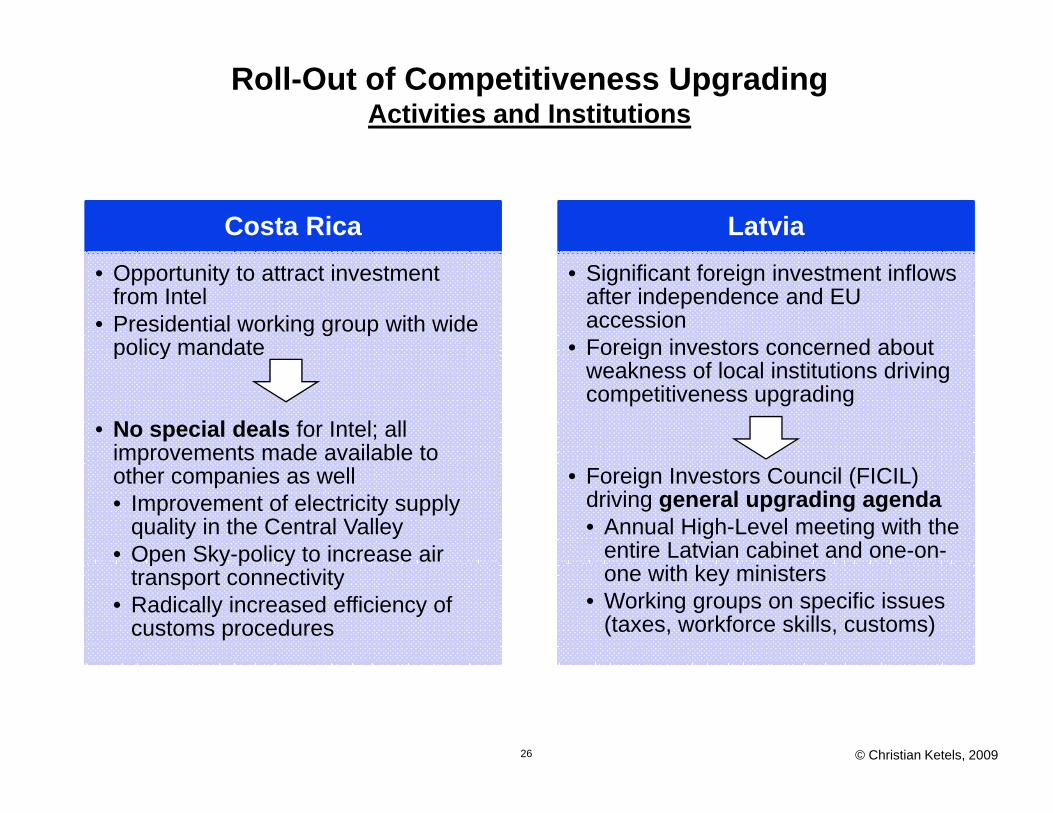
Roll-Out of Competitiveness UpgradingActivities and Institutions
Costa Rica Latvia• Opportunity to attract investment
from Intel• Presidential working group with wide
policy mandate
• Significant foreign investment inflows after independence and EU accession
• Foreign investors concerned about p y
• No special deals for Intel; all improvements made available to
gweakness of local institutions driving competitiveness upgrading
improvements made available to other companies as well• Improvement of electricity supply
quality in the Central Valley• Open Sky-policy to increase air
• Foreign Investors Council (FICIL) driving general upgrading agenda• Annual High-Level meeting with the
entire Latvian cabinet and one-on-Open Sky policy to increase air transport connectivity
• Radically increased efficiency of customs procedures
one with key ministers• Working groups on specific issues
(taxes, workforce skills, customs)
26 © Christian Ketels, 2009

From Insight to Action
What to do How to get it done
• Consensus• Institutional structure• Leadershipp• External environment
27 © Christian Ketels, 2009

Where to Start: The Crucial Role of Analysis
ProductivityEquality Purchasing
O t
y
Labor utilization
Quality of Lifeg
Power
Environmental Outcomes
I i
Labor utilization
Entrepreneurship
conditions
Intermediate Indicators
Innovation
FDI flowsInvestment
Exports/Imports
p p
Competitiveness CorruptionKnowledge
Exports/Imports
Competitiveness
GlobalGovernance
CorruptionKnowledge Economy
28
Global Competitiveness
ReportDoing Business
Logistical Performance Index
© Christian Ketels, 2009

PPP-adjusted GDP per Capita 2008 ($USD)
Prosperity PerformanceSelected Lower and Middle Income Countries
$ $
$25 000
$30,000Capita, 2008 ($USD)
Czech R bli
Israel
Slovenia
South KoreaNew Zealand
UAE Greece ($30,650)
Asian countries
Japan ($34,590) Taiwan ($36,400)
$20,000
$25,000Bahrain Oman
Republic
Saudi Arabia
Estonia
Li h i
Slovakia
Hungary
Cyprus
Portugal
Other countries
$15,000
LatviaCroatia
Russia
Lithuania
Mexico Chile Argentina
Poland
MalaysiaPanama
V l
Libya
Trinidad & Tobago
$10,000 South AfricaThailand
Costa RicaBrazil
Turkey
Belize
yBulgaria
Dominican RepublicColombia
Romania Uruguay
Bosnia Peru
Venezuela
Kazakhstan
Belarus
Lebanon
Algeria
Iran
$5,000China
VietnamHonduras
India
Egypt
Philippines
Sri Lanka
Ukraine
GuatemalaGeorgiaJordan Paraguay
Nicaragua
Guyana
BoliviaEl Salvador
AlbaniaEcuador Tunisia
PakistanPapua New G i ( 3 15%) CambodiaLaos
Indonesia
29
$00% 2% 4% 6% 8% 10% 12% 14%
Growth of Real GDP per Capita (PPP-adjusted), CAGR, 2004 to 2008
Guinea (-3.15%) CambodiaLaosBangladesh
Source: EIU (2009), authors calculations

Comparative Economic PerformanceReal GDP Growth Rates Over Time
12%
Compounded annual growth rate
(CAGR) of real GDP
10%
Vietnam
6%
8% ChinaThailandIndia
4%MalaysiaIndonesiaBrazil
0%
2% Philippines
30
1980-1989 1990-1999 2000-2004 2005-08
Source: EIU (2009), authors calculations

Income InequalitySelected CountriesGini Index
50
60
40
20
30
10
0
31
Note: Most recent Gini index data available for each country (1997 – 2007)Source: World Bank, World Development Indicators, 2009

Environmental Quality
100
EPI Score, 100 = best value
Objectives Policy Categories
60
80
40 ThailandAsia Pacific
0
20 4th Income Group
32Source: Yale Environmental Performance Index 2008

Decomposing Prosperity
Prosperity
Per Capita IncomeDomestic
Purchasing pgPower
• Consumption taxes• Efficiency of local
Labor Productivity
Labor Utilization
industries• Level of local market
competition
Productivity Utilization
• Skills• Capital stock• Total factor productivity
• Working hours• Unemployment• Participation rate
33
• Total factor productivity– Efficiency– Technology
• Participation rate– Population age profile
© Christian Ketels, 2009

$90,000
Comparative Labor ProductivitySelected CountriesReal GDP per employee (PPP
adjusted US$), 2008
$80,000
$90,000USA
Ireland
FranceUK
Hong Kong
Other countriesAsian countries
$60,000
$70,000Australia
Germany
Slovenia
Japan
Saudi ArabiaItaly
UK
Spain Oman
Taiwan
Israel
Greece
Singapore
Kuwait
$40,000
$50,000
T k
New Zealand Slovakia
Poland
KoreaCzech Republic
Croatia
United Arab Emirates
Lithuania
HungaryCyprus
$20,000
$30,000
TurkeyMexico
Iran
Brazil
MalaysiaArgentina
Russia
PeruT i i
RomaniaSouth Africa
Chile
Kazakhstan
Latvia
$10,000
$ ,
Pakistan
Brazil
Senegal
China (10.1%)
Ghana
PhilippinesIndonesia
VietnamIndia
Cameroon
ThailandAlgeria EgyptTunisia
Morocco
Cote d’IvoireMozambique
BangladeshNigeriaKenya
Syria
CambodiaYemen
UkraineJordanSri Lanka (8.1%)
34
$0-2% 0% 2% 4% 6% 8%
Growth of real GDP per employee (PPP-adjusted), 2004 to 2008
Source: authors calculation Groningen Growth and Development Centre (2009), EIU (2009)
Senegal Ghana Mozambique

Understanding Productivity Growth
Economy Sector
Skill Upgrading,Capital Deepening,
and TFP
Structural Change
Firm
Entry, Exit, and Internal
Restructuring
35 © Christian Ketels, 2009

Total Factor Productivity GrowthSelected Countries
Last 15 years Last 6 years Last 3 years
China China China
India Hong Kong Hong Kong
Singapore Turkey India
Thailand India Philippines
High
Vietnam Philippines Turkey
South Korea Thailand Malaysia
Malaysia Malaysia IndonesiaMalaysia Malaysia Indonesia
Turkey Indonesia Vietnam
Philippines Singapore Thailand
Hong Kong Vietnam South Korea
Indonesia South Korea Brazil
Brazil South Africa SingaporeLow
36
Mexico Brazil Mexico
Source: EIU (2009) © Christian Ketels, 2009

Labor Force UtilizationParticipation Rates, Selected Countries
Labor Force Participation
60%
65%
pRate, 2008
China KuwaitSingapore
I l dOther countriesAsian countries
55%Germany
USAJapan
AustraliaDenmark Russia
VietnamThailand
Iceland
IrelandLatviaEstonia
UK
NorwayCanadaSweden
New ZealandFinland
United Arab Emirates
Hong Kong
Papua New Guinea
45%
50%South Korea
Slovenia
USASlovakiaBrazil
IndonesiaIndia
Chile
Lithuania
Bangladesh
France Macedonia
SpainCyprus
Ukraine
UK
HAustria
Greece
Netherlands
It l
Finland
Taiwan
Poland
35%
40%Mexico
ArgentinaPhilippines Malaysia
Croatia
TunisiaBulgariaSouth Africa
Colombia
Cote d’IvoireMoldova
Nigeria
Israel
Hungary Italy
Sri Lanka (-3.59%)
30% Pakistan
Turkey AlbaniaEgypt
Libya
Saudi Arabia
g
YemenSyriaJordan
Iran
37Source: Economist Intelligence Unit (2009)
25%-3% -2% -1% 0% 1% 2% 3% 4% 5%
Change in Labor Force Participation Rate, 2004 to 2008
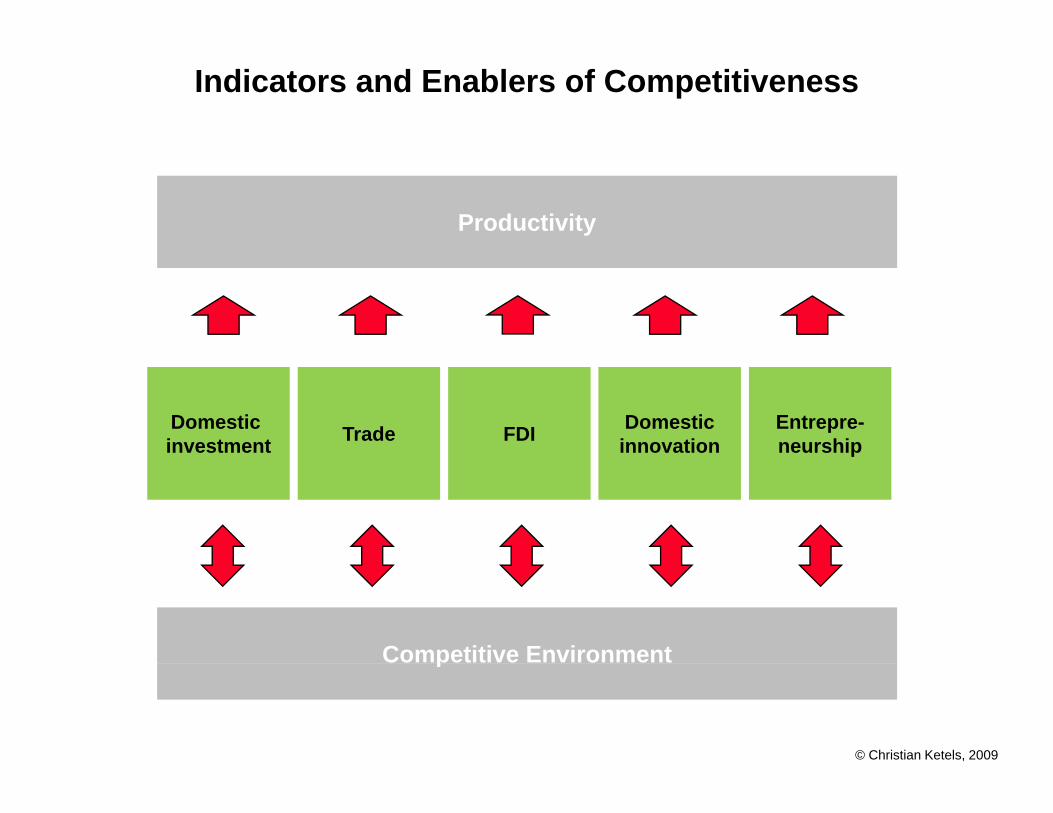
Indicators and Enablers of Competitiveness
Productivity
Domestic investment FDI Entrepre-
neurshipDomesticinnovationTrade
Competitive Environment
38
p
© Christian Ketels, 2009

Trade OpennessSelected Countries
Exports/Imports
100%
+44%-7%
+83%
(% of GDP), 2008
%
80%
Exports
+41% +34%+21%
0% 36%
Change in trade as % of GDP since 2003
40%
60% ExportsImports
0% +36%
-23% +17% +17%
-8% 1% +8%
20%
-1% +8%+19% +1%
+11%-1%
-9%
0%
39Source: EIU (2008), authors’ analysis
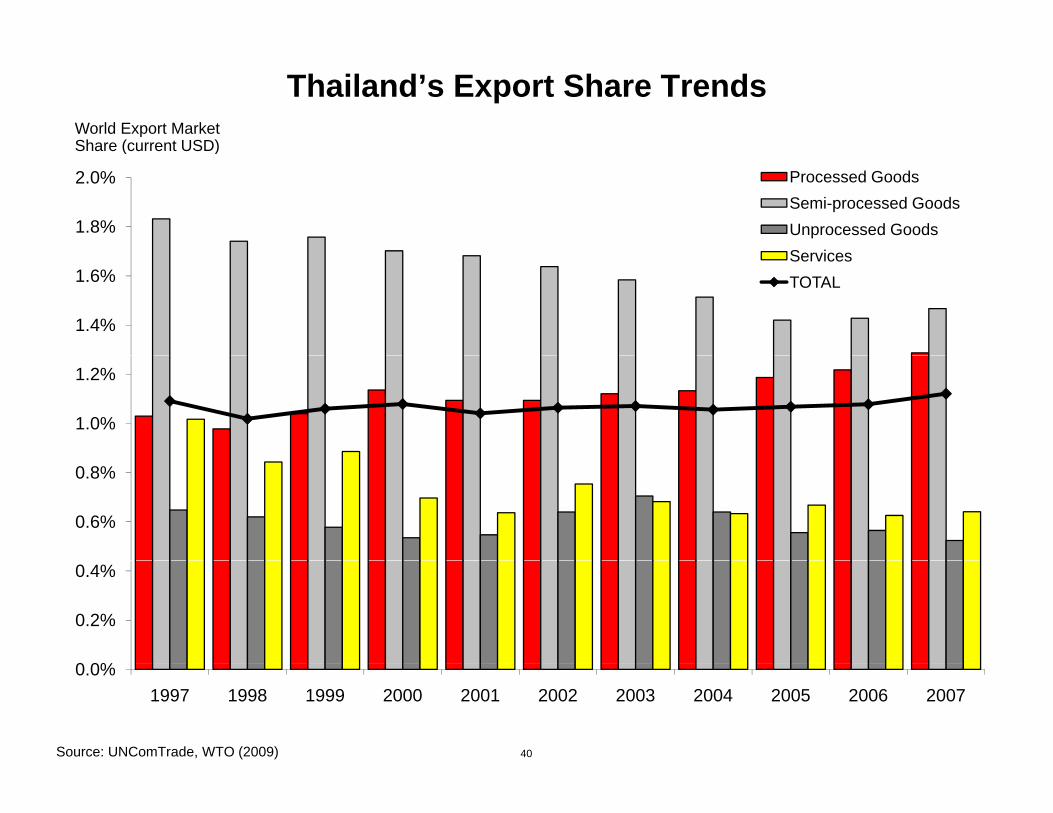
Thailand’s Export Share TrendsWorld Export Market Share (current USD)
1.8%
2.0% Processed GoodsSemi-processed GoodsUnprocessed GoodsServices
Share (current USD)
1.4%
1.6%ServicesTOTAL
1.0%
1.2%
0.6%
0.8%
0 0%
0.2%
0.4%
40
0.0%1997 1998 1999 2000 2001 2002 2003 2004 2005 2006 2007
Source: UNComTrade, WTO (2009)

Inbound Foreign Investment PerformanceStocks and Flows, Selected Countries
Inward FDI Stocks as % of
70%
80%GDP, Average 2003 - 2007
Netherlands Estonia
Singapore (160.1%, 64.7%)Asian countries
60%Hungary
Vietnam
SlovakiaC h R bli
Chile
New Zealand SwedenSwitzerland
CyprusOther countries
40%
50%
UK
Czech Republic
Australia
Denmark
ThailandCanada Latvia
Spain
Portugal Cambodia
Philippines
20%
30%
Russia
Turkey
Slovenia
PolandColombia
South Africa Iceland (46.7%)Canada
Lithuania
Brazil
France
Austria
Latvia
Norway
Germany
MexicoFinland
Laos
IsraelRomania
Egypt
UAE
Syria
0%
10%
Japan
Saudi ArabiaTurkeyUS
AMalaysia
Indonesia
India
PakistanSouth Korea
Italy
yGreece
OmanChinaSri Lanka
Iran
41
0%-5% 0% 5% 10% 15% 20% 25% 30% 35% 40%
Source: UNCTAD, World Investment Report (2009)
FDI Inflows as % of Gross Fixed Capital Formation, Average 2003 - 2007

36%
Domestic Fixed Investment RatesSelected CountriesGross Fixed Investment
as % of GDP, 2008
32%
36%China (40.8%)
Ghana
Vietnam (44.6%)India
Qatar
Croatia Belarus
Romania (11.1%)Bulgaria (12.6%)
Nicaragua
JordanOther countriesAsian countries
28% Australia
SlovakiaSlovenia IndonesiaKorea
ThailandOman
Kazakhstan
EstoniaSingapore
SpainLatvia
LithuaniaBahrainIran
Yemen (8.7%)
24% Czech Rep.
Slovakia
France
Algeria
Argentina
Denmark PolandRussiaIreland
Iceland
Thailand
Japan
CyprusNigeriaCambodia
Tunisia
Albania
Colombia
KPortugal
CanadaNew Zealand
ChileUkraine
MexicoAustriaLebanon
UAE
Syria
Sri Lanka
20% Turkey PakistanBrazil
Malaysia GermanyHong Kong
NorwayFinland
Cyprus
MaltaEgypt
Nigeria
IsraelKuwait
HungarySaudi Arabia
KenyaSouth Africag
Greece
UK
Italy Netherlands
Papua New Guinea
Taiwan
12%
16%
USAPhilippines
UK
42
-4% -2% 0% 2% 4% 6% 8%
Note: Includes inbound FDI Source: EIU, 2009
Change in Gross Fixed Investment (as % of GDP), 2004 to 2008

Average U.S. patents per 1 illi l ti 2003 2007
Innovative CapacityInnovation Output of Selected Countries
8
9million population, 2003-2007
Slovenia
6
7
4
5Hungary
2
3
Malaysia
Brazil
EstoniaCroatia
BelarusSouth Africa Greece
Czech Republic
ChileRomania
1
2 RussiaIndia
Saudi Arabia
Phili i
China
BrazilPoland
EgyptArgentinaMexico
Portugal
Thailand
Chile
Indonesia
43
0-30% -20% -10% 0% 10% 20% 30% 40%
Source: USPTO (2008), EIU (2008)CAGR of US-registered patents, 2003 – 2007
ColombiaPhilippines
50 patents =

Thailand’s Competitiveness Profile 2009
Macro (61)Micro (44) GCI (55)
Social Infra-structure and Pol. Institutions (68)
Macroeconomic Policy (52)
Business Environment Quality
(48)
CompanySophistication
(45)
Political Institutions (68)
R l f L (68)
Demand Conditions (55)
Context for Strategy and Rule of Law (68)
Human Development (70)
Context for Strategy and Rivalry (43)
Related and Supporting Industries (40)Industries (40)
Factor Input Conditions (40)
Worse than 65
60 - 65
44
Admin (53)
Innov. (49) Logistic. (33)Capital (35)
Comm. (51)
50 - 60
45 - 50
Better than 45
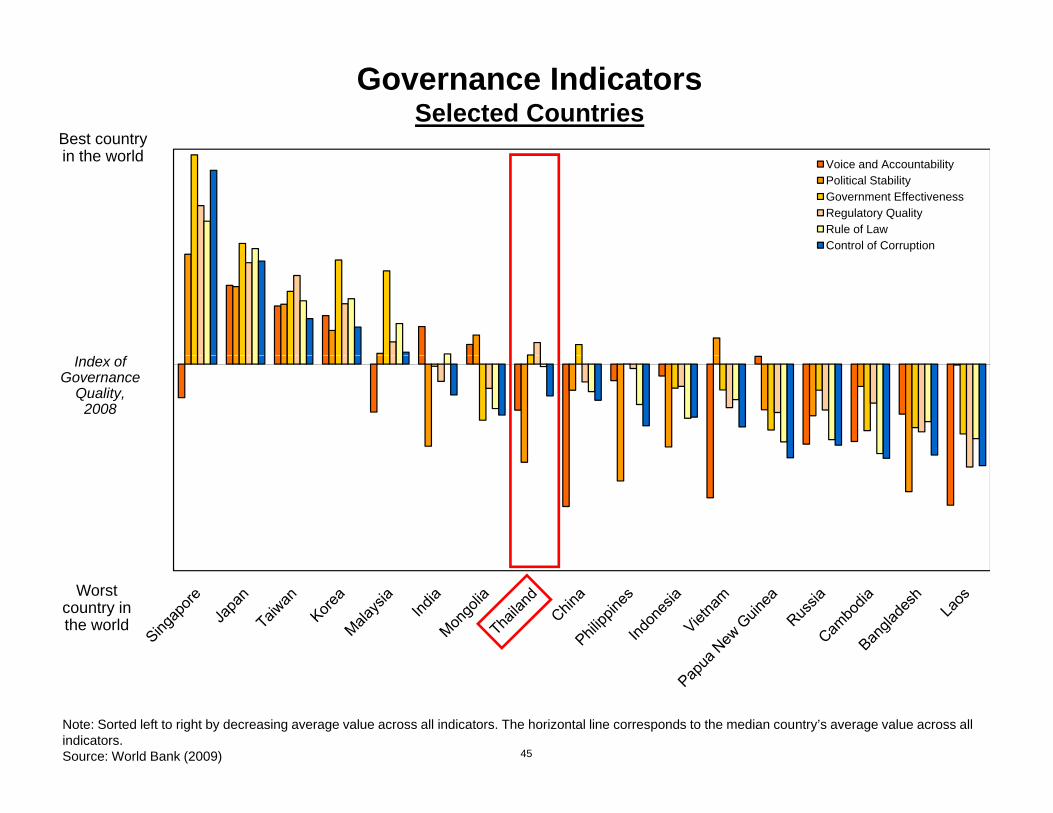
Governance IndicatorsSelected Countries
Best country i th ld Voice and Accountability
Political StabilityGovernment EffectivenessRegulatory QualityRule of LawControl of Corruption
in the world
Index of Governance
Quality,2008
Worstcountry in the world
45
Note: Sorted left to right by decreasing average value across all indicators. The horizontal line corresponds to the median country’s average value across all indicators.Source: World Bank (2009)

Factor (Input) ConditionsThailand’s Relative Position 2009
FactorFactor(Input) (Input)
ConditionsConditions
Financial Market Infrastructure
Competitive Disadvantages Relative to GDP per Capita
Competitive Advantages Relative to GDP per Capita
Advanced Communications InfrastructureSoundness of banks 18Financing through local equity market 19Ease of access to loans 22Regulation of securities exchanges 27
Personal computers per 100 population 56Internet users per 100 population 52
Innovation and SkillsRegulation of securities exchanges 27Financial market sophistication 28Domestic credit to private sector 29Venture capital availability 32
Innovation and SkillsUtility patents per million population 55Quality of scientific research institutions 50Quality of math and science education 45
Physical InfrastructureQuality of air transport infrastructure 20Q lit f d 24
Administrative InfrastructureReliability of the Police 56D t li ti f i li ki 52Quality of roads 24
Quality of port infrastructure 29Quality of electricity supply 30
Decentralization of economic policymaking 52(Low) Time required to start a business 52(Low) Burden of customs procedures 45
46
Note: Rank versus 74 countries; overall, Thailand ranks 54th in 2008 PPP adjusted GDP per capita and 40th in Global CompetitivenessSource: Institute for Strategy and Competitiveness, Harvard University (2009)
Change up/down of more than 5/10 ranks since 2002

Ease of Doing BusinessThailand, 2009
120
Ranking, 2009 (of 183 countries) Favorable Unfavorable
80
100
40
60
20
40
0
47Source: World Bank Report, Doing Business (2009/10)

Workforce Skills and Labor Market Needs
KoreaTaiwan
Brazil
Educational Attainment, Math, 8th Grade
Time Required to Fill Job Vacancy in Production
HungaryJapan
Hong KongSingapore
Korea
Thailand
AustraliaSlovenia
USRussia
Hungary
India
Korea
Unskilled
ThailandIsrael
MalaysiaSweden
T k
Russia
Skilled
ColombiaEgypt
IndonesiaTurkey
Indonesia
Turkey
48
250 350 450 550 650 0 2 4 6 8 10Average Score Number of Weeks
Source: TIMSS (2007), World Bank (2007)

Context for Strategy and RivalryThailand's Relative Position 2009
Context for Firm Context for Firm Strategy Strategy
and Rivalryand Rivalry
OpennessStrength of investor protection 11
Competitive Disadvantages Relative to GDP per Capita
Competitive Advantages Relative to GDP per Capita
Openness(Low) Tariff rate 63Strength of investor protection 11
Business impact of rules on FDI 23
Incentives and flexibility
(Low) Tariff rate 63Restrictions on capital flows 56Prevalence of foreign ownership 43
(Low) Rigidity of employment 16Cooperation in labor-employer relations 21(Low) Impact of taxation on incentives to 24 work and invest
CompetitionEfficacy of corporate boards 56Intellectual property protection 53
work and invest
CompetitionIntensity of local competition 27
Regulatory quality 50Extent of market dominance by business 42 groupsDistortive effect of taxes and subsidies on 40
Quality of competition in the ISP sector 32Effectiveness of antitrust policy 36Prevalence of trade barriers 38
f
Change up/down of more than 5/10 ranks since 2002
competition
49
Low market disruption from state-owned 39 enterprises
Note: Rank versus 74 countries; overall, Thailand ranks 54th in 2008 PPP adjusted GDP per capita and 40th in Global CompetitivenessSource: Institute for Strategy and Competitiveness, Harvard University (2009)

160
Openness to TradeSelected Countries, 2008Rank (157
countries)
140
100
120
60
80
40
0
20
50Source: Index of Economic Freedom (2008), Heritage Foundation

Related and Supporting IndustriesThailand’s Relative Position 2009
Related and Supporting Industries
Competitive Disadvantages Relative to GDP per Capita
Competitive Advantages Relative to GDP per Capita
Extent of cluster policy 21
Local supplier quantity 22
Extent of collaboration in clusters 27
Local availability of specialized research 52 and training services
Availability of latest technologies 43
State of cluster development 30
Local availability of process machinery 36
Local supplier quality 37pp q y
Change up/down of more than 5/10 ranks since 2008
51Note: Rank versus 74 countries; overall, Thailand ranks 54th in 2008 PPP adjusted GDP per capita and 40th in Global CompetitivenessSource: Institute for Strategy and Competitiveness, Harvard University (2009)

Share of World Exports by ClusterThailand, 2007
1.0% -1.5%
World Market Share
Fishing & Fishing Products Hospitality
& TourismAgricultural
Products
Prefabricated Enclosures
Textiles1.5% - 2.5%
> 2.5
Enter-tainment
FurnitureBuilding Fixtures,
Equipment & Services
Transportation & Logistics
Aerospace Vehicles &
Defense
Lightning &Information
Tech.Distribution
Services Heavy
ConstructionMaterials
Jewelry & Precious
Processed Food
Power Generation
Lightning & ElectricalEquipment
Communi-cations
Business Services Forest
Products
yConstruction
ServicesMetals
Medical Devices
Analytical InstrumentsEducation &
Knowledge Creation
Chemical Products
Biopharma-ceuticalsFinancial
Services
Publishing & Printing
cationsEquipment
Tobacco
Heavy Machinery
Production Technology
Motor Driven
Products
Plastics
Oil & Gas
Products
Apparel
Leather &
Tobacco
Aerospace Engines
AutomotiveMining & Metal Manufacturing
52
Leather & Related Products
Footwear
Note: Clusters with overlapping borders have at least 20% overlap (by number of industries) in both directions.
Marine Equipment
Sporting & Recreation
Goods

Clusters and Cluster Efforts in Thailand
• Clear evidence of significant cluster presence in the Thai economy
• Areas of strengths are largely in unrelated areas
• Focus on five clusters based on 2003 government decision– Analysis at the time focused on situation in these clusters, not on the
selection
• Limited progress on mobilizing an effective institutional architecture to move from diagnosis to action
– Creation of structures like the Thailand Automotive Institute positive steps, but limited to selected clusters
– Organization of government policies around clusters very limited
• Limited if any progress of creating mechanisms for translating cluster-Limited if any progress of creating mechanisms for translating clusterspecific competitiveness upgrading into economy-wide benefits
53
• Cluster efforts remain a significant opportunity for Thailand, but a step-change in the policy approach is needed to achieve real impact
© Christian Ketels, 2009
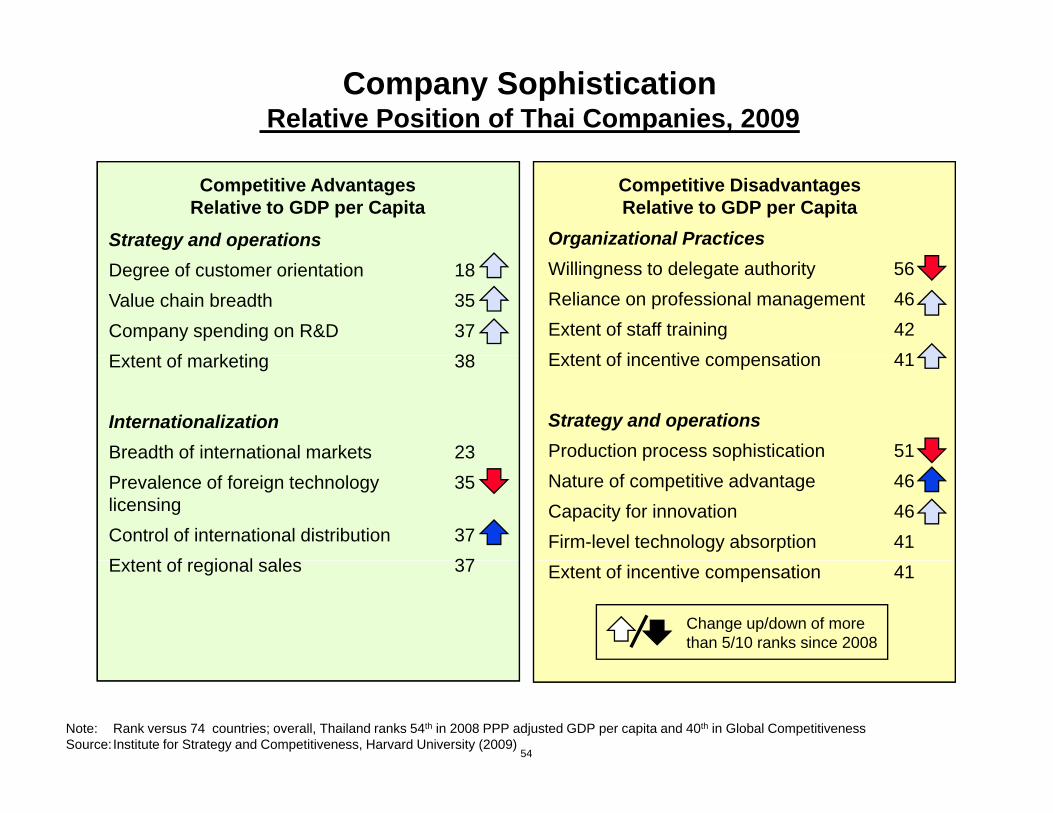
Company SophisticationRelative Position of Thai Companies, 2009
Competitive Disadvantages Relative to GDP per Capita
Competitive Advantages Relative to GDP per Capita
Strategy and operations Organizational PracticesDegree of customer orientation 18Value chain breadth 35Company spending on R&D 37E t t f k ti 38
Willingness to delegate authority 56Reliance on professional management 46Extent of staff training 42E t t f i ti ti 41Extent of marketing 38
InternationalizationBreadth of international markets 23
Extent of incentive compensation 41
Strategy and operationsProduction process sophistication 51Breadth of international markets 23
Prevalence of foreign technology 35 licensingControl of international distribution 37E t t f i l l 37
p pNature of competitive advantage 46Capacity for innovation 46Firm-level technology absorption 41
Extent of regional sales 37
Change up/down of more than 5/10 ranks since 2008
Extent of incentive compensation 41
54
Note: Rank versus 74 countries; overall, Thailand ranks 54th in 2008 PPP adjusted GDP per capita and 40th in Global CompetitivenessSource: Institute for Strategy and Competitiveness, Harvard University (2009)

Subnational Regions in Thailand
North73% of average
income Northeast70% of average
• Significant differences in prosperity, structure, and
titi 70% of average income
competitiveness
• Duality of locally elected and centrally appointed officials at
Central102% of average
income
centrally appointed officials at the local and regional level
income
Greater Bangkok187% of average
• Does the current structure provide for an efficient
South
187% of average income
provide for an efficient interplay across the different levels of government?
– Allocation of responsibilitiesAll ti f biliti
55
South106% of average
incomeSource: 2007 Household Socio-economic Survey, National Statistical Office of Thailand (accessed Nov. 2009)
– Allocation of capabilities

Thailand’s National Economic and Social Development Plan
th
• Sets out objectives and principles
The 10th National Economic and Social Development Plan (2007-2011)• Provides the foundation for
government investments and legislative action
The 9th National Economic and Social Development Plan
legislative action
• Does the Plan define competitive strengths to be
The 8th National Economic and Social Development Plan
competitive strengths to be achieved?
• Is the private sectorThe 7th National Economic and Social
Development Plan
56
Is the private sectorsufficiently involved in the design and execution?
Development Plan
© Christian Ketels, 2009

Competitiveness Rankings Over TimeNew GCI MethodologyRank
(Stable sample of
Malaysia
15
(Stab e sa p e ocountries)
a ays a
China25
Thailand
I d i45
35
Indonesia
India55
45
2001 2002 2003 2004 2005 2006 2007 2008 2009
Vietnam65
57
2001 2002 2003 2004 2005 2006 2007 2008 2009
Source: Unpublished data from the Institute for Strategy and Competitiveness, Harvard University (2009)

Thailand’s Competitiveness AgendaPriority Action Areas
• Strengthen the robustness and efficiency of public institutions
• Address the mismatch between existing and required workforce skillsAddress the mismatch between existing and required workforce skills
• Tackle remaining weaknesses in business rules and regulations
• Remove remaining barriers to foreign competition and strengthen g g p gthe legal framework to enable more effective domestic rivalry
• Activate clusters as an effective mechanism to deliver government policiespolicies
• Clarify the roles and responsibilities across different levels of government
• Mobilize public-private collaboration at the level of clusters, regions, and the national economy
• Launch a discussion on the dimensions of national value proposition
58
• Launch a discussion on the dimensions of national value proposition for Thailand
© Christian Ketels, 2009

Thailand Approaching a Critical Junction
Prosperity Creating competitive advantages
ThailandArgentinaArgentinaS Korea
Exploiting comparative advantages
59
Time
© Christian Ketels, 2009

Themes
• The concept of competitiveness
• Thailand’s Competitiveness: From Assessment to Action
• Competitiveness and the New Global Economy
C i i d E i l S i bili• Competitiveness and Environmental Sustainability
60

Impact of the Global Economic Crisis
China
Financial Sector- Export-
Sweden
SingaporeOriented
pDriven
Brazil
Mexico
ThailandVietnam
RussiaUK
Ireland Iceland
USBrazil Venezuela
Thailand
HExternalR l E t t
Hungary Ukraine
EstoniaHungaryUkraine
External Finance-
Dependent
Real Estate-Driven Spain
Latvia
T k
Argentina
61
Turkey
© Christian Ketels, 2009

Prosperity and Competitiveness
Economic Sustainability of
Current Prosperity
High
THAILANDPhilippines
IndonesiaMalaysia
L
MalaysiaVietnam
Low
62Source: Global Competitiveness Report 2009 © Christian Ketels, 2009

Competitiveness and the Crisis
High Moderate Low
Economic Sustainability of Current Prosperity
• High short term impact given
• Short term impact depends
• Short term impact dependsimpact given
high openness
Quick recovery
impact depends on openness
Recovery likely
impact depends on openness
Recovery only• Quick recovery possible
R i
• Recovery likely to be prolonged
B l i i
• Recovery only with reforms
U th i i• Remain on course
• Balance crisis management with upgrading
• Use the crisis as a promoter of change
63 © Christian Ketels, 2009

Thailand and the Global Economic Crisis
• When the global financial crisis translated into a dramatic slowdown of global trade, Thailand was hard hit due to its export-orientation
– Thailand’s financial system was relatively resilient after the fundamental changes in the wake of the Asian Financial crisis
• Recovery is now relatively swift because of the balance between Thailand’s competitiveness and prosperity
• The challenge is to remain focused on upgrading Thailand’s competitiveness while the improving economic situation reduces the pressure to act
64 © Christian Ketels, 2009

A Changing Economic Environment After the Crisis
• Unsustainable trade imbalances in the global economy will adjust over time
– There is some risk of increasing protectionism in key export markets – Adjustment in response to changes in exchange rates and capital flows
seems more likely
• While Thailand’s trade has become more ASEAN/Asia-focused over time, the ultimate market for many exports so far remains in the US or Western Europe
• The relative share of Asia in the global economy is growing, a process g y g gthat has been accelerated by the global economic crisis
65 © Christian Ketels, 2009

The New Global EconomyImplications for Thailand
• Competitiveness will only increase in importance
• A robust economic strategy needs to take a balanced view of differentA robust economic strategy needs to take a balanced view of different segments of the economy
– Export-oriented activities will remain important: support the market-driven reorientation towards Asian markets
– Domestic consumption will gradually gain in importance, especially for jobs: ensure the upgrading of activities serving the domestic market
• Regional collaboration will gain in importanceRegional collaboration will gain in importance– Strengthening the potential of markets in neighboring countries– Leverage the potential for cluster collaboration in regional cluster networks
Th bili d l i h l h k i b i i l• The ability to deal with external shocks is becoming more crucial;avoiding shocks through less openness and specialization is not viable
– Skill level of the workforce
66
– Flexibility of the economy– Social security mechanisms
© Christian Ketels, 2009

Themes
• The concept of competitiveness
• Thailand’s Competitiveness: From Assessment to Action
• Competitiveness and the New Global Economy
C i i d E i l S i bili• Competitiveness and Environmental Sustainability
67
Competitiveness and Ecological Sustainability
• Ecological sustainability is conceptually fully consistent with the overall objective of competitiveness, i.e. creating an environment where productivity supports a high standard of livingp y pp g g
• The Porter hypothesis identified the synergistic relationship of the two– Tough environmental regulations can lead companies to become more
productiveproductive – Tough environmental regulations can trigger innovations that provide
companies with competitive advantages
BUT
• Short-term trade-offs can exist through the costs of ecological activities, especially for activities exposed to global competition
68
• Competitiveness and ecological sustainability have many overlaps but are two separate objectives
© Christian Ketels, 2009

Economic Policy towards Environmental SustainabilityContext for
FirmFirm Strategy
and Rivalry
F tUpgrading programs for
Factor(Input)
ConditionsDemand
Conditions
g g gcompanies, especially SMEsEnvironmental taxes, subsidies, and process standards
Related and Supporting Industries
Demanding domestic product standards, including early adoption of demanding international standardsE i t l t
Research grants with an environmental focusTargeted workforce skill upgrading
Environmental taxes or subsidies
Financing facilities for relevant public and private investments
Creation of specialized research institutions Cluster working groups on environmental sustainability
• Achieving higher levels of environmental sustainability requires innovation• Innovation will only occur, if complementary changes are made across different
environmental sustainability
69
dimensions the business environment• The policy challenge is to set the pace and mix of these policies in ways that
balances environmental and economic goals in the short-term

Ecological Sustainability of Clusters
Th k t i t ill t i i t iti f• The market environment will create increasing opportunities for environmental products and services
o Relative prices for energy, natural resources, and pollutionG ( )o Government policies (taxes, subsidies, regulations)
o Consumer preferences
• The market for the products of specific clusters is likely
• The demand for products, services and processes thatof specific clusters is likely
to grew significantly, e.g. renewable energy technologies
services, and processes that are environmentally sound is going to increase across all clustersg
• Competition in these markets is going to be intense; only the most
• Environmental issues will affect competition on all markets; no cluster will be
70
; yproductive clusters will succeed
;successful unless it actively addresses them
© Christian Ketels, 2009

The New Sustainable EconomyImplications for Thailand
• Competitiveness and sustainability have to be pursued in tandem
• Thailand’s environmental track-record is relatively solid but more aThailand s environmental track record is relatively solid, but more a reflection of its overall profile than of explicit policies in the past
– Issues in areas like air quality and the pollution in industrialized zones have been growing over timeg g
• The national strategy for environmental sustainability needs to integrate policies across different business environment dimensions
A narrow focus on branding Thailand will not be sufficient; the global– A narrow focus on branding Thailand will not be sufficient; the global competition in this space is becoming relentless
• Cluster policy needs to be an important tool for achieving environmental sustainabilityenvironmental sustainability
– Pursue environmental issues within existing clusters– Encourage the development of new clusters that target emerging
environmental markets and relate to areas of current Thai strengths
71
g
© Christian Ketels, 2009

Why Should Business Leaders Worry About Clusters and National Competitiveness?Clusters and National Competitiveness?
InternalInternal ExternalExternal
• Competitive advantage id l l i id
• Competitive advantage (or di d t ) idresides solely inside a
company or in its industry
disadvantage) resides partly in the locations at which a company’s business units are based
• Competitive success depends primarily on
h i
business units are based
• Cluster participation is an important contributor to
titi
72
company choices competitiveness
Source: Michael Porter

Thailand: Looking Ahead
ISSUES
Thailand has allThailand has allDomestic
• The Middle Income Trap
Thailand has all opportunities to meet the challenges of the future…
Thailand has all opportunities to meet the challenges of the future…
• Policy Implementation
• Political Volatility… if Thais across all
segments of society and economy collaborate.
… if Thais across all segments of society and economy collaborate.
Global
N l b l
economy collaborate.
Competitiveness is a
economy collaborate.
Competitiveness is a Competitiveness has t b ti l l• New global economy
• Climate Changenational goal, not a
political one national goal, not a
political one to be a national goal,
not a political one
73 © Christian Ketels, 2009