that moment you realized there’s a bank that can surprise
TRANSCRIPT

Philippine Savings Bank • III
That moment you realized there’s a bank that can surprise and delight you
2 0 1 7 A U D I T E D F I N A N C I A L S T A T E M E N T S

02 MANAGEMENT’S DISCUSSION AND ANALYSIS
05 SUPPLEMENTARY MANAGEMENT DISCUSSION 12 STATEMENT OF MANAGEMENT’S RESPONSIBILITY FOR FINANCIAL STATEMENTS
14 INDEPENDENT AUDITOR’S REPORT
18 STATEMENTS OF CONDITION
19 STATEMENTS OF INCOME
20 STATEMENTS OF COMPREHENSIVE INCOME
21 STATEMENTS OF CHANGES IN EQUITY
22 STATEMENTS OF CASH FLOWS
24 NOTES TO FINANCIAL STATEMENTS
116 SHAREHOLDERS INFORMATION
OUR VISION
To be the country’s consumer and retail bank of choice.
WHO WE ARE
Philippine Savings Bank (PSBank) is the consumer and retail thrift bank arm of the Metrobank Group, one of the Philippines’ largest and leading banks. For more than 50 years, PSBank has built a reputation for its Simple Lang. Maaasahan (simple and reliable) brand of banking. Enabled by digital technology, we are able to delight our customers at every encounter.
OUR BUSINESS MODEL
The core business of PSBank is focused on expansion of the consumer business by growing its retail deposit and consumer loans, including SME, through various channels which include, but are not limited to, branch and digital channels.
What’s Inside
OUR MISSION
• As an INSTITUTIONTo conform to the highest standards of integrity, professionalism and teamwork.
• For our CLIENTSTo provide superior products and reliable, top-quality services responsive to their banking needs.
• For our EMPLOYEESTo place a premium on their growth, and nurture an environment of teamwork where outstanding performance is recognized.
• For our SHAREHOLDERSTo enhance the value of their investments.

Philippine Savings Bank • 01
Making that Aha! MomentEvery company talks about how good they are when it comes to serving their customers. But the Holy Grail of customer service is the ‘Aha!’ moment. That’s when customers realize that your product or service is exactly what they absolutely need.
For PSBank, finding these delightful ‘Aha!’ moments requires more than reaching out to our customers through various touchpoints. It takes a clear vision and a roadmap, a deeper analysis of customer insights, and an entire organization moving with a singular focus to delight customers. Since embarking on a customer experience journey, making ‘Aha!’ moments consistently for our customers has become our North Star.
May you discover your own ‘Aha!’ moments, too, while reading this.
Philippine Savings Bank • 01
D E L I G H T F U L M O M E N T S
02 • 2017 Annual Report •
Management’s Discussion and Analysis
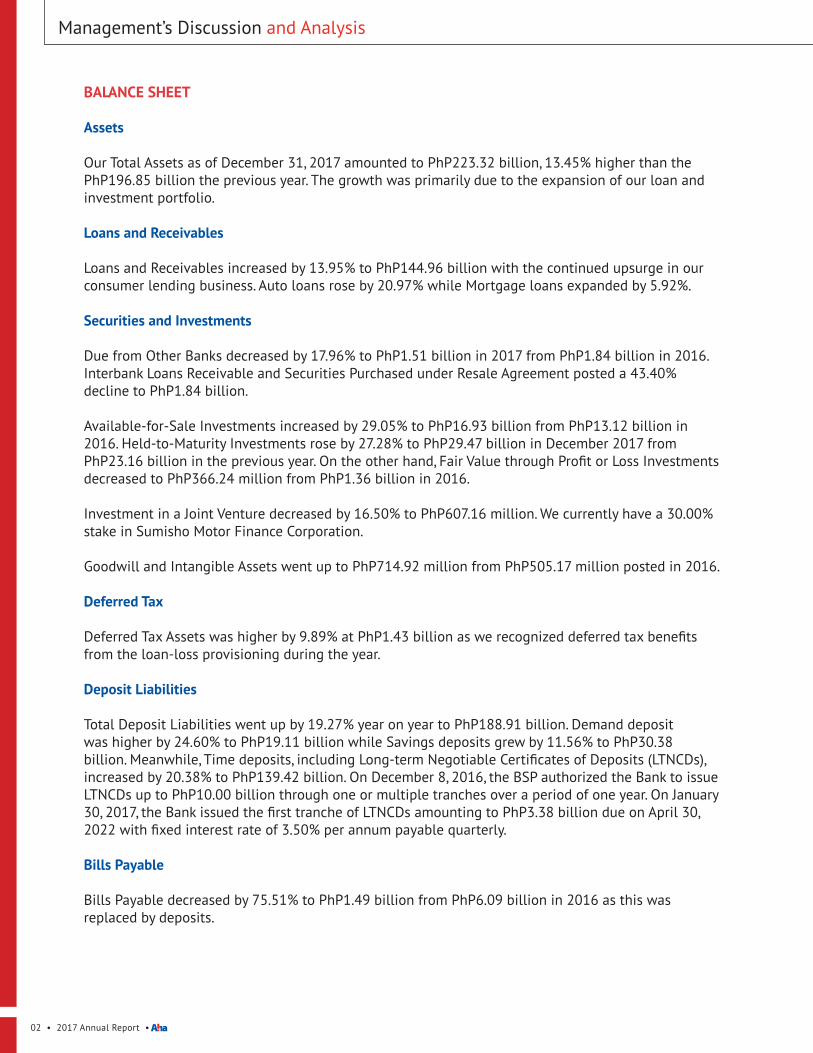
BALANCE SHEET
Assets
Our Total Assets as of December 31, 2017 amounted to PhP223.32 billion, 13.45% higher than the PhP196.85 billion the previous year. The growth was primarily due to the expansion of our loan and investment portfolio.
Loans and Receivables
Loans and Receivables increased by 13.95% to PhP144.96 billion with the continued upsurge in our consumer lending business. Auto loans rose by 20.97% while Mortgage loans expanded by 5.92%.
Securities and Investments
Due from Other Banks decreased by 17.96% to PhP1.51 billion in 2017 from PhP1.84 billion in 2016. Interbank Loans Receivable and Securities Purchased under Resale Agreement posted a 43.40% decline to PhP1.84 billion.
Available-for-Sale Investments increased by 29.05% to PhP16.93 billion from PhP13.12 billion in 2016. Held-to-Maturity Investments rose by 27.28% to PhP29.47 billion in December 2017 from PhP23.16 billion in the previous year. On the other hand, Fair Value through Profit or Loss Investments decreased to PhP366.24 million from PhP1.36 billion in 2016.
Investment in a Joint Venture decreased by 16.50% to PhP607.16 million. We currently have a 30.00% stake in Sumisho Motor Finance Corporation.
Goodwill and Intangible Assets went up to PhP714.92 million from PhP505.17 million posted in 2016.
Deferred Tax
Deferred Tax Assets was higher by 9.89% at PhP1.43 billion as we recognized deferred tax benefits from the loan-loss provisioning during the year.
Deposit Liabilities
Total Deposit Liabilities went up by 19.27% year on year to PhP188.91 billion. Demand deposit was higher by 24.60% to PhP19.11 billion while Savings deposits grew by 11.56% to PhP30.38 billion. Meanwhile, Time deposits, including Long-term Negotiable Certificates of Deposits (LTNCDs), increased by 20.38% to PhP139.42 billion. On December 8, 2016, the BSP authorized the Bank to issue LTNCDs up to PhP10.00 billion through one or multiple tranches over a period of one year. On January 30, 2017, the Bank issued the first tranche of LTNCDs amounting to PhP3.38 billion due on April 30, 2022 with fixed interest rate of 3.50% per annum payable quarterly.
Bills Payable
Bills Payable decreased by 75.51% to PhP1.49 billion from PhP6.09 billion in 2016 as this was replaced by deposits.

Philippine Savings Bank • 03
Tier 2 Notes
The Subordinated Notes or Tier 2 Notes, net of debt issuance cost was recorded at PhP2.98 billion in December 2017, 50.15% or PhP3.00 billion lower than the 2016 year-end level of PhP5.98 billion as the Bank exercised the call option of its PhP3.00 billion Tier 2 Notes issued in February 2012. The Tier 2 Notes issued in May 2014 qualified as Tier 2 Capital in the BSP’s revised risk-based capital adequacy framework in line with Basel III standards.
Capital
Capital was higher by 11.76% at PhP22.39 billion from PhP20.04 billion in 2016. Net Unrealized Loss on Available-for-Sale Investments decreased by 51.18%. We declared quarterly dividends of PhP0.75 per quarter, consistent with our dividend policy.
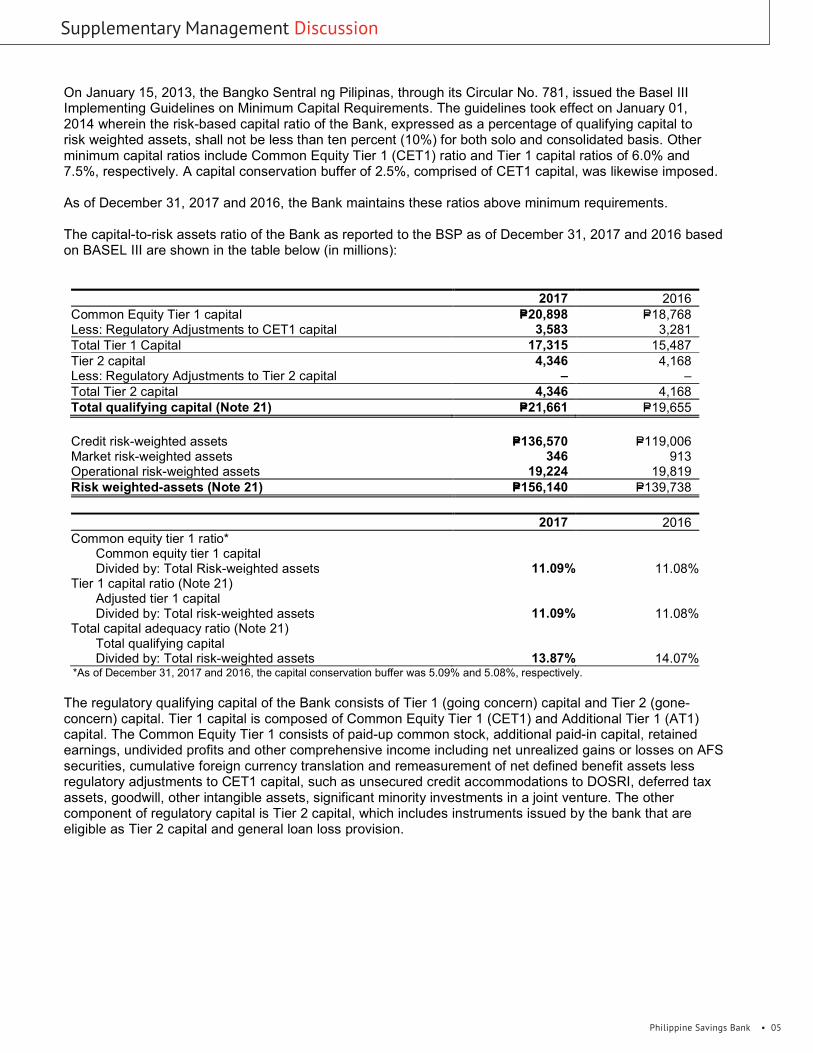
As of end 2017, Common Equity Tier 1 (CET1) Ratio was at 11.09% while Total Capital Adequacy Ratio (CAR) was at 13.87%. Both ratios are above the Bank’s 2017 minimum regulatory requirements of 9.33% and 10.00% for CET1 and Total CAR, respectively.
Capital Adequacy Ratio (CAR)In %
2013 2014 2015 2016 2017
16.9219.57 18.04
14.07
13.87
Return on Average Equity (ROAE)In %
2013 2014 2015 2016 2017
18.7213.64 12.74 12.50 12.51
Return on Average Assets (ROAA)In %
2013 2014 2015 2016 2017
2.38 1.68 1.49 1.341.26
04 • 2017 Annual Report •
Management’s Discussion and Analysis
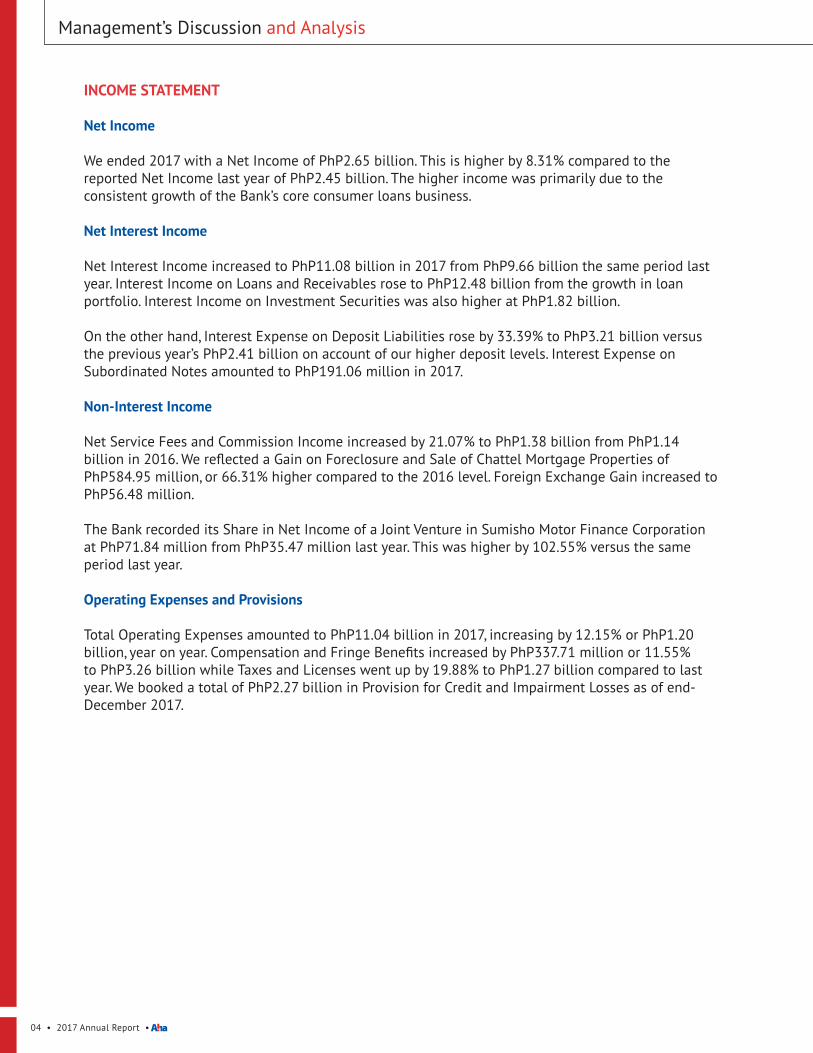
INCOME STATEMENT
Net Income
We ended 2017 with a Net Income of PhP2.65 billion. This is higher by 8.31% compared to the reported Net Income last year of PhP2.45 billion. The higher income was primarily due to the consistent growth of the Bank’s core consumer loans business.
Net Interest Income
Net Interest Income increased to PhP11.08 billion in 2017 from PhP9.66 billion the same period last year. Interest Income on Loans and Receivables rose to PhP12.48 billion from the growth in loan portfolio. Interest Income on Investment Securities was also higher at PhP1.82 billion.
On the other hand, Interest Expense on Deposit Liabilities rose by 33.39% to PhP3.21 billion versus the previous year’s PhP2.41 billion on account of our higher deposit levels. Interest Expense on Subordinated Notes amounted to PhP191.06 million in 2017.
Non-Interest Income
Net Service Fees and Commission Income increased by 21.07% to PhP1.38 billion from PhP1.14 billion in 2016. We reflected a Gain on Foreclosure and Sale of Chattel Mortgage Properties of PhP584.95 million, or 66.31% higher compared to the 2016 level. Foreign Exchange Gain increased to PhP56.48 million.
The Bank recorded its Share in Net Income of a Joint Venture in Sumisho Motor Finance Corporation at PhP71.84 million from PhP35.47 million last year. This was higher by 102.55% versus the same period last year.
Operating Expenses and Provisions
Total Operating Expenses amounted to PhP11.04 billion in 2017, increasing by 12.15% or PhP1.20 billion, year on year. Compensation and Fringe Benefits increased by PhP337.71 million or 11.55% to PhP3.26 billion while Taxes and Licenses went up by 19.88% to PhP1.27 billion compared to last year. We booked a total of PhP2.27 billion in Provision for Credit and Impairment Losses as of end-December 2017.
Philippine Savings Bank • 05
Supplementary Management Discussion

06 • 2017 Annual Report •
Supplementary Management Discussion

Philippine Savings Bank • 07

08 • 2017 Annual Report •
Supplementary Management Discussion

Philippine Savings Bank • 09

10 • 2017 Annual Report •
Supplementary Management Discussion
Philippine Savings Bank • 11

12 • 2017 Annual Report •
Statement of Management’s Responsibility for Financial Statements
SECURITIES AND EXCHANGE COMMISSIONG/F Secretariat BuildingPICC Complex, Roxas BoulevardPasay City, 1307
The management of Philippine Savings Bank is responsible for the preparation and fair presentation ofthe financial statements including the schedules attached therein, for the years ended December 31, 2017 and 2016, in accordance with the prescribed financial reporting framework indicated therein, and for such internal control as management determines is necessary to enable the preparation of financial statements that are free from material misstatement, whether due to fraud or error.
In preparing the financial statements, management is responsible for assessing the company’s ability tocontinue as a going concern, disclosing, as applicable matters related to going concern and using thegoing concern basis of accounting unless management either intends to liquidate the company or to cease operations, or has no realistic alternative but to do so.
The Board of Directors is responsible for overseeing the company’s financial reporting process.
The Board of Directors reviews and approves the financial statements including the schedules attachedtherein, and submits the same to the stockholders or members.
SyCip, Gorres, Velayo & Co., the independent auditor appointed by the stockholders, has audited thefinancial statements of the company in accordance with Philippine Standards on Auditing, and in itsreport to the stockholders or members, has expressed its opinion on the fairness of presentation uponcompletion of such audit.
JOSE T. PARDO VICENTE R. CUNA, JR. LEAH M. ZAMORA Chairman of the Board President Controller
Signed this day 06 of March 2018.
JOSE T. PARDO

Philippine Savings Bank • 13
SUBSCRIBED AND SWORN TO before me this ______________________ affiants exhibiting to me their passports as follow:
REPUBLIC OF THE PHILIPPINESCITY OF MAKATI )S.S.
NameJose T. PardoVicente R. Cuna, Jr.Leah M. Zamora
Passport No.P1032165AEC7752811P2244078A
Date of Issue11/29/201605/19/201603/11/2017
Place of IssueManila ManilaManila
SUBSCRIBED AND SWORN TO before me this ______________________ affiants exhibiting to me their
14 • 2017 Annual Report •
Independent Auditor’s Report
The Stockholders and the Board of DirectorsPhilippine Savings Bank
Report on the Audit of the Financial Statements
Opinion
We have audited the financial statements of Philippine Savings Bank (“the Bank”), which comprise thestatements of condition as at December 31, 2017 and 2016 and the statements of income, statements ofcomprehensive income, statements of changes in equity and statements of cash flows for each of the threeyears in the period ended December 31, 2017, and notes to the financial statements, including a summaryof significant accounting policies.
In our opinion, the accompanying financial statements present fairly, in all material respects, the financialposition of the Bank as at December 31, 2017 and 2016, and its financial performance and its cash flowsfor each of the three years in the period ended December 31, 2017, in accordance with PhilippineFinancial Reporting Standards (PFRSs).
Basis for Opinion
We conducted our audits in accordance with Philippine Standards on Auditing (PSAs). Our responsibilities under those standards are further described in the Auditor’s Responsibilities for the Audit of the Financial Statements section of our report. We are independent of the Bank in accordance with the Code of Ethics for Professional Accountants in the Philippines (Code of Ethics) together with the ethical requirements that are relevant to our audit of the financial statements in the Philippines, and we have fulfilled our other ethical responsibilities in accordance with these requirements and the Code of Ethics. We believe that the audit evidence we have obtained is sufficient and appropriate to provide a basis for our opinion.
Key Audit Matters
Key audit matters are those matters that, in our professional judgment, were of most significance in ouraudit of the financial statements of the current period. These matters were addressed in the context of ouraudit of the financial statements as a whole, and in forming our opinion thereon, and we do not provide aseparate opinion on these matters. For each matter below, our description of how our audit addressed thematter is provided in that context.
We have fulfilled the responsibilities described in the Auditor’s Responsibilities for the Audit of theFinancial Statements section of our report, including in relation to these matters. Accordingly, our auditincluded the performance of procedures designed to respond to our assessment of the risks of materialmisstatement of the financial statements. The results of our audit procedures, including the proceduresperformed to address the matters below, provide the basis for our audit opinion on the accompanyingfinancial statements.
Adequacy of allowance for credit losses on loans and receivables
The Bank’s loans and receivables consist of consumer loans and corporate loans. The appropriateness ofthe allowance for credit losses on these loans and receivables is a key area of judgment for management.The Bank determines the provisions for credit losses on an individual basis for individually significantloans and receivables, and collectively for loans and receivables that are not individually significant. Theidentification of impairment and the determination of the recoverable amount are inherently uncertainprocesses involving various assumptions and factors. These include the financial condition of thecounterparty, estimated future cash flows, observable market prices and estimated net selling prices of thecollateral. The use of assumptions could produce significantly different estimates of provisions for creditlosses.

Philippine Savings Bank • 15
The disclosures in relation to the allowance for credit losses are included in Notes 3 and 15 of thefinancial statements.
Audit Response
We obtained an understanding of the Bank’s impairment calculation process, including the source of theunderlying data and supporting systems, and performed tests over relevant controls. For provisions forcredit losses calculated on an individual basis, we selected a sample of impaired loans and obtained anunderstanding of the borrower’s business and financial capacity. We also tested the assumptionsunderlying the impairment identification and quantification of the allowance for credit losses. This wasdone by assessing whether the forecasted cash flows are based on the borrower’s current financialcondition, checking the payment history of the borrower including payments made subsequent to yearend,agreeing the value of the collateral to the appraisal reports, checking whether the discount raterepresents the original effective interest rate (EIR) or the current EIR of the loan, and re-performing theimpairment calculation.
For provisions for credit losses calculated on a collective basis, we tested the underlying models and theinputs to those models, such as historical loss rates, recovery rates and net flow rates. This was done byagreeing the details of the loan information used in the calculation of loss rates and net flow rates to theBank’s records and subsidiary ledgers, checking the delinquency age buckets of the loans, loan gradesand loan groupings, and re-performing the calculation of the provisions for credit losses.
Recoverability of deferred tax assets
The analysis of the recoverability of deferred tax assets is significant to our audit because the assessmentprocess is complex and judgmental. It is also based on assumptions that are affected by expected futuremarket or economic conditions and the expected performance of the Bank.
The disclosures in relation to deferred income taxes are included in Notes 3 and 27 of the financialstatements.
Audit Response
We obtained an understanding of the Bank’s deferred income tax calculation process, including theapplicable tax regulations. We reviewed management’s assessment on the availability of future taxableincome in reference to financial forecast and tax strategies. We evaluated management’s forecast bycomparing the loan portfolio and deposit growth rates with that of the industry and the historicalperformance of the Bank. We also reviewed the timing of the reversal of future taxable and deductibletemporary differences.
Other Information
Management is responsible for the other information. The other information comprises the informationincluded in the SEC Form 17-A, SEC Form 20-IS (Definitive Information Statement) and Annual Reportfor the year ended December 31, 2017, but does not include the financial statements and our auditor’sreport thereon. The SEC Form 17-A, SEC Form 20-IS (Definitive Information Statement) and AnnualReport for the year ended December 31, 2017 are expected to be made available to us after the date of this auditor’s report.
Our opinion on the financial statements does not cover the other information and we will not express anyform of assurance conclusion thereon.

16 • 2017 Annual Report •
In connection with our audits of the financial statements, our responsibility is to read the otherinformation identified above when it becomes available and, in doing so, consider whether the otherinformation is materially inconsistent with the financial statements or our knowledge obtained in theaudits, or otherwise appears to be materially misstated.
Responsibilities of Management and Those Charged with Governance for the Financial Statements
Management is responsible for the preparation and fair presentation of the financial statements inaccordance with PFRSs, and for such internal control as management determines is necessary to enablethe preparation of financial statements that are free from material misstatement, whether due to fraud orerror.
In preparing the financial statements, management is responsible for assessing the Bank’s ability tocontinue as a going concern, disclosing, as applicable, matters related to going concern and using thegoing concern basis of accounting unless management either intends to liquidate the Bank or to ceaseoperations, or has no realistic alternative but to do so.
Those charged with governance are responsible for overseeing the Bank’s financial reporting process.
Auditor’s Responsibilities for the Audit of the Financial Statements
Our objectives are to obtain reasonable assurance about whether the financial statements as a whole arefree from material misstatement, whether due to fraud or error, and to issue an auditor’s report thatincludes our opinion. Reasonable assurance is a high level of assurance, but is not a guarantee that anaudit conducted in accordance with PSAs will always detect a material misstatement when it exists.Misstatements can arise from fraud or error and are considered material if, individually or in theaggregate, they could reasonably be expected to influence the economic decisions of users taken on thebasis of these financial statements.
As part of an audit in accordance with PSAs, we exercise professional judgment and maintainprofessional skepticism throughout the audit. We also:
• Identify and assess the risks of material misstatement of the financial statements, whether due to fraud or error, design and perform audit procedures responsive to those risks, and obtain audit evidence that is sufficient and appropriate to provide a basis for our opinion. The risk of not detecting a material misstatement resulting from fraud is higher than for one resulting from error, as fraud may involve collusion, forgery, intentional omissions, misrepresentations, or the override of internal control.
• • Obtain an understanding of internal control relevant to the audit in order to design audit
procedures that are appropriate in the circumstances, but not for the purpose of expressing an opinion on the effectiveness of the Bank’s internal control.
• • Evaluate the appropriateness of accounting policies used and the reasonableness of accounting
estimates and related disclosures made by management.• • Conclude on the appropriateness of management’s use of the going concern basis of accounting and
based on the audit evidence obtained, whether a material uncertainty exists related to events or conditions that may cast significant doubt on the Bank’s ability to continue as a going concern. If we
conclude that a material uncertainty exists, we are required to draw attention in our auditor’s report to the related disclosures in the financial statements or, if such disclosures are inadequate, to modify our opinion. Our conclusions are based on the audit evidence obtained up to the date of our auditor’s report. However, future events or conditions may cause the Bank to cease to continue as a going concern.
Independent Auditor’s Report

Philippine Savings Bank • 17
• Evaluate the overall presentation, structure and content of the financial statements, including the disclosures, and whether the financial statements represent the underlying transactions and events in a manner that achieves fair presentation.
• • Obtain sufficient appropriate audit evidence regarding the financial information of the entities or business activities within the Bank to express an opinion on the financial statements. We are responsible for the direction, supervision and performance of the audit. We remain solely responsible for our audit opinion.
We communicate with those charged with governance regarding, among other matters, the planned scope and timing of the audit and significant audit findings, including any significant deficiencies in internal control that we identify during our audit.
We also provide those charged with governance with a statement that we have complied with relevantethical requirements regarding independence, and to communicate with them all relationships and other matters that may reasonably be thought to bear on our independence, and where applicable, related safeguards.
From the matters communicated with those charged with governance, we determine those matters thatwere of most significance in the audit of the financial statements of the current period and are thereforethe key audit matters. We describe these matters in our auditor’s report unless law or regulationprecludes public disclosure about the matter or when, in extremely rare circumstances, we determine that a matter should not be communicated in our report because the adverse consequences of doing so would reasonably be expected to outweigh the public interest benefits of such communication.
Report on the Supplementary Information Required Under Revenue Regulations No. 15-2010
Our audits were conducted for the purpose of forming an opinion on the basic financial statements taken as a whole. The supplementary information required under Revenue Regulations 15-2010 in Note 36 to the financial statements is presented for purposes of filing with the Bureau of Internal Revenue and is not a required part of the basic financial statements. Such information is the responsibility of themanagement of Philippine Savings Bank. The information has been subjected to the auditing proceduresapplied in our audit of the basic financial statements. In our opinion, the information is fairly stated, in all material respects, in relation to the basic financial statements taken as a whole.
The engagement partner on the audit resulting in this independent auditor’s report is Miguel U. Ballelos, Jr.
SYCIP GORRES VELAYO & CO.
Miguel U. Ballelos, Jr.PartnerCPA Certificate No. 109950SEC Accreditation No. 1566-A (Group A),June 9, 2016, valid until June 9, 2019Tax Identification No. 241-031-088BIR Accreditation No. 08-001998-114-2016,February 15, 2016, valid until February 14, 2019PTR No. 6621218, January 9, 2018, Makati CityFebruary 22, 2018
*SGVFS026939*
- 5 -
We also provide those charged with governance with a statement that we have complied with relevantethical requirements regarding independence, and to communicate with them all relationships and othermatters that may reasonably be thought to bear on our independence, and where applicable, relatedsafeguards.
From the matters communicated with those charged with governance, we determine those matters thatwere of most significance in the audit of the financial statements of the current period and are thereforethe key audit matters. We describe these matters in our auditor’s report unless law or regulationprecludes public disclosure about the matter or when, in extremely rare circumstances, we determine thata matter should not be communicated in our report because the adverse consequences of doing so wouldreasonably be expected to outweigh the public interest benefits of such communication.
Report on the Supplementary Information Required Under Revenue Regulations No. 15-2010
Our audits were conducted for the purpose of forming an opinion on the basic financial statements takenas a whole. The supplementary information required under Revenue Regulations 15-2010 in Note 36 tothe financial statements is presented for purposes of filing with the Bureau of Internal Revenue and is nota required part of the basic financial statements. Such information is the responsibility of themanagement of Philippine Savings Bank. The information has been subjected to the auditing proceduresapplied in our audit of the basic financial statements. In our opinion, the information is fairly stated, in allmaterial respects, in relation to the basic financial statements taken as a whole.
The engagement partner on the audit resulting in this independent auditor’s report isMiguel U. Ballelos, Jr.
SYCIP GORRES VELAYO & CO.
Miguel U. Ballelos, Jr.PartnerCPA Certificate No. 109950SEC Accreditation No. 1566-A (Group A), June 9, 2016, valid until June 9, 2019Tax Identification No. 241-031-088BIR Accreditation No. 08-001998-114-2016, February 15, 2016, valid until February 14, 2019PTR No. 6621218, January 9, 2018, Makati City
February 22, 2018
A member firm of Ernst & Young Global Limited

18 • 2017 Annual Report •
*SGVFS026939*
PHILIPPINE SAVINGS BANKSTATEMENTS OF CONDITION
December 312017 2016
ASSETSCash and Other Cash Items P=2,596,872,801 P=2,778,009,185Due from Bangko Sentral ng Pilipinas (Note 16) 15,265,387,772 13,986,784,696Due from Other Banks (Note 29) 1,508,489,309 1,838,630,022Interbank Loans Receivable and Securities Purchased Under
Resale Agreements (Note 7) 1,842,023,049 3,254,311,599Fair Value Through Profit or Loss Investments (Note 8) 366,235,689 1,360,792,147Available-for-Sale Investments (Note 8) 16,925,485,941 13,115,812,858Held-to-Maturity Investments (Note 8) 29,473,724,384 23,156,886,629Loans and Receivables (Note 9) 144,964,513,221 127,221,847,151Investment in a Joint Venture (Notes 10 and 29) 607,162,821 727,176,484Property and Equipment (Note 11) 2,480,012,354 2,667,170,455Investment Properties (Note 12) 3,930,317,479 3,861,708,308Deferred Tax Assets (Note 27) 1,429,327,369 1,300,724,234Goodwill and Intangible Assets (Note 13) 714,924,056 505,165,868Other Assets (Note 14) 1,219,566,379 1,078,083,056
P=223,324,042,624 P=196,853,102,692
LIABILITIES AND EQUITYLiabilitiesDeposit Liabilities (Note 16)Demand P=19,112,561,892 P=15,339,143,653Savings 30,383,783,001 27,236,228,764Time 136,042,056,714 115,811,946,185Long-term Negotiable Certificates of Deposits 3,375,000,000 –
188,913,401,607 158,387,318,602Bills Payable (Note 17) 1,492,418,518 6,093,796,533Subordinated Notes (Note 17) 2,978,997,695 5,975,732,110Treasurer’s, Cashier’s and Manager’s Checks 2,213,869,703 1,760,505,822Accrued Taxes, Interest and Other Expenses (Note 18) 1,658,423,304 1,193,816,372Financial Liabilities at FVPL (Note 8) – 65,316,678Income Tax Payable 375,277 466,880Other Liabilities (Note 19) 3,673,232,353 3,338,477,499
200,930,718,457 176,815,430,496EquityCommon Stock (Note 21) 2,402,524,910 2,402,524,910Capital Paid in Excess of Par Value 2,818,083,506 2,818,083,506Surplus Reserves (Note 30) 1,035,402,901 1,035,275,317Surplus (Note 21) 17,097,046,504 15,163,512,433Net Unrealized Loss on Available-for-Sale Investments (Note 8) (411,510,218) (842,908,364)Remeasurement Losses on Retirement Plan (Note 24) (545,392,541) (541,701,193)Equity in Remeasurement Gains on Retirement Plan of a Joint
Venture (Note 10) 1,245,144 1,443,599Cumulative Translation Adjustment (4,076,039) 1,441,988
22,393,324,167 20,037,672,196P=223,324,042,624 P=196,853,102,692
See accompanying Notes to Financial Statements.
Statements of Condition

Philippine Savings Bank • 19
Statements of Income
*SGVFS026939*
PHILIPPINE SAVINGS BANKSTATEMENTS OF INCOME
Years Ended December 312017 2016 2015
INTEREST INCOMELoans and receivables (Note 9) P=12,477,133,237 P=11,066,862,854 P=9,929,658,464Investment securities (Note 8) 1,823,591,316 1,347,949,127 727,768,591Due from Bangko Sentral ng Pilipinas 179,406,826 13,905,374 146,667,295Interbank loans receivable and securities purchased under
resale agreements (Note 7) 61,037,150 61,530,255 190,814,354Due from other banks 2,608,271 2,222,421 7,818,217
14,543,776,800 12,492,470,031 11,002,726,921INTEREST EXPENSEDeposit liabilities (Note 16) 3,214,665,720 2,409,979,204 2,170,741,412Subordinated notes (Note 17) 191,058,261 361,766,713 342,650,259Bills payable (Note 17) 58,953,437 56,801,997 7,388,984
3,464,677,418 2,828,547,914 2,520,780,655NET INTEREST INCOME 11,079,099,382 9,663,922,117 8,481,946,266Service fees and commission income (Note 22) 1,470,202,440 1,226,015,157 1,293,699,761Service fees and commission expense (Note 22) 94,428,291 89,667,951 98,207,711NET SERVICE FEES AND COMMISSION INCOME 1,375,774,149 1,136,347,206 1,195,492,050OTHER OPERATING INCOME (CHARGES)Gain on foreclosure and sale of chattel mortgage properties - net
(Note 14) 584,947,874 351,721,775 377,657,511Gain on foreclosure and sale of investment properties - net
(Note 12) 348,813,362 364,392,867 258,030,111Foreign exchange gain - net 56,483,920 23,992,498 18,823,668Gain on sale of property and equipment (Note 11) 1,731,001 2,639,304 17,739,663Trading and securities gains (losses) - net (Note 8) (65,237,826) 509,665,576 (63,569,750)Miscellaneous (Notes 12, 23 and 25) 507,510,359 426,147,878 515,413,451
1,434,248,690 1,678,559,898 1,124,094,654TOTAL OPERATING INCOME 13,889,122,221 12,478,829,221 10,801,532,970OTHER EXPENSESCompensation and fringe benefits (Note 24) 3,260,605,852 2,922,900,798 2,613,867,706Provision for credit and impairment losses (Note 15) 2,270,178,805 2,222,503,257 1,588,298,396Taxes and licenses 1,268,907,979 1,058,437,943 961,093,132Occupancy and equipment-related costs (Note 25) 740,050,501 710,941,317 671,728,902Depreciation (Note 11) 635,436,103 557,648,750 501,311,146Security, messengerial and janitorial services 477,533,030 383,670,587 334,030,017Amortization of intangible assets (Note 13) 135,432,343 111,160,451 100,224,715Miscellaneous (Notes 12 and 26) 2,251,333,506 1,876,476,264 1,742,754,431
11,039,478,119 9,843,739,367 8,513,308,445INCOME BEFORE SHARE IN NET INCOME OF A JOINT
VENTURE AND INCOME TAX 2,849,644,102 2,635,089,854 2,288,224,525SHARE IN NET INCOME OF A JOINT VENTURE
(Notes 10 and 29) 71,836,533 35,466,690 20,213,935INCOME BEFORE INCOME TAX 2,921,480,635 2,670,556,544 2,308,438,460PROVISION FOR (BENEFIT FROM) INCOME TAX
(Note 27)Current 394,082,636 295,879,413 351,871,466Deferred (127,021,129) (76,166,179) (394,333,106)
267,061,507 219,713,234 (42,461,640)NET INCOME P=2,654,419,128 P=2,450,843,310 P=2,350,900,100Basic/Diluted Earnings Per Share (Note 28) P=11.05 P=10.20 P=9.79
See accompanying Notes to Financial Statements.
20 • 2017 Annual Report •
*SGVFS026939*
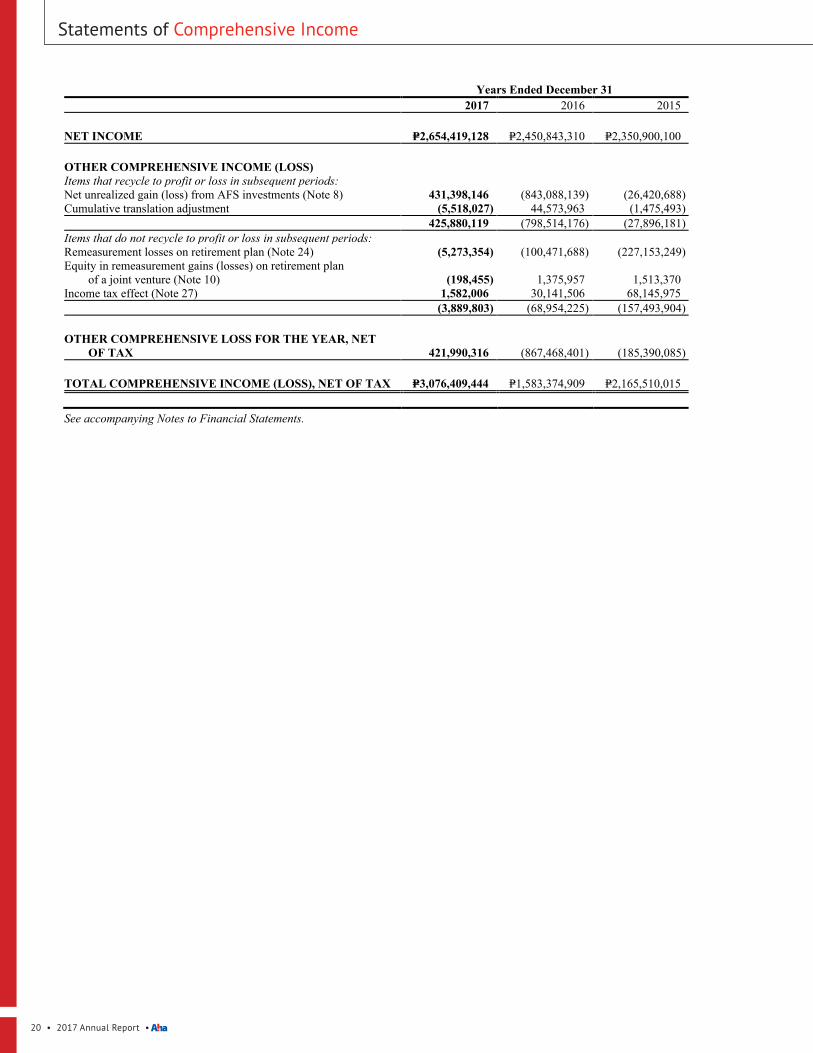
PHILIPPINE SAVINGS BANKSTATEMENTS OF COMPREHENSIVE INCOME
Years Ended December 312017 2016 2015
NET INCOME P=2,654,419,128 P=2,450,843,310 P=2,350,900,100
OTHER COMPREHENSIVE INCOME (LOSS)Items that recycle to profit or loss in subsequent periods:Net unrealized gain (loss) from AFS investments (Note 8) 431,398,146 (843,088,139) (26,420,688)Cumulative translation adjustment (5,518,027) 44,573,963 (1,475,493)
425,880,119 (798,514,176) (27,896,181)Items that do not recycle to profit or loss in subsequent periods:Remeasurement losses on retirement plan (Note 24) (5,273,354) (100,471,688) (227,153,249)Equity in remeasurement gains (losses) on retirement plan
of a joint venture (Note 10) (198,455) 1,375,957 1,513,370Income tax effect (Note 27) 1,582,006 30,141,506 68,145,975
(3,889,803) (68,954,225) (157,493,904)
OTHER COMPREHENSIVE LOSS FOR THE YEAR, NETOF TAX 421,990,316 (867,468,401) (185,390,085)
TOTAL COMPREHENSIVE INCOME (LOSS), NET OF TAX P=3,076,409,444 P=1,583,374,909 P=2,165,510,015
See accompanying Notes to Financial Statements.
Statements of Comprehensive Income
Philippine Savings Bank • 21
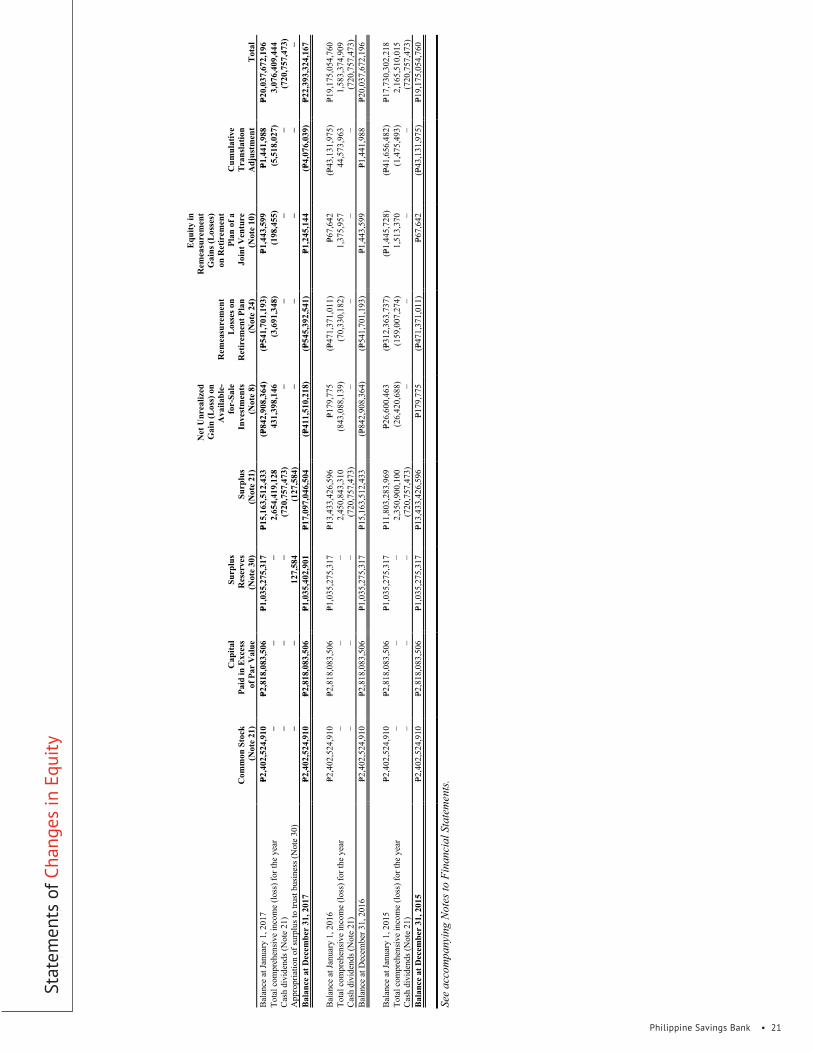
Stat
emen
ts o
f Cha
nges
in E
quity
*SGVFS026939*
PHIL
IPPI
NE
SA
VIN
GS
BA
NK
STA
TE
ME
NT
S O
F C
HA
NG
ES
IN E
QU
ITY
Com
mon
Sto
ck(N
ote
21)
Cap
ital
Paid
in E
xces
sof
Par
Val
ue
Surp
lus
Res
erve
s(N
ote
30)
Surp
lus
(Not
e 21
)
Net
Unr
ealiz
edG
ain
(Los
s) o
nA
vaila
ble-
for-
Sale
Inve
stm
ents
(Not
e 8)
Rem
easu
rem
ent
Los
ses o
nR
etir
emen
t Pla
n(N
ote
24)
Equ
ity in
Rem
easu
rem
ent
Gai
ns (L
osse
s)on
Ret
irem
ent
Plan
of a
Join
t Ven
ture
(Not
e 10
)
Cum
ulat
ive
Tra
nsla
tion
Adj
ustm
ent
Tot
alB
alan
ce a
t Jan
uary
1, 2
017
P=2,4
02,5
24,9
10P=2
,818
,083
,506
P=1,0
35,2
75,3
17P=1
5,16
3,51
2,43
3(P=
842,
908,
364)
(P=54
1,70
1,19
3)P=1
,443
,599
P=1,4
41,9
88P=2
0,03
7,67
2,19
6To
tal c
ompr
ehen
sive
inco
me
(loss
) for
the
year
−−
−2,
654,
419,
128
431,
398,
146
(3,6
91,3
48)
(198
,455
)(5
,518
,027
)3,
076,
409,
444
Cas
h di
vide
nds (
Not
e 21
)−
−−
(720
,757
,473
)−
−−
−(7
20,7
57,4
73)
App
ropr
iatio
n of
surp
lus t
o tru
st b
usin
ess (
Not
e 30
)−
−12
7,58
4(1
27,5
84)
−−
−−
−B
alan
ce a
t Dec
embe
r 31
, 201
7P=2
,402
,524
,910
P=2,8
18,0
83,5
06P=1
,035
,402
,901
P=17,
097,
046,
504
(P=41
1,51
0,21
8)(P=
545,
392,
541)
P=1,2
45,1
44(P=
4,07
6,03
9)P=2
2,39
3,32
4,16
7
Bal
ance
at J
anua
ry 1
, 201
6P=2
,402
,524
,910
P=2,8
18,0
83,5
06P=1
,035
,275
,317
P=13,
433,
426,
596
P=179
,775
(P=47
1,37
1,01
1)P=6
7,64
2(P=
43,1
31,9
75)
P=19,
175,
054,
760
Tota
l com
preh
ensi
ve in
com
e (lo
ss) f
or th
e ye
ar−
−−
2,45
0,84
3,31
0(8
43,0
88,1
39)
(70,
330,
182)
1,37
5,95
744
,573
,963
1,58
3,37
4,90
9C
ash
divi
dend
s (N
ote
21)
−−
−(7
20,7
57,4
73)
−−
−−
(720
,757
,473
)B
alan
ce a
t Dec
embe
r 31,
201
6P=2
,402
,524
,910
P=2,8
18,0
83,5
06P=1
,035
,275
,317
P=15,
163,
512,
433
(P=84
2,90
8,36
4)(P=
541,
701,
193)
P=1,4
43,5
99P=1
,441
,988
P=20,
037,
672,
196
Bal
ance
at J
anua
ry 1
, 201
5P=2
,402
,524
,910
P=2,8
18,0
83,5
06P=1
,035
,275
,317
P=11,
803,
283,
969
P=26,
600,
463
(P=31
2,36
3,73
7)(P=
1,44
5,72
8)(P=
41,6
56,4
82)
P=17,
730,
302,
218
Tota
l com
preh
ensi
ve in
com
e (lo
ss) f
or th
e ye
ar−
−−
2,35
0,90
0,10
0(2
6,42
0,68
8)(1
59,0
07,2
74)
1,51
3,37
0(1
,475
,493
)2,
165,
510,
015
Cas
h di
vide
nds (
Not
e 21
)−
−−
(720
,757
,473
)−
−−
−(7
20,7
57,4
73)
Bal
ance
at D
ecem
ber
31, 2
015
P=2,4
02,5
24,9
10P=2
,818
,083
,506
P=1,0
35,2
75,3
17P=1
3,43
3,42
6,59
6P=1
79,7
75(P=
471,
371,
011)
P=67,
642
(P=43
,131
,975
)P=1
9,17
5,05
4,76
0
See
acco
mpa
nyin
g N
otes
to F
inan
cial
Sta
tem
ents
.

22 • 2017 Annual Report •
*SGVFS026939*
PHILIPPINE SAVINGS BANKSTATEMENTS OF CASH FLOWS
Years Ended December 312017 2016 2015
CASH FLOWS FROM OPERATING ACTIVITIESIncome before income tax P=2,921,480,635 P=2,670,556,544 P=2,308,438,460Adjustments to reconcile income before income tax to net
cash used in operations: Provision for credit and impairment losses (Note 15) 2,270,178,805 2,222,503,257 1,588,298,396 Amortization of premium (discount) on available-for-sale
investments 345,911,497 (490,197,593) 2,024,746,125 Depreciation (Note 11) 635,436,103 557,648,750 501,311,146 Gain on foreclosure and sale of: Chattel mortgage properties (Note 14) (584,947,873) (351,721,775) (377,657,511) Investment properties (Note 12) (348,813,361) (364,392,867) (258,030,111) Amortization of: Intangible assets (Note 13) 135,432,343 111,160,451 100,224,715 Debt issuance costs (Note 17) 3,265,585 23,680,529 5,150,260 Realized loss (gain) on sale of available-for-sale
investments (Note 8) 49,756,366 (456,628,139) (36,343,321) Unrealized trading (gain) loss on fair value through
profit or loss investments (Note 8) (12,181,153) (9,808,773) 24,171,844 Share in net income of a joint venture (Note 10) (71,836,533) (35,466,690) (20,213,935) Loss on sale of a joint venture 2,052,642 – – Gain on sale of property and equipment (Note 11) (1,731,001) (2,639,304) (17,739,663) Changes in operating assets and liabilities: Decrease (increase) in: Fair value through profit or loss investments 941,420,934 1,538,682,890 (2,566,807,850) Loans and receivables (22,428,511,076) (17,801,956,529) (21,526,724,867) Other assets (35,731,437) (31,545,443) 73,185,939 Increase (decrease) in: Deposit liabilities 30,523,557,488 24,091,609,813 17,768,068,631 Accrued taxes, interest and other expenses 464,596,545 143,049,544 (77,668,853) Treasurer’s, cashier’s and manager’s checks 453,363,881 411,884,412 94,839,692 Other liabilities 329,104,407 232,467,904 (57,443,347)Cash generated from (used in) operations 15,591,804,797 12,458,886,981 (450,194,250)Income taxes paid (394,158,858) (303,467,934) (350,950,721)Net cash provided by (used in) operating activities 15,197,645,939 12,155,419,047 (801,144,971)
CASH FLOWS FROM INVESTING ACTIVITIESPurchases of: Available-for-sale investments (9,380,635,227) (40,630,855,364) (13,996,913,431) Held-to-maturity investments (6,917,136,761) (8,051,001,534) (15,183,881,903) Property and equipment (Note 11) (227,119,984) (319,030,433) (639,489,221) Other intangible assets (Note 13) (345,190,531) (171,866,198) (175,544,810)Proceeds from sale of: Available-for-sale investments (Note 8) 5,879,947,979 36,425,024,948 11,056,542,556 Chattel mortgage properties (Note 14) 2,146,956,711 1,564,228,669 1,378,234,489 Held to maturity investments (Note 8) 324,545,000 – – Investment properties (Note 12) 784,512,544 520,225,812 437,934,888 Property and equipment (Note 11) 24,120,404 32,128,996 39,834,213 Investment in a joint venture (Note 10) 189,960,000 – –Decrease (increase) in interbank loans receivable (Note 7) – – 1,386,320,000Net cash used in investing activities (7,520,039,865) (10,631,145,104) (15,696,963,219)
(Forward)
Statements of Cash Flows

Philippine Savings Bank • 23
*SGVFS026939*
- 2 -
Years Ended December 312017 2016 2015
CASH FLOWS FROM FINANCING ACTIVITIESSettlement of subordinated notes (Note 17) (P=3,000,000,000) P=– P=–Settlement of bills payable (4,601,585,608) (126,096,897,354) (15,326,746,786)Dividends paid (Note 21) (720,757,473) (720,757,473) (897,647,381)Availments of bills payable – 127,696,110,553 19,821,347,358Net cash provided (used in) by financing activities (8,322,343,081) 878,455,726 3,596,953,191Effect of exchange rate differences (225,564) 1,713,236 (73,834)
NET INCREASE (DECREASE) IN CASHAND CASH EQUIVALENTS (644,962,571) 2,404,442,905 (12,901,228,833)
CASH AND CASH EQUIVALENTSAT BEGINNING OF YEAR
Cash and other cash items 2,778,009,185 3,934,496,578 4,174,756,446Due from Bangko Sentral ng Pilipinas (Note 16) 13,986,784,696 11,143,781,766 23,997,102,406Due from other banks 1,838,630,022 1,861,110,141 3,382,662,578Interbank loans receivable and securities purchased under
resale agreements (Note 7) 3,254,311,599 2,513,904,112 800,000,00021,857,735,502 19,453,292,597 32,354,521,430
CASH AND CASH EQUIVALENTS AT END OF YEARCash and other cash items 2,596,872,801 2,778,009,185 3,934,496,578Due from Bangko Sentral ng Pilipinas (Note 16) 15,265,387,772 13,986,784,696 11,143,781,766Due from other banks 1,508,489,309 1,838,630,022 1,861,110,141Interbank loans receivable and securities purchased under
resale agreements (Note 7) 1,842,023,049 3,254,311,599 2,513,904,112P=21,212,772,931 P=21,857,735,502 P=19,453,292,597
OPERATIONAL CASH FLOWS FROM INTERESTInterest paid P=5,012,646,483 P=2,772,406,654 P=2,483,813,667Interest received 10,936,013,646 11,911,931,701 12,478,341,350
See accompanying Notes to Financial Statements.
24 • 2017 Annual Report •
*SGVFS026939*
PHILIPPINE SAVINGS BANKNOTES TO FINANCIAL STATEMENTS
1. Corporate Information
Philippine Savings Bank (the Bank) was incorporated in the Philippines primarily to engage insavings and mortgage banking. The Bank’s shares are listed in the Philippine Stock Exchange (PSE).The Bank offers a wide range of products and services such as deposit products, loans, treasury andtrust functions that mainly serve the retail and consumer markets. On September 6, 1991, the Bankwas authorized to perform trust functions.
As of December 31, 2017 and 2016, the Bank had 250 and 255 branches, respectively. In 2017, theBank had 346 Automated Tellering Machines (ATMs) in Metro Manila and 264 in provinciallocations, bringing its total number of ATMs to 610 as of December 31, 2017.
The Bank’s original Certificate of Incorporation was issued by the Securities and ExchangeCommission (SEC) on June 30, 1959. On March 28, 2006, the Board of Directors (BOD) of the Bankapproved the amendment of Article IV of its Amended Articles of Incorporation to extend thecorporate term of the Bank, which expired on June 30, 2009, for another 50 years or up toJune 30, 2059. This was subsequently approved by stockholders representing at least two-thirds ofthe outstanding capital stock of the Bank on April 25, 2006. The Amended Articles of Incorporationwas approved by the SEC on September 27, 2006.
On April 27, 2010, by majority vote of the BOD and by stockholders representing two-thirds of theoutstanding capital stock, the amendment of Article VI of its Amended Articles of Incorporationreducing the number of directors from a maximum of eleven (11) to a maximum of nine (9) has beenapproved. This was approved by the SEC on August 26, 2010.
On March 24, 2014, the BOD approved Article III of Articles of Incorporation to specify its principaladdress from Makati City to PSBank Center, 777 Paseo de Roxas corner Sedeño Street, Makati City1226. The Amended Articles of Incorporation was approved by the SEC on December 22, 2014.
As of December 31, 2017 and 2016, Metropolitan Bank & Trust Company (MBTC), the Bank’sultimate parent, owned eighty-three percent (83%) of the Bank.
2. Significant Accounting Policies
Basis of PreparationThe accompanying financial statements have been prepared under the historical cost basis except forfair value through profit or loss (FVPL) investments, available-for-sale (AFS) investments, andderivative financial instruments that have been measured at fair value. All values are rounded to thenearest peso unless otherwise stated.
The accompanying financial statements of the Bank include the accounts maintained in the RegularBanking Unit (RBU) and Foreign Currency Deposit Unit (FCDU). The functional currency of theRBU and the FCDU is the Philippine Peso and United States Dollar (USD), respectively. Forfinancial reporting purposes, FCDU accounts and foreign currency-denominated accounts in the RBUare translated into their equivalents in Philippine peso (see accounting policy on Foreign CurrencyTranslation). The financial statements of these units are combined after eliminating inter-unitaccounts.
Notes to Financial Statements

Philippine Savings Bank • 25
Notes to Financial Statements - 2 -
*SGVFS026939*
The financial statements provide comparative information in respect of the previous period. Inaddition, the Bank presents an additional statement of condition at the beginning of the earliest periodpresented when there is a retrospective application of an accounting policy, a retrospectiverestatement, or a reclassification of items in financial statements.
Statement of ComplianceThe financial statements of the Bank have been prepared in compliance with Philippine FinancialReporting Standards (PFRS).
Presentation of Financial StatementsThe Bank presents its statement of condition in order of liquidity. An analysis regarding recovery ofassets or settlement of liabilities within twelve (12) months after the statement of condition date(current) and more than 12 months after the statement of condition date (non-current) is presented inNote 20.
Financial assets and financial liabilities are offset and the net amount is reported in the statement ofcondition only when there is a legally enforceable right to offset the recognized amounts and there isan intention to settle on a net basis, or to realize the assets and settle the liability simultaneously. TheBank assesses that it has a currently enforeceable right of offset if the right is not contingent on afuture event, and is legally enforeceable in the normal course of business, event of default, and eventof solvency or bankruptcy of the Bank and all of the counterparties.
Income and expenses are not offset in the statement of income unless required or permitted by anyaccounting standard or interpretation, and as specifically disclosed in the accounting policies of theBank.
Changes in Accounting Policies and DisclosuresThe Bank applied, for the first time, the following applicable new and revised accounting standards.Unless otherwise indicated, these new and revised accounting standards have no impact to the Bank.Except for these standards and amended PFRS which were adopted as of January 1, 2017, theaccounting policies adopted are consistent with those of previous financial year.
Amendments
PFRS 12, Disclosure of Interests in Other Entities – Clarification on the disclosure requirements onthe investments in other entities.The amendments clarify that the disclosure requirements apply to an entity’s interest in a subsidiary, ajoint venture or an associate that is classified as held for sale. The amendment is appliedretrospectively.
PAS 7, Disclosure InitiativeThis requires entities to provide disclosure about changes in their liabilities arising from financingactivities, including both changes arising from cash flows and non-cash changes such as foreignexchange gains and losses. The Bank has provided the required information in the Note 32 tofinancial statements. As allowed under the transition provisions of the standard, the Bank did notpresent comparative information for the year ended December 31, 2016.
PAS 12, Recognition of Deferred Tax Assets for Unrealized Losses – Clarification on the accountingfor deferred tax assets on debt instruments measured at fair value.This requires entities to consider whether tax law restricts the sources of taxable profits against whichit may make deductions on the reversal of that deductible temporary difference. Entities should

26 • 2017 Annual Report •
- 3 -
*SGVFS026939*
determine future taxable profits and explain the circumstances in which taxable profit may include therecovery of some assets for more than carrying amount.
Summary of Significant Accounting Policies
Foreign Currency TranslationThe financial statements are presented in Philippine Peso, which is the Bank’s functional andpresentation currency.
The books of accounts of the RBU are maintained in Philippine Peso, while those of the FCDU aremaintained in USD.
RBUAs at reporting date, foreign currency monetary assets and liabilities of the RBU are translated inPhilippine Peso based on the Philippine Dealing System (PDS) closing rate prevailing at thestatement of condition date, and foreign currency-denominated income and expenses, at the exchangerates as at the dates of the transactions. Foreign exchange differences arising from restatements offoreign currency-denominated assets and liabilities in the RBU are credited to or charged againstprofit or loss in the year in which the rates change. Non-monetary items that are measured in terms ofhistorical cost in a foreign currency are translated using the exchange rates as at the dates of the initialtransactions. Non-monetary items measured at fair value in a foreign currency are translated usingthe exchange rates at the date when the fair value is determined.
FCDUAs at the reporting date, the assets and liabilities of the FCDU are translated to the Bank’spresentation currency (the Philippine Peso) at the PDS closing rate prevailing at the statement ofcondition date, and its income and expenses are translated using the exchange rates as at the dates ofthe transactions. Exchange differences arising on translation to the presentation currency are taken tothe statement of comprehensive income under ‘Cumulative translation adjustment’. Upon disposal ofthe FCDU or upon actual remittance of FCDU profits to RBU, the deferred cumulative amountrecognized in the statement of comprehensive income is recognized in the statement of income.
Fair Value MeasurementThe Bank measures financial instruments, such as FVPL investments, AFS investments andderivative financial instruments, at fair value at each statement of condition date. Also, fair values offinancial instruments measured at amortized cost and non-financial assets such as investmentproperties are disclosed in Note 4.
Fair value is the estimated price that would be received to sell an asset or paid to transfer a liability inan orderly transaction between market participants at the measurement date. The fair valuemeasurement is based on the presumption that the transaction to sell the asset or transfer the liabilitytakes place either:
∂ in the principal market for the asset or liability, or∂ in the absence of a principal market, in the most advantageous market for the asset or liability.
The principal or most advantageous market must be accessible to the Bank.
The fair value of an asset or a liability is measured using the assumptions that market participantswould use when pricing the asset or liability, assuming that market participants act in their economicbest interest.
Notes to Financial Statements

Philippine Savings Bank • 27
Notes to Financial Statements - 4 -
*SGVFS026939*
If an asset or a liability measured at fair value has a bid price and an ask price (e.g., an input from adealer market), the price between the bid-ask spread that is most representative of fair value in thecircumstances shall be used to measure fair value regardless of where the input is categorized withinthe fair value hierarchy.
A fair value measurement of a non-financial asset takes into account a market participant's ability togenerate economic benefits by using the asset in its highest and best use or by selling it to anothermarket participant that would use the asset in its highest and best use.
The Bank uses valuation techniques that are appropriate in the circumstances and for which sufficientdata are available to measure fair value, maximizing the use of relevant observable inputs andminimizing the use of unobservable inputs.
All assets and liabilities for which fair value is measured or disclosed in the financial statements arecategorized within the fair value hierarchy, described as follows, based on the lowest level input thatis significant to the fair value measurement as a whole:
∂ Level 1 − Quoted (unadjusted) market prices in active markets for identical assets or liabilities∂ Level 2 − Valuation techniques for which the lowest level input that is significant to the fair value
measurement is directly or indirectly observable∂ Level 3 − Valuation techniques for which the lowest level input that is significant to the fair value
measurement is unobservable
For assets and liabilities that are recognized in the financial statements on a recurring basis, the Bankdetermines whether transfers have occurred between Levels in the hierarchy by re-assessingcategorization (based on the lowest level input that is significant to the fair value measurement as awhole) at the end of each reporting period.
For the purpose of fair value disclosures, the Bank has determined classes of assets and liabilities onthe basis of the nature, characteristics and risks of the asset and liability and the level of the fair valuehierarchy as explained above.
Cash and Cash EquivalentsFor purposes of reporting cash flows, cash and cash equivalents include cash and other cash items,due from BSP and other banks, interbank loans receivable and securities purchased under resaleagreements that are convertible to known amounts of cash which have original maturities of threemonths or less from date of placements and that are subject to an insignificant risk of changes invalue. Due from BSP includes the statutory reserves required by the BSP which the Bank considersas cash equivalents as withdrawals can be made to meet the Bank’s cash requirements as allowed bythe BSP.
Financial Instruments - Initial Recognition and Subsequent MeasurementDate of recognitionPurchases or sales of financial assets, except for derivatives, that require delivery of assets within thetime frame established by regulation or convention in the marketplace are recognized on thesettlement date. Derivative financial instruments are recognized on a trade date basis. Deposits,amounts due to banks and loans and receivables are recognized when cash is received by the Bank oradvanced to the borrowers.
28 • 2017 Annual Report •
- 5 -
*SGVFS026939*
Initial recognition of financial instrumentsAll financial instruments, including trading and investment securities and loans and receivables, areinitially measured at fair value. Except for FVPL investments and liabilities, the initial measurementof financial instruments includes transaction costs. The Bank classifies its financial assets in thefollowing categories: FVPL investments, AFS investments, held-to-maturity (HTM) investments, andloans and receivables. Financial liabilities are classified into liabilities at FVPL and other financialliabilities at amortized cost. The classification of financial instruments at initial recognition dependson their purpose and characteristics and the management’s intention in acquiring them. Managementdetermines the classification of its investments at initial recognition and, where allowed andappropriate, re-evaluates such designation at every statement of condition date.
Financial assets and financial liabilities at FVPLFinancial assets and financial liabilities at FVPL include financial assets and financial liabilities heldfor trading purposes and derivative instruments.
Financial instruments held-for-tradingOther financial assets or financial liabilities held for trading (HFT) are recorded in the statement ofcondition at fair value. Changes in fair value relating to the HFT positions are recognized in ‘Tradingand securities gains (losses) - net’. Interest earned or incurred is recorded as interest income orexpense, respectively, while dividend income is recorded in other operating income under‘Miscellaneous’ when the right to receive payment has been established.
Included in this classification are debt securities which have been acquired principally for the purposeof selling in the near term.
DerivativesDerivative financial instruments are initially recorded at fair value on the date at which the derivativecontract is entered into and are subsequently remeasured at fair value. Any gains or losses arisingfrom changes in fair values of derivatives (except those accounted for as cash flow hedges) are takendirectly to the statement of income and are included in ‘Foreign exchange gain - net’. Derivatives arecarried as assets when the fair value is positive and as liabilities when the fair value is negative. Asof December 31, 2017 and 2016, derivatives consist of foreign exchange swaps, forwards andRepublic of the Philippines (ROP) paired warrants acquired to manage the Bank’s foreign currencyrisk, lower the risk weighted assets and improve the capital adequacy ratio of the Bank.
AFS investmentsAFS investments include equity and debt securities. Equity investments classified as AFS are thosewhich are neither classified as HFT nor designated at FVPL. Debt securities in this category areintended to be held for an indefinite period of time and may be sold in response to needs for liquidityor in response to changes in market conditions. The Bank has not designated any loans andreceivables as AFS.
After initial measurement, AFS investments are subsequently measured at fair value. The effectiveyield component of AFS debt securities as well as the impact of restatement on foreign currency-denominated AFS debt securities is reported in other comprehensive income. The unrealized gainsand losses arising from the fair valuation of AFS investments are excluded, net of tax, from reportedincome and are reported as ‘Net unrealized gain (loss) from AFS investments’ in OtherComprehensive Income (OCI).
When the security is disposed of, the cumulative gain or loss previously recognized in OCI isrecognized as ‘Trading and securities gains (losses) - net’ in the statement of income. Where theBank holds more than one investment in the same security, these are deemed to be disposed on a
Notes to Financial Statements

Philippine Savings Bank • 29
Notes to Financial Statements - 6 -
*SGVFS026939*
weighted average basis. Interest earned on holding AFS debt investments are reported as interestincome using the EIR. Dividends earned on holding AFS equity investments are recognized in thestatement of income as other operating income under ‘Miscellaneous’ when the right of the paymenthas been established. The losses arising from impairment of such investments are recognized as‘Provision for credit and impairment losses’ in the statement of income and removed from ‘Netunrealized gain (loss) from AFS investments’ in OCI.
HTM investmentsHTM investments are quoted non-derivative financial assets with fixed or determinable payments andfixed maturities for which the Bank’s management has the positive intention and ability to hold untilmaturity. After initial measurement, HTM investments are subsequently measured at amortized costusing the effective interest amortization method, less impairment in value. Amortized cost iscalculated by taking into account any discount or premium on acquisition and fees that are an integralpart of the EIR. The amortization is included in ‘Interest income on investment securities’ in thestatement of income. The losses arising from impairment of such investments are recognized in thestatement of income under ‘Provision for credit and impairment losses’. The effects of restatementon foreign currency-denominated HTM investments are recognized in the statement of income.
If the Bank were to sell or reclassify more than an insignificant amount of HTM investments beforematurity (other than in certain specific circumstances), the entire category would be tainted andwould be reclassified as AFS investments. Furthermore, the Bank would be prohibited fromclassifying any financial asset as HTM investments during the two preceding financial years.
Loans and receivablesThis accounting policy relates to the Bank’s ‘Due from Bangko Sentral ng Pilipinas (BSP)’, ‘Duefrom Other Banks’, ‘Interbank Loans Receivable and Securities Purchased Under Resale Agreements(SPURA)’, ‘Loans and Receivables’, ‘Security Deposits’, ‘Returned Checks and Other Cash Items(RCOCI)’, and ‘Shortages’. These are non-derivative financial assets with fixed or determinablepayments and fixed maturities that are not quoted in an active market, other than:
∂ those that the Bank intends to sell immediately or in the near term and those that the Bank, uponinitial recognition, designates as at FVPL;
∂ those that the Bank, upon initial recognition, designates as AFS; and∂ those for which the Bank may not recover substantially all of its initial investment, other than
because of credit deterioration.
After initial measurement, these are subsequently measured at amortized cost using the effectiveinterest amortization method, less allowance for credit losses. Amortized cost is calculated by takinginto account any discount or premium on acquisition and fees and costs that are an integral part of theEIR. The amortization is included in ‘Interest income’ in the statement of income. The losses arisingfrom impairment are recognized in ‘Provision for credit and impairment losses’ in the statement ofincome.
Other financial liabilities carried at amortized costThis category represents issued financial instruments or their components, which are not designated atFVPL and comprises ‘Deposit Liabilities’,‘Bills Payable’, ‘Subordinated Notes’,‘Treasurer’s,Cashier’s and Manager’s Checks’, ‘Accrued Interest Payable’, ‘Accrued Other Expenses’, ‘AccountsPayable’, ‘Bills Purchased-Contra’, ‘Other credits’, ‘Due to BSP’, ‘Dividends Payable’, ‘Due to theTreasurer of the Philippines’, ‘Deposits for Keys-Safety Deposit Boxes (SDB)’, and ‘Overages’,where the substance of the contractual arrangement results in the Bank having an obligation either todeliver cash or another financial asset to the holder, or to satisfy the obligation other than by the
30 • 2017 Annual Report •
- 7 -
*SGVFS026939*
exchange of a fixed amount of cash or another financial asset for a fixed number of own equityshares.
After initial measurement, financial liabilities not qualified and not designated as FVPL aresubsequently measured at amortized cost using the effective interest amortization method. Amortizedcost is calculated by taking into account any discount or premium on the issue and fees that are anintegral part of the EIR.
A compound financial instrument which contains both a liability and an equity component isseparated at the issue date. A portion of the net proceeds of the instrument is allocated to the debtcomponent on the date of issue based on its fair value (which is generally determined based on quotedmarket prices for similar debt instruments). The residual amount determined after deducting the fairvalue of the debt component is assigned to the equity component. The value of any derivativefeatures (such as a call option) embedded in the compound financial instrument other than the equitycomponent is included in the debt component.
Derecognition of Financial Assets and LiabilitiesFinancial assetsA financial asset (or, where applicable a part of a financial asset or part of a group of financial assets)is primarily derecognized when:
∂ the rights to receive cash flows from the asset have expired; or∂ the Bank has transferred its rights to receive cash flows from the asset or has assumed an
obligation to pay the received cash flows in full without material delay to a third party under a‘pass-through’ arrangement; and either:a. the Bank has transferred substantially all the risks and rewards of the asset, orb. the Bank has neither transferred nor retained the risks and rewards of the asset but has
transferred control over the asset.
Where the Bank has transferred its rights to receive cash flows from an asset or has entered into a‘pass-through’ arrangement, and has neither transferred nor retained substantially all the risks andrewards of the asset nor transferred control over the asset, the asset is recognized to the extent of theBank’s continuing involvement in the asset. In this case, the Bank also recognizes an associatedliability. The transferred asset and the associated liability are measured on a basis that reflects therights and obligations that the Bank has retained.
Continuing involvement that takes the form of a guarantee over the transferred asset is measured atthe lower of original carrying amount of the asset and the maximum amount of consideration that theBank could be required to repay.
Financial liabilitiesA financial liability is derecognized when the obligation under the liability is discharged or cancelledor has expired. Where an existing financial liability is replaced by another from the same lender onsubstantially different terms, or the terms of an existing liability are substantially modified, such anexchange or modification is treated as a derecognition of the original liability and the recognition of anew liability, and the difference in the respective carrying amounts is recognized in the statement ofincome.
Repurchase and Reverse Repurchase AgreementsSecurities sold under agreements to repurchase (SSURA) at a specified future date (‘repos’) are notderecognized from the statement of condition as the Bank retains substantially all the risks andrewards of ownership. The corresponding cash received, including accrued interest, is recognized in
Notes to Financial Statements

Philippine Savings Bank • 31
Notes to Financial Statements - 8 -
*SGVFS026939*
the statement of condition as a loan to the Bank under ‘Bills Payable’, reflecting the economicsubstance of such transaction.
Conversely, securities purchased under agreements to resell (SPURA) at a specified future date(‘reverse repos’) are not recognized in the statement of condition. The consideration paid, includingaccrued interest, is recognized in the statement of condition as SPURA, and is considered a loan tothe counterparty. The difference between the purchase price and resale price is treated as interestincome and is accrued over the life of the agreement using the effective interest amortization method.
Reclassification of Financial AssetsThe Bank may reclassify, in rare circumstances, non-derivative financial assets out of the HFTinvestments category and into the AFS financial assets, HTM financial assets or Loans andReceivables categories.
A financial asset that is reclassified out of the HFT category is reclassified at its fair value on the dateof reclassification. Any gain or loss already recognized in the statement of comprehensive income isnot reversed. The fair value of the financial asset on the date of reclassification becomes its new costor amortized cost, as applicable.
For a financial asset reclassified out of the AFS financial assets category, any previous gain or loss onthe asset that has been recognized in OCI is amortized to profit or loss over the remaining life of theinvestment using the effective interest method. Any difference between the new amortized cost andthe expected cash flows is also amortized over the remaining life of the asset using the effectiveinterest method.
If the asset is subsequently determined to be impaired, the amount recorded in the OCI is recycled tothe statement of income.
If, as a result of a change in intention or ability, it is no longer appropriate to classify an investment asHTM, it shall be reclassified as AFS and remeasured at fair value on the date of reclassification, andthe difference between its carrying amount and fair value shall be recognized in other comprehensiveincome.
There was no reclassification of financial assets in 2017 and 2016.
Impairment of Financial AssetsThe Bank assesses at each statement of condition date whether there is objective evidence that afinancial asset or group of financial assets is impaired. A financial asset or group of financial assetsis deemed to be impaired if, and only if, there is objective evidence of impairment as a result of oneor more events that have occurred after the initial recognition of the asset (an incurred ‘loss event’)and that loss event (or events) has an impact on the estimated future cash flows of the financial assetor the group of financial assets that can be reliably estimated.
Evidence of impairment may include: indications that the borrower or a group of borrowers isexperiencing significant financial difficulty; default or delinquency in interest or principal payments;the probability that they will enter bankruptcy or other financial reorganization; and where observabledata indicate that there is a measurable decrease in the estimated future cash flows, such as changes inarrears or economic conditions that correlate with defaults.
Financial assets carried at amortized costFor financial assets carried at amortized cost, which includes loans and receivables, due from banksand HTM investments, the Bank first assesses individually at each statement of condition date

32 • 2017 Annual Report •
- 9 -
*SGVFS026939*
whether objective evidence of impairment exists for financial assets that are individually significant,or collectively for financial assets that are not individually significant. If the Bank determines that noobjective evidence of impairment exists for an individually assessed financial asset, whethersignificant or not, it includes the asset in a group of financial assets with similar credit riskcharacteristics and collectively assesses for impairment. Those characteristics are relevant to theestimation of future cash flows for groups of such assets by being indicative of the debtors’ ability topay all amounts due according to the contractual terms of the assets being evaluated. Assets that areindividually assessed for impairment and for which an impairment loss is, or continues to be,recognized are not included in a collective assessment for impairment. Assets individually assessedfor impairment for which no impairment loss was measured are also collectively assessed forimpairment.
If there is objective evidence that an impairment loss has been incurred, the amount of the loss ismeasured as the difference between the asset’s carrying amount and the present value of the estimatedfuture cash flows (excluding future credit losses that have not been incurred). The carrying amountof the asset is reduced through the use of an allowance account and the amount of loss is charged tothe statement of income. Interest income continues to be accrued on the reduced carrying amount andis accrued using the rate of interest used to discount the future cash flows for the purpose ofmeasuring the impairment loss.
Loans and receivables, together with the associated allowance accounts, are written off when there isno realistic prospect of future recovery and all collateral have been realized. If, in a subsequent year,the amount of the estimated impairment loss decreases because of an event occurring after theimpairment was recognized, the previously recognized impairment loss is reduced by adjusting theallowance account. If a future write-off is later recovered, any amounts formerly charged are creditedto ‘Recovery of charged-off assets’ under ‘Miscellaneous income’ in the statement of income.
The present value of the estimated future cash flows is discounted at the financial asset’s originalEIR. If a loan has a variable interest rate, the discount rate for measuring any impairment loss is thecurrent EIR, adjusted for the original credit risk premium. The calculation of the present value of theestimated future cash flows of a collateralized financial asset reflects the cash flows that may resultfrom foreclosure less costs for obtaining and selling the collateral, whether or not foreclosure isprobable.
For the purpose of a collective evaluation of impairment, financial assets are grouped on the basis ofcredit risk characteristics such as industry and age of receivables.
Future cash flows in a group of financial assets that are collectively evaluated for impairment areestimated on the basis of historical loss experience for assets with credit risk characteristics similar tothose in the group. Historical loss experience is adjusted on the basis of current observable data toreflect the effects of current conditions that did not affect the period in which the historical lossexperience is based and to remove the effects of conditions in the historical period that do not existcurrently.
Estimates of changes in future cash flows reflect, and are directionally consistent with changes inrelated observable data from period to period (such as changes in unemployment rates, propertyprices, commodity prices, payment status, or other factors that are indicative of incurred losses in thegroup and their magnitude). The methodology and assumptions used for estimating future cash flowsare reviewed regularly by the Bank to reduce any differences between loss estimates and actual lossexperience.
Notes to Financial Statements
Philippine Savings Bank • 33
Notes to Financial Statements - 10 -
*SGVFS026939*
The details of allowance for credit and impairment losses on financial assets carried at amortized costare disclosed in Note 15.
Restructured loansWhere possible, the Bank seeks to restructure loans rather than to take possession of collateral. Thismay involve extending the payment arrangements and the agreement on new loan conditions. Oncethe terms have been renegotiated, any impairment is measured using the original EIR as calculatedbefore the modification of terms and the loan is no longer considered past due.
Management continuously reviews restructured loans to ensure that all criteria are met and that futurepayments are likely to occur. The loans continue to be subjected to an individual or collectiveimpairment assessment, calculated using the loan’s original EIR if the original loan has a fixedinterest rate and the current repriced rate if the original loan is repriceable. The difference betweenthe recorded value of the original loan and the present value of the restructured cash flows,discounted at the applicable interest rate, is recognized in ‘Provision for credit and impairment losses’in the statement of income.
AFS investmentsFor AFS investments, the Bank assesses at each statement of condition date whether there is objectiveevidence that a financial asset or group of financial assets is impaired.
In the case of debt instruments classified as AFS investments, the Bank assesses individually whetherthere is objective evidence of impairment based on the same criteria as financial assets carried atamortized cost. However, the amount recorded as impairment is the cumulative loss measured as thedifference between the amortized cost and the current fair value, less any impairment loss on thatinvestment previously recognized in the statement of income.
Future interest income continues to be accrued based on the reduced carrying amount using the rate ofinterest used to discount future cash flows for the purpose of measuring impairment loss. Suchaccrual is recorded as part of ‘Interest income’ in the statement of income. If, in a subsequent period,the fair value of a debt instrument increases and the increase can be objectively related to an eventoccurring after the impairment loss was recognized, the impairment loss is reversed through thestatement of income.
In the case of equity investments classified as AFS investments, objective evidence would alsoinclude a ‘significant’ or ‘prolonged’ decline in the fair value of the investments below its cost. TheBank treats ‘significant’ generally as 20.00% and ‘prolonged’ generally as longer than twelve (12)months. When there is evidence of impairment, the cumulative loss - measured as the differencebetween the acquisition cost and the current fair value, less any impairment loss on that financialasset previously recognized in the statement of income - is removed from equity and recognized inthe statement of income. Impairment losses on equity investments are not reversed through thestatement of income. Increases in fair value after impairment are recognized in the statement ofcomprehensive income.
Investment in a Joint VentureA joint venture is a type of joint arrangement whereby the parties that have joint control of thearrangement have rights to the net assets of the joint venture. Joint control is the contractually agreedsharing of control of an arrangement, which exists only when decisions about the relevant activitiesrequire unanimous consent of the parties sharing control. The Bank’s investment in a joint venturerepresents its 30.00% and 40.00% interest in Sumisho Motor Finance Corporation (SMFC) as ofDecember 31, 2017 and 2016, respectively.
34 • 2017 Annual Report •
- 11 -
*SGVFS026939*
The considerations made in determining significant influence or joint control are similar to thosenecessary to determine control over subsidiaries.
The Bank’s investment in its joint venture is accounted for using the equity method.Under the equity method, the investment in a joint venture is initially recognized at cost. Thecarrying amount of the investment is adjusted to recognize changes in the Bank’s share of net assetsof the joint venture since the acquisition date. Goodwill relating to the joint venture is included in thecarrying amount of the investment and is neither amortized nor individually tested for impairment.
The statement of income reflects the Bank’s share of the results of operations of the joint venture.Any change in OCI of those investees is presented as part of the Bank’s OCI. In addition, when therehas been a change recognized directly in the equity of the joint venture, the Bank recognizes its shareof any changes, when applicable, in the statement of changes in equity. Unrealized gains and lossesresulting from transactions between the Bank and joint venture are eliminated to the extent of theinterest in the joint venture.
The aggregate of the Bank’s share of profit or loss of a joint venture is shown on the face of thestatement of profit or loss outside operating profit and represents profit or loss after tax and non-controlling interests in the subsidiaries of the joint venture.
The financial statements of a joint venture are prepared for the same reporting period as the Bank.The length of the reporting period is the same from period to period. When necessary, adjustmentsare made to bring the accounting policies in line with those of the Bank.
After application of the equity method, the Bank determines whether it is necessary to recognize animpairment loss on its investment in its joint venture. At each statement of condition date, the Bankdetermines whether there is objective evidence that the investment in the joint venture is impaired. Ifthere is such evidence, the Bank calculates the amount of impairment as the difference between therecoverable amount of the joint venture and its carrying value, then recognizes the loss as ‘Share innet income (loss) of a joint venture’in the statement of income.
Upon loss of significant influence over the joint control over the joint venture, the Bank measures andrecognizes any retained investment at its fair value. Any difference between the carrying amount ofthe joint venture upon loss of significant influence or joint control and the fair value of the retainedinvestment and proceeds from disposal is recognized in profit or loss.
Property and EquipmentLand is stated at cost less any impairment in value and depreciable properties, including building,furniture, fixtures and equipment, and leasehold improvements, are stated at cost less accumulateddepreciation and any accumulated impairment losses. The initial cost of property and equipmentconsists of its purchase price and any directly attributable costs of bringing the asset to its workingcondition and location for its intended use. Expenditures incurred after the assets have been putinto operation, such as repairs and maintenance, are normally charged against profit or loss in theyear in which the costs are incurred. In situations where it can be clearly demonstrated that theexpenditures have resulted in an increase in the future economic benefits expected to be obtainedfrom the use of property and equipment beyond its originally assessed standard of performance, theexpenditures are capitalized as additional cost of property and equipment.
Notes to Financial Statements
Philippine Savings Bank • 35
Notes to Financial Statements - 12 -
*SGVFS026939*
Depreciation is calculated using the straight-line method to write down the cost of the property andequipment to their residual values over their estimated useful lives. Land is not depreciated. Theestimated useful lives are as follows:
Buildings 25-50 yearsFurniture, fixtures and equipment 3-5 years depending on the type of assetsLeasehold improvements 5 years or the term of the related leases,
whichever is shorter
The assets’ residual values, useful lives and methods of depreciation are reviewed, and adjusted ifappropriate, at each financial year-end to ensure that these are consistent with the expected pattern ofeconomic benefits from the items of property and equipment.
An item of property and equipment is derecognized upon disposal or when no future economicbenefits are expected from its use or disposal. Any gain or loss arising on derecognition of the asset(calculated as the difference between the net disposal proceeds and the carrying amount of the asset)is included in the statement of income in the year the asset is derecognized.
The carrying values of property and equipment are reviewed for impairment when events or changesin circumstances indicate the carrying value may not be recoverable. If any such indication exists andwhere the carrying values exceed the estimated recoverable amount, the asset is written down to itsrecoverable amount.
Investment PropertiesInvestment properties are measured initially at cost, including transaction costs. An investmentproperty acquired through an exchange transaction is measured at the fair value of the asset acquiredunless the fair value of such asset cannot be measured, in which case the investment propertyacquired is measured at the carrying amount of the asset given up. Foreclosed properties areclassified under investment properties from foreclosure date. Expenditures incurred after theinvestment properties are recognized, such as repairs and maintenance costs, are normally charged toincome in the period in which the costs are incurred.
Subsequent to initial recognition, investment properties are carried at cost less accumulateddepreciation and impairment in value, except for land which is stated at cost less impairment in value.Depreciation is calculated using the straight-line method over the remaining useful lives from thetime of acquisition of the investment properties.
The estimated useful life of building and condominium units ranges from 10 to 40 years.
Investment properties are derecognized when they have either been disposed of or when theinvestment property is permanently withdrawn from use and no future benefit is expected from itsdisposal. Any gains or losses on the retirement or disposal of an investment property are recognizedin the statement of income in ‘Gain on foreclosure and sale of investment properties - net’ in the yearof retirement or disposal.
Transfers are made to investment properties when, and only when, there is a change in use evidencedby ending of owner occupation, commencement of an operating lease to another party or ending ofconstruction or development. Transfers are made from investment properties when, and only when,there is a change in use evidenced by commencement of owner occupation or commencement ofdevelopment with a view to sale.
36 • 2017 Annual Report •
- 13 -
*SGVFS026939*
Chattel Mortgage PropertiesChattel mortgage properties comprise of repossessed vehicles. Chattel mortgage properties are statedat cost less accumulated depreciation and impairment in value. Chattel mortgage properties acquiredare initially recognized at fair value. Depreciation is calculated using the straight-line method overthe remaining useful lives from the time of acquisition of the vehicles. The useful lives of chattelmortgage properties are estimated to be five years.
Intangible AssetsThe Bank’s intangible assets include branch licenses and computer software. An intangible asset isrecognized only when the cost can be measured reliably and it is probable that the expected futureeconomic benefits that are attributable to it will flow to the Bank.
Intangible assets acquired separately are measured on initial recognition at cost. The cost ofintangible assets acquired in a business combination is its fair value as at the date of acquisition.Following initial recognition, intangible assets are carried at cost less any accumulated amortizationand any accumulated impairment losses. Internally generated intangible assets, excluding capitalizeddevelopment costs, are not capitalized and expenditure is reflected in the statement of income in theyear in which the expenditure is incurred.
The useful lives of intangible assets are assessed to be either finite or indefinite. Intangible assetswith finite lives are amortized over the useful economic life and assessed for impairment wheneverthere is an indication that the intangible assets may be impaired. The amortization period and theamortization method for an intangible asset with a finite useful life are reviewed at least at eachfinancial year-end. Changes in the expected useful life or the expected pattern of consumption offuture economic benefits embodied in the asset is accounted for by changing the amortization periodor method, as appropriate, and they are treated as changes in accounting estimates. The amortizationexpense on intangible assets with finite lives is recognized in the statement of income under‘Amortization of intangible assets’.
Intangible assets with indefinite useful lives are tested for impairment annually either individually orat the CGU level. Such intangibles are not amortized. The useful life of an intangible asset with anindefinite life is reviewed annually to determine whether indefinite life assessment continues to besupportable. If not, the change in the useful life assessment from indefinite to finite is made on aprospective basis.
Gains or losses arising from the derecognition of an intangible asset are measured as the differencebetween the net disposal proceeds and the carrying amount of the asset and are recognized in thestatement of income when the asset is derecognized.
Branch licensesBranch licenses arise from the acquisition of branches from local banks and licenses to operate newbranches from the BSP. Branch licenses have indefinite useful lives and are tested for impairment onan annual basis.
Software costsSoftware costs are carried at cost less accumulated amortization and any impairment in value. Giventhe history of rapid changes in technology, computer software are susceptible to technologicalobsolescence. Therefore, it is likely that their useful life is short. Software costs are amortized on astraight-line basis over five years but maybe shorter depending on the period over which the Bankexpects to use the asset.
Notes to Financial Statements
Philippine Savings Bank • 37
Notes to Financial Statements - 14 -
*SGVFS026939*
Impairment of Non-financial Assets
Property and equipment, investment properties and chattel mortgage propertiesAt each statement of condition date, the Bank assesses whether there is any indication that its non-financial assets may be impaired. When an indicator of impairment exists or when an annualimpairment testing for an asset is required, the Bank makes a formal estimate of the recoverableamount. An asset’s recoverable amount is the higher of an asset’s or CGU’s fair value less costs tosell and its value in use and is determined for an individual asset, unless the asset does not generatecash inflows that are largely independent of those from other assets or groups of assets, in which casethe recoverable amount is assessed as part of the CGU to which it belongs. Where the carryingamount of an asset or CGU exceeds its recoverable amount, the asset is considered impaired and iswritten down to its recoverable amount.
In assessing value in use, the estimated future cash flows are discounted to their present value using apre-tax discount rate that reflects current market assessments of the time value of money and the risksspecific to the asset. In determining fair value less cost to sell, an appropriate valuation model isused. These calculations are corroborated by valuation multiples and other available fair valueindicators.
An impairment loss is charged to operations in the year in which it arises.
An assessment is made at each statement of condition date as to whether there is any indication thatpreviously recognized impairment losses may no longer exist or may have decreased. If suchindication exists, the Bank estimates the asset’s or CGU’s recoverable amount. A previouslyrecognized impairment loss is reversed only if there has been a change in the estimates used todetermine the asset’s recoverable amount since the last impairment loss was recognized. The reversalis limited so that the carrying amount of the asset does not exceed its recoverable amount, norexceeds the carrying amount that would have been determined, net of depreciation, had noimpairment loss been previously recognized. Such reversal is recognized in the statement of income.After such reversal, the depreciation expense is adjusted in future years to allocate the asset’s revisedcarrying amount, less any residual value, on a systematic basis over its remaining life.
GoodwillGoodwill is reviewed for impairment, annually or more frequently if events or changes incircumstances indicate that the carrying value may be impaired.
Impairment is determined for goodwill by assessing the recoverable amount of the CGU (or group ofCGU) to which the goodwill relates. Where the recoverable amount of the CGU (or group of CGU)is less than the carrying amount of the CGU (or group of CGU) to which goodwill has been allocated,an impairment loss is recognized immediately in the statement of income. Impairment losses relatingto goodwill cannot be reversed for subsequent increases in its recoverable amount in future periods.The Bank performs its annual impairment test of goodwill as at December 31 of each year.
Intangible assetsIntangible assets with indefinite useful lives are tested for impairment annually as at December 31 ofeach year, either individually or at the CGU level, as appropriate.
Intangible assets with finite lives are assessed for impairment whenever there is an indication that theintangible asset may be impaired.

38 • 2017 Annual Report •
- 15 -
*SGVFS026939*
Investment in a joint ventureAfter application of the equity method, the Bank determines whether it is necessary to recognize animpairment loss on the Bank’s investment in a joint venture. The Bank determines at each statementof condition date whether there is any objective evidence that the investment a joint venture isimpaired. If this is the case, the Bank calculates the amount of impairment as being the differencebetween the fair value of the investment in the joint venture and the carrying amount and recognizessuch amount in the statement of income.
LeasesThe determination of whether an arrangement is, or contains a lease is based on the substance of thearrangement and requires an assessment at inception date of whether the fulfillment of thearrangement is dependent on the use of a specific asset or assets or the arrangement conveys a right touse the asset. A reassessment is made after inception of the lease only if one of the following applies:
a. there is a change in contractual terms, other than a renewal or extension of the arrangement;b. a renewal option is exercised or extension granted, unless that term of the renewal or extension
was initially included in the lease term;c. there is a change in the determination of whether fulfillment is dependent on a specified asset; or,d. there is a substantial change to the asset.
Where a reassessment is made, lease accounting shall commence or cease from the date when thechange in circumstances gives rise to the reassessment for scenarios (a), (c) or (d) above, and at thedate of renewal or extension period for scenario (b).
Bank as a lesseeLeases where the lessor retains substantially all the risks and benefits of ownership of the assets areclassified as operating leases. Operating lease payments are recognized as an expense in thestatement of income on a straight-line basis over the lease term.
Bank as a lessorLeases where the Bank does not transfer substantially all the risks and benefits of ownership of theasset are classified as operating leases. Initial direct costs incurred in negotiating an operating leaseare added to the carrying amount of the leased asset and recognized over the lease term on the samebasis as rental income. Contingent rents are recognized as income in the period in which they areearned.
Common StockCommon stocks are recorded at par. Proceeds in excess of par value are recognized under equity as‘Capital Paid in Excess of Par Value’ in the statement of condition. Incremental costs incurred whichare directly attributable to the issuance of new shares are shown in equity as a deduction fromproceeds, net of tax.
Revenue RecognitionRevenue is recognized to the extent that it is probable that future economic benefits will flow to theBank and revenue can be measured reliably, regardless of when the payment is being made. Revenueis measured at the fair value of the consideration received or receivable, taking into accountcontractually defined terms and payment excluding taxes or duty. The Bank assesses its revenuearrangements against specific criteria in order to determine if it is acting as principal or agent.
Notes to Financial Statements

Philippine Savings Bank • 39
Notes to Financial Statements - 16 -
*SGVFS026939*
The Bank concluded that it is acting as a principal in all of its revenue arrangements. The followingspecific recognition criteria must also be met before revenue is recognized:
Interest incomeFor all financial instruments measured at amortized cost and interest-bearing financial assetsclassified as AFS and financial instruments designated at FVPL, interest income or expense isrecorded using the EIR. EIR is the rate that exactly discounts estimated future cash payments orreceipts through the expected life of the financial instrument or a shorter period, where appropriate, tothe net carrying amount of the financial asset or financial liability. The calculation takes into accountall contractual terms of the financial instrument (for example, prepayment options), includes any feesor incremental costs that are directly attributable to the instrument and are an integral part of the EIR,but not future credit losses.
The carrying amount of the financial asset or financial liability is adjusted if the Bank revises itsestimates of payments or receipts. The adjusted carrying amount is calculated based on the originalEIR and the change in carrying amount is recorded as ‘Interest income’.
Once the recorded value of a financial asset or group of similar financial assets has been reduced dueto an impairment loss, interest income continues to be recognized using the original EIR used todiscount future cash flows for the purpose of measuring the impairment loss.
Service fees and commission incomeFees earned for the provision of services over a period of time are accrued over that period. Thesefees include fiduciary fees, credit-related fees and other service and management fees.
Income from sale of property and equipment, investment property and chattel mortgage propertiesIncome from sale of properties is recognized upon completion of the earning process when thesignificant risks and rewards of ownership of the goods have passed to the buyer and the collectibilityof the sales price is reasonably assured.
Trading and securities gains (losses) - netTrading and securities gain (loss) represents results arising from trading activities, including all gainsand losses from changes in the fair values of financial instruments at FVPL. It also includes gainsand losses realized from sale of AFS financial assets.
Realized gains and losses on disposals of financial instruments at FVPL are calculated using weightedaverage method. It represents the difference between an instrument’s initial carrying amount anddisposal amount.
Rental incomeRental income arising from leased properties is accounted for on a straight-line basis over the leaseterms of ongoing leases and is recorded in the statement of income under ‘Miscellaneous’ in otheroperating income.
Dividend incomeDividend income is recognized when the Bank’s right to receive payment is established, which isgenerally when shareholders approve the dividend.
Other incomeIncome from sale of service is recognized when services are rendered.
40 • 2017 Annual Report •
- 17 -
*SGVFS026939*
Expense RecognitionExpenses are recognized when it is probable that a decrease in future economic benefit related to adecrease in an asset or an increase in liability has occurred and the decrease in economic benefits canbe measured reliably. Revenues and expenses that relate to the same transaction or other event arerecognized simultaneously.
Interest expenseInterest expense for all interest-bearing financial liabilities are recognized in ‘Interest expense’ in thestatement of income using the EIR of the financial liabilities to which they relate.
Other expenseExpenses encompass losses as well as those expenses that arise in the ordinary course of business ofthe Bank. Expenses are recognized when incurred.
Business Combination and GoodwillBusiness combinations are accounted for using the acquisition method. This involves recognizingidentifiable assets (including previously unrecognized intangible assets) and liabilities (includingcontingent liabilities and excluding future restructuring) of the acquired business at fair value. Anyexcess of the cost of acquisition over the fair values of the identifiable net assets acquired isrecognized as goodwill. If the cost of acquisition is less than the fair values of the identifiable netassets acquired, the discount on acquisition is recognized directly in the statement of income in theyear of acquisition.
Goodwill is initially measured at cost being the excess of the acquisition cost over the share in the netfair value of the acquired identifiable assets, liabilities and contingent liabilities. The Bank’sgoodwill arose from past purchases of branch business/offices from the Parent Company.
After initial recognition, goodwill is measured at cost less any accumulated impairment losses. Forthe purpose of impairment testing, goodwill acquired is, from the acquisition date, allocated to eachof the CGU or group of CGUs that are expected to benefit from the synergies of the combination,irrespective of whether the acquired other assets or liabilities are assigned to those units.
Where goodwill forms part of a CGU and part of the operation within that unit is disposed of, thegoodwill associated with the operation disposed of is included in the carrying amount of the operationwhen determining the gain or loss on disposal of the operation. Goodwill disposed of in thiscircumstance is measured based on the relative values of the operation disposed of and the portion ofthe CGU retained.
Retirement Cost
Defined Benefit PlanThe net defined benefit liability or asset is the aggregate of the present value of the defined benefitobligation at the statement of condition date reduced by the fair value of plan assets, adjusted for anyeffect of limiting a net defined benefit asset to the asset ceiling. The present value of the definedbenefit obligation is calculated annually by an independent actuary. The asset ceiling is the presentvalue of any economic benefits available in the form of refunds from the plan or reductions in futurecontributions to the plan.
The cost of providing benefits under the defined benefit plan is actuarially determined using theprojected unit credit method.
Notes to Financial Statements

Philippine Savings Bank • 41
Notes to Financial Statements - 18 -
*SGVFS026939*
Defined benefit costs comprise the following:a. service cost;b. net interest on the net defined benefit liability or asset; andc. remeasurements of net defined benefit liability or asset.
Service costs, which include current service costs, past service costs and gains or losses on non-routine settlements are recognized as expense in profit or loss. Past service costs are recognizedwhen plan amendment or curtailment occurs. These amounts are calculated periodically byindependent qualified actuaries.
Net interest on the net defined benefit liability or asset is the change during the period in the netdefined benefit liability or asset that arises from the passage of time which is determined by applyingthe discount rate based on Philippine government bonds to the net defined benefit liability or asset.Net interest on the net defined benefit liability or asset is recognized as expense or income in profit orloss.
Remeasurements comprising actuarial gains and losses, return on plan assets and any change in theeffect of the asset ceiling (excluding net interest on defined benefit liability) are recognizedimmediately in OCI in the period in which they arise. Remeasurements are not reclassified to profitor loss in subsequent periods.
Plan assets are assets that are held by a long-term employee benefit fund or qualifying insurancepolicies. Plan assets are not available to the creditors of the Bank, nor can they be paid directly to theBank. The fair value of plan assets is based on market price information. When no market price isavailable, the fair value of plan assets is estimated by discounting expected future cash flows using adiscount rate that reflects both the risk associated with the plan assets and the maturity or expecteddisposal date of those assets (or, if they have no maturity, the expected period until the settlement ofthe related obligations). If the fair value of the plan assets is higher than the present value of thedefined benefit obligation, the measurement of the resulting defined benefit asset is limited to thepresent value of economic benefits available in the form of refunds from the plan or reductions infuture contributions to the plan.
The Bank’s right to be reimbursed of some or all of the expenditure required to settle a definedbenefit obligation is recognized as a separate asset at fair value when and only when reimbursement isvirtually certain.
Termination benefitsTermination benefits are employee benefits provided in exchange for the termination of anemployee’s employment as a result of either an entity’s decision to terminate an employee’semployment before the normal retirement date or an employee’s decision to accept an offer ofbenefits in exchange for the termination of employment.
A liability and expense for a termination benefit is recognized at the earlier of when the entity can nolonger withdraw the offer of those benefits and when the entity recognizes related restructuring costs.Initial recognition and subsequent changes to termination benefits are measured in accordance withthe nature of the employee benefit, as either post-employment benefits, short-term employee benefits,or other long-term employee benefits.
Employee leave entitlementEmployee entitlements to annual leave are recognized as a liability when they are accrued to theemployees. The undiscounted liability for leave expected to be settled after the end of the annual
42 • 2017 Annual Report •
- 19 -
*SGVFS026939*
reporting period is recognized for services rendered by employees up to the end of the reportingperiod.
ProvisionsProvisions are recognized when the Bank has a present obligation (legal or constructive) as a result ofa past event and it is probable that an outflow of resources embodying economic benefits will berequired to settle the obligation and a reliable estimate can be made of the amount of the obligation.Where the Bank expects some or all of a provision to be reimbursed, for example, under an insurancecontract, the reimbursement is recognized as a separate asset but only when the reimbursement isvirtually certain. The expense relating to any provision is presented in the statement of income, net ofany reimbursement. If the effect of the time value of money is material, provisions are determined bydiscounting the expected future cash flows at a pre-tax rate that reflects current market assessments ofthe time value of money and, where appropriate, the risks specific to the liability. Where discountingis used, the increase in the provision due to the passage of time is recognized as ‘Interest expense’.
Contingent Liabilities and Contingent AssetsContingent liabilities are not recognized in the financial statements but are disclosed unless thepossibility of an outflow of resources embodying economic benefits is remote. Contingent assets arenot recognized but are disclosed in the financial statements when an inflow of economic benefits isprobable.
Debt Issue CostsIssuance, underwriting and other related expenses incurred in connection with the issuance of debtinstruments are included in the measurement basis of the underlying debt instruments and areamortized as an adjustment to the interest on the underlying debt instruments using the effectiveinterest method.
Income TaxesIncome tax on profit or loss for the year comprises current and deferred tax. Income tax isdetermined in accordance with Philippine tax law. Income tax is recognized in the statement ofincome, except to the extent that it relates to OCI items recognized directly in the statement ofcomprehensive income.
Current taxCurrent income tax is the expected tax payable on the taxable income for the period, using the taxrates enacted at the statement of condition date, together with adjustments to tax payable in respect toprior years.
Deferred taxDeferred income tax is provided, using the balance sheet liability method, on all temporarydifferences at the statement of condition date between the tax bases of assets and liabilities and theircarrying amounts for financial reporting purposes.
Deferred tax liabilities are recognized for all taxable temporary differences, including assetrevaluations. Deferred tax assets are recognized for all deductible temporary differences and carryforward of unused tax losses and tax credits from excess minimum corporate income tax (MCIT) overthe regular corporate income tax (RCIT), to the extent that it is probable that future taxable profit willbe available against which the deductible temporary differences and carry forward of unused taxlosses and MCIT can be utilized.
Notes to Financial Statements
Philippine Savings Bank • 43
Notes to Financial Statements - 20 -
*SGVFS026939*
The carrying amount of deferred tax assets is reviewed at each statement of condition date andreduced to the extent that it is no longer probable that sufficient future taxable profit will be availableto allow all or part of the deferred tax assets to be utilized. Unrecognized deferred tax assets arereassessed at each statement of condition date and are recognized to the extent that it has becomeprobable that future taxable profits will allow the deferred tax assets to be recovered.
Deferred tax assets and liabilities are measured at the tax rates that are applicable to the period whenthe asset is realized or the liability is settled, based on tax rates (and tax laws) that have been enactedor substantively enacted at the statement of condition date.
Deferred tax assets and deferred tax liabilities are offset if a legally enforceable right exists to set offcurrent tax assets against current tax liabilities and deferred taxes related to the same taxable entity andthe same taxation authority.
Current income tax and deferred income tax relating to items recognized directly in OCI is alsorecognized in OCI and not in the statement of income.
Earnings Per ShareBasic earnings per share (EPS) is computed by dividing net income for the year by the weightedaverage number of common shares issued and outstanding during the year, after giving retroactiveeffect to stock dividends declared, stock rights exercised and stock splits, if any, declared during theyear. As of December 31, 2017 and 2016, there were no potential common shares with dilutive effecton the basic EPS of the Bank.
Dividends on Common SharesDividends on common shares are recognized as a liability and deducted from equity when approvedby the BOD of the Bank. Dividends for the year that are approved after the statement of conditiondate are dealt with as subsequent events.
Segment ReportingThe Bank’s operating businesses are organized and managed separately according to the nature of theproducts and services provided, with each segment representing a strategic business unit that offersdifferent products and serves different markets. Financial information on business segments ispresented in Note 6. The Bank’s assets generating revenues are all located in the Philippines(i.e., one geographical location). Therefore, geographical segment information is no longerpresented.
Fiduciary ActivitiesAssets and income arising from fiduciary activities together with related undertakings to return suchassets to customers are excluded from the financial statements, where the Bank acts in a fiduciarycapacity such as nominee, trustee or agent.
Subsequent EventsPost year-end events that provide additional information about the Bank’s position at the statement ofcondition date (adjusting events) are reflected in the financial statements. Post year-end events thatare not adjusting events are disclosed in the notes to the financial statements when material.
Standards issued but not yet effectivePronouncements issued but not yet effective are listed below. Unless otherwise indicated, the Bankdoes not expect the future adoption of the said pronouncements to have a significant impact on itsfinancial statements. The Bank intends to adopt the following pronouncements when they becomeeffective.

44 • 2017 Annual Report •
- 21 -
*SGVFS026939*
Effective beginning on or after January 1, 2018
∂ Amendments to PFRS 2, Share-based Payment, Classification and Measurement of Share-basedPayment TransactionsThe amendments to PFRS 2 address three main areas: the effects of vesting conditions on themeasurement of a cash-settled share-based payment transaction; the classification of a share-based payment transaction with net settlement features for withholding tax obligations; and theaccounting where a modification to the terms and conditions of a share-based paymenttransaction changes its classification from cash settled to equity settled.
On adoption, entities are required to apply the amendments without restating prior periods, butretrospective application is permitted if elected for all three amendments and if other criteria aremet. Early application of the amendments is permitted.
The amendments are not applicable to the Bank since it does not have share-based paymenttransactions.
∂ Amendments to PFRS 4, Insurance Contracts, Applying PFRS 9, Financial Instruments, withPFRS 4The amendments address concerns arising from implementing PFRS 9, the new financialinstruments standard before implementing the forthcoming insurance contracts standard. Theyallow entities to choose between the overlay approach and the deferral approach to deal with thetransitional challenges. The overlay approach gives all entities that issue insurance contracts theoption to recognize in other comprehensive income, rather than profit or loss, the volatility thatcould arise when PFRS 9 is applied before the new insurance contracts standard is issued. On theother hand, the deferral approach gives entities whose activities are predominantly connectedwith insurance an optional temporary exemption from applying PFRS 9 until the earlier ofapplication of the forthcoming insurance contracts standard or January 1, 2021.
The overlay approach and the deferral approach will only be available to an entity if it has notpreviously applied PFRS 9.
The amendments are not applicable to the Bank since it does not have activities that arepredominantly connected with insurance or issue insurance contracts.
∂ Amendments to PAS 28, Measuring an Associate or Joint Venture at Fair Value (Part of AnnualImprovements to PFRSs 2014 - 2016 Cycle)The amendments clarify that an entity that is a venture capital organization, or other qualifyingentity, may elect, at initial recognition on an investment-by-investment basis, to measure itsinvestments in associates and joint ventures at fair value through profit or loss. They also clarifythat if an entity that is not itself an investment entity has an interest in an associate or jointventure that is an investment entity, the entity may, when applying the equity method, elect toretain the fair value measurement applied by that investment entity associate or joint venture tothe investment entity associate’s or joint venture’s interests in subsidiaries. This election is madeseparately for each investment entity associate or joint venture, at the later of the date on which(a) the investment entity associate or joint venture is initially recognized; (b) the associate or jointventure becomes an investment entity; and (c) the investment entity associate or joint venture firstbecomes a parent. The amendments should be applied retrospectively, with earlier applicationpermitted.
Notes to Financial Statements

Philippine Savings Bank • 45
Notes to Financial Statements - 22 -
*SGVFS026939*
∂ Amendments to PAS 40, Investment Property, Transfers of Investment PropertyThe amendments clarify when an entity should transfer property, including property underconstruction or development into, or out of investment property. The amendments state that achange in use occurs when the property meets, or ceases to meet, the definition of investmentproperty and there is evidence of the change in use. A mere change in management’s intentionsfor the use of a property does not provide evidence of a change in use. The amendments shouldbe applied prospectively to changes in use that occur on or after the beginning of the annualreporting period in which the entity first applies the amendments. Retrospective application isonly permitted if this is possible without the use of hindsight.
∂ Philippine Interpretation IFRIC-22, Foreign Currency Transactions and Advance ConsiderationThe interpretation clarifies that in determining the spot exchange rate to use on initial recognitionof the related asset, expense or income (or part of it) on the derecognition of a non-monetary assetor non-monetary liability relating to advance consideration, the date of the transaction is the dateon which an entity initially recognizes the nonmonetary asset or non-monetary liability arisingfrom the advance consideration. If there are multiple payments or receipts in advance, then theentity must determine a date of the transactions for each payment or receipt of advanceconsideration. The interpretation may be applied on a fully retrospective basis. Entities mayapply the interpretation prospectively to all assets, expenses and income in its scope that areinitially recognized on or after the beginning of the reporting period in which the entity firstapplies the interpretation or the beginning of a prior reporting period presented as comparativeinformation in the financial statements of the reporting period in which the entity first applies theinterpretation.
New Standards
PFRS 9, Financial InstrumentsPFRS 9 reflects all phases of the financial instruments project and replaces PAS 39, FinancialInstruments: Recognition and Measurement, and all previous versions of PFRS 9. The standardintroduces new requirements for classification and measurement, impairment, and hedge accounting.Retrospective application is required but providing comparative information is not compulsory. Forhedge accounting, the requirements are generally applied prospectively, with some limitedexceptions. The Bank plans to adopt the new standard on the mandatory effective date and will notrestate comparative information. The Bank has performed an assessment of the population offinancial instruments impacted by the classification and measurement requirements of PFRS 9 andhas developed impairment methodologies to support the calculation of expected credit losses (ECL)for qualified credit exposures.
a. Classification and MeasurementPFRS 9 requires that the Bank classifies debt instruments based on the contractual cash flowcharacteristics of the assets and the business model for managing those assets. These factorsdetermine whether the financial assets are measured at amortized cost, fair value through othercomprehensive income (FVOCI), or fair value through profit or loss (FVTPL).
As a result of the application of the classification and measurement requirements of PFRS 9, debtsecurities currently held as AFS investments under PAS 39 are expected to be classified as eitherat amortized cost for securities belonging to portfolios managed under a “hold-to-collect” (HTC)business model or at FVOCI with recycling to profit or loss for securities belonging to portfoliosmanaged under a “hold-to-collect-and-sell” business model. The Bank expects to reclassify moredebt securities currently held as AFS investments to amortized cost than to FVOCI. Loans andother receivables are expected to be managed under an “HTC” business model and thus qualifyfor amortized cost measurement.
46 • 2017 Annual Report •
- 23 -
*SGVFS026939*
Investments in unquoted equity shares currently carried at cost under PAS 39 are expected to bemeasured at FVTPL. Quoted equity shares currently held as AFS investments can be measured atFVTPL, which will increase volatility in profit or loss, except for certain AFS investments thatwill be designated as FVOCI with no recycling to profit or loss.
b. ImpairmentPFRS 9 requires the Bank to record ECL for all loans and other debt financial assets not classifiedas at FVTPL, together with loan commitments and financial guarantee contracts.
Incurred loss versus expected credit loss methodologyThe application of ECL will significantly change the Bank’s credit loss methodology and models.ECL represent credit losses that reflect an unbiased and probability-weighted amount which isdetermined by evaluating a range of possible outcomes, the time value of money and reasonableand supportable information about past events, current conditions and forecasts of futureeconomic conditions. The objective of the new impairment standard is to record lifetime losseson all financial instruments which have experienced a significant increase in credit risk (SICR)since their initial recognition. As a result, ECL allowances will be measured at amounts equal toeither (i) 12-month ECL or (ii) lifetime ECL for those financial instruments which haveexperienced a SICR since initial recognition (General Approach). The 12-month ECL is theportion of lifetime ECL that results from default events on a financial instrument that are possiblewithin the 12 months after the reporting date. Lifetime ECL are credit losses that results from allpossible default events over the expected life of a financial instrument. In comparison, thepresent incurred loss model recognizes lifetime credit losses only when there is objectiveevidence of impairment.
Staging assessmentFor non-credit-impaired financial instruments:∂ Stage 1 is comprised of all non-impaired financial instruments which have not experienced a
SICR since initial recognition. The Bank recognizes a 12-month ECL for Stage 1 financialinstruments.
∂ Stage 2 is comprised of all non-impaired financial instruments which have experienced aSICR since initial recognition. The Bank recognizes a lifetime ECL for Stage 2 financialinstruments.
For credit-impaired financial instruments:∂ Financial instruments are classified as Stage 3 when there is objective evidence of
impairment as a result of one or more loss events that have occurred after initial recognitionwith a negative impact on the estimated future cash flows of a loan or a portfolio of loans.The ECL model requires that lifetime ECL be recognized for impaired financial instruments.
Definition of “default” and “cure”The Bank defines a financial instrument as in default, which is fully aligned with the definition ofcredit impaired, in all cases when the borrower becomes 90 days past due on its contractualpayments. As a part of a qualitative assessment of whether a customer is in default, the Bank alsoconsiders a variety of instances that may indicate unlikeliness to pay. When such events occur,the Bank carefully considers whether the event should result in treating the customer as defaulted.An instrument is considered to be no longer in default (i.e., to have cured) when it no longermeets any of the default criteria for a consecutive period of 180 days and has exhibited asatisfactory track record.
Notes to Financial Statements
Philippine Savings Bank • 47
Notes to Financial Statements - 24 -
*SGVFS026939*
Credit risk at initial recognitionThe Bank uses internal credit assessment and approvals at various levels to determine the creditrisk of exposures at initial recognition. Assessment can be quantitative or qualitative and dependson the materiality of the facility or the complexity of the portfolio to be assessed.
Significant increase in credit riskThe criteria for determining whether credit risk has increased significantly vary by portfolio andinclude quantitative changes in probabilities of default and qualitative factors, including abackstop based on delinquency. The credit risk of a particular exposure is deemed to haveincreased significantly since initial recognition if, based on the Bank’s internal credit assessment,the borrower or counterparty is determined to require close monitoring or with well-defined creditweaknesses. For exposures without internal credit grades, if contractual payments are more thana specified days past due threshold, the credit risk is deemed to have increased significantly sinceinitial recognition. Days past due are determined by counting the number of days since theearliest elapsed due date in respect of which full payment has not been received. Due dates aredetermined without considering any grace period that might be available to the borrower. Insubsequent reporting periods, if the credit risk of the financial instrument improves such thatthere is no longer a SICR since initial recognition, the Bank shall revert to recognizing a12-month ECL.
RestructuringIn certain circumstances, the Bank modifies the original terms and conditions of a credit exposureto form a new loan agreement or payment schedule. The modifications can be given dependingon the borrower’s or counterparty’s current or expected financial difficulty. The modificationsmay include, but are not limited to, change in interest rate and terms, principal amount, maturitydate, date and amount of periodic payments and accrual of interest and charges. Distressedrestructuring with indications of unlikeliness to pay are categorized as impaired accounts and aremoved to Stage 3.
ECL parameters and methodologiesECL is a function of the probability of default (PD), exposure at default (EAD) and loss givendefault (LGD), with the timing of the loss also considered, and is estimated by incorporatingforward-looking economic information and through the use of experienced credit judgment.
The PD represents the likelihood that a credit exposure will not be repaid and will go into defaultin either a 12-month horizon for Stage 1 or lifetime horizon for Stage 2. The PD for eachindividual instrument is modelled based on historic data and is estimated based on current marketconditions and reasonable and supportable information about future economic conditions. TheBank segmented its credit exposures based on homogenous risk characteristics and developed acorresponding PD methodology for each portfolio. The PD methodology for each relevantportfolio is determined based on the underlying nature or characteristic of the portfolio, behaviorof the accounts and materiality of the segment as compared to the total portfolio.
EAD is modelled on historic data and represents an estimate of the outstanding amount of creditexposure at the time a default may occur. For off-balance sheet and undrawn amounts, EADincludes an estimate of any further amounts to be drawn at the time of default. LGD is theamount that may not be recovered in the event of default and is modelled based on historical cashflow recovery and reasonable and supportable information about future economic conditions,where appropriate. LGD takes into consideration the amount and quality of any collateral held.
48 • 2017 Annual Report •
- 25 -
*SGVFS026939*
Economic overlaysThe Bank incorporates economic overlays into both its assessment of whether the credit risk of aninstrument has increased significantly since its initial recognition and its measurement of ECL. Abroad range of economic overlays are considered as economic inputs, such as GDP growth,inflation rates, unemployment rates, interest rates and BSP statistical indicators. The inputs andmodels used for calculating ECL may not always capture all characteristics of the market at thedate of the financial statements. To reflect this, qualitative adjustments or overlays areoccasionally made as temporary adjustments when such differences are significantly material.
The Bank has determined that the financial and operational aspects of the ECL methodologiesunder PFRS 9 will have an impact to the 2018 financial statements.
c. Hedge AccountingThe new hedge accounting model under PFRS 9 aims to simplify hedge accounting, align theaccounting for hedge relationships more closely with an entity’s risk management activities andpermit hedge accounting to be applied more broadly to a greater variety of hedging instrumentsand risks eligible for hedge accounting. The Bank has assessed that the adoption of theseamendments will not have any impact in the 2018 financial statements.
The Bank has applied its existing governance framework to ensure that appropriate controls andvalidations are in place over key processes and judgments in implementing PFRS 9. The Bank iscontinuously refining its internal controls and processes which are relevant in the properimplementation of the PFRS 9.
PFRS 15, Revenue from Contracts with CustomersPFRS 15 establishes a new five-step model that will apply to revenue arising from contracts withcustomers. Under PFRS 15, revenue is recognized at an amount that reflects the consideration towhich an entity expects to be entitled in exchange for transferring goods or services to a customer.The principles in PFRS 15 provide a more structured approach to measuring and recognizing revenue.
The new revenue standard is applicable to all entities and will supersede all current revenuerecognition requirements under PFRSs. Either a full or modified retrospective application is requiredfor annual periods beginning on or after January 1, 2018. The Bank is currently assessing the impactof adopting PFRS 15.
Effective beginning on or after January 1, 2019
New Standards
PFRS 16, LeasesUnder the new standard, lessees will no longer classify their leases as either operating or financeleases in accordance with PAS 17, Leases. Rather, lessees will apply the single-asset model. Underthis model, lessees will recognize the assets and related liabilities for most leases on their balancesheets, and subsequently, will depreciate the lease assets and recognize interest on the lease liabilitiesin their profit or loss. Leases with a term of 12 months or less or for which the underlying asset is oflow value are exempted from these requirements. The accounting by lessors is substantiallyunchanged as the new standard carries forward the principles of lessor accounting under PAS 17.Lessors, however, will be required to disclose more information in their financial statements,particularly on the risk exposure to residual value. Entities may early adopt PFRS 16 but only if theyhave also adopted PFRS 15. When adopting PFRS 16, an entity is permitted to use either a fullretrospective or a modified retrospective approach, with options to use certain transition reliefs. TheBank is currently assessing the impact of adopting PFRS 16.
Notes to Financial Statements

Philippine Savings Bank • 49
Notes to Financial Statements - 26 -
*SGVFS026939*
Amendments
Amendments to PFRS 9, Prepayment Features with Negative CompensationThe amendments to PFRS 9 allow debt instruments with negative compensation prepayment featuresto be measured at amortized cost or fair value through other comprehensive income. An entity shallapply these amendments for annual reporting periods beginning on or after January 1, 2019. Earlierapplication is permitted.
Amendments to PAS 28, Long-term Interests in Associates and Joint VenturesThe amendments to PAS 28 clarify that entities should account for long-term interests in an associateor joint venture to which the equity method is not applied using PFRS 9. An entity shall apply theseamendments for annual reporting periods beginning on or after January 1, 2019. Earlier application ispermitted.
Philippine Interpretation IFRIC 23, Uncertainty over Income Tax TreatmentsPhilippine Interpretation IFRIC 23 addresses the accounting for income taxes when tax treatmentsinvolve uncertainty that affects the application of PAS 12 and does not apply to taxes or leviesoutside the scope of PAS 12, nor does it specifically include requirements relating to interest andpenalties associated with uncertain tax treatments.
The interpretation specifically addresses the following:∂ Whether an entity considers uncertain tax treatments separately∂ The assumptions an entity makes about the examination of tax treatments by taxation authorities∂ How an entity determines taxable profit (tax loss), tax bases, unused tax losses, unused tax credits
and tax rates∂ How an entity considers changes in facts and circumstances
An entity must determine whether to consider each uncertain tax treatment separately or together withone or more other uncertain tax treatments. The approach that better predicts the resolution of theuncertainty should be followed.
The Bank is currently assessing the impact of adopting this interpretation.
Impact of TRAIN on the Bank’s 2017 financial statements:∂ “Republic Act (RA) No. 10963 of the Tax Reform for Accelaration and inclusion Act (TRAIN)
was signed into law on December 19, 2017 and took effect January 01, 2018, making the new taxlaw enacted as of the reporting date. Although the TRAIN changes existing tax law and includesseveral provisions that will generally affect business on a prospective basis, the managementassessed that the same will not have any significant impact on the financial statement balances asof the reporting date.”
Deferred effectivity
Amendments to PFRS 10, Consolidated Financial Statements and PAS 28, Investments in Associatesand Joint Ventures - Sale or Contribution of Assets between an Investor and its Associate or JointVenture
The amendments address the conflict between PFRS 10 and PAS 28 in dealing with the loss ofcontrol of a subsidiary that is sold or contributed to an associate or joint venture. The amendmentsclarify that a full gain or loss is recognized when a transfer to an associate or joint venture involves abusiness as defined in PFRS 3, Business Combinations. Any gain or loss resulting from the sale or
50 • 2017 Annual Report •
- 27 -
*SGVFS026939*
contribution of assets that does not constitute a business, however, is recognized only to the extent ofunrelated investors’ interests in the associate or joint venture. On January 13, 2016, the FRSCpostponed the original effective date of January 1, 2016 of the said amendments until the IASB hascompleted its broader review of the research project on equity accounting that may result in thesimplification of accounting for such transactions and of other aspects of accounting for associatesand joint ventures.
3. Significant Accounting Judgments, Estimates and Assumptions
The preparation of the financial statements in accordance with PFRS requires the management tomake judgments, estimates and assumptions that affect the reported amount of revenues, expenses,assets and liabilities, and the accompanying disclosures, as well as the disclosure of contingent assetsand contingent liabilities. Uncertainty about these assumptions and estimates could result inoutcomes that require a material adjustment to the carrying amount of assets and liabilities affected infuture periods. The effects of any change in judgments, estimates and assumptions are reflected inthe financial statements as they become reasonably determinable.
Judgments, estimates and assumptions are continually evaluated and are based on historicalexperience and other factors, including expectations of future events that are believed to bereasonable under the circumstances.
JudgmentsIn the process of applying the Bank’s accounting policies, management has made the followingjudgments, which have the most significant effect on the amounts recognized in the financialstatements:
(a) Fair value of financial instrumentsWhen the fair values of financial assets and financial liabilities in the statement of conditioncannot be measured based on quoted prices in active markets, their fair value is measured usingvaluation techniques including the discounted cash flow model. The inputs to these models aretaken from observable markets where possible, but where this is not feasible, a degree ofjudgement is required in establishing fair values. Judgments include considerations of inputssuch as liquidity risk, credit risk and volatility for longer-dated derivatives and discount rates,prepayments and default rates assumptions. Changes in assumptions about these factors couldaffect the reported fair value of financial instruments.
The fair values of the Bank’s financial instruments are disclosed in Note 4.
(b) Classification of HTM investmentsThe classification to HTM investment requires significant judgment. In making this judgment,the Bank evaluates its intention and ability to hold such investments to maturity.If the Bank fails to keep these investments to maturity other than in certain specificcircumstances - for example, selling an insignificant amount close to maturity - it will be requiredto reclassify the entire portfolio to AFS investments. The investments would therefore bemeasured at fair value and not at amortized cost.
Estimates and AssumptionsThe key assumptions concerning the future and other key sources of estimation uncertainty at thestatement of condition date, which have a significant risk of causing a material adjustment to thecarrying amounts of assets and liabilities within the next period, are described below. The Bankbased its assumptions and estimates on parameters available when the financial statements were
Notes to Financial Statements
Philippine Savings Bank • 51
Notes to Financial Statements - 28 -
*SGVFS026939*
prepared. Existing circumstances and assumptions about future developments, however, may changedue to market changes or circumstances beyond the control of the Bank. Such changes are reflectedin the assumptions when they occur.
(a) Credit losses on loans and receivablesThe Bank reviews its loans and receivables at each statement of condition date to assess whetheran impairment loss should be recorded in the statement of income. In particular, for provisionscalculated on an individual basis, judgment made by management is required in the estimation ofthe amount and timing of future cash flows when determining the level of allowance required.Such estimates are based on assumptions about a number of factors including the assessment ofthe financial condition of the counterparty, and estimated net selling prices of collateral, andactual results may differ, at which event, the Bank adjusts the impairment loss and ensures thatallowance for it remains adequate (Note 5).
In addition to specific allowance against individually significant loans and receivables, the Bankalso provides a collective impairment allowance against exposures which, although notspecifically identified as requiring a specific allowance, have a greater risk of default than whenoriginally granted. This collective allowance take into consideration historical loss rates,recovery rates and net flow rates.
The carrying value of loans and receivables and allowance for credit losses on loans andreceivables are disclosed in Notes 9 and 15, respectively.
(b) Impairment of non-financial assets
Investment properties and chattel mortgage propertiesThe Bank assesses impairment on its non-financial assets whenever events or changes incircumstances indicate that the carrying amount of an asset may not be recoverable. The factorsthat the Bank considers important which could trigger an impairment review include thefollowing:
∂ significant underperformance relative to expected historical or projected future operatingresults;
∂ significant changes in the manner of use of the acquired assets or the strategy for overallbusiness; and
∂ significant negative industry or economic trends.
The Bank recognizes an impairment loss whenever the carrying amount of an asset exceeds itsrecoverable amount. The recoverable amount is computed using the fair value less costs to sellfor property and equipment, investment properties and chattel mortgage properties. Recoverableamounts are estimated for individual assets or, if it is not possible, for the CGU to which the assetbelongs.
The carrying values of the Bank’s investment properties and chattel mortgage properties aredisclosed in Notes 11, 12 and 14, respectively.
52 • 2017 Annual Report •
- 29 -
*SGVFS026939*
Investment in a joint ventureThe Bank assesses impairment on its investment in a joint venture whenever events or changes incircumstances indicate that the carrying amount of said asset may not be recoverable. Amongothers, the factors that the Bank considers important which could trigger an impairment review onits investment in a joint venture include the following:
∂ deteriorating or poor financial condition;∂ recurring net losses; and∂ significant changes (i.e., technological, market, economic, or legal environment in which the
joint venture operates with an adverse effect on the joint venture have taken place during theperiod, or will take place in the near future).
An impairment loss is recognized whenever the carrying amount of an asset exceeds itsrecoverable amount. The recoverable amount is determined based on the asset’s value in use. Asof December 31, 2017 and 2016, the carrying values of the Bank’s investment in a joint ventureamounted to P=607.2 million and P=727.2 million, respectively (Note 10).
(c) Present value of retirement obligationThe cost of defined benefit pension plans as well as the present value of the pension obligationare determined using actuarial valuations. The actuarial valuation involves making variousassumptions. These include the determination of the discount rates, future salary increases, andfuture pension increases. Due to the complexity of the valuation, the underlying assumptions andits long-term nature, defined benefit obligations are highly sensitive to changes in theseassumptions. All assumptions are reviewed at each statement of condition date.
In determining the appropriate discount rate, management considers the interest rates ofPhilippine government bonds that are denominated in the currency in which the benefits will bepaid, with extrapolated maturities corresponding to the expected duration of the defined benefitobligation.
The details of assumptions used in the actuarial valuation are disclosed in Note 24.
As of December 31, 2017 and 2016 the net pension liability of the Bank amounted toP=515.9 million and P=748.8 million, respectively (Note 24).
(d) Recognition of deferred tax assetsDeferred tax assets are recognized for all unused tax losses to the extent that it is probable thatfuture taxable profit will be available against which the losses can be utilized. Significantmanagement judgment is required to determine the amount of deferred tax assets that can berecognized, based upon the availability of future taxable income in reference to financial forecast,tax strategies and expected future market or economic conditions.
Estimates of future taxable income indicate that temporary differences will be realized in thefuture. Net deferred tax assets as of December 31, 2017 and 2016 amounted to P=1.4 billion andP=1.3 billion, respectively (Note 27).
(e) Contingent liabilitiesThe Bank is a defendant in legal actions arising from its normal business activities. Managementbelieves that the ultimate liability, if any, resulting from these cases will not have a materialeffect on the Bank’s financial statements (Note 31).
Notes to Financial Statements
Philippine Savings Bank • 53
Notes to Financial Statements- 30 -
*SGVFS026939*
4. Fair Value Measurement
Financial InstrumentsThe following describes the methodologies and assumptions used to determine the fair values offinancial instruments:
Cash and other cash items, due from BSP, due from other banks, interbank loans receivable andSPURA, accounts receivable, accrued interest receivable, bills purchased, RCOCI, shortages, andpetty cash fund - Carrying amounts approximate fair values due to the relatively short-term maturitiesof these assets.
Debt investments - Fair values are generally based on quoted market prices. If the market prices arenot readily available, fair values are estimated using either values obtained from independent partiesoffering pricing services, or adjusted quoted market prices of comparable investments or using thediscounted cash flow methodology, using rates currently available for debt on similar terms, creditrisk and remaining maturities.
Quoted AFS equity investments - Fair values are based on quoted prices published in markets.Unquoted AFS equity investments - Fair values could not be reliably determined due to theunpredictable nature of future cash flows and the lack of suitable methods of arriving at a reliable fairvalue. Hence, these investments are carried at cost less allowance for impairment losses.
Currently, there is no available market to sell these unquoted AFS equity investments. The Bank willhold onto these investments until management decides to sell them when there will be offers to buyout such investments or the appearance of an available market where the investments can be sold.
Derivative instruments (included under FVPL) - Fair values are estimated based on quoted marketprices provided by independent parties or derived using acceptable valuation models. The modelsutilize published underlying rates (e.g., foreign exchange (FX) rates and forward FX rates).
Receivable from customers, sales contract receivables and security deposits - Fair values areestimated using the discounted cash flow methodology, using the Bank’s current lending rates forsimilar types of loans. The discount rates used range from 6.00% to 30.00% in 2017 and 2016.
Demand deposits, savings deposits, bills payable, treasurer’s, cashier’s and manager’s checks,accrued interest payable, accounts payable, bills purchased-contra, other credits, due to theTreasurer of the Philippines, deposits for keys-SDB, payment orders payable and overages - Carryingamounts approximate fair values due to either the demand nature or the relatively short-termmaturities of these liabilities.
Subordinated notes and time deposits - Fair values are estimated using the discounted cash flowmethodology using the Bank’s borrowing rates for similar borrowings with maturities consistent withthose remaining for the liability being valued. The discount rates used for subordinated notes are5.22% in 2017 and ranges from 5.63% to 5.89% in 2016. The discount rates used for time depositsrange from 0.25% to 1.75% in 2017 and 2016, respectively.
The inputs used in the fair value measurement based on Level 2 are as follows:
Derivative assets and liabilities - fair values are calculated by reference to the prevailing spotexchange rate as of statement of condition date.
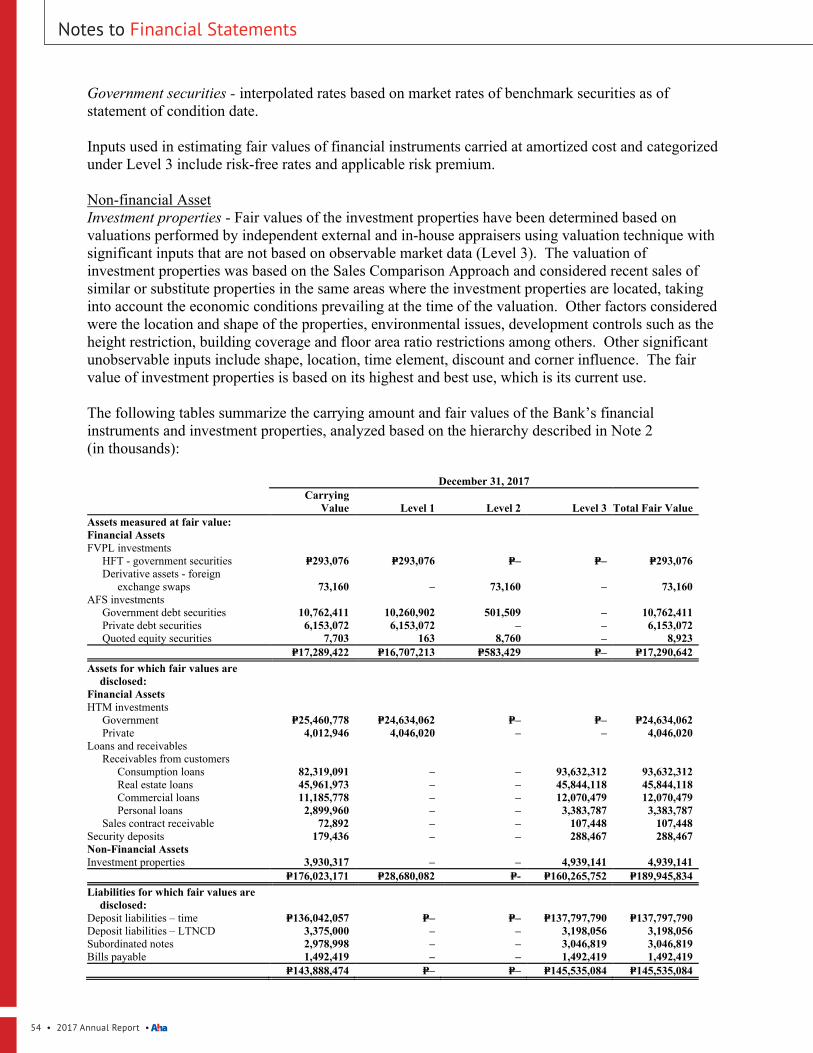
54 • 2017 Annual Report •
- 31 -
*SGVFS026939*
Government securities - interpolated rates based on market rates of benchmark securities as ofstatement of condition date.
Inputs used in estimating fair values of financial instruments carried at amortized cost and categorizedunder Level 3 include risk-free rates and applicable risk premium.
Non-financial AssetInvestment properties - Fair values of the investment properties have been determined based onvaluations performed by independent external and in-house appraisers using valuation technique withsignificant inputs that are not based on observable market data (Level 3). The valuation ofinvestment properties was based on the Sales Comparison Approach and considered recent sales ofsimilar or substitute properties in the same areas where the investment properties are located, takinginto account the economic conditions prevailing at the time of the valuation. Other factors consideredwere the location and shape of the properties, environmental issues, development controls such as theheight restriction, building coverage and floor area ratio restrictions among others. Other significantunobservable inputs include shape, location, time element, discount and corner influence. The fairvalue of investment properties is based on its highest and best use, which is its current use.
The following tables summarize the carrying amount and fair values of the Bank’s financialinstruments and investment properties, analyzed based on the hierarchy described in Note 2(in thousands):
December 31, 2017Carrying
Value Level 1 Level 2 Level 3 Total Fair ValueAssets measured at fair value:Financial AssetsFVPL investments HFT - government securities P=293,076 P=293,076 P=– P=– P=293,076
Derivative assets - foreign exchange swaps 73,160 – 73,160 – 73,160
AFS investments Government debt securities 10,762,411 10,260,902 501,509 – 10,762,411 Private debt securities 6,153,072 6,153,072 – – 6,153,072 Quoted equity securities 7,703 163 8,760 – 8,923
P=17,289,422 P=16,707,213 P=583,429 P=– P=17,290,642Assets for which fair values are
disclosed:Financial AssetsHTM investments Government P=25,460,778 P=24,634,062 P=– P=– P=24,634,062 Private 4,012,946 4,046,020 – – 4,046,020Loans and receivables Receivables from customers Consumption loans 82,319,091 – – 93,632,312 93,632,312 Real estate loans 45,961,973 – – 45,844,118 45,844,118 Commercial loans 11,185,778 – – 12,070,479 12,070,479 Personal loans 2,899,960 – – 3,383,787 3,383,787 Sales contract receivable 72,892 – – 107,448 107,448Security deposits 179,436 – – 288,467 288,467Non-Financial AssetsInvestment properties 3,930,317 – – 4,939,141 4,939,141
P=176,023,171 P=28,680,082 P=- P=160,265,752 P=189,945,834Liabilities for which fair values are
disclosed:Deposit liabilities – time P=136,042,057 P=– P=– P=137,797,790 P=137,797,790Deposit liabilities – LTNCD 3,375,000 – – 3,198,056 3,198,056Subordinated notes 2,978,998 – – 3,046,819 3,046,819Bills payable 1,492,419 – – 1,492,419 1,492,419
P=143,888,474 P=– P=– P=145,535,084 P=145,535,084
Notes to Financial Statements

Philippine Savings Bank • 55
Notes to Financial Statements- 32 -
*SGVFS026939*
December 31, 2016Carrying
Value Level 1 Level 2 Level 3 Total Fair ValueAssets measured at fair value:Financial AssetsFVPL investments HFT - government securities P=1,360,293 P=1,360,293 P=– P=– P=1,360,293
Derivative assets - foreign exchange swaps 499 – 499 – 499
AFS investments Government debt securities 8,462,431 7,860,775 601,656 – 8,462,431 Private debt securities 4,645,669 4,645,669 – – 4,645,669 Quoted equity securities 5,393 163 6,450 – 6,613
P=14,474,285 P=13,866,900 P=608,605 P=– P=14,476,505Assets for which fair values are
disclosed:Financial AssetsHTM investments Government P=20,046,355 P=14,700,636 P=3,121,158 P=– P=17,821,794 Private 3,110,532 4,671,187 – – 4,671,187Loans and receivables Receivables from customers Consumption loans 68,049,723 – – 77,057,592 77,057,592 Real estate loans 43,394,060 – – 43,727,872 43,727,872 Commercial loans 10,724,488 – – 11,602,071 11,602,071 Personal loans 2,923,628 – – 3,471,046 3,471,046 Sales contract receivable 117,814 – – 154,520 154,520Security deposits 178,331 – – 168,120 168,120Non-Financial AssetsInvestment properties 3,861,708 – – 4,675,355 4,675,355
P=152,406,639 P=19,371,823 P=3,121,158 P=140,856,576 P=163,349,557Liabilities measured at fair value:Financial LiabilitiesDerivative liabilities - foreign exchange swaps P=65,317 P=– P=65,317 P=– P=65,317Liabilities for which fair values are disclosed:Deposit liabilities – time P=115,811,946 P=– P=– P=115,519,377 P=115,519,377Subordinated notes 5,975,732 – – 6,000,716 6,000,716Bills Payable 6,093,797 – – 6,093,797 6,093,797
P=127,881,475 P=– P=– P=127,613,890 P=127,613,890
As of December 31, 2017 and 2016, there were no transfers between Level 1 and Level 2 fair valuemeasurements, and no transfers into and out of Level 3 fair value measurements.
As of December 31, 2017 and 2016, the Bank determined the market value of its warrants to be zerodue to the absence of an active market for the Bank’s ROP warrants, as evidenced by theunavailability of quoted market prices.
5. Financial Risk Management Policies and Objectives
The Bank has exposure to the following risks from its use of financial instruments:
∂ Credit risk∂ Market risk∂ Liquidity risk
Organization risk management structure continues to be a top-down organization, with the BOD atthe helm of all major initiatives.

56 • 2017 Annual Report •
- 33 -
*SGVFS026939*
Discussed below are the relevant sections on roles and responsibilities from the Risk OversightCommittee (ROC) Charter:
BODThe corporate powers of the Bank are vested in and are exercised by the BOD, who conducts itsbusiness and controls its property. The BOD approves broad risk management strategies and policiesand ensures that risk management initiatives and activities are consistent with the Bank’s overallobjectives. The BOD appoints the members of the ROC.
ROCThe ROC is composed of at least three members of the Board, the majority of whom are independentdirectors including its Chairperson. The ROC Chairperson is not the Chairperson of the Board or ofany other committee. Members of the ROC possess a range of expertise and adequate knowledge ofthe Bank’s risk exposures to be able to develop appropriate strategies for preventing losses andminimizing the impact of losses when they occur.
The BOD may also appoint non-directors to the ROC as part of the Metrobank Group risk oversightmeasures. However, only Bank directors shall be considered as voting members of the ROC. Non-voting members are appointed in an advisory capacity.
The ROC oversees the system of limits to discretionary authority that the BOD delegates to themanagement and ensures that the system remains effective, the limits are observed, and thatimmediate corrective actions are taken whenever limits are breached.
The ROC meets on a monthly basis and is supported by the Risk Management Office (RMO). In theabsence of the ROC Chairman, another Independent Director shall preside. ROC resolutions, whichrequire the concurrence of the majority of its voting members, are presented to the BOD forconfirmation.
RMOThe RMO, headed by the Chief Risk Officer, is a function that is independent from executivefunctions and business line responsibilities, operations and revenue-generating functions. It reportsdirectly to the BOD, through the ROC. The RMO assists the ROC in carrying out its responsibilitiesby:∂ analyzing, communicating, implementing, and maintaining the risk management policies
approved by the ROC and the BOD;∂ spearheading the regular review of the Bank’s risk management policy manual and making or
elevating recommendations that enhance the risk management process to the ROC and the BOD,for their approval; and
∂ ensuring that the risks arising from the Bank’s activities are identified, measured, analyzed,reported to and understood by risk takers, management, and the board. The RMO analyzes limitexceptions and recommends enhancements to the limits structure.
The RMO does not assume risk-taking accountability nor does it have approving authority. TheRMO’s role is to act as liaison and to provide support to the BOD, ROC, the President, managementcommittees, risk takers and other support and control functions on risk-related matters.
The Risk Management Function is responsible for:∂ identifying the key risk exposures and assessing and measuring the extent of risk exposures of the
Bank and its trust operations;
Notes to Financial Statements

Philippine Savings Bank • 57
Notes to Financial Statements - 34 -
*SGVFS026939*
∂ monitoring the risk exposures and determining the corresponding capital requirement inaccordance with the Basel capital adequacy framework and based on the Bank’s internal capitaladequacy assessment on an on-going basis;
∂ monitoring and assessing decisions to accept particular risks whether these are consistent withBOD-approved policies on risk tolerance and the effectiveness of the corresponding riskmitigation measures; and
∂ reporting on a regular basis to Senior Management and the BOD the results of assessment andmonitoring.
PresidentThe President is the Chief Executive Officer of the Bank and has the primary responsibility ofcarrying out the policies and objectives of the BOD. The President exercises the authorities delegatedto him by the BOD and may recommend such policies and objectives he deems necessary for thecontinuing progress of the Bank.
Risk managementThe risk management framework aims to maintain a balance between the nature of the Bank’sbusinesses and the risk appetite of the BOD. Accordingly, policies and procedures are reviewedregularly and revised as the organization grows and as financial markets evolve. New policies orproposed changes in current policies are presented to the ROC and the BOD for approval.
a. Credit risk and concentration of assets and liabilities and off-balance sheet items
Credit risk is the risk that a counterparty will not settle its obligations in accordance with the agreedterms.
The Bank’s lending business follows credit policy guidelines set by the BOD, ROC and RMO. Thesepolicies serve as minimum standards for extending credit. The people engaged in the credit processare required to understand and adhere to these policies.
Product manuals are in place for all loans and deposit products that actually or potentially expose theBank to all types of risks that may result in financial or reputational losses. They define the productand the risks associated with the product plus the corresponding risk-mitigating controls. Theyembody the business plans and define the business parameters within which the product or activity isto be performed.
The system of checks around extension of credit includes approval by at least two credit approversthrough the Credit Committee (CreCom), Executive Committee (ExCom) or BOD. The ROCreviews the business strategies and ensures that revenue-generating activities are consistent with therisk tolerance and standards of the Bank. The Internal Audit Group conducts regular audit across allfunctional units. The BOD, through the ExCom, CreCom and ROC, ensure that sound credit policiesand practices are followed through all the business segments.
Credit ApprovalCredit approval is the documented acceptance of credit risk in the credit proposal or application.
The Bank’s credit decision-making for consumer loans utilizes the recommendation of the creditscoring and is performed at the CreCom level appropriate to the size and risk of each transaction, inconformity with corporate policies and procedures in regulating credit risk activities. The Bank’sExCom may approve deviations or exceptions, while the BOD approves material exceptions such as

58 • 2017 Annual Report •
- 35 -
*SGVFS026939*
large exposures, loans to directors, officers, stockholders and other related interests (DOSRI), andloan restructuring.
Credit delegation limits are identified, tracked and reviewed at least annually by the Bank’s Head ofCredit and Collections together with the Credit Risk Manager.
Borrower EligibilityThe Bank’s credit processing commences when a customer expresses his intention to borrow througha credit application. The Bank gathers data on the customer; ensures they are accurate, up-to-date andadequate to meet the minimum regulatory requirements and to render credit decision. These data areused for the intended purpose only and are managed in adherence to the customer information secrecylaw.
The customer’s credit worthiness, repayment ability and cash flow are established before credit isextended. The Bank independently verifies critical data from the customer, ensuring compliance withKnow Your Customer requirements under the anti-money laundering laws. The Bank requires thatcustomer income be derived from legitimate sources and supported with government-acceptedstatements of income, assets and liabilities.
The Bank ascertains whether the customer is legally capable of entering a credit contract and ofproviding a charge over any asset presented as collateral for a loan. Guarantors or sureties may beaccepted, provided they are a relative, partner, and have financial interest in the transaction, and theypass all credit acceptance criteria applied to the borrower.
Loan StructureThe Bank structures loans for its customers based on the customer’s capability to pay, the purpose ofthe loan, and for a collateralized loan, the collateral’s economic life and liquidation value over time.
The Bank establishes debt burden guidelines and minimum income requirements to assess thecustomer’s capacity to pay.
The Bank utilizes credit bureau data, both external and internal, to obtain information on a customer’scurrent commitments and credit history.
The Bank takes into account environmental and social issues when reviewing credit proposals ofsmall businesses and commercial mortgage customers. The Bank ensures that all qualified securitiespass through the BOD for approval. Assignments of securities are confirmed and insurance areproperly secured.
The Bank uses credit scoring models and decision systems for consumer loans as approved by theBOD. Borrower risk rating model and facility risk rating model, on the other hand, are available forSME loans, and supported with qualitative evaluation. Regular monitoring of all these tools and theirperformance is carried out to ensure that they remain effective.
Initial loan limits are recommended by the CreCom and ExCom and approved by the BOD. TheBank ensures that secured loans are within ceilings set by local regulators. Succeeding loanavailments are based on account performance and customer’s credit worthiness.
Notes to Financial Statements
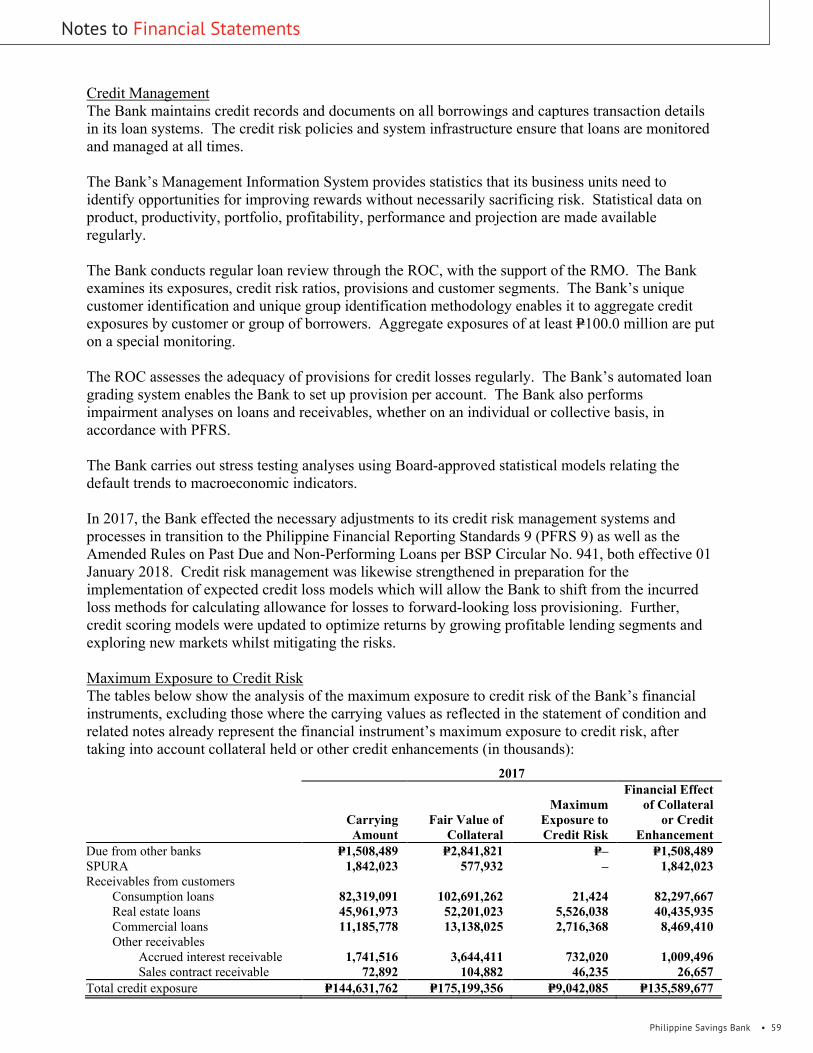
Philippine Savings Bank • 59
Notes to Financial Statements - 36 -
*SGVFS026939*
Credit ManagementThe Bank maintains credit records and documents on all borrowings and captures transaction detailsin its loan systems. The credit risk policies and system infrastructure ensure that loans are monitoredand managed at all times.
The Bank’s Management Information System provides statistics that its business units need toidentify opportunities for improving rewards without necessarily sacrificing risk. Statistical data onproduct, productivity, portfolio, profitability, performance and projection are made availableregularly.
The Bank conducts regular loan review through the ROC, with the support of the RMO. The Bankexamines its exposures, credit risk ratios, provisions and customer segments. The Bank’s uniquecustomer identification and unique group identification methodology enables it to aggregate creditexposures by customer or group of borrowers. Aggregate exposures of at least P=100.0 million are puton a special monitoring.
The ROC assesses the adequacy of provisions for credit losses regularly. The Bank’s automated loangrading system enables the Bank to set up provision per account. The Bank also performsimpairment analyses on loans and receivables, whether on an individual or collective basis, inaccordance with PFRS.
The Bank carries out stress testing analyses using Board-approved statistical models relating thedefault trends to macroeconomic indicators.
In 2017, the Bank effected the necessary adjustments to its credit risk management systems andprocesses in transition to the Philippine Financial Reporting Standards 9 (PFRS 9) as well as theAmended Rules on Past Due and Non-Performing Loans per BSP Circular No. 941, both effective 01January 2018. Credit risk management was likewise strengthened in preparation for theimplementation of expected credit loss models which will allow the Bank to shift from the incurredloss methods for calculating allowance for losses to forward-looking loss provisioning. Further,credit scoring models were updated to optimize returns by growing profitable lending segments andexploring new markets whilst mitigating the risks.
Maximum Exposure to Credit RiskThe tables below show the analysis of the maximum exposure to credit risk of the Bank’s financialinstruments, excluding those where the carrying values as reflected in the statement of condition andrelated notes already represent the financial instrument’s maximum exposure to credit risk, aftertaking into account collateral held or other credit enhancements (in thousands):
2017
CarryingAmount
Fair Value ofCollateral
MaximumExposure toCredit Risk
Financial Effectof Collateral
or CreditEnhancement
Due from other banks P=1,508,489 P=2,841,821 P=– P=1,508,489SPURA 1,842,023 577,932 – 1,842,023Receivables from customers Consumption loans 82,319,091 102,691,262 21,424 82,297,667 Real estate loans 45,961,973 52,201,023 5,526,038 40,435,935 Commercial loans 11,185,778 13,138,025 2,716,368 8,469,410 Other receivables
Accrued interest receivable 1,741,516 3,644,411 732,020 1,009,496 Sales contract receivable 72,892 104,882 46,235 26,657Total credit exposure P=144,631,762 P=175,199,356 P=9,042,085 P=135,589,677
- 36 -
*SGVFS026939*
Credit ManagementThe Bank maintains credit records and documents on all borrowings and captures transaction detailsin its loan systems. The credit risk policies and system infrastructure ensure that loans are monitoredand managed at all times.
The Bank’s Management Information System provides statistics that its business units need toidentify opportunities for improving rewards without necessarily sacrificing risk. Statistical data onproduct, productivity, portfolio, profitability, performance and projection are made availableregularly.
The Bank conducts regular loan review through the ROC, with the support of the RMO. The Bankexamines its exposures, credit risk ratios, provisions and customer segments. The Bank’s uniquecustomer identification and unique group identification methodology enables it to aggregate creditexposures by customer or group of borrowers. Aggregate exposures of at least P=100.0 million are puton a special monitoring.
The ROC assesses the adequacy of provisions for credit losses regularly. The Bank’s automated loangrading system enables the Bank to set up provision per account. The Bank also performsimpairment analyses on loans and receivables, whether on an individual or collective basis, inaccordance with PFRS.
The Bank carries out stress testing analyses using Board-approved statistical models relating thedefault trends to macroeconomic indicators.
In 2017, the Bank effected the necessary adjustments to its credit risk management systems andprocesses in transition to the Philippine Financial Reporting Standards 9 (PFRS 9) as well as theAmended Rules on Past Due and Non-Performing Loans per BSP Circular No. 941, both effective 01January 2018. Credit risk management was likewise strengthened in preparation for theimplementation of expected credit loss models which will allow the Bank to shift from the incurredloss methods for calculating allowance for losses to forward-looking loss provisioning. Further,credit scoring models were updated to optimize returns by growing profitable lending segments andexploring new markets whilst mitigating the risks.
Maximum Exposure to Credit RiskThe tables below show the analysis of the maximum exposure to credit risk of the Bank’s financialinstruments, excluding those where the carrying values as reflected in the statement of condition andrelated notes already represent the financial instrument’s maximum exposure to credit risk, aftertaking into account collateral held or other credit enhancements (in thousands):
2017
CarryingAmount
Fair Value ofCollateral
MaximumExposure toCredit Risk
Financial Effectof Collateral
or CreditEnhancement
Due from other banks P=1,508,489 P=2,841,821 P=– P=1,508,489SPURA 1,842,023 577,932 – 1,842,023Receivables from customers Consumption loans 82,319,091 102,691,262 21,424 82,297,667 Real estate loans 45,961,973 52,201,023 5,526,038 40,435,935 Commercial loans 11,185,778 13,138,025 2,716,368 8,469,410 Other receivables
Accrued interest receivable 1,741,516 3,644,411 732,020 1,009,496 Sales contract receivable 72,892 104,882 46,235 26,657Total credit exposure P=144,631,762 P=175,199,356 P=9,042,085 P=135,589,677
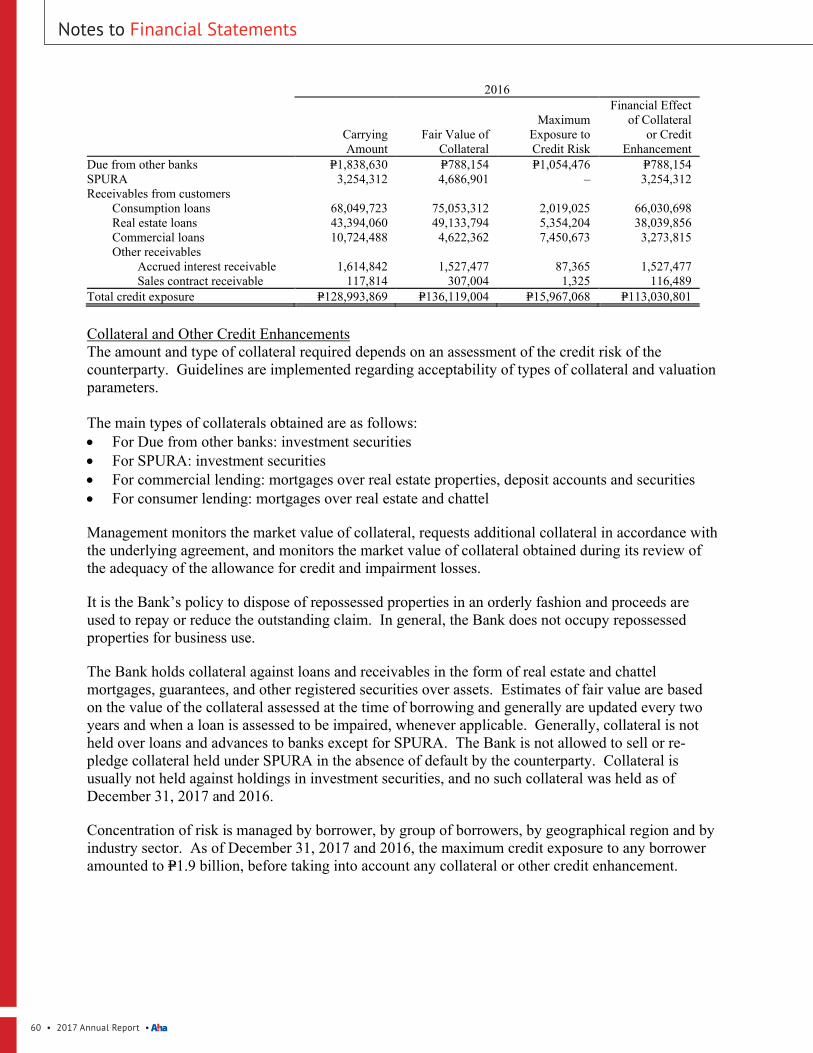
60 • 2017 Annual Report •
- 37 -
*SGVFS026939*
2016
CarryingAmount
Fair Value ofCollateral
MaximumExposure toCredit Risk
Financial Effectof Collateral
or CreditEnhancement
Due from other banks P=1,838,630 P=788,154 P=1,054,476 P=788,154SPURA 3,254,312 4,686,901 – 3,254,312Receivables from customers Consumption loans 68,049,723 75,053,312 2,019,025 66,030,698 Real estate loans 43,394,060 49,133,794 5,354,204 38,039,856 Commercial loans 10,724,488 4,622,362 7,450,673 3,273,815 Other receivables
Accrued interest receivable 1,614,842 1,527,477 87,365 1,527,477 Sales contract receivable 117,814 307,004 1,325 116,489Total credit exposure P=128,993,869 P=136,119,004 P=15,967,068 P=113,030,801
Collateral and Other Credit EnhancementsThe amount and type of collateral required depends on an assessment of the credit risk of thecounterparty. Guidelines are implemented regarding acceptability of types of collateral and valuationparameters.
The main types of collaterals obtained are as follows:∂ For Due from other banks: investment securities∂ For SPURA: investment securities∂ For commercial lending: mortgages over real estate properties, deposit accounts and securities∂ For consumer lending: mortgages over real estate and chattel
Management monitors the market value of collateral, requests additional collateral in accordance withthe underlying agreement, and monitors the market value of collateral obtained during its review ofthe adequacy of the allowance for credit and impairment losses.
It is the Bank’s policy to dispose of repossessed properties in an orderly fashion and proceeds areused to repay or reduce the outstanding claim. In general, the Bank does not occupy repossessedproperties for business use.
The Bank holds collateral against loans and receivables in the form of real estate and chattelmortgages, guarantees, and other registered securities over assets. Estimates of fair value are basedon the value of the collateral assessed at the time of borrowing and generally are updated every twoyears and when a loan is assessed to be impaired, whenever applicable. Generally, collateral is notheld over loans and advances to banks except for SPURA. The Bank is not allowed to sell or re-pledge collateral held under SPURA in the absence of default by the counterparty. Collateral isusually not held against holdings in investment securities, and no such collateral was held as ofDecember 31, 2017 and 2016.
Concentration of risk is managed by borrower, by group of borrowers, by geographical region and byindustry sector. As of December 31, 2017 and 2016, the maximum credit exposure to any borroweramounted to P=1.9 billion, before taking into account any collateral or other credit enhancement.
Notes to Financial Statements

Philippine Savings Bank • 61
Notes to Financial Statements - 38 -
*SGVFS026939*
The distribution of the Bank’s financial assets before taking into account any collateral held or othercredit enhancements can be analyzed by the following geographical regions (in thousands):
2017
Loans andReceivables
Loans andAdvances to
Banks*Investment
Securities** Others*** TotalLuzon P=129,574,601 P=18,612,324 P=46,755,443 P=273,268 P=195,215,636Visayas 9,422,015 1,106 – – 9,423,121Mindanao 10,614,855 2,470 – – 10,617,325
149,611,471 18,615,900 46,755,443 273,268 215,256,082Less allowance for credit and
impairment losses 4,646,958 – – – 4,646,958Total P=144,964,513 P=18,615,900 P=46,755,443 P=273,268 P=210,609,124* Composed of due from BSP, due from other banks, interbank loans receivable and SPURA.** Composed of FVPL investments, AFS investments (excluding equity securities not exposed to credit risk) and HTM investments.*** Composed of financial assets classified under other assets (such as RCOCI, security deposits and shortages) and stand-by credit lines.
2016
Loans andReceivables
Loans andAdvances to
Banks*Investment
Securities** Others*** TotalLuzon P=114,457,713 P=19,023,728 P=37,625,779 P=273,614 P=171,380,834Visayas 8,125,298 23,421 – – 8,148,719Mindanao 9,401,569 32,577 – – 9,434,146
131,984,580 19,079,726 37,625,779 273,614 188,963,699Less allowance for credit and
impairment losses 4,762,733 – – – 4,762,733Total P=127,221,847 P=19,079,726 P=37,625,779 P=273,614 P=184,200,966* Composed of due from BSP, due from other banks, interbank loans receivable and SPURA.** Composed of FVPL investments, AFS investments (excluding equity securities not exposed to credit risk) and HTM investments.*** Composed of financial assets classified under other assets (such as RCOCI, security deposits and shortages) and stand-by credit lines.
Additionally, the tables below show the distribution of the Bank’s financial assets and off-balancesheet items before taking into account any collateral or other credit enhancements analyzed byindustry sector as of December 31, 2017 and 2016 (in thousands):
2017
Loans andReceivables
Loans andAdvances to
Banks*Investment
Securities** Others*** TotalActivities of private households as employers
and undifferentiated goods and servicesand producing activities of householdsfor own use P=90,543,668 P=– P=– P=– P=90,543,668
Financial and insurance activities 4,068,627 18,615,900 46,755,443 191,162 69,631,132Real estate activities 42,251,639 – – – 42,251,639Wholesale and retail trade; repair
of motor vehicles and motorcycles 2,421,117 – – – 2,421,117Electricity, gas, steam and air-conditioning
supply 1,749,765 – – – 1,749,765Administrative and support service activities 996,493 – – – 996,493Transportation and storage 963,123 – – – 963,123Construction 801,242 – – 56,000 857,242Manufacturing 644,735 – – – 644,735Information and communication 592,890 – – – 592,890Accommodation and food service activities 372,653 – – – 372,653Human health and social work activities 326,297 – – – 326,297Water supply, sewage, waste management
and remediation activities 237,078 – – – 237,078Education 198,609 – – – 198,609Professional, scientific and technical services 137,853 – – – 137,853
(Forward)

62 • 2017 Annual Report •
- 39 -
*SGVFS026939*
2017
Loans andReceivables
Loans andAdvances to
Banks*Investment
Securities** Others*** TotalArts, entertainment and recreation P=85,099 P=– P=– P=– P=85,099Agricultural, forestry and fishing 25,302 – – – 25,302Mining and quarrying 7,230 – – – 7,230Other service activities 3,188,051 – – 26,106 3,214,157
149,611,471 18,615,900 46,755,443 273,268 215,256,082Less allowance for credit and impairment
losses 4,646,958 – – – 4,646,958Total P=144,964,513 P=18,615,900 P=46,755,443 P=273,268 P=210,609,124* Composed of due from BSP, due from other banks, interbank loans receivable and SPURA.** Composed of FVPL investments, AFS investments (excluding equity securities not exposed to credit risk) and HTM investments.*** Composed of financial assets classified under other assets (such as RCOCI, security deposits and shortages) and stand-by credit lines.
2016
Loans andReceivables
Loans andAdvances to
Banks*Investment
Securities** Others*** TotalActivities of private households as employers
and undifferentiated goods and servicesand producing activities of householdsfor own use P=76,644,704 P=– P=– P=– P=76,644,704
Financial and insurance activities 3,506,711 19,079,726 37,625,779 189,954 60,402,170Real estate activities 39,499,089 – – – 39,499,089Wholesale and retail trade; repair
of motor vehicles and motorcycles 2,021,531 – – – 2,021,531Electricity, gas, steam and air-conditioning
supply 1,571,669 – – – 1,571,669Information and communication 1,513,811 – – – 1,513,811Administrative and support service activities 1,176,719 – – – 1,176,719Accommodation and food service activities 709,800 – – – 709,800Manufacturing 547,418 – – – 547,418Construction 427,755 – – 56,000 483,755Human health and social work activities 356,752 – – – 356,752Transportation and storage 326,725 – – – 326,725Water supply, sewage, waste management
and remediation activities 289,700 – – – 289,700Education 203,247 – – – 203,247Professional, scientific and technical services 81,247 – – – 81,247Arts, entertainment and recreation 37,165 – – – 37,165Agricultural, forestry and fishing 20,321 – – – 20,321Mining and quarrying 4,514 – – – 4,514Other service activities 3,045,702 – – 27,660 3,073,362
131,984,580 19,079,726 37,625,779 273,614 188,963,699Less allowance for credit and impairment
losses 4,762,733 – – – 4,762,733Total P=127,221,847 P=19,079,726 P=37,625,779 P=273,614 P=184,200,966* Composed of due from BSP, due from other banks, interbank loans receivable and SPURA.** Composed of FVPL investments, AFS investments (excluding equity securities not exposed to credit risk) and HTM investments.*** Composed of financial assets classified under other assets (such as RCOCI, security deposits and shortages) and stand-by credit lines.
Credit QualityDescription of the loan grades for loans, receivables and stand-by credit lines:
Master Loan ClassificationsThe Bank rates accounts on a scale of 1 to 10, with 1 being the best, based on the Board-approvedloan classifications which utilize the credit scoring results, credit experience and qualitativeassessments.
Neither Past Due nor Individually ImpairedThe Bank classifies those accounts under current status having the following master loanclassification grades:
Notes to Financial Statements

Philippine Savings Bank • 63
Notes to Financial Statements
- 40 -
*SGVFS026939*
High Grade (Master Loan Classification 1 - 4)1 - ExcellentThis is considered as normal risk by the Bank. An excellent rating is given to a borrower who has theability to meet credit obligation in full and is never delinquent.
2 - StrongThis is also considered as normal risk by the Bank. Borrower has the ability to meet credit obligationin full, except that the borrower had history of 1-29 days delinquency at worst.
3 - GoodThis rating is given to a borrower who has the ability to meet credit obligation in full, except that theborrower had history of Loan Especially Mentioned rating (rating=7) at worst.
4 - SatisfactoryThis rating is given to a borrower who has the ability to meet credit obligation in full, except that theborrower had history of Substandard rating (rating=8) at worst.
Standard Grade (Master Loan Classification 5 - 7)5 - AcceptableAn acceptable rating is given to a borrower who meets present obligations, except that the borrowerhad history of Doubtful rating (rating=9) at worst.
6 - WatchlistThis rating is given to a borrower who meets present obligations, except that the borrower had historyof Loss rating (rating=10) at worst.
7 - Loan Especially MentionedThis rating is given to a borrower who has potential weaknesses which when left uncorrected, mayaffect the repayment of the loan and thus increase credit risk to the Bank.
Substandard Grade (Master Loan Classification 8)8 - SubstandardA substandard rating is given to a borrower whose loan or portion thereof involves a substantial andan unreasonable degree of risk to the Bank because of unfavorable record or unsatisfactorycharacteristics. These loans show possibility of future loss to the Bank unless given closersupervision and well-defined weaknesses that jeopardize the loan liquidation.
Unrated gradeOther credit assets which cannot be classified as High, Standard or Sub-standard are tagged asUnrated.
Past Due but Not Individually ImpairedThese are accounts which are classified as delinquent but are not subject to individual impairment asof statement of condition date.
9 - DoubtfulThis rating is given to a borrower whose loans have characteristics where collection and liquidation infull is highly improbable and in which substantial loss is probable.
10 - LossThis rating is given to a borrower whose loans or portions thereof are considered uncollectible orworthless and of such little value that their continuance as bankable assets is not warranted.
- 39 -
*SGVFS026939*
2017
Loans andReceivables
Loans andAdvances to
Banks*Investment
Securities** Others*** TotalArts, entertainment and recreation P=85,099 P=– P=– P=– P=85,099Agricultural, forestry and fishing 25,302 – – – 25,302Mining and quarrying 7,230 – – – 7,230Other service activities 3,188,051 – – 26,106 3,214,157
149,611,471 18,615,900 46,755,443 273,268 215,256,082Less allowance for credit and impairment
losses 4,646,958 – – – 4,646,958Total P=144,964,513 P=18,615,900 P=46,755,443 P=273,268 P=210,609,124* Composed of due from BSP, due from other banks, interbank loans receivable and SPURA.** Composed of FVPL investments, AFS investments (excluding equity securities not exposed to credit risk) and HTM investments.*** Composed of financial assets classified under other assets (such as RCOCI, security deposits and shortages) and stand-by credit lines.
2016
Loans andReceivables
Loans andAdvances to
Banks*Investment
Securities** Others*** TotalActivities of private households as employers
and undifferentiated goods and servicesand producing activities of householdsfor own use P=76,644,704 P=– P=– P=– P=76,644,704
Financial and insurance activities 3,506,711 19,079,726 37,625,779 189,954 60,402,170Real estate activities 39,499,089 – – – 39,499,089Wholesale and retail trade; repair
of motor vehicles and motorcycles 2,021,531 – – – 2,021,531Electricity, gas, steam and air-conditioning
supply 1,571,669 – – – 1,571,669Information and communication 1,513,811 – – – 1,513,811Administrative and support service activities 1,176,719 – – – 1,176,719Accommodation and food service activities 709,800 – – – 709,800Manufacturing 547,418 – – – 547,418Construction 427,755 – – 56,000 483,755Human health and social work activities 356,752 – – – 356,752Transportation and storage 326,725 – – – 326,725Water supply, sewage, waste management
and remediation activities 289,700 – – – 289,700Education 203,247 – – – 203,247Professional, scientific and technical services 81,247 – – – 81,247Arts, entertainment and recreation 37,165 – – – 37,165Agricultural, forestry and fishing 20,321 – – – 20,321Mining and quarrying 4,514 – – – 4,514Other service activities 3,045,702 – – 27,660 3,073,362
131,984,580 19,079,726 37,625,779 273,614 188,963,699Less allowance for credit and impairment
losses 4,762,733 – – – 4,762,733Total P=127,221,847 P=19,079,726 P=37,625,779 P=273,614 P=184,200,966* Composed of due from BSP, due from other banks, interbank loans receivable and SPURA.** Composed of FVPL investments, AFS investments (excluding equity securities not exposed to credit risk) and HTM investments.*** Composed of financial assets classified under other assets (such as RCOCI, security deposits and shortages) and stand-by credit lines.
Credit QualityDescription of the loan grades for loans, receivables and stand-by credit lines:
Master Loan ClassificationsThe Bank rates accounts on a scale of 1 to 10, with 1 being the best, based on the Board-approvedloan classifications which utilize the credit scoring results, credit experience and qualitativeassessments.
Neither Past Due nor Individually ImpairedThe Bank classifies those accounts under current status having the following master loanclassification grades:

64 • 2017 Annual Report •
- 41 -
*SGVFS026939*
Individually ImpairedAccounts which are subject to individual impairment as of statement of condition date.
The tables below show the credit quality per class of financial assets under loans and receivables (in thousands)*:
2017
Neither Past Due nor Individually ImpairedPast Due
but not
High GradeStandard
GradeSubstandard
Grade UnratedIndividually
ImpairedIndividually
Impaired TotalLoans and advances to banks Due from BSP P=15,265,388 P=– P=– P=– P=– P=– P=15,265,388 Due from other banks – 1,508,489 – – – – 1,508,489 Interbank loans receivable and
SPURA – 1,842,023 – – – – 1,842,023Receivables from customers Consumption loans 72,426,514 218,182 19,887 – 11,611,871 – 84,276,454 Real estate loans 40,436,431 690,957 124,237 – 4,311,333 1,031,117 46,594,075 Commercial loans 10,867,915 565,472 216,548 – 180,164 145,606 11,975,705 Personal loans 2,822,044 62,340 57,011 – 544,674 – 3,486,069Other receivables Accrued interest receivable 881,262 680,976 4,693 – 296,242 48,199 1,911,372 Accounts receivable 723,178 99 198 – 341,973 185,139 1,250,587 Sales contract receivable 86,935 483 93 – 19,218 – 106,729 Bills purchased – – – 10,482 – – 10,482 Other assets Security deposits – – – 179,996 – – 179,996 RCOCI – – – 10,349 – – 10,349 Shortages – – – 1,012 – – 1,012Total P=143,509,667 P=5,569,021 P=422,667 P=201,839 P=17,305,475 P=1,410,061 P=168,418,730*Shown gross of allowance for credit and impairment losses, net of unearned discount
2016
Neither Past Due nor Individually ImpairedPast Due
but not
High GradeStandard
GradeSubstandard
Grade UnratedIndividually
ImpairedIndividually
Impaired TotalLoans and advances to banks Due from BSP P=13,986,785 P=– P=– P=– P=– P=– P=13,986,785 Due from other banks – 1,838,630 – – – – 1,838,630 Interbank loans receivable and
SPURA 3,254,312 – – – – – 3,254,312Receivables from customers Consumption loans 54,186,784 – 5,282,592 – 10,630,050 – 70,099,426 Real estate loans 33,239,048 4,778,346 458,589 – 4,375,855 1,047,721 43,899,559 Commercial loans 10,575,097 478,928 199,136 – 180,377 172,246 11,605,784 Personal loans 1,979,545 880,638 93,212 – 636,243 – 3,589,638Other receivables Accrued interest receivable 1,109,075 252,348 42,217 – 269,821 100,007 1,773,468 Accounts receivable 301,282 2,719 71 – 312,557 184,652 801,281 Sales contract receivable 112,841 12,571 – – 26,238 – 151,650 Bills purchased – – – 63,774 – – 63,774Other assets Security deposits – – – 178,331 – – 178,331 RCOCI – – – 10,316 – – 10,316 Shortages – – – 1,307 – – 1,307Total P=118,744,769 P=8,244,180 P=6,075,817 P=253,728 P=16,431,141 P=1,504,626 P=151,254,261*Shown gross of allowance for credit and impairment losses, net of unearned discount
External RatingsIn ensuring quality investment portfolio, the Bank uses the credit risk rating based on the rating ofMoody’s Investors Service (Moody’s rating) as follows:
Credit Quality External RatingHigh grade Aaa Aa1 Aa2 Aa3 A1 A2 A3 Baa1 Baa2 Baa3Standard grade Ba1 Ba2 Ba3 B1 B2 B3Substandard grade Caa1 Caa2 Caa3 Ca C
Notes to Financial Statements
- 40 -
*SGVFS026939*
High Grade (Master Loan Classification 1 - 4)1 - ExcellentThis is considered as normal risk by the Bank. An excellent rating is given to a borrower who has theability to meet credit obligation in full and is never delinquent.
2 - StrongThis is also considered as normal risk by the Bank. Borrower has the ability to meet credit obligationin full, except that the borrower had history of 1-29 days delinquency at worst.
3 - GoodThis rating is given to a borrower who has the ability to meet credit obligation in full, except that theborrower had history of Loan Especially Mentioned rating (rating=7) at worst.
4 - SatisfactoryThis rating is given to a borrower who has the ability to meet credit obligation in full, except that theborrower had history of Substandard rating (rating=8) at worst.
Standard Grade (Master Loan Classification 5 - 7)5 - AcceptableAn acceptable rating is given to a borrower who meets present obligations, except that the borrowerhad history of Doubtful rating (rating=9) at worst.
6 - WatchlistThis rating is given to a borrower who meets present obligations, except that the borrower had historyof Loss rating (rating=10) at worst.
7 - Loan Especially MentionedThis rating is given to a borrower who has potential weaknesses which when left uncorrected, mayaffect the repayment of the loan and thus increase credit risk to the Bank.
Substandard Grade (Master Loan Classification 8)8 - SubstandardA substandard rating is given to a borrower whose loan or portion thereof involves a substantial andan unreasonable degree of risk to the Bank because of unfavorable record or unsatisfactorycharacteristics. These loans show possibility of future loss to the Bank unless given closersupervision and well-defined weaknesses that jeopardize the loan liquidation.
Unrated gradeOther credit assets which cannot be classified as High, Standard or Sub-standard are tagged asUnrated.
Past Due but Not Individually ImpairedThese are accounts which are classified as delinquent but are not subject to individual impairment asof statement of condition date.
9 - DoubtfulThis rating is given to a borrower whose loans have characteristics where collection and liquidation infull is highly improbable and in which substantial loss is probable.
10 - LossThis rating is given to a borrower whose loans or portions thereof are considered uncollectible orworthless and of such little value that their continuance as bankable assets is not warranted.
- 41 -
*SGVFS026939*
Individually ImpairedAccounts which are subject to individual impairment as of statement of condition date.
The tables below show the credit quality per class of financial assets under loans and receivables (in thousands)*:
2017
Neither Past Due nor Individually ImpairedPast Due
but not
High GradeStandard
GradeSubstandard
Grade UnratedIndividually
ImpairedIndividually
Impaired TotalLoans and advances to banks Due from BSP P=15,265,388 P=– P=– P=– P=– P=– P=15,265,388 Due from other banks – 1,508,489 – – – – 1,508,489 Interbank loans receivable and
SPURA – 1,842,023 – – – – 1,842,023Receivables from customers Consumption loans 72,426,514 218,182 19,887 – 11,611,871 – 84,276,454 Real estate loans 40,436,431 690,957 124,237 – 4,311,333 1,031,117 46,594,075 Commercial loans 10,867,915 565,472 216,548 – 180,164 145,606 11,975,705 Personal loans 2,822,044 62,340 57,011 – 544,674 – 3,486,069Other receivables Accrued interest receivable 881,262 680,976 4,693 – 296,242 48,199 1,911,372 Accounts receivable 723,178 99 198 – 341,973 185,139 1,250,587 Sales contract receivable 86,935 483 93 – 19,218 – 106,729 Bills purchased – – – 10,482 – – 10,482 Other assets Security deposits – – – 179,996 – – 179,996 RCOCI – – – 10,349 – – 10,349 Shortages – – – 1,012 – – 1,012Total P=143,509,667 P=5,569,021 P=422,667 P=201,839 P=17,305,475 P=1,410,061 P=168,418,730*Shown gross of allowance for credit and impairment losses, net of unearned discount
2016
Neither Past Due nor Individually ImpairedPast Due
but not
High GradeStandard
GradeSubstandard
Grade UnratedIndividually
ImpairedIndividually
Impaired TotalLoans and advances to banks Due from BSP P=13,986,785 P=– P=– P=– P=– P=– P=13,986,785 Due from other banks – 1,838,630 – – – – 1,838,630 Interbank loans receivable and
SPURA 3,254,312 – – – – – 3,254,312Receivables from customers Consumption loans 54,186,784 – 5,282,592 – 10,630,050 – 70,099,426 Real estate loans 33,239,048 4,778,346 458,589 – 4,375,855 1,047,721 43,899,559 Commercial loans 10,575,097 478,928 199,136 – 180,377 172,246 11,605,784 Personal loans 1,979,545 880,638 93,212 – 636,243 – 3,589,638Other receivables Accrued interest receivable 1,109,075 252,348 42,217 – 269,821 100,007 1,773,468 Accounts receivable 301,282 2,719 71 – 312,557 184,652 801,281 Sales contract receivable 112,841 12,571 – – 26,238 – 151,650 Bills purchased – – – 63,774 – – 63,774Other assets Security deposits – – – 178,331 – – 178,331 RCOCI – – – 10,316 – – 10,316 Shortages – – – 1,307 – – 1,307Total P=118,744,769 P=8,244,180 P=6,075,817 P=253,728 P=16,431,141 P=1,504,626 P=151,254,261*Shown gross of allowance for credit and impairment losses, net of unearned discount
External RatingsIn ensuring quality investment portfolio, the Bank uses the credit risk rating based on the rating ofMoody’s Investors Service (Moody’s rating) as follows:
Credit Quality External RatingHigh grade Aaa Aa1 Aa2 Aa3 A1 A2 A3 Baa1 Baa2 Baa3Standard grade Ba1 Ba2 Ba3 B1 B2 B3Substandard grade Caa1 Caa2 Caa3 Ca C

Philippine Savings Bank • 65
Notes to Financial Statements
- 42 -
*SGVFS026939*
High grade - represents those investments which fall under any of the following grade:
Aaa - fixed income obligations are judged to be of the highest quality, with the smallest degree ofrisk.
Aa1, Aa2, Aa3 - fixed income are judged to be of high quality and are subject to very low credit risk,but their susceptibility to long-term risks appears somewhat greater.
A1, A2, A3 - fixed income obligations are considered upper-medium grade and are subject to lowcredit risk, but have elements present that suggest a susceptibility to impairment over the long term.
Baa1, Baa2, Baa3 - fixed income obligations are subject to moderate credit risk. They are consideredmedium grade and as such protective elements may be lacking or may be characteristically unreliable.
Standard grade - represents those investments which fall under any of the following grade:
Ba1, Ba2, Ba3 - obligations are judged to have speculative elements and are subject to substantialcredit risk.
B1, B2, B3 - obligations are considered speculative and are subject to high credit risk.
Substandard grade - represents those investments which fall under any of the following grade:
Caa1, Caa2, Caa3 - are judged to be of poor standing and are subject to very high credit risk.
Ca - are highly speculative and are likely in, or very near, default, with some prospect of recovery ofprincipal and interest.
C - are the lowest rated class of bonds and are typically in default, with little prospect for recovery ofprincipal or interest.
The tables below show the credit quality per class of investment securities (in thousands)*:
2017
Neither Past Due nor Individually ImpairedPast Due
but not
High GradeStandard
GradeSubstandard
Grade UnratedIndividually
ImpairedIndividually
Impaired TotalFVPL HFT - government securities P=293,076 P=– P=– P=– P=– P=– P=293,076 Derivative asset – 73,160 – – – – 73,160AFS investments Government debt securities 10,762,411 – – – – – 10,762,411 Private debt securities 3,777,708 2,375,363 – – – – 6,153,071 Quoted equity securities – – – 8,923 – – 8,923 Unquoted equity securities – – – 3,269 – – 3,269HTM investments Government debt securities 25,460,778 – – – – – 25,460,778 Private debt securities 2,606,038 1,406,909 – – – – 4,012,947Total P=42,900,011 P=3,855,432 P=– P=12,192 P=– P=– P=46,767,635*Shown gross of allowance for credit and impairment losses
- 41 -
*SGVFS026939*
Individually ImpairedAccounts which are subject to individual impairment as of statement of condition date.
The tables below show the credit quality per class of financial assets under loans and receivables (in thousands)*:
2017
Neither Past Due nor Individually ImpairedPast Due
but not
High GradeStandard
GradeSubstandard
Grade UnratedIndividually
ImpairedIndividually
Impaired TotalLoans and advances to banks Due from BSP P=15,265,388 P=– P=– P=– P=– P=– P=15,265,388 Due from other banks – 1,508,489 – – – – 1,508,489 Interbank loans receivable and
SPURA – 1,842,023 – – – – 1,842,023Receivables from customers Consumption loans 72,426,514 218,182 19,887 – 11,611,871 – 84,276,454 Real estate loans 40,436,431 690,957 124,237 – 4,311,333 1,031,117 46,594,075 Commercial loans 10,867,915 565,472 216,548 – 180,164 145,606 11,975,705 Personal loans 2,822,044 62,340 57,011 – 544,674 – 3,486,069Other receivables Accrued interest receivable 881,262 680,976 4,693 – 296,242 48,199 1,911,372 Accounts receivable 723,178 99 198 – 341,973 185,139 1,250,587 Sales contract receivable 86,935 483 93 – 19,218 – 106,729 Bills purchased – – – 10,482 – – 10,482 Other assets Security deposits – – – 179,996 – – 179,996 RCOCI – – – 10,349 – – 10,349 Shortages – – – 1,012 – – 1,012Total P=143,509,667 P=5,569,021 P=422,667 P=201,839 P=17,305,475 P=1,410,061 P=168,418,730*Shown gross of allowance for credit and impairment losses, net of unearned discount
2016
Neither Past Due nor Individually ImpairedPast Due
but not
High GradeStandard
GradeSubstandard
Grade UnratedIndividually
ImpairedIndividually
Impaired TotalLoans and advances to banks Due from BSP P=13,986,785 P=– P=– P=– P=– P=– P=13,986,785 Due from other banks – 1,838,630 – – – – 1,838,630 Interbank loans receivable and
SPURA 3,254,312 – – – – – 3,254,312Receivables from customers Consumption loans 54,186,784 – 5,282,592 – 10,630,050 – 70,099,426 Real estate loans 33,239,048 4,778,346 458,589 – 4,375,855 1,047,721 43,899,559 Commercial loans 10,575,097 478,928 199,136 – 180,377 172,246 11,605,784 Personal loans 1,979,545 880,638 93,212 – 636,243 – 3,589,638Other receivables Accrued interest receivable 1,109,075 252,348 42,217 – 269,821 100,007 1,773,468 Accounts receivable 301,282 2,719 71 – 312,557 184,652 801,281 Sales contract receivable 112,841 12,571 – – 26,238 – 151,650 Bills purchased – – – 63,774 – – 63,774Other assets Security deposits – – – 178,331 – – 178,331 RCOCI – – – 10,316 – – 10,316 Shortages – – – 1,307 – – 1,307Total P=118,744,769 P=8,244,180 P=6,075,817 P=253,728 P=16,431,141 P=1,504,626 P=151,254,261*Shown gross of allowance for credit and impairment losses, net of unearned discount
External RatingsIn ensuring quality investment portfolio, the Bank uses the credit risk rating based on the rating ofMoody’s Investors Service (Moody’s rating) as follows:
Credit Quality External RatingHigh grade Aaa Aa1 Aa2 Aa3 A1 A2 A3 Baa1 Baa2 Baa3Standard grade Ba1 Ba2 Ba3 B1 B2 B3Substandard grade Caa1 Caa2 Caa3 Ca C

66 • 2017 Annual Report •
- 43 -
*SGVFS026939*
2016
Neither Past Due nor Individually ImpairedPast Due
but not
High GradeStandard
GradeSubstandard
Grade UnratedIndividually
ImpairedIndividually
Impaired TotalFVPL HFT - government securities P=1,360,293 P=– P=– P=– P=– P=– P=1,360,293 Derivative asset – 499 – – – – 499AFS investments Government debt securities 8,462,431 – – – – – 8,462,431 Private debt securities 2,358,046 2,287,623 – – – – 4,645,669 Quoted equity securities – – – 6,613 – – 6,613 Unquoted equity securities – – – 3,289 – – 3,289HTM investments Government debt securities 20,046,355 – – – – – 20,046,355 Private debt securities 516,161 2,594,371 – – – – 3,110,532Total P=32,743,286 P=4,882,493 P=– P=9,902 P=– P=– P=37,635,681*Shown gross of allowance for credit and impairment losses
Impairment AssessmentImpairment losses are recognized based on the results of a specific (individual) and collectiveassessment of credit exposures. Impairment has taken place when there is a presence of knowndifficulties in the payments of obligation by counterparties, a significant credit rating downgradetakes place, infringement of the original terms of the contract has happened or when there is inabilityto pay principal or interest overdue beyond a threshold (e.g., 90 days). These and other factors, eitherindividually or together with other factors, constitute observable events or data that meet thedefinition of objective evidence of impairment.
Individually assessed allowancesThe Bank determines the allowances appropriate for each significant loan or advance on an individualbasis. Items considered when determining amounts of allowances include an account’s age, paymentand collection history, timing of expected cash flows and realizable value of collateral.
The Bank sets criteria for specific loan impairment testing and uses the discounted cash flowmethodology to compute for impairment loss. Accounts subjected to specific impairment and that arefound to be impaired shall be excluded from the collective impairment computation.
Collectively assessed allowancesAllowances are assessed collectively for losses on commercial loans and advances that are notindividually significant or are found to be not individually impaired. Impairment losses are estimatedby taking into consideration the historical losses using a lookback period of five years on the portfolioand the expected receipts and recoveries once impaired. The Bank is responsible for deciding thelength of historical loss period which can extend for as long as five years. The impairment allowanceis then reviewed by the Bank to ensure alignment with the Bank’s overall policy.
The Bank uses the Net Flow Rate method to determine the credit loss rate of a particular delinquencyage bucket based on historical data of flow-through and flow-back of loans across specificdelinquency age buckets. The method applies to consumer loans, as well as salary and home equityloans granted to employees of the Bank. For commercial loans, the Bank uses Historical Loss Ratemethod in determining the credit loss rate based on the actual historical loss experienced by the Bankon each specific industry type.
Notes to Financial Statements
- 42 -
*SGVFS026939*
High grade - represents those investments which fall under any of the following grade:
Aaa - fixed income obligations are judged to be of the highest quality, with the smallest degree ofrisk.
Aa1, Aa2, Aa3 - fixed income are judged to be of high quality and are subject to very low credit risk,but their susceptibility to long-term risks appears somewhat greater.
A1, A2, A3 - fixed income obligations are considered upper-medium grade and are subject to lowcredit risk, but have elements present that suggest a susceptibility to impairment over the long term.
Baa1, Baa2, Baa3 - fixed income obligations are subject to moderate credit risk. They are consideredmedium grade and as such protective elements may be lacking or may be characteristically unreliable.
Standard grade - represents those investments which fall under any of the following grade:
Ba1, Ba2, Ba3 - obligations are judged to have speculative elements and are subject to substantialcredit risk.
B1, B2, B3 - obligations are considered speculative and are subject to high credit risk.
Substandard grade - represents those investments which fall under any of the following grade:
Caa1, Caa2, Caa3 - are judged to be of poor standing and are subject to very high credit risk.
Ca - are highly speculative and are likely in, or very near, default, with some prospect of recovery ofprincipal and interest.
C - are the lowest rated class of bonds and are typically in default, with little prospect for recovery ofprincipal or interest.
The tables below show the credit quality per class of investment securities (in thousands)*:
2017
Neither Past Due nor Individually ImpairedPast Due
but not
High GradeStandard
GradeSubstandard
Grade UnratedIndividually
ImpairedIndividually
Impaired TotalFVPL HFT - government securities P=293,076 P=– P=– P=– P=– P=– P=293,076 Derivative asset – 73,160 – – – – 73,160AFS investments Government debt securities 10,762,411 – – – – – 10,762,411 Private debt securities 3,777,708 2,375,363 – – – – 6,153,071 Quoted equity securities – – – 8,923 – – 8,923 Unquoted equity securities – – – 3,269 – – 3,269HTM investments Government debt securities 25,460,778 – – – – – 25,460,778 Private debt securities 2,606,038 1,406,909 – – – – 4,012,947Total P=42,900,011 P=3,855,432 P=– P=12,192 P=– P=– P=46,767,635*Shown gross of allowance for credit and impairment losses
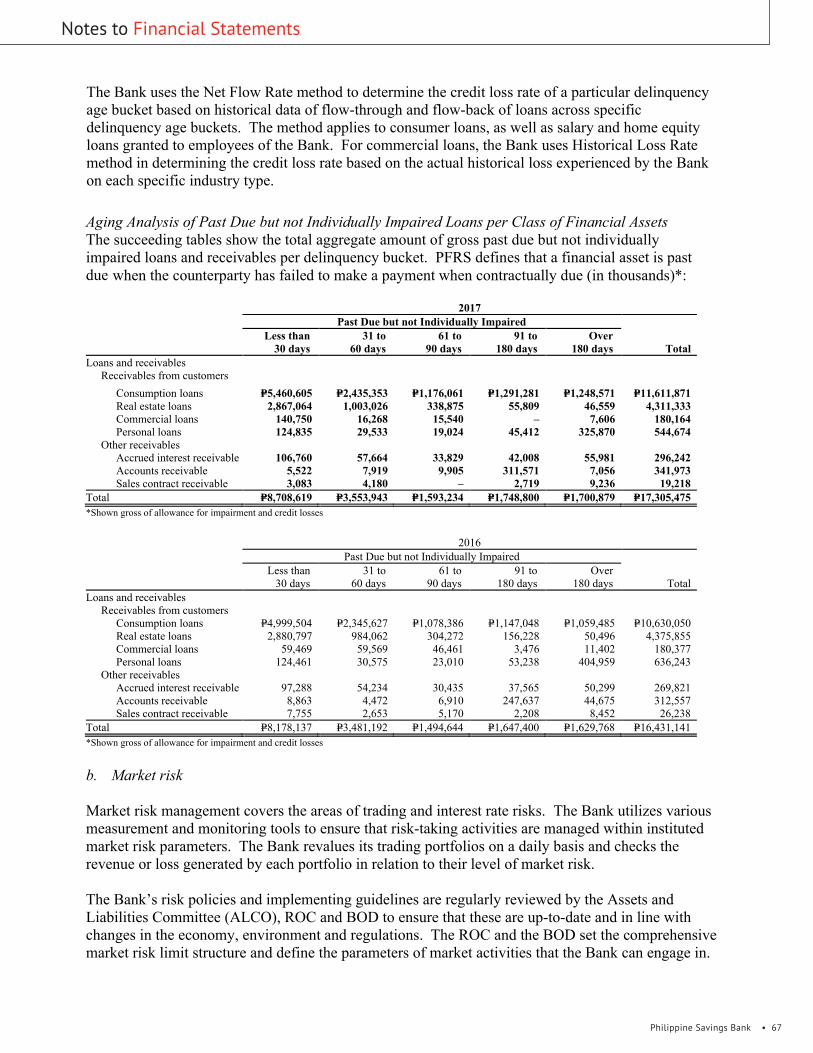
Philippine Savings Bank • 67
Notes to Financial Statements
- 43 -
*SGVFS026939*
2016
Neither Past Due nor Individually ImpairedPast Due
but not
High GradeStandard
GradeSubstandard
Grade UnratedIndividually
ImpairedIndividually
Impaired TotalFVPL HFT - government securities P=1,360,293 P=– P=– P=– P=– P=– P=1,360,293 Derivative asset – 499 – – – – 499AFS investments Government debt securities 8,462,431 – – – – – 8,462,431 Private debt securities 2,358,046 2,287,623 – – – – 4,645,669 Quoted equity securities – – – 6,613 – – 6,613 Unquoted equity securities – – – 3,289 – – 3,289HTM investments Government debt securities 20,046,355 – – – – – 20,046,355 Private debt securities 516,161 2,594,371 – – – – 3,110,532Total P=32,743,286 P=4,882,493 P=– P=9,902 P=– P=– P=37,635,681*Shown gross of allowance for credit and impairment losses
Impairment AssessmentImpairment losses are recognized based on the results of a specific (individual) and collectiveassessment of credit exposures. Impairment has taken place when there is a presence of knowndifficulties in the payments of obligation by counterparties, a significant credit rating downgradetakes place, infringement of the original terms of the contract has happened or when there is inabilityto pay principal or interest overdue beyond a threshold (e.g., 90 days). These and other factors, eitherindividually or together with other factors, constitute observable events or data that meet thedefinition of objective evidence of impairment.
Individually assessed allowancesThe Bank determines the allowances appropriate for each significant loan or advance on an individualbasis. Items considered when determining amounts of allowances include an account’s age, paymentand collection history, timing of expected cash flows and realizable value of collateral.
The Bank sets criteria for specific loan impairment testing and uses the discounted cash flowmethodology to compute for impairment loss. Accounts subjected to specific impairment and that arefound to be impaired shall be excluded from the collective impairment computation.
Collectively assessed allowancesAllowances are assessed collectively for losses on commercial loans and advances that are notindividually significant or are found to be not individually impaired. Impairment losses are estimatedby taking into consideration the historical losses using a lookback period of five years on the portfolioand the expected receipts and recoveries once impaired. The Bank is responsible for deciding thelength of historical loss period which can extend for as long as five years. The impairment allowanceis then reviewed by the Bank to ensure alignment with the Bank’s overall policy.
The Bank uses the Net Flow Rate method to determine the credit loss rate of a particular delinquencyage bucket based on historical data of flow-through and flow-back of loans across specificdelinquency age buckets. The method applies to consumer loans, as well as salary and home equityloans granted to employees of the Bank. For commercial loans, the Bank uses Historical Loss Ratemethod in determining the credit loss rate based on the actual historical loss experienced by the Bankon each specific industry type.
- 44 -
*SGVFS026939*
Aging Analysis of Past Due but not Individually Impaired Loans per Class of Financial AssetsThe succeeding tables show the total aggregate amount of gross past due but not individuallyimpaired loans and receivables per delinquency bucket. PFRS defines that a financial asset is pastduen when the counterparty has failed to make a payment when contractually due (in thousands)*:
2017Past Due but not Individually Impaired
Less than30 days
31 to60 days
61 to90 days
91 to180 days
Over180 days Total
Loans and receivables Receivables from customers Consumption loans P=5,460,605 P=2,435,353 P=1,176,061 P=1,291,281 P=1,248,571 P=11,611,871 Real estate loans 2,867,064 1,003,026 338,875 55,809 46,559 4,311,333 Commercial loans 140,750 16,268 15,540 – 7,606 180,164 Personal loans 124,835 29,533 19,024 45,412 325,870 544,674 Other receivables Accrued interest receivable 106,760 57,664 33,829 42,008 55,981 296,242 Accounts receivable 5,522 7,919 9,905 311,571 7,056 341,973 Sales contract receivable 3,083 4,180 – 2,719 9,236 19,218Total P=8,708,619 P=3,553,943 P=1,593,234 P=1,748,800 P=1,700,879 P=17,305,475*Shown gross of allowance for impairment and credit losses
2016Past Due but not Individually Impaired
Less than30 days
31 to60 days
61 to90 days
91 to180 days
Over180 days Total
Loans and receivables Receivables from customers Consumption loans P=4,999,504 P=2,345,627 P=1,078,386 P=1,147,048 P=1,059,485 P=10,630,050 Real estate loans 2,880,797 984,062 304,272 156,228 50,496 4,375,855 Commercial loans 59,469 59,569 46,461 3,476 11,402 180,377 Personal loans 124,461 30,575 23,010 53,238 404,959 636,243 Other receivables Accrued interest receivable 97,288 54,234 30,435 37,565 50,299 269,821 Accounts receivable 8,863 4,472 6,910 247,637 44,675 312,557 Sales contract receivable 7,755 2,653 5,170 2,208 8,452 26,238Total P=8,178,137 P=3,481,192 P=1,494,644 P=1,647,400 P=1,629,768 P=16,431,141*Shown gross of allowance for impairment and credit losses
b. Market risk
Market risk management covers the areas of trading and interest rate risks. The Bank utilizes variousmeasurement and monitoring tools to ensure that risk-taking activities are managed within institutedmarket risk parameters. The Bank revalues its trading portfolios on a daily basis and checks therevenue or loss generated by each portfolio in relation to their level of market risk.
The Bank’s risk policies and implementing guidelines are regularly reviewed by the Assets andLiabilities Committee (ALCO), ROC and BOD to ensure that these are up-to-date and in line withchanges in the economy, environment and regulations. The ROC and the BOD set the comprehensivemarket risk limit structure and define the parameters of market activities that the Bank can engage in.
Market risk is the risk to earnings and capital arising from changes in the value of traded portfolios offinancial instruments (trading market risk) and from movements in interest rates (interest rate risk).The Bank’s market risk originates primarily from holding peso and dollar-denominated debtsecurities. The Bank utilizes Value-at-Risk (VaR) to measure and manage market risk exposure.VaR estimates the potential decline in the value of a portfolio, under normal market conditions, for agiven confidence level over a specified holding period.

68 • 2017 Annual Report •
- 44 -
*SGVFS026939*
Aging Analysis of Past Due but not Individually Impaired Loans per Class of Financial AssetsThe succeeding tables show the total aggregate amount of gross past due but not individuallyimpaired loans and receivables per delinquency bucket. PFRS defines that a financial asset is pastduen when the counterparty has failed to make a payment when contractually due (in thousands)*:
2017Past Due but not Individually Impaired
Less than30 days
31 to60 days
61 to90 days
91 to180 days
Over180 days Total
Loans and receivables Receivables from customers Consumption loans P=5,460,605 P=2,435,353 P=1,176,061 P=1,291,281 P=1,248,571 P=11,611,871 Real estate loans 2,867,064 1,003,026 338,875 55,809 46,559 4,311,333 Commercial loans 140,750 16,268 15,540 – 7,606 180,164 Personal loans 124,835 29,533 19,024 45,412 325,870 544,674 Other receivables Accrued interest receivable 106,760 57,664 33,829 42,008 55,981 296,242 Accounts receivable 5,522 7,919 9,905 311,571 7,056 341,973 Sales contract receivable 3,083 4,180 – 2,719 9,236 19,218Total P=8,708,619 P=3,553,943 P=1,593,234 P=1,748,800 P=1,700,879 P=17,305,475*Shown gross of allowance for impairment and credit losses
2016Past Due but not Individually Impaired
Less than30 days
31 to60 days
61 to90 days
91 to180 days
Over180 days Total
Loans and receivables Receivables from customers Consumption loans P=4,999,504 P=2,345,627 P=1,078,386 P=1,147,048 P=1,059,485 P=10,630,050 Real estate loans 2,880,797 984,062 304,272 156,228 50,496 4,375,855 Commercial loans 59,469 59,569 46,461 3,476 11,402 180,377 Personal loans 124,461 30,575 23,010 53,238 404,959 636,243 Other receivables Accrued interest receivable 97,288 54,234 30,435 37,565 50,299 269,821 Accounts receivable 8,863 4,472 6,910 247,637 44,675 312,557 Sales contract receivable 7,755 2,653 5,170 2,208 8,452 26,238Total P=8,178,137 P=3,481,192 P=1,494,644 P=1,647,400 P=1,629,768 P=16,431,141*Shown gross of allowance for impairment and credit losses
b. Market risk
Market risk management covers the areas of trading and interest rate risks. The Bank utilizes variousmeasurement and monitoring tools to ensure that risk-taking activities are managed within institutedmarket risk parameters. The Bank revalues its trading portfolios on a daily basis and checks therevenue or loss generated by each portfolio in relation to their level of market risk.
The Bank’s risk policies and implementing guidelines are regularly reviewed by the Assets andLiabilities Committee (ALCO), ROC and BOD to ensure that these are up-to-date and in line withchanges in the economy, environment and regulations. The ROC and the BOD set the comprehensivemarket risk limit structure and define the parameters of market activities that the Bank can engage in.
Market risk is the risk to earnings and capital arising from changes in the value of traded portfolios offinancial instruments (trading market risk) and from movements in interest rates (interest rate risk).The Bank’s market risk originates primarily from holding peso and dollar-denominated debtsecurities. The Bank utilizes Value-at-Risk (VaR) to measure and manage market risk exposure.VaR estimates the potential decline in the value of a portfolio, under normal market conditions, for agiven confidence level over a specified holding period.
- 45 -
*SGVFS026939*
Trading activitiesThe Bank’s trading portfolios are currently composed of peso and dollar-denominated fixed incomesecurities that are marked-to-market daily. The Bank also uses VaR to measure the extent of marketrisk exposure arising from these portfolios.
VaR is a statistical measure that calculates the maximum potential loss from a portfolio over aholding period, within a given confidence level. The Bank’s current VaR model uses historicalsimulation for Peso and USD HFT portfolios with confidence level at 99.00% and a 1 day holdingperiod. It utilizes a 250 days rolling data most recently observed daily percentage changes in pricefor each asset class in its portfolio.
VaR reports are prepared on a daily basis and submitted to Treasury Group and RMO. VaR is alsoreported to the ROC and BOD on a monthly basis. The President, ROC and BOD are advised ofpotential losses that exceed prudent levels or limits.
When there is a breach in VaR limits, Treasury Group is expected to close or reduce their positionand bring it down within the limit unless approval from the President is obtained to retain the same.All breaches are reported to the President for regularization. In addition to the regularization andapproval of the President, breaches in VaR limits and special approvals are likewise reported to theROC and BOD for their information and confirmation.
Back-testing is employed to verify the effectiveness of the VaR model. The Bank performs back-testing to validate the VaR model and stress testing to determine the impact of extreme marketmovements on the portfolios. Results of backtesting are reported to the ROC and BOD on a monthlybasis. Stress testing is also conducted, based on historical maximum percentage daily movement andon an ad-hoc rate shock to estimate potential losses in a crisis situation.
The Bank has established limits, VaR, stop loss limits and loss triggers, for its trading portfolios.Daily profit or losses of the trading portfolios are closely monitored against loss triggers and stop-losslimits.
Responsibility for managing the Bank’s trading market risk remains with the ROC. With the supportof RMO, the ROC recommends to the BOD changes in market risk limits, approving authorities andother activities that need special consideration.
Discussed below are the limitations and assumptions applied by the Bank on its VaR methodology:
a. VaR is a statistical estimate and thus, does not give the precise amount of loss;b. VaR is not designed to give the probability of bank failure, but only attempts to quantify losses
that may arise from a bank’s exposure to market risk;c. Historical simulation does not involve any distributional assumptions, scenarios that are used in
computing VaR are limited to those that occurred in the historical sample; andd. VaR systems are backward-looking. It attempts to forecast likely future losses using past data.
As such, this assumes that past relationships will continue to hold in the future. Major shiftstherefore (i.e., an unexpected collapse of the market) are not captured and may inflict losses muchbigger than anything the VaR model may have calculated.
Notes to Financial Statements

Philippine Savings Bank • 69
Notes to Financial Statements
- 46 -
*SGVFS026939*
The Bank’s interest rate VaR follows (in thousands):
December 31, 20171 December 31, 2016Peso USD Peso USD
Year-end 8,644 0 4 9,817Average 9,328 9,108 15,643 8,912High 30,309 39,341 45,741 24,889Low 3 466 3 –1Using METRISK Historical Simulation VaR
Non-trading activities
Interest Rate RiskThe Bank follows a prudent policy on managing its assets and liabilities to ensure that fluctuations ininterest rates are kept within acceptable limits.
One method by which the Bank measures the sensitivity of its assets and liabilities to interest ratefluctuations is by way of “gap” analysis. This analysis provides the Bank with a static view of thematurity and repricing characteristics of the positions in its statement of condition. An interest rategap report is prepared by classifying all assets and liabilities into various time period categoriesaccording to contracted maturities or anticipated repricing dates, whichever is earlier. Non-maturingdeposits are considered as rate sensitive liabilities; no loan pre-payments assumptions are used. Thedifference in the amount of assets and liabilities maturing or being repriced in any time periodcategory would then give the Bank an indication of the extent to which it is exposed to the risk ofpotential changes in net interest income.
The interest rate sensitivity gap report measures interest rate risk by identifying gaps between therepricing dates of assets and liabilities. The Bank’s sensitivity gap model calculates the effect ofpossible rate movements on its interest rate profile.
The Bank uses sensitivity gap model to estimate Earnings-at-Risk (EaR) should interest rates moveagainst its interest rate profile. The Bank’s EaR limits are based on a percentage of the Bank’sprojected earnings for the year or capital whichever is lower. The Bank also performs stress-testingto measure the impact of various scenarios based on interest rate volatility and shift in the yield curve.The EaR and stress testing reports are prepared on a monthly basis.
The ALCO is responsible for managing the Bank’s structural interest rate exposure. The ALCO’sgoal is to achieve a desired overall interest rate profile while remaining flexible to interest ratemovements and changes in economic conditions. The RMO and ROC review and oversee the Bank’sinterest rate risks.
The table below demonstrate the sensitivity equity. Equity sensitivity was computed by calculatingmark-to-market changes of AFS debt instruments, assuming a parallel shift in the yield curve.
2017 2016Change in
basis points Sensitivity of equityChange in
basis points Sensitivity of equity
CurrencyPHP +10 (53,429,706) +10 (33,918,897)USD +10 (61,335,975) +10 (61,686,169)
CurrencyPHP -10 54,019,588 -10 46,027,531USD -10 62,192,804 -10 62,421,587
- 45 -
*SGVFS026939*
Trading activitiesThe Bank’s trading portfolios are currently composed of peso and dollar-denominated fixed incomesecurities that are marked-to-market daily. The Bank also uses VaR to measure the extent of marketrisk exposure arising from these portfolios.
VaR is a statistical measure that calculates the maximum potential loss from a portfolio over aholding period, within a given confidence level. The Bank’s current VaR model uses historicalsimulation for Peso and USD HFT portfolios with confidence level at 99.00% and a 1 day holdingperiod. It utilizes a 250 days rolling data most recently observed daily percentage changes in pricefor each asset class in its portfolio.
VaR reports are prepared on a daily basis and submitted to Treasury Group and RMO. VaR is alsoreported to the ROC and BOD on a monthly basis. The President, ROC and BOD are advised ofpotential losses that exceed prudent levels or limits.
When there is a breach in VaR limits, Treasury Group is expected to close or reduce their positionand bring it down within the limit unless approval from the President is obtained to retain the same.All breaches are reported to the President for regularization. In addition to the regularization andapproval of the President, breaches in VaR limits and special approvals are likewise reported to theROC and BOD for their information and confirmation.
Back-testing is employed to verify the effectiveness of the VaR model. The Bank performs back-testing to validate the VaR model and stress testing to determine the impact of extreme marketmovements on the portfolios. Results of backtesting are reported to the ROC and BOD on a monthlybasis. Stress testing is also conducted, based on historical maximum percentage daily movement andon an ad-hoc rate shock to estimate potential losses in a crisis situation.
The Bank has established limits, VaR, stop loss limits and loss triggers, for its trading portfolios.Daily profit or losses of the trading portfolios are closely monitored against loss triggers and stop-losslimits.
Responsibility for managing the Bank’s trading market risk remains with the ROC. With the supportof RMO, the ROC recommends to the BOD changes in market risk limits, approving authorities andother activities that need special consideration.
Discussed below are the limitations and assumptions applied by the Bank on its VaR methodology:
a. VaR is a statistical estimate and thus, does not give the precise amount of loss;b. VaR is not designed to give the probability of bank failure, but only attempts to quantify losses
that may arise from a bank’s exposure to market risk;c. Historical simulation does not involve any distributional assumptions, scenarios that are used in
computing VaR are limited to those that occurred in the historical sample; andd. VaR systems are backward-looking. It attempts to forecast likely future losses using past data.
As such, this assumes that past relationships will continue to hold in the future. Major shiftstherefore (i.e., an unexpected collapse of the market) are not captured and may inflict losses muchbigger than anything the VaR model may have calculated.

70 • 2017 Annual Report •
- 47 -
*SGVFS026939*
The impact on the Bank’s equity excludes the impact on transactions affecting the statement ofincome.
Foreign Currency RiskForeign currency risk is the risk of an investment's value changing due to an adverse movement incurrency exchange rates. It arises due to a mismatch in the Bank's foreign currency assets andliabilities.
The Bank’s policy is to maintain foreign currency exposure within the approved position, stop loss,loss trigger, VaR limits and to remain within existing regulatory guidelines. To compute for VaR, theBank uses historical simulation model for USD/PHP FX position, with confidence level at 99.00%and a 1 day holding period. The Bank’s VaR for its foreign exchange position for trading and non-trading activities are as follows (in thousands):
20171 20161
As of year-end P=1,140 P=176Average 883 752High 1,302 1,249Low 175 18
1Using METRISK Historical Simulation VaR
The table below summarizes the Bank’s exposure to foreign exchange risk as ofDecember 31, 2017 and 2016. Included in the table are the Bank’s assets and liabilities at carryingamounts (in thousands):
2017 2016AssetsCash $3 $82Due from other banks 381 1,728FVPL investments – 10AFS investments – 56,160 Total assets 384 57,980LiabilitiesDeposit liabilities Savings 56 62 Time 43 52Financial liabilities at FVPL – 1,314Other liabilities 290 11 Total liabilities 389 1,439
Net exposure ($5) $56,541
c. Liquidity Risk
The Bank’s policy on liquidity management emphasizes on three elements of liquidity, namely,cashflow management, ability to borrow in the interbank market, and maintenance of a stock of highquality liquid assets. These three approaches complement one another with greater weight beinggiven to a particular approach, depending upon the circumstances. The Bank’s objective in liquiditymanagement is to ensure that the Bank has sufficient liquidity to meet obligations under normal andadverse circumstances and is able to take advantage of lending and investment opportunities as theyarise.
Notes to Financial Statements
- 46 -
*SGVFS026939*
The Bank’s interest rate VaR follows (in thousands):
December 31, 20171 December 31, 2016Peso USD Peso USD
Year-end 8,644 0 4 9,817Average 9,328 9,108 15,643 8,912High 30,309 39,341 45,741 24,889Low 3 466 3 –1Using METRISK Historical Simulation VaR
Non-trading activities
Interest Rate RiskThe Bank follows a prudent policy on managing its assets and liabilities to ensure that fluctuations ininterest rates are kept within acceptable limits.
One method by which the Bank measures the sensitivity of its assets and liabilities to interest ratefluctuations is by way of “gap” analysis. This analysis provides the Bank with a static view of thematurity and repricing characteristics of the positions in its statement of condition. An interest rategap report is prepared by classifying all assets and liabilities into various time period categoriesaccording to contracted maturities or anticipated repricing dates, whichever is earlier. Non-maturingdeposits are considered as rate sensitive liabilities; no loan pre-payments assumptions are used. Thedifference in the amount of assets and liabilities maturing or being repriced in any time periodcategory would then give the Bank an indication of the extent to which it is exposed to the risk ofpotential changes in net interest income.
The interest rate sensitivity gap report measures interest rate risk by identifying gaps between therepricing dates of assets and liabilities. The Bank’s sensitivity gap model calculates the effect ofpossible rate movements on its interest rate profile.
The Bank uses sensitivity gap model to estimate Earnings-at-Risk (EaR) should interest rates moveagainst its interest rate profile. The Bank’s EaR limits are based on a percentage of the Bank’sprojected earnings for the year or capital whichever is lower. The Bank also performs stress-testingto measure the impact of various scenarios based on interest rate volatility and shift in the yield curve.The EaR and stress testing reports are prepared on a monthly basis.
The ALCO is responsible for managing the Bank’s structural interest rate exposure. The ALCO’sgoal is to achieve a desired overall interest rate profile while remaining flexible to interest ratemovements and changes in economic conditions. The RMO and ROC review and oversee the Bank’sinterest rate risks.
The table below demonstrate the sensitivity equity. Equity sensitivity was computed by calculatingmark-to-market changes of AFS debt instruments, assuming a parallel shift in the yield curve.
2017 2016Change in
basis points Sensitivity of equityChange in
basis points Sensitivity of equity
CurrencyPHP +10 (53,429,706) +10 (33,918,897)USD +10 (61,335,975) +10 (61,686,169)
CurrencyPHP -10 54,019,588 -10 46,027,531USD -10 62,192,804 -10 62,421,587
Philippine Savings Bank • 71
Notes to Financial Statements
- 48 -
*SGVFS026939*
The main tool that the Bank uses for monitoring its liquidity is the Maximum Cumulative Outflow(MCO) reports, which is also called liquidity gap or maturity matching gap reports. The MCO is auseful tool in measuring and analyzing the Bank’s cash flow projections and monitoring liquidityrisks. The liquidity gap report shows the projected cash flows of assets and liabilities representingestimated funding sources and requirements under normal conditions, which also forms the basis forthe Bank’s Liquidity Contingency Funding Plan (LCFP). The LCFP projects the Bank’s fundingposition during stress to help evaluate the Bank’s funding needs and strategies under various stressconditions.
The Bank discourages dependence on Large Funds Providers (LFPs) and monitors the depositfunding concentrations so that it will not be vulnerable to a substantial drop in deposit level shouldthere be an outflow of large deposits. ALCO is responsible for managing the liquidity of the Bankwhile RMO and ROC review and oversee the Bank’s overall liquidity risk management.
To mitigate potential liquidity problems caused by unexpected withdrawals of significant deposits,the Bank takes steps to cultivate good business relationships with clients and financial institutions,maintains high level of high quality liquid assets, monitors the deposit funding concentrations andregularly updates the Liquidity Contingency Funding Plan.
Financial assetsAnalysis of equity and debt securities at FVPL and AFS investments into maturity groupings is basedon the expected date on which these assets will be realized. For other assets, the analysis intomaturity grouping is based on the remaining period from the end of the reporting period to thecontractual maturity date or if earlier, the expected date the assets will be realized.
Financial liabilitiesThe maturity grouping is based on the remaining period from the end of the reporting period to thecontractual maturity date and does not consider the behavioral pattern of the creditors. When thecounterparty has a choice of when the amount is paid, the liability is allocated to the earliest period inwhich the Bank can be required to pay.
Analysis of Financial Assets and Liabilities by Remaining MaturitiesThe tables below show the maturity profile of the Bank’s financial assets and liabilities based oncontractual undiscounted repayment obligations (in millions):
2017
On demandUp to
1 monthOver 1 to3 months
Over 3 to6 months
Over 6 to12 months
Total within1 year
Beyond1 year Total
Financial AssetsFVPL HFT - government securities P=306 P=– P=– P=– P=– P=306 P=– P=306 Derivatives – – 73 – – 73 – 73AFS investments Government securities – 110 192 147 422 871 21,782 22,653 Quoted equity securities – – – – – – 8 8 Unquoted equity securities – – – – – – 1 1HTM investments Government bonds – 227 347 196 766 1,536 39,290 40,826Loans and receivables Loans and advances to banks Due from BSP 15,265 – – – – 15,265 – 15,265 Due from other banks 1,508 – – – – 1,508 – 1,508 Interbank loans receivable and SPURA – 1,842 – – – 1,842 – 1,842 Receivables from customers Consumption loans 121 1,117 2,332 3,749 8,378 15,697 114,129 129,826 Real estate loans 111 385 945 1,582 3,434 6,457 75,848 82,305 Commercial loans 575 463 1,367 716 1,260 4,381 10,918 15,299 Personal loans 1,046 172 341 532 1,378 3,469 1,661 5,130
(Forward)
- 47 -
*SGVFS026939*
The impact on the Bank’s equity excludes the impact on transactions affecting the statement ofincome.
Foreign Currency RiskForeign currency risk is the risk of an investment's value changing due to an adverse movement incurrency exchange rates. It arises due to a mismatch in the Bank's foreign currency assets andliabilities.
The Bank’s policy is to maintain foreign currency exposure within the approved position, stop loss,loss trigger, VaR limits and to remain within existing regulatory guidelines. To compute for VaR, theBank uses historical simulation model for USD/PHP FX position, with confidence level at 99.00%and a 1 day holding period. The Bank’s VaR for its foreign exchange position for trading and non-trading activities are as follows (in thousands):
20171 20161
As of year-end P=1,140 P=176Average 883 752High 1,302 1,249Low 175 18
1Using METRISK Historical Simulation VaR
The table below summarizes the Bank’s exposure to foreign exchange risk as ofDecember 31, 2017 and 2016. Included in the table are the Bank’s assets and liabilities at carryingamounts (in thousands):
2017 2016AssetsCash $3 $82Due from other banks 381 1,728FVPL investments – 10AFS investments – 56,160 Total assets 384 57,980LiabilitiesDeposit liabilities Savings 56 62 Time 43 52Financial liabilities at FVPL – 1,314Other liabilities 290 11 Total liabilities 389 1,439
Net exposure ($5) $56,541
c. Liquidity Risk
The Bank’s policy on liquidity management emphasizes on three elements of liquidity, namely,cashflow management, ability to borrow in the interbank market, and maintenance of a stock of highquality liquid assets. These three approaches complement one another with greater weight beinggiven to a particular approach, depending upon the circumstances. The Bank’s objective in liquiditymanagement is to ensure that the Bank has sufficient liquidity to meet obligations under normal andadverse circumstances and is able to take advantage of lending and investment opportunities as theyarise.

72 • 2017 Annual Report •
Notes to Financial Statements
- 48 -
*SGVFS026939*
The main tool that the Bank uses for monitoring its liquidity is the Maximum Cumulative Outflow(MCO) reports, which is also called liquidity gap or maturity matching gap reports. The MCO is auseful tool in measuring and analyzing the Bank’s cash flow projections and monitoring liquidityrisks. The liquidity gap report shows the projected cash flows of assets and liabilities representingestimated funding sources and requirements under normal conditions, which also forms the basis forthe Bank’s Liquidity Contingency Funding Plan (LCFP). The LCFP projects the Bank’s fundingposition during stress to help evaluate the Bank’s funding needs and strategies under various stressconditions.
The Bank discourages dependence on Large Funds Providers (LFPs) and monitors the depositfunding concentrations so that it will not be vulnerable to a substantial drop in deposit level shouldthere be an outflow of large deposits. ALCO is responsible for managing the liquidity of the Bankwhile RMO and ROC review and oversee the Bank’s overall liquidity risk management.
To mitigate potential liquidity problems caused by unexpected withdrawals of significant deposits,the Bank takes steps to cultivate good business relationships with clients and financial institutions,maintains high level of high quality liquid assets, monitors the deposit funding concentrations andregularly updates the Liquidity Contingency Funding Plan.
Financial assetsAnalysis of equity and debt securities at FVPL and AFS investments into maturity groupings is basedon the expected date on which these assets will be realized. For other assets, the analysis intomaturity grouping is based on the remaining period from the end of the reporting period to thecontractual maturity date or if earlier, the expected date the assets will be realized.
Financial liabilitiesThe maturity grouping is based on the remaining period from the end of the reporting period to thecontractual maturity date and does not consider the behavioral pattern of the creditors. When thecounterparty has a choice of when the amount is paid, the liability is allocated to the earliest period inwhich the Bank can be required to pay.
Analysis of Financial Assets and Liabilities by Remaining MaturitiesThe tables below show the maturity profile of the Bank’s financial assets and liabilities based oncontractual undiscounted repayment obligations (in millions):
2017
On demandUp to
1 monthOver 1 to3 months
Over 3 to6 months
Over 6 to12 months
Total within1 year
Beyond1 year Total
Financial AssetsFVPL HFT - government securities P=306 P=– P=– P=– P=– P=306 P=– P=306 Derivatives – – 73 – – 73 – 73AFS investments Government securities – 110 192 147 422 871 21,782 22,653 Quoted equity securities – – – – – – 8 8 Unquoted equity securities – – – – – – 1 1HTM investments Government bonds – 227 347 196 766 1,536 39,290 40,826Loans and receivables Loans and advances to banks Due from BSP 15,265 – – – – 15,265 – 15,265 Due from other banks 1,508 – – – – 1,508 – 1,508 Interbank loans receivable and SPURA – 1,842 – – – 1,842 – 1,842 Receivables from customers Consumption loans 121 1,117 2,332 3,749 8,378 15,697 114,129 129,826 Real estate loans 111 385 945 1,582 3,434 6,457 75,848 82,305 Commercial loans 575 463 1,367 716 1,260 4,381 10,918 15,299 Personal loans 1,046 172 341 532 1,378 3,469 1,661 5,130
(Forward)
- 49 -
*SGVFS026939*
2017
On demandUp to
1 monthOver 1 to3 months
Over 3 to6 months
Over 6 to12 months
Total within1 year
Beyond1 year Total
Other receivables Accrued interest receivable P=36 P=20 P=19 P=33 P=75 P=183 P=1,729 P=1,912 Accounts receivable 4 721 5 9 490 1,229 21 1,250 Sales contract receivable 5 1 1 2 6 15 124 139Other assets Security deposits – – – – – – – – RCOCI 10 – – – – 10 – 10 Shortages 179 – – – – 179 – 179
P=19,166 P=5,058 P=5,622 P=6,966 P=16,209 P=53,021 P=265,511 P=318,532
Financial LiabilitiesDeposit liabilities Demand P=19,113 P=– P=– P=– P=– P=19,113 P=– P=19,113 Savings 30,384 – – – – 30,384 – 30,384 Time – 13,556 50,086 20,331 31,039 115,012 24,674 139,686 LTNCD – 30 – 30 58 118 3,759 3,877
49,497 13,586 50,086 20,361 31,097 164,627 28,433 193,060Bills payable – 1,497 – – – 1,497 – 1,497Subordinated notes – – 41 41 83 165 3,990 4,155Treasurer’s, cashier’s and manager’s checks 2,214 2,214 2,214Accrued interest payable – – 518 22 – 540 – 540Accrued other expenses payable 1,119 – – – – 1,119 – 1,119Other liabilities Accounts payable 2,080 – – – – 2,080 – 2,080 Other credits – – – – – – 1,146 1,146 Bills purchased - contra 10 – – – – 10 – 10 Due to the Treasurer of the Philippines – – – – – – 17 17 Deposit for keys 1 – – – – 1 – 1 Overages 6 – – – – 6 – 6
P=54,927 P=15,083 P=50,645 P=20,424 P=31,180 P=172,259 P=33,586 P=205,845
2016
On demandUp to
1 monthOver 1 to3 months
Over 3 to6 months
Over 6 to12 months
Total within1 year
Beyond1 year Total
Financial AssetsFVPL HFT - government securities P=64 P=609 P=710 P=– P=– P=1,383 P=– P=1,383 Derivatives – – 1 – – 1 – 1AFS investments Government securities 5 4 7 45 157 218 13,083 13,301 Private debt securities – – 26 28 93 147 5,798 5,945 Quoted equity securities – – – – – – 7 7 Unquoted equity securities – – – – – – 3 3HTM investments Government bonds – 30 24 85 400 539 24,998 25,537 Private bonds – 1 6 39 395 441 2,965 3,406Loans and receivables Loans and advances to banks Due from BSP 13,987 – – – – 13,987 – 13,987 Due from other banks 1,839 – – – – 1,839 – 1,839 Interbank loans receivable and SPURA 1 – – – – 1 – 1 Receivables from customers Consumption loans 119 2,024 4,254 6,611 14,451 27,459 60,024 87,483 Real estate loans 136 647 1,539 2,379 5,317 10,018 55,570 65,588 Commercial loans 419 801 607 437 778 3,042 11,920 14,962 Personal loans 637 154 357 595 1,699 3,442 604 4,046Other receivables Accrued interest receivable 1,422 – 187 47 46 1,702 71 1,773 Accounts receivable 801 – – – – 801 – 801 Sales contract receivable 4 3 7 11 21 46 140 186Other assets Security deposits – 4 1 5 15 25 154 179 RCOCI 10 – – – – 10 – 10 Shortages 1 – – – – 1 – 1
P=19,445 P=4,277 P=7,726 P=10,282 P=23,372 P=65,102 P=175,337 P=240,439
(Forward)
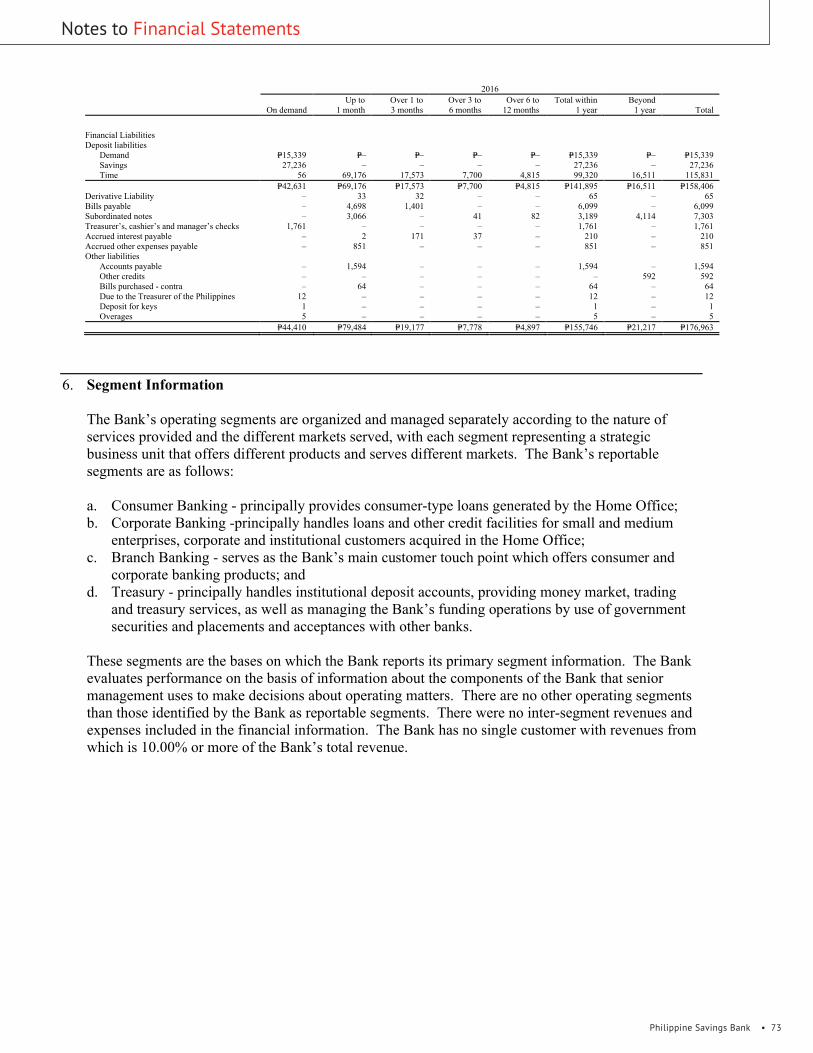
Philippine Savings Bank • 73
Notes to Financial Statements- 50 -
*SGVFS026939*
2016
On demandUp to
1 monthOver 1 to3 months
Over 3 to6 months
Over 6 to12 months
Total within1 year
Beyond1 year Total
Financial LiabilitiesDeposit liabilities Demand P=15,339 P=– P=– P=– P=– P=15,339 P=– P=15,339 Savings 27,236 – – – – 27,236 – 27,236 Time 56 69,176 17,573 7,700 4,815 99,320 16,511 115,831
P=42,631 P=69,176 P=17,573 P=7,700 P=4,815 P=141,895 P=16,511 P=158,406Derivative Liability – 33 32 – – 65 – 65Bills payable – 4,698 1,401 – – 6,099 – 6,099Subordinated notes – 3,066 – 41 82 3,189 4,114 7,303Treasurer’s, cashier’s and manager’s checks 1,761 – – – – 1,761 – 1,761Accrued interest payable – 2 171 37 – 210 – 210Accrued other expenses payable – 851 – – – 851 – 851Other liabilities Accounts payable – 1,594 – – – 1,594 – 1,594 Other credits – – – – – – 592 592 Bills purchased - contra – 64 – – – 64 – 64 Due to the Treasurer of the Philippines 12 – – – – 12 – 12 Deposit for keys 1 – – – – 1 – 1 Overages 5 – – – – 5 – 5
P=44,410 P=79,484 P=19,177 P=7,778 P=4,897 P=155,746 P=21,217 P=176,963
6. Segment Information
The Bank’s operating segments are organized and managed separately according to the nature ofservices provided and the different markets served, with each segment representing a strategicbusiness unit that offers different products and serves different markets. The Bank’s reportablesegments are as follows:
a. Consumer Banking - principally provides consumer-type loans generated by the Home Office;b. Corporate Banking -principally handles loans and other credit facilities for small and medium
enterprises, corporate and institutional customers acquired in the Home Office;c. Branch Banking - serves as the Bank’s main customer touch point which offers consumer and
corporate banking products; andd. Treasury - principally handles institutional deposit accounts, providing money market, trading
and treasury services, as well as managing the Bank’s funding operations by use of governmentsecurities and placements and acceptances with other banks.
These segments are the bases on which the Bank reports its primary segment information. The Bankevaluates performance on the basis of information about the components of the Bank that seniormanagement uses to make decisions about operating matters. There are no other operating segmentsthan those identified by the Bank as reportable segments. There were no inter-segment revenues andexpenses included in the financial information. The Bank has no single customer with revenues fromwhich is 10.00% or more of the Bank’s total revenue.
- 50 -
*SGVFS026939*
2016
On demandUp to
1 monthOver 1 to3 months
Over 3 to6 months
Over 6 to12 months
Total within1 year
Beyond1 year Total
Financial LiabilitiesDeposit liabilities Demand P=15,339 P=– P=– P=– P=– P=15,339 P=– P=15,339 Savings 27,236 – – – – 27,236 – 27,236 Time 56 69,176 17,573 7,700 4,815 99,320 16,511 115,831
P=42,631 P=69,176 P=17,573 P=7,700 P=4,815 P=141,895 P=16,511 P=158,406Derivative Liability – 33 32 – – 65 – 65Bills payable – 4,698 1,401 – – 6,099 – 6,099Subordinated notes – 3,066 – 41 82 3,189 4,114 7,303Treasurer’s, cashier’s and manager’s checks 1,761 – – – – 1,761 – 1,761Accrued interest payable – 2 171 37 – 210 – 210Accrued other expenses payable – 851 – – – 851 – 851Other liabilities Accounts payable – 1,594 – – – 1,594 – 1,594 Other credits – – – – – – 592 592 Bills purchased - contra – 64 – – – 64 – 64 Due to the Treasurer of the Philippines 12 – – – – 12 – 12 Deposit for keys 1 – – – – 1 – 1 Overages 5 – – – – 5 – 5
P=44,410 P=79,484 P=19,177 P=7,778 P=4,897 P=155,746 P=21,217 P=176,963
6. Segment Information
The Bank’s operating segments are organized and managed separately according to the nature ofservices provided and the different markets served, with each segment representing a strategicbusiness unit that offers different products and serves different markets. The Bank’s reportablesegments are as follows:
a. Consumer Banking - principally provides consumer-type loans generated by the Home Office;b. Corporate Banking -principally handles loans and other credit facilities for small and medium
enterprises, corporate and institutional customers acquired in the Home Office;c. Branch Banking - serves as the Bank’s main customer touch point which offers consumer and
corporate banking products; andd. Treasury - principally handles institutional deposit accounts, providing money market, trading
and treasury services, as well as managing the Bank’s funding operations by use of governmentsecurities and placements and acceptances with other banks.
These segments are the bases on which the Bank reports its primary segment information. The Bankevaluates performance on the basis of information about the components of the Bank that seniormanagement uses to make decisions about operating matters. There are no other operating segmentsthan those identified by the Bank as reportable segments. There were no inter-segment revenues andexpenses included in the financial information. The Bank has no single customer with revenues fromwhich is 10.00% or more of the Bank’s total revenue.
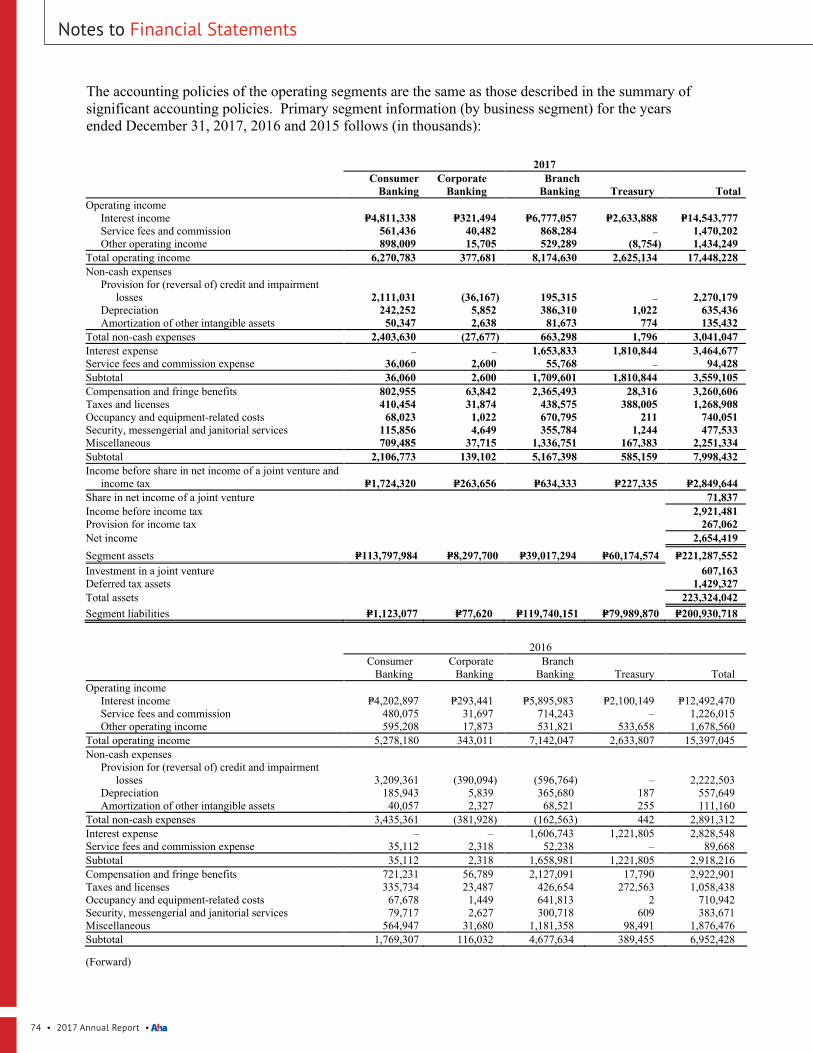
74 • 2017 Annual Report •
- 51 -
*SGVFS026939*
The accounting policies of the operating segments are the same as those described in the summary ofsignificant accounting policies. Primary segment information (by business segment) for the yearsended December 31, 2017, 2016 and 2015 follows (in thousands):
2017Consumer
BankingCorporate
BankingBranch
Banking Treasury TotalOperating income Interest income P=4,811,338 P=321,494 P=6,777,057 P=2,633,888 P=14,543,777 Service fees and commission 561,436 40,482 868,284 – 1,470,202 Other operating income 898,009 15,705 529,289 (8,754) 1,434,249Total operating income 6,270,783 377,681 8,174,630 2,625,134 17,448,228Non-cash expenses Provision for (reversal of) credit and impairment
losses 2,111,031 (36,167) 195,315 – 2,270,179 Depreciation 242,252 5,852 386,310 1,022 635,436 Amortization of other intangible assets 50,347 2,638 81,673 774 135,432Total non-cash expenses 2,403,630 (27,677) 663,298 1,796 3,041,047Interest expense – – 1,653,833 1,810,844 3,464,677Service fees and commission expense 36,060 2,600 55,768 – 94,428Subtotal 36,060 2,600 1,709,601 1,810,844 3,559,105Compensation and fringe benefits 802,955 63,842 2,365,493 28,316 3,260,606Taxes and licenses 410,454 31,874 438,575 388,005 1,268,908Occupancy and equipment-related costs 68,023 1,022 670,795 211 740,051Security, messengerial and janitorial services 115,856 4,649 355,784 1,244 477,533Miscellaneous 709,485 37,715 1,336,751 167,383 2,251,334Subtotal 2,106,773 139,102 5,167,398 585,159 7,998,432Income before share in net income of a joint venture and
income tax P=1,724,320 P=263,656 P=634,333 P=227,335 P=2,849,644Share in net income of a joint venture 71,837Income before income tax 2,921,481Provision for income tax 267,062Net income 2,654,419Segment assets P=113,797,984 P=8,297,700 P=39,017,294 P=60,174,574 P=221,287,552Investment in a joint venture 607,163Deferred tax assets 1,429,327Total assets 223,324,042Segment liabilities P=1,123,077 P=77,620 P=119,740,151 P=79,989,870 P=200,930,718
2016Consumer
BankingCorporate
BankingBranch
Banking Treasury TotalOperating income Interest income P=4,202,897 P=293,441 P=5,895,983 P=2,100,149 P=12,492,470 Service fees and commission 480,075 31,697 714,243 – 1,226,015 Other operating income 595,208 17,873 531,821 533,658 1,678,560Total operating income 5,278,180 343,011 7,142,047 2,633,807 15,397,045Non-cash expenses Provision for (reversal of) credit and impairment losses 3,209,361 (390,094) (596,764) – 2,222,503 Depreciation 185,943 5,839 365,680 187 557,649 Amortization of other intangible assets 40,057 2,327 68,521 255 111,160Total non-cash expenses 3,435,361 (381,928) (162,563) 442 2,891,312Interest expense – – 1,606,743 1,221,805 2,828,548Service fees and commission expense 35,112 2,318 52,238 – 89,668Subtotal 35,112 2,318 1,658,981 1,221,805 2,918,216Compensation and fringe benefits 721,231 56,789 2,127,091 17,790 2,922,901Taxes and licenses 335,734 23,487 426,654 272,563 1,058,438Occupancy and equipment-related costs 67,678 1,449 641,813 2 710,942Security, messengerial and janitorial services 79,717 2,627 300,718 609 383,671Miscellaneous 564,947 31,680 1,181,358 98,491 1,876,476Subtotal 1,769,307 116,032 4,677,634 389,455 6,952,428
(Forward)
Notes to Financial Statements- 51 -
*SGVFS026939*
The accounting policies of the operating segments are the same as those described in the summary ofsignificant accounting policies. Primary segment information (by business segment) for the yearsended December 31, 2017, 2016 and 2015 follows (in thousands):
2017Consumer
BankingCorporate
BankingBranch
Banking Treasury TotalOperating income Interest income P=4,811,338 P=321,494 P=6,777,057 P=2,633,888 P=14,543,777 Service fees and commission 561,436 40,482 868,284 – 1,470,202 Other operating income 898,009 15,705 529,289 (8,754) 1,434,249Total operating income 6,270,783 377,681 8,174,630 2,625,134 17,448,228Non-cash expenses Provision for (reversal of) credit and impairment
losses 2,111,031 (36,167) 195,315 – 2,270,179 Depreciation 242,252 5,852 386,310 1,022 635,436 Amortization of other intangible assets 50,347 2,638 81,673 774 135,432Total non-cash expenses 2,403,630 (27,677) 663,298 1,796 3,041,047Interest expense – – 1,653,833 1,810,844 3,464,677Service fees and commission expense 36,060 2,600 55,768 – 94,428Subtotal 36,060 2,600 1,709,601 1,810,844 3,559,105Compensation and fringe benefits 802,955 63,842 2,365,493 28,316 3,260,606Taxes and licenses 410,454 31,874 438,575 388,005 1,268,908Occupancy and equipment-related costs 68,023 1,022 670,795 211 740,051Security, messengerial and janitorial services 115,856 4,649 355,784 1,244 477,533Miscellaneous 709,485 37,715 1,336,751 167,383 2,251,334Subtotal 2,106,773 139,102 5,167,398 585,159 7,998,432Income before share in net income of a joint venture and
income tax P=1,724,320 P=263,656 P=634,333 P=227,335 P=2,849,644Share in net income of a joint venture 71,837Income before income tax 2,921,481Provision for income tax 267,062Net income 2,654,419Segment assets P=113,797,984 P=8,297,700 P=39,017,294 P=60,174,574 P=221,287,552Investment in a joint venture 607,163Deferred tax assets 1,429,327Total assets 223,324,042Segment liabilities P=1,123,077 P=77,620 P=119,740,151 P=79,989,870 P=200,930,718
2016Consumer
BankingCorporate
BankingBranch
Banking Treasury TotalOperating income Interest income P=4,202,897 P=293,441 P=5,895,983 P=2,100,149 P=12,492,470 Service fees and commission 480,075 31,697 714,243 – 1,226,015 Other operating income 595,208 17,873 531,821 533,658 1,678,560Total operating income 5,278,180 343,011 7,142,047 2,633,807 15,397,045Non-cash expenses Provision for (reversal of) credit and impairment losses 3,209,361 (390,094) (596,764) – 2,222,503 Depreciation 185,943 5,839 365,680 187 557,649 Amortization of other intangible assets 40,057 2,327 68,521 255 111,160Total non-cash expenses 3,435,361 (381,928) (162,563) 442 2,891,312Interest expense – – 1,606,743 1,221,805 2,828,548Service fees and commission expense 35,112 2,318 52,238 – 89,668Subtotal 35,112 2,318 1,658,981 1,221,805 2,918,216Compensation and fringe benefits 721,231 56,789 2,127,091 17,790 2,922,901Taxes and licenses 335,734 23,487 426,654 272,563 1,058,438Occupancy and equipment-related costs 67,678 1,449 641,813 2 710,942Security, messengerial and janitorial services 79,717 2,627 300,718 609 383,671Miscellaneous 564,947 31,680 1,181,358 98,491 1,876,476Subtotal 1,769,307 116,032 4,677,634 389,455 6,952,428
(Forward)

Philippine Savings Bank • 75
Notes to Financial Statements - 52 -
*SGVFS026939*
2016Consumer
BankingCorporate
BankingBranch
Banking Treasury TotalIncome before share in net income of a joint venture and
income tax P=38,400 P=606,589 P=967,995 P=1,022,105 2,635,089Share in net income of a joint venture 35,467Income before income tax 2,670,556Provision for income tax 219,713Net income P=2,450,843Segment assets P=94,193,769 P=8,891,632 P=39,281,097 P=52,458,705 P=194,825,203Investment in a joint venture 727,176Deferred tax assets 1,300,724Total assets P=196,853,103Segment liabilities P=1,365,551 P=110,204 P=108,983,331 P=66,356,344 P=176,815,430
2015Consumer
BankingCorporate
BankingBranch
Banking Treasury TotalOperating income Interest income P=2,424,517 P=433,460 P=6,646,711 P=1,498,039 P=11,002,727 Service fees and commission 341,653 38,519 913,528 – 1,293,700 Other operating income 361,645 31,979 775,216 (44,746) 1,124,094Total operating income 3,127,815 503,958 8,335,455 1,453,293 13,420,521Non-cash expenses Provision for credit and impairment losses 534,730 34,988 1,015,294 3,286 1,588,298 Depreciation 94,839 6,189 400,103 180 501,311 Amortization of other intangible assets 23,423 2,784 73,779 239 100,225Total non-cash expenses 652,992 43,961 1,489,176 3,705 2,189,834Interest expense – – 1,476,307 1,044,474 2,520,781Service fees and commission expense 25,936 2,924 69,348 – 98,208Subtotal 25,936 2,924 1,545,655 1,044,474 2,618,989Compensation and fringe benefits 434,632 53,123 2,111,648 14,465 2,613,868Taxes and licenses 163,728 19,347 512,614 265,404 961,093Occupancy and equipment-related costs 34,129 1,609 635,915 76 671,729Security, messengerial and janitorial services 46,943 3,235 283,232 620 334,030Miscellaneous 279,418 35,962 1,343,991 83,383 1,742,754Subtotal 958,850 113,276 4,887,400 363,948 6,323,474Income before share in net income of a joint venture and
income tax 1,490,037 343,797 413,224 41,166 2,288,224Share in net income of a joint venture 20,214Income before income tax 2,308,438Benefit from income tax 42,462Net income P=2,350,900Segment assets P=82,181,033 P=8,438,387 P=36,990,937 P=39,836,139 P=167,446,496Investment in a joint venture 690,334Deferred tax assets 1,194,417Total assets P=169,331,247Segment liabilities P=1,201,661 P=86,172 P=97,009,484 P=51,858,875 P=150,156,192
7. Interbank Loans Receivable and Securities Purchased Under Resale Agreements
This account consists of the following:
2017 2016Interbank loans receivable P=1,263,772,319 P=–SPURA 578,250,730 3,254,311,599
P=1,842,023,049 P=3,254,311,599
- 52 -
*SGVFS026939*
2016Consumer
BankingCorporate
BankingBranch
Banking Treasury TotalIncome before share in net income of a joint venture and
income tax P=38,400 P=606,589 P=967,995 P=1,022,105 2,635,089Share in net income of a joint venture 35,467Income before income tax 2,670,556Provision for income tax 219,713Net income P=2,450,843Segment assets P=94,193,769 P=8,891,632 P=39,281,097 P=52,458,705 P=194,825,203Investment in a joint venture 727,176Deferred tax assets 1,300,724Total assets P=196,853,103Segment liabilities P=1,365,551 P=110,204 P=108,983,331 P=66,356,344 P=176,815,430
2015Consumer
BankingCorporate
BankingBranch
Banking Treasury TotalOperating income Interest income P=2,424,517 P=433,460 P=6,646,711 P=1,498,039 P=11,002,727 Service fees and commission 341,653 38,519 913,528 – 1,293,700 Other operating income 361,645 31,979 775,216 (44,746) 1,124,094Total operating income 3,127,815 503,958 8,335,455 1,453,293 13,420,521Non-cash expenses Provision for credit and impairment losses 534,730 34,988 1,015,294 3,286 1,588,298 Depreciation 94,839 6,189 400,103 180 501,311 Amortization of other intangible assets 23,423 2,784 73,779 239 100,225Total non-cash expenses 652,992 43,961 1,489,176 3,705 2,189,834Interest expense – – 1,476,307 1,044,474 2,520,781Service fees and commission expense 25,936 2,924 69,348 – 98,208Subtotal 25,936 2,924 1,545,655 1,044,474 2,618,989Compensation and fringe benefits 434,632 53,123 2,111,648 14,465 2,613,868Taxes and licenses 163,728 19,347 512,614 265,404 961,093Occupancy and equipment-related costs 34,129 1,609 635,915 76 671,729Security, messengerial and janitorial services 46,943 3,235 283,232 620 334,030Miscellaneous 279,418 35,962 1,343,991 83,383 1,742,754Subtotal 958,850 113,276 4,887,400 363,948 6,323,474Income before share in net income of a joint venture and
income tax 1,490,037 343,797 413,224 41,166 2,288,224Share in net income of a joint venture 20,214Income before income tax 2,308,438Benefit from income tax 42,462Net income P=2,350,900Segment assets P=82,181,033 P=8,438,387 P=36,990,937 P=39,836,139 P=167,446,496Investment in a joint venture 690,334Deferred tax assets 1,194,417Total assets P=169,331,247Segment liabilities P=1,201,661 P=86,172 P=97,009,484 P=51,858,875 P=150,156,192
7. Interbank Loans Receivable and Securities Purchased Under Resale Agreements
This account consists of the following:
2017 2016Interbank loans receivable P=1,263,772,319 P=–SPURA 578,250,730 3,254,311,599
P=1,842,023,049 P=3,254,311,599
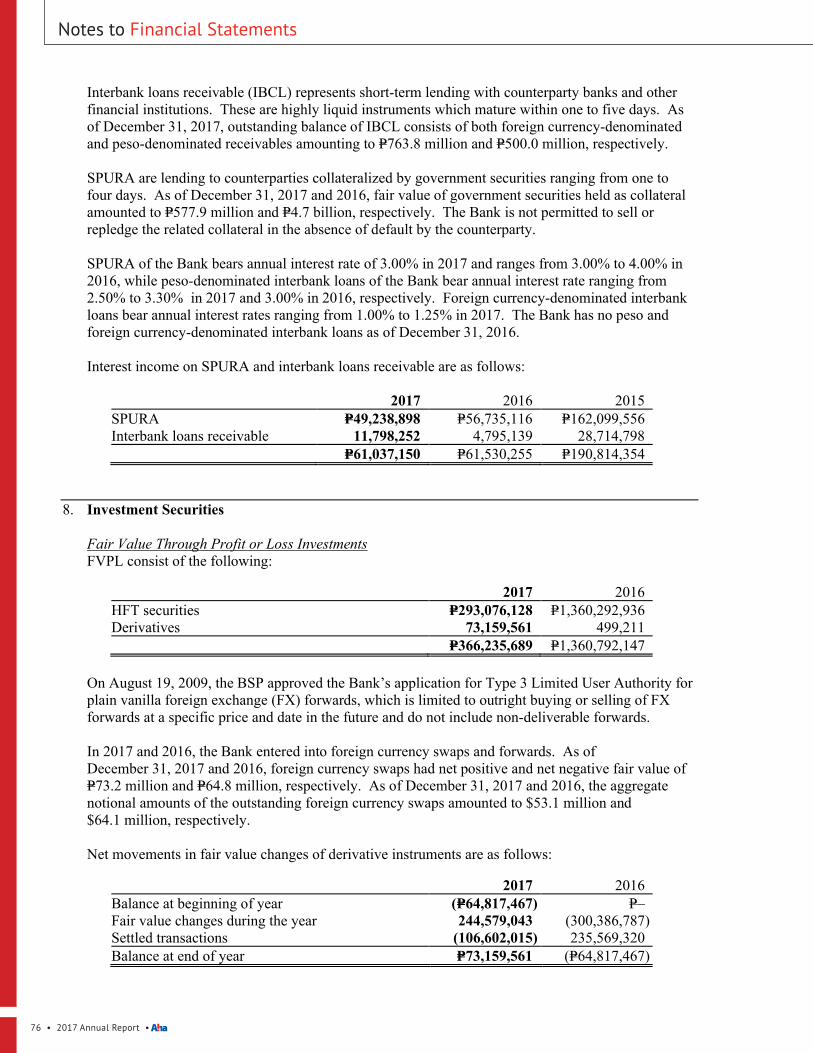
76 • 2017 Annual Report •
- 53 -
*SGVFS026939*
Interbank loans receivable (IBCL) represents short-term lending with counterparty banks and otherfinancial institutions. These are highly liquid instruments which mature within one to five days. Asof December 31, 2017, outstanding balance of IBCL consists of both foreign currency-denominatedand peso-denominated receivables amounting to P=763.8 million and P=500.0 million, respectively.
SPURA are lending to counterparties collateralized by government securities ranging from one tofour days. As of December 31, 2017 and 2016, fair value of government securities held as collateralamounted to P=577.9 million and P=4.7 billion, respectively. The Bank is not permitted to sell orrepledge the related collateral in the absence of default by the counterparty.
SPURA of the Bank bears annual interest rate of 3.00% in 2017 and ranges from 3.00% to 4.00% in2016, while peso-denominated interbank loans of the Bank bear annual interest rate ranging from2.50% to 3.30% in 2017 and 3.00% in 2016, respectively. Foreign currency-denominated interbankloans bear annual interest rates ranging from 1.00% to 1.25% in 2017. The Bank has no peso andforeign currency-denominated interbank loans as of December 31, 2016.
Interest income on SPURA and interbank loans receivable are as follows:
2017 2016 2015SPURA P=49,238,898 P=56,735,116 P=162,099,556Interbank loans receivable 11,798,252 4,795,139 28,714,798
P=61,037,150 P=61,530,255 P=190,814,354
8. Investment Securities
Fair Value Through Profit or Loss InvestmentsFVPL consist of the following:
2017 2016HFT securities P=293,076,128 P=1,360,292,936Derivatives 73,159,561 499,211
P=366,235,689 P=1,360,792,147
On August 19, 2009, the BSP approved the Bank’s application for Type 3 Limited User Authority forplain vanilla foreign exchange (FX) forwards, which is limited to outright buying or selling of FXforwards at a specific price and date in the future and do not include non-deliverable forwards.
In 2017 and 2016, the Bank entered into foreign currency swaps and forwards. As ofDecember 31, 2017 and 2016, foreign currency swaps had net positive and net negative fair value ofP=73.2 million and P=64.8 million, respectively. As of December 31, 2017 and 2016, the aggregatenotional amounts of the outstanding foreign currency swaps amounted to $53.1 million and$64.1 million, respectively.
Net movements in fair value changes of derivative instruments are as follows:
2017 2016Balance at beginning of year (P=64,817,467) P=–Fair value changes during the year 244,579,043 (300,386,787)Settled transactions (106,602,015) 235,569,320Balance at end of year P=73,159,561 (P=64,817,467)
Notes to Financial Statements

Philippine Savings Bank • 77
Notes to Financial Statements- 54 -
*SGVFS026939*
As of December 31, 2017 and 2016, the Bank has outstanding ROP paired warrants amounting to$1.9 million which give the Bank the option or right to exchange its holdings of ROP Global Bonds(Paired Bonds) into peso-denominated government securities upon occurrence of a pre-determinedcredit event. Paired Bonds shall be risk weighted at 0.00%, provided that the 0.00% risk weight shallbe applied only to the Bank’s holdings of Paired Bonds equivalent to not more than 50.00% of thetotal qualifying capital. Further, the Bank’s holdings of said warrants, booked in the FVPL category,are likewise exempted from capital charge for market risk as long as said instruments are paired withROP Global Bonds up to a maximum of 50.00% of the total qualifying capital. As a result of the saleof its paired bonds in 2013, the Bank is holding ROP warrants without paired instruments and with onactive market. As of December 31, 2017 and 2016, the Bank determined the market value of itswarrants to be zero.
Available-for-Sale InvestmentsAFS investments consist of the following:
2017 2016Debt securities Government (Notes 29 and 30) P=10,762,411,432 P=8,462,431,246 Private 6,153,071,645 4,645,668,747Equity securities Quoted 8,922,987 6,612,987 Unquoted 3,268,542 3,288,543
16,927,674,606 13,118,001,523Less allowance for impairment losses (Note 15) 2,188,665 2,188,665
P=16,925,485,941 P=13,115,812,858
Movements in the net unrealized gain (loss) on AFS investments follow:
2017 2016Balance at beginning of year (P=842,908,364) P=179,775Loss (gain) from sale of AFS investments
realized in profit or loss 49,756,366 (456,628,139)Changes in fair values of AFS investments 381,641,780 (386,460,000)
431,398,146 (843,088,139)Balance at end of year (P=411,510,218) (P=842,908,364)
As of December 31, 2017 and 2016, included in AFS investments are National Food Authority bondspledged by the Bank to MBTC to secure its payroll account with MBTC with total carrying value ofP=50.2 million and P=51.8 million, respectively (Note 29).
As of December 31, 2017 and 2016, the Bank deposited AFS investments in the form of governmentbonds with total carrying value of P=64.5 million and P=49.7 million in compliance with trustregulations, respectively (Note 30).
As of December 31, 2017, the carrying value of AFS investments in the form of government bondspledged as collateral for its bills payable amounted to P=751.8 million (Note 17).

78 • 2017 Annual Report •
- 55 -
*SGVFS026939*
Held-to-Maturity InvestmentsHTM investments consist of the following:
2017 2016Debt securities Government P=25,460,777,587 P=20,046,354,933 Private 4,012,946,797 3,110,531,696
P=29,473,724,384 P=23,156,886,629
As of December 31, 2017 and 2016, the carrying value of HTM Investments in the form ofgovernment bonds pledged by the Bank as collateral for bills payable amounted to P=1.0 billion andP=4.7 billion, respectively (Note 17).
Interest income on investment securities consists of:
2017 2016 2015HTM investments P=1,165,451,432 P=776,516,116 P=375,698,086AFS investments 607,568,926 486,761,874 266,464,510FVPL investments 50,570,958 84,671,137 85,605,995
P=1,823,591,316 P=1,347,949,127 P=727,768,591
Peso-denominated AFS investments bear nominal annual interest rates ranging from 2.13% to 9.50%in 2017, 2.13% to 8.13% in 2016 and 1.63% to 9.13% in 2015 while foreign currency-denominatedAFS investments bear nominal annual interest rates ranging from 3.70% to 9.50% in 2017, 1.63% to10.63% in 2016, and 2.50% to 10.63% in 2015.
Effective interest rates on AFS investments as of December 31, 2017, 2016, and 2015 range from2.69% to 6.15%, 1.58% to 8.14% and 2.20% to 6.75%, respectively.
On the other hand, peso-denominated HTM investments bear effective interest rates ranging from3.70% to 5.61% in 2017, 3.44% to 4.77% in 2016 and 2015, while foreign currency-denominatedHTM investments bear effective interest rates ranging from 2.46% to 4.96%, 2.75% to 4.78%, 3.15%to 4.09% in 2017, 2016 and 2015, respectively.
Trading and securities gains (losses) - net on investment securities consist of:
2017 2016 2015FVPL investments (Note 29) Realized (P=27,662,614) P=43,228,664 (P=75,741,227) Unrealized market valuation gain (loss) 12,181,154 9,808,773 (24,171,844)
(15,481,460) 53,037,437 (99,913,071)AFS investments (Note 29) (49,756,366) 456,628,139 36,343,321
(P=65,237,826) P=509,665,576 (P=63,569,750)
Notes to Financial Statements

Philippine Savings Bank • 79
Notes to Financial Statements- 56 -
*SGVFS026939*
9. Loans and Receivables
This account consists of:
2017 2016Receivables from customers Consumption loans P=84,276,599,224 P=70,110,905,877 Real estate loans 46,594,075,046 43,899,559,143 Commercial loans 11,975,704,903 11,605,784,470 Personal loans (Note 29) 3,486,068,122 3,589,638,459
146,332,447,295 129,205,887,949Less unearned discounts 145,142 11,479,526
146,332,302,153 129,194,408,423Other receivables Accrued interest receivable 1,911,372,461 1,773,467,620 Accounts receivable (Note 29) 1,250,586,507 801,280,736 Sales contract receivables 106,727,770 151,649,979 Bills purchased (Note 19) 10,482,445 63,773,615
149,611,471,336 131,984,580,373Less allowance for credit losses (Note 15) 4,646,958,115 4,762,733,222
P=144,964,513,221 P=127,221,847,151
Personal loans comprise deposit collateral loans, employee salary and consumer loan products such asmoney card, multi-purpose loan and flexi-loan.
As of December 31, 2017, 2016 and 2015, 40.02%, 42.95% and 45.02%, respectively, of the totalreceivables from customers are subject to periodic interest repricing with average effective interestrates of 14.06%, 13.78% and 13.39% in 2017, 2016 and 2015. Remaining receivables earn averageannual fixed interest rates of 14.81%, 15.06% and 15.10% in 2017, 2016 and 2015, respectively.
Receivables from customers earned interest income at an effective interest rate ranging from 8.94% to9.17%, 8.55% to 9.70%, and 8.56% to 10.16% for the periods ending December 31, 2017, 2016 and2015, respectively.
Interest income on loans and receivables consists of:
2017 2016 2015Receivables from customers Consumption loans P=7,624,465,526 P=6,326,845,090 P=5,273,970,259 Real estate loans 3,273,928,199 3,149,014,794 2,889,904,587 Personal loans (Note 29) 820,957,546 838,015,354 881,020,749 Commercial loans 749,518,594 741,347,084 868,764,738Other receivables Sales contract receivables 8,263,372 11,640,532 15,998,131
P=12,477,133,237 P=11,066,862,854 P=9,929,658,464
Interest income accreted on impaired loans and receivables classified under real estate loans andcommercial loans amounted to P=58.1 million, P=71.7 million and P=92.1 million in 2017, 2016 and2015, respectively.
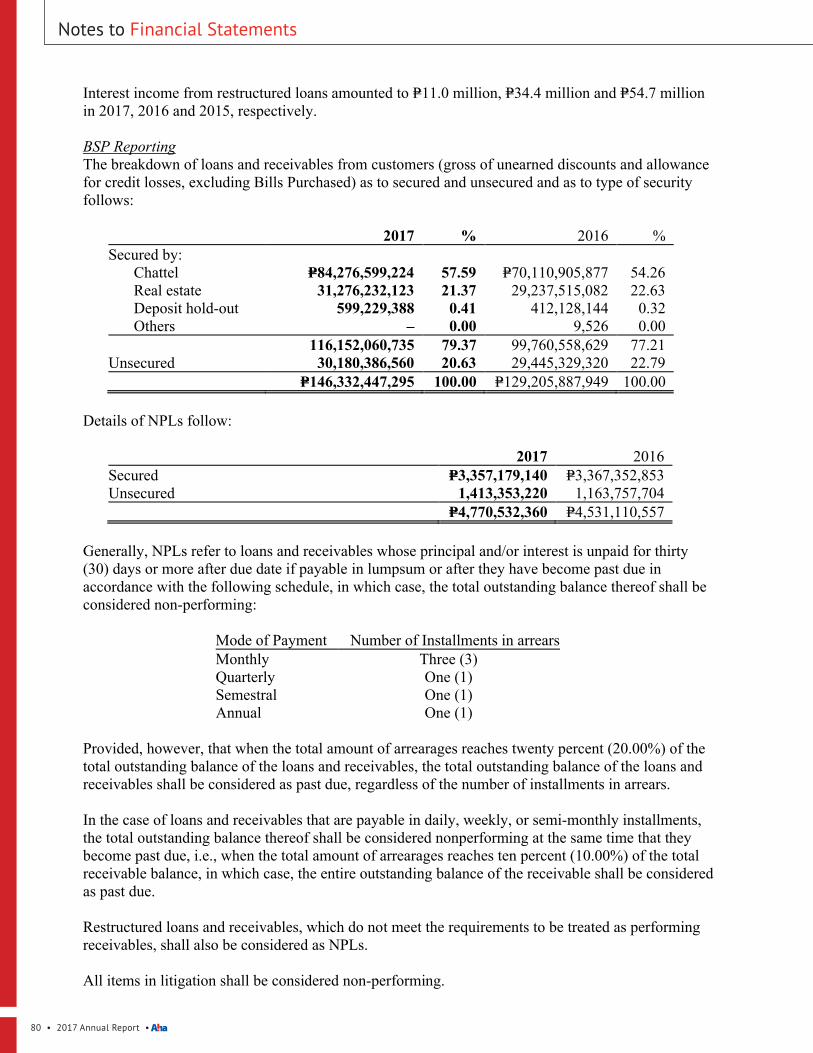
80 • 2017 Annual Report •
- 57 -
*SGVFS026939*
Interest income from restructured loans amounted to P=11.0 million, P=34.4 million and P=54.7 millionin 2017, 2016 and 2015, respectively.
BSP ReportingThe breakdown of loans and receivables from customers (gross of unearned discounts and allowancefor credit losses, excluding Bills Purchased) as to secured and unsecured and as to type of securityfollows:
2017 % 2016 %Secured by: Chattel P=84,276,599,224 57.59 P=70,110,905,877 54.26 Real estate 31,276,232,123 21.37 29,237,515,082 22.63 Deposit hold-out 599,229,388 0.41 412,128,144 0.32 Others – 0.00 9,526 0.00
116,152,060,735 79.37 99,760,558,629 77.21Unsecured 30,180,386,560 20.63 29,445,329,320 22.79
P=146,332,447,295 100.00 P=129,205,887,949 100.00
Details of NPLs follow:
2017 2016Secured P=3,357,179,140 P=3,367,352,853Unsecured 1,413,353,220 1,163,757,704
P=4,770,532,360 P=4,531,110,557
Generally, NPLs refer to loans and receivables whose principal and/or interest is unpaid for thirty(30) days or more after due date if payable in lumpsum or after they have become past due inaccordance with the following schedule, in which case, the total outstanding balance thereof shall beconsidered non-performing:
Mode of Payment Number of Installments in arrearsMonthly Three (3)Quarterly One (1)Semestral One (1)Annual One (1)
Provided, however, that when the total amount of arrearages reaches twenty percent (20.00%) of thetotal outstanding balance of the loans and receivables, the total outstanding balance of the loans andreceivables shall be considered as past due, regardless of the number of installments in arrears.
In the case of loans and receivables that are payable in daily, weekly, or semi-monthly installments,the total outstanding balance thereof shall be considered nonperforming at the same time that theybecome past due, i.e., when the total amount of arrearages reaches ten percent (10.00%) of the totalreceivable balance, in which case, the entire outstanding balance of the receivable shall be consideredas past due.
Restructured loans and receivables, which do not meet the requirements to be treated as performingreceivables, shall also be considered as NPLs.
All items in litigation shall be considered non-performing.
Notes to Financial Statements
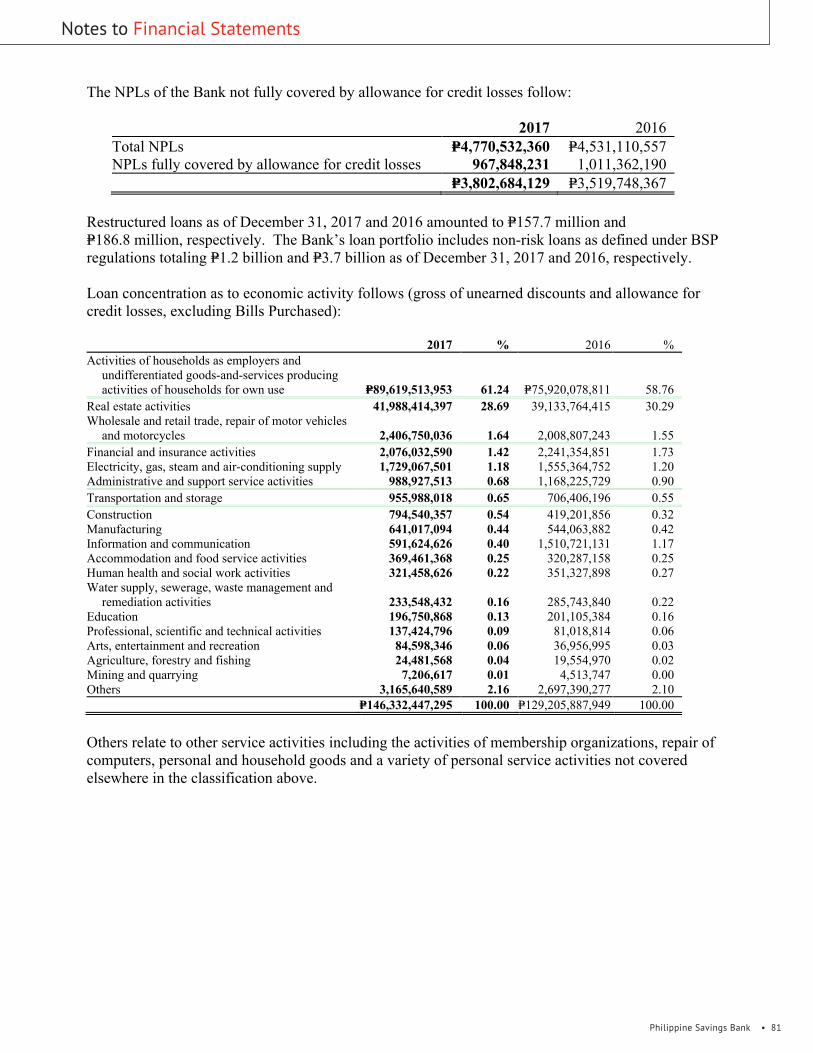
Philippine Savings Bank • 81
Notes to Financial Statements - 58 -
*SGVFS026939*
The NPLs of the Bank not fully covered by allowance for credit losses follow:
2017 2016Total NPLs P=4,770,532,360 P=4,531,110,557NPLs fully covered by allowance for credit losses 967,848,231 1,011,362,190
P=3,802,684,129 P=3,519,748,367
Restructured loans as of December 31, 2017 and 2016 amounted to P=157.7 million andP=186.8 million, respectively. The Bank’s loan portfolio includes non-risk loans as defined under BSPregulations totaling P=1.2 billion and P=3.7 billion as of December 31, 2017 and 2016, respectively.
Loan concentration as to economic activity follows (gross of unearned discounts and allowance forcredit losses, excluding Bills Purchased):
2017 % 2016 %Activities of households as employers and
undifferentiated goods-and-services producingactivities of households for own use P=89,619,513,953 61.24 P=75,920,078,811 58.76
Real estate activities 41,988,414,397 28.69 39,133,764,415 30.29Wholesale and retail trade, repair of motor vehicles
and motorcycles 2,406,750,036 1.64 2,008,807,243 1.55Financial and insurance activities 2,076,032,590 1.42 2,241,354,851 1.73Electricity, gas, steam and air-conditioning supply 1,729,067,501 1.18 1,555,364,752 1.20Administrative and support service activities 988,927,513 0.68 1,168,225,729 0.90Transportation and storage 955,988,018 0.65 706,406,196 0.55Construction 794,540,357 0.54 419,201,856 0.32Manufacturing 641,017,094 0.44 544,063,882 0.42Information and communication 591,624,626 0.40 1,510,721,131 1.17Accommodation and food service activities 369,461,368 0.25 320,287,158 0.25Human health and social work activities 321,458,626 0.22 351,327,898 0.27Water supply, sewerage, waste management and
remediation activities 233,548,432 0.16 285,743,840 0.22Education 196,750,868 0.13 201,105,384 0.16Professional, scientific and technical activities 137,424,796 0.09 81,018,814 0.06Arts, entertainment and recreation 84,598,346 0.06 36,956,995 0.03Agriculture, forestry and fishing 24,481,568 0.04 19,554,970 0.02Mining and quarrying 7,206,617 0.01 4,513,747 0.00Others 3,165,640,589 2.16 2,697,390,277 2.10
P=146,332,447,295 100.00 P=129,205,887,949 100.00
Others relate to other service activities including the activities of membership organizations, repair ofcomputers, personal and household goods and a variety of personal service activities not coveredelsewhere in the classification above.

82 • 2017 Annual Report •
- 59 -
*SGVFS026939*
10. Investment in a Joint Venture
On August 9, 2017, the Bank signed a Sale and Purchase Agreement (“SPA”) to sell 2.0 millionshares or 10.00% ownership in SMFC to GT Capital Holdings, Inc. (GT Capital), a related party, forP190.0 million or P95.0 per share. The price of the transaction was based on an independentvaluation report which was subjected to a third party fairness opinion.
As a result of the sale, the Bank’s ownership interest in SMFC was reduced from 40.00% to 30.00%.Management has assessed that the Bank continues to have joint control over SMFC together with GTCapital, Sumitomo Japan and Sumitomo Corporation of the Philippines (Sumitomo Group), as allinvestors are bound by all the terms and conditions of the original Joint Venture Agreement betweenthe Bank and Sumitomo Group, where unanimous consent is required from all the parties for SMFC’srelevant activities.
SMFC is engaged in the business of lending or leasing to retail customers for their purchase ofmotorcycles. As of December 31, 2017 and 2016, the Bank’s Investment in a Joint Ventureamounted to P=607.2 million and P=727.2 million, respectively.
The following table illustrates the summarized financial information of SMFC (in thousands):
2017 2016Current assets P=3,415,192 P=2,481,689Non-current assets 118,675 125,057Current liabilities (1,485,946) (179,881)Non-current liabilities (24,045) (608,924)Net assets P=2,023,876 P=1,817,941
2017 2016 2015Revenues P=818,915 P=661,242 P=449,887Costs and expenses 524,426 539,530 379,678
294,489 121,712 70,209Provision for income tax 89,062 35,687 19,674Net income 205,427 86,025 50,535Other comprehensive income 541 3,440 3,783Total comprehensive income P=205,968 P=89,465 P=54,318
Movement in this account follows (in thousands):
2017 2016Balance at beginning of year P=727,176 P=690,334Carrying value of investment sold (192,012) –Share in net income (Note 29) 71,837 35,466Share in unrealized gain on remeasurement of
retirement liability 162 1,376Ending balance P=607,163 P=727,176
Cost of the investment as of December 31, 2017 and 2016 amounted to P=600.0 million andP=800.0 million, respectively.
SMFC is a private company and there is no quoted market price available for its shares. The netassets of SMFC consist mainly of financial assets and financial liabilities.
Notes to Financial Statements
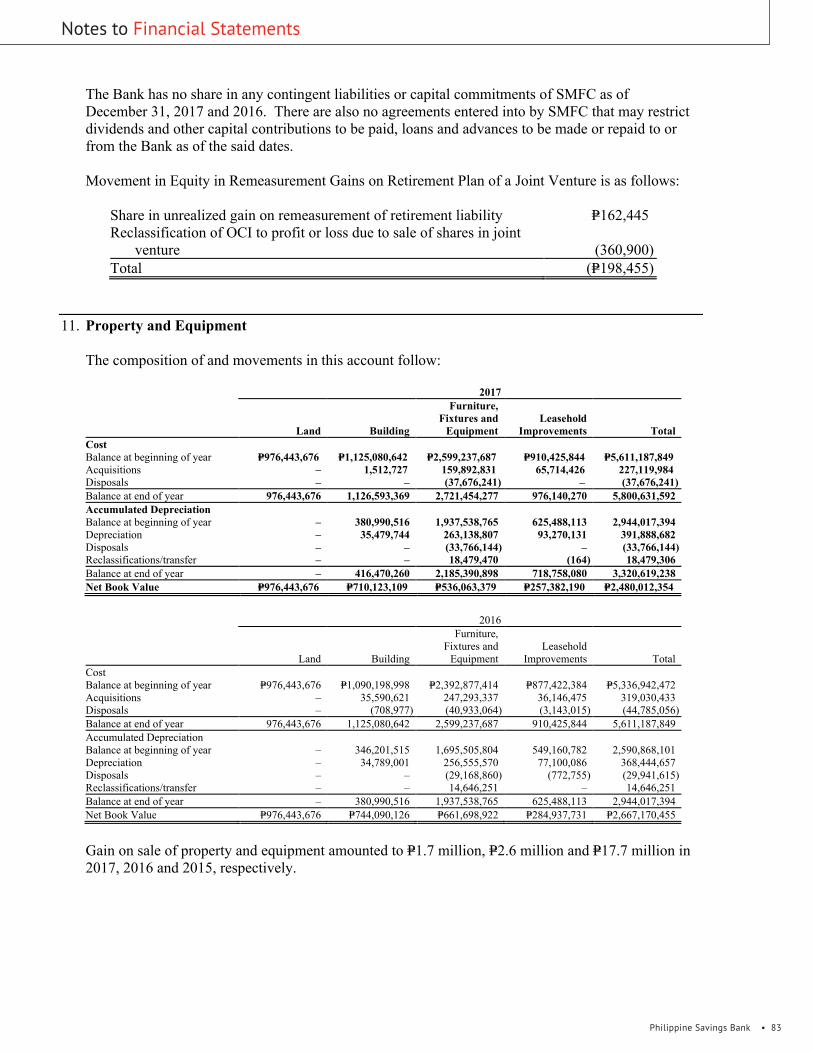
Philippine Savings Bank • 83
Notes to Financial Statements- 60 -
*SGVFS026939*
The Bank has no share in any contingent liabilities or capital commitments of SMFC as ofDecember 31, 2017 and 2016. There are also no agreements entered into by SMFC that may restrictdividends and other capital contributions to be paid, loans and advances to be made or repaid to orfrom the Bank as of the said dates.
Movement in Equity in Remeasurement Gains on Retirement Plan of a Joint Venture is as follows:
Share in unrealized gain on remeasurement of retirement liability P=162,445Reclassification of OCI to profit or loss due to sale of shares in joint
venture (360,900)Total (P=198,455)
11. Property and Equipment
The composition of and movements in this account follow:
2017
Land Building
Furniture,Fixtures and
EquipmentLeasehold
Improvements TotalCostBalance at beginning of year P=976,443,676 P=1,125,080,642 P=2,599,237,687 P=910,425,844 P=5,611,187,849Acquisitions – 1,512,727 159,892,831 65,714,426 227,119,984Disposals – – (37,676,241) – (37,676,241)Balance at end of year 976,443,676 1,126,593,369 2,721,454,277 976,140,270 5,800,631,592Accumulated DepreciationBalance at beginning of year – 380,990,516 1,937,538,765 625,488,113 2,944,017,394Depreciation – 35,479,744 263,138,807 93,270,131 391,888,682Disposals – – (33,766,144) – (33,766,144)Reclassifications/transfer – – 18,479,470 (164) 18,479,306Balance at end of year – 416,470,260 2,185,390,898 718,758,080 3,320,619,238Net Book Value P=976,443,676 P=710,123,109 P=536,063,379 P=257,382,190 P=2,480,012,354
2016
Land Building
Furniture,Fixtures and
EquipmentLeasehold
Improvements TotalCostBalance at beginning of year P=976,443,676 P=1,090,198,998 P=2,392,877,414 P=877,422,384 P=5,336,942,472Acquisitions – 35,590,621 247,293,337 36,146,475 319,030,433Disposals – (708,977) (40,933,064) (3,143,015) (44,785,056)Balance at end of year 976,443,676 1,125,080,642 2,599,237,687 910,425,844 5,611,187,849Accumulated DepreciationBalance at beginning of year – 346,201,515 1,695,505,804 549,160,782 2,590,868,101Depreciation – 34,789,001 256,555,570 77,100,086 368,444,657Disposals – – (29,168,860) (772,755) (29,941,615)Reclassifications/transfer – – 14,646,251 – 14,646,251Balance at end of year – 380,990,516 1,937,538,765 625,488,113 2,944,017,394Net Book Value P=976,443,676 P=744,090,126 P=661,698,922 P=284,937,731 P=2,667,170,455
Gain on sale of property and equipment amounted to P=1.7 million, P=2.6 million and P=17.7 million in2017, 2016 and 2015, respectively.
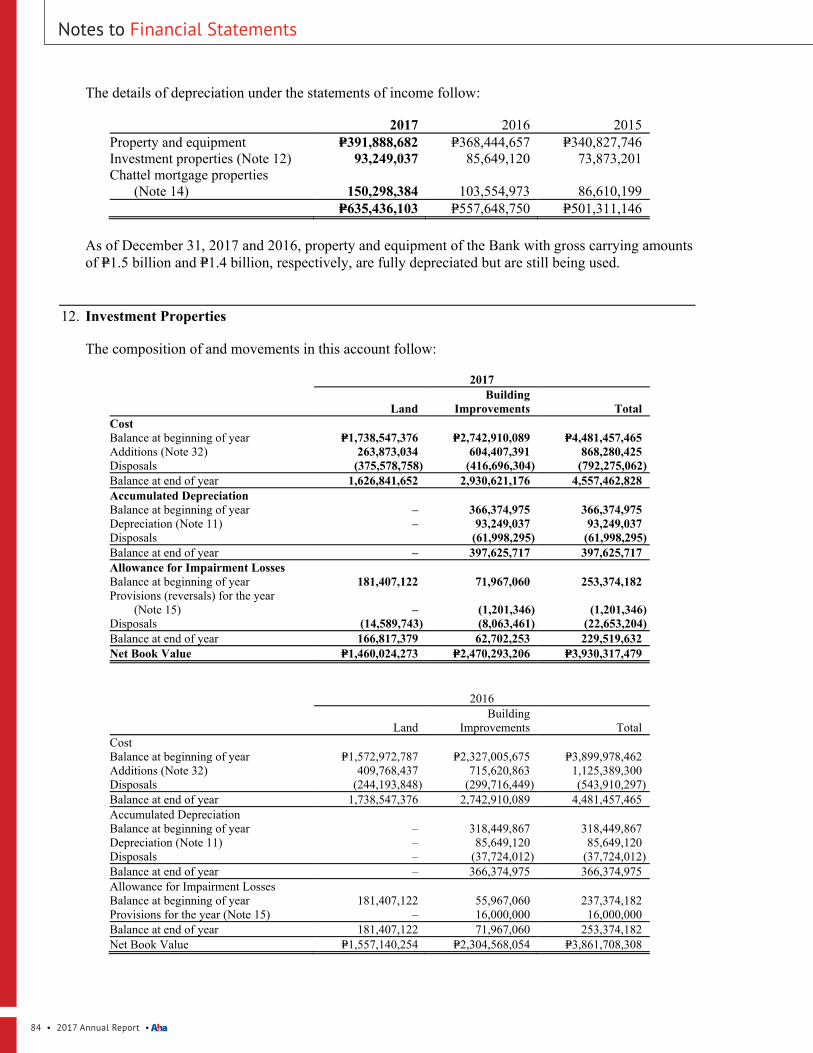
84 • 2017 Annual Report •
- 61 -
*SGVFS026939*
The details of depreciation under the statements of income follow:
2017 2016 2015Property and equipment P=391,888,682 P=368,444,657 P=340,827,746Investment properties (Note 12) 93,249,037 85,649,120 73,873,201Chattel mortgage properties
(Note 14) 150,298,384 103,554,973 86,610,199P=635,436,103 P=557,648,750 P=501,311,146
As of December 31, 2017 and 2016, property and equipment of the Bank with gross carrying amountsof P=1.5 billion and P=1.4 billion, respectively, are fully depreciated but are still being used.
12. Investment Properties
The composition of and movements in this account follow:
2017
LandBuilding
Improvements TotalCostBalance at beginning of year P=1,738,547,376 P=2,742,910,089 P=4,481,457,465Additions (Note 32) 263,873,034 604,407,391 868,280,425Disposals (375,578,758) (416,696,304) (792,275,062)Balance at end of year 1,626,841,652 2,930,621,176 4,557,462,828Accumulated DepreciationBalance at beginning of year – 366,374,975 366,374,975Depreciation (Note 11) – 93,249,037 93,249,037Disposals (61,998,295) (61,998,295)Balance at end of year – 397,625,717 397,625,717Allowance for Impairment LossesBalance at beginning of year 181,407,122 71,967,060 253,374,182Provisions (reversals) for the year
(Note 15) – (1,201,346) (1,201,346)Disposals (14,589,743) (8,063,461) (22,653,204)Balance at end of year 166,817,379 62,702,253 229,519,632Net Book Value P=1,460,024,273 P=2,470,293,206 P=3,930,317,479
2016
LandBuilding
Improvements TotalCostBalance at beginning of year P=1,572,972,787 P=2,327,005,675 P=3,899,978,462Additions (Note 32) 409,768,437 715,620,863 1,125,389,300Disposals (244,193,848) (299,716,449) (543,910,297)Balance at end of year 1,738,547,376 2,742,910,089 4,481,457,465Accumulated DepreciationBalance at beginning of year – 318,449,867 318,449,867Depreciation (Note 11) – 85,649,120 85,649,120Disposals – (37,724,012) (37,724,012)Balance at end of year – 366,374,975 366,374,975Allowance for Impairment LossesBalance at beginning of year 181,407,122 55,967,060 237,374,182Provisions for the year (Note 15) – 16,000,000 16,000,000Balance at end of year 181,407,122 71,967,060 253,374,182Net Book Value P=1,557,140,254 P=2,304,568,054 P=3,861,708,308
Notes to Financial Statements

Philippine Savings Bank • 85
Notes to Financial Statements- 62 -
*SGVFS026939*
The details of the net book value of investment properties follow:
2017 2016Real estate properties acquired in settlement of
loans and receivables P=3,832,340,181 P=3,759,902,584Bank premises leased to third parties and held for
capital appreciation 97,977,298 101,805,724P=3,930,317,479 P=3,861,708,308
As of December 31, 2017 and 2016, the aggregate fair value of investment properties amounted toP=4.9 billion and P=4.7 billion, respectively. Fair value of the properties was determined usingSales Comparison Approach. Fair values are based on valuations performed by accredited externaland in-house appraisers.
Gain on foreclosure of investment properties amounted to P=271.9 million, P=350.4 million andP=258.7 million in 2017, 2016 and 2015, respectively. The Bank realized gain on sale of investmentproperties amounting to P=76.9 million and P=14.0 million in 2017 and 2016, respectively, and a losson sale amounting to P=0.7 million in 2015.
Rental income on investment properties included in miscellaneous income amounted toP=48.7 million, P=53.8 million and P=53.0 million in 2017, 2016 and 2015, respectively(Notes 23 and 25).
Operating expenses incurred in maintaining investment properties (included under miscellaneousexpense) amounted to P=20.5 million, P=18.8 million and P=15.7 million in 2017, 2016 and 2015,respectively (Note 26).
13. Goodwill and Intangible Assets
This account consists of:
2017 2016Goodwill P=53,558,338 P=53,558,338Intangible assets Software costs 624,241,981 414,483,793 Branch licenses 37,123,737 37,123,737
661,365,718 451,607,530P=714,924,056 P=505,165,868
The movements in intangible assets follow:
2017Software
CostsBranch
Licenses TotalBalance at beginning of year P=414,483,793 P=37,123,737 P=451,607,530Additions 345,190,531 – 345,190,531Amortization (135,432,343) – (135,432,343)Balance at end of year P=624,241,981 P=37,123,737 P=661,365,718

86 • 2017 Annual Report •
- 63 -
*SGVFS026939*
2016Software
CostsBranch
Licenses TotalBalance at beginning of year P=355,178,046 P=35,723,737 P=390,901,783Additions 170,466,198 1,400,000 171,866,198Amortization (111,160,451) – (111,160,451)Balance at end of year P=414,483,793 P=37,123,737 P=451,607,530
14. Other Assets
This account consists of:
2017 2016Chattel mortgage properties - net P=712,848,255 P=607,096,135Security deposits (Note 29) 179,996,425 178,330,923Prepayments 139,556,053 186,996,554Documentary stamps on hand 103,123,771 42,298,499Stationeries and supplies on hand 41,788,037 25,762,082Sundry debits 23,766,185 21,699,387RCOCI 10,349,423 10,315,608Creditable withholding tax 6,675,985 1,130,340Others 1,462,245 4,453,528
P=1,219,566,379 P=1,078,083,056
Prepayments represent prepaid insurance, rent, taxes and other prepaid expenses. Creditablewithholding tax (CWT) pertains to the excess credits after applying CWT against income tax payable.
The movements in chattel mortgage properties - net follow:
2017 2016CostBalance at beginning of year P=683,799,123 P=526,167,582Additions (Note 32) 2,577,163,081 1,925,310,853Disposals (2,454,636,558) (1,767,679,312)Balance at the end of year 806,325,646 683,799,123Accumulated DepreciationBalance at beginning of year 76,086,898 69,266,942Depreciation (Note 11) 150,298,384 103,554,973Disposals (133,167,936) (96,735,017)Balance at the end of year 93,217,346 76,086,898Allowance for Impairment LossesBalance at beginning of year (Note 15) 616,090 616,090Disposals (356,045) –Balance at end of year 260,045 616,090Net Book Value P=712,848,255 P=607,096,135
Notes to Financial Statements

Philippine Savings Bank • 87
Notes to Financial Statements- 64 -
*SGVFS026939*
Gain on foreclosure of chattel mortgage properties amounted to P=759.1 million, P=458.4 million andP=432.6 million in 2017, 2016 and 2015, respectively. The Bank realized loss on sale of chattelmortgage properties amounting to P=174.2 million, P=106.7 million, and P=54.9 million in 2017, 2016and 2015, respectively.
15. Allowance for Credit and Impairment Losses
2017AFS Investments –
Equity Securities (Note 8)Loans and
Receivables(Note 9)
InvestmentProperties
(Note 12)
OtherAssets
(Note 14) TotalQuoted UnquotedBalance at beginning of year P=1,220,000 P=968,665 P=4,762,733,222 P=253,374,182 P=616,090 P=5,018,912,159Provision (reversal) for credit a
and impairment losses – – 2,271,380,151 (1,201,346) – 2,270,178,805Reversal of allowance on assets
sold/settled – – (1,413,816,082) (22,653,204) (356,045) (1,436,825,331)Accounts written off – – (973,339,176) – – (973,339,176)Balance at end of year P=1,220,000 P=968,665 P=4,646,958,115 P=229,519,632 P=260,045 P=4,878,926,457
2016AFS Investments –
Equity Securities (Note 8)Loans and
Receivables(Note 9)
InvestmentProperties
(Note 12)
OtherAssets
(Note 14) TotalQuoted UnquotedBalance at beginning of year P=1,220,000 P=968,665 P=4,625,202,276 P=237,374,182 P=616,090 P=4,865,381,213Provision for credit and
impairment losses – – 2,206,503,257 16,000,000 – 2,222,503,257Reversal of allowance on assets
sold/settled – – (1,231,826,987) – – (1,231,826,987)Accounts written off – – (837,145,324) – – (837,145,324)Balance at end of year P=1,220,000 P=968,665 P=4,762,733,222 P=253,374,182 P=616,090 P=5,018,912,159
- 64 -
*SGVFS026939*
Gain on foreclosure of chattel mortgage properties amounted to P=759.1 million, P=458.4 million andP=432.6 million in 2017, 2016 and 2015, respectively. The Bank realized loss on sale of chattelmortgage properties amounting to P=174.2 million, P=106.7 million, and P=54.9 million in 2017, 2016and 2015, respectively.
15. Allowance for Credit and Impairment Losses
2017AFS Investments –
Equity Securities (Note 8)Loans and
Receivables(Note 9)
InvestmentProperties
(Note 12)
OtherAssets
(Note 14) TotalQuoted UnquotedBalance at beginning of year P=1,220,000 P=968,665 P=4,762,733,222 P=253,374,182 P=616,090 P=5,018,912,159Provision (reversal) for credit a
and impairment losses – – 2,271,380,151 (1,201,346) – 2,270,178,805Reversal of allowance on assets
sold/settled – – (1,413,816,082) (22,653,204) (356,045) (1,436,825,331)Accounts written off – – (973,339,176) – – (973,339,176)Balance at end of year P=1,220,000 P=968,665 P=4,646,958,115 P=229,519,632 P=260,045 P=4,878,926,457
2016AFS Investments –
Equity Securities (Note 8)Loans and
Receivables(Note 9)
InvestmentProperties
(Note 12)
OtherAssets
(Note 14) TotalQuoted UnquotedBalance at beginning of year P=1,220,000 P=968,665 P=4,625,202,276 P=237,374,182 P=616,090 P=4,865,381,213Provision for credit and
impairment losses – – 2,206,503,257 16,000,000 – 2,222,503,257Reversal of allowance on assets
sold/settled – – (1,231,826,987) – – (1,231,826,987)Accounts written off – – (837,145,324) – – (837,145,324)Balance at end of year P=1,220,000 P=968,665 P=4,762,733,222 P=253,374,182 P=616,090 P=5,018,912,159

88 • 2017 Annual Report •
- 65
-
*SGVFS026939*
A
reco
ncili
atio
n of
the
allo
wan
ce fo
r cre
dit l
osse
s by
clas
s of l
oans
and
rece
ivab
les i
s as f
ollo
ws (
in th
ousa
nds)
:
2017
Rec
eiva
bles
from
Cus
tom
ers
Oth
er R
ecei
vabl
esA
ccru
edIn
tere
stA
ccou
nts
Sale
sC
ontr
act
Bill
s
Con
sum
ptio
nR
eal E
stat
e C
omm
erci
alPe
rson
alR
ecei
vabl
eR
ecei
vabl
eR
ecei
vabl
ePu
rcha
sed
Tot
alB
alan
ce a
t beg
inni
ng o
f yea
rP=2
,049
,703
P=505
,499
P=881
,296
P=666
,010
P=158
,626
P=466
,460
P=33,
836
P=1,3
03P=4
,762
,733
Prov
isio
ns fo
r the
yea
r cha
rged
aga
inst
pro
fit o
r los
s1,
950,
817
126,
603
(91,
369)
227,
854
57,3
9877
––
2,27
1,38
0R
ever
sal o
f allo
wan
ce(1
,413
,816
)–
––
––
––
(1,4
13,8
16)
Am
ount
s writ
ten
off
(629
,341
)–
–(2
97,7
56)
(46,
168)
(74)
––
(973
,339
)B
alan
ce a
t end
of y
ear
P=1,9
57,3
63P=6
32,1
02P=7
89,9
27P=5
96,1
08P=1
69,8
56P=4
66,4
63P=3
3,83
6P=1
,303
4,64
6,95
8In
divi
dual
impa
irmen
tP=–
P=487
,884
P=103
,431
P=–P=4
8,19
9P=1
85,1
39P=–
P=–P=8
24,6
53C
olle
ctiv
e im
pairm
ent
1,95
7,36
314
4,21
868
6,49
659
6,10
812
1,65
728
1,32
433
,836
1,30
33,
822,
305
P=1,9
57,3
63P=6
32,1
02P=7
89,9
27P=5
96,1
0816
9,85
6P=4
66,4
63P=3
3,83
6P=1
,303
4,64
6,95
8G
ross
am
ount
of l
oans
indi
vidu
ally
impa
ired,
bef
ore
dedu
ctin
g an
y in
divi
dual
impa
irmen
t allo
wan
ceP=–
P=1,0
31,1
17P=1
45,6
06P=–
P=48,
199
P=185
,139
P=–P=–
P=1,4
10,0
61
2016
Rec
eiva
bles
from
Cus
tom
ers
Oth
er R
ecei
vabl
esA
ccru
edIn
tere
stA
ccou
nts
Sale
sC
ontra
ctB
ills
C
onsu
mpt
ion
Rea
l Est
ate
Com
mer
cial
Pers
onal
Rec
eiva
ble
Rec
eiva
ble
Rec
eiva
ble
Purc
hase
dTo
tal
Bal
ance
at b
egin
ning
of y
ear
P=779
,300
P=571
,894
P=1,7
84,4
55P=6
06,2
27P=3
81,7
65P=4
66,4
22P=3
3,83
6P=1
,303
P=4,6
25,2
02Pr
ovis
ions
for t
he y
ear c
harg
ed a
gain
st p
rofit
or l
oss
3,14
0,53
4(6
6,39
5)(9
03,1
59)
226,
828
(191
,391
)86
––
2,20
6,50
3R
ever
sal o
f allo
wan
ce(1
,231
,827
)–
––
––
––
(1,2
31,8
27)
Am
ount
s writ
ten
off
(638
,304
)–
–(1
67,0
45)
(31,
748)
(48)
––
(837
,145
)B
alan
ce a
t end
of y
ear
P=2,0
49,7
03P=5
05,4
99P=8
81,2
96P=6
66,0
10P=1
58,6
26P=4
66,4
60P=3
3,83
6P=1
,303
P=4,7
62,7
33In
divi
dual
impa
irmen
tP=–
P=459
,093
P=105
,041
P=–P=1
00,0
07P=1
84,6
52P=–
P=–P=8
48,7
93C
olle
ctiv
e im
pairm
ent
2,04
9,70
346
,406
776,
255
666,
010
58,6
1928
1,80
833
,836
1,30
33,
913,
940
P=2,0
49,7
03P=5
05,4
99P=8
81,2
96P=6
66,0
10P=1
58,6
26P=4
66,4
60P=3
3,83
6P=1
,303
P=4,7
62,7
33G
ross
am
ount
of l
oans
indi
vidu
ally
impa
ired,
bef
ore
dedu
ctin
g an
y in
divi
dual
impa
irmen
t allo
wan
ceP=–
P=1,0
47,7
21P=1
72,2
46P=–
P=100
,007
P=184
,652
P=–P=–
P=1,5
04,6
26
Notes to Financial Statements
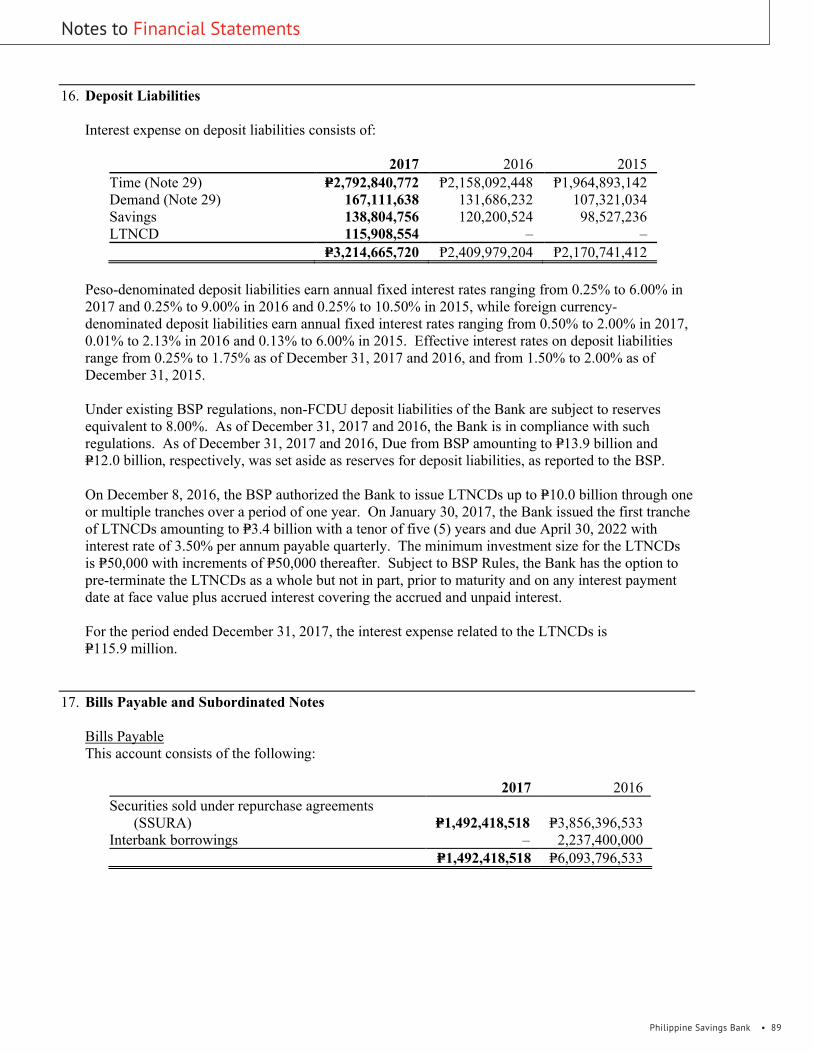
Philippine Savings Bank • 89
Notes to Financial Statements- 66 -
*SGVFS026939*
16. Deposit Liabilities
Interest expense on deposit liabilities consists of:
2017 2016 2015Time (Note 29) P=2,792,840,772 Ᵽ2,158,092,448 Ᵽ1,964,893,142Demand (Note 29) 167,111,638 131,686,232 107,321,034Savings 138,804,756 120,200,524 98,527,236LTNCD 115,908,554 – –
P=3,214,665,720 Ᵽ2,409,979,204 Ᵽ2,170,741,412
Peso-denominated deposit liabilities earn annual fixed interest rates ranging from 0.25% to 6.00% in2017 and 0.25% to 9.00% in 2016 and 0.25% to 10.50% in 2015, while foreign currency-denominated deposit liabilities earn annual fixed interest rates ranging from 0.50% to 2.00% in 2017,0.01% to 2.13% in 2016 and 0.13% to 6.00% in 2015. Effective interest rates on deposit liabilitiesrange from 0.25% to 1.75% as of December 31, 2017 and 2016, and from 1.50% to 2.00% as ofDecember 31, 2015.
Under existing BSP regulations, non-FCDU deposit liabilities of the Bank are subject to reservesequivalent to 8.00%. As of December 31, 2017 and 2016, the Bank is in compliance with suchregulations. As of December 31, 2017 and 2016, Due from BSP amounting to P=13.9 billion andP=12.3 billion, respectively, was set aside as reserves for deposit liabilities, as reported to the BSP.
On December 8, 2016, the BSP authorized the Bank to issue LTNCDs up to P=10.0 billion through oneor multiple tranches over a period of one year. On January 30, 2017, the Bank issued the first trancheof LTNCDs amounting to P=3.4 billion with a tenor of five (5) years and due April 30, 2022 withinterest rate of 3.50% per annum payable quarterly. The minimum investment size for the LTNCDsis P=50,000 with increments of P=50,000 thereafter. Subject to BSP Rules, the Bank has the option topre-terminate the LTNCDs as a whole but not in part, prior to maturity and on any interest paymentdate at face value plus accrued interest covering the accrued and unpaid interest.
For the period ended December 31, 2017, the interest expense related to the LTNCDs isP=115.9 million.
17. Bills Payable and Subordinated Notes
Bills PayableThis account consists of the following:
2017 2016Securities sold under repurchase agreements
(SSURA) P=1,492,418,518 P=3,856,396,533Interbank borrowings – 2,237,400,000
P=1,492,418,518 P=6,093,796,533
- 66 -
*SGVFS026939*
16. Deposit Liabilities
Interest expense on deposit liabilities consists of:
2017 2016 2015Time (Note 29) P=2,792,840,772 Ᵽ2,158,092,448 Ᵽ1,964,893,142Demand (Note 29) 167,111,638 131,686,232 107,321,034Savings 138,804,756 120,200,524 98,527,236LTNCD 115,908,554 – –
P=3,214,665,720 Ᵽ2,409,979,204 Ᵽ2,170,741,412
Peso-denominated deposit liabilities earn annual fixed interest rates ranging from 0.25% to 6.00% in2017 and 0.25% to 9.00% in 2016 and 0.25% to 10.50% in 2015, while foreign currency-denominated deposit liabilities earn annual fixed interest rates ranging from 0.50% to 2.00% in 2017,0.01% to 2.13% in 2016 and 0.13% to 6.00% in 2015. Effective interest rates on deposit liabilitiesrange from 0.25% to 1.75% as of December 31, 2017 and 2016, and from 1.50% to 2.00% as ofDecember 31, 2015.
Under existing BSP regulations, non-FCDU deposit liabilities of the Bank are subject to reservesequivalent to 8.00%. As of December 31, 2017 and 2016, the Bank is in compliance with suchregulations. As of December 31, 2017 and 2016, Due from BSP amounting to P=13.9 billion andP=12.3 billion, respectively, was set aside as reserves for deposit liabilities, as reported to the BSP.
On December 8, 2016, the BSP authorized the Bank to issue LTNCDs up to P=10.0 billion through oneor multiple tranches over a period of one year. On January 30, 2017, the Bank issued the first trancheof LTNCDs amounting to P=3.4 billion with a tenor of five (5) years and due April 30, 2022 withinterest rate of 3.50% per annum payable quarterly. The minimum investment size for the LTNCDsis P=50,000 with increments of P=50,000 thereafter. Subject to BSP Rules, the Bank has the option topre-terminate the LTNCDs as a whole but not in part, prior to maturity and on any interest paymentdate at face value plus accrued interest covering the accrued and unpaid interest.
For the period ended December 31, 2017, the interest expense related to the LTNCDs isP=115.9 million.
17. Bills Payable and Subordinated Notes
Bills PayableThis account consists of the following:
2017 2016Securities sold under repurchase agreements
(SSURA) P=1,492,418,518 P=3,856,396,533Interbank borrowings – 2,237,400,000
P=1,492,418,518 P=6,093,796,533

90 • 2017 Annual Report •
- 67 -
*SGVFS026939*
Bills payable – SSURA are borrowings from counterparties secured by pledge of governmentsecurities with maturities ranging from 5 to 33 days. Details of securities pledged under Billspayable – SSURA as of December 31, 2017 and 2016 are as follows:
December 31, 2017Collateral Pledge Face Value Carrying Value Fair Value
HTM Investments (Note 8) P=748,950,000 P=1,010,100,200 P=1,009,137,727AFS Investments (Note 8) 439,300,000 751,808,493 751,808,493
December 31, 2016Collateral Pledge Face Value Carrying Value Fair Value
HTM Investments (Note 8) P=3,247,163,480 P=4,740,757,004 P=4,686,900,717
Peso-denominated interbank borrowings of the Bank bear annual interest is 2.50% in 2017, andranging from 2.50% to 2.56% in 2016 and 2015. Foreign currency-denominated interbankborrowings bear annual interest ranging from 1.00% to 1.55%, 0.88% to 1.94%, and 0.55% to 1.25%in 2017, 2016, and 2015, respectively. Annual interest rate on dollar-denominated SSURA rangesfrom 1.05% to 1.75%, 0.25% to 1.65%, and 0.50% to 1.25% in 2017, 2016, and 2015, respectively.
Interest expense on bills payable in 2017, 2016 and 2015 amounted to P=59.0 million, P=56.8 millionand P=7.4 million, respectively.
Subordinated NotesThis account consists of the following Peso Notes:
Carrying ValueMaturity Date Face Value 2017 2016February 20, 2022 3,000,000,000 P=– Ᵽ2,999,264,700August 23, 2024 3,000,000,000 2,978,997,695 2,976,467,410
6,000,000,000 P=2,978,997,695 Ᵽ5,975,732,110
Unamortized debt issuance costs on these notes amounted to P=21.0 million and P=24.3 million as ofDecember 31, 2017 and 2016, respectively.
5.75%, P=3.0 Billion Unsecured Subordinated NotesOn December 29, 2011, the Bank obtained approval from the BSP to issue and sell P=3.0 billion inUnsecured Subordinated Notes due 2022 (the Notes) and issued them on February 20, 2012 with aninterest rate of 5.75%.
Among the significant terms and conditions of the issuance of the Notes are:
a. Issue price at 100.00% of the face value of each Note;
b. The Notes bear interest at the rate of 5.75% per annum from and including February 20, 2012 butexcluding February 20, 2022. The interest shall be payable quarterly in arrears at the end of eachinterest period on every 20th of May, August, November and February of each year, commencingon February 20, 2012 until the maturity date;
Notes to Financial Statements
Philippine Savings Bank • 91
Notes to Financial Statements - 68 -
*SGVFS026939*
c. The Notes will constitute direct, unconditional and unsecured obligations of the Bank. The Noteswill be subordinated in right of payment of principal and interest to all depositors and othercreditors of the Issuer and will rank pari passu and without any preference among themselves, butin priority to the rights and claims of holders of all classes of equity securities of the Bank,including holders of preferred shares, if any;
d. Subject to satisfaction of certain regulatory approval requirements, the Bank may redeem theNotes in whole and not only in part at a redemption price equal to 100.00% of the principalamount together with the accrued and unpaid interest upon at least thirty (30) days notice prior tocall option date, which is the Banking Day immediately following the fifth anniversary of theissue date of the Notes or February 21, 2017.
e. The Bank may, but is not obliged to, redeem the Notes, in whole but not in part, at the CallOption Amount, on the Call Option Date, subject to the prior approval of the BSP and thecompliance by the Bank with the Regulations and prevailing requirements for the granting by theBSP of its consent therefore, including (i) the capital adequacy ratio of the Bank is well above therequired minimum ratio after redemption; or (ii) the Note is simultaneously replaced, on or priorto the Call Option Date, with issues of new capital which is of the same or of better quality and isdone under conditions which are sustainable for the income capacity of the Bank; and (iii) a 30Banking Day prior written notice to the then Holder on record. Any tax due on interest incomealready earned by the Holders on the Notes shall be for the account of the Bank. Call OptionAmount shall be based on the Issue Price of the Note plus accrued but unpaid interest thereon upto but excluding the Call Option Date.
On July 22, 2016, the Board of Directors approved the Bank’s option to call the Tier 2 Notesissued in 2012 on its fifth year anniversary or on February 21, 2017. The request of the Bank toexercise the same was approved by the BSP on September 13, 2016. The redemption falls underthe call provisions of the Tier 2 Notes worth P=3.0 Billion, which had an original maturity of tenyears or until 2022.
The Bank sent a notice on the call option to its public trustee, Development Bank of thePhilippines, with a copy to its registrar and paying agent Standard Chartered Bank onJanuary 12, 2017. Each of the noteholders also received individual notices no less than 30business days nor more than 45 days prior to the Call Option date. The Bank has likewisepublished the notice of Call Option in two newspapers of general circulation within Metro Manilafor two consecutive weeks prior to February 21, 2017. The notice included the Call Option Date,Call Option Amount and the manner in which the call will be effected.
5.50%, P=3.0 Billion Unsecured Subordinated NotesOn April 14, 2014, the Bank obtained approval from the BSP to issue and sell P=3.0 billion inUnsecured Subordinated Notes due August 23, 2024 (the Notes) and issued them onMay 23, 2014 with an interest rate of 5.50%.
Among the significant terms and conditions of the issuance of the Notes are:
a. Issue price at 100.00% of the face value of each Note;
b. The Notes bear interest at the rate of 5.50% per annum from and including May 23, 2014 tobut excluding August 23, 2024. Unless the Notes are earlier redeemed upon at least 30 daysprior notice to August 23, 2019, the Call Option Date. Interest shall be payable quarterly inarrears at the end of each Interest Period on August 23, November 23, February 23 andMay 23 of each year, commencing on August 23, 2014 until the Maturity Date;

92 • 2017 Annual Report •
- 69 -
*SGVFS026939*
c. The Notes will constitute direct, unconditional and unsecured obligations of the Bank. TheNotes will be subordinated in right of payment of principal and interest to all depositors andother creditors of the Bank and will rank pari passu and without any preference amongthemselves, but in priority to the rights and claims of holders of all classes of equity securitiesof the Bank, including holders of preferred shares, if any;
d. The Notes have a loss absorption feature, which means the Notes are subject to a Non-Viability Write-Down in case of the occurrence of a Non-Viability Event, subject to certainconditions set out in the "Terms and Conditions of the Notes - Loss Absorption Due to Non-Viability Event; Non-Viability Write-Down", when the Bank or its parent company isconsidered non-viable as determined by the BSP. Non-viability is defined as a deviationfrom a certain level of Common Equity Tier 1 (CET1) Ratio or the inability of the Bank or itsparent company to continue business or any other event as determined by the BSP, whichevercomes earlier. A Non-Viability Trigger Event shall be deemed to have occurred if the BSPnotifies the Bank in writing that it has determined that a: i) Write-Down of the Notes andother capital instruments of the Bank is necessary because, without such write-down, theBank would become non-viable, ii) public sector injection of capital, or equivalent support, isnecessary because, without such injection or support, the Bank would become non-viable, oriii) write-down of the Notes and other capital instruments of the Bank is necessary, because,as a result of the closure of the Bank, the latter has become non-viable;
e. Unless previously converted, and provided a Non-Viability Trigger Event has not occurredand subject to regulations, the Bank shall have the option but not the obligation, uponsecuring all required regulatory approvals, to redeem the Notes as a whole, but not in part, inthe following circumstances: i) at the Call Option Amount, on the Call Option Date, subjectto the prior approval of the BSP and the compliance by the Issuer with Regulations andprevailing requirements for the granting by the BSP of its consent, ii) prior to the statedmaturity and on any Interest Payment Date at par plus accrued but unpaid interest thereon ifor when payments or principal or interest due on the Notes become subject to additional orincreased taxes, other than any taxes and rates of such taxes prevailing as of the Issue Date, asa result of certain changes in law, rule, or regulation, or in the interpretation thereof, and suchadditional or increased rate of such tax cannot be avoided by use of reasonable measuresavailable to the Bank or iii) the non-qualification of the Notes as Tier 2 capital as determinedby the BSP. Incremental tax, if any, that may be due on the interest income already earnedunder the Notes as a result of the exercise by the Bank of its option for early redemption,shall be for its own account. Call Option Amount shall be based on the principal amount ofthe Note plus accrued interest covering the accrued and unpaid interest as of but excludingthe Call Option Date.
As of December 31, 2017 and 2016, the Bank is in compliance with the terms and conditions uponwhich the subordinated notes have been issued.
Interest expense incurred on these notes amounted to P=191.1 million, P=361.8 million andP=342.7 million in 2017, 2016 and 2015, respectively, net of amortization of deferred financing costamounting to P=3.3 million, P=23.7 million and P=5.2 million, respectively.
Notes to Financial Statements
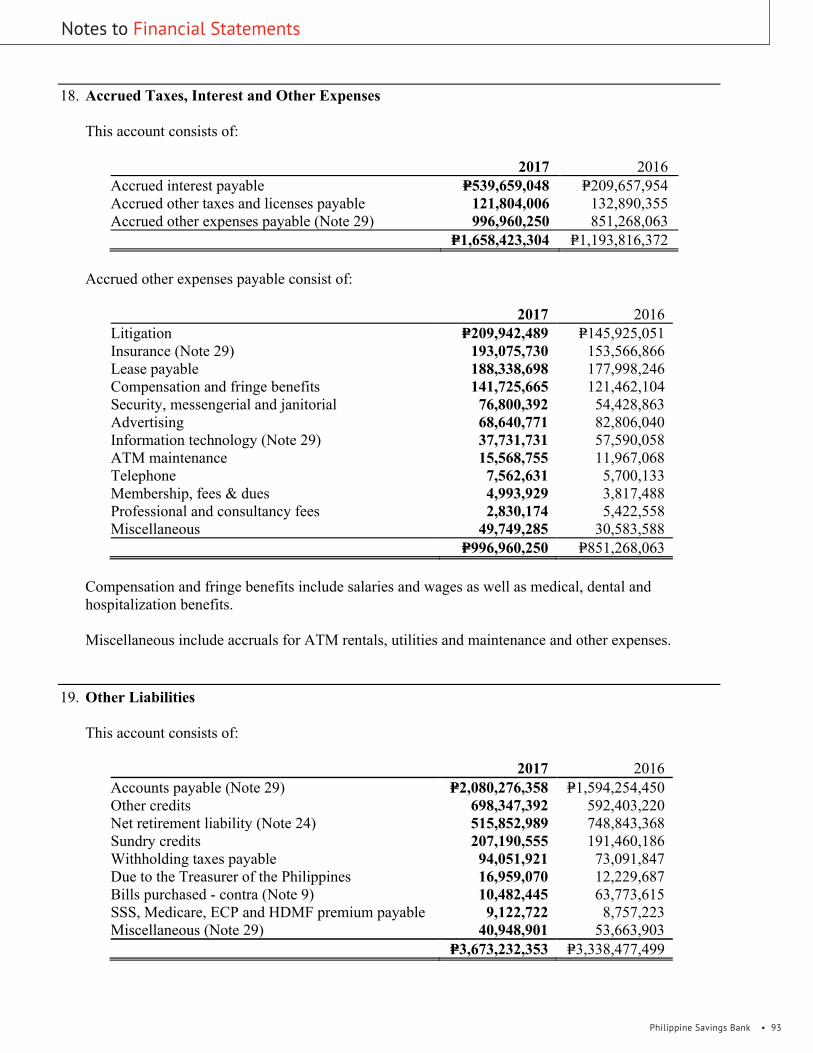
Philippine Savings Bank • 93
Notes to Financial Statements - 70 -
*SGVFS026939*
18. Accrued Taxes, Interest and Other Expenses
This account consists of:
2017 2016Accrued interest payable P=539,659,048 P=209,657,954Accrued other taxes and licenses payable 121,804,006 132,890,355Accrued other expenses payable (Note 29) 996,960,250 851,268,063
P=1,658,423,304 P=1,193,816,372
Accrued other expenses payable consist of:
2017 2016Litigation P=209,942,489 P=145,925,051Insurance (Note 29) 193,075,730 153,566,866Lease payable 188,338,698 177,998,246Compensation and fringe benefits 141,725,665 121,462,104Security, messengerial and janitorial 76,800,392 54,428,863Advertising 68,640,771 82,806,040Information technology (Note 29) 37,731,731 57,590,058ATM maintenance 15,568,755 11,967,068Telephone 7,562,631 5,700,133Membership, fees & dues 4,993,929 3,817,488Professional and consultancy fees 2,830,174 5,422,558Miscellaneous 49,749,285 30,583,588
P=996,960,250 P=851,268,063
Compensation and fringe benefits include salaries and wages as well as medical, dental andhospitalization benefits.
Miscellaneous include accruals for ATM rentals, utilities and maintenance and other expenses.
19. Other Liabilities
This account consists of:
2017 2016Accounts payable (Note 29) P=2,080,276,358 P=1,594,254,450Other credits 698,347,392 592,403,220Net retirement liability (Note 24) 515,852,989 748,843,368Sundry credits 207,190,555 191,460,186Withholding taxes payable 94,051,921 73,091,847Due to the Treasurer of the Philippines 16,959,070 12,229,687Bills purchased - contra (Note 9) 10,482,445 63,773,615SSS, Medicare, ECP and HDMF premium payable 9,122,722 8,757,223Miscellaneous (Note 29) 40,948,901 53,663,903
P=3,673,232,353 P=3,338,477,499

94 • 2017 Annual Report •
- 71 -
*SGVFS026939*
Accounts payable includes payable to suppliers and service providers, and loan payments and othercharges received from customers in advance.
Other credits represent long-outstanding unclaimed balances from inactive and dormant accounts.
Miscellaneous liabilities include incentives for housing loan customers that are compliant with thepayment terms amounting to P=18.2 million and P=27.3 million as of December 31, 2017 and 2016,respectively.
20. Maturity Analysis of Assets and Liabilities
The following table shows an analysis of assets and liabilities analyzed according to whether they areexpected to be recovered or settled within one year and beyond one year from the statement ofcondition dates (in thousands):
December 312017 2016
WithinOne Year
BeyondOne Year Total
WithinOne Year
BeyondOne Year Total
Financial AssetsCash and other cash items P=2,596,873 P=– P=2,596,873 P=2,778,009 P=– P=2,778,009Due from BSP (Note 16) 15,265,388 – 15,265,388 13,986,785 – 13,986,785Due from other banks (Note 16) 1,508,489 – 1,508,489 1,838,630 – 1,838,630Interbank loans receivable and SPURA
(Note 7) 1,842,023 – 1,842,023 3,254,312 – 3,254,312FVPL investments (Note 8) 366,236 366,236 1,360,792 – 1,360,792AFS investments - gross (Note 8) 565,979 16,361,696 16,927,675 39,805 13,078,197 13,118,002HTM investments (Note 8) – 29,473,724 29,473,724 329,768 22,827,119 23,156,887Loans and receivables - gross (Note 9) 14,576,182 135,035,434 149,611,616 12,821,739 119,174,321 131,996,060Other assets - gross* (Note 14) – 191,358 191,358 36,475 153,479 189,954
36,721,170 181,062,212 217,783,382 36,446,315 155,233,116 191,679,431Nonfinancial AssetsInvestment in a joint venture – 607,163 607,163 – 727,176 727,176Property and equipment - gross (Note 11) – 5,800,632 5,800,632 – 5,611,188 5,611,188Investment properties - gross (Note 12) – 4,557,463 4,557,463 – 4,481,457 4,481,457Deferred tax assets – 1,429,327 1,429,327 – 1,300,724 1,300,724Goodwill and intangible assets – 714,924 714,924 – 505,166 505,166Other assets - gross** 315,324 806,362 1,121,686 281,033 683,799 964,832
315,324 13,915,871 14,231,195 281,033 13,309,510 13,590,543Less:Allowance for credit and
impairment losses (Note 15) 4,878,926 5,018,912 Accumulated depreciation
(Notes 11, 12 and 14) 3,811,463 3,386,479 Unearned discounts (Note 9) 145 11,480
8,690,534 8,416,871P=37,036,494 P=194,978,083 P=223,324,043 P=36,727,348 P=168,542,626 P=196,853,103
* Others assets under financial assets comprise petty cash fund, shortages, RCOCI and security deposits.** Other assets under nonfinancial assets comprise inter-office float items, prepaid expenses, stationery and supplies on hand, sundry debits, documentary
stamps on hand, deferred charges, postages stamps and chattel mortgage properties.
Notes to Financial Statements- 71 -
*SGVFS026939*
Accounts payable includes payable to suppliers and service providers, and loan payments and othercharges received from customers in advance.
Other credits represent long-outstanding unclaimed balances from inactive and dormant accounts.
Miscellaneous liabilities include incentives for housing loan customers that are compliant with thepayment terms amounting to P=18.2 million and P=27.3 million as of December 31, 2017 and 2016,respectively.
20. Maturity Analysis of Assets and Liabilities
The following table shows an analysis of assets and liabilities analyzed according to whether they areexpected to be recovered or settled within one year and beyond one year from the statement ofcondition dates (in thousands):
December 312017 2016
WithinOne Year
BeyondOne Year Total
WithinOne Year
BeyondOne Year Total
Financial AssetsCash and other cash items P=2,596,873 P=– P=2,596,873 P=2,778,009 P=– P=2,778,009Due from BSP (Note 16) 15,265,388 – 15,265,388 13,986,785 – 13,986,785Due from other banks (Note 16) 1,508,489 – 1,508,489 1,838,630 – 1,838,630Interbank loans receivable and SPURA
(Note 7) 1,842,023 – 1,842,023 3,254,312 – 3,254,312FVPL investments (Note 8) 366,236 366,236 1,360,792 – 1,360,792AFS investments - gross (Note 8) 565,979 16,361,696 16,927,675 39,805 13,078,197 13,118,002HTM investments (Note 8) – 29,473,724 29,473,724 329,768 22,827,119 23,156,887Loans and receivables - gross (Note 9) 14,576,182 135,035,434 149,611,616 12,821,739 119,174,321 131,996,060Other assets - gross* (Note 14) – 191,358 191,358 36,475 153,479 189,954
36,721,170 181,062,212 217,783,382 36,446,315 155,233,116 191,679,431Nonfinancial AssetsInvestment in a joint venture – 607,163 607,163 – 727,176 727,176Property and equipment - gross (Note 11) – 5,800,632 5,800,632 – 5,611,188 5,611,188Investment properties - gross (Note 12) – 4,557,463 4,557,463 – 4,481,457 4,481,457Deferred tax assets – 1,429,327 1,429,327 – 1,300,724 1,300,724Goodwill and intangible assets – 714,924 714,924 – 505,166 505,166Other assets - gross** 315,324 806,362 1,121,686 281,033 683,799 964,832
315,324 13,915,871 14,231,195 281,033 13,309,510 13,590,543Less:Allowance for credit and
impairment losses (Note 15) 4,878,926 5,018,912 Accumulated depreciation
(Notes 11, 12 and 14) 3,811,463 3,386,479 Unearned discounts (Note 9) 145 11,480
8,690,534 8,416,871P=37,036,494 P=194,978,083 P=223,324,043 P=36,727,348 P=168,542,626 P=196,853,103
* Others assets under financial assets comprise petty cash fund, shortages, RCOCI and security deposits.** Other assets under nonfinancial assets comprise inter-office float items, prepaid expenses, stationery and supplies on hand, sundry debits, documentary
stamps on hand, deferred charges, postages stamps and chattel mortgage properties.

Philippine Savings Bank • 95
Notes to Financial Statements
- 72 -
*SGVFS026939*
December 312017 2016
WithinOne Year
BeyondOne Year Total
WithinOne Year
BeyondOne Year Total
Financial LiabilitiesDeposit liabilities P=170,432,096 P=18,481,306 P=188,913,402 P=141,892,398 P=16,494,921 P=158,387,319Bills payable 1,492,419 – 1,492,419 6,093,797 – 6,093,797Subordinated notes – 2,978,998 2,978,998 2,999,265 2,976,467 5,975,732Derivatives at negative fair value – – – 65,317 – 65,317Treasurer’s, cashier’s and manager’s
checks 2,213,870 – 2,213,870 1,760,506 – 1,760,506Accrued other expenses payable
(Note 18) 996,960 – 996,960 851,268 – 851,268Accrued interest payable (Note 18) 539,659 – 539,659 209,658 – 209,658Other liabilities (Note 19) Accounts payable 2,080,276 – 2,080,276 1,594,254 – 1,594,254 Other credits 698,347 – 698,347 592,403 – 592,403 Bills purchased - contra 10,482 – 10,482 63,774 – 63,774 Due to the treasurer of the
Philippines 16,959 – 16,959 12,230 – 12,230 Deposits for keys – SDB 806 – 806 P=823 P=– P=823 Others* 5,585 – 5,585 4,702 – 4,702
P=178,487,459 P=21,460,304 P=199,947,763 156,140,395 19,471,388 175,611,783Nonfinancial LiabilitiesAccrued other taxes and licenses payable
(Note 18) P=121,804 P=– P=121,804 P=132,890 P=– P=132,890Income tax payable 375 – 375 467 – 467Withholding taxes payable (Note 19) 94,052 – 94,052 73,092 – 73,092Other liabilities (Note 19)** 250,871 515,853 766,724 248,354 748,844 997,198
467,102 515,853 982,955 454,803 748,844 1,203,647P=178,954,561 P=21,976,157 P=200,930,718 P=156,595,198 P=20,220,232 P=176,815,430
* Others under financial liabilities comprise payment orders payable and overages.** Other liabilities under nonfinancial liabilities comprise advance rentals on bank premises, sundry credits, SSS, Medicare, ECP & HDMF premium
payable, net retirement liability, and miscellaneous liabilities.
21. Equity
Issued CapitalThe Bank’s capital stock consists of:
2017 2016Shares Amount Shares Amount
Authorized common stock - P=10 par value 425,000,000 P=4,250,000,000 425,000,000 P=4,250,000,000Issued and outstandingBalance at beginning and end of year (Note 28) 240,252,491 P=2,402,524,910 240,252,491 P=2,402,524,910
The Bank became listed in the Philippine Stock Exchange (PSE) on October 10, 1994. Subsequently,the SEC approved the increase in the capital stock of the Bank. The summarized information on theBank’s registration of securities under the Securities Regulation Code follows:
Date of SEC Approval Type Authorized Shares Par ValueAugust 16, 1995 Common 300,000,000 P=10October 8, 1997 Common 425,000,000 P=10
As of December 31, 2017 and 2016, the total number of stockholders is 1,483 and 1,507, respectively.

96 • 2017 Annual Report •
- 73 -
*SGVFS026939*
Dividends Paid and ProposedDetails of the Bank’s dividend distributions as approved by the Bank’s BOD and the BSP follow:
Cash DividendsDate of declaration Per share Total amount Date of BSP approval Record date Payment dateJanuary 22, 2015 0.75 180,189,368.3 March 3, 2015 March 30, 2015 April 17, 2015April 28, 2015 0.75 180,189,368.3 June 5, 2015 July 14, 2015 July 28, 2015July 28, 2015 0.75 180,189,368.3 September 23, 2015 October 26, 2015 November 11, 2015October 29, 2015 0.75 180,189,368.3 – November 16, 2015 November 27, 2015January 19, 2016 0.75 180,189,368.3 – February 1, 2016 February 19, 2016April 26, 2016 0.75 180,189,368.3 – May 11, 2016 May 26, 2016July 22, 2016 0.75 180,189,368.3 – August 8, 2016 August 22, 2016October 21, 2016 0.75 180,189,368.3 – November 9, 2016 November 21, 2016January 24, 2017 0.75 180,189,368.3 – February 10, 2017 February 24, 2017April 24, 2017 0.75 180,189,368.3 – May 10, 2017 May 24, 2017July 27, 2017 0.75 180,189,368.3 – August 11, 2017 August 29, 2017October 26, 2017 0.75 180,189,368.3 – November 14, 2017 November 24, 2017January 18, 2018 0.75 180,189,368.3 – February 02, 2018 February 19, 2018
On October 9, 2015, the Bangko Sentral ng Pilipinas (BSP) issued Circular No. 888, Amendments toRegulations on Dividend Declaration and Interest Payments on Tier 1 Capital Instruments, whichliberalized said rules in the sense that prior BSP verification and approval is no longer required exceptfor banks with major supervisory concerns. However, banks are bound to comply with the provisionsof Section X136 of the Manual of Regulations for Banks (MORB) and its subsections, including thesubmission of documentary requirements under Subsection X136.4 of the MORB, otherwise, banks,subsequently found to have violated the provisions on dividend declaration or have falselycertified/submitted misleading statements shall be reverted to the prior BSP verification wherein thebank can only make an announcement or communication on the declaration of the dividends orpayment of dividends thereon upon receipt of BSP advice thereof. The Bank is compliant with thesaid circular.
The computation of surplus available for dividend declaration in accordance with SEC MemorandumCircular No. 11 issued in December 2008 differs to a certain extent from the computation followingBSP guidelines.
In compliance with BSP regulations, 10.00% of the Bank’s profit from trust business is appropriatedto surplus reserves. This annual appropriation is required until the surplus reserves for trust businessequals 20.00% of the Bank’s authorized capital stock.
A portion of the surplus corresponding to the accumulated net earnings of a joint venture is notavailable for dividend declaration (Note 10) until receipt of cash dividends from the investee.
Capital ManagementThe primary objectives of the Bank’s capital management are to ensure that the Bank complies withexternally imposed capital requirements, as mandated by the BSP, and that the Bank maintainshealthy capital ratios in order to support its business and maximize returns for its shareholders. TheBank considers its paid in capital and surplus as its capital.
The Bank manages its capital structure and makes adjustments to it in light of changes in economicconditions and the risk characteristics of its activities. In order to maintain or adjust the capitalstructure, the Bank may adjust the amount of dividend payments to shareholders or issue capitalsecurities. The major activities in this area include the following:
∂ The Bank issued additional common shares for its qualified stockholders in 2008 and 2006through stock rights offerings that raised P=2.0 billion and P=750.0 million in capital, respectively.
Notes to Financial Statements

Philippine Savings Bank • 97
Notes to Financial Statements - 74 -
*SGVFS026939*
∂ On March 2, 2005, the Bank’s BOD approved an amendment to the Bank’s Dividend Policywhich provides for an annual regular cash dividend of 6.00% of the par value of the total capitalstock payable quarterly at the rate of 1.50% or P=0.15 per share payable not later than March 31,June 30, September 30 and December 31 of each year.
∂ On February 29, 2012, the Bank’s BOD approved a further amendment to the Bank’s DividendPolicy to provide for an annual regular cash dividend of 30.00% of the par value of the totalcapital stock, payable quarterly at the rate of 7.50% or P=0.75 per share payable not later thanMarch 31, June 30, September 30 and December 31 of each year.
Regulatory Qualifying CapitalUnder existing BSP regulations, the determination of the Bank’s compliance with regulatoryrequirements and ratios is based on the amount of the Bank’s unimpaired capital (regulatory capital)as reported to the BSP. This is determined on the basis of regulatory accounting policies which differfrom PFRS in some respects.
In addition, the risk-based capital ratio of a bank, expressed as a percentage of qualifying capital torisk-weighted assets, should not be less than 10.00% for both solo basis and consolidated basis.Qualifying capital and risk-weighted assets are computed based on BSP regulations. Risk-weightedassets consist of total assets less cash on hand, due from BSP, loans covered by hold-out on orassignment of deposits, loans or acceptances under letters of credit to the extent covered by margindeposits and other non-risk items determined by the Monetary Board of the BSP.
On January 15, 2013, the BSP issued Circular No. 781, Basel III Implementing Guidelines onMinimum Capital Requirements, which states the implementing guidelines on the revised risk-basedcapital adequacy framework, particularly on the minimum capital and disclosure requirements foruniversal banks and commercial banks, as well as their subsidiary banks and quasi-banks, inaccordance with the Basel III standards. The Circular took effect on January 1, 2014.
The Circular sets out a minimum Common Equity Tier 1 (CET1) ratio of 6.00% and Tier 1 capitalratio of 7.50%. It also introduces a capital conservation buffer of 2.50% comprised of CET1 capital.The BSP’s existing requirement for Total CAR remains unchanged at 10.00% and these ratios shallbe maintained at all times.
The CAR of the Bank as of December 31, as reported to the BSP, based on BSP Circular No. 781 andBSP Circular No. 538, respectively, are shown in the table below (amounts in millions).
2017 2016Tier 1 capital P=20,898 P=18,768Tier 2 capital 4,346 4,168Gross qualifying capital 25,244 22,936Less required deductions 3,583 3,281Total qualifying capital 21,661 19,655Risk weighted assets P=156,140 P=139,738Tier 1 capital adequacy ratio 11.09% 11.08%Capital adequacy ratio 13.87% 14.07%
Regulatory qualifying capital consists of Tier 1 (going concern) capital, which comprises capitalstock, surplus, surplus reserves, net unrealized gains on AFS securities, and cumulative translationadjustment. Certain adjustments are made to PFRS-based results and reserves, as prescribed by theBSP. The other component of regulatory capital is Tier 2 (gone-concern) capital, which is comprised
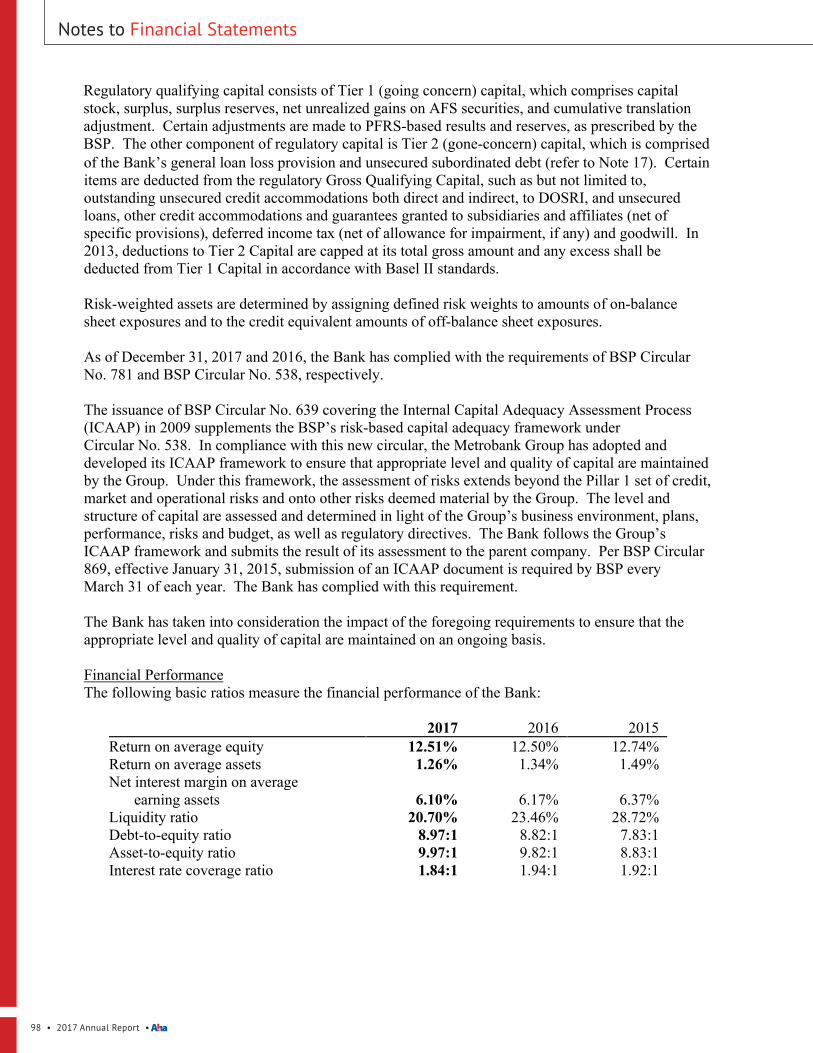
98 • 2017 Annual Report •
Notes to Financial Statements
- 75 -
*SGVFS026939*
of the Bank’s general loan loss provision and unsecured subordinated debt (refer to Note 17). Certainitems are deducted from the regulatory Gross Qualifying Capital, such as but not limited to,outstanding unsecured credit accommodations both direct and indirect, to DOSRI, and unsecuredloans, other credit accommodations and guarantees granted to subsidiaries and affiliates (net ofspecific provisions), deferred income tax (net of allowance for impairment, if any) and goodwill. In2013, deductions to Tier 2 Capital are capped at its total gross amount and any excess shall bededucted from Tier 1 Capital in accordance with Basel II standards.
Risk-weighted assets are determined by assigning defined risk weights to amounts of on-balancesheet exposures and to the credit equivalent amounts of off-balance sheet exposures.
As of December 31, 2017 and 2016, the Bank has complied with the requirements of BSP CircularNo. 781 and BSP Circular No. 538, respectively.
The issuance of BSP Circular No. 639 covering the Internal Capital Adequacy Assessment Process(ICAAP) in 2009 supplements the BSP’s risk-based capital adequacy framework underCircular No. 538. In compliance with this new circular, the Metrobank Group has adopted anddeveloped its ICAAP framework to ensure that appropriate level and quality of capital are maintainedby the Group. Under this framework, the assessment of risks extends beyond the Pillar 1 set of credit,market and operational risks and onto other risks deemed material by the Group. The level andstructure of capital are assessed and determined in light of the Group’s business environment, plans,performance, risks and budget, as well as regulatory directives. The Bank follows the Group’sICAAP framework and submits the result of its assessment to the parent company. Per BSP Circular869, effective January 31, 2015, submission of an ICAAP document is required by BSP everyMarch 31 of each year. The Bank has complied with this requirement.
The Bank has taken into consideration the impact of the foregoing requirements to ensure that theappropriate level and quality of capital are maintained on an ongoing basis.
Financial PerformanceThe following basic ratios measure the financial performance of the Bank:
2017 2016 2015Return on average equity 12.51% 12.50% 12.74%Return on average assets 1.26% 1.34% 1.49%Net interest margin on average
earning assets 6.10% 6.17% 6.37%Liquidity ratio 20.70% 23.46% 28.72%Debt-to-equity ratio 8.97:1 8.82:1 7.83:1Asset-to-equity ratio 9.97:1 9.82:1 8.83:1Interest rate coverage ratio 1.84:1 1.94:1 1.92:1
- 74 -
*SGVFS026939*
∂ On March 2, 2005, the Bank’s BOD approved an amendment to the Bank’s Dividend Policywhich provides for an annual regular cash dividend of 6.00% of the par value of the total capitalstock payable quarterly at the rate of 1.50% or P=0.15 per share payable not later than March 31,June 30, September 30 and December 31 of each year.
∂ On February 29, 2012, the Bank’s BOD approved a further amendment to the Bank’s DividendPolicy to provide for an annual regular cash dividend of 30.00% of the par value of the totalcapital stock, payable quarterly at the rate of 7.50% or P=0.75 per share payable not later thanMarch 31, June 30, September 30 and December 31 of each year.
Regulatory Qualifying CapitalUnder existing BSP regulations, the determination of the Bank’s compliance with regulatoryrequirements and ratios is based on the amount of the Bank’s unimpaired capital (regulatory capital)as reported to the BSP. This is determined on the basis of regulatory accounting policies which differfrom PFRS in some respects.
In addition, the risk-based capital ratio of a bank, expressed as a percentage of qualifying capital torisk-weighted assets, should not be less than 10.00% for both solo basis and consolidated basis.Qualifying capital and risk-weighted assets are computed based on BSP regulations. Risk-weightedassets consist of total assets less cash on hand, due from BSP, loans covered by hold-out on orassignment of deposits, loans or acceptances under letters of credit to the extent covered by margindeposits and other non-risk items determined by the Monetary Board of the BSP.
On January 15, 2013, the BSP issued Circular No. 781, Basel III Implementing Guidelines onMinimum Capital Requirements, which states the implementing guidelines on the revised risk-basedcapital adequacy framework, particularly on the minimum capital and disclosure requirements foruniversal banks and commercial banks, as well as their subsidiary banks and quasi-banks, inaccordance with the Basel III standards. The Circular took effect on January 1, 2014.
The Circular sets out a minimum Common Equity Tier 1 (CET1) ratio of 6.00% and Tier 1 capitalratio of 7.50%. It also introduces a capital conservation buffer of 2.50% comprised of CET1 capital.The BSP’s existing requirement for Total CAR remains unchanged at 10.00% and these ratios shallbe maintained at all times.
The CAR of the Bank as of December 31, as reported to the BSP, based on BSP Circular No. 781 andBSP Circular No. 538, respectively, are shown in the table below (amounts in millions).
2017 2016Tier 1 capital P=20,898 P=18,768Tier 2 capital 4,346 4,168Gross qualifying capital 25,244 22,936Less required deductions 3,583 3,281Total qualifying capital 21,661 19,655Risk weighted assets P=156,140 P=139,738Tier 1 capital adequacy ratio 11.09% 11.08%Capital adequacy ratio 13.87% 14.07%
Regulatory qualifying capital consists of Tier 1 (going concern) capital, which comprises capitalstock, surplus, surplus reserves, net unrealized gains on AFS securities, and cumulative translationadjustment. Certain adjustments are made to PFRS-based results and reserves, as prescribed by theBSP. The other component of regulatory capital is Tier 2 (gone-concern) capital, which is comprised

Philippine Savings Bank • 99
Notes to Financial Statements- 76 -
*SGVFS026939*
22. Net Service Fees and Commission Income
This account consists of:
2017 2016 2015Service Fees and Commission
IncomeCredit-related fees and commissions P=1,002,687,070 P=731,435,587 P=757,297,871Deposit-related and other fees
received 441,197,668 473,979,270 521,122,916Trust fees 26,317,702 20,600,300 15,278,974
1,470,202,440 1,226,015,157 1,293,699,761Service Fees and Commission
ExpenseCommissions P=83,211,656 83,156,492 89,801,141Brokerage 11,216,635 6,511,459 8,406,570
94,428,291 89,667,951 98,207,711Net Service Fees and Commission
Income P=1,375,774,149 P=1,136,347,206 P=1,195,492,050
23. Miscellaneous Income
This account consists of:
2017 2016 2015Recovery of charged-off assets P=325,476,107 P=296,241,762 P=284,561,719Insurance commission income 113,868,238 63,948,168 42,103,916Rental income (Notes 12 and 25) 50,137,646 55,505,274 54,876,077Others 18,028,368 10,452,674 133,871,739
P=507,510,359 P=426,147,878 P=515,413,451
Rental income arises from the lease of properties and safety deposit boxes of the Bank.
Others include income from renewal fees, checkbook charges, dividend income and othermiscellaneous income.
24. Retirement Benefits
The Bank has a funded, noncontributory defined benefit plan covering substantially all of itsemployees. The benefits are based on years of service and final compensation.
The plan administered by the Retirement Committee is composed of five (5) members appointed bythe Board of Directors of the Bank. The Retirement Committee have all the powers necessary oruseful in the discharge of its duties of administration including, but not limited to determining therights of Members under the Plan. The Retirement Committee may adopt such rules and regulationsas it deems necessary and desirable, including those governing the establishment of procedures, theuse of necessary forms, and the setting up of minimum periods where notice is required. TheRetirement Committee may seek advice of counsel, and may appoint an independent accountant toaudit the Plan and actuary to value the plan periodically, whose professional fees and expenses maybe charged to the Fund.
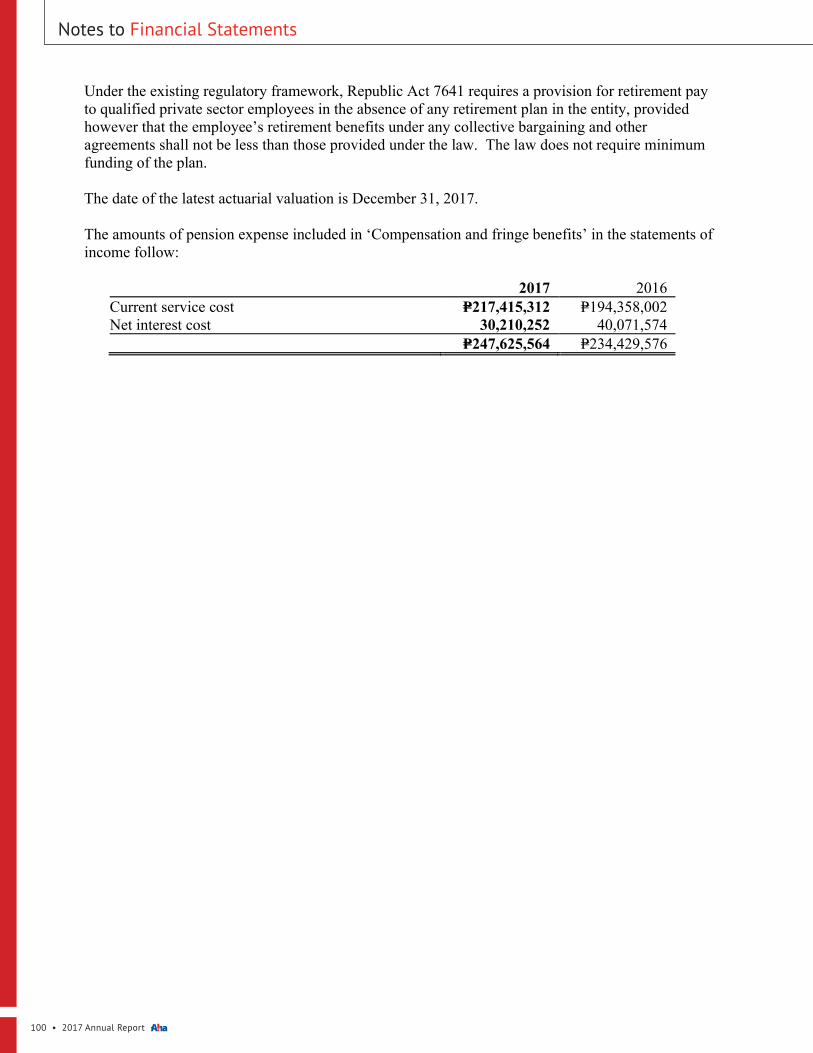
100 • 2017 Annual Report •
- 77 -
*SGVFS026939*
Under the existing regulatory framework, Republic Act 7641 requires a provision for retirement payto qualified private sector employees in the absence of any retirement plan in the entity, providedhowever that the employee’s retirement benefits under any collective bargaining and otheragreements shall not be less than those provided under the law. The law does not require minimumfunding of the plan.
The date of the latest actuarial valuation is December 31, 2017.
The amounts of pension expense included in ‘Compensation and fringe benefits’ in the statements ofincome follow:
2017 2016Current service cost P=217,415,312 P=194,358,002Net interest cost 30,210,252 40,071,574
P=247,625,564 P=234,429,576
Notes to Financial Statements

Philippine Savings Bank • 101
Notes to Financial Statements
- 78
-
*SGVFS026939*
The
net r
etire
men
t lia
bilit
y sh
own
unde
r ‘O
ther
liab
ilitie
s’ re
cogn
ized
in th
e B
ank’
s sta
tem
ents
of c
ondi
tion
follo
ws (
in th
ousa
nds)
:
2017
Rem
easu
rem
ents
in o
ther
com
preh
ensi
ve in
com
e
Net
ben
efit
cost
Ret
urn
onpl
an a
sset
s(e
xclu
ding
amou
nt
Act
uari
alch
ange
sar
isin
g fr
om
Act
uari
alch
ange
s ari
sing
from
cha
nges
Act
uari
alch
ange
s ari
sing
from
cha
nges
Janu
ary
1,20
17C
urre
ntse
rvic
e co
stN
etIn
tere
stSu
btot
alB
enef
itspa
idin
clud
ed in
net
inte
rest
)ex
peri
ence
adju
stm
ents
in d
emog
raph
icas
sum
ptio
nsin
fina
ncia
las
sum
ptio
nsSu
btot
alC
ontr
ibut
ion
by e
mpl
oyer
Dec
embe
r 31
,20
17Pr
esen
t val
ue o
f def
ined
ben
efit
oblig
atio
nP=2
,222
,652
P=217
,415
P=114
,127
P=331
,542
(P=88
,676
)P=−
P=87,
389
(P=48
,863
)(P=
88,4
93)
(P=49
,967
)P=−
P=2,4
15,5
51Fa
ir va
lue
of p
lan
asse
ts(1
,473
,809
)−
(83,
917)
(83,
917)
88,6
7655
,241
−−
−55
,241
(485
,889
)(1
,899
,698
)N
et d
efin
ed b
enef
it lia
bilit
yP=7
48,8
43P=2
17,4
15P=3
0,21
0P=2
47,6
25P=−
P=55,
241
P=87,
389
(P=48
,863
)(P=
88,4
93)
P=5,2
74(4
85,8
89)
P=515
,853
2016
Rem
easu
rem
ents
in o
ther
com
preh
ensi
ve in
com
e
Net
ben
efit
cost
Ret
urn
onpl
an a
sset
s(e
xclu
ding
amou
nt
Act
uaria
lch
ange
sar
isin
g fr
om
Act
uaria
lch
ange
s aris
ing
from
cha
nges
Act
uaria
lch
ange
s aris
ing
from
cha
nges
Janu
ary
1,20
16C
urre
ntse
rvic
e co
stN
etIn
tere
stSu
btot
alB
enef
itspa
idin
clud
ed in
net
inte
rest
)ex
perie
nce
adju
stm
ents
in d
emog
raph
icas
sum
ptio
nsin
fina
ncia
las
sum
ptio
nsSu
btot
alC
ontri
butio
nby
em
ploy
erD
ecem
ber 3
1,20
16Pr
esen
t val
ue o
f def
ined
ben
efit
oblig
atio
nP=1
,990
,815
P=194
,358
P=97,
314
P=291
,672
(P=65
,706
)P=−
P=69,
380
P=− (P=
63,5
09)
P=5,8
71P=−
P=2,2
22,6
52Fa
ir va
lue
of p
lan
asse
ts(1
,190
,983
)−
(57,
242)
(57,
242)
65,7
0694
,601
−−
−94
,601
(385
,891
)(1
,473
,809
)N
et d
efin
ed b
enef
it lia
bilit
yP=7
99,8
32P=1
94,3
58P=4
0,07
2P=2
34,4
30P=−
P=94,
601
P=69,
380
P=−(P=
63,5
09)
P=100
,472
(P=38
5,89
1)P=7
48,8
43
The
max
imum
eco
nom
ic b
enef
it av
aila
ble
is a
com
bina
tion
of e
xpec
ted
refu
nds f
rom
the
plan
and
redu
ctio
ns in
futu
re c
ontri
butio
ns.
The
Ban
k ex
pect
s to
cont
ribut
e P=4
13.5
mill
ion
to it
s non
cont
ribut
ory
defin
ed b
enef
it pl
an in
201
8.

102 • 2017 Annual Report •
Notes to Financial Statements - 79 -
*SGVFS026939*
The fair values of plan assets by each class as at the statements of condition date are as follows:
2017 2016Cash and cash equivalents Special deposit account P=554,889,479 P=582,003,365 Certificate of time deposit (Note 29) – 92,000,000Investment in other debt securities 1,240,305,685 531,057,496Investment in equity securities 26,368,915 223,986,236Unit Investment Trust Fund 66,781,376 58,850,839Other assets 12,961,335 5,833,021
1,901,306,790 1,493,730,957Other liabilities 1,608,492 19,922,568
P=1,899,698,298 P=1,473,808,389
The person exercising voting right for the foregoing equity instruments is currently a seniorofficer of the Bank.
The principal actuarial assumptions used in determining retirement liability as ofDecember 31, 2017 and 2016 are shown below:
2017 2016Discount rate 5.73% 5.31%Turnover rate 5.00% 6.00%Future salary increases 5.00% 5.00%
The sensitivity analysis below has been determined based on reasonably possible changes of eachsignificant assumption on the defined benefit obligation as of the end of the reporting period,assuming all other assumptions were held constant:
December 31, 2017 December 31, 2016Possible
FluctuationsIncrease
(decrease)Possible
FluctuationsIncrease
(decrease)Discount rate +1.00% (193,153,254) +1.00% (190,815,355)
-1.00% 223,084,719 -1.00% 221,306,014
Turnover rate +1.00% (10,645,594) +1.00% (20,387,630)-1.00% 10,953,731 -1.00% 20,980,032
Future salary increase rate +1.00% 238,335,111 +1.00% 238,629,209-1.00% (209,707,814) -1.00% (208,964,328)
The Retirement Committee ensures that there will be sufficient assets to pay pension benefits asthey fall due and maintains the plan on an actuarially sound basis considering the benefits tomembers.
Shown below is the maturity analysis of the undiscounted benefit payments:
2017 2016Less than one year P=260,863,815 P=146,739,063More than one year to five years 728,232,134 660,937,425More than five years to 10 years 1,673,064,174 1,364,613,210More than 10 years to 15 years 1,991,238,250 2,014,243,913More than 15 years to 20 years 2,001,828,082 1,954,212,513More than 20 years 4,280,297,426 4,095,907,866
- 79 -
*SGVFS026939*
The fair values of plan assets by each class as at the statements of condition date are as follows:
2017 2016Cash and cash equivalents Special deposit account P=554,889,479 P=582,003,365 Certificate of time deposit (Note 29) – 92,000,000Investment in other debt securities 1,240,305,685 531,057,496Investment in equity securities 26,368,915 223,986,236Unit Investment Trust Fund 66,781,376 58,850,839Other assets 12,961,335 5,833,021
1,901,306,790 1,493,730,957Other liabilities 1,608,492 19,922,568
P=1,899,698,298 P=1,473,808,389
The person exercising voting right for the foregoing equity instruments is currently a seniorofficer of the Bank.
The principal actuarial assumptions used in determining retirement liability as ofDecember 31, 2017 and 2016 are shown below:
2017 2016Discount rate 5.73% 5.31%Turnover rate 5.00% 6.00%Future salary increases 5.00% 5.00%
The sensitivity analysis below has been determined based on reasonably possible changes of eachsignificant assumption on the defined benefit obligation as of the end of the reporting period,assuming all other assumptions were held constant:
December 31, 2017 December 31, 2016Possible
FluctuationsIncrease
(decrease)Possible
FluctuationsIncrease
(decrease)Discount rate +1.00% (193,153,254) +1.00% (190,815,355)
-1.00% 223,084,719 -1.00% 221,306,014
Turnover rate +1.00% (10,645,594) +1.00% (20,387,630)-1.00% 10,953,731 -1.00% 20,980,032
Future salary increase rate +1.00% 238,335,111 +1.00% 238,629,209-1.00% (209,707,814) -1.00% (208,964,328)
The Retirement Committee ensures that there will be sufficient assets to pay pension benefits asthey fall due and maintains the plan on an actuarially sound basis considering the benefits tomembers.
Shown below is the maturity analysis of the undiscounted benefit payments:
2017 2016Less than one year P=260,863,815 P=146,739,063More than one year to five years 728,232,134 660,937,425More than five years to 10 years 1,673,064,174 1,364,613,210More than 10 years to 15 years 1,991,238,250 2,014,243,913More than 15 years to 20 years 2,001,828,082 1,954,212,513More than 20 years 4,280,297,426 4,095,907,866

Philippine Savings Bank • 103
Notes to Financial Statements - 80 -
*SGVFS026939*
The average duration of the expected benefit payments at the statement of condition date is16.1 years.
25. Leases
The Bank leases the premises occupied by its branches for periods ranging from 1 to 20 yearsrenewable under certain terms and conditions. Various lease contracts include escalation clauses,most of which bear an annual rent increase of 10.00%. Rentals charged against profit or lossunder these lease contracts amounting to P=579.9 million, P=559.9 million and P=521.8 million in2017, 2016 and 2015, respectively, are shown under ‘Occupancy and equipment-related costs’ inthe statements of income.
Future minimum rentals payable under non-cancelable operating leases are as follows:
2017 2016Within one year P=361,756,475 P=370,406,271After one year but not more than five years 1,078,413,962 1,152,216,591More than five years 461,169,886 607,663,809
P=1,901,340,323 P=2,130,286,671
The Bank has also entered into commercial property leases on its surplus office space. Thesenon-cancelable leases have remaining non-cancelable lease terms between 1 and 5 years. As ofDecember 31, 2017 and 2016, there is no contingent rental income. Rental income of the Bankrelated to these property leases amounting to P=48.7 million, P=53.8 million, and P=53.0 million in2017, 2016 and 2015, respectively are shown under ‘Miscellaneous income’ in the statements ofincome.
Future minimum rentals receivable under non-cancelable operating leases are as follows:
2017 2016Within one year P=54,489,372 P=48,424,870After one year but not more than five years 64,053,882 40,876,011
P=118,543,254 P=89,300,881
26. Miscellaneous Expenses
This account consists of:
2017 2016 2015Insurance P=646,175,766 P=531,430,943 P=477,751,230Litigation 311,326,367 231,158,922 275,455,140Information technology 300,919,189 342,296,763 272,182,604Fines, penalties and other charges 193,083,359 18,411,698 14,432,007Communications 171,980,030 154,193,467 159,129,969Repairs and maintenance 145,685,402 139,952,788 159,398,625Advertising 134,701,913 102,412,588 64,934,029Transportation and traveling 108,019,662 115,592,190 107,011,983Stationery and supplies 61,923,426 58,283,090 63,978,794Supervision and examination fees 59,666,717 49,247,092 52,911,508(Forward)

104 • 2017 Annual Report •
- 81 -
*SGVFS026939*
2017 2016 2015Management and professional fees P=29,477,993 P=23,062,585 P=25,993,577Training and seminars 19,158,180 18,007,677 9,332,858Donations and charitable contributions 11,391,445 10,920,000 3,912,468Banking activities expenses 9,032,636 8,004,469 9,472,020Meeting allowance 6,731,295 4,074,588 4,675,555Rewards and incentives 6,595,774 3,181,297 4,522,624Membership fees and dues 3,508,422 5,816,084 5,046,531Entertainment, amusement and recreation (EAR)
(Note 27) 3,492,739 3,407,845 3,563,703Others 28,463,191 57,022,178 29,049,206
P=2,251,333,506 P=1,876,476,264 P=1,742,754,431
Insurance expense includes premiums paid to the Philippine Deposit Insurance Corporation (PDIC)amounting to P=368.2 million, P=289.5 million, and P=245.2 million in 2017, 2016 and 2015,respectively.
Other expenses include sponsorship expenses, home free loan expenses, appraisal fees and notarialfees. It also include payments to union members amounting to P=10.8 million, P=10.6 million andP=10.5 million in 2017, 2016 and 2015, respectively, for the successful completion of the collectivebargaining agreement.
27. Income and Other Taxes
Under Philippine tax laws, the Bank is subject to percentage and other taxes (presented as ‘Taxes andlicenses’ in the statements of income) as well as income taxes. Percentage and other taxes paidconsist principally of gross receipts tax (GRT) and documentary stamp tax (DST).
Income taxes include corporate income tax, further discussed below, and final taxes paid at the rate of20.00%, which is a final withholding tax on gross interest income from government securities andother deposit substitutes.
The NIRC of 1997 also provides for rules on the imposition of a 2.00% MCIT on the gross income asof the end of the taxable year beginning on the fourth (4th) taxable year immediately following thetaxable year in which the company commenced its business operations. Any excess MCIT over theRCIT can be carried forward on an annual basis and credited against the RCIT for the three (3)immediately succeeding taxable years.
Starting July 1, 2008, the Optional Standard Deduction (OSD) equivalent to 40.00% of gross incomemay be claimed as an alternative deduction in computing for the RCIT. The Bank elected to claimitemized expense deductions instead of the OSD in computing for the RCIT in 2017 and 2016.
On March 15, 2011, the BIR issued RR No. 4-2011 which prescribes the attribution and allocation ofexpenses between FCDUs/EFCDUs or OBU and RBU, and further allocation within RBU based ondifferent income earning activities. Pursuant to the regulations, the Bank made an allocation of itsexpenses in calculating income taxes due for RBU and FCDU.
Current tax regulations also provide for the ceiling on the amount of EAR expense that can beclaimed as a deduction against taxable income. Under the regulations, EAR expense allowed as adeductible expense for a service company is limited to the actual EAR paid or incurred but not toexceed 1.00% of net revenue.
Notes to Financial Statements
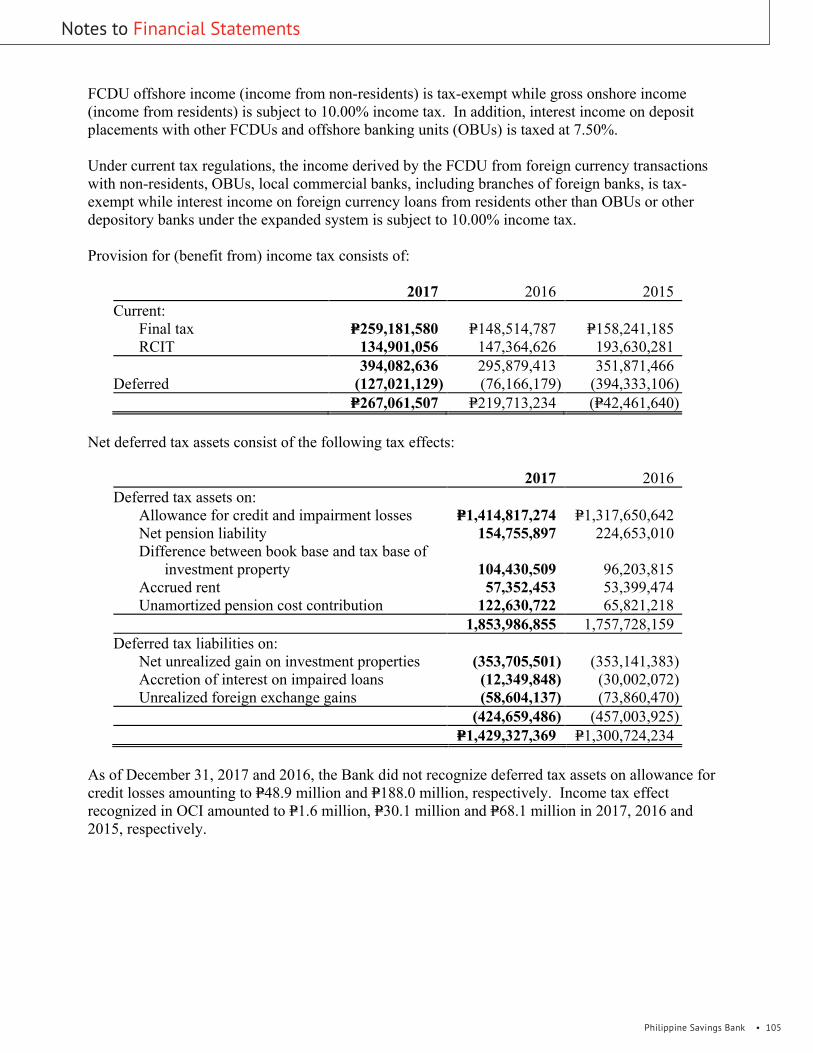
Philippine Savings Bank • 105
Notes to Financial Statements - 82 -
*SGVFS026939*
FCDU offshore income (income from non-residents) is tax-exempt while gross onshore income(income from residents) is subject to 10.00% income tax. In addition, interest income on depositplacements with other FCDUs and offshore banking units (OBUs) is taxed at 7.50%.
Under current tax regulations, the income derived by the FCDU from foreign currency transactionswith non-residents, OBUs, local commercial banks, including branches of foreign banks, is tax-exempt while interest income on foreign currency loans from residents other than OBUs or otherdepository banks under the expanded system is subject to 10.00% income tax.
Provision for (benefit from) income tax consists of:
2017 2016 2015Current: Final tax P=259,181,580 P=148,514,787 P=158,241,185 RCIT 134,901,056 147,364,626 193,630,281
394,082,636 295,879,413 351,871,466Deferred (127,021,129) (76,166,179) (394,333,106)
P=267,061,507 P=219,713,234 (P=42,461,640)
Net deferred tax assets consist of the following tax effects:
2017 2016Deferred tax assets on: Allowance for credit and impairment losses P=1,414,817,274 P=1,317,650,642 Net pension liability 154,755,897 224,653,010 Difference between book base and tax base of
investment property 104,430,509 96,203,815 Accrued rent 57,352,453 53,399,474 Unamortized pension cost contribution 122,630,722 65,821,218
1,853,986,855 1,757,728,159Deferred tax liabilities on: Net unrealized gain on investment properties (353,705,501) (353,141,383) Accretion of interest on impaired loans (12,349,848) (30,002,072) Unrealized foreign exchange gains (58,604,137) (73,860,470)
(424,659,486) (457,003,925)P=1,429,327,369 P=1,300,724,234
As of December 31, 2017 and 2016, the Bank did not recognize deferred tax assets on allowance forcredit losses amounting to P=48.9 million and P=188.0 million, respectively. Income tax effectrecognized in OCI amounted to P=1.6 million, P=30.1 million and P=68.1 million in 2017, 2016 and2015, respectively.
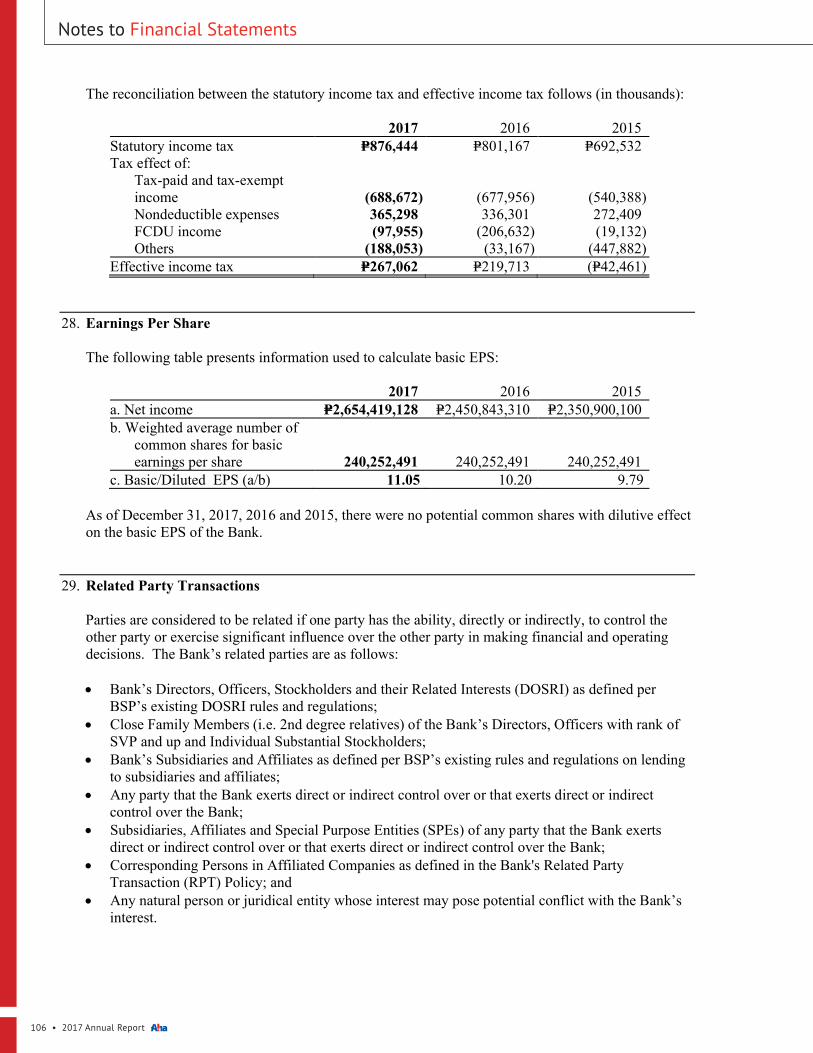
106 • 2017 Annual Report •
- 83 -
*SGVFS026939*
The reconciliation between the statutory income tax and effective income tax follows (in thousands):
2017 2016 2015Statutory income tax P=876,444 P=801,167 P=692,532Tax effect of: Tax-paid and tax-exempt
income (688,672) (677,956) (540,388) Nondeductible expenses 365,298 336,301 272,409 FCDU income (97,955) (206,632) (19,132) Others (188,053) (33,167) (447,882)Effective income tax P=267,062 P=219,713 (P=42,461)
28. Earnings Per Share
The following table presents information used to calculate basic EPS:
2017 2016 2015a. Net income P=2,654,419,128 P=2,450,843,310 P=2,350,900,100b. Weighted average number of
common shares for basicearnings per share 240,252,491 240,252,491 240,252,491
c. Basic/Diluted EPS (a/b) 11.05 10.20 9.79
As of December 31, 2017, 2016 and 2015, there were no potential common shares with dilutive effecton the basic EPS of the Bank.
29. Related Party Transactions
Parties are considered to be related if one party has the ability, directly or indirectly, to control theother party or exercise significant influence over the other party in making financial and operatingdecisions. The Bank’s related parties are as follows:
∂ Bank’s Directors, Officers, Stockholders and their Related Interests (DOSRI) as defined perBSP’s existing DOSRI rules and regulations;
∂ Close Family Members (i.e. 2nd degree relatives) of the Bank’s Directors, Officers with rank ofSVP and up and Individual Substantial Stockholders;
∂ Bank’s Subsidiaries and Affiliates as defined per BSP’s existing rules and regulations on lendingto subsidiaries and affiliates;
∂ Any party that the Bank exerts direct or indirect control over or that exerts direct or indirectcontrol over the Bank;
∂ Subsidiaries, Affiliates and Special Purpose Entities (SPEs) of any party that the Bank exertsdirect or indirect control over or that exerts direct or indirect control over the Bank;
∂ Corresponding Persons in Affiliated Companies as defined in the Bank's Related PartyTransaction (RPT) Policy; and
∂ Any natural person or juridical entity whose interest may pose potential conflict with the Bank’sinterest.
Notes to Financial Statements
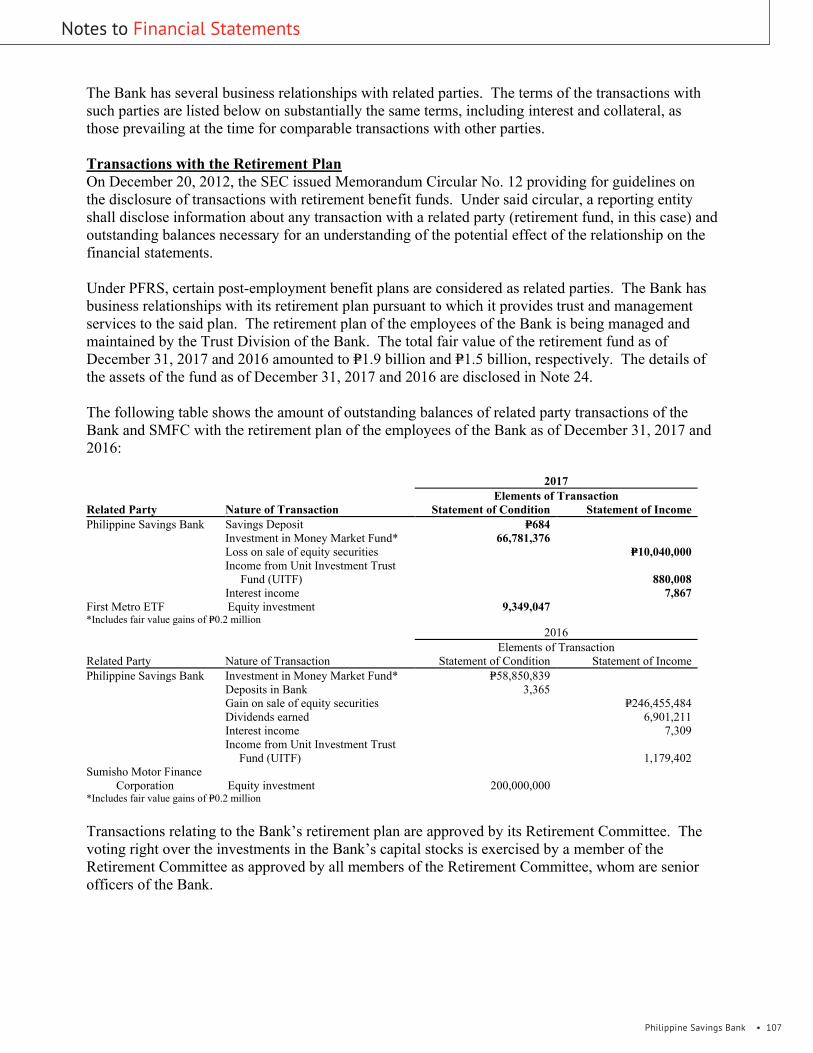
Philippine Savings Bank • 107
Notes to Financial Statements - 84 -
*SGVFS026939*
The Bank has several business relationships with related parties. The terms of the transactions withsuch parties are listed below on substantially the same terms, including interest and collateral, asthose prevailing at the time for comparable transactions with other parties.
Transactions with the Retirement PlanOn December 20, 2012, the SEC issued Memorandum Circular No. 12 providing for guidelines onthe disclosure of transactions with retirement benefit funds. Under said circular, a reporting entityshall disclose information about any transaction with a related party (retirement fund, in this case) andoutstanding balances necessary for an understanding of the potential effect of the relationship on thefinancial statements.
Under PFRS, certain post-employment benefit plans are considered as related parties. The Bank hasbusiness relationships with its retirement plan pursuant to which it provides trust and managementservices to the said plan. The retirement plan of the employees of the Bank is being managed andmaintained by the Trust Division of the Bank. The total fair value of the retirement fund as ofDecember 31, 2017 and 2016 amounted to P=1.9 billion and P=1.5 billion, respectively. The details ofthe assets of the fund as of December 31, 2017 and 2016 are disclosed in Note 24.
The following table shows the amount of outstanding balances of related party transactions of theBank and SMFC with the retirement plan of the employees of the Bank as of December 31, 2017 and2016:
2017Elements of Transaction
Related Party Nature of Transaction Statement of Condition Statement of IncomePhilippine Savings Bank Savings Deposit P=684
Investment in Money Market Fund* 66,781,376Loss on sale of equity securities P=10,040,000Income from Unit Investment Trust
Fund (UITF) 880,008Interest income 7,867
First Metro ETF Equity investment 9,349,047*Includes fair value gains of P=0.2 million
2016Elements of Transaction
Related Party Nature of Transaction Statement of Condition Statement of IncomePhilippine Savings Bank Investment in Money Market Fund* P=58,850,839
Deposits in Bank 3,365Gain on sale of equity securities P=246,455,484Dividends earned 6,901,211Interest income 7,309Income from Unit Investment Trust
Fund (UITF) 1,179,402Sumisho Motor Finance
Corporation Equity investment 200,000,000*Includes fair value gains of P=0.2 million
Transactions relating to the Bank’s retirement plan are approved by its Retirement Committee. Thevoting right over the investments in the Bank’s capital stocks is exercised by a member of theRetirement Committee as approved by all members of the Retirement Committee, whom are seniorofficers of the Bank.

108 • 2017 Annual Report •
- 85 -
*SGVFS026939*
Remunerations of Directors and Other Key Management PersonnelKey management personnel are those persons having authority and responsibility for planning,directing and controlling the activities of the Bank, directly or indirectly. The Bank considers themembers of the Management Committee to constitute key management personnel for purposes ofPAS 24, Related Party Disclosures.
Total remunerations of key management personnel (covering assistant vice presidents and up)included under ‘Compensation and fringe benefits’ in the statements of income are as follows:
2017 2016Short-term employee benefits P=253,953,306 P=250,805,503Post-employment pension benefits 7,858,066 6,356,856
P=261,811,372 P=257,162,359
Short-term employee benefits include salaries and other non-monetary benefits.
Remunerations given to directors, as approved by the Board Remuneration Committee, amounted toP=19.3 million, P=16.7 million, and P=16.9 million in 2017, 2016 and 2015, respectively.
The Bank also provides banking services to Directors and other key management personnel andpersons connected to them.
Other Related Party TransactionsOther related party transactions of the Bank by category of related party are presented below.The following tables show the amount and outstanding balances included in the financial statements(in thousands):
December 31, 2017
CategoryAmount/Volume
OutstandingBalance Nature, Terms and Conditions
Significant InvestorInterbank loans receivable Peso-denominated lending with 2.50% fixed interest rates
and maturities ranging from 1 to 3 days Placements P=19,970,000 P=– Maturities 19,970,000 –Due from other banks (540,032) 912,745 Peso-denominated lending with 2.50% fixed interest rates
and maturities ranging from 360 daysAccounts receivable 10,802 17,651 Outstanding ATM service fees, rental and utility
receivables, non interest bearing; no impairmentMiscellaneous assets – 781 Security deposits on lease contractsBills payable – Peso-denominated borrowing with fixed interest rate of Deposits/placements 1,285,000 – 2.50% and maturities ranging from 1 to 3 days Withdrawals/maturities 1,285,000 –Miscellaneous liabilities – 6,242 Advance payments of security depositsAccrued other expense payable – 37,732 Outstanding information technology expense payable,
charges on current and savings accounts processingInterest income 2,494 – Income on deposits and interbank loans receivablesRental income 18,384 – Income from leasing agreements with various lease terms
ranging from 2 to 5 yearsMiscellaneous income 7,502 – Income received from ATM service fees, rental and utilitiesInformation technology expense 95,662 – Payment of information technology expensesTrading and security loss (3,898) – Loss from securities transactionsInterest expense 256 – Interest expense on bills payable
(Forward)
Notes to Financial Statements - 85 -
*SGVFS026939*
Remunerations of Directors and Other Key Management PersonnelKey management personnel are those persons having authority and responsibility for planning,directing and controlling the activities of the Bank, directly or indirectly. The Bank considers themembers of the Management Committee to constitute key management personnel for purposes ofPAS 24, Related Party Disclosures.
Total remunerations of key management personnel (covering assistant vice presidents and up)included under ‘Compensation and fringe benefits’ in the statements of income are as follows:
2017 2016Short-term employee benefits P=253,953,306 P=250,805,503Post-employment pension benefits 7,858,066 6,356,856
P=261,811,372 P=257,162,359
Short-term employee benefits include salaries and other non-monetary benefits.
Remunerations given to directors, as approved by the Board Remuneration Committee, amounted toP=19.3 million, P=16.7 million, and P=16.9 million in 2017, 2016 and 2015, respectively.
The Bank also provides banking services to Directors and other key management personnel andpersons connected to them.
Other Related Party TransactionsOther related party transactions of the Bank by category of related party are presented below.The following tables show the amount and outstanding balances included in the financial statements(in thousands):
December 31, 2017
CategoryAmount/Volume
OutstandingBalance Nature, Terms and Conditions
Significant InvestorInterbank loans receivable Peso-denominated lending with 2.50% fixed interest rates
and maturities ranging from 1 to 3 days Placements P=19,970,000 P=– Maturities 19,970,000 –Due from other banks (540,032) 912,745 Peso-denominated lending with 2.50% fixed interest rates
and maturities ranging from 360 daysAccounts receivable 10,802 17,651 Outstanding ATM service fees, rental and utility
receivables, non interest bearing; no impairmentMiscellaneous assets – 781 Security deposits on lease contractsBills payable – Peso-denominated borrowing with fixed interest rate of Deposits/placements 1,285,000 – 2.50% and maturities ranging from 1 to 3 days Withdrawals/maturities 1,285,000 –Miscellaneous liabilities – 6,242 Advance payments of security depositsAccrued other expense payable – 37,732 Outstanding information technology expense payable,
charges on current and savings accounts processingInterest income 2,494 – Income on deposits and interbank loans receivablesRental income 18,384 – Income from leasing agreements with various lease terms
ranging from 2 to 5 yearsMiscellaneous income 7,502 – Income received from ATM service fees, rental and utilitiesInformation technology expense 95,662 – Payment of information technology expensesTrading and security loss (3,898) – Loss from securities transactionsInterest expense 256 – Interest expense on bills payable
(Forward)

Philippine Savings Bank • 109
Notes to Financial Statements - 86 -
*SGVFS026939*
December 31, 2017
CategoryAmount/Volume
OutstandingBalance Nature, Terms and Conditions
Securities transactions Outright purchases P=8,493,345 – Outright purchase of FVPL, AFS and HTM investments Outright sales 4,920,695 – Outright sale of FVPL and AFS investments
Joint VentureInvestment in a joint venture – P=607,163 Capital investment in SMFC after sale of 10% ownership to
GT Capital Inc.Accounts receivable 1,466 1,980 Outstanding rental and utility receivables, non-interest
bearingDeposit liabilities 934 13,321 Demand and short term peso time-deposits with annual
fixed rates of 1.25%Miscelleneous liabilities (2,975) – Payment of security depositsRental income 11,619 – Income from leasing agreementsShare in net income of a joint venture 71,837 – 40.00% (January to July) and 30% (August to December)
share in net income of SMFCInterest expense 75 – Interest on deposit liabilities
Other Related PartiesInterbank loans receivable –
59,900,00059,400,000
500,000 Peso-denominated lending which earn 2.50% fixed dailyPlacements – interest rate with maturity terms from 1 to 5 days.Maturities –
Receivable from customers 10,241 Loans granted bear interest ranging from 6.00% to Placements Maturities
3,7232,817
– 10.50% with maturities ranging from 1 to 5 years; Secured - P=10,241
Miscellaneous assets – 1,390 Three months advance security depositsAccounts receivable 16 2,470 Outstanding ATM service fees, rental and utility
receivables, non interest bearingPrepaid expense 4,125 Payment for various policy renewalsDeposit liabilities 5,073,694 1,612,687 Demand, savings and short term peso and foreign currency
time deposits with fixed rates ranging from 0.00% to2.00%
Bills payable Peso-denominated borrowing with fixed interest rate of Deposits/placements 4,750,000 – 2.50% and maturities ranging from 1 to 4 days Withdrawals/maturities 4,750,000 –Accounts payable – 2,617 Various personal and car insurance payableMiscellaneous liabilities – 3,169 Advance payment of security deposits from various tenantsInterest income 3,445 – Income on receivables from customers and interbank loans
receivablesTrading and securities loss 2,836 – Loss from securities transactionsRental income 13,690 – Income from leasing agreements with various lease termsBank commission 1,396 – Commission income on ATM service feesMiscellaneous income 13,107 – Service income from referral fees on approved credit card
issuances and bank insurance with rates ranging from2.00% to 10.00%
Insurance expense 79,790 – Payment of insurance premiumInterest expense 35,350 – Interest on deposit liabilities and bills payableRent expense 1,025 – Payment of rent expense to various lessorsSecurities transactions Outright purchases 2,065,340 – Outright purchase of FVPL and AFS investments Outright sales 1,000,000 – Outright sale of FVPL and AFS investmentsKey PersonnelReceivables from customers – P=13,069 Unsecured, no impairment, with annual fixed interest Placements P=2,815 – rates of 6.00% and maturities ranging from 2 to 10 years Maturities 3,554 –Interest income 973 – Interest income from loans

110 • 2017 Annual Report •
- 87 -
*SGVFS026939*
December 31, 2016
CategoryAmount/Volume
OutstandingBalance Nature, Terms and Conditions
Significant InvestorInterbank loans receivable Peso-denominated lending with 2.50% fixed interest rates
and maturities ranging from 1 to 3 days Placements P=26,450,000 P=– Maturities 26,450,000 –Due from other banks 418,071 1,452,777 Short-term peso and foreign currency-denominated deposits
with fixed rates ranging from 0.00% to 5.00% securedby government securities amounting to P=788,154
Accounts receivable 216 6,849 Outstanding ATM service fees, rental and utilityreceivables, non interest bearing; no impairment
Miscellaneous assets – 781 Security deposits on lease contractsBills payable – Peso-denominated borrowing with fixed interest rate of Deposits/placements 14,526,000 2.50% and maturities ranging from 1 to 4 days Withdrawals/maturities 14,526,000Miscellaneous liabilities – 6,242 Advance payments of security depositsAccrued other expense payable – 57,590 Outstanding information technology expense payable,
charges on current and savings accounts processingInterest income 4,077 – Income on deposits and interbank loans receivablesRental income 24,775 – Income from leasing agreements with various lease terms
ranging from 2 to 5 yearsMiscellaneous income 6,022 – Income received from ATM service fees, rental and utilitiesInformation technology expense 263,263 – Payment of information technology expensesTrading and security loss 6,937 – Loss from securities transactionsInterest expense 2,144 – Interest expense on bills payableSecurities transactions – Outright purchases 6,374,152 Outright purchase of FVPL, AFS and HTM investments Outright sales 2,611,040 Outright sale of FVPL and AFS investments
Joint VentureInvestment in a joint venture 727,176 Capital investment in SMFCAccounts receivable (38) 514 Outstanding rental and utility receivables, non-interest
bearingDeposit liabilities 7,318 12,387 Demand and short term peso time-deposits with annual
fixed rates of 1.25%Miscellaneous liabilities – 2,975 Advance payment of security depositsRental income 11,460 – Income from leasing agreementsShare in net income of a joint venture 35,467 – 40.00% share in net income of SMFCInterest expense 47 – Interest on deposit liabilities
Other Related PartiesInterbank loans receivable
11,800,00011,800,000
– Peso-denominated lending which earn 2.50% fixed dailyPlacements interest rate with maturity terms from 1 to 5 days.Maturities
Receivable from customers14,715
383,987
12,252 Loans granted bear interest ranging from 7.00% to Placements Maturities
19.14% with maturities ranging from 1 to 2 years;Secured - P=12,252
Miscellaneous assets 1,390 Three months advance security depositsAccounts receivable 621 2,454 Outstanding ATM service fees, rental and utility
receivables, non interest bearingPrepaid expense 8,600 Payment for various policy renewalsDeposit liabilities 2,494,936 6,686,381 Demand, savings and short term peso and foreign currency
time deposits with fixed rates ranging from 0.00% to2.00%
Bills payable 900,000 Peso-denominated borrowing with fixed interest rate of Deposits/placements 10,630,000 2.50% and maturities ranging from 1 to 4 days Withdrawals/maturities 9,730,000Accrued other expense payable 3,231 Outstanding group life insurance payableAccounts payable 174 Various personal and car insurance payableMiscellaneous liabilities 3,169 Advance payment of security deposits from various tenantsInterest income 1,251 – Income on receivables from customers and interbank loans
receivablesTrading and securities gain 2,590 – Gain from securities transactionsRental income 12,967 – Income from leasing agreements with various lease termsBank commission 4,629 – Commission income on ATM service feesMiscellaneous income 1,020 – Service income from referral fees on approved credit card
issuances and bank insurance with rates ranging from2.00% to 10.00%
(Forward)
Notes to Financial Statements

Philippine Savings Bank • 111
Notes to Financial Statements - 88 -
*SGVFS026939*
December 31, 2016
CategoryAmount/Volume
OutstandingBalance Nature, Terms and Conditions
Insurance expense P=53,946 P=– Payment of insurance premiumInterest expense 179,408 – Interest on deposit liabilities and bills payableRent expense 3,410 – Payment of rent expense to various lessorsSecurities transactions – Outright purchases 650,000 Outright purchase of FVPL and AFS investments Outright sales 650,000 Outright sale of FVPL and AFS investmentsKey Personnel
Receivables from customers P=13,808 Unsecured, no impairment, with annual fixed interest Placements P=2,528 rates of 6.00% and maturities ranging from 2 to 10 years Maturities 559Interest income 814 Interest income from loans
Regulatory ReportingAs required under existing BSP rules and regulations, the Bank discloses loans and other creditaccommodations granted to its Directors, Officers, Stockholders and Related Interests (DOSRI).These loans and other credit accommodations were made substantially on the same terms as withother individuals and businesses of comparable risks and were subject of prior Board approval andentailing BSP reportorial requirements.
Existing banking regulations also limit the total amount of credit exposure to each of the Bank’sDOSRIs, at least 70.00% of which must be secured, to the total of their respective deposits and bookvalue of their respective unencumbered deposits and, if any, book value of their respective paid-incapital contribution in the Bank. In the aggregate, the Bank’s total credit exposure to all its DOSRIsshould not exceed its net worth or 15.00% of its total loan portfolio, whichever is lower, with anyunsecured portion thereof not exceeding the lower between 30.00% of the aggregate limit or of thetotal actual exposure. However, loans and other credit accommodations to DOSRIs that are securedby assets considered by the BSP as non-risk are exempt from these ceilings. As ofDecember 31, 2017 and 2016, the Bank's credit exposures to DOSRI are within the said regulatorylimits.
BSP Circular No. 423 dated March 15, 2004, as amended by BSP Circular No. 914 datedJune 23, 2016, provide the rules and regulations governing credit exposures to DOSRI. Thefollowing table shows information relating to the loans, other credit accommodations and guaranteesclassified as DOSRI accounts under regulations existing prior to BSP Circular No. 423 and newDOSRI loans and other credit accommodations granted under said circular as of December 31, 2017and 2016:
2017 2016Total outstanding DOSRI accounts P=1,201,916,069 P=1,734,454,266Percent of DOSRI accounts granted under regulations
existing prior to BSP Circular No. 423 to total loans 0.82% 1.34%Percent of new DOSRI accounts granted under BSP
Circular No. 423 to total loans – –Percent of unsecured DOSRI accounts to total DOSRI
accounts 19.94% 12.63%Percent of past due DOSRI accounts to total
DOSRI accounts 0.00% 0.00%Percent of nonperforming DOSRI accounts to
total DOSRI accounts 0.00% 0.00%
Total interest income from DOSRI loans amounted to P=5.8 million, P=26.6 million, P=44.7 million in2017, 2016 and 2015, respectively.
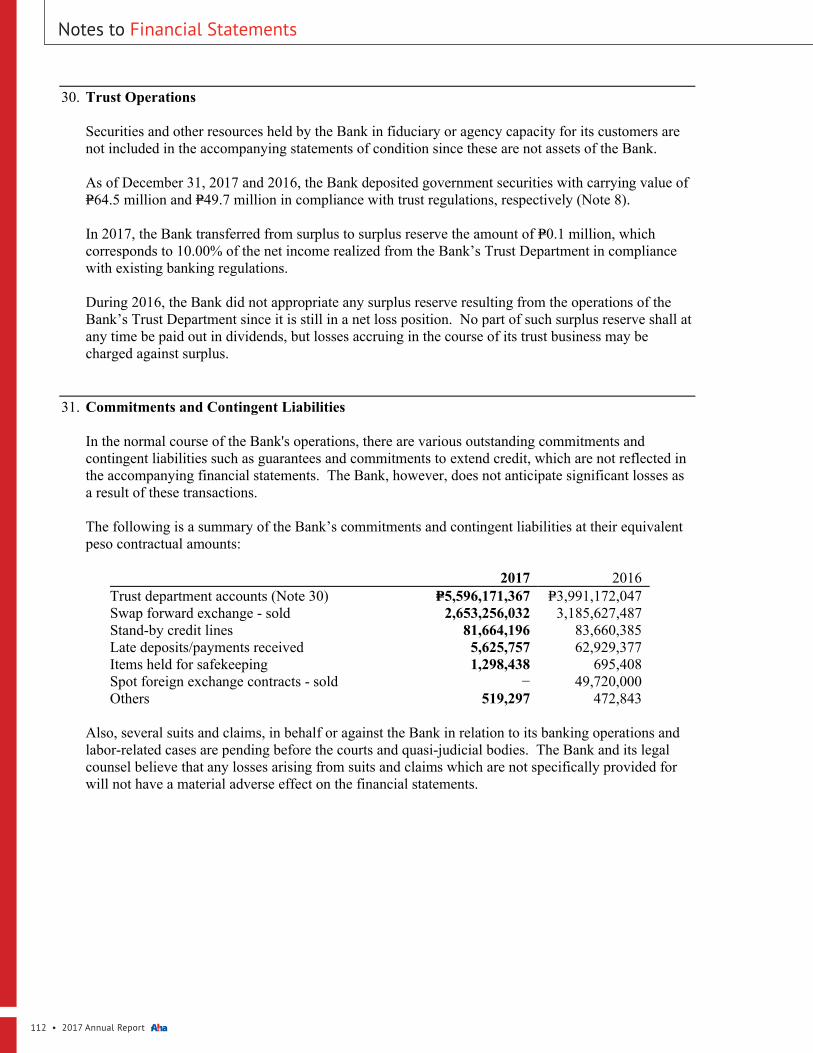
112 • 2017 Annual Report •
- 89 -
*SGVFS026939*
30. Trust Operations
Securities and other resources held by the Bank in fiduciary or agency capacity for its customers arenot included in the accompanying statements of condition since these are not assets of the Bank.
As of December 31, 2017 and 2016, the Bank deposited government securities with carrying value ofP=64.5 million and P=49.7 million in compliance with trust regulations, respectively (Note 8).
In 2017, the Bank transferred from surplus to surplus reserve the amount of P=0.1 million, whichcorresponds to 10.00% of the net income realized from the Bank’s Trust Department in compliancewith existing banking regulations.
During 2016, the Bank did not appropriate any surplus reserve resulting from the operations of theBank’s Trust Department since it is still in a net loss position. No part of such surplus reserve shall atany time be paid out in dividends, but losses accruing in the course of its trust business may becharged against surplus.
31. Commitments and Contingent Liabilities
In the normal course of the Bank's operations, there are various outstanding commitments andcontingent liabilities such as guarantees and commitments to extend credit, which are not reflected inthe accompanying financial statements. The Bank, however, does not anticipate significant losses asa result of these transactions.
The following is a summary of the Bank’s commitments and contingent liabilities at their equivalentpeso contractual amounts:
2017 2016Trust department accounts (Note 30) P=5,596,171,367 P=3,991,172,047Swap forward exchange - sold 2,653,256,032 3,185,627,487Stand-by credit lines 81,664,196 83,660,385Late deposits/payments received 5,625,757 62,929,377Items held for safekeeping 1,298,438 695,408Spot foreign exchange contracts - sold − 49,720,000Others 519,297 472,843
Also, several suits and claims, in behalf or against the Bank in relation to its banking operations andlabor-related cases are pending before the courts and quasi-judicial bodies. The Bank and its legalcounsel believe that any losses arising from suits and claims which are not specifically provided forwill not have a material adverse effect on the financial statements.
Notes to Financial Statements
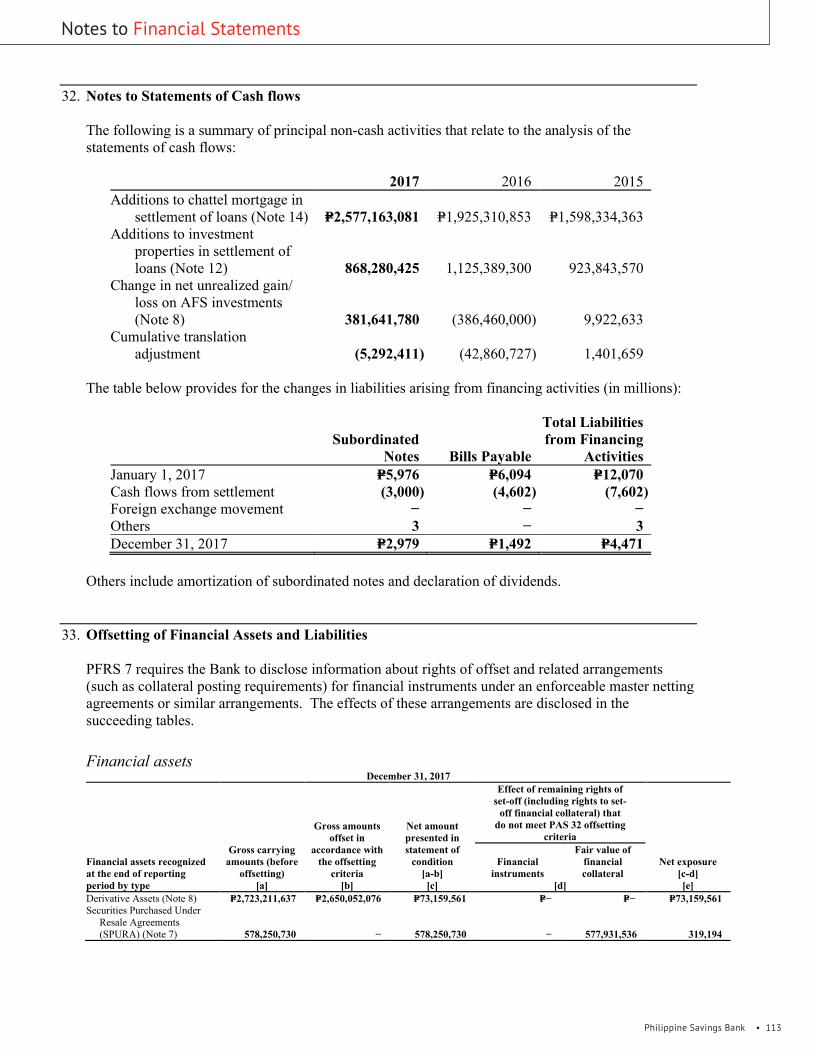
Philippine Savings Bank • 113
Notes to Financial Statements- 90 -
*SGVFS026939*
32. Notes to Statements of Cash flows
The following is a summary of principal non-cash activities that relate to the analysis of thestatements of cash flows:
2017 2016 2015Additions to chattel mortgage in
settlement of loans (Note 14) P=2,577,163,081 P=1,925,310,853 P=1,598,334,363Additions to investment
properties in settlement ofloans (Note 12) 868,280,425 1,125,389,300 923,843,570
Change in net unrealized gain/loss on AFS investments(Note 8) 381,641,780 (386,460,000) 9,922,633
Cumulative translationadjustment (5,292,411) (42,860,727) 1,401,659
The table below provides for the changes in liabilities arising from financing activities (in millions):
SubordinatedNotes Bills Payable
Total Liabilitiesfrom Financing
ActivitiesJanuary 1, 2017 P=5,976 P=6,094 P=12,070Cash flows from settlement (3,000) (4,602) (7,602)Foreign exchange movement − − −Others 3 − 3December 31, 2017 P=2,979 P=1,492 P=4,471
Others include amortization of subordinated notes and declaration of dividends.
33. Offsetting of Financial Assets and Liabilities
PFRS 7 requires the Bank to disclose information about rights of offset and related arrangements(such as collateral posting requirements) for financial instruments under an enforceable master nettingagreements or similar arrangements. The effects of these arrangements are disclosed in thesucceeding tables.
Financial assetsDecember 31, 2017
Financial assets recognizedat the end of reportingperiod by type
Gross carryingamounts (before
offsetting)
Gross amountsoffset in
accordance withthe offsetting
criteria
Net amountpresented instatement of
condition[a-b]
Effect of remaining rights ofset-off (including rights to set-
off financial collateral) thatdo not meet PAS 32 offsetting
criteria
Net exposure[c-d]
Financialinstruments
Fair value offinancialcollateral
[a] [b] [c] [d] [e]Derivative Assets (Note 8) P=2,723,211,637 P=2,650,052,076 P=73,159,561 P=− P=− P=73,159,561Securities Purchased Under
Resale Agreements(SPURA) (Note 7) 578,250,730 − 578,250,730 − 577,931,536 319,194
- 90 -
*SGVFS026939*
32. Notes to Statements of Cash flows
The following is a summary of principal non-cash activities that relate to the analysis of thestatements of cash flows:
2017 2016 2015Additions to chattel mortgage in
settlement of loans (Note 14) P=2,577,163,081 P=1,925,310,853 P=1,598,334,363Additions to investment
properties in settlement ofloans (Note 12) 868,280,425 1,125,389,300 923,843,570
Change in net unrealized gain/loss on AFS investments(Note 8) 381,641,780 (386,460,000) 9,922,633
Cumulative translationadjustment (5,292,411) (42,860,727) 1,401,659
The table below provides for the changes in liabilities arising from financing activities (in millions):
SubordinatedNotes Bills Payable
Total Liabilitiesfrom Financing
ActivitiesJanuary 1, 2017 P=5,976 P=6,094 P=12,070Cash flows from settlement (3,000) (4,602) (7,602)Foreign exchange movement − − −Others 3 − 3December 31, 2017 P=2,979 P=1,492 P=4,471
Others include amortization of subordinated notes and declaration of dividends.
33. Offsetting of Financial Assets and Liabilities
PFRS 7 requires the Bank to disclose information about rights of offset and related arrangements(such as collateral posting requirements) for financial instruments under an enforceable master nettingagreements or similar arrangements. The effects of these arrangements are disclosed in thesucceeding tables.
Financial assetsDecember 31, 2017
Financial assets recognizedat the end of reportingperiod by type
Gross carryingamounts (before
offsetting)
Gross amountsoffset in
accordance withthe offsetting
criteria
Net amountpresented instatement of
condition[a-b]
Effect of remaining rights ofset-off (including rights to set-
off financial collateral) thatdo not meet PAS 32 offsetting
criteria
Net exposure[c-d]
Financialinstruments
Fair value offinancialcollateral
[a] [b] [c] [d] [e]Derivative Assets (Note 8) P=2,723,211,637 P=2,650,052,076 P=73,159,561 P=− P=− P=73,159,561Securities Purchased Under
Resale Agreements(SPURA) (Note 7) 578,250,730 − 578,250,730 − 577,931,536 319,194
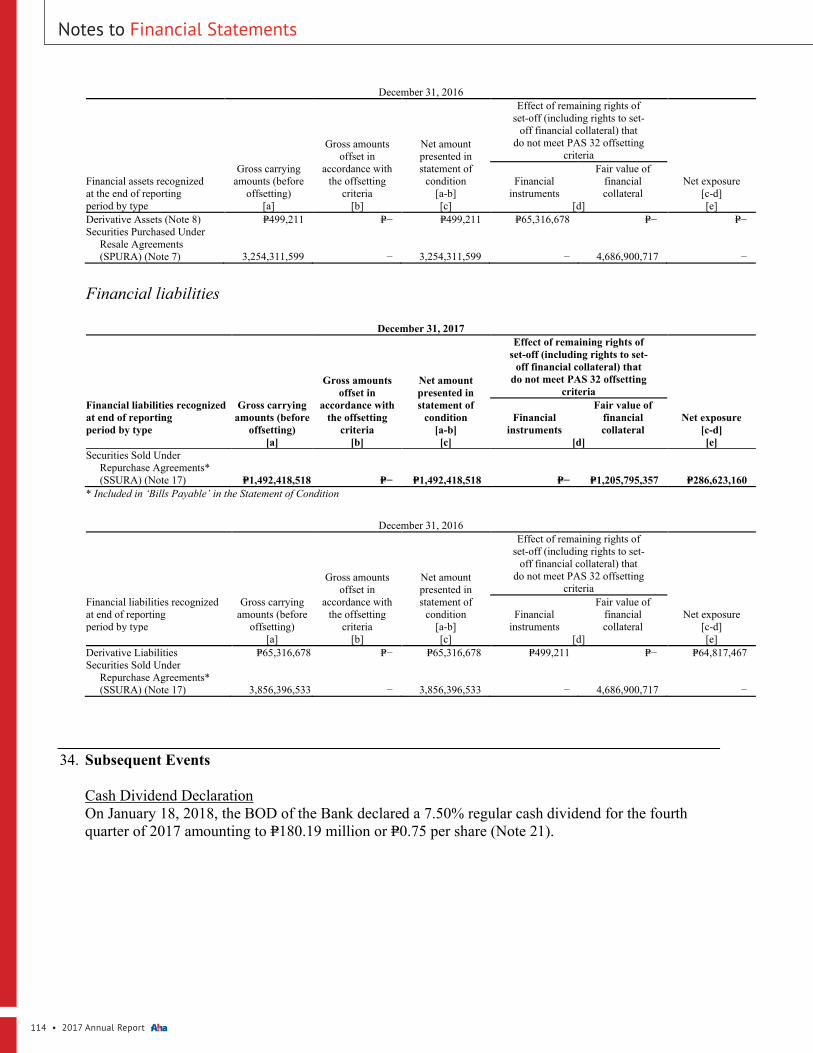
114 • 2017 Annual Report •
- 91 -
*SGVFS026939*
December 31, 2016
Financial assets recognizedat the end of reportingperiod by type
Gross carryingamounts (before
offsetting)
Gross amountsoffset in
accordance withthe offsetting
criteria
Net amountpresented instatement of
condition[a-b]
Effect of remaining rights ofset-off (including rights to set-
off financial collateral) thatdo not meet PAS 32 offsetting
criteria
Net exposure[c-d]
Financialinstruments
Fair value offinancialcollateral
[a] [b] [c] [d] [e]Derivative Assets (Note 8) P=499,211 P=− P=499,211 P=65,316,678 P=− P=−Securities Purchased Under
Resale Agreements(SPURA) (Note 7) 3,254,311,599 − 3,254,311,599 − 4,686,900,717 −
Financial liabilities
December 31, 2017
Financial liabilities recognizedat end of reportingperiod by type
Gross carryingamounts (before
offsetting)
Gross amountsoffset in
accordance withthe offsetting
criteria
Net amountpresented instatement of
condition[a-b]
Effect of remaining rights ofset-off (including rights to set-
off financial collateral) thatdo not meet PAS 32 offsetting
criteria
Net exposure[c-d]
Financialinstruments
Fair value offinancialcollateral
[a] [b] [c] [d] [e]Securities Sold Under
Repurchase Agreements*(SSURA) (Note 17) P=1,492,418,518 P=− P=1,492,418,518 P=− P=1,205,795,357 P=286,623,160
* Included in ‘Bills Payable’ in the Statement of Condition
December 31, 2016
Financial liabilities recognizedat end of reportingperiod by type
Gross carryingamounts (before
offsetting)
Gross amountsoffset in
accordance withthe offsetting
criteria
Net amountpresented instatement of
condition[a-b]
Effect of remaining rights ofset-off (including rights to set-
off financial collateral) thatdo not meet PAS 32 offsetting
criteria
Net exposure[c-d]
Financialinstruments
Fair value offinancialcollateral
[a] [b] [c] [d] [e]Derivative Liabilities P=65,316,678 P=− P=65,316,678 P=499,211 P=− P=64,817,467Securities Sold Under
Repurchase Agreements*(SSURA) (Note 17) 3,856,396,533 − 3,856,396,533 − 4,686,900,717 −
34. Subsequent Events
Cash Dividend DeclarationOn January 18, 2018, the BOD of the Bank declared a 7.50% regular cash dividend for the fourthquarter of 2017 amounting to P=180.19 million or P=0.75 per share (Note 21).
35. Approval for the Release of the Financial Statements
The accompanying comparative financial statements were reviewed by the Audit Committee onJanuary 25, 2018 and approved by the BOD in its meeting on February 22, 2018.
Notes to Financial Statements - 91 -
*SGVFS026939*
December 31, 2016
Financial assets recognizedat the end of reportingperiod by type
Gross carryingamounts (before
offsetting)
Gross amountsoffset in
accordance withthe offsetting
criteria
Net amountpresented instatement of
condition[a-b]
Effect of remaining rights ofset-off (including rights to set-
off financial collateral) thatdo not meet PAS 32 offsetting
criteria
Net exposure[c-d]
Financialinstruments
Fair value offinancialcollateral
[a] [b] [c] [d] [e]Derivative Assets (Note 8) P=499,211 P=− P=499,211 P=65,316,678 P=− P=−Securities Purchased Under
Resale Agreements(SPURA) (Note 7) 3,254,311,599 − 3,254,311,599 − 4,686,900,717 −
Financial liabilities
December 31, 2017
Financial liabilities recognizedat end of reportingperiod by type
Gross carryingamounts (before
offsetting)
Gross amountsoffset in
accordance withthe offsetting
criteria
Net amountpresented instatement of
condition[a-b]
Effect of remaining rights ofset-off (including rights to set-
off financial collateral) thatdo not meet PAS 32 offsetting
criteria
Net exposure[c-d]
Financialinstruments
Fair value offinancialcollateral
[a] [b] [c] [d] [e]Securities Sold Under
Repurchase Agreements*(SSURA) (Note 17) P=1,492,418,518 P=− P=1,492,418,518 P=− P=1,205,795,357 P=286,623,160
* Included in ‘Bills Payable’ in the Statement of Condition
December 31, 2016
Financial liabilities recognizedat end of reportingperiod by type
Gross carryingamounts (before
offsetting)
Gross amountsoffset in
accordance withthe offsetting
criteria
Net amountpresented instatement of
condition[a-b]
Effect of remaining rights ofset-off (including rights to set-
off financial collateral) thatdo not meet PAS 32 offsetting
criteria
Net exposure[c-d]
Financialinstruments
Fair value offinancialcollateral
[a] [b] [c] [d] [e]Derivative Liabilities P=65,316,678 P=− P=65,316,678 P=499,211 P=− P=64,817,467Securities Sold Under
Repurchase Agreements*(SSURA) (Note 17) 3,856,396,533 − 3,856,396,533 − 4,686,900,717 −
34. Subsequent Events
Cash Dividend DeclarationOn January 18, 2018, the BOD of the Bank declared a 7.50% regular cash dividend for the fourthquarter of 2017 amounting to P=180.19 million or P=0.75 per share (Note 21).
35. Approval for the Release of the Financial Statements
The accompanying comparative financial statements were reviewed by the Audit Committee onJanuary 25, 2018 and approved by the BOD in its meeting on February 22, 2018.

Philippine Savings Bank • 115
Notes to Financial Statements
- 92 -
*SGVFS026939*
36. Report on the Supplementary Information Required Under Revenue Regulations (RR)No. 15-2010
On November 25, 2010, the BIR issued RR No. 15-2010 to amend certain provisions ofRR No. 21-2002. The regulations provide that starting 2010, the notes to financial statements shallinclude information on taxes, duties and license fees paid or accrued during the taxable year.
The Bank reported and/or paid the following types of taxes for the year:
Taxes and LicensesFor the taxable year ended December 31, 2017, taxes and licenses of the Bank consist of:
Gross receipts tax P=655,407,895Documentary stamps tax 534,245,710Local taxes 72,187,567Fringe benefit tax 7,044,313Others 22,494
P=1,268,907,979
Withholding TaxesDetails of total remittances of withholding taxes in 2017 are as follows:
Withholding taxes on compensation and benefits P=554,116,959Final withholding taxes 489,445,015Expanded withholding taxes 99,945,753
P=1,143,507,727
The Bank has no ongoing tax assessment as of December 31, 2017.
- 91 -
*SGVFS026939*
December 31, 2016
Financial assets recognizedat the end of reportingperiod by type
Gross carryingamounts (before
offsetting)
Gross amountsoffset in
accordance withthe offsetting
criteria
Net amountpresented instatement of
condition[a-b]
Effect of remaining rights ofset-off (including rights to set-
off financial collateral) thatdo not meet PAS 32 offsetting
criteria
Net exposure[c-d]
Financialinstruments
Fair value offinancialcollateral
[a] [b] [c] [d] [e]Derivative Assets (Note 8) P=499,211 P=− P=499,211 P=65,316,678 P=− P=−Securities Purchased Under
Resale Agreements(SPURA) (Note 7) 3,254,311,599 − 3,254,311,599 − 4,686,900,717 −
Financial liabilities
December 31, 2017
Financial liabilities recognizedat end of reportingperiod by type
Gross carryingamounts (before
offsetting)
Gross amountsoffset in
accordance withthe offsetting
criteria
Net amountpresented instatement of
condition[a-b]
Effect of remaining rights ofset-off (including rights to set-
off financial collateral) thatdo not meet PAS 32 offsetting
criteria
Net exposure[c-d]
Financialinstruments
Fair value offinancialcollateral
[a] [b] [c] [d] [e]Securities Sold Under
Repurchase Agreements*(SSURA) (Note 17) P=1,492,418,518 P=− P=1,492,418,518 P=− P=1,205,795,357 P=286,623,160
* Included in ‘Bills Payable’ in the Statement of Condition
December 31, 2016
Financial liabilities recognizedat end of reportingperiod by type
Gross carryingamounts (before
offsetting)
Gross amountsoffset in
accordance withthe offsetting
criteria
Net amountpresented instatement of
condition[a-b]
Effect of remaining rights ofset-off (including rights to set-
off financial collateral) thatdo not meet PAS 32 offsetting
criteria
Net exposure[c-d]
Financialinstruments
Fair value offinancialcollateral
[a] [b] [c] [d] [e]Derivative Liabilities P=65,316,678 P=− P=65,316,678 P=499,211 P=− P=64,817,467Securities Sold Under
Repurchase Agreements*(SSURA) (Note 17) 3,856,396,533 − 3,856,396,533 − 4,686,900,717 −
34. Subsequent Events
Cash Dividend DeclarationOn January 18, 2018, the BOD of the Bank declared a 7.50% regular cash dividend for the fourthquarter of 2017 amounting to P=180.19 million or P=0.75 per share (Note 21).
35. Approval for the Release of the Financial Statements
The accompanying comparative financial statements were reviewed by the Audit Committee onJanuary 25, 2018 and approved by the BOD in its meeting on February 22, 2018.

116 • 2017 Annual Report •
Shareholders Information
Corporate Information
Philippine Savings BankPSBank Center777 Paseo de Roxas corner Sedeño StreetMakati City 1226 PhilippinesTel: (+632) 845-8888Website: www.psbank.com.ph
Annual Shareholders’ MeetingMonday, 23 April 2018, 3:00 p.m.PSBank Hall, 19th Floor PSBank Center777 Paseo de Roxas corner Sedeño StreetMakati City 1226 Philippines
Stock ListingPhilippine Savings Bank (PSBank) common sharesare listed and traded at the Philippine Stock Exchange under the ticker symbol “PSB.”
ShareholdersThe number of common shareholders of recordas of 02 March 2018 was 1,475.
Major ShareholderMetropolitan Bank & Trust CompanyPercentage of Stockholdings: 82.675%Nationality: Filipino
Market InformationFollowing are the high and low closing prices of the PSB shares as reported in the PSE for each quarter of the years ending in 2016 and 2017:
Years Quarters Highest Lowest
2016 1st 104.00 95.00
2nd 107.00 98.10
3rd 106.00 95.75
4th 101.00 90.00
2017 1st 91.00 87.00
2nd 90.50 86.50
3rd 92.00 87.65
4th 90.00 87.00
Annual Report in SEC Form 17-AThe financial report included in this report follows the information contained in the Bank’s SEC Form 17-A as required by and submitted to the Securities and Exchange Commission. Copies of this report may be obtained free of charge upon written request to the Office of the Finance Group Head.
Shareholder Assistance and Services
Investor RelationsCorporate Affairs Division9th Floor PSBank Center777 Paseo de Roxas corner Sedeño StreetMakati City 1226 PhilippinesTel: (+632) 845-8888Fax: (+632) 885-8352Email: [email protected]
MediaPR & Corporate Communications Division8th Floor PSBank Center777 Paseo de Roxas corner Sedeño StreetMakati City 1226 PhilippinesTel: (+632) 845-8888Fax: (+632) 845-0025
For inquiries or concerns:Customer Experience Group6th Floor PSBank Center777 Paseo de Roxas corner Sedeño StreetMakati City 1226 PhilippinesTel: (+632) 845-8888Fax: (+632) 845-0048SMS: (+63) 998-8458888Email: [email protected]: www.psbank.com.ph
Stockholder ServicesFor inquiries regarding dividend payments,change of address or account status:Metrobank Trust Banking - Stock Transfer Department17th Floor GT Tower International6813 Ayala Avenue corner H.V. Dela Costa StreetMakati City 1227 PhilippinesTel: (+632) 857-5695
Fax: (+632) 858-8010

Philippine Savings Bank • 117

118 • 2017 Annual Report •
PSBank Center, 777 Paseo de Roxas corner Sedeño Sts. Makati City 1226 Philippines
www.psbank.com.ph
Customer Experience Hotline: (02) 845-8888
PSBank LiveChat via www.psbank.com.ph
PSBankOfficialView the annual report online
by scanning this QR code.
CREDITS
Publisher
Philippine Savings Bank
Editor in Chief
Noel Tuazon
Editorial
Sheila Pesayco
Katt Pascual
Layout & Design
Jer Macasero
Photography
Albert Labrador
Revoli Cortez
Kai Huang
Project Managers
Jean Salvador
Kae Tamase
Agency
Writers Edge