that’s the assumption we’ve made… vera eory, kairsty topp, dominic moran, adam butler...
TRANSCRIPT
That’s the assumption we’ve made…
Vera Eory, Kairsty Topp, Dominic Moran, Adam Butler
29/9/2015, Edinburgh
Royal Statistical Society Seminar

22
Our mitigation targets
Aim:- 42%
So far:- 23% All other
sectors 81%
Agriculture19%
CO2
N2O
CH4
Scottish Government, 2013

33
Sources of agricultural GHG emissions
http://www.farmingfutures.org.uk/
• CH4: anaerobic decomposition of organic matter
– Enteric fermentation
– Manure management
– Rice
• N2O: microbial transformation of N in soils and manures
– Manure and organic matter application to land
– Synthetic fertiliser application to land
– Grazing (urine)
• CO2: fossil fuel combustion and soil carbon degradation
– On-farm energy use (field operations, animal housing etc.)
– Changes in above and below ground C stocks

44
Assessment of mitigation policies
• Aspects:
– Economic: At what cost? How efficient?
– Distributional: Who loses, who gains?
– Environmental: How much mitigation? Are there any
negative or positive co-effects?
– Institutional: Transaction costs? How to monitor?

55
Marginal abatement cost curves
• Economic rationale
• How do they help?– Identify the most cost-effective ways of meeting the
targets – within and between sectors– Identify options that cost less than the marginal benefit
from abatement (e.g. Shadow Price of Carbon (SPC))
Marginal abatement costMarginal benefit from
abatement
Abatement
Ma
rgin
al c
ost
M
arg
ina
l be
ne
fit
Optimal abatement
Pearce and Turner 1989

66
An example MACC
UK MACC for 2022 (maximum technical potential)
MacLeod et al. 2010

7
Optimal pollution reduction
Marginal abatement cost curve , 95% confidence interval
Marginal benefit from abatement, 95% confidence interval
Abatement
Mar
gina
l cos
t
Optimal abatement, 95% confidence interval

8
MACC uncertainty assessment
Propagating estimated statistical uncertainty through an economic assessment model:• Agricultural MACC (marginal abatement cost curve)• Arable areas and managed grasslands (excl. livestock)• Scotland (2012 to 2022)
Output metrics:• Optimal abatement (cumulative abatement below the
shadow price of carbon (£29 / tCO2e))
• Ranking of each option

9
Mitigation options
• Avoiding nitrogen application in excess• Using manure nitrogen to its full extent• Reducing N nitrogen fertiliser• Improving the timing of mineral nitrogen application• Improving the timing of slurry and poultry manure application• Separating slurry applications from fertiliser applications by several days• Using composts, straw-based manures in preference to slurry• Using controlled release fertilisers• Using nitrification inhibitors• Using biological fixation to provide nitrogen inputs• Introducing of new species (including legumes)• Adopting plant varieties with improved N-use efficiency• Adopting systems less reliant on inputs• Using reduced tillage and no-till techniques• Improving land drainage
N2O
CO2

1010
Sources of uncertainty
• Main sources of uncertainty– Farmers’ uptake of mitigation practices, effects of policy
instruments
– Current emissions and mitigation effects of alternative practices (emission factors)
– Costs of changing farming practices and transaction costs
– Current and future agricultural activities and practices (effects of climate change, demographics, economics)
• Uncertainties in the…– unitary and total abatement of practices
– costs and the cost-effectiveness of practices
– ranking of the practices and the economically optimal level of abatement

11
Propagating statistical uncertainty
Monte Carlo simulations for all combinations of:• Year (2012, 2017, 2022)• Uptake scenario (low feasible, central feasible, high
feasible and maximum technical potential)
• Uncertainty source (N2O GWP, activity level, applicability, uptake, interaction factors, abatement rate, net cost, all seven sources combined)
• Uncertainty scenario (narrow, medium, wide)• Parametric distribution (censored normal, truncated
normal, triangular)
1212
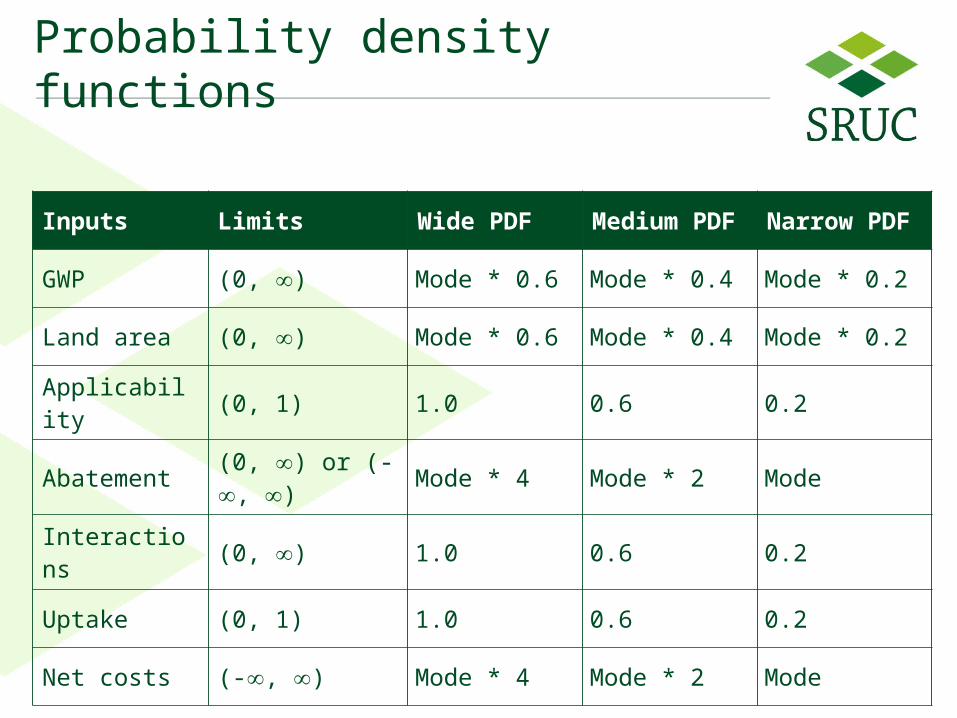
Probability density functions
Inputs Limits Wide PDF Medium PDF Narrow PDF
GWP (0, ) Mode * 0.6 Mode * 0.4 Mode * 0.2
Land area (0, ) Mode * 0.6 Mode * 0.4 Mode * 0.2
Applicability (0, 1) 1.0 0.6 0.2
Abatement (0, ) or (-, ) Mode * 4 Mode * 2 Mode
Interactions (0, ) 1.0 0.6 0.2
Uptake (0, 1) 1.0 0.6 0.2
Net costs (-, ) Mode * 4 Mode * 2 Mode

1313
(kt CO2e/y)
Narrow PDFs
Medium PDFs
Wide PDFs
(2022, central feasible potential, all sources combined, truncated normal distributions)
Results: uncertainty of the optimal abatement
Original studypro
babili
ty

1414
Results: parametric model and uncertainty scenario
Narrow PDFs Medium PDFs Wide PDFs0
0.2
0.4
0.6
0.8
1
1.2
1.4
1.6
1.8
Truncated normalCensored normalTriangular
95% CI of the mean of the economically optimal GHG abatement (2022, central feasible potential, all sources combined)

1515
Results: ranking of the mitigation options
(2022, central feasible potential, wide PDFs, all sources combined, truncated normal distributions)

1616
Results: importance of the uncertainty of individual groups of inputs
The ratio of the width of the 95% CI to the mean of the economically optimal GHG abatement (2022, central feasible potential, truncated normal distributions)
Narrow PDFs
Medium PDFs
Wide PDFs0%
20%
40%
60%
80%
100%
120%
AllAbatement rateUptakeApplicabilityInteraction factorsGWPActivity levelNet costs95
% C
I o
f th
e m
ean

1717
Discussion
• Highly uncertain optimal abatement
• Robust ranking of the measures (especially regarding the threshold)
• Focus on the most important inputs in further research

1818
DiscussionC
ontr
ibut
ion
to o
utpu
t’s u
ncer
tain
ty
(opt
imal
aba
tem
ent)
unc
erta
inty
Hig
hLo
w
Level of uncertaintyHighLow
Activity level
Abatement rate
Applicability rate
Uptake rate
GWP
Interaction factors
Net costs
Must haves
High effort, little return
Low effort, little return
Quick wins

1919
Discussion
• MACCs are complex, accumulating many layers of uncertainty
• Uncertainty reporting should be an essential part of policy input (both quantifiable and deep uncertainty)
• Data gaps about the statistical uncertainty
• Uncertainty in the policy process

2020
The policy context
Scottish Government 2011

Acknowledgments
Funded by the Scottish Government Rural and Environmental Science and Analytical Services division (RESAS) funding to SRUC and to ClimatexChange
Contact: [email protected]

Additional slides

2323
Results: ranking of the mitigation options
Optimal abatement
0 1 2 3 4 5 6 7 8 9 10 11 12 13 140
0.05
0.1
0.15
0.2
0.25
0.3
0.35
0.4
Timing of mineral N
Cmproved N-use efficiency plants
Better land drainage
Reduced tillage
Timing of organic N
Avoiding excess N
Using organic N to its full extent
Delay between slurry and mineral N
Using composts in preference to slurry
Nitrification inhibitors
Introduction of new species
Controlled release fertilisers
Reducing N fertiliser
Biological fixation
Systems less reliant on inputs(2022, central feasible potential, wide PDFs, all sources combined, truncated normal distributions)

2424
Uncertainty inventory
GWP
Agricultural land areas
Abatement by mitigation
optionsUptake of mitigation options
Applicability of mitigation
options
Net cost of mitigation options
Macro-economic drivers
Farm management
Discount rate
GWP metric
Weather and soil types
Soil processes
Farmers’ behaviour
Agro-environmental
policies