thawing frozen capital markets and backdoor bailouts: evidence
TRANSCRIPT
Thawing Frozen Capital Markets and Backdoor Bailouts: Evidence from the Fed’s Liquidity Programs*
Nicole M. Boysona
Jean Helwegeb
Jan Jindrac
September 16, 2014
* We thank Gerald Hanweck, Rene Stulz, Sergey Tsyplakov, Haluk Unal, seminar participants at the Office of the Comptroller of the Currency, University of Southern Carolina and Menlo College and participants at the Midwest Finance Association Conference and Ohio State Alumni Conference for helpful comments. Raluca Roman kindly provided assistance with TARP data. a Northeastern University, Boston, MA 02186; [email protected]; 617.373.4775. b University of South Carolina, Columbia, SC 29208; [email protected]; 803.777.4926. c Securities and Exchange Commission, 44 Montgomery Street, San Francisco, CA 94104; [email protected]; 650.489.6807. The Securities and Exchange Commission, as a matter of policy, disclaims responsibility for any private publication or statement by any of its employees. The views expressed herein are those of the author and do not necessarily reflect the views of the Commission or of the author’s colleagues upon the staff of the Commission.
1
Thawing Frozen Capital Markets and Backdoor Bailouts: Evidence from the Fed’s Liquidity Programs
Abstract
During the subprime crisis, the Federal Reserve introduced several emergency liquidity
programs as supplements to the discount window: TAF, PDCF, and TSLF. Using
microdata on loans to large commercial banks and investment banks, we find that the
programs were used by relatively few institutions and had modest effects on the liquidity
of short-term debt markets. Instead, our evidence suggests that the decisions to borrow
and to prepay loans were more closely related to a firm’s financial health. Our results
suggest that healthy banks found the terms of the loans expensive relative to private
market funds, while banks closer to insolvency often did not.

2
“...in September [2008], after 13 months of market stress, the financial system essentially seized up and we had a system-wide crisis. Our markets were frozen, banks had pulled back very substantially from interbank lending.” (Testimony of Hank Paulson, Treasury Secretary, to the House Committee on Financial Services on November 18, 2008.)
The Federal Reserve (the Fed) aims to mitigate the effects of financial system
shocks by acting as a lender of last resort (LOLR) to banks through its discount window
(DW). Borrowing from the DW carries the potential for stigma, as the market might
perceive banks that need to borrow from the Fed as financially weak.1 To provide
additional support to financial intermediaries in the subprime crisis, and in an attempt to
reduce this stigma, the Fed introduced three new loan facilities: the Primary Dealer Credit
Facility (PDCF), the Term Securities Lending Facility (TSLF) and the Term Auction
Facility (TAF).2
Like the DW, which is available only to commercial banks, the PDCF provides
short-term secured loans to I-banks at a penalty over the unsecured Fed Funds (FF) rate.
Since both programs charge a penalty, they are potentially quite costly for banks and I-
banks, especially since secured loans typically carry lower interest rates than unsecured
loans (Benmelech and Bergman (2009), Fleming, Hruang and Keane (2009), and Hrung
and Seligman (2011)).3 Figure A1 shows that the discount window rate typically
exceeded the repo rate by 50 – 100 basis points during our sample period. Thus, most
banks would shun these loans in normal times. However, in a crisis, when capital markets
are frozen, the penalty rate may be a small price to pay when other funding has dried up.
We investigate all four Fed facilities in the subprime crisis and their use by large
commercial banks and I-banks to determine how well the programs alleviated stress in
short-term capital markets.4
1 See Peristiani (1998), Furfine (2001, 2003), and Armantier, Ghysels, Sarkar and Shrader (2011). In the remainder of the paper we use the term “weak” to refer to banks that are close to insolvency. 2 See Tables A1-A4 in the appendix for details on the Fed emergency facilities. 3 Studies that compare yields on secured and unsecured debt typically find the opposite, but this owes to endogeneity (Benmelech and Bergman (2009)). 4 See also Wu (2011), Fleming, Hrung and Keane (2009), Hrung and Seligman (2011), McAndrews, Sarkar and Wang (2008) and Christensen, Lopez, and Rudebusch (2009) who analyze aggregate data showing that the Fed programs provided liquidity, However, Taylor and Williams (2008) and In, Cui and Maharaj (2012) contend otherwise.

3
By following Bagehot’s (1873) dictum to lend freely to sound banks against good
collateral at a penalty rate, the Fed intends to combat illiquidity in a crisis and at the same
time avoid loans that are essentially substitutes for capital at weak banks (Schwartz
(1992)). In contrast, Ashcraft, Bech and Frame (2010) show that Federal Home Loan
Bank (FHLB) advances, which do not have a penalty, were mainly used in the recent
crisis by distressed banks that viewed FHLB loans as a cheap source of funding. While
the Fed intends to reduce this problem for DW and PDCF loans by charging a penalty
rate, it sets the penalty rate the same for all institutions. This one-size-fits-all policy
affords undercapitalized banks a relative advantage since these banks typically pay a
premium in the FF markets anyway. In contrast, stronger banks pay a rate closer to the FF
target rate used as the benchmark for DW and PDCF loans (Furfine (2003) and
Armantier, Ghysels, Sarkar and Shrider (2011)).5
The penalty rates on DW and PDCF loans might make these two facilities less
popular than the TAF and TSLF auctions, which do not have penalties. However, these
auction programs were normally held just once a week and thus may not have been
available to banks when needed. In addition, the Fed typically offered less than $75
billion at each auction, and even when raised to $150 billion the funds might not have
been sufficient to satisfy the needs of all bidders. Thus, banks would have required
alternative funding in the event that their bids did not win. Since weak banks had fewer
alternative sources of funds, they should have bid more aggressively. Thus, these two
facilities could serve a disproportionately high fraction of weak banks (Armantier,
Ghysels, Sarkar and Shrider (2011)).
We analyze two frameworks to characterize the use of Fed credit facilities. The first
views these emergency liquidity programs as potential lifelines to all banks when short-
term debt markets are frozen (“liquidity provision” framework). This framework implies
that more banks should use the loan programs and borrow more money as the crisis
5 Consider a healthy bank with Treasury bonds as collateral shortly after Bear Stearns failed. With a FF rate of 4% and a penalty of 1%, the bank would obtain a loan at 5%, well above the repo rates of 3% - 4% reported by Krishnamurthy, Nagel and Orlov (2013). In contrast, their figures suggest that a weak bank that had only the riskiest bonds as collateral might pay as much as 6% to borrow in the repo market in Q1 2008, and hence would prefer a 5% DW rate then. The rates on DW and PDCF loans are even more favorable to the weak bank in late 2008 when the Fed lowered the penalty (and the FF rate) and mortgage-backed securities (MBS) repo rates soared (Gorton and Metrick (2012) and Adrian, Burke and McAndrews (2009)).

4
deepens, and that the pressure should be most evident among banks that rely on short-
term debt markets. The framework predicts that these patterns should reverse as capital
markets ease up. The second framework to describe LOLR borrowing focuses on the
financial strength of the institutions (the “bailout” framework). Under the bailout
framework, we should observe (1) small and infrequent amounts borrowed from the Fed,
especially relative to the banks’ typical funding from short-term debt markets and (2)
concentrated borrowing by weaker banks rather than widespread use of the programs. In
addition, the bailout framework predicts that repayment of loans, to the extent it exists, is
not related to general market conditions but to the health of the bank.
Our sample includes large U.S. commercial banks, investment banks and foreign
banks – essentially all large financial institutions permitted to borrow directly from the
Fed during the crisis. Many of these large firms had both commercial and investment
banking arms and, thus had access to all four programs. We focus on large firms since the
new Fed programs should have had the most significant impact on these firms. In
contrast, Berger, Black, Bouwman and Dlugosz (2013) analyze the same data Freedom of
Information Act (FOIA) data, but limit the sample to banks that submit Call Reports, thus
ignoring many large firms that would have been severely affected by disruptions in repo
and public bond markets.6 Acharya, Fleming, Hrung and Sarkar (2014) also analyze large
borrowers, but they restrict their analysis to the emergency facilities aimed at primary
dealers (PDCF and TSLF).
We find that all Fed liquidity programs were used more heavily after the
bankruptcy filing of Lehman Brothers on September 15, 2008, and that the largest loans
were provided to I-banks under the PDCF facility. Post-Lehman, borrowing from the Fed
liquidity programs became more widespread, and many large commercial banks
borrowed from at least one facility. These results suggest that the new emergency
6 Prior to a Freedom of Information Act (FOIA) lawsuit in 2011, use of the DW was not disclosed to the public. The FOIA data, which are described in detail in the appendix, are matched by name to datasets on bank financial information, such as Compustat in our case, and to Call Reports by Berger, Bouwman, Black and Duglosz (2013). The entity matched to the FOIA name may be at a different level than the borrower. For example, Berger et al. report substantial TAF borrowing by Chase Bank USA relative to its $79 billion in assets (as of year-end 2007), but we note that this borrowing is not substantial compared to the assets of JPMorgan Chase Bank ($1.3 trillion). The former bank did not report any repo borrowing but JPMorgan Chase Bank lists $99 billion in repo debt. Both entities have lower assets than the consolidated balance sheet of JPMorgan Chase & Co. ($1.6 trillion; Compustat).

5
facilities were successful in providing liquidity to stressed markets (Afonso, Kovner and
Schoar (2011)). However, borrowing remained quite concentrated through the crisis, and
some safer banks were noticeably absent from the Fed programs even after Lehman’s
collapse. Loans were often small compared to banks’ typical short-term debt levels – at
the peak of borrowing, nearly 90% of short-term funding continued to be supplied by
capital markets. Multivariate analysis shows that weaker banks were significantly more
likely to borrow from the Fed. These results suggest that the programs had a tendency to
prop up weaker banks. Finally, loan prepayments were not generally motivated by better
market conditions, but rather by a desire among weaker banks to avoid investor scrutiny.
We also note that some large loans were granted by the Fed in situations that were
unrelated to general market conditions. For example, JPMorgan Chase borrowed billions
in early 2009 coinciding with its acquisition of Bear Stearns. Furthermore, Lehman
borrowed from the Fed after it declared bankruptcy. And, some very weak foreign banks
borrowed frequently and in large amounts throughout the crisis, even after receiving
bailouts from their own governments. These large loans suggest that the emergency
facility programs were sometimes used for purposes other than easing general market
conditions.
Overall, our findings imply that while the Fed programs increased liquidity, the
amount provided was small relative to the size of these banks’ short-term borrowings in
capital markets. Of course, it is possible that the situation would have been worse if the
Fed did not offer the new LOLR programs, but our results suggest that these programs
could have been more widely used. Our results suggest that subdued borrowing from
these emergency programs owes at least in part to their high cost (the penalty rate on
secured debt) for healthy institutions.
The remainder of the paper is as follows: Section 1 discusses the framework for
analyzing the extent of liquidity provision by the Fed and the sample. Section 2 presents
results. Section 3 concludes. The appendix provides detailed information on the Fed
liquidity programs and the FOIA data.

6
1. Analytical Framework and Sample
A. Analytical framework
We test two frameworks describing the use of the Fed liquidity facilities: the
“liquidity provision” and “bailout” frameworks. The former framework explicitly
assumes that capital markets froze at some point during the crisis, as indicated in prior
research (e.g., Afonso, Kovner and Schoar (2011) and Berger, Black, Bouwman and
Dlugosz (2013)) and the above-cited statement made by Secretary Paulson. While debt
markets were stressed prior to the Bear Stearns deal in March of 2008, regulators did not
declare debt markets frozen until September of that year. Thus, some firms that avoided
Fed borrowing early in the crisis may have only later taken advantage of the emergency
facilities. To account for this possibility, we analyze borrowing from the Fed facilities
during the pre- and post-Lehman periods separately.
An alternative framework (bailouts) is articulated by Ennis and Weinberg (2009)
and Artuc and Demiralp (2010). Their perspectives implicitly assume that markets, while
not functioning as normal, continue to provide some funds to the strongest financial
institutions. As a result, the weakest banks are more likely to find DW loans cheaper than
private market debt. Thus, if bailouts are the primary factor in Fed lending, the use of the
programs will be limited and skewed towards undercapitalized banks.
Our first set of hypotheses describing the use of the Fed programs is related to the
aggregate amount borrowed and the amount of capital market funding such borrowing
replaced. Specifically, the two frameworks predict different uses of the facilities:
H1 (Market funding replacement hypotheses) H1A (Liquidity provision): If the Fed liquidity facilities were effective in thawing frozen capital markets, financial institutions should have replaced a substantial portion of their short-term borrowing with loans from the Fed programs. H1B (Bailout): If the Fed liquidity facilities were used as bailouts of insolvent institutions, the capital markets should have continued to supply most short-term borrowing by solvent banks. H2 (Pervasiveness of use hypotheses) H2A (Liquidity provision): If the Fed liquidity facilities were effective in thawing frozen capital markets, the use of the facilities should have become more widespread when capital markets froze. H2B (Bailout): If the Fed liquidity facilities were used to bail out insolvent institutions, the use of the facilities at time of market turmoil should have remained more concentrated.
7
We test H1 by examining the time series patterns of aggregate borrowing in all four
programs relative to the total amount of short-term debt on banks’ and dealers’ balance
sheets. If the Fed facilities succeeded in providing liquidity to thaw frozen markets, we
should observe that the emergency loans replaced a large fraction of short-term debt. If,
by contrast, Fed loans replace a small fraction of short-term debt, then the results are
more consistent with the bailout hypothesis. There is no theoretical cutoff that determines
what constitutes a small or large fraction of short-term debt replacement. However, we
note that prior research finds that the majority of banks suffering short-term debt
shortfalls are able to offset at least half of the shortfall with deposits (Boyson et al.
(2014)). Hence, we consider whether LOLR borrowing replaces at least half of short-term
debt at some point during the crisis.
We test H2 by calculating Herfindahl indexes for each program on each day and
examining the changes in the indexes around the time of the Lehman bankruptcy, since it
is after the Lehman bankruptcy that regulators declared credit markets frozen. If the
Herfindahl indexes decline sharply following the Lehman event, indicating that more
institutions accessed the liquidity programs, we conclude that the Fed programs provided
liquidity to thaw frozen markets (accept H2A and reject H2B). If the index increases, the
bailout framework gains support (accept H2B). We also examine the absolute level of the
Herfindahl indexes in the post-Lehman period. If the indexes are high, we infer that
disruptions in capital markets were not severe enough to affect most firms and that the
programs were not very widely used (reject H2A).
Next, we consider the cross-sectional variation in the types of firms that access the
Fed liquidity programs. Under the liquidity provision framework, the institutions most
exposed to debt markets should be more likely to borrow from the Fed. If the bailout
framework is correct, weak institutions should be more likely to take advantage of the
Fed programs because the penalty rate of the Fed loans is not institution-specific. That is,
weak institutions do not face as high a penalty as healthy ones when borrowing from the
Fed. Therefore, if these weak institutions face a high market cost of debt, they should find
the Fed loans economical. Specifically,

8
H3 (Loan initiation hypotheses) H3A (Liquidity provision): If the Fed liquidity facilities were effective in thawing frozen capital markets, financial institutions with high (low) exposure to capital markets were more (less) likely to access the Fed programs. H3B (Bailout): If the Fed liquidity facilities were used as bailouts of insolvent institutions, financially weak (strong) institutions were more (less) likely to access the Fed programs during times of market turmoil.
We test the liquidity provision loan initiation hypothesis (H3A) by examining
firms’ prior reliance on short-term debt markets. H3A predicts that firms with high short-
term debt and low deposits are more likely to access the Fed programs after Lehman fails.
We also consider the type of collateral posted when borrowing from the Fed. According
to Gorton and Metrick (2012), when the repo market froze in 2008, MBS repo lending
was particularly distressed. Thus, the use of MBS collateral for Fed loans should have
increased sharply when repo markets froze. With respect to the bailout loan initiation
hypothesis (H3B), weaker firms are more likely to access the Fed facilities, especially
after Lehman’s collapse. We use measures of firm health, such as bank capital and ROA
prior to borrowing from the facilities. We also consider information on TARP program
usage from Call Reports regarding both the usage and early repayment. Firms that were
closer to insolvency would have had fewer high quality assets to pledge to the Fed and
thus were more likely to post equity collateral when the Fed started accepting it in late
2008 (see Table A4).
Finally, we analyze factors related to early repayment of DW and PDCF loans.
Under the liquidity provision framework, when market funding is severely limited,
institutions would be less likely to voluntarily prepay loans obtained from the DW or
PDCF. However, as markets eased and the penalty rate rose well above market rates,
prepaying LOLR loans might have become attractive, especially for institutions with high
exposure to capital markets. Under the bailout framework, factors other than easing of
capital markets should be related to loan prepayments. Specifically:
H4 (Loan prepayment hypotheses) H4A (Liquidity provision): If the Fed liquidity facilities were effective in thawing frozen capital markets, financial institutions with high (low) exposure to capital markets should have been more (less) likely to prepay their loans. H4B (Bailout): If the Fed liquidity facilities were used as substitutes for capital by undercapitalized institutions, financially weak institutions should have been more
9
likely to prepay their loans when either their situation improved or the end of fiscal quarter approached.
We test the liquidity provision prepayment hypothesis (H4A) by analyzing whether
the amount of short-term debt and deposits affect the likelihood of prepayment. The
rationale is that when credit conditions ease, banks with the highest exposure to the credit
markets stand to benefit the most in prepaying above-market rate loans and, instead rely
on short-term debt markets. The most important factor for the bailout loan prepayment
hypothesis (H4B) is the creditworthiness of the firm, especially if it improves over time.
We also consider the effect of disclosure in audited financial statements. The Fed loan
data was secret prior to the Bloomberg FOIA lawsuit in 2011. However, if the amounts
borrowed were large enough, banks would be required to disclose them in financial
statements, which might lead to a run on a bank, difficulty rolling over short-term debt, or
a decline in the firm’s stock price. Therefore, to avoid disclosure, banks would prefer to
prepay loans immediately prior to the end of the fiscal reporting period.
B. Sample
Because we are interested in the effects of overall capital market disruptions on
financial firms and the role of the LOLR in dealing with them, we restrict our sample to
large firms. We screen for a set of potential borrowers that are publicly traded, have at
least one quarter of Compustat and CRSP data available, and have assets of at least $1
billion (Berger et al. (2014)). Several foreign banks borrowed heavily from the Fed
during the crisis but not all of them have data on Compustat or CRSP. In those cases, we
search for their data on Global Compustat or collect data from their annual reports and
SEC filings.7 Our total sample consists of 382 large commercial banks and 17 primary
dealers with full Compustat and CRSP data. By construction, our sample uses data for the
consolidated entity (including bank holding companies and bank subsidiaries).
Next, we identify firms that borrowed at least once during the crisis from at least
one of the four facilities. We identify institutions accessing the DW, TAF, PDCF, and
7 We include all US banks and investment banks that might have borrowed through one of the four programs. However, data limitations prevent us from creating a comparable sample for foreign banks. We include foreign banks that actually did borrow from one of the programs or which have available data on Compustat. We confirm that most large foreign banks are included in the sample: When we compare our sample to the American Bankers Association list of the 150 largest banks in the world by assets (December 2007 and June 2009 lists) only eight foreign banks are missing from our sample.

10
TSLF from the 3/31/2011 FOIA production by the Federal Reserve as discussed in the
Appendix. Since the FOIA files only report the name of the institution and no other
identifying information, we match the names manually. If the name of a borrower is not
in CRSP or Compustat, we search for other identifying data in SEC filings and company
websites to improve the matching process. We identify 213 banks that borrowed from at
least one Fed facility and 169 non-users. Finally, we identify 17 primary dealers with
available Compustat and CRSP data.
While data stop before June 2009 for 40 banks, we do not consider survivorship
bias to be a problem among our sample of large commercial banks.8 We obtain
information regarding bank failures from the FDIC failed bank list and from a review of
the financial press. We use their data for as long as it is available. We note that several
European banks would not have survived as stand-alone entities absent a bailout from
their local governments, but they were not shut down by their regulators, and are included
in the sample throughout. In addition to acquisitions that cause a firm to exit the sample,
acquisitions cause some sample firms to expand in size. This information comes from
Securities Data Corporation (SDC).
Likewise, survivorship bias is negligible among the primary dealers. In early 2008,
there were 20 primary dealers, including Bear Stearns, whose takeover by JPMorgan
Chase was announced the day before the PDCF began. One of the few US dealers with
high deposits, Countrywide, ceased to be a primary dealer in July 2008. Lehman is
deleted from the New York Fed’s list of primary dealers on September 22, 2008 and Bear
Stearns, which merged with JPMorgan Chase, is not deleted from the list until October
2008. Merrill continued to be a primary dealer until February 11, 2009. Only one new
primary dealer, Jefferies, was added after the sample period started (in May 2009). Most
of the primary dealers were investment banks or had large investment banking arms. Ten
of the dealers were foreign and, in contrast to US dealers, often had large deposit-taking
divisions that allowed them access to DW loans.
C. Sample characteristics
8 For example, Washington Mutual is missing data after it goes bankrupt, and National City, Provident and Wachovia are acquired in 2008. ABN-Amro is acquired in mid-2007 and is the only acquisition that is not clearly related to losses in the crisis. We note that data for about 5% of users, 9% of light users, and 13% of non-users stop before the end of the sample period.
11
We begin by reporting the characteristics of loans and borrowers. Table 1, Panel A
reports the size of each loan in the FOIA data regardless of whether or not the borrower is
in our sample. The table also reports maturity and interest rate for the 3,614 loans
together and by program. Panels B-E show that the DW and the TAF are the most
popular programs, as each accounts for nearly one-third of all lending. Most of the DW
and PDCF loans are overnight, whereas the TAF and TSLF loans typically have a
maturity of about one month. The range of interest rates is wide, reflecting the decline in
interest rates at the start of the crisis to the end of the sample period.
The median TSLF loans and PDCF loans were larger than those made through the
DW and TAF, partly reflecting the large relative size of the primary dealers that
borrowed from the PDCF and TSLF. However, the distribution of DW loans is heavily
skewed, as some large borrowers used the DW as well. For example, JPMorgan Chase
borrowed $8.6 billion from the DW in late May 2008.
While the loan amounts are large in absolute terms, the median loan of $1.9 billion
is about 12% of the (untabulated) median book value of short-term debt of the users in
our sample. Some firms take out more than one loan at a time, but even considering the
size of all new loans for a firm, the median amounts are comparable. Panel F of Table 1
shows that the average and median amounts increase by this method of calculation, but
only by a few hundred million dollars. Thus, as a percentage of short-term debt, average
borrowing is not large. A few banks borrowed from more than one facility at a time or
took out additional loans from the same program before the first one matured. Panel G of
Table 1 shows the average and median quantities borrowed by each bank on days when
there is a loan outstanding. The averages and medians are larger still, but remain small
for most banks. The largest amount outstanding at any one point was nearly $100 billion,
which was owed by Morgan Stanley.9 Part of this sum reflects a $40.1 billion PDCF loan
on September 29, 2008, the same day that Morgan Stanley received a $9 billion dollar
equity injection from Mitsubishi UFJ Financial Group. With a balance sheet of slightly
under a trillion dollars and $323 billion in short-term debt, the total Fed borrowing on
that day amounted to about 10% and 30% of Morgan Stanley’s assets and short-term
9 Bloomberg reported that Morgan Stanley borrowed $107 billion from the Fed. The Bloomberg figure includes borrowing using a single tranche repo. The Fed does not consider these repos to be emergency loans.

12
debt, respectively. The largest single loan in the sample is a 4-day loan to Barclays on
September 18, 2008 for $47.942 billion.10
The first two columns of Panel A of Table 2 compare the characteristics of
commercial banks that used at least one of the Fed programs to non-users. The last
column presents the characteristics of primary dealers.11 The results indicate that users
are larger firms, whether measured by the average or median assets, and they rely more
heavily on capital markets funding (they have fewer deposits and more ST debt). These
results are consistent with a description of the programs as providing liquidity during a
crisis.
Only one measure suggests that the users are weaker banks: Their capital ratios are
significantly lower in Panel A when compared to non-users. In contrast, the return on
assets and (median) non-performing loans are not significantly different between users
and non-users. The average of non-performing loans indicates that users have stronger
balance sheets and their market-to-book ratios imply that they enjoy higher valuations.
To capture the effects of weak balance sheets in this crisis period while avoiding
multicollinearity, we create an insolvency index. The index is the sum of the following
indicator variables: whether equity capital divided by total assets is below the sample
median, whether ROA is negative, whether non-performing loans scaled by total assets
are above the sample median, and whether the market-to-book ratio is below the sample
median. The insolvency index of users is not significantly different from the insolvency
index of non-users.
Foreign firms account for 21% and 16% of users and non-users, respectively.
While this difference is not significant, the availability of loans from their home
governments suggests that 21% is a high fraction of foreign users.
We also report whether banks received capital from the TARP program. The results
indicate that users have significantly higher propensity to access TARP funding
10 As can be seen from Figure 4, other firms borrowed more than $47.942 billion through the PDCF. The data in Figures 1-6 represent total loan amount outstanding at a given point in time. In the case of Morgan Stanley, for example, it borrowed slightly over $61 billion from the PDCF through two loans on September 29, 2008. 11 We do not report data on non-users for the PDCF or TSLF because that sample of primary dealers is small. We report data as of year-end 2007 except when missing data are replaced with figures from the next quarter.

13
compared to non-users. Conditional on accessing TARP, users are about as likely as non-
users to repay TARP quickly (i.e., before June 2009).
Finally, primary dealers are large firms that rely heavily on short-term debt
markets. On average, short-term debt accounts for 24% of assets, while deposits are only
42% of assets. Equity capital, ROA, and market-to-book are all low compared to the
commercial banks in our sample. The insolvency index is lower, but this is not surprising
given that it uses only three measures of strength instead of the four used in the
commercial bank index (non-performing loans are not included). Two (12%) of the
primary dealers accessed TARP and both of the firms repaid TARP before June 2009.
2. Results
A. Tests of the market funding replacement hypotheses (H1)
Our first test of the market funding replacement hypothesis (H1) is conducted in
Table 2 Panels B-F, which report quarterly data. The most striking aspect of these panels
is the small number of users. Over 380 large commercial banks could have used the DW
and TAF during this period, but at most 64 banks accessed either of them during any of
the eight quarters in the sample period (Panels B and C). We note that a much higher
fraction of primary dealers used the facilities, although the PDCF is not widely used in
the two quarters after Bear Stearns. TSLF attracted wide participation throughout the
crisis, with over 80% (14) of the primary dealers accessing the facility in Q3 2008. The
number of users increased among all four programs after Lehman declared bankruptcy,
with the sharpest increase in the PDCF. Nonetheless, the liquidity framework predicts
that borrowing would be widespread at some point in the crisis, but as Panel F shows, the
largest number of borrowers is only 91 (23%) in 2008Q3. The size of the borrowers
increases around the Lehman event in most programs, but the median DW borrower asset
size drops after Lehman. The average amounts borrowed in the post-Lehman period
relative to the pre-Lehman period are higher for the DW and TAF. However, the median
loan sizes for DW are still relatively small and not meaningfully different from median
DW loan sizes in the earlier periods. We note larger PDCF loans in the post-Lehman
period, especially in Q3 and Q4, but TSLF loan sizes do not show dramatic changes then.
Thus, Panel F shows that the median amount borrowed in all four programs only jumps a

14
small amount after Lehman fails. Finally, we note that the use of all four programs
dropped off dramatically by the end of the sample period.
We present further univariate analyses of the market funding replacement
hypotheses (H1) in Figures 1-6. Figure 1 shows the amount outstanding owed by all
firms, including small banks and thrifts that are not in our sample. In all Fed programs the
aggregate outstanding never exceeds $800 billion, and indeed, the debt rarely exceeds
$750 billion at any point in time in the crisis. To put the amount of borrowing in
perspective, we consider the total amount of borrowing from all four Fed facilities by
firms in our sample relative to the total amount of their short-term debt (Figure 2). We
hypothesize in H1A that Fed borrowing should replace a substantial portion (at least
50%) of short-term borrowing if the programs mainly worked to provide liquidity to
frozen markets. Instead, Figure 2 shows that even when the markets were most stressed,
they continued to supply about 90% of these large firms’ short-term debt funding. This
evidence contradicts the market funding replacement hypothesis H1A.
Figure 3 shows that DW borrowing was very light until late March 2008. As a
comparison, Furfine (2001) shows that borrowing from a Fed facility set up for Y2K
problems reached $1.187 billion on December 29, 1999. Only about a third of the days
between August 20, 2007 and April 1, 2008 had DW loans outstanding of more than
$1.187 billion and several of those days were related to the Fed’s request of several large
banks that they “test borrow” in August 2007. Thus, DW borrowing in the first nine
months of the crisis suggested a situation that was only marginally worse than the Y2K
scare. Figure 3 also indicates that the majority of the Fed loans usually went to financial
institutions less likely to be affected by frozen debt markets in the U.S. In particular,
large money center banks (LMCBs) scarcely approached the DW before October 2008
and quickly repaid the loans when they did. Furthermore, foreign institutions accounted
for most of the borrowing from DW despite their ability to access LOLR loans in foreign
countries.12
12 A possible explanation for this heavy borrowing by foreign banks is a shortage of dollar funding in foreign markets. In untabulated results, we assess this conjecture by analyzing the amount of swap lines made available by the Fed to foreign LOLRs. Table A4 indicates that following Lehman bankruptcy, the swap lines increased from about $62 billion to $635 billion. Hence, at the time that the Fed entered in swap line agreements with foreign LOLRs, foreign institutions substantially increased their DW borrowing.
15
Figure 4 shows that TAF borrowing was much larger for LMCBs, but they still
accounted for less than half of all borrowing in the program. The fraction of LMCB debt
in Figure 4 is particularly small before October 2008, and while it increased after
Lehman, these banks’ total TAF borrowing never exceeded $200 billion.
One explanation for the low LMCB borrowing is that banks obtained a large
portion of their funding from deposits, which is a stable, even increasing, source of funds
in a crisis (Gatev and Strahan (2006), Gatev, Schuermann, and Strahan (2009) and
Cornett, McNutt, Strahan and Tehranian (2011), and Boyson, Helwege, and Jindra
(2014)). In untabulated results, we note that deposits for users increased by almost $1
trillion between 2Q 2007 and 4Q 2008.
In contrast, some primary dealers may not have been able to increase deposits to
offset the loss of short-term debt funding, especially the U.S. dealers, which typically do
not own retail banks. Consistent with this argument, the two facilities available to
primary dealers (PDCF and TSLF) have the highest participation rates of the Fed
programs, suggesting that the use of Fed programs increases with illiquidity in capital
markets. Figure 5 shows that 18 dealers used the PDCF at some point in the crisis and
only HSBC and Greenwich/RBS never used the facility.13 Figure 6 also shows borrowing
by 18 dealers, but the two firms that did not use the TSLF were Daiwa and Mizuho.
Overall, based on the univariate analyses of the market funding replacement
hypotheses in Table 2 and Figures 1-6, we find evidence that generally favors H1B over
H1A (bailouts over frozen markets).
B. Tests of pervasiveness of use hypotheses (H2)
We next analyze the pervasiveness of use hypotheses (H2) by testing whether
participation in the Fed programs was widespread. Table 3 reports the average and
median Herfindahl index (HHI) of loan amounts for each program (Panel A) and the
index scaled by HHI of the size of the firms in the sample eligible to borrow from a
particular sample (Panel B). Thus, a firm that borrows 10% of the loans would be
borrowing its “fair share” of Fed debt if it also accounted for 10% of the overall bank
assets in our sample. In that case the normalized value would equal 1. A number larger
13 Note that Figures 5 and 6 show borrowing for all 20 primary dealers, whereas Table 2 includes firms with data in Compustat and CRSP.

16
than one indicates the firm is borrowing more than would be expected given its size. We
test for differences in the HHIs from the pre- to post-Lehman bankruptcy periods to test
H2. For DW and PDCF, we calculate the HHI based on the share of the loans initiated on
the same day. For TAF and TSLF, the share is based on the size of the auction offering,
so that if a particular auction was undersubscribed, the HHI would be low.14 The HHI
values are, by design, capped for the TAF and TSLF, as their rules limit funding to any
one firm.15
Prior to Lehman’s bankruptcy, participation in the Fed programs was often
concentrated among a handful of firms. Panel A shows that DW and PDCF borrowing
was often done by only one or two firms since the average HHI is close to one. Panel B
shows that the scaled HHI is substantially higher than one.
If borrowing increased sharply in late 2008 because debt markets froze after
Lehman, we would expect the HHI values to decline after September 15. Table 3 shows
that the HHI as well as the scaled HHI do indeed decline for DW, PDCF, and TAF after
September 15. Therefore, the Lehman event leads to a statistically significant increase in
pervasiveness of the use of the three facilities, which is consistent with H2A. For TAF,
we further note that the post-Lehman concentrations are consistent with pervasive use
and supportive of H2A. However, while the declines in the loan concentrations are
significant for DW and PDCF, the absolute levels of the HHI indicate that the use of the
programs remained concentrated even in the post-Lehman period. For example, for DW
(PDCF), the HHI value of 0.497 (0.292) indicates that as few as two (three) institutions
borrowed comparable amounts on the same day.
The use of TSLF is characterized by increasing HHI values, implying that TSLF
borrowing becomes more concentrated after the Lehman bankruptcy. This owes only a
bit to Lehman’s lack of participation in the auctions after its bankruptcy (an increase of
14 Note the gray areas in Figures 3 and 5, which show the size of the available funds in the auctions. We note that TAF auctions in October to December 2008 were undersubscribed after the Fed increased the auction size to $150 billion. The TSLF was undersubscribed in November 2008 even though the Fed did not change its size. 15 For the TAF the limit is 10% and for the TSLF it is 20%. If each TAF auction had exactly 10 recipients, the HH1 would be 10*0.12=0.1. If each TSLF auction had exactly 5 winners its HHI would be 5*0.22=0.2. Furthermore, the PDCF and TSLF programs are limited to no more than 20 participants (the number of primary dealers), so if all primary dealers participate in the auction, the HHI cannot fall below 0.05.

17
about 0.005 in the HHI, or less than 10% of the increase in the average HHI of TSLF
loans).16
Overall, for DW, TAF, and PDCF, the evidence shows significant declines in
concentration in the post-Lehman period, which is supportive of the liquidity provision of
the pervasiveness of use hypothesis (H2A), while for TSLF, the evidence is supportive of
the bailout hypothesis (H2B). We also note that for all but the TAF, the usage of the
programs remains concentrated in the post-Lehman period, as indicated by the high levels
of HHI.
C. Tests of the loan initiation hypotheses (H3)
The liquidity provision hypothesis H3A predicts that repo market borrowing will be
replaced to a large extent by Fed emergency loans. In Table 4, we examine the use of
collateral pledged for PDCF loans over the course of the crisis. Copeland, Martin and
Walker (2010) show that the majority of collateral posted in the repo market is either
Treasury or MBS bonds, with only about 6% of repo borrowing backed by corporate
bonds and even less by equity. At the onset of the crisis, PDCF collateral was fairly
similar to tri-party repo collateral, although Treasury bond collateral was rarely posted.
After Lehman, the mix of assets changes significantly. Rather than the majority of the
collateral being MBS, as in the first half of 2008, post-Lehman the most common types
of collateral are corporate bonds followed by equity. The fact that MBS collateral drops
off sharply is inconsistent with Fed programs substituting for frozen repo markets, as
primary dealers rarely used MBS collateral at the Fed window. Further, the high fraction
of equity collateral in late 2008 suggests these banks were short on unencumbered, high
quality collateral, as predicted by the backdoor bailout hypothesis H3B.
Next, we use a multivariate analysis of the factors related to Fed borrowing and
how they changed around the time of Lehman bankruptcy. Specifically, we estimate a
hazard function of the conditional probability of borrowing that allows for multiple
events (see Andersen and Gill (1982)), where each event is defined as a new loan from
the Fed. In Tables 5-8, we present estimates of such hazard functions with multiple
events, where each table presents separate estimates for DW, TAF PDCF, and TSLF
borrowing. The dependent variable in these models is set to one each time a user borrows
16 Assuming that 15 primary dealers, i.e. one extra dealer, would participate in the Q3 2008 auctions.

18
from the program and zero otherwise. We estimate the coefficients over the pre- and
post-Lehman periods for each program, and then test whether differences in the
coefficients support the liquidity provision or bailout loan initiation hypotheses. For DW
and TAF, we also perform the analysis using the sample of domestic banks to assess
whether foreign banks’ borrowing is meaningfully different from US banks’ borrowing.
Table 5 shows the hazard function estimates for DW loan initiations. The first four
models use data for the base period prior to the Lehman bankruptcy (models 1 and 2 are
for the whole sample and models 3 and 4 only include data on US banks). The coefficient
on ST debt is positive and significant, which indicates that, early in the crisis, banks that
rely more on wholesale funding were more likely to borrow from the Fed. The coefficient
on deposits is significantly negative for US banks, indicating that banks that rely more on
wholesale funding (have fewer deposits) are more likely to borrow from the DW.
However, the deposit variable is not significant in the sample as a whole. These results
support the liquidity framework, while the bailout framework draws almost no support
from models (1) and (2). Indeed, during the pre-Lehman bankruptcy period, most
solvency measures indicate that users are healthier (banks with higher capital, ROA, and
market-to-book borrow more). Only non-performing loans suggests otherwise. Consistent
with these results, aggregating the four individual measures into an insolvency index
yields a significant negative coefficient for the whole sample and an insignificant
coefficient for US banks. With respect to other variables, banks that completed an
acquisition in the prior 30 days, domestic, and large banks are more likely to access the
DW. The models also indicate that foreign banks were less frequent borrowers early in
the crisis and that the DW loans were significantly more likely to fund an acquisition, as
in the case of Bear Stearns and JP Morgan.
The test of the loan initiation hypothesis (H3A) focuses on the change in the
coefficients as the crisis deepens. In Table 5 models (5) through (8), we analyze the post-
Lehman period and test whether the coefficients are significant and consider whether they
change. We would accept H3A if the coefficients on ST debt are significantly positive
and significantly larger than in the pre-Lehman period. The figures in brackets below the
coefficients’ p-values in parentheses are p-values for the test of significant differences
between the two periods. We find that the coefficients on ST debt remain significantly
19
positive in all four models, but they do not increase as expected when debt markets
freeze. The coefficients either decline (model (6)) or remain about the same size (models
(5), (7), and (8)). The coefficients on ST debt in model (6) is significantly smaller than its
counterpart in model (1), indicating that banks with high exposure to capital markets
were less likely to access the DW in the post-Lehman period, contradicting the liquidity
provision loan initiation hypothesis (H3A). The coefficient on deposits remains
insignificant in the later period when estimated with the whole sample and it changes to
the incorrect sign in the sample of US banks. The evidence from deposits provides further
evidence against H3A.
With respect to the bailout loan initiation hypothesis (H3B), model (5) indicates
that after Lehman, DW users are more likely to be weaker firms, as the coefficients on
capital, ROA, and market-to-book change from significantly positive in the pre-Lehman
period (model (1)) to significantly negative. The coefficient on non-performing loans
remains positive but is no longer significant. Furthermore, the tests on changes indicate
that all coefficients are significantly different from their counterparts in model (1). The
positive and significant coefficient on the insolvency index (model (6)) lends further
supports to the bailout hypothesis.
However, the results for US banks in models (7) and (8) do not paint as clear a
picture of weakness. Only the negative coefficient on ROA and the positive sign on non-
performing loans are significant with the signs consistent with H3B. Market-to-book is
insignificant, but its decline from the pre-Lehman period does suggest a greater
likelihood of weaker firms borrowing as the crisis evolves. The coefficient on equity
capital for US banks contradicts the bailout hypothesis, as it is significantly positive and
as large as in the pre-Lehman period. We also consider whether borrowing is affected by
the penalty rate in Table 5 by including a variable that measures the difference between
the interest rates on DW and repo loans. While this is not an apples-to-apples comparison
once the Fed accepts a wider range of collateral in late 2008, the signs and sometimes the
significance of the penalty variable suggest the higher cost of Fed loans played a role in
banks’ borrowing decisions. After Lehman, foreign banks step up their borrowing while
acquirers borrow less. Consistent with the size of the banks reported in Table 2, Table 5
shows that smaller banks are significantly more likely to access the DW in the post-

20
Lehman period, even though they are not the expected victims of stress in short-term debt
markets. Finally, the evidence on DW usage by TARP banks is mixed, indicating that
institutions forced to access TARP were significantly more likely to borrow from the
DW.17 Overall, based on the multivariate analysis of DW loan initiations, the Fed may
have followed the Bagehot rule when markets first showed signs of weakness, however,
the estimates from the post-Lehman period suggest that DW loans often propped up weak
foreign banks.18
Table 6 shows the same specifications of the hazard function for TAF borrowing,
except for the pre-Lehman time period since TAF starts in late 2007. The sample used in
these analyses includes only auction dates. Consistent with the DW results, during the
pre-Lehman period reliance on ST debt (and deposits for US banks) is a significant factor
behind the decision to borrow from the Fed. For the post-Lehman period, the coefficients
on ST debt are similar in models (5) and (6) when compared to their pre-Lehman
counterparts. However, for US banks, the coefficients on ST debt increase significantly,
providing support for H3A. The coefficients on deposits in the post-Lehman period are
generally insignificant and show less support for H3A.
Table 6 shows much more evidence in favor of the bailout framework during the
early crisis period than the DW estimates, as equity, ROA, market to book and the
insolvency index all suggest weaker banks were more likely to borrow (although equity is
only significant in model (1) and M/B only in model (3)). The insolvency index enters
with a significant positive coefficient in both models (1) and (3). These solvency
measures, however, are generally less significant in the post-Lehman period and
sometimes change sign (e.g., equity for the US bank sample). In that sense, the results are
17 These institutions include Bank of America, Bank of New York, Citibank, Goldman Sachs, J.P. Morgan, Merrill Lynch, Morgan Stanley, State Street, and Wells Fargo. U.S. Treasury Secretary Paulson’s talking points for a meeting with CEOs of these banks contained the following language “...We don't believe it is tenable to opt out because doing so would leave you vulnerable and exposed. If a capital infusion is not appealing, you should be aware your regulator will require it in any circumstance.” For details see, http://www.businessinsider.com/uncovered-tarp-docs-reveal-how-paulson-forced-banks-to-take-the-cash-2009-5 18 Table 1 indicates that the distribution of loan sizes is skewed. Thus, the multivariate analyses reported in Tables 5-8 use hazard models of whether borrowing occurred instead of regressions using the amount borrowed. In an untabulated robustness check we consider loan size by estimating a Tobit regression where the dependent variables in Tables 5-8 are replaced by the total amount of debt borrowed on a particular day scaled by assets. Our conclusions are not affected when we use Tobit regressions analyzing amount borrowed.

21
in conflict with the DW estimates, which showed that weaker banks were more likely to
use the window after Lehman. The contrasting results may owe to the fact that DW loans
are made at a penalty rate whereas the TAF minimum is set by auction. Although weak
banks have an incentive to bid more aggressively in TAF auctions than strong ones, it is
still the case that the cost of replacing frozen debt market funds is cheaper using the TAF
instead of DW loans. Foreign banks are more likely to borrow from the TAF in both
periods, as are larger banks (which likely have more expertise with bidding in auctions).
Overall, the evidence on TAF usage shows some evidence favoring the liquidity
provision hypothesis for US banks, but not for foreign banks. The results also show that
weak banks were more likely to access TAF in both pre- and post-Lehman periods.
However, the results do not support the bailout loan initiation hypothesis in that weak
banks were no more likely to access TAF during the period of market turmoil.
We further investigate whether TAF loans helped thaw frozen capital markets by
analyzing the level of participation in the auctions. Figure 4 indicates that TAF auctions
were not always fully subscribed during the sample period – the gray background
indicates that the amount borrowed by bidders is less than the amount available. In
untabulated results, we regress the subscription ratio (calculated as the total of dollar bids
submitted divided by the size of the auction) less one on measures of market conditions
as well as features of the loans being auctioned. The dependent variable is larger
(smaller) than zero whenever there is oversubscription (undersubscription) and banks
desire more (fewer) funds than is available via TAF loans. Under H3A, we expect TAF
auctions post-Lehman to be significantly oversubscribed (i.e., the coefficient on the time
period indicator to be significantly positive), but we find that of the 44 TAF auctions in
our sample period only those in the pre-Lehman period are significantly oversubscribed.
The post-Lehman and pre-TARP period (8/15-10/28/2008) is characterized by
insignificant oversubscription; during the post-TARP period they are significantly
undersubscribed. Loan-specific maturity characteristics and market return on the day
before the auction are both insignificant predictors of the level of TAF participation.
While the results on oversubscription contradict H3A, it is possible that the size of
TAF auctions was increased by the Fed in response to market disruptions so that they
provided sufficient liquidity. The total TAF amount was raised from $600 billion in

22
December 2008 to $900 billion for a short time. We note, however, that the auction size
is always below 20% of total short-term debt, which, as Figure 2 shows, is around $5
trillion in aggregate. Moreover, much of the borrowing in the TAF was done by smaller
banks that are not in our sample (Figure 4), indicating that TAF provided well under 10%
of the short-term funding required by our sample firms even in Fall 2008. We conclude
that while TAF attracted more participation as short-term debt markets seized up, it did
not succeed in attracting a higher fraction of healthier banks than DW, despite the fact
that its loans did not carry a penalty. We conjecture that since the auctions are infrequent
and do not guarantee timely loans in a pinch, healthy banks are forced to obtain
alternative funds in the event that more aggressive bids shut them out of the TAF auction.
We next consider borrowing from the PDCF with a multiple event hazard function.
H3A predicts that the ST debt variable will be more important in these models and H2A
predicts that the impact will be greatest after Lehman fails since primary dealers tend to
rely heavily on ST debt to fund their balance sheets (Table 2, Panel A). Counter to the
liquidity framework, Table 7 reveals that PDCF usage is negatively related to a dealer’s
ST debt during the pre-Lehman period. While the ST debt coefficients increase
significantly for the post-Lehman period, the coefficients themselves are insignificant.
Prior to Lehman, deposits do not affect the likelihood of borrowing from PDCF, while
after Lehman, deposits have a significant negative effect. The decline in the coefficient is
significant in model 4. These results might reflect a switch from ST debt to deposits by
some primary dealers, especially as the largest primary dealers converted to bank holding
companies, which likely helped them attract more deposits. Overall, PDCF use provides
very little evidence in support of H3A.
Turning to the measures of solvency, the PDCF is more likely to be used when a
dealer is closer to default in both periods, but the insolvency measures are stronger in the
pre-Lehman period. During the post-Lehman period, the usage of PDCF is still related to
solvency characteristics, however, the relationships are either statistically
indistinguishable from pre-Lehman period (equity capital and ROA) or the absolute
levels of the coefficients decline (market-to-book and insolvency index). Overall, the
results show that institutions closer to default continued to be more likely to use PDCF
loans, although, the likelihood of accessing PDCF by weak firms does not increase

23
during times of market turmoil. Unlike the DW and TAF facilities, the PDCF is less
likely to be used by foreign firms. The coefficient on the indicator for primary dealers
that converted to bank holding companies is significantly positive in model 3, indicating
a preference for PDCF even when other Fed facilities are available. Finally, institutions
using TARP are also more likely to access PDCF.19 Overall, the findings for PDCF show
little support for the liquidity provision loan initiation hypothesis. The results indicate
that during the whole sample period, weak institutions were more likely to access PDCF.
However, this relationship did not increase during the post-Lehman period, suggesting
that the facility drew in somewhat healthier banks as the penalty rate declined.
Table 8 shows the same specifications of the hazard function for TSLF borrowing,
except for the time periods (reflecting the later start of the TSLF) and that the analysis
includes only auction dates. Contrary to the PDCF, TSLF borrowing is related to a
dealer’s funding model. Both ST debt and deposits are significant in the pre-Lehman
period in at least one model and have signs that support the liquidity framework in both
models. While the coefficients are larger in absolute value in the post-Lehman period
than in the pre-Lehman period, the increases are not statistically significant, which
contradicts H3A. Contrary to the results for the PDCF, all measures of solvency are
insignificant in the pre-Lehman period. In the post-Lehman period, the coefficients on
market-to-book and the insolvency index suggest that weaker banks accessed the TSLF.
Both of the increases in the coefficients are statistically significant. With respect to other
variables, we find that larger firms are more likely to use TSLF. Models 3 and 4 capture
the possibility of arbitrage, since they include an indicator variable for the period in late
2008 when the rate on TSLF loans is below the interest rate on excess reserves, but the
variable is not significant. Perhaps not surprisingly, firms that converted to a bank charter
are less likely to participate in TSLF auctions. TARP users are no more likely to access
TSLF than TARP non-users. Overall, these results are consistent with the bailout
framework and contrary to the liquidity provision hypothesis.
The PDCF and TSLF hazard function estimates provide mixed evidence on the role
of the liquidity provision framework for primary dealers. Thus, we further investigate the
19 We note that the forced TARP indicator cannot be included in the model because it is collinear with the indicator for banks with TARP balances (correlation of 0.94).

24
level of participation in the TSLF auctions. Similar to the TAF analysis, we calculate the
subscription ratio as total dollar bids submitted divided by the size of the auction and
analyze whether oversubscription (a subscription ratio larger than one) occurs more often
after Lehman. In untabulated results we note that in the 85 TSLF auctions in our sample
period, auctions taking place before Lehman and post-TARP (after 10/28/2008) periods
are undersubscribed, and significantly so in the post-TARP period. Only the auctions
taking place between September 15, 2008 and October 28, 2008 are significantly
oversubscribed. The TSLF arbitrage opportunity indicator enters with a significantly
positive coefficient, implying that some participation in the TSLF auctions is related to
the existence of arbitrage. This evidence is consistent with the loan initiation hypothesis
for TSLF and suggests that the penalty rate limits the appeal of the PDCF.
Next, we consider individual loans in the dataset to determine if the largest loans
are motivated by solvency or liquidity. We first identify loans exceeding $5 billion and
consider the circumstances under which these loans were obtained. Table 9 shows the
results of this analysis, including information on the largest and smallest loans for each
borrower in the time periods of interest. Panel A reveals that billions of dollars of loans
were made to troubled institutions after they announced a merger or bankruptcy. Bear
Stearns borrowed $28 billion the day after the announcement of its merger with
JPMorgan Chase and rolled over the debt until the merger was completed. Lehman
borrowed about $28 billion the day it filed for bankruptcy and then again in the next two
days, albeit in slightly smaller amounts. Wachovia was taken over by Wells Fargo after
the FDIC’s involvement in finding a buyer, essentially declaring it a failed bank. It too
borrowed from the Fed after it was clear it would no longer exist as an independent firm.
Finally, Merrill Lynch rolled over a series of large loans while in the process of being
acquired by Bank of America. These data indicate that the Fed did not always follow
Bagehot’s advice to lend to sound banks.20 Because of the redactions in the documents
20 See Thornton (2008). Bernanke alludes to the Fed’s intention of following the Bagehot rule: “In the context of the crisis of 2008, … the financial system … looked very different in its details, if not in its conceptual structure, from what Walter Bagehot saw in the 19th century. And so the challenge for us at the Fed was to adapt Bagehot's advice to the context of a modern financial system. So for example, instead of having retail depositors … standing in line out the doors … in the 1907 panic ,.. we had instead runs by … repo lenders or commercial-paper lenders, and we had to find ways to essentially provide liquidity to stop those runs.” (“Central Banking after the Great Recession: Lessons Learned and Challenges Ahead; A

25
produced by the Fed, we are unable to determine whether the loans to weak (and
sometimes insolvent) banks were classified as “primary credit” or “secondary credit”
loans.21
Panel B of Table 9 shows unusually large loans to foreign institutions. Dexia,
which had the largest DW loan ($37 billion) and Depfa, which borrowed $28.5 billion in
November 2008, accounted for all of the 70 largest DW loans in the sample. Panel B
shows that, besides the loan at the time of the Lehman bankruptcy, Barclays borrowed
billions earlier in the year. While these loans and the loans to Bank of Scotland and Royal
Bank of Scotland could have been in response to capital markets disruptions, the Bank of
Scotland loan could as likely have been related to the takeover of its parent company by
Lloyds on September 18, 2008 and its subsequent bailout. The other large loans to Dexia,
Depfa and Fortis occur around the time when each of the institutions received bailouts
from European governments. Hence, in these instances of borrowing by foreign banks,
Bagehot’s advice to lend to sound institutions was not followed.
We also review borrowing patterns by two banks that might have taken out loans of
$5 billion or more and did not: Goldman Sachs and JPMorgan Chase, two institutions
generally considered to have remained strong during the crisis. We find that borrowing
by these two firms was relatively limited even in the worst part of the crisis. For example,
Goldman Sachs only borrowed from the Fed in two periods, one of which includes the
date it became a bank holding company (September 21, 2008). The first loan was for
$100 million immediately after Bear Stearns failed and the other time was a series of
loans that were rolled over continuously from September 15 through November 27, 2008.
While the latter set of loans seems to support the idea of a liquidity shock in late 2008,
the quantities involved do not. Goldman had over a trillion dollars of liabilities at the end
of Q3 2008, including more than $250 billion of ST debt. Yet, most of the time after
Lehman’s bankruptcy, the bank only rolled over a billion dollars or less. The largest loan
was for $8 billion, but even that was repaid by November 28, the last day of its fiscal
Discussion with Federal Reserve Chairman Ben Bernanke on the Fed’s 100th Anniversary.” The Brookings Institution, Washington, D.C., January 16, 2014. 21 The Fed describes secondary credit loans as those made through the discount window when the bank is not eligible for primary credit (i.e., when the bank is not sound). It further notes that the purpose of such loans is on a very short term basis to facilitate an orderly resolution of serious financial difficulties. See http://www.frbdiscountwindow.org/programs.cfm?hdrID=14.

26
fourth quarter. Likewise, JPMorgan Chase’s borrowing is very small at a time when most
firms were thought to be struggling with frozen debt markets. While this bank borrowed
far more often than Goldman, the vast majority of its loans were in the first half of 2008
and coinciding with its takeover of Bear Stearns. It had seven loans from the DW and
PDCF in the second half of 2008, including four before Lehman’s bankruptcy, but the
median amount borrowed was only $250 million. Its largest loan, for $3 billion on
September 15, 2008, was a tiny fraction of its $2.25 trillion in assets and only 0.7% of its
short-term debt. And, like Goldman Sachs, JPMorgan Chase repaid the debt prior to the
end of its third quarter (September 30, 2008). The bank only borrowed twice from the
DW and PDCF in the last three months of 2008, each time for $10 million. JPMorgan
Chase borrowed more often from the TSLF, reaching a peak of $13 billion in April 2008.
Its TSLF borrowing dropped sharply from the first nine months of 2008 and ended
completely by early 2009.
Overall, our analysis shows that reliance on short-term debt funding was an
important factor in whether a bank or dealer borrowed from the Fed. This suggests that
the programs were important substitutes for frozen capital markets. However, several
results also indicate that the programs were disproportionately helpful to banks closer to
insolvency: frequent instances of posting equity and corporate bond collateral, rather than
the Treasury and MBS bonds typically seen in the repo market; measures of bank health
are often significant in the multivariate analysis, suggesting that insolvency was an
important reason for Fed borrowing; and a number of unusual loans, particularly to
already failed foreign banks, is inconsistent with widespread dislocations in short-term
debt markets. Overall, we conclude that our evidence favors the bailout loan initiation
hypothesis as much if not more than the liquidity provision hypothesis.
D. Tests of the loan prepayment hypotheses (H4)
Disruptions in debt markets around the time of the Lehman bankruptcy were
extreme, so we expect that borrowing from Fed programs would have continued at a high
level for some time. While Figure 1 suggests this is the case, Figures 3 and 5 show a
sharp drop-off in DW and PDCF borrowing before the end of the last quarter of 2008. By
late December only three primary dealers had PDCF debt outstanding: Morgan Stanley,

27
Merrill Lynch, and Citigroup.22 We note that the identity of the borrowers from these
programs was not made public until after the Fed lost the Bloomberg FOIA lawsuit and
that the publicly traded firms did not list these loans in detail in their SEC filings. We
therefore examine the propensity to repay DW and PDCF debt in hazard function
estimations in Tables 10 and 11.
Table 10 shows the results for the probability of repaying a DW loan using a
multiple event hazard function estimation. Hypotheses H1A, H2A and H3A imply that
firms with more ST debt would struggle to repay the Fed debt, especially after Lehman,
and would continue to roll over the loans until the crisis pressure subsided. In contrast, if
the bailout framework describes borrowing more accurately, firms with a greater fraction
of bad loans and a lower capital base would continue to use the programs as the market
penalizes them for being closer to insolvency (making the Fed’s penalty rate less onerous
for them). Table 10 shows that all of the variables are insignificant. Interestingly, during
the post-Lehman period, institutions were significantly more likely to prepay DW loans
as the quarter end approached, lending support to the bailout loan repayment hypothesis.
This result may also suggest that frozen debt markets thawed before December 31, 2008
as banks sought to repay DW loans before the quarter end. The desire to prepay DW
loans may further reflect the increased availability of deposits for banks.
Table 11 reports the same estimations for primary dealers borrowing from PDCF.
Among these firms, the end of quarter variable is significantly positive in the pre-Lehman
but not in the post-Lehman period. The insolvency index coefficient is significantly
negative in the pre-Lehman period, indicating that more insolvent firms are less likely to
prepay loans.
In untabulated results, we find that only a few firms borrowed amounts exceeding
30% of their equity from the Fed.23 In total, only 14 banks and 5 dealers ever borrowed
22 Since Bank of America announced the takeover of Merrill Lynch in September, its PDCF debt could easily have been associated with the merger, as has often been the case with DW and PDCF borrowing in the crisis. If so, the decline in LOLR lending through the PDCF was even sharper.
23 Our reference to the cutoff of 30% of equity reflects SEC guidance on reporting short-term debt (U.S. SEC Industry Guide at https://www.sec.gov/about/forms/industryguides.pdf). Specifically, p. 12 states: “VII. Short-Term Borrowings For each reported period, present the following information for each category of short-term borrowings reported in the financial statements pursuant to §210.0-04.11:
(1) The amounts outstanding at the end of the reported period, the weighted average interest rate thereon, and the general terms thereof;
28
such a high fraction from the Fed, and all but a handful of these firms had either already
failed or were about to be merged into a stronger bank.
Overall, the prepayment patterns show that firms avoided reporting Fed loans at the
end of a quarter as part of a strategy to avoid the effects of revealing poor financial
health. For primary dealers, solvency concerns during pre-Lehman period played a
significant role in loan prepayments. These results are consistent with the bailout loan
prepayment hypothesis.
3. Conclusion
The Federal Reserve introduced a number of emergency loan programs in the most
recent financial crisis in its role as lender of last resort in order to improve market
liquidity. In this paper we analyze the loan micro data to assess whether the programs
were effective in thawing the frozen capital markets or whether the programs amounted
to backdoor bailouts of weak institutions.
We find that the amount lent through the programs increased dramatically during
the crisis, but the total amount outstanding was always small relative to the amount of
short-term debt it was meant to replace. We document that throughout the crisis, private
debt markets supplied over 90% of the short-term debt used by the institutions in our
sample. Furthermore, while the usage of the programs became more widespread after the
Lehman bankruptcy, the results reveal a high concentration of borrowers even in the post-
Lehman period. We also find that only a small fraction of banks and a handful of primary
dealers ever borrowed as much as 30% of their equity at one time. Given their very high
leverage, this means that the majority of their assets were funded by private capital
markets and deposits.
We attribute the low level of borrowing from Fed facilities at least in part to the
high cost of borrowing. Previous research and our analysis indicate that most large
commercial banks and many of the primary dealers had ample access to deposits during
(2) The maximum amount of borrowings in each category outstanding at any month-end during each reported period; (3) The approximate average amounts outstanding during each reported period and the approximate weighted average interest rate thereon.
Instruction. This information is not required to be given for any category of short-term borrowings for which the average balance outstanding during the period was less than 30 percent of stockholders’ equity at the end of the period.”

29
the crisis. Since these funds were less expensive than secured debt with a penalty rate,
commercial banks would naturally rely on them more in a crisis. And as long as banks
had access to secured funding in the crisis from private markets, they had little incentive
to borrow from the DW or PDCF at the Fed’s high rates. We note that Fed borrowing was
not often backed with typical repo market collateral after Lehman, and instead involved a
large fraction of corporate bonds and equity.
Furthermore, while the Fed program borrowing is at a penalty rate, this penalty rate
does not take into account firm-specific (solvency) characteristics. Even the auction
programs, which do not set rates and have no penalty, encourage weaker banks to bid
more aggressively for funds, again making the relative cost of the Fed loans lower for
banks that were closer to insolvency. Furthermore, we find that weaker banks were more
likely to borrow from the Fed after Lehman declares bankruptcy while stronger firms like
Goldman and JPMorgan Chase avoided the loans. Our analysis of factors affecting DW
and PDCF loan prepayments also suggests that weaker banks took advantage of the
programs and repaid the loans in order to keep them out of the SEC filings.
In addition to the fact that the programs replaced only a small portion of the firms’
short-term debt, much of that low fraction owed to loans that were unrelated to market
conditions. Some of the largest individual loans were made to foreign firms that had
already failed, such as Dexia and Depfa. The timing of several large loans coincides with
a merger, such as JPMorgan’s acquisition of Bear Stearns, and not the result of market
freezes.
Overall, we conclude that the programs added liquidity to debt markets at a time
when they were stressed. However, the added liquidity was quite limited and it often
went to institutions in danger of a bailout or firms that already received one.

30
Appendix
A. 1. Fed Lending Pre- and Post-2007
Prior to the start of the crisis, the Fed’s emergency lending facilities consisted
solely of overnight lending to commercial banks via the discount window. The penalty at
that point was set at 100 basis points (bp) above the FF rate. Starting with the “quant
shock” in August 2007 (Khandani and Lo (2007)), the Fed modified the DW to expand
its LOLR role and subsequently introduced several new programs. It also reduced the
penalty to 50 bp. Appendix Table A1 summarizes the main borrowing facilities analyzed
in this paper available to large financial institutions during the crisis and Figure A1 shows
a timeline that relates them to events in the markets. An important change to its approach
occurred in March 2008 after the Bear Stearns bailout, when the Fed opened the discount
window to large investment banks (the primary dealers) via the PDCF and reduced the
penalty further to only 25 bp above the target FF rate. The rules for PDCF loans were
identical to those for commercial banks using the discount window – the loans were
short-term (ST), mostly overnight (although by that point up to a maturity of 90 days),
secured, and offered immediately to any firm that requested the money, no questions
asked as to why the cash was necessary.24 Both facilities made a distinction between
primary and secondary credit, with the former meant for sound institutions. In our data
we see no such distinction and thus we refer to the two types of loans as if they were the
same.
In contrast to the DW and PDCF, the TAF and TSLF were longer maturity
programs that lent money at regularly scheduled intervals to the winners of an auction.
The TAF began in December 2007 as a means of supplying additional liquidity to
commercial banks.25 The TAF was a biweekly auction of 28-day loans, where no bidder
could obtain more than ten percent of the auction total and the rate charged was
determined by the bidding. Initially, the program lent up to $20 billion but it was
expanded to $900 billion later when the crisis worsened. Unlike the DW and PDCF loans,
24 Madigan and Nelson (2002) discuss changes to the DW that were designed to reduce the stigma, including the elimination of the requirement that the borrower show evidence that other sources of funding were unavailable and therefore that the Fed was truly its last resort. 25 Goldman and Morgan Stanley converted to bank holding companies on September 22, 2008, making them eligible for both the DW and TAF on that date. Lehman was able to borrow from the DW through its bank subsidiary but not the TAF.

31
a TAF loan could not be paid back prior to maturity. Likewise, the TSLF was also a
biweekly auction of secured loans with 28-day maturities, but the TSLF auctions offered
up to $245 billion of loans to primary dealers.
Of the four programs, only the DW facility lasted beyond 2010. These emergency
facilities were considered temporary, for use in a crisis, and thus were considered
unnecessary by early 2010. For similar reasons, the penalty on DW loans was reset to 100
bp in 2010.
The Fed also introduced four other programs. However, these programs would not
be considered methods for a LOLR to provide funding to financial institutions in a crisis
and thus we do not match up their use to data on a specific commercial bank or primary
dealer. The CPFF was instituted in October 27 2008 to purchase commercial paper (CP)
directly from issuers. The AMLF, which began on September 19, 2008, purchased asset-
backed CP from money market mutual funds (see Duygan-Bump, Parkinson, Rosengren,
Suarez and Willen (2013)). A complementary program, the MMIF, was also intended as a
way to buy CP. The TALF was a debt guarantee program. We ignore these programs
because they were either not restricted to financial institutions (CPFF and TALF) or were
restricted to a set of financial institutions that did not borrow from potentially frozen
credit markets (AMLF and MMIF).
A. 2. Loan data
In response to an FOIA lawsuit by Bloomberg News, the Fed produced data on its
lending activities during the crisis. With respect to DW, two types of electronic
documents were produced for each day during the crisis: The first document shows loan
initiations on that day; the second shows all loans outstanding.26 We collect information
on the date the loan starts, how long it remains outstanding, its maturity date, the
borrower’s name, the type of institution, and its Federal Reserve district from the second
set of documents and cross-check these data with the documents on loan initiations. The
Fed classified institutions into seven categories, with the majority of institutions fitting
into the categories of Large Money Center Bank (LMCB), Other Large Commercial
Bank (OLCB), Small Commercial Bank, Thrift or Credit Union, and Foreign.
26 The Fed produced more than 29,000 pages of documents related to the Bloomberg’s FOIA lawsuit (all documents pertaining to DW borrowing were released as Acrobat files). The original electronic files produced by the Fed were obtained at: cdn.gotraffic.net/downloads/30110331_fed_release_documents.zip.
32
We obtain information on TAF, PDCF, and TSLF borrowing from the Fed’s
website.27 Files for each facility include the date the loan is initiated, its maturity date, the
institution’s name, the amount of the loan, its interest rate, and various items about
pledged collateral.
While all four of the programs were intended to provide liquidity to financial
institutions in an emergency, the features of the liquidity facilities differed in a number of
ways. Thus, we investigate the separate use of the facilities as well as the aggregate use.
The DW and the TAF are aimed at commercial banks. However, the TAF has limited
funding, in terms of both the frequency of the auctions and the size of the program, while
the DW offers the borrower immediate access to funds at any point in time. The PDCF
and the DW are identical in the terms of their loans, but the PDCF is for primary dealers
only and it does not start until after the announcement of the Bear Stearns acquisition.
However, by the fourth quarter of 2008 most of the large primary dealers are bank
holding companies and eligible for DW loans. Lastly, the TSLF lowered its requirements
on collateral after Lehman’s bankruptcy, likely affecting the choice of which program to
borrow from in late 2008.
27 http://www.federalreserve.gov/newsevents/reform_transaction.htm
33
References
Acharya, V.V., M.J. Fleming, W.B. Hrung, and A. Sarkar. 2014. Dealer Financial Conditions and Lender-of-Last Resort Facilities. Working paper.
Adrian, T., C.R. Burke, and J.J. McAndrews. 2009. The Federal Reserve’s Primary Dealer Credit Facility. Federal Reserve Bank of New York Current Issues 15:1-10.
Afonso, G., A. Kovner, and A. Schoar. 2011. Stressed, Not Frozen: The Federal Funds Market in the Financial Crisis. Journal of Finance 66: 1109-1139.
Andersen, P.K. and R.D. Gill . 1982. Cox’s Regression for Counting Processes: A Large Sample Study. Annals of Statistics 10: 110-1120.
Armantier, O., E. Ghysels, A. Sarkar, and J. Shrader. 2011. Stigma in Financial Markets: Evidence from Liquidity Auctions and Discount Window Borrowing during the Crisis. Working paper.
Artuc, E. and S. Demiralp. 2010. Discount Window Borrowing after 2003: The Explicit Reduction in Implicit Costs. Journal of Banking and Finance 34:825-833.
Ashcraft, A., M.L. Bech, and W.S. Frame. 2010. The Federal Home Loan Bank System: The Lender of Next-to-Last Resort? Journal of Money, Credit, and Banking 42:551-583.
Bagehot, W. 1873. Lombard Street: A Description of the Money Market. 3rd edition, Henry S. King, London. (http://oll.libertyfund.org/titles/128)
Bech, M.L. and E. Klee. 2011. The Mechanics of a Graceful Exit: Interest on Reserves and Segmentation in the Federal Funds Market. Journal of Monetary Economics 58:415-431.
Benmelech, E. and N.K. Bergman. 2009. Collateral Pricing. Journal of Financial Economics 91:339-360.
Berger, A. N., L. K. Black, C. H. S. Bouwman, and J. L. Dlugosz. 2013. The Federal Reserve’s Discount Window and TAF Programs: “Pushing on a String?” Working paper.
Boyson, N.M., J. Helwege, and J. Jindra. 2013. Crises, Liquidity Shocks and Fire Sales at Commercial Banks. Financial Management, forthcoming.
Brunnermeier, M. K. 2009. Deciphering the 2007-2008 Liquidity and Credit Crunch. Journal of Economic Perspectives 23:77-100.
Brunnermeier, M. K. and L. H. Pedersen. 2009. Market Liquidity and Funding Liquidity. Review of Financial Studies 22:2201-2238.
Christensen, J.H.E., J.A. Lopez, and G.D. Rudebusch. 2009. Do Central Bank Liquidity Facilities Affect Interbank Lending Rates? Working paper.

34
Copeland, A., A. Martin, and M. Walker. 2010. The Tri-Party Repo Market Before the 2010 Reforms. Working paper.
Cornett, M. M., J. McNutt, P. Strahan and H. Tehranian. 2011. Liquidity Risk Management and Credit Supply in the Financial Crisis. Journal of Financial Economics 101:297-312.
Cyree, K.B., M.D. Griffiths, and D.B. Winters. 2013. Federal Reserve Financial Crisis Lending Programs and Bank Stock. Journal of Banking and Finance 37:3819-3829.
Drechsler, I., T. Drechsel, D. Marques-Ibanez, and P. Schnabl. 2013. Who Borrows from the Lender of Last Resort? Working paper.
Duygan-Bump, B., P. Parkinson, E. Rosengren, G. Suarez and P. Willen. 2013. How Effective Were the Federal Reserve Emergency Liquidity Facilities? Evidence from the Asset-Backed Commercial Paper Money Market Mutual Fund Liquidity Facility. Journal of Finance 68:715-737.
Ennis, H.M. and J. M. Weinberg. 2009. A Model of Stigma in the Fed Funds Market. Working paper.
Fleming, M.J., W.B. Hrung, and F.M. Keane. 2009. The Term Securities Lending Facility: Origin, Design, and Effects. Federal Reserve Bank of New York Current Issues 15:1-10.
Furfine, C. 2001. The Reluctance to Borrow from the Fed. Economic Letters 72:209-213.
Furfine, C. 2003. Standing Facilities and Interbank Borrowing: Evidence from the Fed’s New Discount Window. International Finance 6:329-347.
Gatev, E., T. Schuermann, and P. Strahan. 2009. Managing Banks Liquidity Risk: How Deposit-Loan Synergies Vary with Market Conditions. Review of Financial Studies 22:995-1020.
Gatev, E. and P. Strahan. 2006. Banks’ Advantage in Hedging Liquidity Risk: Theory and Evidence from the Commercial Paper Market. Journal of Finance 61:867-892.
Gorton, G. and A. Metrick. 2012. Securitized Banking and the Run on the Repo. Journal of Financial Economics 104:425-451.
Gorton, G. and A. Metrick. 2013. The Federal Reserve and Financial Regulation: The First Hundred Years. Working paper.
Hrung, W.B. and J.S. Seligman. 2011. Responses to the Financial Crisis, Treasury Debt, and the Impact on Short-Term Money Markets. Working paper.
In, F., J. Cui and E.A. Maharaj. 2012. The Impact of a New Term Auction Facility on LIBOR-OIS Spreads and Volatility Transmission between Money and Mortgage Markets during the Subprime Crisis. Journal of International Money and Finance 31:1106-1125.

35
Kacperczyk, M. and P. Schnabl. 2010. When Safe Proved Risk: Commercial Paper during the Financial Crisis of 2007-2009. Journal of Economic Perspectives 24:29-50.
Khandani, A. and A. Lo. 2007. What Happened To The Quants In August 2007? Journal of Investment Management 5:29-78.
Krishnamurthy, A., S. Nagel, and D. Orlov, 2013. Sizing Up Repo, Journal of Finance forthcoming.
Madigan, B. and W. Nelson. 2002. Proposed Revisions to the Federal Reserve’s Discount Window Lending Programs. Federal Reserve Bulletin 88:314-319.
McAndrews, J., A. Sarkar, and Z. Wang. 2008. The Effects of the Term Auction Facility on the London Inter-Bank Offered Rate. Federal Reserve Bulletin 88:314-319.
Peristiani, S. 1998. The Growing Reluctance to Borrow at the Discount Window: An Empirical Investigation. The Review of Economics and Statistics 80:611-620.
Schwartz, A. 1992. The Misuse of the Fed’s Discount Window. Federal Reserve Bank of St. Louis Review September-October: 58-69.
Taylor, J.B. and J.C. Williams. 2008. A Black Swan in the Money Market. Working paper.
Thornton, D.L. 2008. Walter Bagehot, the Discount Window, and TAF. Federal Reserve Bank of St. Louis Economic Synopses 27: 1-2.
Wilson, L. Y.W. Wu and S. Prejean. 2014. Are the Bailouts of Wall Street Complements or Substitutes? Atlantic Economic Journal 42:21-38.
Wu, T. 2011. The U.S. Money Market and the Term Auction Facility in the Financial Crisis of 2007-2009. Review of Economics and Statistics 93:617-631.

Table 1 - Descriptive Statistics of Loans from the Federal Reserve During 8/2007 - 6/2009
Panel A: All (N = 3,614); Loan-Specific Ave Min Med Max
Loan Amount (million) $4,472 $0.001 $1,900 $47,942Interest Rate 1.46% 0.10% 1.25% 5.75%Maturity (days) 20 1 4 91
Panel B: DW (N = 1,147); Loan-Specific Ave Min Med Max
Loan Amount (million) $6,569 $0.001 $272 $35,000Interest Rate 1.78% 0.50% 1.75% 5.75%Maturity (days) 6 1 1 91
Panel C: TAF (N = 1,128); Loan-Specific Ave Min Med Max
Loan Amount (million) $2,041 $5.000 $1,000 $15,000Interest Rate 1.56% 0.20% 1.39% 4.67%Maturity (days) 45 28 28 84
Panel D: PDCF (N = 844); Loan-Specific Ave Min Med Max
Loan Amount (million) $5,316 $10.000 $3,521 $47,942Interest Rate 1.47% 0.50% 1.25% 3.25%Maturity (days) 2 28 28 28
Panel E: TSLF (N = 495); Loan-Specific Ave Min Med Max
Loan Amount (million) $3,714 $10.000 $4,000 $15,000Interest Rate 0.44% 0.10% 0.25% 3.22%Maturity (days) 28 8 29 32
All Loans (N = 3,379) $4,783 $0.001 $1,825 $49,118DW (N = 1,141) $6,603 $0.001 $275 $35,000TAF (N = 1,119) $2,057 $5.000 $1,000 $15,000PDCF (N = 844) $5,316 $10.000 $3,521 $47,942TSLF (N = 485) $3,791 $10.000 $3,900 $15,000
All Loans (N = 19,417) $6,941 $0.001 $2,500 $97,292DW (N = 2,414) $5,023 $0.001 $1,950 $37,000TAF (N = 16,748) $4,679 $5.000 $2,000 $60,000PDCF (N = 844) $9,862 $10.000 $7,400 $61,292TSLF (N = 3360) $10,697 $200.000 $8,977 $38,510
This table reports distribution of loan characteristics. Included are all loans by institutions with data in Compustat (bank orindustrial). DW stands for Primary and Secondary credit (Discount Window).
Panel F: Total Loan Amount Initiated on the Same Day; Bank-Initiation Day-Specific (million)
Panel G: Total Loan Amount on Calendar Day; Bank-Calendar Day-Specific

Users (N = 213)
Total Assets (billion) Ave $226.3 $26.5 *** $1,692.2Med $7.8 $2.9 *** $1,562.1
S-T Debt / TA Ave 8.39% 5.02% *** 23.75%Med 7.06% 3.11% *** 21.68%
Deposits / TA Ave 66.21% 68.65% * 41.54%Med 68.62% 71.47% ** 47.17%
Equity / TA Ave 8.32% 9.52% *** 4.03%Med 8.52% 8.78% ** 3.17%
ROA Ave 0.10% 0.07% -0.06%Med 0.16% 0.17% 0.06%
Non-Perf. Loans / Loans Ave 1.24% 1.70% **Med 0.88% 0.88%
MB Ave 1.04 1.02 ** 0.99Med 1.03 1.01 ** 1.00
Insolvency Index Ave 1.63 1.67 1.27Med 2.00 2.00 1.00
Foreign Indicator Ave 0.21 0.16 0.47
Used TARP Indicator Ave 0.42 0.31 ** 0.12
Repaid TARP before 6/2009 | Used TARP Ave 0.40 0.30 1.00
Table 2 - Univariate AnalysisIn Panel A, number of observations (N) reflects number of institutions in the sample on 12/31/2007. Users/Non-Users areinstitutions with available data on Bank Compustat and CRSP that have total assets larger than $1 billion as of 4Q 2006and accessed/did not access Fed facilties during the crisis. Insolvency Index is a sum of the following indicator variables:Equity/TA is below median, ROA is negative, Non-Perf. Loans/TA are above median, and MB is below median of the in-sample distribution. For primary dealers, Non-Perf. Loans are not used in the calculation of the Insolvency Index. TARPrelated variables are reported based on a sample of U.S. institutions only. ***, **, * denotes statistical significance at the1%, 5%, and 10% level, respectively, of test of means and medians against the Users group. Panels B-F showscharacteristics of unique users and the average of the loans obtained from each of the facility in a particular calendarquarter.
Non-Users(N = 169)
Panel A: Q4 2007Commercial Banks:
Primary Dealers(N = 17)

2007Q3 2007Q4 2008Q1 2008Q2 2008Q3 2008Q4 2009Q1 2009Q2
Panel B: Discount Window N 26 34 41 38 64 54 28 12
Total Assets (million, q-1) Ave $713,093 $233,942 $505,473 $248,238 $373,797 $145,416 $350,768 $215,190Med $181,583 $34,986 $59,849 $61,069 $33,673 $6,905 $16,320 $89,845
Loan Amount (million) Ave $269 $134 $410 $552 $390 $1,311 $1,870 $2,561Med $84 $3 $36 $105 $57 $19 $26 $8
Panel C: TAF N 18 52 39 46 50 57 35
Total Assets (million, q-1) Ave $548,494 $585,558 $496,848 $735,777 $457,343 $689,995 $438,455Med $273,763 $224,330 $111,396 $300,671 $144,627 $253,525 $150,737
Loan Amount (million) Ave $544 $1,252 $1,347 $1,525 $1,986 $2,215 $2,133Med $199 $783 $500 $984 $1,000 $1,126 $1,075
Panel D: PDCF N 6 5 9 9 4 2
Total Assets (million, q-1) Ave $1,879,932 $1,132,956 $1,871,473 $1,434,092 $1,536,673 $2,072,271Med $2,311,542 $1,090,896 $1,775,670 $1,446,309 $1,774,704 $2,072,271
Loan Amount (million) Ave $1,475 $4,241 $4,416 $6,934 $3,208 $2,648Med $1,286 $1,704 $4,393 $5,911 $2,973 $2,648
Panel E: TSLF N 11 11 14 10 11 2
Total Assets (million, q-1) Ave $1,959,424 $1,562,790 $1,978,952 $1,560,768 $2,116,232 $1,373,934Med $2,017,263 $1,217,613 $1,908,265 $1,514,146 $1,938,470 $1,373,934
Loan Amount (million) Ave $4,881 $3,760 $3,342 $4,032 $2,802 $3,700Med $3,000 $3,500 $3,820 $4,212 $2,633 $3,700
Panel F: All N 79 66 91 86 76 43
Total Assets (million, q-1) Ave $505,906 $436,916 $496,436 $325,750 $567,135 $397,977Med $142,543 $106,444 $126,649 $33,572 $205,656 $142,144
Loan Amount (million) Ave $1,128 $1,398 $1,158 $2,035 $2,243 $1,950Med $354 $410 $420 $299 $902 $1,000
Table 2, continued
Pre-Bear Post-Bear & Pre-Lehman Post-Lehman

Pre-Lehman
Panel A: HHI Loans
Discount Window Ave 0.776 0.497 ***Med 0.867 0.491 ***
TAF Ave 0.058 0.027 ***Med 0.053 0.032 ***
PDCF Ave 0.635 0.292 ***Med 0.608 0.290 ***
TSLF Ave 0.094 0.152 ***Med 0.082 0.148 ***
Discount Window Ave 25.155 16.117 ***Med 28.411 15.985 ***
TAF Ave 2.724 1.310 ***Med 2.511 1.639 ***
PDCF Ave 8.505 4.193 ***Med 7.956 4.197 ***
TSLF Ave 1.656 2.604 ***Med 1.586 2.626 ***
Table 3 - Statistical Tests of Changes in Loan ConcentrationThis table reports the average and median concentration of loans in DW, TAF, PDCF, and TSLF forperiods preceding and following the Lehman bankruptcy. The concentration is measured as theHerfindahl index (HHI) of loans taken out on the same day (Panel A) and as the HHI of loans taken outon the same day scaled by the HHI of total assets of total assets of firms in the sample eligible toborrow from a particular program. ***, **, * denotes statistical significance at the 1%, 5%, and 10%level, respectively, of test of means and medians.
Post-Lehman(9/16/08 - 12/31/08)
Panel B: HHI Loans Normalized by Size HHI

Type of Collateral 2008Q1 2008Q2 Total
N 154 14 168 202 286 140 48
US Treasury / Agency Ave 1.56% 0.00% 1.43% 0.92% 0.87% 0.22% 0.27%Med 0.00% 0.00% 0.00% 0.00% *** 0.00% *** 0.00% *** 0.08% ***
MBS Agency & Other, ABS Ave 59.43% 13.35% 55.59% 14.77% *** 8.04% *** 12.32% *** 14.25% ***Med 73.80% 0.24% 56.21% 2.75% *** 7.81% *** 2.58% *** 7.52% ***
Municipal Securities Ave 12.78% 86.56% 18.93% 4.21% *** 17.34% 0.39% *** 6.24% ***Med 0.01% 99.12% 0.02% 0.05% 0.03% *** 0.01% 1.27% ***
Corporate Market Instruments Ave 26.23% 0.09% 24.05% 48.09% *** 48.46% *** 56.13% *** 49.14% ***Med 0.86% 0.00% 0.62% 45.44% *** 35.80% *** 58.48% *** 51.40% ***
Equity Securities Ave 0.00% 0.00% 0.00% 25.02% *** 16.02% *** 15.94% *** 17.52% ***Med 0.00% 0.00% 0.00% 20.73% *** 13.92% *** 15.35% *** 13.70% ***
International & Loans & Other Ave 0.00% 0.00% 0.00% 6.98% *** 9.26% *** 15.00% *** 12.57% ***Med 0.00% 0.00% 0.00% 1.80% *** 5.56% *** 8.87% *** 9.58% ***
Table 4 - Percent of Type of Collateral Pledged for PDCF Loans Over Time
Pre-Lehman Post-Lehman2009Q22009Q12008Q42008Q3
This table reports the fraction of collateral pledged for PDCF loans for institutions in our sample. The collateral information is obtained from the Federal Reserve websiteon PDCF (http://www.federalreserve.gov/newsevents/reform_pdcf.htm). Total reports number of observations, average, and median for the pre-Lehman period. ***, **,and * indicates that the averages/medians for a post-Lehman quarter and the entire pre-Lehman period are significantly different at the 1%, 5%, and 10%, respectively.
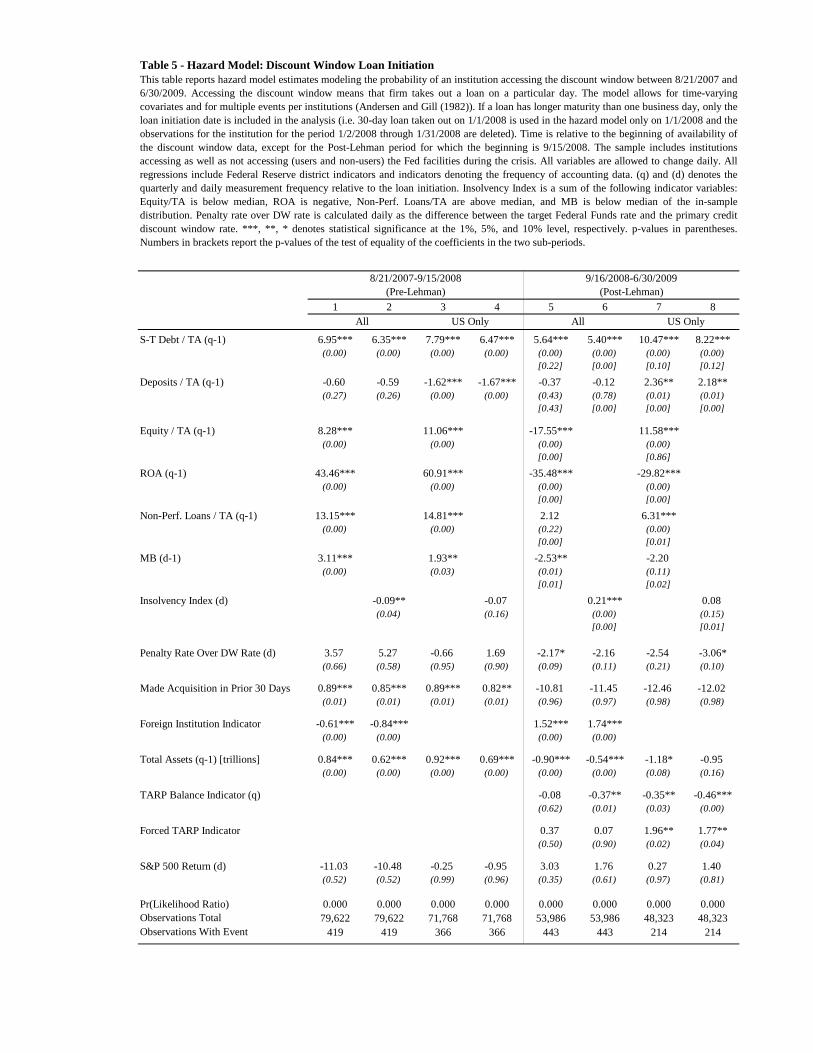
1 2 3 4 5 6 7 8
S-T Debt / TA (q-1) 6.95*** 6.35*** 7.79*** 6.47*** 5.64*** 5.40*** 10.47*** 8.22***(0.00) (0.00) (0.00) (0.00) (0.00) (0.00) (0.00) (0.00)
[0.22] [0.00] [0.10] [0.12]
Deposits / TA (q-1) -0.60 -0.59 -1.62*** -1.67*** -0.37 -0.12 2.36** 2.18**(0.27) (0.26) (0.00) (0.00) (0.43) (0.78) (0.01) (0.01)
[0.43] [0.00] [0.00] [0.00]
Equity / TA (q-1) 8.28*** 11.06*** -17.55*** 11.58***(0.00) (0.00) (0.00) (0.00)
[0.00] [0.86]
ROA (q-1) 43.46*** 60.91*** -35.48*** -29.82***(0.00) (0.00) (0.00) (0.00)
[0.00] [0.00]
Non-Perf. Loans / TA (q-1) 13.15*** 14.81*** 2.12 6.31***(0.00) (0.00) (0.22) (0.00)
[0.00] [0.01]
MB (d-1) 3.11*** 1.93** -2.53** -2.20 (0.00) (0.03) (0.01) (0.11)
[0.01] [0.02]
Insolvency Index (d) -0.09** -0.07 0.21*** 0.08 (0.04) (0.16) (0.00) (0.15)
[0.00] [0.01]
Penalty Rate Over DW Rate (d) 3.57 5.27 -0.66 1.69 -2.17* -2.16 -2.54 -3.06*(0.66) (0.58) (0.95) (0.90) (0.09) (0.11) (0.21) (0.10)
Made Acquisition in Prior 30 Days 0.89*** 0.85*** 0.89*** 0.82** -10.81 -11.45 -12.46 -12.02 (0.01) (0.01) (0.01) (0.01) (0.96) (0.97) (0.98) (0.98)
Foreign Institution Indicator -0.61*** -0.84*** 1.52*** 1.74***(0.00) (0.00) (0.00) (0.00)
Total Assets (q-1) [trillions] 0.84*** 0.62*** 0.92*** 0.69*** -0.90*** -0.54*** -1.18* -0.95 (0.00) (0.00) (0.00) (0.00) (0.00) (0.00) (0.08) (0.16)
TARP Balance Indicator (q) -0.08 -0.37** -0.35** -0.46***(0.62) (0.01) (0.03) (0.00)
Forced TARP Indicator 0.37 0.07 1.96** 1.77**(0.50) (0.90) (0.02) (0.04)
S&P 500 Return (d) -11.03 -10.48 -0.25 -0.95 3.03 1.76 0.27 1.40 (0.52) (0.52) (0.99) (0.96) (0.35) (0.61) (0.97) (0.81)
Pr(Likelihood Ratio) 0.000 0.000 0.000 0.000 0.000 0.000 0.000 0.000Observations Total 79,622 79,622 71,768 71,768 53,986 53,986 48,323 48,323Observations With Event 419 419 366 366 443 443 214 214
This table reports hazard model estimates modeling the probability of an institution accessing the discount window between 8/21/2007 and6/30/2009. Accessing the discount window means that firm takes out a loan on a particular day. The model allows for time-varyingcovariates and for multiple events per institutions (Andersen and Gill (1982)). If a loan has longer maturity than one business day, only theloan initiation date is included in the analysis (i.e. 30-day loan taken out on 1/1/2008 is used in the hazard model only on 1/1/2008 and theobservations for the institution for the period 1/2/2008 through 1/31/2008 are deleted). Time is relative to the beginning of availability ofthe discount window data, except for the Post-Lehman period for which the beginning is 9/15/2008. The sample includes institutionsaccessing as well as not accessing (users and non-users) the Fed facilities during the crisis. All variables are allowed to change daily. Allregressions include Federal Reserve district indicators and indicators denoting the frequency of accounting data. (q) and (d) denotes thequarterly and daily measurement frequency relative to the loan initiation. Insolvency Index is a sum of the following indicator variables:Equity/TA is below median, ROA is negative, Non-Perf. Loans/TA are above median, and MB is below median of the in-sampledistribution. Penalty rate over DW rate is calculated daily as the difference between the target Federal Funds rate and the primary creditdiscount window rate. ***, **, * denotes statistical significance at the 1%, 5%, and 10% level, respectively. p-values in parentheses.Numbers in brackets report the p-values of the test of equality of the coefficients in the two sub-periods.
Table 5 - Hazard Model: Discount Window Loan Initiation
8/21/2007-9/15/2008(Pre-Lehman)
US OnlyAllUS OnlyAll
9/16/2008-6/30/2009(Post-Lehman)

1 2 3 4 5 6 7 8
S-T Debt / TA (q-1) 6.18*** 6.33*** 5.87*** 4.58*** 7.44*** 7.26*** 11.19*** 10.08***(0.00) (0.00) (0.00) (0.00) (0.00) (0.00) (0.00) (0.00)
[0.57] [0.83] [0.01] [0.00]
Deposits / TA (q-1) -0.44 -0.24 -2.42*** -3.63*** 0.52 0.42 -0.54 -1.93***(0.45) (0.68) (0.00) (0.00) (0.35) (0.44) (0.52) (0.00)
[0.67] [0.12] [0.77] [0.63]
Equity / TA (q-1) -6.22** -1.83 -3.69 5.36*(0.02) (0.57) (0.11) (0.08)
[0.93] [0.06]
ROA (q-1) -30.83*** -25.58** -18.44*** -11.60**(0.00) (0.01) (0.00) (0.04)
[0.39] [0.77]
Non-Perf. Loans / TA (q-1) -14.10** -20.04** -11.75*** -8.51 (0.02) (0.04) (0.01) (0.17)
[0.79] [0.19]
MB (d-1) 0.52 -10.10*** 0.99 -5.36**(0.15) (0.00) (0.21) (0.01)
[0.72] [0.08]
Insolvency Index (d) 0.27*** 0.47*** 0.02 0.13*(0.00) (0.00) (0.65) (0.05)
[0.00] [0.00]
Made Acquisition in Prior 30 Days 0.47 0.36 0.16 0.18 -0.07 -0.08 -0.41 -0.28 (0.32) (0.45) (0.74) (0.72) (0.89) (0.88) (0.45) (0.61)
Foreign Institution Indicator 1.63*** 2.07*** 1.71*** 1.99***(0.00) (0.00) (0.00) (0.00)
Total Assets (q-1) [trillions] 0.29*** 0.31*** 0.44 0.81 0.47*** 0.50*** 0.21 0.25 (0.00) (0.00) (0.44) (0.12) (0.00) (0.00) (0.51) (0.43)
TARP Balance Indicator (q) 1.29*** 1.39*** 1.49*** 1.60*** 0.62*** 0.65*** 0.61*** 0.66***(0.00) (0.00) (0.00) (0.00) (0.00) (0.00) (0.00) (0.00)
Forced TARP Indicator 0.76** 0.92*** 0.29 -0.28 1.39*** 1.49*** 1.31** 1.08*(0.01) (0.00) (0.75) (0.71) (0.00) (0.00) (0.02) (0.06)
S&P 500 Return (d) 6.29 9.70 -7.99 3.41 -1.58 -1.77 3.78 4.11 (0.75) (0.64) (0.85) (0.93) (0.74) (0.71) (0.73) (0.69)
Pr(Likelihood Ratio) 0.00 0.00 0.00 0.00 0.00 0.00 0.00 0.00Observations Total 6,391 6,391 5,633 5,633 6,417 6,417 5,664 5,664Observations With Event 334 334 170 170 400 400 191 191
This table reports hazard model estimates modeling the probability of an institution accessing the TAF between 12/12/2007 and6/30/2009. The model allows for time-varying covariates and for multiple events per institutions (Andersen and Gill (1982)).Accessing the TAF means that a firm takes out a loan on a particular auction day. Only the loan initiation date is included in theanalysis (i.e. 30-day loan taken out on 1/1/2008 is used in the hazard model only on 1/1/2008 and the observations for theinstitution for the period 1/2/2008 through 1/31/2008 are deleted). Time is relative to the beginning of availability of the data,except for the Post-Lehman period for which the beginning is 9/15/2008. The sample includes institutions accessing as well as notaccessing (users and non-users) the Fed facilities during the crisis. All variables are allowed to change daily. All regressionsinclude Federal Reserve district indicators and indicators denoting the frequency of accounting data. (q) and (d) denotes thequarterly and daily measurement frequency relative to the loan initiation. ***, **, * denotes statistical significance at the 1%, 5%,and 10% level, respectively. p-values in parentheses. Numbers in brackets report the p-values of the test of equality of thecoefficients in the two sub-periods.
Table 6 - Hazard Model: TAF Loan Initiations
12/12/2007-9/15/2008(Pre-Lehman)
All US Only All US Only
9/16/2008-6/30/2009(Post-Lehman)

1 2 3 4
S-T Debt / TA (q-1) -2.66* -1.29 1.25 2.07 (0.10) (0.16) (0.53) (0.21)
[0.00] [0.00]
Deposits / TA (q-1) -1.39 0.91 -2.92*** -1.81**(0.23) (0.22) (0.00) (0.03)
[0.23] [0.02]
Equity / TA (q-1) -65.27*** 3.57 (0.00) (0.47)
[0.91]ROA (q-1) -71.26 -122.82***
(0.16) (0.00)[0.34]
MB (d-1) -51.68*** -48.93***(0.00) (0.00)
[0.00]
Insolvency Index (d) 0.93*** 0.77***(0.00) (0.00)
[0.00]
Foreign Institution Indicator -2.97*** -1.12*** -2.51*** -3.24***(0.00) (0.00) (0.00) (0.00)
Total Assets (q-1) [trillions] 0.31 -0.40*** 0.21 0.30 (0.21) (0.00) (0.43) (0.21)
TARP Balance Indicator (q) 0.63* 0.65*(0.09) (0.10)
Conv. To Bank Chrt. Indicator (d) 0.35** 0.15 (0.02) (0.29)
S&P 500 Return (d) -440.15 -449.99 44.18 61.78*(0.99) (0.98) (0.22) (0.10)
Pr(Likelihood Ratio) 0.00 0.00 0.00 0.00Observations Total 1,673 1,673 2,194 2,194Observations With Event 152 152 540 540
9/16/2008-6/30/2009(Post-Lehman)
This table reports hazard model estimates modeling the probability of an institution accessing thePDCF between 3/17/2007 and 6/30/2009. The model allows for time-varying covariates and formultiple events per institutions (Andersen and Gill (1982)). Accessing the PDCF means that a firmtakes out a loan on a particular day. If a loan has longer maturity than one business day, only the loaninitiation date is included in the analysis (i.e. 30-day loan taken out on 1/1/2008 is used in the hazardmodel only on 1/1/2008 and the observations for the institution for the period 1/2/2008 through1/31/2008 are deleted). Time is relative to the beginning of availability of the data, except for the Post-Lehman period for which the beginning is 9/15/2008. The sample includes only primary dealers. Allregressions include indicators denoting the frequency of accounting data. (q) and (d) denotes thequarterly and daily measurement frequency relative to the loan initiation. ***, **, * denotes statisticalsignificance at the 1%, 5%, and 10% level, respectively. p-values in parentheses. Numbers in bracketsreport the p-values of the test of equality of the coefficients in the two sub-periods.
Table 7 - Hazard Model: PDCF Loan Initiations
3/17/2008-9/15/2008(Pre-Lehman)
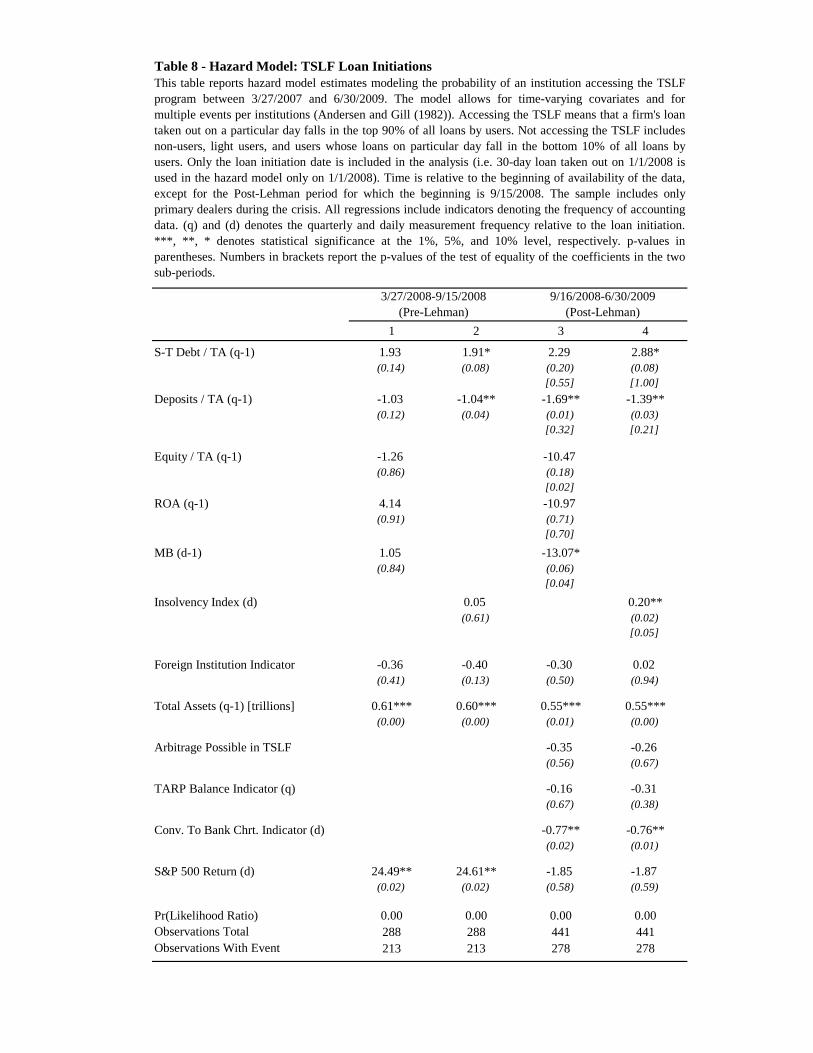
1 2 3 4
S-T Debt / TA (q-1) 1.93 1.91* 2.29 2.88*(0.14) (0.08) (0.20) (0.08)
[0.55] [1.00]Deposits / TA (q-1) -1.03 -1.04** -1.69** -1.39**
(0.12) (0.04) (0.01) (0.03)[0.32] [0.21]
Equity / TA (q-1) -1.26 -10.47 (0.86) (0.18)
[0.02]ROA (q-1) 4.14 -10.97
(0.91) (0.71)[0.70]
MB (d-1) 1.05 -13.07*(0.84) (0.06)
[0.04]
Insolvency Index (d) 0.05 0.20**(0.61) (0.02)
[0.05]
Foreign Institution Indicator -0.36 -0.40 -0.30 0.02 (0.41) (0.13) (0.50) (0.94)
Total Assets (q-1) [trillions] 0.61*** 0.60*** 0.55*** 0.55***(0.00) (0.00) (0.01) (0.00)
Arbitrage Possible in TSLF -0.35 -0.26 (0.56) (0.67)
TARP Balance Indicator (q) -0.16 -0.31 (0.67) (0.38)
Conv. To Bank Chrt. Indicator (d) -0.77** -0.76**(0.02) (0.01)
S&P 500 Return (d) 24.49** 24.61** -1.85 -1.87 (0.02) (0.02) (0.58) (0.59)
Pr(Likelihood Ratio) 0.00 0.00 0.00 0.00Observations Total 288 288 441 441Observations With Event 213 213 278 278
Table 8 - Hazard Model: TSLF Loan Initiations
3/27/2008-9/15/2008(Pre-Lehman)
9/16/2008-6/30/2009(Post-Lehman)
This table reports hazard model estimates modeling the probability of an institution accessing the TSLFprogram between 3/27/2007 and 6/30/2009. The model allows for time-varying covariates and formultiple events per institutions (Andersen and Gill (1982)). Accessing the TSLF means that a firm's loantaken out on a particular day falls in the top 90% of all loans by users. Not accessing the TSLF includesnon-users, light users, and users whose loans on particular day fall in the bottom 10% of all loans byusers. Only the loan initiation date is included in the analysis (i.e. 30-day loan taken out on 1/1/2008 isused in the hazard model only on 1/1/2008). Time is relative to the beginning of availability of the data,except for the Post-Lehman period for which the beginning is 9/15/2008. The sample includes onlyprimary dealers during the crisis. All regressions include indicators denoting the frequency of accountingdata. (q) and (d) denotes the quarterly and daily measurement frequency relative to the loan initiation.***, **, * denotes statistical significance at the 1%, 5%, and 10% level, respectively. p-values inparentheses. Numbers in brackets report the p-values of the test of equality of the coefficients in the twosub-periods.

Table 9 - Detailed Information on Selected Loans Made Through Discount Window and PDCF
Institution Loan Initiation
Loan Maturity/
Repayment
Amount/ Range
(billion)Facility
Panel A: Discount Window and PDCF Borrowing of Selected Merged/Failed Institutions
Bear Stearns & Co. 3/17/2008 Rolled over $28.0 PDCF 3/16/2008: Merger announcement (JPM-Chase)through 5/30/2008 $7.2 5/29/2008: Merger approval by shareholders
Lehman Brothers Inc. 9/15/2008 9/16/2008 $28.0 PDCF 9/15/2008: Bankruptcy9/16/2008 9/17/2008 $19.7 PDCF9/17/2008 9/18/2008 $20.4 PDCF
Wachovia 10/6/2008 11/4/2008 $6.0 DW10/6/2008 11/5/2008 $23.0 DW10/8/2008 10/22/2008 $7.0 DW
Merrill Lynch 9/17/2008 Rolled over $4.7 PDCFthrough 12/30/2008 $33.2 PDCF
12/9/2008 12/10/2008 $2.0 DW
Panel B: Discount Window and/or PDCF Borrowing of at Least $5 billion by Selected Foreign Institutions:
Bank of Scotland 9/17/2008 10/17/2008 $5.0 DW 9/18/2008:I10/13/2008:I
Merger announcement (Lloyds TSB) Bailout by UK
Barclays PLC 9/18/2008 Rolled over $47.9 PDCF 9/16/2008: Agreement to acquire Lehmanthrough 10/7/2008 $8.0 PDCF
Depfa 10/7/2008 Rolled over $5.0 DW 9/29/2008: Bailout proposal announcementthrough 6/30/2009 $28.5 DW 10/6/2008: Holding company bailout by Germany
Dexia 4/18/2008 Rolled over $6.0 DW 9/30/2008: Moody's downgrade from Aa1 to Aa3through 6/30/2009 $37.0 DW 9/30/2008:I
1/19/2009:IBailout by Belgium and France Moody's downgrade from Aa3 to A1
Fortis 9/29/2008 9/30/2008 $7.0 DW 9/28/2008: Partial nationalization by Benelux
Royal Bank of Scotland 10/6/2008 10/7/2008 $8.4 DW 10/13/2008: Recapitalization by UK
For loans rolled over, the minimum and maximum amount are shown - note that those amounts do not necessarily correspond to the dates shown.
9/14/2008:I12/5/2008:I
Merger announcement (BofA)Merger approval by shareholders
Notes
10/3/2008:I12/31/2008:I 10/22/2008:I
Merger announcement (Wells Fargo)Merger completed Loan partially repaid ($3 billion)
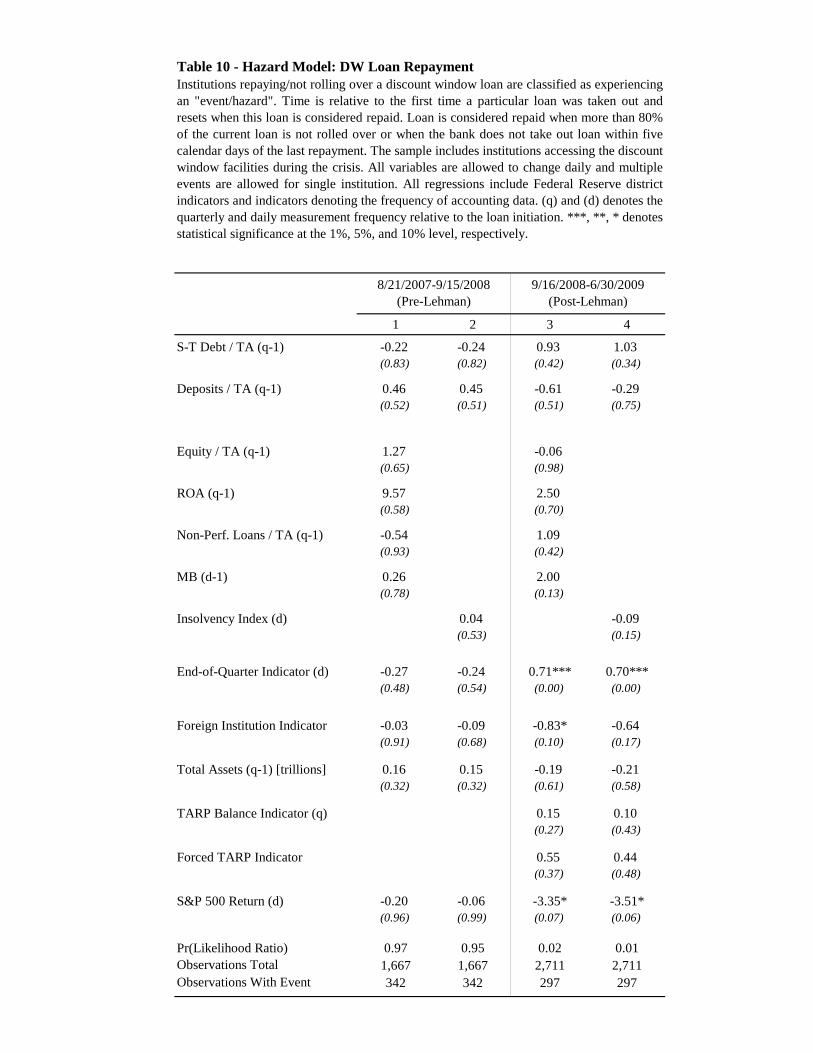
1 2 3 4
S-T Debt / TA (q-1) -0.22 -0.24 0.93 1.03 (0.83) (0.82) (0.42) (0.34)
Deposits / TA (q-1) 0.46 0.45 -0.61 -0.29 (0.52) (0.51) (0.51) (0.75)
Equity / TA (q-1) 1.27 -0.06 (0.65) (0.98)
ROA (q-1) 9.57 2.50 (0.58) (0.70)
Non-Perf. Loans / TA (q-1) -0.54 1.09 (0.93) (0.42)
MB (d-1) 0.26 2.00 (0.78) (0.13)
Insolvency Index (d) 0.04 -0.09 (0.53) (0.15)
End-of-Quarter Indicator (d) -0.27 -0.24 0.71*** 0.70***(0.48) (0.54) (0.00) (0.00)
Foreign Institution Indicator -0.03 -0.09 -0.83* -0.64 (0.91) (0.68) (0.10) (0.17)
Total Assets (q-1) [trillions] 0.16 0.15 -0.19 -0.21 (0.32) (0.32) (0.61) (0.58)
TARP Balance Indicator (q) 0.15 0.10 (0.27) (0.43)
Forced TARP Indicator 0.55 0.44 (0.37) (0.48)
S&P 500 Return (d) -0.20 -0.06 -3.35* -3.51*(0.96) (0.99) (0.07) (0.06)
Pr(Likelihood Ratio) 0.97 0.95 0.02 0.01Observations Total 1,667 1,667 2,711 2,711Observations With Event 342 342 297 297
9/16/2008-6/30/2009(Post-Lehman)
Institutions repaying/not rolling over a discount window loan are classified as experiencingan "event/hazard". Time is relative to the first time a particular loan was taken out andresets when this loan is considered repaid. Loan is considered repaid when more than 80%of the current loan is not rolled over or when the bank does not take out loan within fivecalendar days of the last repayment. The sample includes institutions accessing the discountwindow facilities during the crisis. All variables are allowed to change daily and multipleevents are allowed for single institution. All regressions include Federal Reserve districtindicators and indicators denoting the frequency of accounting data. (q) and (d) denotes thequarterly and daily measurement frequency relative to the loan initiation. ***, **, * denotesstatistical significance at the 1%, 5%, and 10% level, respectively.
Table 10 - Hazard Model: DW Loan Repayment
8/21/2007-9/15/2008(Pre-Lehman)

1 2 3 4
S-T Debt / TA (q-1) 5.64 2.86 -34.34 -25.45 (0.23) (0.46) (0.16) (0.12)
Deposits / TA (q-1) -16.59 -23.76 -13.43 0.70 (0.45) (0.26) (0.45) (0.93)
Equity / TA (q-1) 101.91 -486.16 (0.18) (0.12)
ROA (q-1) 140.64 872.84 (0.29) (0.47)
MB (d-1) 115.27** -185.23 (0.03) (0.21)
Insolvency Index (d) -1.63** -0.48 (0.02) (0.53)
End-of-Quarter Indicator (d) 3.59** 4.08** 8.01 1.54 (0.03) (0.01) (0.36) (0.40)
Foreign Institution Indicator 12.42 8.15 -6.02 1.30 (0.10) (0.18) (0.49) (0.55)
Total Assets (q-1) [trillions] -1.93 -0.02 -6.76* -4.62 (0.16) (0.98) (0.10) (0.10)
Arbitrage Possible in TSLF 18.17 16.38 (1.00) (1.00)
TARP Balance Indicator (q) 30.13 1.78 (0.11) (0.59)
Pr(Likelihood Ratio) 0.04 0.02 0.03 0.19Observations Total 152 152 383 383Observations With Event 16 16 10 10
Table 11 - Hazard Model: PDCF Loan Repayment
3/17/2008-9/15/2008(Pre-Lehman)
9/16/2008-6/30/2009(Post-Lehman)
Institutions repaying/not rolling over a PDCF loan are classified as experiencing an "event/hazard".Time is relative to the first time a particular loan was taken out and resets when this loan isconsidered repaid. Loan is considered repaid when more than 80% of the current loan is not rolledover or when the institution does not take out loan within five calendar days of the last repayment.The sample includes institutions accessing the PDCF facilities during the crisis. CorporateInstruments Collateral Indicator equals one if the collateral pledged contains unsecured securitiesissued by private corporations. All variables are allowed to change daily. (q) and (d) denotes thequarterly and daily measurement frequency relative to the loan initiation. ***, **, * denotesstatistical significance at the 1%, 5%, and 10% level, respectively.

$0
$150
$300
$450
$600
$750
$900
(bill
ions
)
TSLF PDCF TAF Primary & Secondary
Figure 1: Total Primary and Secondary Credit, PDCF, TAF, and TSLF Borrowing for Financial Institutions: 8/20/2007 - 6/30/2009
Source: Federal Reserve (FOIA 3/31/2011)
3/17/2008 9/15/2008

$0
$1,000
$2,000
$3,000
$4,000
$5,000
$6,000
(bill
ions
)
Total S-T Debt Total Fed Borrowing: U.S. Institutions Total Fed Borrowing: Foreign Banks
Figure 2: Total Fed Borrowing and S-T Debt for Sample Financial Institutions: 1/2/2008 - 6/30/2009
Source: Federal Reserve (FOIA 3/31/2011)
3/17/2008 9/15/2008
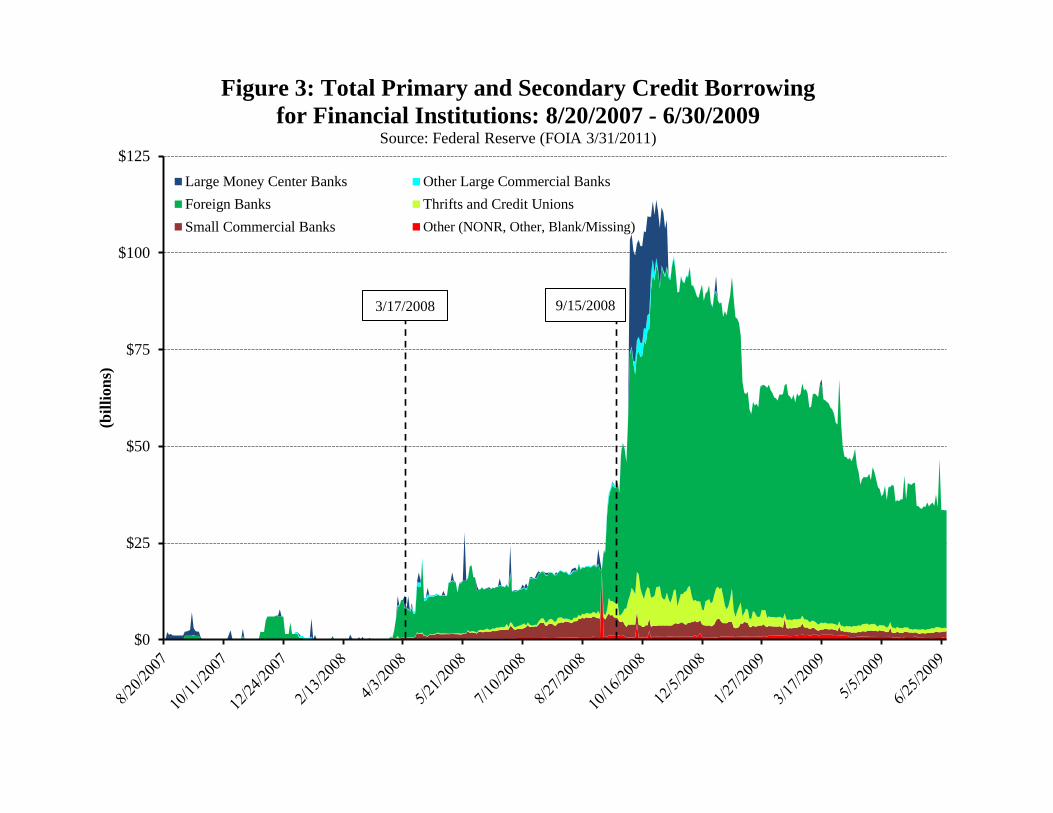
$0
$25
$50
$75
$100
$125
(bill
ions
)
Large Money Center Banks Other Large Commercial BanksForeign Banks Thrifts and Credit UnionsSmall Commercial Banks Other (NONR, Other, Blank/Missing)
Figure 3: Total Primary and Secondary Credit Borrowing for Financial Institutions: 8/20/2007 - 6/30/2009
Source: Federal Reserve (FOIA 3/31/2011)
3/17/2008 9/15/2008

$0
$100
$200
$300
$400
$500
$600
$700
$800
$900
(bill
ions
)
Total Amount Made Available Other Large Commercial BanksForeign Banks Thrifts and Credit UnionsSmall Commercial Banks Other (NONR, Other, Blank/Missing)
Large Money Center Banks
Figure 4: Total TAF Borrowing and Total Amount Made Available for Financial Institutions: 8/20/2007 - 6/30/2009
Source: Federal Reserve (FOIA 3/31/2011)
3/17/2008 9/15/2008

$0
$20
$40
$60
$80
$100
$120
$140
$160
(bill
ions
)
Banc of America SecuritiesBarclays Capital Inc.Bear, Stearns & Co.BNP Paribas SecuritiesCantor Fitzgerald & Co.CitigroupCountrywide SecuritiesCredit Suisse Securities USA Daiwa Securities America Inc. Deutsche Bank Securities Inc.Dresdner Kleinwort SecuritiesGoldman Sachs J. P. Morgan Securities Inc. Lehman Brothers Inc.Merrill LynchMizuho Securities USAMorgan StanleyUBS Securities
Figure 5: Total PDCF Borrowing for Financial Institutions: 3/14/2008 - 6/30/2009
Source: Federal Reserve (FOIA 3/31/2011)
9/15/2008
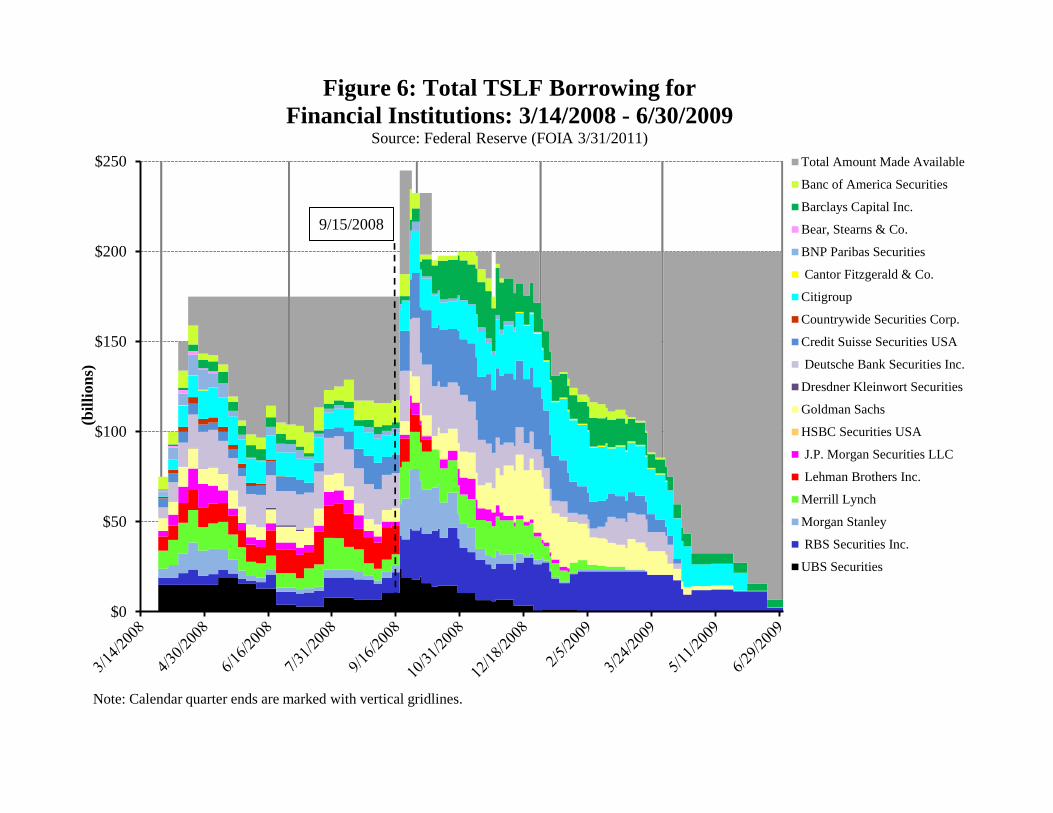
$0
$50
$100
$150
$200
$250
(bill
ions
)
Total Amount Made Available
Banc of America Securities
Barclays Capital Inc.
Bear, Stearns & Co.
BNP Paribas Securities
Cantor Fitzgerald & Co.
Citigroup
Countrywide Securities Corp.
Credit Suisse Securities USA
Deutsche Bank Securities Inc.
Dresdner Kleinwort Securities
Goldman Sachs
HSBC Securities USA
J.P. Morgan Securities LLC
Lehman Brothers Inc.
Merrill Lynch
Morgan Stanley
RBS Securities Inc.
UBS Securities
Figure 6: Total TSLF Borrowing for Financial Institutions: 3/14/2008 - 6/30/2009
Source: Federal Reserve (FOIA 3/31/2011)
9/15/2008
Note: Calendar quarter ends are marked with vertical gridlines.
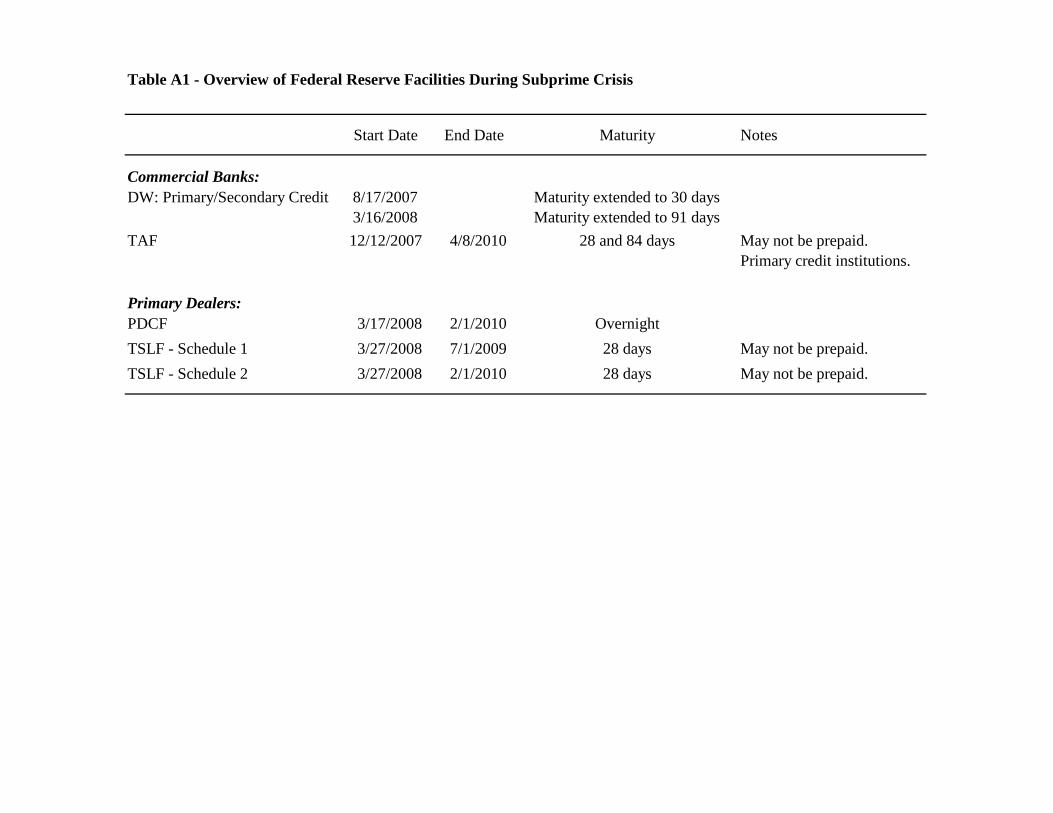
Table A1 - Overview of Federal Reserve Facilities During Subprime Crisis
Start Date End Date Maturity Notes
Commercial Banks:DW: Primary/Secondary Credit 8/17/2007
3/16/2008Maturity extended to 30 daysMaturity extended to 91 days
TAF 12/12/2007 4/8/2010 28 and 84 days May not be prepaid. Primary credit institutions.
Primary Dealers:PDCF 3/17/2008 2/1/2010 OvernightTSLF - Schedule 1 3/27/2008 7/1/2009 28 days May not be prepaid.TSLF - Schedule 2 3/27/2008 2/1/2010 28 days May not be prepaid.
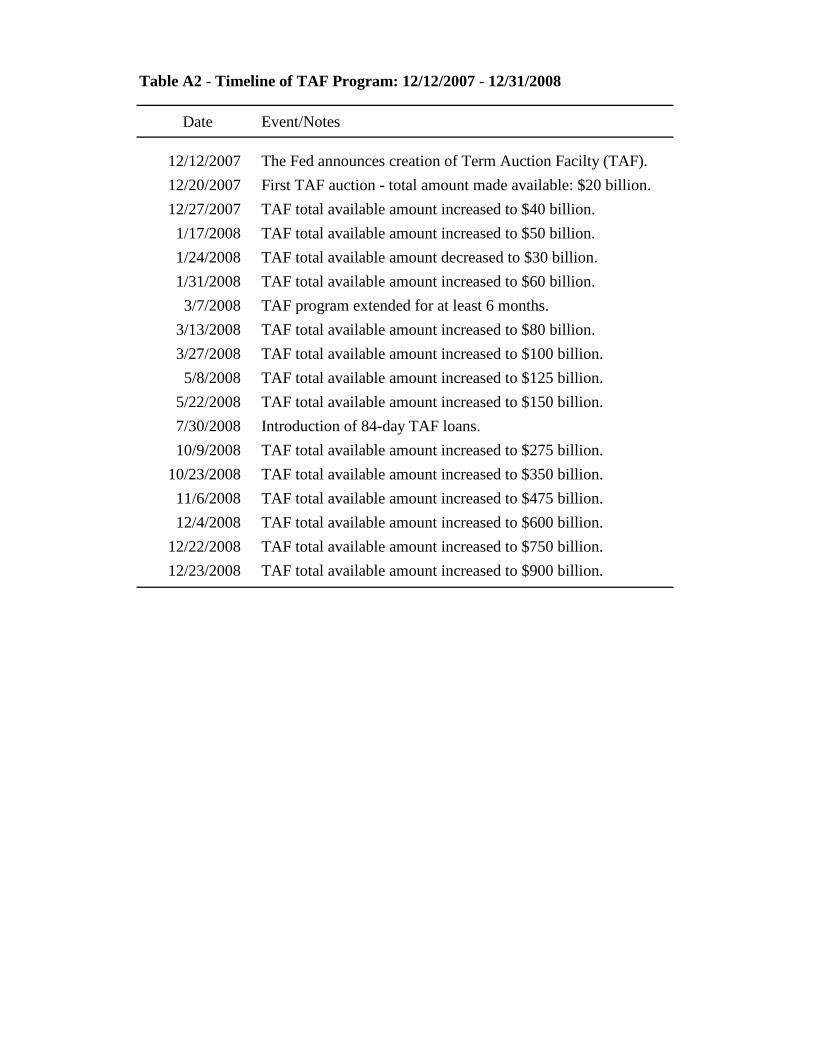
Date Event/Notes
12/12/2007 The Fed announces creation of Term Auction Facilty (TAF).12/20/2007 First TAF auction - total amount made available: $20 billion.12/27/2007 TAF total available amount increased to $40 billion.1/17/2008 TAF total available amount increased to $50 billion.1/24/2008 TAF total available amount decreased to $30 billion.1/31/2008 TAF total available amount increased to $60 billion.3/7/2008 TAF program extended for at least 6 months.
3/13/2008 TAF total available amount increased to $80 billion.3/27/2008 TAF total available amount increased to $100 billion.5/8/2008 TAF total available amount increased to $125 billion.
5/22/2008 TAF total available amount increased to $150 billion. 7/30/2008 Introduction of 84-day TAF loans.10/9/2008 TAF total available amount increased to $275 billion.
10/23/2008 TAF total available amount increased to $350 billion. 11/6/2008 TAF total available amount increased to $475 billion. 12/4/2008 TAF total available amount increased to $600 billion.
12/22/2008 TAF total available amount increased to $750 billion. 12/23/2008 TAF total available amount increased to $900 billion.
Table A2 - Timeline of TAF Program: 12/12/2007 - 12/31/2008
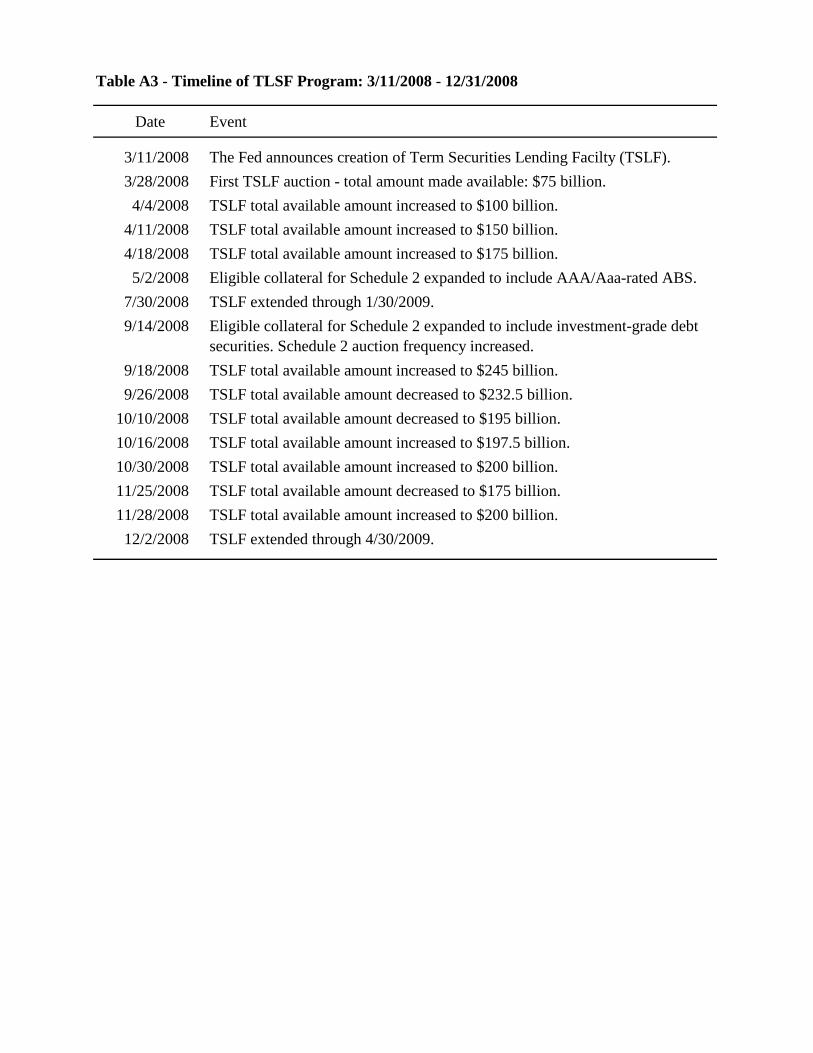
Date Event
3/11/2008 The Fed announces creation of Term Securities Lending Facilty (TSLF).3/28/2008 First TSLF auction - total amount made available: $75 billion.4/4/2008 TSLF total available amount increased to $100 billion.
4/11/2008 TSLF total available amount increased to $150 billion. 4/18/2008 TSLF total available amount increased to $175 billion. 5/2/2008 Eligible collateral for Schedule 2 expanded to include AAA/Aaa-rated ABS.
7/30/2008 TSLF extended through 1/30/2009.9/14/2008 Eligible collateral for Schedule 2 expanded to include investment-grade debt
securities. Schedule 2 auction frequency increased.9/18/2008 TSLF total available amount increased to $245 billion. 9/26/2008 TSLF total available amount decreased to $232.5 billion.
10/10/2008 TSLF total available amount decreased to $195 billion. 10/16/2008 TSLF total available amount increased to $197.5 billion. 10/30/2008 TSLF total available amount increased to $200 billion.11/25/2008 TSLF total available amount decreased to $175 billion.11/28/2008 TSLF total available amount increased to $200 billion. 12/2/2008 TSLF extended through 4/30/2009.
Table A3 - Timeline of TLSF Program: 3/11/2008 - 12/31/2008

Date Event
12/12/2007 The Fed announces Term Auction Facilty (TAF).12/12/2008 The Fed announces $20 billion and $4 billion swap lines for 6 months with European Central Bank and the Swiss National Bank, respectively.12/20/2007 First TAF auction - total amount made available: $20 billion.
2/17/2008 Northern Rock nationalized by UK Treasury.3/11/2008 The Fed announces Term Securities Lending Facilty (TSLF).3/11/2008 The Fed increases swap lines with European Central Bank and the Swiss National Bank by $10 billion and $2 billion, respectively. Both swap
lines extended through 9/30/2008.3/16/2008 Merger announcement: JPM-Chase to acquire Bear Stearns.3/16/2008 The Fed announces Primary Dealer Credit Facility (PDCF).3/24/2008 The Fed provides financing to JPM-Chase for acquisition of Bear Stearns.3/27/2008 TAF total available amount increased to $100 billion.3/28/2008 First TSLF auction - total amount made available: $75 billion.5/2/2008 The Fed increases swap lines with European Central Bank and the Swiss National Bank by $20 billion and $6 billion, respectively. 5/8/2008 TAF total available amount increased to $125 billion.
5/29/2008 Bear Stearns acquisition approved by shareholders.7/11/2008 IndyMac Federal Bank seized by regulators (largest thrift failure to-date).7/15/2008 SEC issues order to temporarily suspend naked short-selling of Fannie Mae, Freddie Mac, and primary dealers.7/30/2008 The Fed increases swap line with European Central Bank to $55 billion.9/7/2008 Fannie Mae and Freddie Mac taken over by the U.S. government.
9/14/2008 Merger announcement: Bank of America to acquire Merrill Lynch.9/14/2008 The Fed expands the list of eligible collateral for PDCF and TSLF.9/15/2008 Lehman Brothers Inc. Files for bankruptcy.9/16/2008 Barclays to acquire Lehman Brothers Inc.9/16/2008 $85 billion AIG bailout by U.S. government.9/17/2008 SEC issues order to temporarily suspend naked short-selling of of financial institutions.9/18/2008 The Fed increases swap lines by $180 billion and authorizes new swap lines with Bank of Japan, Bank of England, and Bank of Canada.9/18/2008 Merger announcement: Lloyds TSB to acquire Bank of Scotland.9/21/2008 Goldman Sachs and Morgan Stanley convert to bank holding companies.9/24/2008 The Fed establishes swap with the Reserve Bank of Australia ($10 billion), the Sveriges Riskbank ($10 billion), Norges Bank ($5 billion), and
Danmarks Nationalbank ($5 billion) through 1/30/2009.9/25/2008 Washington Mutual closed by regulators (sold to JPM-Chase).9/26/2008 The Fed increases swap lines with European Central Bank and the Swiss National Bank by $10 billion and $3 billion, respectively. 9/28/2008 Partial nationalization of Fortis by governments of Benelux countries.9/29/2008 First bailout proposal of Depfa announced.9/29/2008 The Fed expands swap lines by $330 billion to a total of $620 billion.9/30/2008 Dexia bailed out by governments of Belgium and France.10/3/2008 Merger announcement: Wells Fargo to acquire Wachovia.10/3/2008 Congress passes TARP.10/6/2008 Depfa's holding company bailed out by German government.10/7/2008 FDIC announces increase in deposit insurance coverage to $250,000.10/8/2008 Additional $37.8 billion AIG bailout by U.S. government.10/9/2008 TAF total available amount increased to $275 billion.
10/13/2008 Bank of Scotland bailed out by UK Treasury.10/13/2008 Recapitalization of Royal Bank of Scotland by UK government.10/13/2008 The Fed increases swap line with European Central Bank, Bank of England, and Swiss National Bank.10/14/2008 The Fed increases swap line with Bank of Japan.10/28/2008 First TARP transactions.10/28/2008 The Fed establishes swap line with Reserve Bank of New Zealand ($15 billion).10/29/2008 The Fed establishes swap lines with Banco Central de Brasil, Banco de Mexico, Bank of Korea, and Monetary Authority of Singapore; $30
billion each.11/10/2008 AIG bailout restructured to include TARP and the creation of Maiden Lane facilities.
12/5/2008 Merrill Lynch acquisition approved by shareholders.12/31/2008 Wells Fargo acquisition of Wachovia completed.
Table A4 - Timeline of Selected Key Events: 12/12/2007 - 12/31/2008
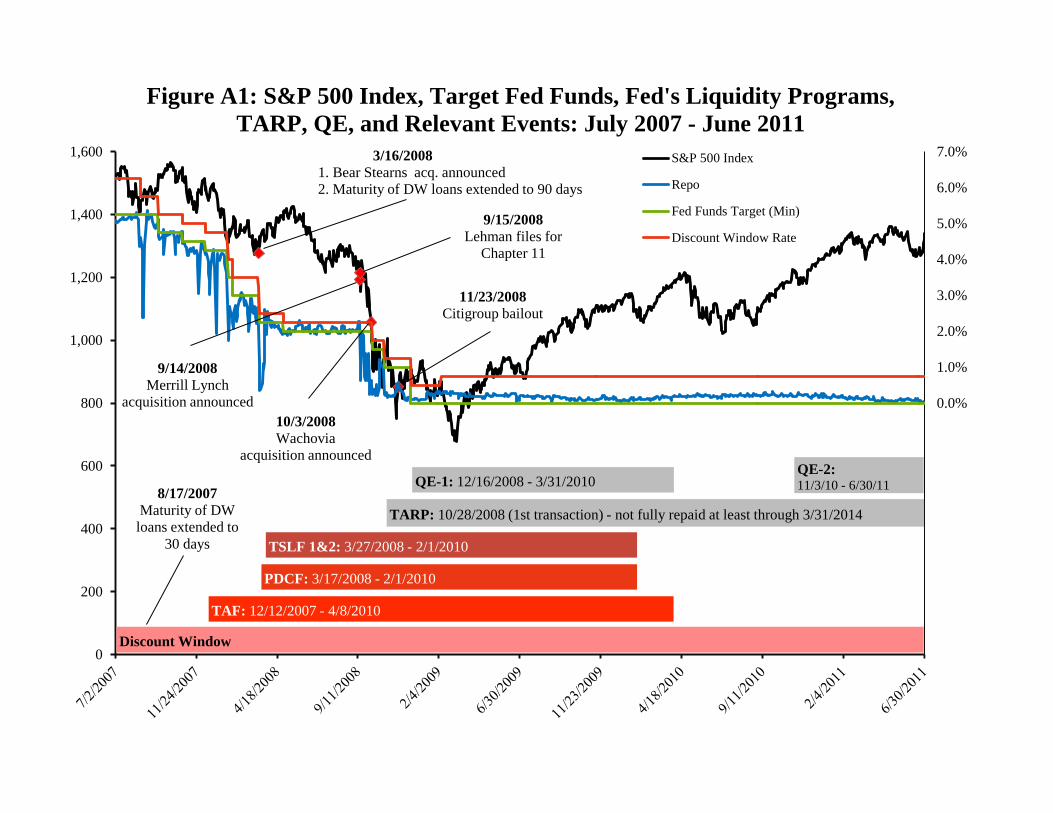
-7.0%
-6.0%
-5.0%
-4.0%
-3.0%
-2.0%
-1.0%
0.0%
1.0%
2.0%
3.0%
4.0%
5.0%
6.0%
7.0%
0
200
400
600
800
1,000
1,200
1,400
1,600Events
S&P 500 Index
Repo
Fed Funds Target (Min)
Discount Window Rate
TAF: 12/12/2007 - 4/8/2010
TSLF 1&2: 3/27/2008 - 2/1/2010
PDCF: 3/17/2008 - 2/1/2010
TARP: 10/28/2008 (1st transaction) - not fully repaid at least through 3/31/2014
QE-1: 12/16/2008 - 3/31/2010 QE-2: 11/3/10 - 6/30/11
Discount Window
3/16/2008 1. Bear Stearns acq. announced 2. Maturity of DW loans extended to 90 days
9/14/2008 Merrill Lynch
acquisition announced
9/15/2008 Lehman files for
Chapter 11
10/3/2008 Wachovia
acquisition announced
Figure A1: S&P 500 Index, Target Fed Funds, Fed's Liquidity Programs, TARP, QE, and Relevant Events: July 2007 - June 2011
8/17/2007 Maturity of DW
loans extended to 30 days
11/23/2008 Citigroup bailout