the 1452 or 1453 a.d. kuwae eruption signal derived from
TRANSCRIPT
The University of MaineDigitalCommons@UMaine
Earth Science Faculty Scholarship Earth Sciences
6-27-2006
The 1452 or 1453 A.D. Kuwae Eruption SignalDerived from Multiple Ice Core Records: GreatestVolcanic Sulfate Event of the Past 700 YearsChaochao Gao
Alan Robock
Stephen Self
Jeffrey B. Witter
J. P. Steffenson
See next page for additional authors
Follow this and additional works at: https://digitalcommons.library.umaine.edu/ers_facpub
Part of the Earth Sciences Commons
This Article is brought to you for free and open access by DigitalCommons@UMaine. It has been accepted for inclusion in Earth Science FacultyScholarship by an authorized administrator of DigitalCommons@UMaine. For more information, please [email protected].
Repository CitationGao, Chaochao; Robock, Alan; Self, Stephen; Witter, Jeffrey B.; Steffenson, J. P.; Clausen, Henrik Brink; Siggard-Andersen, Marie-Louise; Johnson, Sigfus; Mayewski, Paul Andrew; and Ammann, Caspar, "The 1452 or 1453 A.D. Kuwae Eruption Signal Derivedfrom Multiple Ice Core Records: Greatest Volcanic Sulfate Event of the Past 700 Years" (2006). Earth Science Faculty Scholarship. 98.https://digitalcommons.library.umaine.edu/ers_facpub/98

AuthorsChaochao Gao, Alan Robock, Stephen Self, Jeffrey B. Witter, J. P. Steffenson, Henrik Brink Clausen, Marie-Louise Siggard-Andersen, Sigfus Johnson, Paul Andrew Mayewski, and Caspar Ammann
This article is available at DigitalCommons@UMaine: https://digitalcommons.library.umaine.edu/ers_facpub/98
The 1452 or 1453 A.D. Kuwae eruption signal derived
from multiple ice core records:
Greatest volcanic sulfate event of the past 700 years
Chaochao Gao,1 Alan Robock,1 Stephen Self,2 Jeffrey B. Witter,3 J. P. Steffenson,4
Henrik Brink Clausen,4 Marie-Louise Siggaard-Andersen,4 Sigfus Johnsen,4
Paul A. Mayewski,5 and Caspar Ammann6
Received 26 September 2005; revised 22 January 2006; accepted 1 March 2006; published 27 June 2006.
[1] We combined 33 ice core records, 13 from the Northern Hemisphere and 20 from theSouthern Hemisphere, to determine the timing and magnitude of the great Kuwae eruptionin the mid-15th century. We extracted volcanic deposition signals by applying a high-pass loess filter to the time series and examining peaks that exceed twice the 31 yearrunning median absolute deviation. By accounting for the dating uncertainties associatedwith each record, these ice core records together reveal a large volcanogenic aciddeposition event during 1453–1457 A.D. The results suggest only one major stratosphericinjection from the Kuwae eruption and confirm previous findings that the Kuwae eruptiontook place in late 1452 or early 1453, which may serve as a reference to evaluate andimprove the dating of ice core records. The average total sulfate deposition from theKuwae eruption was 93 kg SO4/km
2 in Antarctica and 25 kg SO4/km2 in Greenland. The
deposition in Greenland was probably underestimated since it was the average value ofonly two northern Greenland sites with very low accumulation rates. After taking thespatial variation into consideration, the average Kuwae deposition in Greenland wasestimated to be 45 kg SO4/km
2. By applying the same technique to the other majoreruptions of the past 700 years our result suggests that the Kuwae eruption was the largeststratospheric sulfate event of that period, probably surpassing the total sulfate depositionof the Tambora eruption of 1815, which produced 59 kg SO4/km
2 in Antarctica and50 kg SO4/km
2 in Greenland.
Citation: Gao, C., A. Robock, S. Self, J. B. Witter, J. P. Steffenson, H. B. Clausen, M.-L. Siggaard-Andersen, S. Johnsen, P. A.
Mayewski, and C. Ammann (2006), The 1452 or 1453 A.D. Kuwae eruption signal derived from multiple ice core records: Greatest
volcanic sulfate event of the past 700 years, J. Geophys. Res., 111, D12107, doi:10.1029/2005JD006710.
1. Introduction
[2] The Kuwae volcano in Vanuatu (16.83�S, 168.54�E)erupted in the middle of the 15th century A.D. [Pang,1993; Briffa et al., 1998], expelling 32–39 km3 of denserock equivalent [Monzier et al., 1994]. This volume ofexpelled matter is more than six times larger that of the1991 Pinatubo eruption and left ‘‘unmistakable marks inworld climate records’’ [Pang, 1993]. While records ofunusual weather and atmospheric optical phenomena andsevere damage on agriculture [Pang, 1993], as well as the
anomalously low tree ring densities [Briffa et al., 1998],point to the year 1452 as the time of the eruption, datingof the Kuwae signal derived from individual ice corerecord ranges from 1450 to 1464. For example, Cole-Dai et al. [1997] found an acid ‘‘spike’’ that lasted for fouryears from 1454 to 1457 in the Siple Station ice core.Palmer et al. [2002] reported deposition of a largevolcanic eruption during 1459–1461 in the Law Domerecord, which was also found to be the largest volcanicsignal in the last seven centuries in this record. Castellanoet al. [2005] assigned the Kuwae signal to the year 1460in their EPICA Dome C core. Another Antarctic ice core,PS1 [Delmas et al., 1992], displays a prominent acid peakwhich they determined to be about 1450. Similarly, in theNorthern Hemisphere (NH), Zielinski et al. [1994] andZielinski [1995] found a large volcanic signal at 1460–1461 in the GISP2 record. Fisher and Koerner [1994]discovered a volcanic deposition in 1455 in the A84 icecore. Bigler et al. [2002] found a large peak lasting severalyears in the early 1450s in the NGT-B20 ice core. Inseveral of these cores Kuwae is a major if not a dominant
JOURNAL OF GEOPHYSICAL RESEARCH, VOL. 111, D12107, doi:10.1029/2005JD006710, 2006
1Department of Environmental Sciences, Rutgers–State University ofNew Jersey, New Brunswick, New Jersey, USA.
2Department of Earth Sciences, Open University, Milton Keynes, UK.3Hawaii Institute of Geophysics and Planetology, University of Hawaii
at Manoa, Honolulu, Hawaii, USA.4Niels Bohr Institute, University of Copenhagen, Copenhagen,
Denmark.5Climate Change Institute, University of Maine, Orono, Maine, USA.6National Center for Atmospheric Research, Boulder, Colorado, USA.
Copyright 2006 by the American Geophysical Union.0148-0227/06/2005JD006710
D12107 1 of 11

volcanic signal. For example, the sulfate flux of theKuwae eruption derived from Plateau Remote is five timesthat of the Tambora [Cole-Dai et al., 2000], which raisesthe question about the relative magnitude of the Kuwaeand other large volcanic eruptions during the past 2000years. Because of different site characteristics, such as therelative contribution of different air-to-snow mass transfermechanisms (wet and dry deposition, riming, and vaportransfer) of sulfate aerosols as well as the surface elevationand irregularities, temperatures, wind speed that affect theflux of sulfate aerosols [Cole-Dai et al., 1997] and thusthe magnitude of volcanic signals, studies based on mul-tiple ice cores from both Antarctic and Greenland arerequired to better understand this problem, as suggested byprevious studies [Robock and Free, 1995; Free andRobock, 1999; Mosley-Thompson et al., 2003].[3] In our study, we have incorporated the volcanic
signals derived from 33 ice core records from both hemi-spheres to determine the timing and magnitude of theKuwae eruption. Results obtained from these multiple icecores reevaluate and complement the previous geological,historical and proxy data. The estimated timing of theeruption not only provides a tool to evaluate the dating ofexisting ice core record serves as a volcanic reference
horizon for future ice core dating and important case studyfor the effects of volcanic eruptions on climate change.
2. Ice Core Database and Volcanic SignalExtraction Methods
[4] After large explosive volcanic eruptions, a portion ofemitted sulfate aerosols is embedded and preserved incertain glaciers and ice sheets, in the snow and ice byprecipitation or by dry deposition. Thus measurement of thetotal acidity or the actual sulfate content in the ice coresfrom those areas allows relatively precise computation of avolcanic time series [Robock and Free, 1995, 1996; Robock,2000]. While no individual ice core record is representativeof past volcanism due to the large spatial variation ofvolcanic deposition on ice sheets [Zielinski et al., 1997],previous studies [Robock and Free, 1995; Free and Robock,1999] suggested that results compiled from multiple icecores can reduce the errors associated with individualrecords and provide a more reliable index of past volcanism.In our study, we used 33 ice cores, 13 in the NH and 20 inthe Southern Hemisphere (SH). Table 1 lists the names andgeneral information about these 33 ice cores, among which19 ice cores, 10 in the SH and nine in the NH, contain data
Table 1. Ice Core Time Series Used in the Studya
Name Location Period Resolution
AnnualAccumulationRate, mwe/yr Measure Type Units Reference
A84b 80.7�N, 73.1�W 1223–1961 1/yr 0.098 ECM mA Fisher et al. [1995]A77b 80.7�N, 73.1�W 453–1853 1/yr 0.175 ECM mA Fisher et al. [1995]NGT_B20 79�N, 36.5�W 830–1993 12/yr 0.098 CFA ng/g (ppb) Bigler et al. [2002]NorthGRIP1.ECM 75.1�N, 42.3�W 190–1969 2/yr 0.152 ECM this paperNorthGRIP1.SO4 75.1�N, 42.3�W 190–1969 1/yr 0.152 total SO4 meq/kg this paperGISP2b 72.6�N, 38.5�W 1–1984 0.5/yr 0.420 NSS SO4 ppb Zielinski [1995]Dye3 deep 72.6�N, 37.6�W 1–1768 4/yr 0.500 ECM this paperGreenland Site T 72.6�N,38.5 W 1731–1989 1/yr 0.224 EXS kg/km2 Mosley-Thompson et al. [1993]GRIP main 71.3�N, 26.7�W 1–1642 4/yr 0.212 ECM this paperCrete 71.1�N, 37.3�W 553–1778 4/yr 0.267 ECM this paperGreenland Site A 70.8�N, 36�W 1715–1985 1/yr 0.267 EXS kg/km2 Mosley-Thompson et al. [1993]Renland 70.6�N, 35.8�W 1000–1984 1/yr 0.319 ECM this paper20Db 65�N, 45�W 1767–1983 1/yr 0.410 NSS SO4 ng/g Mayewski et al. [1990]Mount Loganb 60.6�N, 141�W 1689–1979 1/yr 0.330 total SO4 meq/L Mayewski et al. [1993]Law Dome 66.7�S 112.8�E 1301–1995 12/yr 0.644 NSS SO4 meq/L Palmer et al. [2002]Dyer 70.7�S, 65�W 1505–1989 1/yr 0.450 total SO4 flux kg/km2 Cole-Dai et al. [1997]G15b 71.2�S, 46�E 1210–1983 varies 0.130 DEP mS/m Moore et al. [1991]Talos Dome 72.8�S, 159.1�E 1217–1996 varies 0.081 NSS SO4 meq/L Stenni et al. [2002]Dome Cb 74.7�S, 124.2�E 1763–1973 1/yr 0.031 NSS SO4 meq/L Legrand and Delmas [1987]DML_B32.SO4 75�S, 0�W 159–1997 varies 0.061 NSS SO4 ng/g Traufetter et al. [2004]DML_B32.ECM 75�S, 0�W 159–1997 12/yr 0.061 NSS-conductivity mS/cm Sommer et al. [2000a]DML_B33 75.2�S, 6.5�W 1–1996 12/yr 0.063 NSS-conductivity mS/cm Sommer et al. [2000a]DML_B31 75.6�S, 3.5�W 463–1994 12/yr 0.044 NSS-conductivity mS/cm Sommer et al. [2000a]Siple Station 76�S, 84.3�W 1417–1983 1/yr 0.550 Total SO4 flux kg/km2 Cole-Dai et al. [1997]ITASE 01-5 77�S, 89�W 1781–2002 varies 0.389 SO4 mg/L Dixon et al. [2004]ITASE 00-5 77.7�S, 124�W 1708–2001 varies 0.136 SO4 mg/L Dixon et al. [2004]ITASE 00-4 78�S, 120�W 1799–2001 varies 0.190 SO4 mg/L Dixon et al. [2004]ITASE 01-3 78.1�S, 95.6�W 1859–2002 varies 0.326 SO4 mg/L Dixon et al. [2004]ITASE 00-1 79.4�S, 111�W 1651–2001 varies 0.218 SO4 mg/L Dixon et al. [2004]ITASE 99-1 80.6�S,122.6�W 1713–2000 varies 0.130 SO4 mg/L Dixon et al. [2004]Plateau Remoteb 84�S, 43�E 1–1986 1/yr 0.040 SO4 ppb Cole-Dai et al. [2000]PS1b 90�S 1010–1984 1/yr 0.080 NSS SO4 ng/g Delmas et al. [1992]PS14b 90�S 1800–1984 1/yr 0.080 NSS SO4 ng/g Delmas et al. [1992]SP2001c1 90�S 905–1999 1/yr 0.080 Total SO4 flux kg/km2 Budner and Cole-Dai [2003]SP95 90�S 1487–1992 varies 0.078 SO4 mg/L Dixon et al. [2004]
aECM, electrical conductivity measurement; DEP, dielectric profiling; NSS SO4, non-sea-salt sulfate; CFA, continuous flow analysis; NSS-conductivity,non-sea-salt conductivity; EXS, excess sulfate; mwe, meters of liquid water equivalent.
bIce cores used by Robock and Free [1995].
D12107 GAO ET AL.: THE 1452 OR 1453 KUWAE ICE CORE SIGNAL
2 of 11
D12107

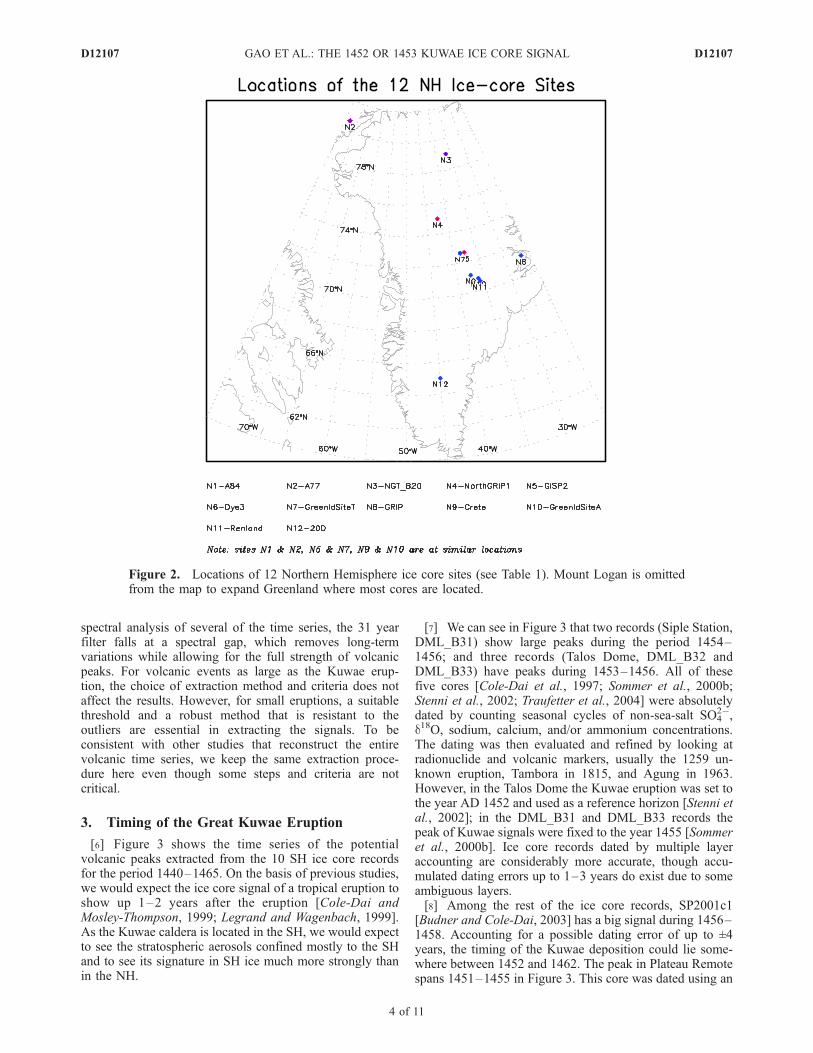
beginning in or before the 15th century. From Table 1 wealso see that 24 ice cores, 17 in the SH and seven in the NH,have sulfate records. Among the 24 sulfate ice core records,only nine (7 SH, 2 NH) have records that go back to the15th century. In this study, we used all available ice cores(i.e., the 19 records with Kuwae signals) to determine thetiming of the Kuwae eruption, but only the sulfate records(i.e., the nine cores with Kuwae sulfate records) to estimatethe deposition of the eruption on the Antarctic and Green-land ice sheets. The estimated deposition was evaluated andadjusted with the 24 total ice core sulfate records. Thereason we choose not to use electrical conductivity mea-surement (ECM) records in calculating the volcanic depo-sition is that ECM measures acidity caused not only bysulfuric acid (H2SO4), but also by nitric (HNO3), hydro-chloric (HCl), and hydrofluoric (HF) acids, can be reducedby deposition of basic (as contrasted with acidic) aerosolparticles, and depends on the temperature at the time whenthe measurement was taken. Figures 1 and 2 show thelocations of these 33 sites, except the Mount Logan ice corewhich is far away from Greenland. We can see fromFigures 1 and 2 that the 19 sites with Kuwae signals arerelatively evenly distributed in both regions, especially forthe 10 ice cores in A ca.
[5] To extract the volcanic signals from the annualaverage time series of each ice core we used the followingprocedures: (1) convert the sulfate concentration time seriesinto fluxes (see Appendix A), (2) remove the trend and thebackground variation with a high-pass loess filter, alocally weighted least squares quadratic estimate [Clevelandand Devlin, 1988], to remove signals longer than 31 years,(3) calculate the 31 year running median absolute deviation(MAD) of the residuals and select the potential volcanicpeaks if they exceed the baseline plus 2 running MAD,(4) replace the selected peak values with the median ofthe original time series, (5) repeat step 2 using the timeseries with the peaks removed, and (6) repeat step 3 toextract the volcanic peaks. We use the loess filter andMAD because they provide robust estimates for a widerange of population distributions, and do not require anormal distribution, which is the underlying assumptionfor the automatic extraction method [Naveau et al., 2003]and other methods [e.g., Robock and Free, 1995, 1996]that extract peaks above a certain standard deviation limit.We chose an appropriate window length and extractionthreshold by examining the properties of the detrended,peak-removed residuals such as normality, constant vari-ance, and minimum autocorrelation. On the basis of
Figure 1. Locations of the 20 Southern Hemisphere ice core sites (see Table 1).
D12107 GAO ET AL.: THE 1452 OR 1453 KUWAE ICE CORE SIGNAL
3 of 11
D12107
spectral analysis of several of the time series, the 31 yearfilter falls at a spectral gap, which removes long-termvariations while allowing for the full strength of volcanicpeaks. For volcanic events as large as the Kuwae erup-tion, the choice of extraction method and criteria does notaffect the results. However, for small eruptions, a suitablethreshold and a robust method that is resistant to theoutliers are essential in extracting the signals. To beconsistent with other studies that reconstruct the entirevolcanic time series, we keep the same extraction proce-dure here even though some steps and criteria are notcritical.
3. Timing of the Great Kuwae Eruption
[6] Figure 3 shows the time series of the potentialvolcanic peaks extracted from the 10 SH ice core recordsfor the period 1440–1465. On the basis of previous studies,we would expect the ice core signal of a tropical eruption toshow up 1–2 years after the eruption [Cole-Dai andMosley-Thompson, 1999; Legrand and Wagenbach, 1999].As the Kuwae caldera is located in the SH, we would expectto see the stratospheric aerosols confined mostly to the SHand to see its signature in SH ice much more strongly thanin the NH.
[7] We can see in Figure 3 that two records (Siple Station,DML_B31) show large peaks during the period 1454–1456; and three records (Talos Dome, DML_B32 andDML_B33) have peaks during 1453–1456. All of thesefive cores [Cole-Dai et al., 1997; Sommer et al., 2000b;Stenni et al., 2002; Traufetter et al., 2004] were absolutelydated by counting seasonal cycles of non-sea-salt SO4
2�,d18O, sodium, calcium, and/or ammonium concentrations.The dating was then evaluated and refined by looking atradionuclide and volcanic markers, usually the 1259 un-known eruption, Tambora in 1815, and Agung in 1963.However, in the Talos Dome the Kuwae eruption was set tothe year AD 1452 and used as a reference horizon [Stenni etal., 2002]; in the DML_B31 and DML_B33 records thepeak of Kuwae signals were fixed to the year 1455 [Sommeret al., 2000b]. Ice core records dated by multiple layeraccounting are considerably more accurate, though accu-mulated dating errors up to 1–3 years do exist due to someambiguous layers.[8] Among the rest of the ice core records, SP2001c1
[Budner and Cole-Dai, 2003] has a big signal during 1456–1458. Accounting for a possible dating error of up to ±4years, the timing of the Kuwae deposition could lie some-where between 1452 and 1462. The peak in Plateau Remotespans 1451–1455 in Figure 3. This core was dated using an
Figure 2. Locations of 12 Northern Hemisphere ice core sites (see Table 1). Mount Logan is omittedfrom the map to expand Greenland where most cores are located.
D12107 GAO ET AL.: THE 1452 OR 1453 KUWAE ICE CORE SIGNAL
4 of 11
D12107
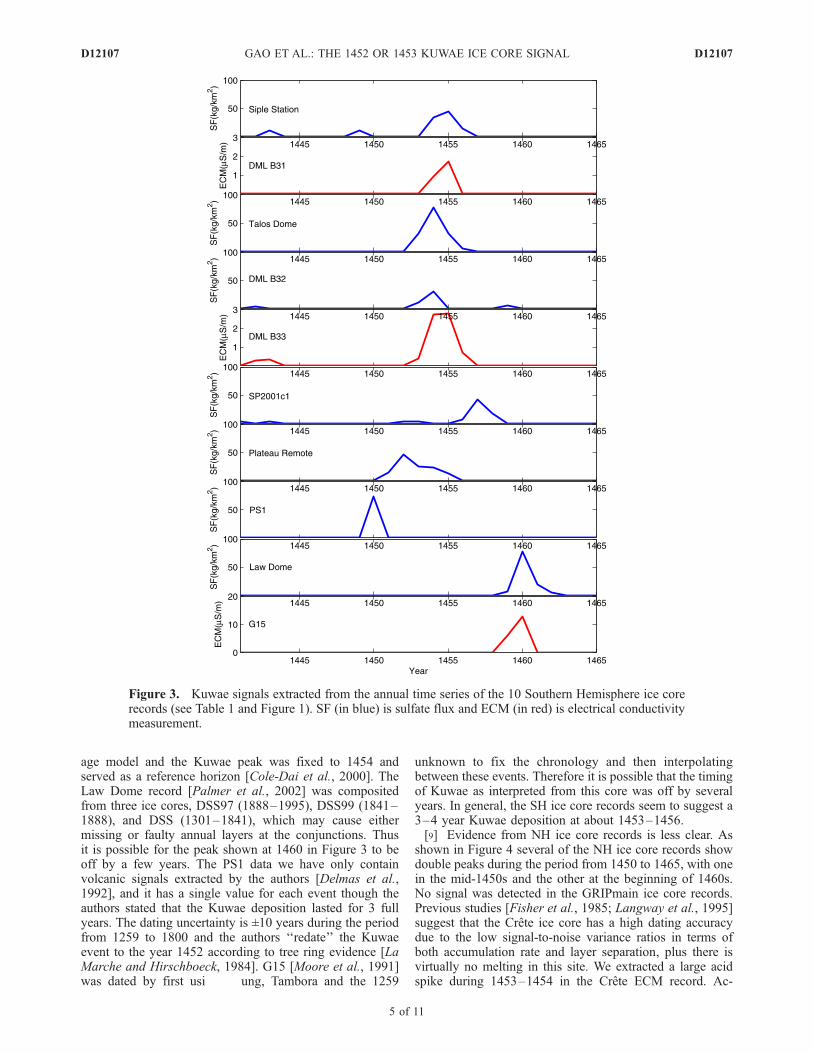
age model and the Kuwae peak was fixed to 1454 andserved as a reference horizon [Cole-Dai et al., 2000]. TheLaw Dome record [Palmer et al., 2002] was compositedfrom three ice cores, DSS97 (1888–1995), DSS99 (1841–1888), and DSS (1301–1841), which may cause eithermissing or faulty annual layers at the conjunctions. Thusit is possible for the peak shown at 1460 in Figure 3 to beoff by a few years. The PS1 data we have only containvolcanic signals extracted by the authors [Delmas et al.,1992], and it has a single value for each event though theauthors stated that the Kuwae deposition lasted for 3 fullyears. The dating uncertainty is ±10 years during the periodfrom 1259 to 1800 and the authors ‘‘redate’’ the Kuwaeevent to the year 1452 according to tree ring evidence [LaMarche and Hirschboeck, 1984]. G15 [Moore et al., 1991]was dated by first usi ung, Tambora and the 1259
unknown to fix the chronology and then interpolatingbetween these events. Therefore it is possible that the timingof Kuwae as interpreted from this core was off by severalyears. In general, the SH ice core records seem to suggest a3–4 year Kuwae deposition at about 1453–1456.[9] Evidence from NH ice core records is less clear. As
shown in Figure 4 several of the NH ice core records showdouble peaks during the period from 1450 to 1465, with onein the mid-1450s and the other at the beginning of 1460s.No signal was detected in the GRIPmain ice core records.Previous studies [Fisher et al., 1985; Langway et al., 1995]suggest that the Crete ice core has a high dating accuracydue to the low signal-to-noise variance ratios in terms ofboth accumulation rate and layer separation, plus there isvirtually no melting in this site. We extracted a large acidspike during 1453–1454 in the Crete ECM record. Ac-
Figure 3. Kuwae signals extracted from the annual time series of the 10 Southern Hemisphere ice corerecords (see Table 1 and Figure 1). SF (in blue) is sulfate flux and ECM (in red) is electrical conductivitymeasurement.
D12107 GAO ET AL.: THE 1452 OR 1453 KUWAE ICE CORE SIGNAL
5 of 11
D12107
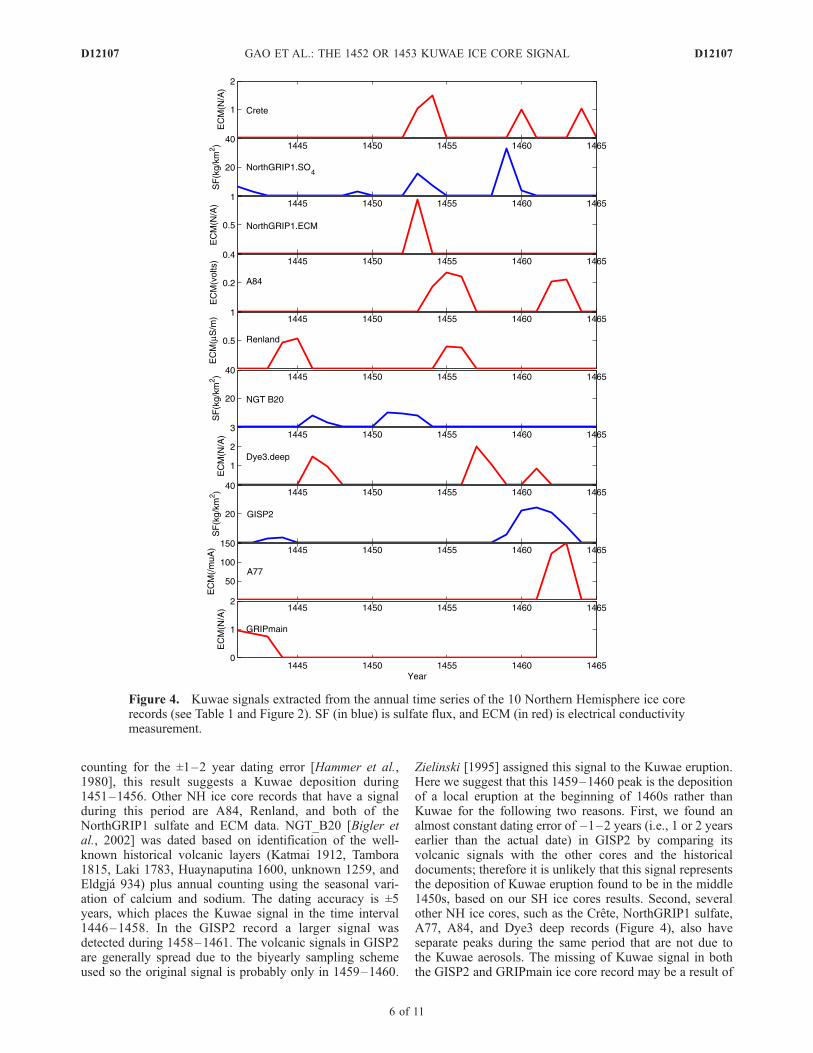
counting for the ±1–2 year dating error [Hammer et al.,1980], this result suggests a Kuwae deposition during1451–1456. Other NH ice core records that have a signalduring this period are A84, Renland, and both of theNorthGRIP1 sulfate and ECM data. NGT_B20 [Bigler etal., 2002] was dated based on identification of the well-known historical volcanic layers (Katmai 1912, Tambora1815, Laki 1783, Huaynaputina 1600, unknown 1259, andEldgja 934) plus annual counting using the seasonal vari-ation of calcium and sodium. The dating accuracy is ±5years, which places the Kuwae signal in the time interval1446–1458. In the GISP2 record a larger signal wasdetected during 1458–1461. The volcanic signals in GISP2are generally spread due to the biyearly sampling schemeused so the original signal is probably only in 1459–1460.
Zielinski [1995] assigned this signal to the Kuwae eruption.Here we suggest that this 1459–1460 peak is the depositionof a local eruption at the beginning of 1460s rather thanKuwae for the following two reasons. First, we found analmost constant dating error of –1–2 years (i.e., 1 or 2 yearsearlier than the actual date) in GISP2 by comparing itsvolcanic signals with the other cores and the historicaldocuments; therefore it is unlikely that this signal representsthe deposition of Kuwae eruption found to be in the middle1450s, based on our SH ice cores results. Second, severalother NH ice cores, such as the Crete, NorthGRIP1 sulfate,A77, A84, and Dye3 deep records (Figure 4), also haveseparate peaks during the same period that are not due tothe Kuwae aerosols. The missing of Kuwae signal in boththe GISP2 and GRIPmain ice core record may be a result of
Figure 4. Kuwae signals extracted from the annual time series of the 10 Northern Hemisphere ice corerecords (see Table 1 and Figure 2). SF (in blue) is sulfate flux, and ECM (in red) is electrical conductivitymeasurement.
D12107 GAO ET AL.: THE 1452 OR 1453 KUWAE ICE CORE SIGNAL
6 of 11
D12107

the natural spatial variation of volcanic deposition; or it maybe caused by the loss of snow and ice during the postde-positional redistribution or even the drilling and handingprocesses.[10] All of the ten SH ice core records in Figure 3 display
only one dominant peak during the interval 1445–1465,suggesting that the Kuwae eruption was a single-phasevolcanic event. The multiple peaks shown in some of theNH time series (Figure 4) were probably caused by signalsfrom other sources such as local volcanic eruptions. Sincethe Kuwae eruption is at 17�S, it is reasonable to base ouranalysis on the SH ice core records and conclude that theeruption was indeed a single-phase event.[11] In summary, the ice core records support the previous
discovery that there was a large volcanic eruption some-where during the 1450s that emitted significant amounts ofsulfate aerosols into both hemispheres. Although signalsderived from individual ice cores indicate different timingsof the Kuwae eruption, when accounting for the datingerrors associated with each record, these signals seem topoint to a volcanic deposition during the period 1453–1457,suggesting that the Kuwae eruption took place in either late1452 or early 1453. This result is consistent with previoussuggestions based on the geological record [Simkin andSiebert, 1994], historical records [Pang, 1993; Simarski,1996], and proxy data [La Marche and Hirschboeck, 1984;Pang, 1993; Briffa et al., 1998].
4. Sulfate Deposition
[12] To calculate the amount of sulfate deposited in thepolar regions by the Kuwae eruption, we first adjusted thetiming of the Kuwae signals in each ice core record bylining them up during 1453–1456 and fixing the highestvalues at year 1454. We then calculated the hemisphericaverage sulfate deposition based on the seven SH ice cores(SP2001c1, PS1, Plateau Remote, Talos Dome, Law Dome,Siple Station, and DML_B32) and two NH ice cores(NGT_B20 and NorthGRIP1) that have sulfate records.The resulting total sulfate deposition was 93.0 kg SO4/km
2
and 24.8 kg SO4/km2 for SH and NH ice core records,
respectively (Table 2). The difference between these two
average values suggests an asymmetric distribution of thevolcanic debris.[13] To evaluate how representative these seven SH and
two NH ice core records are, we compared the averagesulfate depositions derived from these records to those froma larger number of ice cores for several other well-knownvolcanic events when more ice core records were available.In the SH we calculated sulfate deposition averaged fromthe seven cores and those from 17 records for the 1809unknown, 1815 Tambora, and 1883 Krakatau eruptions.These results, together with those for the NH ice corecomparisons, are shown in Table 2. We also plotted inFigure 5 the sulfate fluxes averaged over the seven versus17 SH ice cores and two versus seven NH ice cores,respectively, for the four years following the Tamboraeruption. Our results show that the sulfate fluxes based onthese seven SH ice cores records are very close, within 5%,to those from 17 SH records for the five events chosen.Therefore it is reasonable to assume that our estimation ofsulfate fluxes for the Kuwae eruption based on the sevenSH cores is representative of what we would obtain from the17 SH ice core records.[14] Similarly, we calculated the average sulfate deposi-
tion of the two Greenland cores and the total seven cores forthe Laki, 1809 unknown, 1815 Tambora, and 1883 Kraka-tau eruptions (Table 2). The results based on the twonorthern Greenland ice core records are smaller than thoseaveraged over the seven Greenland cores. Also listed inTable 2 are the average sulfate depositions for the unknown,Tambora, and Krakatau eruptions from six Program forArctic Regional Climate Assessment (PARCA) [Mosley-Thompson et al., 2003] ice cores, and 12 Greenland coresfrom Clausen and Hammer [1988]. We can see that for allof the three events, the average sulfate deposition of thesetwo other groups of Greenland ice core records is abouttwice as large as those of the two NH records. Previousstudies [e.g., Zielinski et al., 1997] found that there are largespatial variations in the volcanic depositions among differ-ent NH ice cores. We also found, for instance, that theTambora deposition ranges from 25 kg/km2 in B20 (79�N)to 73 kg/km2 in GISP2 (72.6�N) and 85 kg/km2 in 20D(65�N). Since both NGT_B20 and NorthGRIP1 (75.1�N)
Table 2. Average Total Sulfate Depositions and the Corresponding Standard Deviations Based on Different Groups of Ice Cores for the
Laki, 1809 Unknown, Tambora, and Krakatau Eruptionsa
Volcano Latitude Year 7 SH 17 SH 2 NH 7 NH PARCA CH1988
Kuwae 17�S 1452 93.0 ± 35.5 97.7b 24.8 ± 3.2 44.6b N/A N/ALaki 64�N 1783 N/A N/A 87.6 ± 4.2 103.2 ± 35.1 187.0 ± 91.8 171.3 ± 72.5Unknown tropical? 1809 25.1 ± 13.3 27.2 ± 12.3 17.7 ± 19.2 25.9 ± 15.2 35.9 ± 8.8 N/ATambora 8�S 1815 56.7 ± 32.8 59.4 ± 26.4 31.3 ± 8.5 49.5 ± 24.8 60.4 ± 16.9 64.2 ± 33.1Krakatau 6�S 1883 12.4 ± 5.6 12.1 ± 5.9 4.6 ± 0.6 14.0 ± 7.4c N/A N/A
aAll values are calculated in the same way. The 7 Southern Hemisphere (SH) cores: SP2001, PS1, Plateau Remote, Talos Dome, Law Dome, SipleStation, and B32. The 17 SH cores: the above seven cores plus SP95, ITASE015, ITASE005, ITASE004, ITASE013, TASE001, ITASE991, Dyer, Dome C,and PS14. The 2 Northern Hemisphere (NH) cores: B20 and NorthGRIP1. The 7 NH cores: the above two cores plus Greenland Site A and T, GISP2, 20D,Mount Logan. See Table 1 for details on these cores. PARCA data from four cores (GITS, D2, D3, and Raven) for unknown and Tambora and five cores(D2, D3, Raven, Humboldt, and NASA-U) for Laki are from Table 2 of Mosley-Thompson et al. [2003]. CH1988 data obtained by averaging the sulfatedepositions of 12 and 11 NH cores from Table 4 of Clausen and Hammer [1988]. Deposition values are in kg/km2.
bThese are estimated values by multiplying the Kuwae deposition in columns 4 and 6 with the average ratios of 7 versus 17 SH and 2 versus 7 NH icecore mean depositions, respectively. Thus these two values roughly represent the average Kuwae depositions if all of the 17 SH and 7 NH ice cores wereavailable.
cThe Krakatau signal does not show in the Mount Logan ice core record. Therefore the total deposition for the Krakatau eruption is averaged over six NHice core records instead of seven.
D12107 GAO ET AL.: THE 1452 OR 1453 KUWAE ICE CORE SIGNAL
7 of 11
D12107
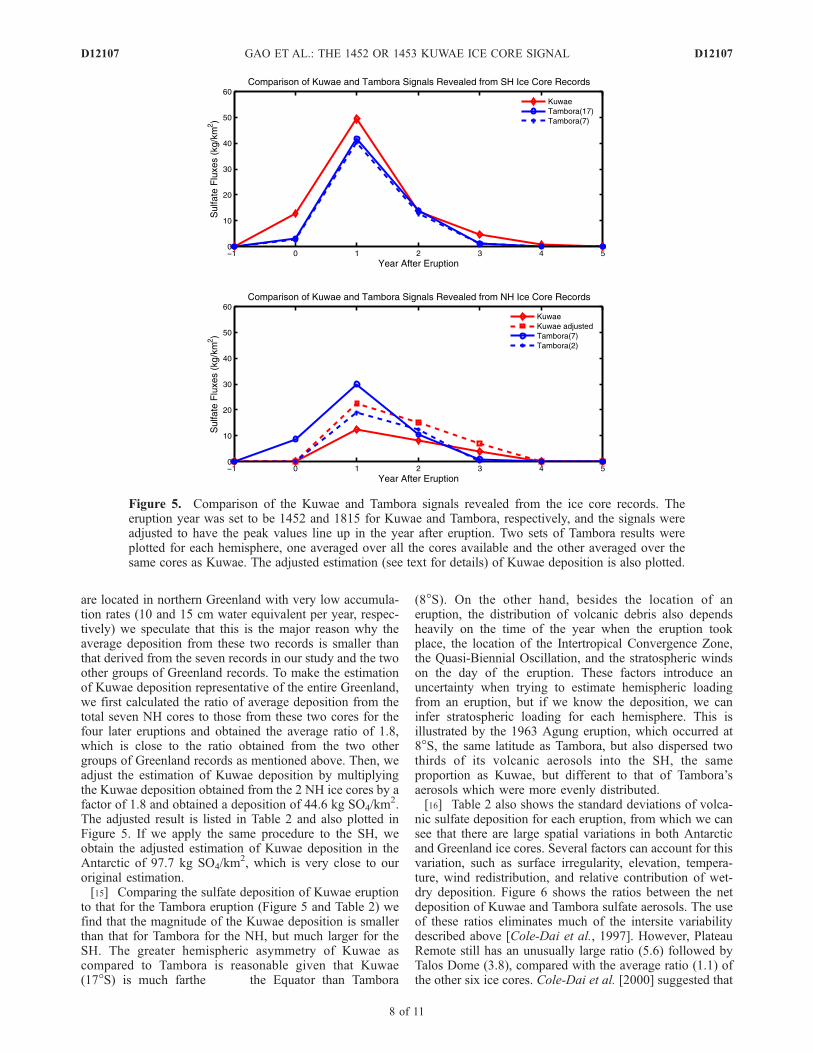
are located in northern Greenland with very low accumula-tion rates (10 and 15 cm water equivalent per year, respec-tively) we speculate that this is the major reason why theaverage deposition from these two records is smaller thanthat derived from the seven records in our study and the twoother groups of Greenland records. To make the estimationof Kuwae deposition representative of the entire Greenland,we first calculated the ratio of average deposition from thetotal seven NH cores to those from these two cores for thefour later eruptions and obtained the average ratio of 1.8,which is close to the ratio obtained from the two othergroups of Greenland records as mentioned above. Then, weadjust the estimation of Kuwae deposition by multiplyingthe Kuwae deposition obtained from the 2 NH ice cores by afactor of 1.8 and obtained a deposition of 44.6 kg SO4/km
2.The adjusted result is listed in Table 2 and also plotted inFigure 5. If we apply the same procedure to the SH, weobtain the adjusted estimation of Kuwae deposition in theAntarctic of 97.7 kg SO4/km
2, which is very close to ouroriginal estimation.[15] Comparing the sulfate deposition of Kuwae eruption
to that for the Tambora eruption (Figure 5 and Table 2) wefind that the magnitude of the Kuwae deposition is smallerthan that for Tambora for the NH, but much larger for theSH. The greater hemispheric asymmetry of Kuwae ascompared to Tambora is reasonable given that Kuwae(17�S) is much farthe the Equator than Tambora
(8�S). On the other hand, besides the location of aneruption, the distribution of volcanic debris also dependsheavily on the time of the year when the eruption tookplace, the location of the Intertropical Convergence Zone,the Quasi-Biennial Oscillation, and the stratospheric windson the day of the eruption. These factors introduce anuncertainty when trying to estimate hemispheric loadingfrom an eruption, but if we know the deposition, we caninfer stratospheric loading for each hemisphere. This isillustrated by the 1963 Agung eruption, which occurred at8�S, the same latitude as Tambora, but also dispersed twothirds of its volcanic aerosols into the SH, the sameproportion as Kuwae, but different to that of Tambora’saerosols which were more evenly distributed.[16] Table 2 also shows the standard deviations of volca-
nic sulfate deposition for each eruption, from which we cansee that there are large spatial variations in both Antarcticand Greenland ice cores. Several factors can account for thisvariation, such as surface irregularity, elevation, tempera-ture, wind redistribution, and relative contribution of wet-dry deposition. Figure 6 shows the ratios between the netdeposition of Kuwae and Tambora sulfate aerosols. The useof these ratios eliminates much of the intersite variabilitydescribed above [Cole-Dai et al., 1997]. However, PlateauRemote still has an unusually large ratio (5.6) followed byTalos Dome (3.8), compared with the average ratio (1.1) ofthe other six ice cores. Cole-Dai et al. [2000] suggested that
Figure 5. Comparison of the Kuwae and Tambora signals revealed from the ice core records. Theeruption year was set to be 1452 and 1815 for Kuwae and Tambora, respectively, and the signals wereadjusted to have the peak values line up in the year after eruption. Two sets of Tambora results wereplotted for each hemisphere, one averaged over all the cores available and the other averaged over thesame cores as Kuwae. The adjusted estimation (see text for details) of Kuwae deposition is also plotted.
D12107 GAO ET AL.: THE 1452 OR 1453 KUWAE ICE CORE SIGNAL
8 of 11
D12107

the high value in Plateau Remote was caused by the partialloss or gain of snow within annual layers, whose effects aremore pronounced in the low-accumulation sites; whereasCastellano et al. [2005] speculated that the Kuwae distri-bution pattern can be a real spatial variation in its deposi-tional fluxes. The high ratios in these two sites doubled theoverall average ratio between Kuwae and Tambora, and ourresults may overestimate the mean Kuwae sulfate depositionin Antarctica if the high ratios in the above two sites areactually caused by net gain of snow. This once againaddresses the importance of using multiple (as many asavailable) ice cores with full spatial coverage to obtain theforcing index of past volcanism.
5. Conclusions
[17] We have used 33 ice core records, 13 from theNorthern Hemisphere and 20 from the Southern Hemi-sphere, to examine the timing and magnitude of the greatKuwae eruption in the mid-15th century. Our results suggestthat the Kuwae eruption is a single-phase eruption whichtook place in late 1452 or early 1453, producing significantdepositions that lasted up to four years in both Greenlandand Antarctic ice sheets. The Kuwae signals detected in ice
cores from both polar regions confirm the potential of thiseruption for global climatic impacts. The large differencebetween the two hemispheric-average sulfate depositiondensities (97.7 kg/km2 in the SH versus 44.6 kg/km2 inthe NH) indicates an asymmetric distribution of the volcanicdebris between the two hemispheres. Our results alsosuggest that the Kuwae eruption caused one of the largestaerosol events in the past 700 years, probably surpassing themagnitude of the aerosol cloud caused by Tambora eruptionin 1815.[18] Witter and Self [2006] calculated the total atmo-
spheric sulfate aerosol loading from the Kuwae eruptionand found it to lie somewhere between 235 and 414 Tg.They used geological techniques to estimate the amount ofsulfur the eruption actually injected into the stratosphere. Bymeasuring the amount of sulfate that was deposited in icecores, in theory one could do an inverse calculation toestimate the stratospheric loading, and then use this informa-tion to calculate the radiative forcing of the climate system[e.g., Stenchikov et al., 1998], one of the ultimate goals of ourresearch. However, to do this inverse calculation, one wouldhave to explicitly model the stratospheric, cross-tropopause,and then tropospheric transport; microphysical, precipitation,and deposition mechanisms; as well as effects of sastrugi on
Figure 6. Spatial distribution of the ratio between the net deposition for Kuwae and Tambora eruptionin eight Antarctic ice cores.
D12107 GAO ET AL.: THE 1452 OR 1453 KUWAE ICE CORE SIGNAL
9 of 11
D12107
the ice; and no one has done such a calculation yet. That workis currently underway and will be reported in a subsequentpaper.
Appendix A
[19] Procedure to calculate sulfate fluxes for ice coreswith sulfate concentration records.
A1. Cores With Sulfate Contents in Meq/L
[20] 1. Assume the density of the sample solution issimilar to that of water, i.e., 1 meq SO4/L � 1 meq SO4/kg.[21] 2. Use 1 kg/L as the density if the accumulation is in
water equivalent, and 0.85 kg/L as the density if theaccumulation is in ice equivalent.[22] 3. Multiply the sulfate content (in meq/kg) with the
factor [L = 48 (g/eq SO42�) � annual accumulation (m/yr in
either water or ice equivalents) � water or ice density (inkg/L)] or [L = 48 (g/eq SO4
2�) � annual accumulation in (gcm�2 yr�1) or (kg/km2 yr)] to convert them to fluxes (kg/km2 yr).
A2. NorthGRIP1
[23] Since the NorthGRIP1 record we used only containsthe sulfate content (in meq/kg) corresponding to annualdepth intervals and the 55 cm average ice or snow densityfor the first 100 m of ice core, we used the followingprocedure to calculate the sulfate fluxes.[24] 1. Linearly interpolate the 55 cm averaged densities
for the first 100 m of ice core to the depth intervals thatcorresponding to the annual depositions.[25] 2. Assume the ice density as 0.85 kg/L for the data
after the first 100 m.[26] 3. Multiply the sulfate content (in meq/kg) with the
factor [L = 48 (g/eq SO42�) � annual deposition (in m) � ice
density for each annual depth interval ( in kg/L)] to convertthem to fluxes (kg/km2 yr).
A3. Cores With Sulfate Contents in Mg/L, ng/g, or ppb
[27] 1. Assume the density of the sample solution is thesame as that of water, i.e., 1 mg/L � 1 mg/kg = 1 ng/g =1 ppb.[28] 2. Use 1 kg/L as the density if the accumulation is in
water equivalent, and 0.85 kg/L as the density if theaccumulation is in ice equivalent.[29] 3. Multiply the sulfate content with the factor [L =
annual accumulation (m/yr in either water or ice equiva-lents) � water or ice density (in kg/L)] or just with theannual accumulation if it is in (g cm�2 yr�1) or (kg/km2 yr)to convert them to fluxes (in kg/km2 yr).
[30] Acknowledgments. We thank all the scientists who have sup-plied us with ice core records both for the difficult work of obtaining andanalyzing the cores and for allowing us to use them. We thank PhilippeNaveau for valuable discussions on signal extraction methods. This work issupported by NOAA grant NA03-OAR-4310155 and the Chaire duDeveloppement Durable de l’Ecole Polytechnique, Paris, France.
ReferencesBigler, M., D. Wagenbach, H. Fischer, J. Kipfstuhl, H. Millar, S. Sommer,and B. Stauffer (2002), Sulphate record from a northeast Greenland icecore over the last 1200 years based on continuous flow analysis, Ann.Glaciol., 35, 250–256.
Briffa, K. R., P. D. Jones, F. H. Schweingruber, and T. J. Osborn (1998),Influence of volcanic eruptions on Northern Hemisphere summer tem-perature over the past 600 years, Nature, 393, 450–455.
Budner, D., and J. H. Cole-Dai (2003), The number and magnitude of largeexplosive volcanic eruptions between 904 and 1865 A. D.: Quantitativeevidence from a new south pole ice core, in Volcanism and the Earth’sAtmosphere, edited by A. Robock and C. Oppenheimer, pp. 165–176,AGU, Washington, D. C.
Castellano, E., S. Becagli, M. Hansson, M. Hutterli, J. R. Petit, M. R.Rampino, M. Severi, J. P. Steffensen, R. Traversi, and R. Udisti(2005), Holocene volcanic history as recorded in the sulfate stratigraphyof the European Project for Ice Coring in Antarctica Dome C (EDC96)ice core, J. Geophys. Res., 110, D06114, doi:10.1029/2004JD005259.
Clausen, H., and C. U. Hammer (1988), The Laki and Tambora eruptions asrevealed in Greenland ice cores from 11 locations, Ann. Glaciol., 10, 16–22.
Cleveland, W. S., and S. J. Devlin (1988), Locally weighted regression: Anapproach to regression analysis by local fitting, J. Am. Stat. Assoc., 83,596–610.
Cole-Dai, J. H., and E. Mosley-Thompson (1999), The Pinatubo eruption inSouth Pole snow and its potential value to ice core paleovolcanic records,Ann. Glaciol., 29, 99–105.
Cole-Dai, J. H., E. Mosley-Thompson, and L. Thomason (1997), Annuallyresolved Southern Hemisphere volcanic history from two Antarctic icecores, J. Geophys. Res., 102, 16,761–16,771.
Cole-Dai, J. H., E. Mosley-Thompson, S. P. Wight, and L. Thomason(2000), A 4100–year record of explosive volcanism from an East Ant-arctica ice core, J. Geophys. Res., 105, 24,431–24,441.
Delmas, R. J., S. Kirchner, J. M. Palais, and J. R. Petit (1992), 1000 years ofexplosive volcanism recorded at the South-Pole, Tellus, Ser. B, 44, 335–350.
Dixon, D., P. A. Mayewski, S. Kaspari, S. Sneed, and M. Handley (2004),A 200 year sub-annual record of sulfate in West Antarctica, from 16 icecores, Ann. Glaciol., 39, 1–12.
Fisher, D., and R. Koerner (1994), Signal and noise in four ice core recordsfrom the Agassiz Ice Cap, Ellesmere Island, Canada: Details of the lastmillennium for stable isotopes, melt and solid conductivity, Holocene, 4,113–120.
Fisher, D., N. Reeh, and H. Clausen (1985), Stratigraphic noise in timeseries derived from ice cores, Ann. Glaciol., 7, 76–83.
Fisher, D. A., R. M. Koerner, and N. Reeh (1995), Holocene climaticrecords from Agassiz Ice Cap, Ellesmere Island, NWT, Canada, Holo-cene, 5, 19–24.
Free, M., and A. Robock (1999), Global warming in the context of theLittle Ice Age, J. Geophys. Res., 104, 19,057–19,070.
Hammer, C. U., H. B. Clausen, and W. Dansgaard (1980), Greenland ice-sheet evidence of post-glacial volcanism and its climatic impact, Nature,288, 230–235.
La Marche, V. C., and K. K. Hirschboeck (1984), Frost rings in trees asrecords of major volcanic eruptions, Nature, 307, 121–126.
Langway, C. C., K. Osada, H. B. Clausen, C. U. Hammer, and H. Shoji(1995), A 10-century comparison of prominent bipolar volcanic events inice cores, J. Geophys. Res., 100, 16,241–16,247.
Legrand, M., and R. Delmas (1987), A 220 year continuous record ofvolcanic H2SO4 in the Antarctic ice sheet, Nature, 327, 671–676.
Legrand, M., and D. Wagenbach (1999), Impact of Cerro Hudson andPinatubo volcanic eruptions on the Antarctic air and snow chemistry,J. Geophys. Res., 104, 1581–1596.
Mayewski, P. A., W. B. Lyons, M. J. Spencer, M. S. Twickler, C. F. Buck,and S. Whitlow (1990), An ice core record of atmospheric response toanthropogenic sulfate and nitrate, Nature, 346, 554–556.
Mayewski, P. A., L. D. Meeker, M. C. Morrison, M. S. Twickler, S. I.Whitlow, K. K. Ferland, D. A. Meese, M. R. Legrand, and J. P. Steffensen(1993), Greenland ice core signal characteristics: An expanded view ofclimate change, J. Geophys. Res., 98, 12,839–12,847.
Monzier, M., C. Robin, and J.-P. Eissen (1994), Kuwae (�1425 A. D.): Theforgotten caldera, J. Volcanol. Geotherm. Res., 59, 207–218.
Moore, J. C., H. Narita, and N. Maeno (1991), A continuous 770–yearrecord of volcanic activity from East Antarctica, J. Geophys. Res., 96,17,353–17,359.
Mosley-Thompson, E., L. G. Thompson, J. Dai, M. Davis, and P. N. Lin(1993), Climate of the last 500 years: High-resolution ice core records,Quat. Sci. Rev., 12(6), 419–430.
Mosley-Thompson, E., T. A. Mashiotta, and L. G. Thompson (2003), Highresolution ice core records of late Holocene volcanism: Current andfuture contributions from the Greenland PARCA cores, in Volcanismand the Earth’s Atmosphere, edited by A. Robock and C. Oppenheimer,pp. 153–164, AGU, Washington, D. C.
Naveau, P., C. Ammann, H.-S. Oh, and W. Guo (2003), An automaticstatistical methodology to extract pulse-like forcing factors in climate
D12107 GAO ET AL.: THE 1452 OR 1453 KUWAE ICE CORE SIGNAL
10 of 11
D12107

time series: Application to volcanic events, in Volcanism and the Earth’sAtmosphere, Geophys. Monogr. Ser., vol. 139, edited by A. Robock andC. Oppenheimer, pp. 177–186, AGU, Washington, D. C.
Palmer, A. S., V. I. Morgan, A. J. Curran, T. D. Van Ommen, and P. A.Mayewski (2002), Antarctic volcanic flux ratios from Law Dome icecores, Ann. Glaciol., 35, 329–332.
Pang, K. D. (1993), Climatic impact of the mid-fifteenth century Kuwaecaldera formation, as reconstructed from historical and proxy data, EosTrans. AGU, 74, 106.
Robock, A. (2000), Volcanic eruptions and climate, Rev. Geophys., 38,191–219.
Robock, A., and M. P. Free (1995), Ice cores as an index of global volcan-ism from 1 850 to the present, J. Geophys. Res., 100, 11,549–11,567.
Robock, A., and M. Free (1996), The volcanic record in ice cores for thepast 2000 years, in Climatic Variations and Forcing Mechanisms of theLast 2000 Years, edited by P. Jones, R. Bradley, and J. Jouzel, pp. 533–546, Springer, New York.
Simarski, L. T. (1996), Constantinople’s volcanic twilight, Saudi AramcoWorld, 47, 8–13.
Simkin, T., and L. Siebert (1994), Volcanoes of the World, 349 pp.,Geoscience, Tucson, Ariz.
Sommer, S., C. Appenzeller, R. Rothlisberger, M. Hutterli, B. Stauffer,D. Wagenbach, H. Oerter, F. Wilhelms, D. J. Miller, and R. Mulvaney(2000a), Glacio-chemical study spanning the past 2 kyr on three ice coresfrom Dronning Maud Land, Antarctica: 1. Annually resolved accumula-tion rates, J. Geophys. Res., 105, 29,411–29,421.
Sommer, S., D. Wagenbach, R. Mulvaney, and H. Fischer (2000b), Glacio-chemical study spanning the past 2 kyr on three ice cores from DronningMaud Land, Antarctica: 2. Seasonally resolved chemical records, J. Geo-phys. Res., 105, 29,423–29,433.
Stenchikov, G. L., I. Kirchner, A. Robock, H.-F. Graf, J. C. Antuna, R. G.Grainger, A. Lambert, and L. Thomason (1998), Radiative forcing fromthe 1991 Mount Pinatubo volcanic eruption, J. Geophys. Res., 103,13,837–13,857.
Stenni, B., M. Proposito, R. Gragnani, O. Flora, J. Jouzel, S. Falourd, andM. Frezzotti (2002), Eight centuries of volcanic signal and climatechange at Talos Dome (East Antarctica), J. Geophys. Res., 107(D9),4076, doi:10.1029/2000JD000317.
Traufetter, F., H. Oerter, H. Fischer, R. Weller, and H. Miller (2004), Spatio-temporal variability in volcanic sulphate deposition over the past 2kyr insnow pits and firn cores from Amundsenisen, Antarctica, J. Glaciol., 50,137–146.
Witter, J. B., and S. Self (2006), The Kuwae (Vanuatu) eruption of AD1452: Potential magnitude and volatile release, Bull. Volcanol., 68, 1–18,doi:10.1007/s00445-006-0075-4.
Zielinski, G. A. (1995), Stratospheric loading and optical depth estimates ofexplosive volcanism over the last 2100 years derived from the Greenland-Ice-Sheet-Project-2 ice core, J. Geophys. Res., 100, 20,937–20,955.
Zielinski, G. A., P. A. Mayewski, L. D. Meeker, S. Whitlow, M. S. Twickler,M. Morrison, D. A. Meese, A. J. Gow, and R. B. Alley (1994), Recordof volcanism since 7000–BC from the GISP2 Greenland ice core andimplications for the volcano-climate system, Science, 264, 948–952.
Zielinski, G., J. Dibb, Q. Yang, P. Mayewski, S. Whitlow, and M. S.Twickler (1997), Assessment of the record of the 1982 El Chichon erup-tion as preserved in Greenland snow, J. Geophys. Res., 102, 30,031–30,045.
�����������������������C. Ammann, National Center for Atmospheric Research, 1850 Table
Mesa Drive, Boulder, CO 80307-3000, USA.C. Gao and A. Robock, Department of Environmental Sciences,
Rutgers–State University of New Jersey, New Brunswick, 14 CollegeFarm Road, New Brunswick, NJ 08901, USA. ([email protected];robock@envsci:.rutgers.edu)P. A. Mayewski, Climate Change Institute, University of Maine, Orono,
ME 04469, USA.S. Self, Department of Earth Sciences, Open University, Milton Keynes
MK7 6AA, UK.J. P. Steffenson, H. B. Clausen, M.-L. Siggaard-Andersen, and S. Johnsen,
Niels Bohr Institute, University of Copenhagen, Juliane Maries Vej 30,DK-2100 Copenhagen O, Denmark.J. B. Witter, Hawaii Institute of Geophysics and Planetology, University
of Hawaii at Manoa, 1680 East West Road, Post 504, Honolulu, HI 96822,USA.
D12107 GAO ET AL.: THE 1452 OR 1453 KUWAE ICE CORE SIGNAL
11 of 11
D12107