the 1st the economics of digitization - cesifo group munich · the economics of digitization...
TRANSCRIPT

The 1st Doctoral Workshop on
The Economics of Digitization Munich, May 12–13 2017
Estimating the Effects of File-sharing on Movie
Box-office Zhuang Liu

Estimating the Effects of File-sharing on Movie
Box-office
Zhuang Liu∗
University of Western Onatrio
This Draft: May 2, 2017
Abstract
File-sharing and on-line piracy have caught great public attention yet no
consensus has been reached on how file-sharing affects industry revenue in
economics literature. Using a novel dataset of downloads from Bit-Torrent
network, this paper quantifies the effects of file-sharing on movie box-office
revenue. I estimate a random coefficient demand model of movies to quantify
the effects of file-sharing. I also allow piracy consumption to have spillover
effect on paid consumption and quantify its impact on box-office. The es-
timates show that file-sharing reduces box-office revenue of motion picture
industry by 1.4 % over a 20 week period in 10 countries. In addition, spillover
effect from pirated consumption contribute to $ 9.4 million (0.14%) to movie
box-office revenue.
∗Preliminary and Incomplete, please do not cite without permission. I thank SalvadorNavarro, David Rivers, Tim Conley, Tai-Yeong Chung, Scott Orr, Nail Kashaev, Giulia Pa-van and participants of Tenth IDEI-TSE-IAST Conference on The Economics of IntellectualProperty, Software and the Internet, 50th Annual Conference of the Canadian Economics As-sociation, Western Economics 50th Anniversary Conference and UWO labor lunch seminar fortheir help and useful comments. All errors are mine.
1

1 Introduction
One of the very important developments on the Internet is the emergence of peer-
to-peer file-sharing. In less than 20 years, P2P file-sharing has experienced dra-
matic growth and now become one of the most common activities on the Internet.
The most widely used file sharing protocol, BitTorrent now has more than 170
million active users worldwide. It is claimed that BitTorrent moves as much as
40% of the world’s Internet traffic on a daily basis1. The wide use of file-sharing
has provided Internet users free and easy access to unauthorized copies of digital
content like movies and music, resulting in a surge in digital piracy2.
These facts have raised concerns among both policymakers and academic re-
searchers about the economic effects of file-sharing on relevant industries. However,
there is yet no consensus on the impact of file-sharing. On one side, many people,
especially copyright holders in movie and music industries treat file-sharing as the
major reason for declining sales. Several widely quoted industry investigations
have indicated evidence of huge economics loss, for example, software piracy costs
the economy about 63.4 billion dollars in 2011 (Business Software Alliance(BSA)’s
2011 Piracy Study); Digital piracy causes 58 billion dollar in actual US economic
losses and 373,000 lost jobs (IPI 2005 study)3. However, the reliability of some
of these estimates is under criticism for the unrealistic assumptions made in these
studies 4. This relatively “naive” methodology will inevitably inflates the esti-
mated loss. In addition, It is possible that piracy can have positive spillover
effects on sales through channels like sampling effect (Peitz and Waelbroeck, 2006;
Kretschmer and Peukert, 2016), social learning from word-of-mouth recommenda-
tion (Moul, 2007; Moretti, 2011; Peukert et al, 2016) , observation learning (New-
berry, 2016) or network externalities in movie consumption (Gilchrist and Sand,
2016) 5, so it is hard to conclude what the true effect of file-sharing is without
1BitTorrent Inc: http://www.bittorrent.com/company/about2http://arstechnica.com/tech-policy/2015/08/riaa-says-bittorrent-software-accounts-for-75-
of-piracy-demands-action/3http://www.prnewswire.com/news-releases/58-billion-in-economic-damage-and-373000-
jobs-lost-in-us-due-to-copyright-piracy-58354582.html4For instance BSA admits that they assume that every download counts as one lost sale in
their study5Belleflamme and Peitz (2012) provides a more comprehensive survey of the literature on the
positive effects of digital piracy
2

knowing (1) the true substitutability between legitimate and pirated consumption
and (2) the magnitude of pirated consumption’s positive spillover effect on sale.
The goal of this paper is to answer these questions that are at the center of
current debates. To be specific, this paper complements the empirical literature
on file-sharing by estimating a random coefficient demand model of movies using a
novel dataset I collected on actual downloads on Bit-Torrent. Using the estimated
parameters I conduct a no-piracy counterfactual experiment to quantify the effects
of file-sharing. Main contributions of this paper is twofold. First, using computer
science techniques, I conduct a 20 week period study that monitors the download-
ing activities of pirated movies on BitTorrent during a 20 week period in 2015.
I construct a dataset of weekly movie downloads using information from 26,266
relevant movie torrent files collected via major torrent search engines. Due to lack
of data on actual downloads, researchers on file-sharing mainly explore various
proxies and events to study the impact of file-sharing and data limitation issues
may hamper the identification of true effects of file-sharing because of measure-
ment errors and data representativeness. With information on actual downloads,
we are free from some worries about measurement errors and representativeness
issues from employing proxies or using individual survey data.
Second, to the best of my knowledge, this paper is the first attempt to assemble
aggregate download data on P2P file-sharing and apply it to structural model to
study movie piracy. The use of structural model bring several benefits. First, we
can use counter-factual experiments to test the efficacy of various anti-piracy pol-
icy. With data on aggregate downloads, we can obtain more reasonable estimates
of loss and compare them with estimates from the previous widely cited indus-
try studies. Second, estimation of a demand model allow calculation of consumer
welfare, therefore we can conduct welfare analysis regarding file-sharing. Third,
we can have a more thorough investigation of the substitution pattern, specifically
how one movie’s piracy displace its own boxoffice and other movies’ boxoffice.
Third, this paper decompose the effect of piracy on box-office into the canni-
balization effects and spillover effects. Quantifying the spillover effect from piracy
via sampling or word of mouth have important managerial implication if firm can
correctly identify the magnitude of spillover and utilize it as a promotional tool in
the right timing. However, few papers have attempted to decompose those effect:
Kretschmer and Peukert (2016) use a natural experiment on Youtube in Germany
3

and qualitatively study the promotional and displacement effect of sampling; An-
other similar paper is Ma et al.,(2016) who also decompose the two effects on
boxoffice using a Hidden Markov Model, I complement those studies by structural
estimation of a random coefficient demand model with consumer decision on movie
and piracy choice, allowing for more thorough investigation at the substitution
pattern.
This paper’s findings are as follows. First, file-sharing reduces total revenue
of the motion picture industry from box-office by $ 90 million in total, 1.4 %
of the current box-office6. The estimates are smaller than widely cited industry
estimates constantly referenced in policy making, the “naive” methodology which
assumes full sale displacement will inflate the true cost 9.2 times. On average one
movie suffers monetary loss of 0.379 million because of file-sharing. Second, on
average one download displaces legitimate sale by 0.11 unit. Third, the results of
welfare analysis show that file-sharing increase consumer welfare by a total of $
0.73 billion, therefore banning file-sharing service will result in a dead weight loss
of $ 0.64 billion. Fourth, I examine heterogeneity in revenue loss due to piracy. I
find that science fiction and action movies are more vulnerable to piracy. Wide
release movies benefit most from removal of piracy. In addition, the magnitude
of cross substitution effect of piracy is potentially big, so anti-piracy campaigns
that remove piracy for individual movie have limited benefits to box-office revenue
because most downloaders will substitute into other pirated movies. Lastly, I
examine the magnitude of spillover effect of piracy on box-office revenue. I find
that spillover effect contributes to box-office by a total of 9.4 million dollars in 10
countries during 20 weeks period.
The topic of this paper is important to the resolution of current heated debate
on controversial issues regarding file-sharing and intellectual property. For policy
makers, the results on the effects of file-sharing on industry revenue and consumer
welfare will help their decision making regarding the legal issues on file-sharing.
These results also have important managerial implication, proper estimate of the
effects of file-sharing and substitutability will help managers in motion picture
industry to better determine the optimal level of copyright protection given the
supervision and litigation cost.
The paper is organized as follows. Section 2 provides an overview of relevant
6The number is a total of number in 10 countries under study with a time period of 20 week.
4

literature. Section 3 provides background information on motion picture industry
and file-sharing. Section 4 describes the data and Section 5 presents the model.
Estimation procedure and results are presented in Section 6. Section 7 gives the
results of counterfactual experiments, and Section 8 concludes the paper.
2 Literature Review
This paper adds to several strands of literature. Firstly, this paper is related to
the empirical literature on file-sharing. Identifying effects of file-sharing on sales of
digital products is an empirically challenging question because of issues like data
limitation and endogeneity of downloads. The displacement effects of filesharing
on sale has been widely studied inthe literature, but evidence about the causal
effect of file-sharing on sale are mixed. Majority of papers find negative effect on
sale ( Liebowitz, 2004,2005; Zentner, 2006; De Vany and Walls, 2007; Rob and
Waldfogel, 2004; Rob and Waldfogel, 2007; Hong, 2013; Danaher and Waldfogel,
2015; Ma et al, 2016), but there are also a number of papers finding moderate
negative effect, insignificant effect or even positive effect (Oberholzer-Gee and
Strumpf, 2007; Smith and Telang, 2010; Bai and Waldfogel, 2012; Hammond,
2015; Lee, 2016)
One reason cause the controversy in those empirical results could be data lim-
itation. Due to the difficulty to observe actual downloads, researchers have come
out with different ways to overcome this empirical issue. Judging by their method-
ologies, most researches on file-sharing can be categorized into three categories.
Firstly, many researchers employ various proxies such as geographic variations in
Internet penetration rate, broadband connection rate, etc(Liebowitz, 2004,2005;
Zentner, 2006). Secondly, some papers take advantages of quasi-experiments such
as development of file-sharing technology, close of filesharing sites or variation
in international movie release window (Danaher and Smith, 2014; Hong, 2013;
Kretschmer and Peukert, 2016; Peukert et al., 2016; Danaher and Waldfogal,
2015). Lastly, the others use survey data collected from group of consumers (Rob
and Waldfogal 2004, Rob and Waldfogal 2007, Bai and Waldfogal 2012, Leung,
2013). Each of these researche methods have their own merits, but in absence of
data on actual file-sharing activities, questions may arise such as to what degree
these proxies and quasi-experiments can capture the true variation of file-sharing
5

activities and to what degree the consumer sampled in survey are representative
of the true population. These questions regarding measurement errors and repre-
sentativeness may help explain the different results in those papers. Having data
on actual downloads can be a good complement to those studies. Few studies that
utilize actual download data include Oberholzer-Gee and Strumpf (2007), Ham-
mond (2013) and Lee (2016). They use download data on Napster and private
BitTorrent tracker and most of them find no significant effect and or very moder-
ate negative effect. Compared with the file-sharing data used in those papers, the
data employed in this paper are collected from a more recent period in 2015 where
the landscape of file-sharing has changed dramatically from 2007. Instead of using
data from one tracker, I attempt to estimate the aggregate download using data
obtained from a more comprehensive list of 84 popular public BitTorrent trackers.
Beside data, a paper closely related to this paper in terms of econometric method-
ology is Leung (2013), who also structurally estimate a random coefficient Logit
model to study software piracy using a conjoint survey of 281 college students.
Our papers are different in several aspects. Leung (2013) studies on software in-
dustry and this paper focuses on motion picture industry. While Leung (2013)
focus on the study of substitution pattern using the rich information in college
student survey data, this paper also tries to estimate total impact on the industry
level using an aggregate measure of download activity, in addition this paper also
decompose the pure substitution effect and positive spillover effect of piracy which
is not considered in Leung (2013)’s study.
In addition to the empirical literature on file-sharing, this paper is also related
to the growing literature on motion picture industry7. Researchers have studied
different aspects of the motion picture industry, for example: spatial competition
of movie theaters (Davis, 2006), social spillover and word of mouth (Moul, 2007;
Moretti, 2011; Gilchrist and Sand, 2016), seasonality in the motion picture indus-
try (Einav, 2007), uniform pricing practice (Einav, 2007), movie price elasticity
(Davis, 2002; De Roos and McKenzie, 2014), effect of uncertainty in the movie
industry (De Vany and Walls, 1999; Elberse and Eliashberg, 2003), influence of
movie critics(Eliashberg and Shugan, 1997). This paper adds to the literature on
the effect of file-sharing on the motion picture industry.
The third strand of literature is the broad literature on intellectual property
7See McKenzie (2012) for survey on movie industry.
6

especially copyright. The emergence of file-sharing may require governments to
adjust the existing strength of copyright protection accordingly. However, there
is no consensus on the optimal degree of intellectual property protections. As
Boldrin and Levine (2002) point out, strong property rights which not only include
the right to own and sell ideas, but also the right to regulate their use after sale,
will create a socially inefficient intellectual monopoly. Klein, Lerner and Murphy
(2002) argue that file sharing restrict copyright holders’ ability to exercise price
discrimination and effectively control price, so file-sharing services are likely to
reduce the value of copyrighted work. They argue that the use of strong property
rights to restrict piracy should be implemented even if there is substantial cost of
restricting consumer’s “fair use”. Empirical evidence on the effects of file-sharing
will provide useful insights to the debate on optimal copyright protection.
3 File-Sharing and BitTorrent
Peer-to-peer file-sharing is a decentralized file-transfer technology. In traditional
downloading methods, files are downloaded from a centralized servers which store
the source file. Because of the limited bandwidth, download speed will deteriorates
as the number of clients requesting services from the server increases. For P2P file-
sharing, clients download the file from other clients who are also downloading the
file or those who have downloaded the file. P2P file-sharing can efficiently utilizes
the upload bandwidth of clients to facilitate downloading, therefore it success-
fully overcomes the bandwidth bottleneck of centralized servers and significantly
increases download speed. Due to these advantages, P2P file-sharing has quickly
gained popularity among Internet users.
The history of file-sharing can date back to 1999. An American computer
programmer named Shawn Fanning developed a peer-to-peer file-sharing platform
called Napster, Napster was used to share music files among users and it quickly
became popular among Internet users. At its peak in 2001, Napster had about
80 million registered users over the world. In July 2001, Napster was involved
in a series of copyright lawsuits and was forced to shut down by US court. Af-
ter the shutdown of Napster, subsequent file-sharing services have been developed
including Gnutella, Freenet, Kazaa, FastTrack, E-Mule and so on. Among those
followers, BitTorrent has become the dominating file-sharing service gradually, ac-
7

counting for on average 40 % of Internet upstream traffic according to broadband
management company Sandvine8. Most files transfered in BitTorrent are media
files like movies, TV shows and music, and most of these files are pirated. Accord-
ing to research conducted by RIAA, Bit Torrent may account for about 70% of
piracy activities around the world.
Due to the dominance of Bit-Torrent over other file-sharing platforms, I focus
on BitTorrent in the study of file-sharing in this paper. Bit-Torrent is representa-
tive of the P2P file-sharing population. First, although BitTorrent is not the only
one of the P2P file-sharing services, it is believed that behaviors of file-sharers
are not systematically different across different platforms. Oberholzer-Gee and
Strumpf (2007) provide the evidence that download patterns in different plat-
forms are very similar. Second, even if there are some difference across platform,
BitTorrent is so dominating nowadays that share of other substitutes are negligi-
ble. In 2007, according to the research of Ipoque9, the traffic of the second popular
P2P protocol E-Donkey is roughly 50 % of BitTorrent. However in 2011 traffic of
E-Donkey is only 2.6% 10 and therefore is negligible.
4 Data
4.1 Data Description
The data used in this analysis are from several data sources. The main data consist
of data about box-office and downloads11, country specific average admission price
and movie characteristics for movies from 10 countries including major box-office
market such as United States, United Kingdom for 20 week periods in 2015.
I collected the file-sharing data during the 20 weeks period from March 27th to
August 7th in 2015. The data contains weekly downloads on BitTorrent collected
8TorrentFreak: https://torrentfreak.com/bittorrent-still-dominates-global-internet-traffic-101026/
9TorrentFreak, https://torrentfreak.com/p2p-traffic-still-booming-071128/10ISPreview, http://www.ispreview.co.uk/story/2011/05/18/bittorrent-p2p-filesharing-
dominates-eu-broadband-isp-internet-traffic.html11Admission and downloads are at country-level. 144 of the movies are found to have pirated
versions circulated in BitTorrent, most of movies unavailable to download are small independentmovies or Non-English movies from other countries. They are all with limited box-office influence.The countries in our data include: United States, United Kingdom, Australia, Brazil, Japan,South Korea, Mexico, Greece, New Zealand, Poland.
8
from 26,266 torrent files for 144 movies released between March 27th and August
7th, 2015. The data are collected using computer science techniques following
several studies on BitTorrent (Erman 2005, Layton and Walters 2010), details of
data collection methods are presented in the next section.
The box-office data was collected from box-office reporting service websites
Boxofficemojo.com and The-numbers.com. I collected information on weekly box-
office and movie characteristics for all movies showing during the sampling period
(March 27th to August 7th in 2015). I include characteristics such as movie ratings,
sequel, cast quality, director quality, genres, MPAA rating, weeks after release
which are commonly used in studies on motion picture industry. Movie rating data
was collected from Internet Movie Database(imdb.com). Cast and director quality
are collected from Powergird.com. they are of scale 0-100, measured by their
previous boxoffice performance. Because the uniform pricing practice in movie
theaters and movie price data hard to collect, only country-level average admission
price is obtained12. The box-office of some independent movies are extremely small
that their market shares are indistinguishable from zero, inclusion of these “zero”
market share movies will bring numerical problems to the estimation procedure so
I drop all observations with market share smaller than 0.01 % in my sample.
4.2 Collection of File-sharing Data
This section provides a description of the procedures of downloading on BitTorent
and my data collection methodology.
It is very easy for BitTorrent users to download movie files online, they only
need to find the .torrent file associated to the requesting file, the .torrent file is
a descriptor meta-file containing important information to facilitate file transfer.
Each .torrent file is indexed by an unique 40 bits identifier called torrent info-hash.
The torrent file usually can be obtained from popular torrent search engines such
as Piratebay.com, Torrentz.com and so on. Upon getting the .torrent file, the Bit-
Torrent Client software installed on user’s computer will help download the file
12Admission price variation is very small, although prices are different across screentypes(IMAX/3D/Ordiniary), these variation are perfectly correlated with movie characteristicsand therefore offer little identification power for the price elasticity. There is also price discrimi-nation on different age group and selected days in a week (’Cheap Tuesday’), but actual data onadmission by type and price are hard to obtain, so I will not attempt to estimateprice elasticityin this paper.
9

automatically. The information on .torrent file will guide client to contact BitTor-
rent trackers and get a list of clients(so called ’peers’) who are also downloading
the same file. The role of trackers is essentially directing the traffic in the Bit
Torrent network, tracker server don’t keep the file content itself, instead it keeps
tracks of who are downloading the file and tell a client who they should contact
for file transfer. Tracker server keep the current number of downloads for each
registered torrent file and these number can be scraped by sending an HTTP or
UDP request given the info-hash of torrent file13.
Now I describe my data collection methods. To obtain the estimates of weekly
download on BitTorrent, I first collect the torrent files of each movie by webcrawl-
ing the popular BitTorrent search engines. Every week the web crawler will send
search queries about each movie on major Bit Torrent search engines (Torrentz,
Kickass, Isohunt, Piratedbay, Extratorrent) and extract the identifier (infohash)
of relevant movie torrent files from the torrent information page.
To ensure the extracted torrent file are truly relevant, I add several restrictions
in the search queries:
• The file size has to be bigger than 200 MB.
• The file format has to be a video format such as mp4,avi,wmv,mkv,rmvb,etc.
• The file age can not be older than the earliest release date of the movie.
• I filter out several keywords such as: trailer, featurette, soundtrack, OST,
xxx, etc.
After obtaining a collection of infohashes (torrent identifiers) for each movie,
I collect a list of all working public Bit Torrent trackers. There are currently 84
trackers in the list.
According to Bit Torrent protocols, BitTorrent trackers will respond to HTTP
or UDP GET request with information including number of downloads, current
number of seeders, number of leechers and list of peers. The procedures of obtain-
ing downloads for a movie go as follows:
13Though trackers coordinate most of the downloads on BitTorrent, it is not the only way todownload file on BitTorrent, downloading can happen in a decentralized way using DHT withouttrackers, I did not currently count download incidence right now in DHT because monitoringthe DHT traffic is difficult. I am working on a estimating of the scale of downloads in DHT forpossible correction on the download estimates
10

• For each movie (e.g. Furious 7), searches the name plus filter in torrent
search engine as shown in Figure 1.
• The webcrawler will collect the infohashes for all search results shown in
Figure 2.
• Specifically, for each torrent file in search results, for example:
“Fast.and.Furious.7.HDRip.XviD.AC3-EVO”, the crawler will get access to
the Torrent information page and record the infohash as shown in Figure 3:
35a89cb57246dbdfdbf581403c33010d177a30dd
• The computer program then transforms the infohash into codes that can be
understood by trackers (Bencode):
5%A8%9C%B5rF%DB%DF%DB%F5%81%40%3C3%01%0D%17z0%DD
• For each tracker in the tracker list (e.g. http://www.todotorrents.com:2710/announce),
the program sends a HTTP GET request14:
GET http:///www.todotorrents.com:2710/scrape?info_hash=5%A8%9C%B5rF
%DB%DF%DB%F5%81%40%3C3
%01%0D%17z0%DD
• The tracker response contains information about the current number of seed-
ers (complete), leechers (incomplete) and the number of completed down-
loads (downloaded) for the file:
{’files’: {’5\xa8\x9c\xb5rF\xdb\xdf\xdb\xf5\x81@<3\x01\r\x17z0\xdd
’: {’downloaded’: 659, ’complete’: 3, ’incomplete’: 4}}}
From the response, ’downloaded’ indicates stock value of completed down-
loads, ’complete’ refers to number of seeders, ’incomplete’ is the number of
leechers. Current number of downloads registered in this tracker for this
torrent is: 659.
• The program records this number and repeats previous steps for all trackers
and all torrents.
11

Figure 1: Home Page of a Torrent Search Engine Figure 2: Search Result
Figure 3: Torrent Information Page
12

Figure 4: File-sharing Activities in the World
Notes: Darker color denotes higher number of file-sharers adjusted by country population. Frequency of file-sharing activities ineach country is based on a sample of 1,698,846 movie downloaders’ IP addresses that I collected from public BitTorrent trackers
during a 5 days period. The geographic information of IP address is obtained using Maxmind’s geoip database.
I will aggregate the number of downloads of each torrent file to get the current
stock value of download count for each movie. Weekly flow value of download is
obtained by taking difference of download count of consecutive weeks. This number
can be treated as the total global downloads because the trackers’ responses to
SCRAPE requests contain no geographical information. Additional HTTP and
UDP ’announce’ request is sent on weekly basis to trackers to get a snapshot list
of IP address of users currently downloading the files. I then use the IP address to
identify the source country of downloaders and the share of downloads from each
country. Country-specific weekly downloads is estimated using this geographic
share information.
4.3 Descriptive Statistics
Figure 4 shows the intensity of file-sharing activities across the world. The intensity
is measured by the number of file-sharers we found in the sample period adjusted
by country population.File-sharing is indeed penetrating into almost every place
in the world. Of 177 countries and regions in the study, file-sharing activities are
found in 170 countries. In terms of total number of file-sharers, United States
is the country with the largest number of file-sharers, making up 13.7 % of the
total numbers. Other followers including Russia (6.3 %) and France (5.4%). Not
14The UDP request is similar so I omit the description of UDP.
13

Table 1: Top-sellers and top downloaded movies
Top Selling MoviesTitle Admission(million)Jurassic World 184.09Furious 7 167.97Avengers: Age of Ultron 155.83Minions 120.15The Hobbit: The Battle of the Five Armies 106.22Inside Out 84.63The Hunger Games: Mockingjay Part 1 83.57Interstellar 75.00Big Hero 6 73.09Mission: Impossible - Rogue Nation 72.94
Top Downloaded MoviesTitle Download(million)Furious 7 35.85Interstellar 35.08Fifty Shades of Grey 30.54Kingsman: The Secret Service 27.18Big Hero 6 23.41The Hobbit: The Battle of the Five Armies 21.65American Sniper 21.28Avengers: Age of Ultron 18.84Taken 3 18.57Jupiter Ascending 16.02
Notes: Box-office and download data are up to September 11th, 2015. Box-office anddownloads are all global numbers.
surprisingly, file-sharing activities in one country are positively correlated with
country’s GDP per capita, population size,15 but they are only mildly correlated
with Internet speeds16.
I match the box-office data with the collected file-sharing data. Table 1 provides
statistics about top downloaded movies and top selling movies. Top downloaded
15Correlation coefficient of GDP and file-sharing is 0.7649, correlation coefficient of populationand file-sharing is 0.3262.
16Correlation coefficient of Internet speed and file-sharing is 0.082. Due to data limitation Ionly able to collect average Internet speed of 59 countries, most of countries with low Internetspeed are not presented in the data, this selection problem may explain the low correlationsfound between Internet speed and file-sharing activities
14

Figure 5: Average Weekly Audience and Downloads per Movie by Weeks afterRelease
15

movies are generally blockbuster movies featured by big budgets and massive ad-
vertisement campaign, most of best-seller movies also appeared to be the most
downloaded.
As one kind of experience good, movies exhibit short product life cycles. Con-
sumers have strong preferences for new movies and demand are strongly influenced
by pre-release advertising campaigns. The typical showing period of an ordinary
movie is about 6-10 weeks. Most of a movie’s box-office revenue is concentrated
on the first few weeks since release. For blockbuster movies, the box office revenue
of the opening week usually account for around 20 % of total box office revenue.
Figure 5 shows the pattern of average weekly audience (in 1,000,000’s) and down-
loads (in 100,000’s) per movie by number of weeks after initial release. Weekly
audience attendance in theater decays exponentially, quickly dropping to almost 0
around 10 weeks after initial release. Downloads of pirated movies exhibit a more
persistent pattern, partly because the continuous supply of better quality torrents
in the later period.
The most important thing to point out is that on average most of the mass
of downloads happens after closure of theatre window. Not only is the overlap
between download and boxoffice not big, the quality of downlaoded movies are also
not comparable to movie quality in theater. During the first few weeks after release,
most available pirated movies are the “CAM” version with very low quality17,
which are harly comparable with the quality of normal moviesin theater. Around
5-10 weeks after release, many better quality “TC” version 18 pirated movies come
out and downloads start to increase. Download usually peaks at some time between
10-20 weeks after theater release when the “DVDRip/BluerayRip” version pirated
movies become available due to the movie’s DVD/Blueray release. At this moment,
movies’ theatrical windows have closed for a long time.
Judging by these facts, one conjecture is that movie’s own download might not
displace its own boxoffice by large. To verify the conjecture and quantify the extent
of displacement, counterfactual experiments are conducted in section 7. The fact
that movie’s own download does not overlap with its boxoffice doesn’t mean file-
sharing is not hurting studio revenue. Though the effect on own boxoffice might
17CAM or CAMrip version are usually copy made in a cinema using a camcorder or mobilephone by audience.
18TC (telecine) versions are usually copy produced by transfering the movie from its analogreel to digital format.
16

be low, two other potential effects prevail. One is to displace its own sale revenue
on DVD/Blueray, another one is to displace the similar movies that release later.
Because a lack of data on DVD/Blueray sale, this paper focus on the second effect.
Examination of the cross elasticity of piracy is discussed in section 7.
Table 2 provides sample descriptive statistics for the movies. The average movie
budget is 43.12 million dollars, and the median of movie budget is 17 million, in-
dicating that the distribution is skewed to the right by the top big budget ‘Hits’
movies. The standard deviation is 55.7 million, which shows that the budget dis-
tribution is quite dispersed. The highest budget movie (Avengers: Age of Ultron)
spends 250 million on budget, while about 34.5 % of movies spend less than 10 mil-
lion.19 Compared to budget, movie rating exhibits less dispersion, with an average
rating of 6.7 and a standard deviation of 1.02. 65% of the movies have pirated
copies available on-line. The industry is dominated by major studios (so-called
“Big Six”20). Those “Big Six” studios produced 44% of all movies in the sample,
but account for 80.9 % of all box-office. Average admission per movie is about
0.53 million, similar to movie budget, the distribution is skewed to the right by
blockbuster movies, the best-seller (Jurassic World) admits 92.6 million audience,
which is greater than 6 times of standard deviation above mean. The distribution
of downloads resembles the admission distribution, but it has a much smaller scale
and is less dispersed. In terms of Genre, Three most common genres are Drama
(24.4%), Comedy (21.2%) and Action (14.2%). Table 3 provides information on
market shares across genres and source(download or sale). Average market share
of the legal sale of a movie is about 0.47%, while average market share of the
download of a movie is about 0.05%. So illegal download account for about less
than 10 % of all movie watching activities. Action, Animation and Science Fiction
movie usually have higher market share for both sale and download. The variable
Share at the last column measures the frequency that consumer choose this given
category conditional on watching movies.
19Because the observations missing budget is quite large, we did no include budget in the setof movie characteristics in estimation.
20“Big Six” refers to the six biggest studios in Hollywood: Disney, Warner Brothers, Sony/-Columbia, Universal, 20th Century Fox and Paramount
17

Table 2: Summary Statistics on Movie Characteristics
Mean Std.Dev Median Min MaxBudget(.million) 43.1156 55.7843 17 .1 250Rating 6.7850 1.0296 6.9 4 8.9Cast score(0-100) 57.5166 20.2985 58.9733 0 87.36Director score(0-100) 65.3064 24.3756 69.07 0 96.94Pirated .6535 .4777 1 0 1GenreAction .1417 .3501 0 0 1Animation .0708 .2576 0 0 1Comedy .2125 .4107 0 0 1Drama .2440 .4312 0 0 1Horror .0629 .2439 0 0 1Science Fiction .0708 .2576 0 0 1MPPA RatingPG .1496 .3580 0 0 1PG13 .3464 .4777 0 0 1R .3700 .4847 0 0 1Market ShareSale( %) .4788 .9809 0.1243 0.0102 11.4391Downloads( %) .0514 .0705 0.0280 0.0100 1.0616
Note: Budget are in unit of million. Rating are of a scale of 0-10. Pirated is a dummy variablewhich equals 1 if the movie have pirated version available online. Sale and Downloads in moviecharacteristics section are measured in units. Action, Animation, Comedy, Drama, Horror,Science Fiction, PG, PG13, R are all genre and MPAA Rating dummy variables. In the marketshare section, the market share is an average of one movie’s market shares in all weeks andcountries.
18

Table 3: Market Shares by Genre and Source
(Percent%) Mean Std Deviation Min Max ShareAction Sale 0.84 1.38 0.01 9.10 4.06
Download 0.07 0.09 0.01 0.73 2.11Animation Sale 0.83 1.12 0.01 6.43 24.98
Download 0.04 0.05 0.01 0.45 5.80Comedy Sale 0.36 0.56 0.01 4.17 14.89
Download 0.06 0.08 0.01 1.06 1.70Drama Sale 0.13 0.17 0.01 0.93 15.45
Download 0.03 0.03 0.01 0.26 4.48Horror Sale 0.21 0.25 0.01 1.18 3.18
Download 0.02 0.01 0.01 0.07 1.29Science Fiction Sale 0.87 1.65 0.01 11.44 1.95
Download 0.06 0.07 0.01 0.54 0.28Other Sale 0.16 0.32 0.01 2.08 16.06
Download 0.03 0.03 0.01 0.25 3.74
Note: This table provides information on weekly market share of movie by Genre andSource(Download/Sale). Share variable is measured by using sum of all consumption in one cat-egory devided by sum of total consumption of movies. It can be used to examine the distribution ofconsumer’s choice across categories.
5 Model
Models of movies demand with realistic substitution pattern and taking into ac-
count consumer heterogeneity are pivotal in examining the effect of file-sharing.
In this section, I present a static random coefficient demand model of movies from
both legal source and file-sharing based on Berry, Levinsohn and Pakes(1995). It is
well acknowledged that random coefficient models can generate better substitution
pattern that can get rid of the unrealistic IIA assumption in Multinomial Logit
demand models. In the model, I treat paid movie in cinema and its pirated coun-
terpart as different goods which have very similar product characteristics, their
difference are accounted by dummy variable Pirated.
In the model, time is discrete and indexed by t, the decision period is one week
in length. At each time period we observe a number of markets indexed by m
and a number of products in each market. A product is defined as a movie that
are currently showing in cinemas or available to download on the Internet at a
given period of time. A product is differentiated by title, source and time and can
19
be indexed by jbct where j denotes movie title, c denotes country and b denotes
source( i.e. b=1 denotes download and b=0 denotes in cinemas). In each market,
there is a number of consumers indexed by i. The market size is set to be the total
population of the country.
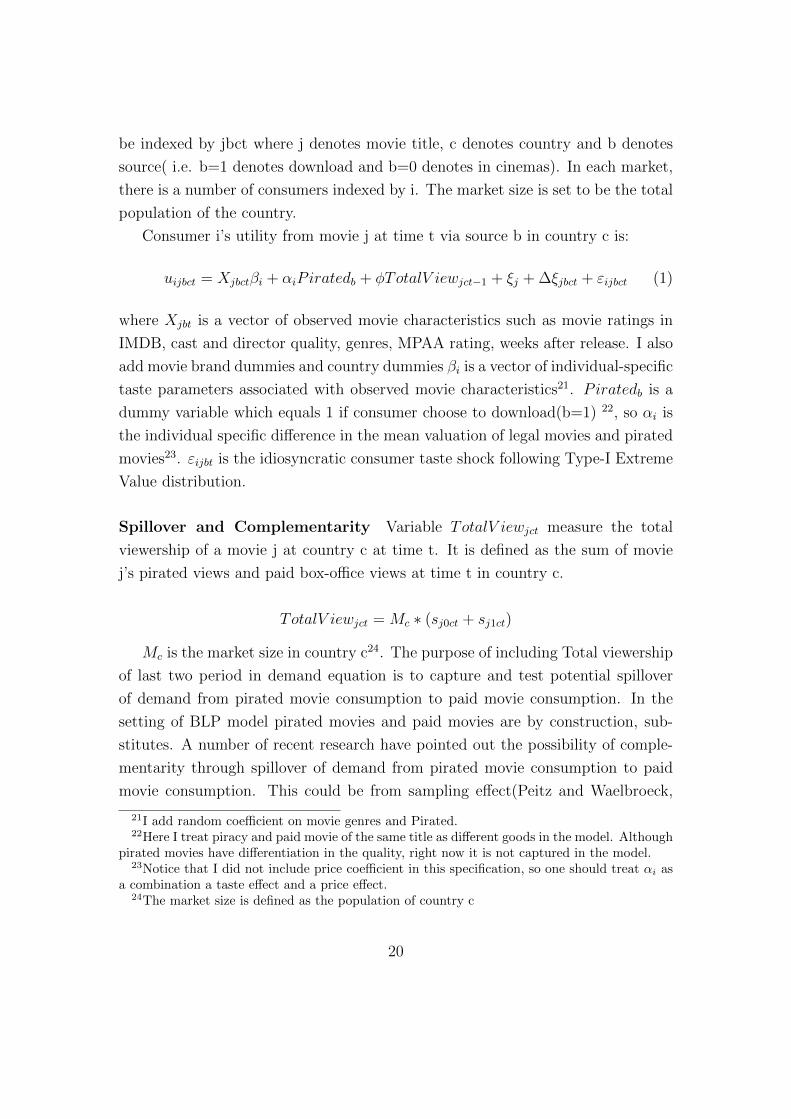
Consumer i’s utility from movie j at time t via source b in country c is:
uijbct = Xjbctβi + αiPiratedb + φTotalV iewjct−1 + ξj + ∆ξjbct + εijbct (1)
where Xjbt is a vector of observed movie characteristics such as movie ratings in
IMDB, cast and director quality, genres, MPAA rating, weeks after release. I also
add movie brand dummies and country dummies βi is a vector of individual-specific
taste parameters associated with observed movie characteristics21. Piratedb is a
dummy variable which equals 1 if consumer choose to download(b=1) 22, so αi is
the individual specific difference in the mean valuation of legal movies and pirated
movies23. εijbt is the idiosyncratic consumer taste shock following Type-I Extreme
Value distribution.
Spillover and Complementarity Variable TotalV iewjct measure the total
viewership of a movie j at country c at time t. It is defined as the sum of movie
j’s pirated views and paid box-office views at time t in country c.
TotalV iewjct = Mc ∗ (sj0ct + sj1ct)
Mc is the market size in country c24. The purpose of including Total viewership
of last two period in demand equation is to capture and test potential spillover
of demand from pirated movie consumption to paid movie consumption. In the
setting of BLP model pirated movies and paid movies are by construction, sub-
stitutes. A number of recent research have pointed out the possibility of comple-
mentarity through spillover of demand from pirated movie consumption to paid
movie consumption. This could be from sampling effect(Peitz and Waelbroeck,
21I add random coefficient on movie genres and Pirated.22Here I treat piracy and paid movie of the same title as different goods in the model. Although
pirated movies have differentiation in the quality, right now it is not captured in the model.23Notice that I did not include price coefficient in this specification, so one should treat αi as
a combination a taste effect and a price effect.24The market size is defined as the population of country c
20

2006; Kretschmer and Peukert, 2016); peer effect/word-of-mouth effect (Morreti,
2011; Peukert, Claussen and Kretschmer, 2016; Lee, 2016), observational learning
(Newberry, 2016), pure network externalities in movie consumption (Gilchrist and
Sand, 2016), backward spillover on product discovery (Hendricks and Sorensen,
2009). In all of these cases, current demand is affected by previous number of
users. Therefore, I model movie as a network good and add total views of last
period in the demand equation, allowing previous downloads to have a spillover ef-
fect on current demand. I then empirically examine the magnitude of the spillover
effect through counterfactual experiment.
Movie Specific Dummy and Other Controls ξj is the movie dummy vari-
ables used to control for time invariant movie specific unobservable characteristics,
the coefficient of time invariant movie characteristics can be obtained by regress-
ing estimated movie fixed effects on those variables. Beside movie fixed effects, I
also include country fixed effect and interaction of country dummies with variable
Pirated that help control all country specific unobservable component that affect
the demand for movies and valuation difference between pirated and paid movies.
Including those fixed effects help improve fit of the model and serve to correct the
potential correlation between observable movie characteristics and unobservable
characteristics as implemented in Nevo(2001). As now market specific deviation
from mean valuation ∆ξjbct will serve as the“error term”. It is plausible to assume
movie characteristics are predetermined and not responsive to market specific taste
deviation from mean.
Interaction of Movie Characteristics with Pirated An important question
is: What movie characteristics are more amenable to piracy? Is consumer’s taste
on Pirated differ by movie characteristics? To answer the question I add inter-
action term of selected movie characteristics with variable Pirated in the vector
of movie characteristics Xjbct. The coefficients of these interaction terms capture
consumer taste on these movie characteristics different between pirated and paid
movies.
Following Nevo (2000), I model the distribution of consumer taste parameters
for movie characteristics (movie genres) and piracy as multivariate normal with a
21

mean that is a function of demographics25:(αi
βi
)=
(α
β
)+ ΠDi + Σvi (2)
whereDi is a vector of demographics variables. Π is a matrix of parameters measur-
ing how consumer taste change with demographics. vi is a vector of unobservable
consumer characteristics following a multivariate standard normal distribution. Σ
is a scaling diagonal matrix. We can then decompose the utility into the shock
term εijbct, a mean utility term component δjbct:
δjbct(Xjbt, P iratedb, ξjbct; θ1) = Xjbctβ−αP iratedb+ξjbct = Xjbctβ−αP iratedb+ξj+∆ξjbct
(3)
and a individual-specific deviation from mean component µijbt:
µijbct(Xjbct, P iratedb, Di, vi; θ2) = [Piratedb, Xjbct]′ ∗ (ΠDi + Σvi) (4)
where θ = (θ1, θ2) is the vector of parameters to be estimated. θ1 = (α, β) are the
linear parameters and θ2 = (Π,Σ) are the nonlinear parameters.
Consumer i can also choose the outside option to neither watch nor download
any movies. The introduction of outside option gives consumers flexibilities to
turn to other non-movie activities, therefore rules out the unrealistic assumption
that one download must transfer into one sale if file-sharing is disabled. The utility
of outside option is defined as:
ui0bct = εi0bct (5)
Consumer i chooses one among all options to maximize his utility. Since the
error term εijbct follows extreme value distribution, consumer i’s choice probability
of movie jbt at time t can be written as:
Prijbct(Xjbct, P iratedb, Di, vi; θ1, θ2) =exp(δjbct + µijbct)
1 +∑j′exp(δj′bct + µij′bct)
(6)
25For simplicity, I abuse notation a little bit and collapse variable TotalV iew and moviedummies inside movie characterstics Xjbct
22

And the market share of product jbt is then:
sjbct =
∫Prijbct(Xjbct, P iratedb, Di, vi; θ1, θ2)dP (D, v, ε) (7)
6 Estimation and Results
6.1 Estimation
Following the estimation procedures of Berry, Levinsohn and Pakes (1995), I use
GMM method to estimate the model’s parameters. The estimation procedure is
basically a nested fixed point algorithm: in the inner loop I solve a contraction
mapping to get mean utility δ’s from the market share. In the outside loop the
unobserved characteristics ξ’s can be obtained via 2SLS and interacted with instru-
ments to form the GMM objective function. I use BFGS method with self-supplied
analytical Gradient function for the optimization.
To be specific, the data I have is: movie characteristics {Xjbct, P iratedb} and
market shares {sjbct}. The parameters need to estimate is {θ1, θ2}. Given the data
I can solve the contraction mapping in the inner loop of estimation algorithm:
δn+1jbct = δnjbct + ln(sjbct)− ln(S(Xjbct, P iratedb, δ
njbct, θ2)) (8)
where S(Xjbct, P iratedb, δnjbct, θ2) is the simulated market share:
S(Xjbct, P iratedb, δnjbct, θ2) =
1
nind
∑i
Prijbct(Xjbct, P iratedb, Di, vi; θ1, θ2) (9)
Following Dube, Fox and Su(2012), I set the convergence tolerance to be 10−8 to
avoid propagation of simulation error which affects parameter estimates. After I
get mean utility δ’s, I can run 2SLS to get error term: the market specific deviation
of mean valuation ∆ξ’s. I then apply GMM to the set of moment conditions:
E[Z∆ξ(θ)] = 0 (10)
Instruments For identification of the random coefficients, I maintain the as-
sumption that own-product characteristics (except week after release and last
23

week’s total views) are uncorrelated with market specific deviation of mean val-
uation ∆ξ. Given the assumptions, I choose a set of differentiation-instruments
in line with Gandhi and Houde (2016) which approximate Chamberlain (1987)
optimal instruments. The instruments are:
• own product characteristics
•∑
j′ ‖Xkjt −Xk
j′t‖2 for each characteristics k
• sum of number of rival product where difference between rival product char-
acteristics and own product characteristics less than one standard deviation
of product characteristics.∑j′ 1{‖Xk
jt −Xkj′t‖ < sd(Xk)} for each characteristics k
6.2 Identification
In this subsection I provide a discussion of identification in this model.
Mean coefficients on movie characteristics (β’s) Characteristics coeffi-
cients (movie genres, rating, weeks after release) are identified from variation in
sales as such characteristics change across different products.
Spillover Coefficient Identification of the spillover effect coefficients on lagged
total views might run into problems with Fixed effect model as pointed out by
the dynamic panel data literature(Nickell 1981; Arellano and Bond 1991). To
account for the potential bias, I choose to include a group of variables on last
week’s weather condition in this country (Gilchrist and Sand 2016) to instrument
for the lagged total views26. The intuition is that weather condition affect both
movie-watching activities and it’s orthogonal to the time-varying component of
unobservable movie quality after we control for time fixed effect.
26For each country, I collect the weather condition for the top 5 cities in terms of populationdaily information including temperature(Celcius), precipitation(inches), dummy variable aboutHail, Snow, Thunder, Fog, Tornado. I separate temperature and precipitation into 5 degreebins and 0.25 inch bins respectively, these city level dummies are then aggregated by weight ofpopulation into country-week level. The data are obtained from WeatherUnderground.com.
24

Distributions of random coefficient (σ)’s Distributions of random coeffi-
cients are identified using variations in choice sets and the corresponding change
in market shares. For example, if three movie A,B and C are offered, A and C
have the same budget but very different rating while B and C have same rating but
very different budget. Suppose we observe that movie C exits the market, then the
magnitude of how consumers of C shift to movie A and movie B will help determine
the distributions of random coefficient on budget and rating respectively.
Interaction terms with demographics To identify interaction terms with
demographics, ideally we should have several markets with variation in distribution
of demographics. Then a comparison of how market shares change following change
in choice sets across different markets will help identify the interaction terms. Here
I have two source of variations: the first one is variations of demographics over
the 10 countries, second is variations of choice set over time across those markets.
These variation will help the identification of interaction terms.
7 Estimation Results
This section reports the estimation result of our model. Beside the full model,
we also report results of several other alternative specifications including a simple
multinomial logit model as benchmark, a nested logit model and a random coef-
ficient model without interactions with demographics for comparison. For MNL
model and nested logit model, the mean utility can be easily obtained by inverting
the market shares. For random coefficient logit model there exist no closed form
solution to invert mean utility, I implement the numerical procedure described in
the previous section. The results are shown in Table 4. Before discussing the full
model result, I’ll first show the result for MNL benchmark.
Multinomial Logit model Column 1 of Table 4 shows the demand estimates
for MNL model. As the result indicates, there is significant difference between
mean valuation of pirated movies and paid movies in theater. One caveat is that,
since I did not include price coefficient in my demand specification in all models
because the identification problem mentioned earlier, dis-utility from price is not
25

controlled for when we interpret the taste for Pirated. One should treat the coef-
ficient as the combination of the negative quality differential effect and a positive
price differential effect.
On average, mean utilities of pirated movies are lower than legal movies by
0.54. This utility difference suggests the quality of a pirated movie at the early
stage of movie release is quite low compared with counterpart in cinema, and there
are certain costs to download movies via file-sharing(waiting time, search cost, risk
of being blocked by ISPs).
The spillover coefficient on lagged totalviews is positive and significant, indicat-
ing that current demand is influenced by previous demand, both piracy and paid.
Movies with better cast and director have better valuations among consumers.
Weeks after release coefficient is negative and significant, indicating consumer’s
preference of ‘fresh’ movies. A counterintuitive result is that the coefficient of rat-
ing is negative and statistically significant, this may be because consumers have
high expectation and are more critical on big budget movies which usually have
wider releases and higher box-office, while consumer rating are relatively lenient
for independent movies, so they are more inclined to get high ratings. Estimates
on Genre dummies indicate that generally action, animation and science fiction are
more popular movie genres than drama and horror movies. Negative coefficient
on the constant term shows that compared with watching movies, people usually
have better outside option.
Nested Logit Column 2 shows the result for nested logit model. As a prior
I impose a nested choice structure where consumer first choose which movie to
watch and then choose the way to watch that movie(theater/download). The
nested choice structure is helpful to overcome the IIA assumption presented in
MNL model. The model can be described as follows:
uijbct = Xjbctβ + φTotalV iewjct−1 + ξjbct + εijbct (11)
where
εijbct = λj + αPiratedb + (1− ρ)εijbct (12)
Here the term εijbct is a combination of group specific shocks and the idiosyn-
cratic shocks. ρ is the nesting parameter which represents the degree of preference
26

Table 4: Demand Estimation Results
(1) (2) (3) (4)MNL Nested Logit Random Coefficient Logit RC Logit with Demographics
Mean Utility Random Coefficient Mean Utility Random Coefficient
Pirated -0.54∗∗∗ -0.36∗∗∗ -1.221* 1.580*** -1.946* 4.533***(0.08) (0.08) (0.615) (0.057) (0.716) (0.022)
TotalViews 0.16∗∗∗ 0.20∗∗∗ 0.182*** 0.122***(in millions) (0.01) (0.01) (0.017) (0.020)Weeks after Release -0.04∗∗∗ -0.05∗∗∗ -0.021** -0.033**
(0.00) (0.00) (0.009) (0.010)Rating -0.02 0.00 -0.109 -0.064
(0.02) (0.02) (0.093) (0.099)Action 1.01∗∗∗ 0.95∗∗∗ -1.705*** 3.096*** -1.217*** 2.783***
(0.09) (0.09) (0.397) (0.127) (0.421) (0.344)Comedy 0.25∗∗ 0.25∗∗ -0.3611 1.0753 -0.437 1.057***
(0.09) (0.08) (0.3381) (1.2231) (0.358) (0.180)Drama -0.08 -0.08 -3.394*** 2.890*** -5.051*** 3.761***
(0.09) (0.08) (0.309) (0.157) (0.328) (0.253)Science Fiction 0.76∗∗∗ 0.79∗∗∗ -0.935 2.280*** -1.142* 2.449***
(0.09) (0.09) (0.515) (0.335) (0.545) (0.843)Horror 0.25∗ 0.23∗ -5.328*** 4.006** -2.901*** 2.748***
(0.10) (0.10) (0.389) (0.877) (0.412) (0.326)Cartoon 1.43∗∗∗ 1.44∗∗∗ -1.541*** 2.653*** -2.628*** 3.224***
(0.09) (0.09) (0.457) (0.335) (0.484) (1.059)PG -0.68∗∗∗ -0.74∗∗∗ -4.091*** 2.915*** -3.131*** 2.521***
(0.10) (0.10) (0.429) (0.110) (0.454) (0.479)PG-13 -0.26∗∗ -0.32∗∗∗ -4.274*** 3.432*** -3.523*** 2.915***
(0.09) (0.09) (0.3631) (0.078) (0.385) (0.418)R -0.29∗∗ -0.37∗∗∗ -4.518*** 3.199*** -5.551*** 3.732***
(0.09) (0.09) (0.343) (0.571) (0.364) (0.584)Cast 0.00∗∗∗ 0.01∗∗∗ 0.008 0.006
(0.00) (0.00) (0.0058) (0.006)Director 0.00∗∗∗ 0.01∗∗∗ 0.005 0.005
(0.00) (0.00) (0.005) (0.006)Sequel 0.17∗∗∗ 0.21∗∗∗ 0.766* 0.739*
(0.04) (0.04) (0.343) (0.363)Nesting Parameter 0.38∗∗∗
(0.02)Constant -6.43∗∗∗ -6.47∗∗∗ -6.338*** 1.873*** -10.350*** 1.787***
(0.14) (0.14) (0.617) (0.212) (0.653) (0.2141)
Interaction with Demographics
Age*Pirated -4.533***(1.185)
Income*Pirated -0.707***(0.030)
Internet Speed*Pirated 2.007***(0.044)
Age*Constant 1.216*(0.549)
Income*Constant 0.448***(0.034)
Movie Fixed Effect X XTime Fixed Effect X X X XObservations 5625 5625 5625 5625Adjusted R2 0.4593 0.4955
Notes: Standard errors in parentheses. ***,**, and * denote statistical significance at 0.005, 0.01, and 0.05 levels respectively. Based on 5625 observations. Cast and Director arevariables ranging from 0 to 100 measuring the strength of cast and director in terms of previous box-office performance. Vriable Age is a binary variable indicates whether or notindividual is older than 40. Variable Income is the log of annual income and variable Internet Speed is the log of the speed of Internet. For full model, movie dummies, countrydummies and interaction terms of Pirated with contry dummies are included. Coefficients of time-invarying movie characterristics are obtained from regressing movie fixed effectson time-invarying movie characterristics.
27

Table 5: Substitutability of Piracy across Movie Genres
Genre MNL Nested Logit RC Logit RC Logit with Demographics
Action -1.15*** -1.03*** -1.3538*** -1.0558***(0.10) (0.10) (0.2159) (0.2515)
Comedy -0.42*** -0.41*** -0.8121*** -0.6911***(0.10) (0.09) (0.2084) (0.2428)
Drama -0.13 -0.10 0.2244 0.4715(0.10) (0.10) (0.2336) (0.2722)
Science Fiction -0.62*** -0.57*** -0.8024*** -0.5514*(0.10) (0.10) (0.2139) (0.2492)
Horror -0.83*** -0.84*** -1.8048*** -0.5695(0.13) (0.12) (0.2539) (0.2958)
Cartoon -1.07*** -0.88*** -1.1734*** -1.1161***(0.10) (0.10) (0.2362) (0.2751)
Notes: Standard errors in parentheses. ***,**, and * denote statistical significance at 0.005, 0.01, and 0.05 levelsrespectively. Based on 5625 observations. The reported estimates denote coefficients of interaction terms betweenPirated and Movie genre dummies. The coefficient can be interpreted as a measure of how disutility of Piracydiffer across movie genres. Larger coefficients indicates higher disuility of the pirated version and therefore lowersubstitutabiliy.
correlation between products in the same group (title).
From column 2 of Table 4, the coefficient for the taste of Piracy drops to -0.36,
and most of the other coefficient are not significantly different from MNL model.
The coefficient for the nesting parameter is 0.38 and statistically significant.
Random Coefficient Logit I estimate two versions of random coefficient logit
models, the first version adds random coefficients on Pirated, movie genres, MPAA
rating and the constant term which is shown on column 3. To explore the role of
demographics in terms of exlaining heterogeneity in preference for piracy, I include
demographics in the second version of RC logit model. Specifically, I include three
demographics variable: Age is a binary variable indicates whether or not individ-
ual is older than 40. Log(Income) is the log of annual income and Log(Internet
Speed) is the log of the speed of Internet. Distribution of Age and Log(Income)
is obtained from Luxembourg Income Study, and distribution of Internet speed
28
data27 is obtained from Testmy.net. I interact demographics (Age, log(Income),
log(Internet Speed)) with variable Pirated and the constant term.
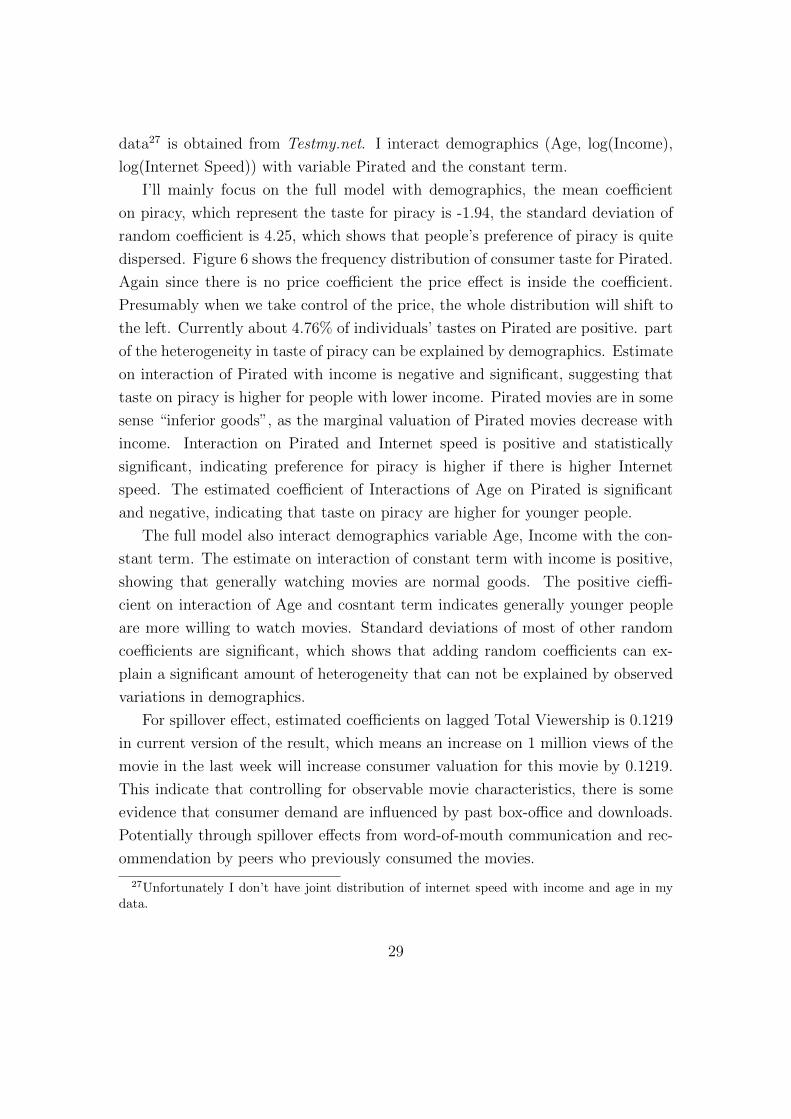
I’ll mainly focus on the full model with demographics, the mean coefficient
on piracy, which represent the taste for piracy is -1.94, the standard deviation of
random coefficient is 4.25, which shows that people’s preference of piracy is quite
dispersed. Figure 6 shows the frequency distribution of consumer taste for Pirated.
Again since there is no price coefficient the price effect is inside the coefficient.
Presumably when we take control of the price, the whole distribution will shift to
the left. Currently about 4.76% of individuals’ tastes on Pirated are positive. part
of the heterogeneity in taste of piracy can be explained by demographics. Estimate
on interaction of Pirated with income is negative and significant, suggesting that
taste on piracy is higher for people with lower income. Pirated movies are in some
sense “inferior goods”, as the marginal valuation of Pirated movies decrease with
income. Interaction on Pirated and Internet speed is positive and statistically
significant, indicating preference for piracy is higher if there is higher Internet
speed. The estimated coefficient of Interactions of Age on Pirated is significant
and negative, indicating that taste on piracy are higher for younger people.
The full model also interact demographics variable Age, Income with the con-
stant term. The estimate on interaction of constant term with income is positive,
showing that generally watching movies are normal goods. The positive cieffi-
cient on interaction of Age and cosntant term indicates generally younger people
are more willing to watch movies. Standard deviations of most of other random
coefficients are significant, which shows that adding random coefficients can ex-
plain a significant amount of heterogeneity that can not be explained by observed
variations in demographics.
For spillover effect, estimated coefficients on lagged Total Viewership is 0.1219
in current version of the result, which means an increase on 1 million views of the
movie in the last week will increase consumer valuation for this movie by 0.1219.
This indicate that controlling for observable movie characteristics, there is some
evidence that consumer demand are influenced by past box-office and downloads.
Potentially through spillover effects from word-of-mouth communication and rec-
ommendation by peers who previously consumed the movies.
27Unfortunately I don’t have joint distribution of internet speed with income and age in mydata.
29

Figure 6: Frequency Distribution of Consumer Taste for Pirated
Note: Frequency distribution of consumer taste for Pirated. Since I did not include price coefficient in my demand equation,dis-utility from price is not controlled for when we interpret the taste for Pirated. Presumably when we take into consideration
the price effect, the whole distribution will shift to the left. About 4.76% of individuals’ tastes on Pirated are positive.
Table 5 reports the estimated coefficients for interaction term between movie
genres and Pirated. The coefficient can be interpreted as a measure of how disu-
tility of Piracy differ across movie genres. Larger coefficients indicates higher
disuility of the pirated version and therefore lower substitutability. Results show
that there are significant difference in piracy’s substitutability, for example, action
and cartoon movies have consistently more negative coefficient, indicating that
these genres of movies are more suitable for theater experience. Other genres like
science fiction also have significant but smaller difference. Where for Drama movie
it is positive but not significant.
8 Counterfactual Experiments
The most important task in this paper is to estimate the true cost of file-sharing
on movie box-office and its welfare implications. In this section, I conduct several
counterfactual experiments to estimate the true cost of file-sharing on box-office
revenue. Specifically, First, I conduct a “No-Piracy” experiment that eradicate all
pirated movie products in my models and compared the counterfactual box-office
revenue and consumer welfare with the benchmark. Second, I consider a firm level
30

Table 6: Result of No-Piracy Counterfactual Experiment
With Piracy No Piracy ChangeIndustry Revenue(billion) 6.82 6.91 +0.09Consumer Welfare(billion) 8.74 8.01 -0.73
“Anti-Piracy Campaign” for each movie by removing just pirated versions of this
movie, while leaving other movies’ pirated version untouched. Third, I shut down
the Spillover effect channel to measure the magnitude of spillover effect of piracy
on box-office.
8.1 Eradicate All Piracy
I remove all pirated movies in the model and recalculated counter-factual market
shares using the estimated full model parameters in Table 6. Assuming price is
the same after the no-piracy policy, I can then calculate counterfactual industry
revenue as the product of market share times market size and price. Following
Train(2003), consumer welfare at market c and time t is calculated as the market
size times the average of expected maximum value of indirect utility of simulated
individuals:
CSct = Mct1
α
1
nind
∑i
E[maxuijbct] (13)
where α is the mean price coefficient used to translate utility into terms of money
value28 and Mc denotes market size of country c.
The result of the counterfactual experiment is shown in Table 6. The elimina-
tion of pirated movies on file-sharing will result in a increase of industry revenue of
$90 millions during 20 week period in those 10 countries. The number represent a
1.4 % increase in total box-office revenue. It will translate into an annual number
of $0.243 billion, which is lower than the widely cited estimates of $3 billions from
MPAA in 2005.29 On the other side, consumer welfare decrease by $ 0.73 billion
when we ban piracy, which is 3 times higher than the increase in motion picture
industry revenue. There is a dead weight loss of $0.64 billions if we ban movie
28Because I did not attempt to estimate price elasticity in this paper, I parametrize the α as0.16 according to Davis (2002).
29In 2005, the Motion Picture Association of America (MPAA) estimated that they were losing$3 billion in box office sales due to piracy according to De Vany and Walls(2007)
31

piracy. In general, The counterfactual result suggests that piracy indeed “rob”
firm revenue, but also increase consumer welfare which is higher than the initial
loss. So policy that eradicating movie file-sharing may result in transfer of large
reduction of consumer welfares into small increase in industry revenue, resulting
in socially inefficient outcomes from just the social welfare’s point of view.
If we use a “Naive” way to estimate the revenue loss, assuming that one down-
load equals one lost sale of paid movies, then the estimated revenue loss amount to
0.828 billion dollars for the same time periods and countries, which is 9.2 times of
the revenue loss calculated in counter-factual experiment. Many widely cited in-
dustry studies have employed this “Naive” methods in their estimation on piracy’s
cost. The result shows that using such methodology will substantially inflate the
true loss of piracy.
I also calculate the average displacement rate of pirated movies on legitimate
movie sale in theaters. On average one download displaces legitimate sale by 0.11
unit.
To assess the heterogeneity in responses to removal of piracy, I calculate the
displacement rate and recovered revenue for each movie. Table 8 shows some de-
scriptive statistics on the distribution of recovered revenue. There are substantial
heterogeneity in terms of movies recovered revenue from piracy eradication be-
cause of the difference in position in characteristics space and level of competition
faced. I calculate each movie’s revenue gain from the no-piracy counter-factual
experiment. On average movie’s revenue increases by 0.379 million dollars, the
distribution is quite dispersed with a standard deviation of 1.390 million.
To further understand how the response differs with movie characteristics, I
run an OLS regression of each movie’s recovered revenue and displacement on a
number of movie characteristics, the result is shown in Table 7. From the result, for
displacement rate, wide release movies have significantly higher displacement rate.
In terms of recovered revenue, Action movie and Science Fiction movie significantly
benefit more from removal of piracy. Again, wide release movies have significantly
much higher recovered revenue. These results indicate that the removal of piracy
mainly benefit the ”blockbuster” movies that lies in the top tail of the distribution.
32

Table 7: OLS Regression of Recovered Revenue and displacement Rate on MovieCharacteristics
(1) (2)Recovered Revenue in Full Eradication Displacement rate
Wide Release 1.46*** 0.22***(0.22) (0.04)
cast 0.00 0.00(0.00) (0.00)
director 0.00 -0.00(0.00) (0.00)
sequel 1.14*** -0.05(0.27) (0.05)
rating 0.14 0.00(0.07) (0.02)
action 0.68* 0.08(0.32) (0.07)
comedy -0.14 0.04(0.26) (0.06)
drama -0.07 0.02(0.24) (0.06)
sci 1.30** 0.02(0.41) (0.08)
horror -0.43 0.07(0.31) (0.08)
animation -0.00 0.03(0.36) (0.08)
pg -0.50 -0.03(0.33) (0.12)
pg13 -0.16 -0.06(0.28) (0.11)
r -0.09 -0.03(0.27) (0.11)
Constant -0.99* -0.01(0.48) (0.17)
Adjusted R2 0.40 0.2633

8.2 Partial Eradication
The previous contractual experiment resemble the copyright protection at the pub-
lic and legislative level, where policy are tend to affect the whole industry. But
copyright protections are not always initiated by the government or legislation, in
recent years private copyright protection initiated by firms targeting at individ-
ual copyrighted work becomes more and more prevalent. As Reimers (2016) have
pointed out, such private copyright protections are effective in the book publishing
industry. In motion picture industry, studios also hire internet surveillance com-
pany to monitor and send DMCA notices to take down torrents files on file-sharing
websites. How effective are those private copyright protection efforts targeted to
remove piracy for individual movie? Will downloader substitute into its paid ver-
sion, other pirated movies or simply the outside options? To answer the question
I conduct a partial removal counter-factual experiment. In this experiment, for
each movie I simulate a firm-level private copyright protection campaign, which
eliminate all its pirated versions in all countries across all time periods, but leave
pirated versions of other movies untouched. I then calculate counter-factual mar-
ket shares and counter-factual revenue increase for that movie.
Table 8 shows the comparison of average movie’s revenue increase between this
partial eradication counterfactual experiment and the full eradication experiment.
Not surprisingly, average revenue increase has dropped to 0.045 million, only 12%
of the average recovered revenue by eradicating all piracy. In this counterfactual,
most downloaders will choose the other available pirated movie or other similar
movies instead because in many cases the availability of original movie in theaters
are small.
Table 10 shows how consumers substitute into other products when their initial
choice was eliminated for a selected number of movies in US at one particular time
period. An examination of Table 10 reveals that substitution is not just restricted
to substitution within movie title. There is also notable cross substitution effect
of piracy across movie titles with similar characteristics. For example, after the
elimination of pirated versions of movie Minions, 26 % of downloaders of Minions
choose to go to watch Minions in theaters, also 4.5 % of downloaders choose to
watch another cartoon Inside Out. In general, except for blockbuster movie like
Avengers: Age of Ultron or Jurassic World that have few concurrent competitors
34

Table 8: Comparison of Revenue Increase from two Counter-Factual Experiment
(in millions) Mean Std Dev Min Max Effects on other moviesFull removal 0.379 1.390 -0.007 10.711 -Partial removal 0.045 0.359 -0.008 4.607 0.22
and lots of concurrent downloads during release, most movies can only reclaim
a small fraction of recovered revenue in full eradication of piracy. Both due to
the timing of downloads and cross-substitution into other piracy or paid movies.30
Despite the limited influence on its own revenue, the externalities from private
copyright protection to the other movies are big in magnitude. On average other
movies gain 0.22 million dollar in total, roughly 5 times of the gain from the own
movie. The result to some extent indicate that the biggest threat to one movie’s
box-office revenue is not the piracy of its own movie, but rather the movies whose
downloads overlap with its box-office windows. In order for private copyright pro-
tection to secure the box-office revenue, other studios’ copyright protection efforts
are equally important, so coordination and cooperation of copyright protection
efforts may be beneficial to studios.
8.3 How Big is the Spillover Effect?
In the third counter-factual experiment, I quantify the magnitude of the spillover
effect from pirated consumption. In the model, demand are influenced by the total
viewership in the last two periods to account for all possible channels of spillover
effects. Higher previous market share in pirated movie therefore can benefit the
demand for paid movies in next period. Based solely on the estimates, the spillover
effect is not statistically significant, but it is difficult to know whether the mag-
nitude of spillover effects have economics significance. so in this counterfactual
experiment, I shut down the channel for spillover effect from piracy by redefine
the previous totalviews as only the previous views from box-office, and compare the
counterfactual revenue with the benchmark to quantify the magnitude of spillover
effect on industry revenue.
30Here the cross-substitution effect might be overestimated because of the model assumptionsof iid taste shock between one movie and its piracy, it would be useful to verify using differentspecification of choice structure, for example imposing a nested structure of choice.
35

Tab
le9:
Subst
ituti
onP
atte
rns
up
onE
radic
atio
nof
Par
ticu
lar
Mov
ie’s
Pir
acy
for
US
inw
eek
15
Per
cent(
%)
ou
tid
eop
tion
Paid
Movie
sP
irate
dM
ovie
s
Hom
eIn
sid
eO
ut
Ju
rass
icW
orl
dT
erm
inato
rM
inio
ns
Spy
Hom
eJu
rass
icW
orl
dM
inio
ns
Spy
ou
tsid
eop
tion
--
--
--
--
--
-
Paid
Movie
sH
om
e33.4
069
-100
9.1
391
0.5
217
0.1
418
54.0
09
0.0
058
0.2
265
0.0
291
0.0
93
0.0
011
Insi
de
Ou
t35.2
809
0.1
467
-100
0.5
684
0.1
522
60.7
835
0.0
061
0.2
481
0.0
309
0.1
019
0.0
011
Ju
rass
icW
orl
d77.0
618
0.0
085
0.5
938
-100
8.0
485
3.5
092
0.0
043
0.0
01
0.8
649
0.0
004
0.0
005
Ter
min
ato
r80.4
048
0.0
03
0.2
091
9.9
687
-100
1.2
357
0.0
495
0.0
006
0.1
373
0.0
003
0.0
006
Min
ion
s55.5
423
0.4
934
34.5
919
1.1
557
0.2
79
-100
0.0
102
0.7
127
0.0
493
0.2
927
0.0
013
Spy
30.3
505
0.0
005
0.0
355
0.0
255
0.2
027
0.2
096
-100
0.0
001
0.0
01
09.4
217
Pir
ate
dM
ovie
sH
om
e59.8
264
0.0
67
4.6
948
0.0
191
0.0
09
27.7
45
0.0
002
-100
0.5
691
3.6
39
0.0
012
Ju
rass
icW
orl
d90.7
006
0.0
017
0.1
201
3.2
379
0.3
738
0.7
099
0.0
006
0.1
426
-100
0.0
586
0.0
103
Min
ion
s56.3
862
0.0
65
4.5
548
0.0
19
0.0
089
26.9
177
0.0
002
8.2
414
0.5
626
-100
0.0
012
Spy
17.5
318
0.0
002
0.0
114
0.0
053
0.0
044
0.0
676
15.8
22
0.0
006
0.0
241
0.0
002
-100
36
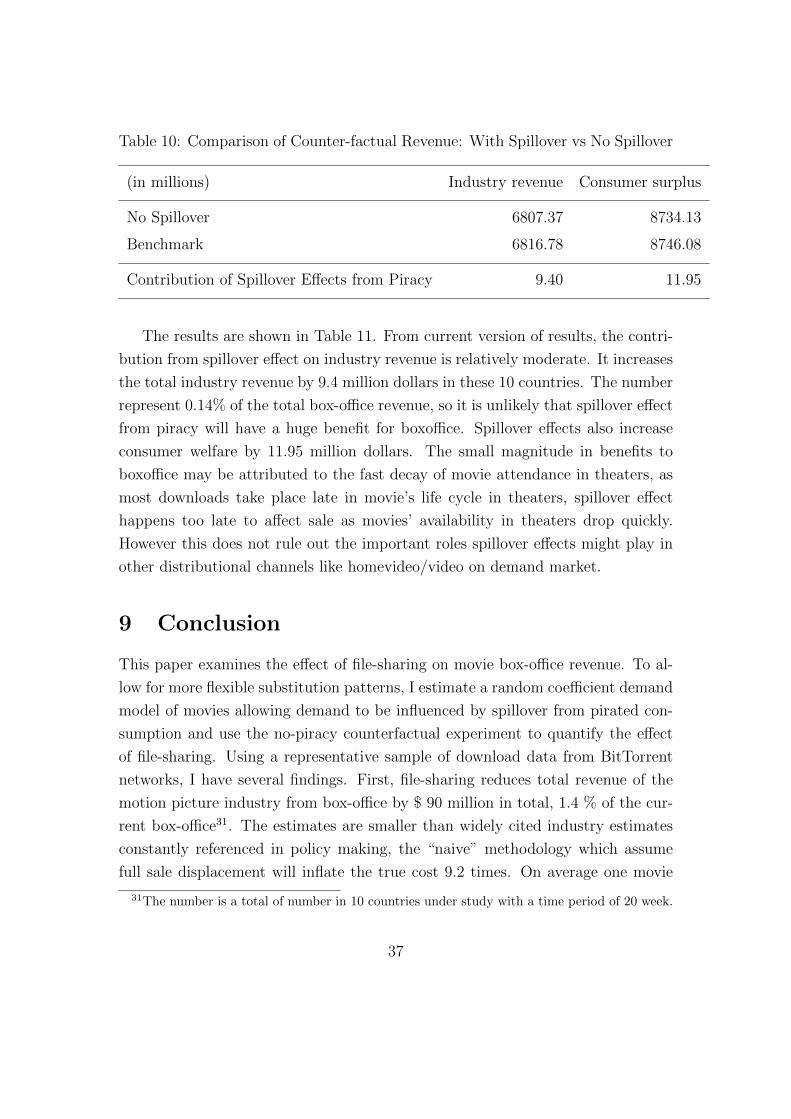
Table 10: Comparison of Counter-factual Revenue: With Spillover vs No Spillover
(in millions) Industry revenue Consumer surplus
No Spillover 6807.37 8734.13
Benchmark 6816.78 8746.08
Contribution of Spillover Effects from Piracy 9.40 11.95
The results are shown in Table 11. From current version of results, the contri-
bution from spillover effect on industry revenue is relatively moderate. It increases
the total industry revenue by 9.4 million dollars in these 10 countries. The number
represent 0.14% of the total box-office revenue, so it is unlikely that spillover effect
from piracy will have a huge benefit for boxoffice. Spillover effects also increase
consumer welfare by 11.95 million dollars. The small magnitude in benefits to
boxoffice may be attributed to the fast decay of movie attendance in theaters, as
most downloads take place late in movie’s life cycle in theaters, spillover effect
happens too late to affect sale as movies’ availability in theaters drop quickly.
However this does not rule out the important roles spillover effects might play in
other distributional channels like homevideo/video on demand market.
9 Conclusion
This paper examines the effect of file-sharing on movie box-office revenue. To al-
low for more flexible substitution patterns, I estimate a random coefficient demand
model of movies allowing demand to be influenced by spillover from pirated con-
sumption and use the no-piracy counterfactual experiment to quantify the effect
of file-sharing. Using a representative sample of download data from BitTorrent
networks, I have several findings. First, file-sharing reduces total revenue of the
motion picture industry from box-office by $ 90 million in total, 1.4 % of the cur-
rent box-office31. The estimates are smaller than widely cited industry estimates
constantly referenced in policy making, the “naive” methodology which assume
full sale displacement will inflate the true cost 9.2 times. On average one movie
31The number is a total of number in 10 countries under study with a time period of 20 week.
37

suffers monetary loss of 0.259 million because of file-sharing. Second, on average
one download displace legitimate sale by 0.11 unit. Third, the results of welfare
analysis show that file-sharing increase consumer welfare by a total of $ 0.73 bil-
lion, therefore banning file-sharing service will result in a dead weight loss of $ 0.64
billion. Fourth, I examine factors that affect the revenue loss due to piracy. I find
that wide release movies, science fiction and action movies are more vulnerable to
piracy. In addition, anti-piracy campaigns that remove piracy for individual movie
have limited benefits to boxoffice revenue because most downloaders just substi-
tute into other pirated movies. Lastly, I examine the magnitude of spillover effect
of piracy on boxoffice revenue. I find that spillover effect contributes to box-office
revenue by a total of 9.4 million dollars in 10 countries during 20 weeks period.
The findings of this paper serve to provide extra evidence to assist the resolution
of current heated debate on controversial issues regarding intellectual property. For
policy makers, the findings in this paper highlight the importance of considering
outside option and substitution in evaluating th effect of file-sharing, research
omitting these factors will substantially overestimate the negative effects of file-
sharing and should be treated with caution for policy making. For industry, the
finding in this paper can be used by motion picture studios to determine the
optimal level of copyright protection given the high supervision and litigation cost.
An interesting question I did not answer in this paper is how supply of movies
is affected by file-sharing since I take movie release as exogenous in my model.
An interesting extension of this paper will be to model the movie release decision
as an entry game given the estimated demand system. This will help to find the
effect of file-sharing on producer incentives to supply new products, which is also
an important question worth exploring in the future.
References
[1] Manuel Arellano and Stephen Bond. Some Tests od Specification for Panel
Data: Monte Carlo Evidence and an Application to Emplyment Equations.
The Review of Economic Studies, 59(2):277–297, 1991.
[2] Paul Belleflamme and Martin Peitz. Digital Piracy: Theory. The Oxford
Handbook of the Digital Economy, Oxford University Press, 2012.
38

[3] Paul Belleflamme and Martin Peitz. Industrial organization: markets and
strategies. Cambridge University Press, 2010.
[4] Steven Berry, James Levinsohn, and Ariel Pakes. Automobile prices in market
equilibrium. Econometrica, 63(4):841–890, 1995.
[5] David Blackburn. Does file sharing affect record sales. PhD diss. Harvard
University, 2004.
[6] Michele Boldrin and David Levine. The case against intellectual property.
American Economic Review, pages 209–212, 2002.
[7] Bram Cohen. The bittorrent protocol specification. 2015.
[8] Brett Danaher and Joel Waldfogel. Reel Piracy: The Effect of Internet Film
Piracy on International Box Office Sales. Working Paper, 2015.
[9] Brett Danaher and Michael D Smith. Gone in 60 Seconds: The Impact of
the Megaupload Shutdown on Movie Sales International Journal of Industrial
Organization, 33:1–8, 2014.
[10] Peter Davis. Estimating multi-way error components models with unbalanced
data structures. Journal of Econometrics, 106(1):67–95, 2002.
[11] Peter Davis. Spatial competition in retail markets: movie theaters. RAND
Journal of Economics, pages 964–982, 2006.
[12] Nicolas De Roos and Jordi McKenzie. Cheap tuesdays and the demand for
cinema. International Journal of Industrial Organization, 33:93–109, 2014.
[13] Arthur De Vany and W David Walls. Uncertainty in the movie industry: Does
star power reduce the terror of the box office? Journal of Cultural Economics,
23(4):285–318, 1999.
[14] Arthur S De Vany and W David Walls. Estimating the effects of movie piracy
on box-office revenue. Review of Industrial Organization, 30(4):291–301, 2007.
[15] Jean-Pierre Dube, Jeremy T Fox, and Che-Lin Su. Improving the numerical
performance of static and dynamic aggregate discrete choice random coeffi-
cients demand estimation. Econometrica, 80(5):2231–2267, 2012.
39

[16] Liran Einav. Seasonality in the us motion picture industry. RAND Journal
of Economics, pages 127–145, 2007.
[17] David Erman. Bittorrent Traffic Measurements and Models, 2005.
[18] Amit Gayer and Oz Shy. Internet and peer-to-peer distributions in markets
for digital products. Economics Letters, 81(2):197–203, 2003.
[19] Benjamin Klein, Andres V Lerner, and Kevin M Murphy. The economics of
copyright” fair use” in a networked world. American Economic Review, pages
205–208, 2002.
[20] Jonathan Lee. Purchase, Pirate, Publicize: The Effect of Private-Network
File Sharing on Album Sales Working paper, 2016.
[21] Tin Cheuk Leung. What is the true loss due to piracy? evidence from mi-
crosoft office in hong kong. Review of Economics and Statistics, 95(3):1018–
1029, 2013.
[22] Robert Layton, and Paul Watters. Investigation into the extent of infringing
content on BitTorrent networks Internet Commerce Security Laboratory, 8–
10, 2010.
[23] Stan Liebowitz. Will mp3 downloads annihilate the record industry? the
evidence so far. Advances in the Study of Entrepreneurship, Innovation, and
Economic Growth, 15:229–260, 2004.
[24] Stan J Liebowitz. Pitfalls in measuring the impact of file-sharing on the sound
recording market. CESifo Economic Studies, 51(2-3):435–473, 2005.
[25] Stan J Liebowitz. File sharing: creative destruction or just plain destruction?
Journal of Law and Economics, 49(1):1, 2006.
[26] Liye Ma, Alan Montgomery and Michael D. The Dual Impact of Movie Piracy
on Box-Office Revenue: Cannibalization and Promotion. Available at SSRN:
https://ssrn.com/abstract=2736946
[27] Jordi McKenzie. The economics of movies: A literature survey. Journal of
Economic Surveys, 26(1):42–70, 2012.
40

[28] Aviv Nevo. Mergers with differentiated products: The case of the ready-to-eat
cereal industry. The RAND Journal of Economics, pages 395–421, 2000.
[29] Aviv Nevo. A practitioner’s guide to estimation of random-coefficients logit
models of demand. Journal of Economics and Management Strategy, 9(4):513–
548, 2000.
[30] Aviv Nevo. Measuring market power in the ready-to-eat cereal industry.
Econometrica, 69(2):307–342, 2001.
[31] Stephen Nickell. Biases in Dynamic Models with Fixed Effects. Econometrica,
49(6):1417–1426, 1981.
[32] Imke Reimers. Can Private Copyright Protection be Effective? Evidence
from Book Publishing. Journal of Law and Economics, 59, no.2 (May 2016):
411–440.
[33] Felix Oberholzer-Gee and Koleman Strumpf. The effect of file sharing on
record sales: An empirical analysis. Journal of Political Economy, 115(1):1–
42, 2007.
[34] Motion Picture Association of America. Theatrical market statistics 2014.
2014.
[35] Barak Y Orbach and Liran Einav. Uniform prices for differentiated goods:
The case of the movie-theater industry. International Review of Law and
Economics, 27(2):129–153, 2007.
[36] Christian Peukert, Jorg Claussen , and Tobias Kretschmer. Piracy and Box
Office Movie Revenues: Evidence from Megaupload. International Journal of
Industrial Organization, forthcoming, 2016.
[37] Tobias Kretschmer and Christian Peukert. Video killed the radio star? Online
music videos and digital music sales. Working Paper, 2016.
[38] Martin Peitz and Patrick Waelbroeck. Piracy of digital products: A criti-
cal review of the theoretical literature. Information Economics and Policy,
18(4):449–476, 2006.
41

[39] Kathleen Reavis Conner and Richard P Rumelt. Software piracy: an analysis
of protection strategies. Management Science, 37(2):125–139, 1991.
[40] Rafael Rob and Joel Waldfogel. Piracy on the high c’s: Music download-
ing, sales displacement, and social welfare in a sample of college students.
Technical report, National Bureau of Economic Research, 2004.
[41] Rafael Rob and Joel Waldfogel. Piracy on the Silver Screen. Journal of
Industrial Economics, 55(3), 379–395, 2007.
[42] Joshua Slive and Dan Bernhardt. Pirated for profit. Canadian Journal of
Economics, pages 886–899, 1998.
[43] Olaf van der Spek. Udp tracker protocol for bittorrent. 2015.
[44] Kenneth E Train. Discrete choice methods with simulation. Cambridge uni-
versity press, 2009.
[45] Joel Waldfogel. Music file sharing and sales displacement in the itunes era
Information economics and policy, 22:306–314, 2010.
[46] Alejandro Zentner. Measuring the effect of file sharing on music purchases*.
Journal of Law and Economics, 49(1):63–90, 2006.
42

Appendix A Reliability of the Download Esti-
mates
Given the difficulty in estimating traffics on BitTorrent, concerns might be raised
regarding precision of the collected data in this paper, as indeed certain type of
BitTorrent activities are omitted in our data collection procedures. For example,
the data collection process are unable to track download activity happened through
trackerless protocol (DHT) and private trackers. It would be ideal to compare
our data with data with more reliable statistics from sources such as Internet
surveillance companies to further assess the quality of our data. While the data
on downloading via BitTorrent for movies are scarce. I manage to find yearly
download statistics for a limited number of movie in 2015 estimated by professional
piracy tracking company Explico32. Table 12 shows the comparison of download
estimates in this paper and Explico’s estimates.
As the Table shows, indeed there are some difference between the two columns,
generally our data tend to underestimate the download compared to Explico’s, our
average is 28,155,435 compared with their average: 33,221,557. The correlation
coefficient is 0.88. The high correlation suggest that variation in our data well
match the variation in file-sharing network. Although data estimates in this paper
are usually smaller than Explico’s estimate, to assess robustness of our result to the
downloads count. we can multiplied our download count by a factor to minimize
the distance to Explico’s download estimates and re-estimate the model.
[IMCOMPLETE]
Appendix B Illegal Streaming
With the emergence of Pirated streaming website like Popcorntime, Putlocker and
Movie4k, many file-sharing users have switched from downloading to streaming.
In 2015, streaming has already taken up a significant proportion of total piracy
activity. In order to taken into account the increasing popularity of illegal stream-
ing service, the volume of illegal streaming need to be estimated. Unfortunately
it is technically very difficult to monitor the movie streaming traffic.
32http://variety.com/2015/digital/news/top-10-pirated-movies-of-2015-see-alarming-increase-in-downloads-1201667982/
43
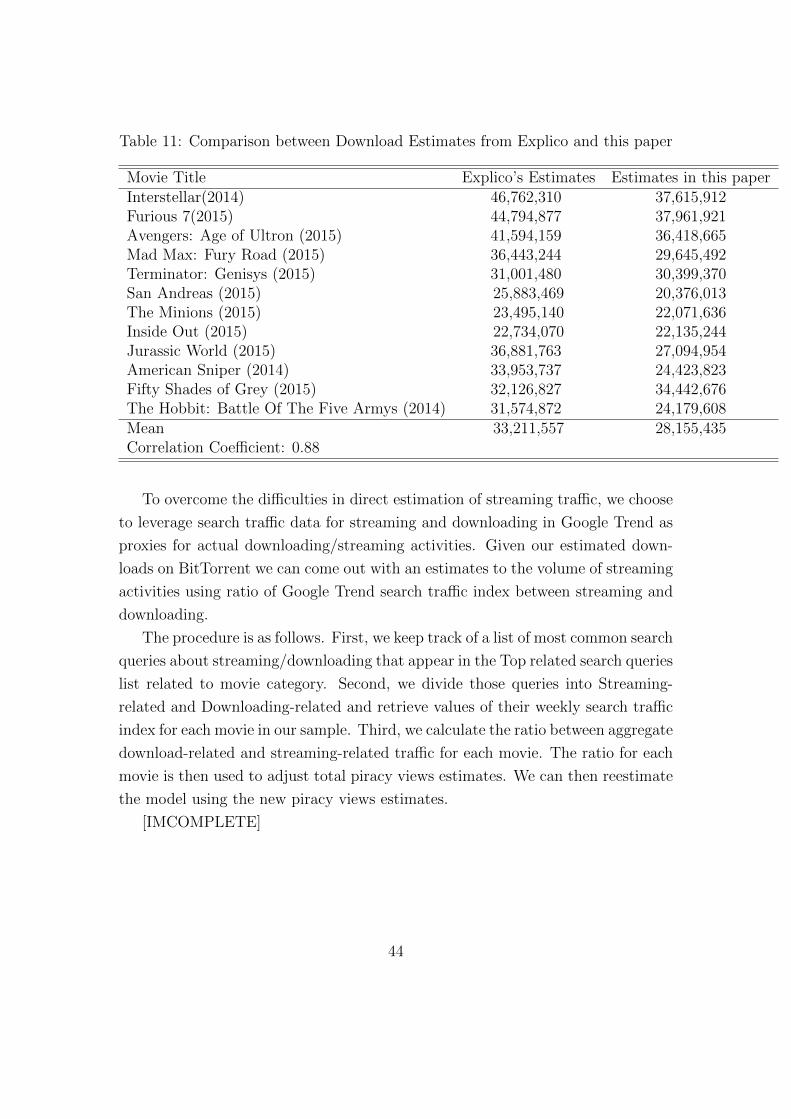
Table 11: Comparison between Download Estimates from Explico and this paper
Movie Title Explico’s Estimates Estimates in this paperInterstellar(2014) 46,762,310 37,615,912Furious 7(2015) 44,794,877 37,961,921Avengers: Age of Ultron (2015) 41,594,159 36,418,665Mad Max: Fury Road (2015) 36,443,244 29,645,492Terminator: Genisys (2015) 31,001,480 30,399,370San Andreas (2015) 25,883,469 20,376,013The Minions (2015) 23,495,140 22,071,636Inside Out (2015) 22,734,070 22,135,244Jurassic World (2015) 36,881,763 27,094,954American Sniper (2014) 33,953,737 24,423,823Fifty Shades of Grey (2015) 32,126,827 34,442,676The Hobbit: Battle Of The Five Armys (2014) 31,574,872 24,179,608Mean 33,211,557 28,155,435Correlation Coefficient: 0.88
To overcome the difficulties in direct estimation of streaming traffic, we choose
to leverage search traffic data for streaming and downloading in Google Trend as
proxies for actual downloading/streaming activities. Given our estimated down-
loads on BitTorrent we can come out with an estimates to the volume of streaming
activities using ratio of Google Trend search traffic index between streaming and
downloading.
The procedure is as follows. First, we keep track of a list of most common search
queries about streaming/downloading that appear in the Top related search queries
list related to movie category. Second, we divide those queries into Streaming-
related and Downloading-related and retrieve values of their weekly search traffic
index for each movie in our sample. Third, we calculate the ratio between aggregate
download-related and streaming-related traffic for each movie. The ratio for each
movie is then used to adjust total piracy views estimates. We can then reestimate
the model using the new piracy views estimates.
[IMCOMPLETE]
44

Appendix C List of Trackers
udp://open.demonii.com:1337/announce
udp://9.rarbg.com:2710/announce
udp://tracker.leechers-paradise.org:6969/announce
udp://glotorrents.pw:6969/announce
http://bttracker.crunchbanglinux.org:6969/announce
http://i.bandito.org/announce
udp://www.eddie4.nl:6969/announce
udp://coppersurfer.tk:6969/announce
udp://shadowshq.eddie4.nl:6969/announce
http://tracker.dutchtracking.nl/announce
http://tracker.flashtorrents.org:6969/announce
udp://tracker.internetwarriors.net:1337/announce
http://www.todotorrents.com:2710/announce
http://pow7.com/announce
udp://inferno.demonoid.ph:3389/announce
http://torrent.gresille.org/announce
udp://tracker4.piratux.com:6969/announce
http://opensharing.org:2710/announce
http://anisaishuu.de:2710/announce
http://tracker.tvunderground.org.ru:3218/announce
http://tracker2.wasabii.com.tw:6969/announce
udp://mgtracker.org:2710/announce
udp://shadowshq.yi.org:6969/announce
http://bt.careland.com.cn:6969/announce
http://teentorrent.com:7070/announce
http://tracker.dler.org:6969/announce
http://bigfoot1942.sektori.org:6969/announce
udp://sugoi.pomf.se:80/announce
http://tracker.blazing.de:6969/announce
udp://exodus.desync.com:6969/announce
udp://open.nyaatorrents.info:6544/announce
http://tracker.tricitytorrents.com:2710/announce
udp://tracker.blackunicorn.xyz:6969/announce
http://tracker.ex.ua/announce
45

udp://bt.rutor.org:2710/announce
http://announce.torrentsmd.com:6969/announce
http://tracker.aletorrenty.pl:2710/announce
http://210.244.71.11:6969/announce
udp://tracker.torrenty.org:6969/announce
http://pubt.net:2710/announce
http://tracker.best-torrents.net:6969/announce
http://tracker.files.fm:6969/announce
http://retracker.uln-ix.ru/announce
http://bulkpeers.com:2710/announce
http://tracker3.infohash.org/announce
http://bt.mp4ba.com:2710/announce
udp://tracker.opentrackr.org:1337/announce
udp://p4p.arenabg.ch:1337/announce
http://retracker.telecom.kz/announce
http://tracker.mg64.net:6881/announce
http://tracker.trackerfix.com/announce
udp://zer0day.ch:1337/announce
udp://tracker.piratepublic.com:1337/announce
udp://tracker.sktorrent.net:6969/announce
http://xbtrutor.com:2710/announce
http://85.17.19.180/announce
http://tracker.bittorrent.am/announce
http://siambit.org/announce.php
http://retracker.krs-ix.ru/announce
http://tracker.baravik.org:6970/announce
http://tracker.tntvillage.scambioetico.org:2710/announce
http://tracker.mininova.org/announce
http://tracker.frozen-layer.com:6969/announce
http://www.mvgroup.org:2710/announce
http://bt.edwardk.info:6969/announce
http://share.camoe.cn:8080/announce
http://tracker.otaku-irc.fr/bt/announce.php
http://tracker.anirena.com:81/announce
http://tracker.dm258.cn:7070/announce
http://tracker.minglong.org:8080/announce
46

http://www.smartorrent.com:2710/announce
http://tracker.zaerc.com/announce.php
http://www.spanishtracker.com:2710/announce
http://www.todotorrents.com:2710/announce
http://www.tribalmixes.com/announce.php
http://funfile.org:2710/announce
http://mixfiend.com/announce.php
http://firesharing.altervista.org/announce.php
http://tracker.desitorrents.com:6969/announce
http://fafs.fansubanime.net/announce.php
http://all4nothin.net/announce.php
http://www.crnaberza.com/announce.php
http://www.gameupdates.org/announce.php
47