the 20 20 src green book of 35-year charts...the 20 20 src green book of 35-y ear charts the 2020...
TRANSCRIPT

The 202
0SRC
Green Book of 3
5-Year C
harts
The 2020 SRC Green Book®
of 35-Year Charts®
40th Annual Edition
Green Book 2016.qxp_Layout 1 2/5/16 10:22 AM Page 1
Securities Research Company · 1050 University Ave. STE E107-97 · San Diego, CA 92103 Phone: (508)832-4509
Website: www.Securities-Research.Com Email: [email protected]
Preview Edition Companies A-B

||||||||||
SRC 35-YEAR CHART LEGEND GROWTH
PERFORMANCE MEASUREMENT The Growth Performance Measurement on each chart clearly shows the percent-age gain or loss for price, earnings, and dividends for the past 1, 5, 10, & 25 years – saving you time – no need to look elsewhere. CORPORATE ACTIONS
Significant events in a company’s history, such as an acquisition, divestiture or stock split are indicated, taking out all of the guesswork.
PRICE RANGES
A quick glance at the high, low, and closing prices will show you if your stock’s price trend is up, down or sideways. (Read from right scale.)
RELATIVE PERFORMANCE This handy indicator shows you each stock’s relative-to-market action compared to the S&P 500.
RECESSIONS
Recessionary periods are shaded in grey.
ADJUSTED EARNINGS Earnings have been adjusted by removing extraordinary items –giving you the most accurate picture of earnings performance. (Read from left scale.)
MOVING AVERAGE This line represents the average of closing prices for the most recent period. (Read from right scale.)
DIVIDENDS & STOCK SPLITS Charts show dividend and stock splits. This allows for easy calculation to determine “basis” price and helps you establish reference markers to determine growth rates for prices, earnings, and divi-dends. (Read from left scale.)
VOLUME Let’s you track the easy way the number of shares traded. (Read at the very bottom)
CAPITALIZATION DATA Includes the company’s capitalization structure, shares outstanding, book value, P/E ratio, industry P/E ratio, and location of the company.
SEMI-LOGARITHMIC SCALE SRC stock charts are plotted on uniform semi-logarithmic (ratio) scale grids. This enables you to quickly compare percentage moves on one stock chart with any other. Semi-logarithmic charts do a better job than arithmetic scale charts in providing an accurate picture. Example: Two stocks have an identical price rise. Each jumps 5 points. At first, it seems both stocks are performing equally well. But while for a $100 stock that’s a mere 5% increase in value, for a $20 stock it’s 25%.On any SRC stock chart, this 25% increase covers a distance 5 times greater than the 5%, so the sharply different rate of performance jumps right out at you.
Capitalization Data
Dividends (left scale)
Relative Performance
Earnings (left scale)
Price Ranges (right scale)
Growth rates for 1, 5, 10 & 25 years
Stock Splits
Volume
Moving Average
Corp. Actions
Recessionary Periods

THE
SRC GREEN BOOK®
OF
35-YEAR CHARTS®
1985 — 2020
40th EDITION
Executive Editor: Mike Gmitter
Published by Securities Research Company
1050 University Ave. STE E107-97, San Diego, CA 92103www.Securities-Research.com
© 2020 SECURITIES RESEARCH COMPANY - All rights reserved.

INDEX
Major Market Indices Dow Jones Industrial Avera ........... 1 Dow Jones Transportation A .......... 2 Dow Jones Utility Average ............ 3 Dow Jones Composite 65 ............... 4 NYSE Market Composite Inde ....... 5 Nasdaq Composite Index ............... 6 Nikkei Stock Average .................... 7 NYSE Composite Index ................. 8 S&P 500 Composite Index ............. 9 Value Line Geometric Index .........10 Wilshire 5000 Index ......................11
Companies (Alphabetical)
1St Source Corporation .................12 3-D Sys Corp Del ..........................13 3M Company ................................14 Aaon Inc .......................................15 Aar Corporation ............................16 Aaron'S, Inc .................................17 Abbott Laboratories ......................18 Abiomed Inc .................................19 Abm Industries Incorporat .............20 Acadia Realty Trust ......................21 Acme United Corporation .............22 Activision Blizzard Incor ..............23 Adobe Systems Inc .......................24 Adtalem Global Ed Inc ..................25 Advanced Micro Devices In ..........26 Aegion Corp .................................27 Aegon N V Adr .............................28 Aerojet Rocketdyne Holdin ...........29 Aes Corp .......................................30 Aflac Inc .......................................31 Agco Corp ....................................32 Agilysys, Inc. ................................33 Agnico Eagle Mines Ltd ...............34 Air Products & Chemicals ............35 Alamo Group Inc ..........................36 Alaska Air Group Inc ....................37 Albany Intl Corp ...........................38 Alcoa Inc ......................................39 Alexander & Baldwin Holdi ..........40 Alkermes Plc.................................41 Alleghany Corp Del ......................42 Allegheny Technologies In............43 Allergan Plc ..................................44 Allete Incorporated .......................45 Alliancebernstein Holding .............46 Alliant Energy Corporatio .............47 Allstate Corp .................................48 Altria Group Inc ............................49 Amag Pharmaceuticals Inc ............50 Amarin Corp Plc ...........................51 Amcor Plc .....................................52 Ameren Corporation .....................53 American Electric Power C ...........54 American Express Co ....................55 American Financial Group ............56 American International Gr .............57 American National Insuran............58 American Natl Bankshares ...........59
American Software Inc ................. 60 American States Water Com ......... 61 American Superconductor C ......... 62 American Vanguard Corp ............. 63 American Woodmark Corpora ...... 64 Americas Car Mart Inc ................. 65 Ametek Inc. .................................. 66 Amgen Inc ................................... 67 Ampco-Pittsburgh Corp ................ 68 Amphenol Corp. ........................... 69 Analog Devices Inc ...................... 70 Anika Therapeutics Inc ................. 71 Anixter Intl Inc ............................. 72 Aon Corporation Plc ..................... 73 Apache Corp ................................ 74 Apogee Enterprises Inc ................. 75 Apple Inc ..................................... 76 Applied Industrial Techno ............ 77 Applied Materials Inc ................... 78 Aptargroup Inc ............................. 79 Aqua America Incorporated.......... 80 Arcbest Corp ................................ 81 Archer Daniels Midland Co .......... 82 Arconic Inc .................................. 83 Arrow Electronics Inc................... 84 Arrow Financial Corporati ............ 85 Ascena Retail Group Inc............... 86 Ashland Inc. ................................. 87 Associated Banc Corp .................. 88 Astec Inds Inc .............................. 89 Astrazeneca Plc ............................ 90 Astro-Med, Inc. ............................ 91 Astronics Corp ............................. 92 Asure Software Inc ....................... 93 At&T Inc ...................................... 94 Atmos Energy Corporation ........... 95 Atn Intl Inc ................................... 96 Autodesk Inc ................................ 97 Automatic Data Processing ........... 98 Autonation Inc.............................. 99 Autozone Inc .............................. 100 Avery Dennison Corp ................. 101 Avis Budget Group..................... 102 Avista Corporation ..................... 103 Avnet Inc ................................... 104 Avon Products Inc ...................... 105 Azz Inc ....................................... 106 Badger Meter Inc........................ 107 Baker Hughes Inc ....................... 108 Balchem Corp ............................ 109 Ball Corp .................................... 110 Bancfirst Corp ............................ 111 Banco Latinoamericano De ....... 112 Banco Santander Sa .................... 113 Bancorpsouth Inc ....................... 114 Bank Hawaii Corp ...................... 115 Bank Of America Corporati ........ 116 Bank Of New York Mellon C ..... 117 Barclays Plc ............................... 118 Barnes Group Inc ....................... 119 Barrick Gold Corp ...................... 120 Bassett Furniture Inds In............. 121 Baxter International Inc .............. 122 Bce Inc ....................................... 123 Becton Dickinson & Co .............. 124 Bed Bath & Beyond Inc.............. 125
Benchmark Electrs Inc ................ 126 Berkshire Hathaway Inc De ........ 127 Best Buy Inc ............................... 128 Bhp Billiton Ltd.......................... 129 Big Lots Inc ................................ 130 Bio Rad Labs Inc ........................ 131 Bio Techne Corp......................... 132 Black Hills Corporation .............. 133 Blackstone Mortgage Trust ......... 134 Block H & R Inc ......................... 135 Boeing Co .................................. 136 Borgwarner Inc ........................... 137 Boston Scientific Corp ................ 138 Boyd Gaming Corp ..................... 139 Bp Plc ......................................... 140 Brady Corp ................................. 141 Brandywine Realty Trust ............ 142 Briggs & Stratton Corp ............... 143 Brinker International Inc ............. 144 Brinks Co ................................... 145 Bristol Myers Squibb Co ............ 146 British American Tobacco ......... 147 Brookfield Asset Mgmt Inc ......... 148 Brown & Brown Inc ................... 149 Brown Forman Corp ................... 150 Brt Realty Trust .......................... 151 Brunswick Corp .......................... 152 Bryn Mawr Bk Corp ................... 153 Bt Group Plc ............................... 154 Buckle Inc .................................. 155 Cabot Corp ................................. 156 Cabot Oil & Gas Corp ................ 157 Caci International Inc ................. 158 Cadence Design System Inc ........ 159 Calamp Corp .............................. 160 Caleres, Inc. ................................ 161 California Water Service ............ 162 Callaway Golf Co ....................... 163 Callon Pete Co Del ..................... 164 Cambrex Corp ............................ 165 Camden Property Trust ............... 166 Campbell Soup Co ...................... 167 Canadian Pacific Railway .......... 168 Canon Inc ................................... 169 Cantel Medical Corp ................... 170 Capital Southwest Corp .............. 171 Capstead Mortgage Corp ............ 172 Cardinal Health Inc ..................... 173 Carlisle Cos Inc .......................... 174 Carnival Corp ............................. 175 Carpenter Technology Corp ........ 176 Casey'S General Stores, I ............ 177 Caterpillar Inc Del ...................... 178 Cathay Gen Bancorp ................... 179 Cato Corp. .................................. 180 Cbl & Associated Properti .......... 181 Ceco Environmental Corp ........... 182 Cedar Fair L P ............................ 183 Cedar Realty Trust, Inc. .............. 184 Celldex Therapeutics Inc. ........... 185 Centerpoint Energy Incorp .......... 186 Central Pac Finl Corp ................. 187 Centurytlink Inc .......................... 188 Cerner Corp ................................ 189 Cheesecake Factory Inc .............. 190 Chemed Corp.............................. 191
Chesapeake Utilities Corp ........... 192 Chevron Corp. ............................ 193 Chicos Fas Inc ............................ 194 Chubb Limited ............................ 195 Church & Dwight Inc .................. 196 Cigna Corp ................................. 197 Cincinnati Bell Inc. ..................... 198 Cincinnati Finl Corp ................... 199 Cintas Corp ................................. 200 Cirrus Logic Inc .......................... 201 Cisco Sys Inc .............................. 202 Citigroup Inc ............................... 203 City Hldg Co............................... 204 Clean Harbors Inc ....................... 205 Clearfield Inc .............................. 206 Cleveland-Cliffs Inc. ................... 207 Clorox Co Del ............................. 208 Cms Energy Corporation ............. 209 Cna Finl Corp ............................. 210 Cnb Finl Corp Pa ........................ 211 Cno Financial Group ................... 212 Coca Cola Co .............................. 213 Coca Cola European Partne ......... 214 Coca Cola Femsa S A B De ....... 215 Coca-Cola Consolidated Co ........ 216 Coeur Mng Inc ............................ 217 Cognex Corp ............................... 218 Coherent Inc ............................... 219 Cohu Inc ..................................... 220 Colgate Palmolive Co ................. 221 Columbia Bkg Sys Inc ................ 222 Comcast Corp 'A' ........................ 223 Comerica Inc .............................. 224 Commerce Bancshares Inc .......... 225 Commercial Metals Co ............... 226 Community Bank System Inc ...... 227 Community Tr Bancorp Inc ........ 228 Compania Cervecerias Unid ........ 229 Computer Task Group Inc ........... 230 Comstock Resources Inc ............. 231 Comtech Telecommunication ...... 232 Conagra Foods Inc ...................... 233 Conmed Corp .............................. 234 Connectone Bancorp Inc Ne ........ 235 Conocophillips ............................ 236 Consolidated Edison Incor .......... 237 Consolidated Tomoka Land ....... 238 Constellation Brands Inc ............. 239 Cooper Cos Inc ........................... 240 Cooper Tire & Rubber Co ........... 241 Corelogic Inc. ............................. 242 Corning Inc ................................. 243 Corporate Office Properti ............ 244 Costco Wholesale Corp .............. 245 Cott Corp Que ............................. 246 Cousins Properties Inc ................ 247 Covanta Hldg Corp ..................... 248 Cracker Barrel Old Ctry S ........... 249 Crane Co ..................................... 250 Crawford & Co ........................... 251 Crawford & Co ........................... 252 Credit Accep Corp Mich ............. 253 Cree Inc ...................................... 254 Crown Crafts Inc ......................... 255 Crown Holdings Inc .................... 256 Cryolife Inc ................................. 257 Css Inds Inc ................................ 258
Csx Corp .................................... 259 Cts Corp ..................................... 260 Cubic Corp ................................. 261 Cullen Frost Bankers Inc ............ 262 Culp Inc ..................................... 263 Cummins Inc .............................. 264 Curtiss Wright Corp ................... 265 Cvb Finl Corp ............................ 266 Cvs Health Corp ......................... 267 Cyberoptics Corp ....................... 268 Cypress Semiconductor Cor ....... 269 D R Horton Inc ........................... 270 Daily Journal Corp ..................... 271 Danaher Corp Del ...................... 272 Data I O Corp ............................. 273 Deere & Co ................................ 274 Delta Air Lines Inc Del .............. 275 Deluxe Corp ............................... 276 Dentsply Sirona .......................... 277 Destination Xl Group Inc ........... 278 Devon Energy Corp. ................... 279 Diebold Inc ................................ 280 Digi Intl Inc ................................ 281 Dillards Inc ................................ 282 Diodes Inc .................................. 283 Disney Walt Co .......................... 284 Dmc Global Inc .......................... 285 Dominion Resources, Incor ........ 286 Domtar Corp .............................. 287 Donaldson Inc. ........................... 288 Donnelley R R & Sons Co .......... 289 Dover Corp ................................ 290 Dte Energy Company ................. 291 Ducommun Inc Del .................... 292 Duke Energy Corporation ........... 293 Duke Realty Corp ....................... 294 Dupont De Nemours Inc. ............ 295 Dxc Technology Company ......... 296 Dycom Inds Inc .......................... 297 Dynex Cap Inc ........................... 298 Eastgroup Properties Inc ............. 299 Eaton Corp ................................. 300 Eaton Vance Corp ...................... 301 Ecolab Inc .................................. 302 Edison International ................... 303 El Paso Elec Co .......................... 304 Electronic Arts Inc ..................... 305 Emerson Electric Co................... 306 Enbridge Inc ............................... 307 Encompass Health Corp ............. 308 Encore Wire Corp ...................... 309 Ennis Inc .................................... 310 Entergy Corporation ................... 311 Enzo Biochem Inc ...................... 312 Eog Resources Inc ...................... 313 Eqt Corporation .......................... 314 Equifax Inc................................. 315 Equity Commonwealth Reit ....... 316 Equity Lifestyle Properti ............ 317 Ericsson ..................................... 318 Escalade Inc ............................... 319 Ethan Allen Interiors Inc ............ 320 Evergy........................................ 321 Eversource Energy ..................... 322 Exelon Corporation .................... 323 Expeditors International ............ 324

INDEX
Exponent Inc ............................... 325 Exxon Mobil Corp ...................... 326 Fair Isaac Corp ............................ 327 Farmer Bros Co ........................... 328 Fastenal Co ................................. 329 Federal Realty Investment ........... 330 Federal Signal Corp .................... 331 Fedex Corp ................................. 332 Ferro Corp .................................. 333 Fifth Third Bancorp .................... 334 First Bancorp N C ....................... 335 First Bancorp P R ........................ 336 First Comwlth Finl Corp P .......... 337 First Finl Bancorp Oh.................. 338 First Finl Corp Ind ...................... 339 First Horizon National Co ........... 340 First Merchants Corp .................. 341 First Midwest Bancorp Del ......... 342 Firstenergy Corporation .............. 343 Fiserv Inc .................................... 344 Flowers Foods Inc ....................... 345 Flowserve Corp ........................... 346 Fmc Corp .................................... 347 Fnb Corp Pa ................................ 348 Foot Locker Inc ........................... 349 Ford Motor Co Del...................... 350 Fox Corporation .......................... 351 Franklin Elec Inc ......................... 352 Franklin Res Inc .......................... 353 Freeport-Mcmoran Copper & ...... 354 Frontier Communications C ........ 355 Fuller H B Co ............................. 356 Fulton Finl Corp Pa ..................... 357 Gallagher Arthur J & Co ............. 358 Gap Inc Del ................................. 359 Gartner Inc .................................. 360 Gatx Corp ................................... 361 General Dynamics Corp .............. 362 General Electric Co ..................... 363 General Mills Inc ........................ 364 Genesco Inc ................................ 365 Gentex Corp ................................ 366 Genuine Parts Co ........................ 367 Getty Realty Corp. ...................... 368 Gilead Sciences Inc ..................... 369 Glacier Bancorp Inc. ................... 370 Glatfelter ..................................... 371 Glaxosmithkline Plc .................... 372 Globe Life Inc. ............................ 373 Goodyear Tire & Rubber Co ....... 374 Gorman Rupp Co ........................ 375 Gp Strategies Corp ...................... 376 Grace W R & Co. ........................ 377 Graco Inc .................................... 378 Grainger W W Inc ....................... 379 Gray Television Inc ..................... 380 Great Southn Bancorp Inc ........... 381 Greif Inc ..................................... 382 Griffon Corp ............................... 383 Halliburton Co ............................ 384 Harley Davidson Inc ................... 385 Harsco Corp ................................ 386 Hasbro Inc .................................. 387 Haverty Furniture Inc .................. 388
Hawaiian Electric Industr ........... 389 Healthcare Svcs Grp Inc ............. 390 Healthpeak Properties ................. 391 Heartland Express Inc................. 392 Hecla Mng Co ............................ 393 Heico Corp. ................................ 394 Helen Of Troy Corp Ltd ............. 395 Helmerich & Payne Inc .............. 396 Henry Jack & Assoc Inc ............. 397 Hershey Co ................................ 398 Hess Corp................................... 399 Hexcel Corp. .............................. 400 Hill Rom Hldgs Inc .................... 401 Hni Corp .................................... 402 Hollyfrontier Corp. ..................... 403 Home Depot Inc ......................... 404 Honda Motor Ltd........................ 405 Honeywell International I ........... 406 Hormel Foods Corp .................... 407 Host Hotels & Resorts Inc .......... 408 Hovnanian Enterprises Inc .......... 409 Hp, Inc. ...................................... 410 Hubbell Inc ................................ 411 Humana Inc ................................ 412 Hunt J B Trans Svcs Inc ............. 413 Huntington Bancshares Inc ......... 414 Icahn Enterprises Lp ................... 415 Icu Med Inc ................................ 416 Idacorp Incorporated .................. 417 Idex Corp ................................... 418 Ii Vi Inc ...................................... 419 Illinois Tool Wks Inc .................. 420 Immunomedics Inc ..................... 421 Imperial Oil Ltd ......................... 422 Independent Bank Corp Mas ...... 423 Independent Bank Corp Mic ....... 424 Ingersoll-Rand Plc ...................... 425 Insteel Industries Inc .................. 426 Intel Corp ................................... 427 Inter Parfums Inc ........................ 428 Interdigital Inc ............................ 429 Interface Inc ............................... 430 International Business Ma .......... 431 International Flavors&Fra .......... 432 International Paper Compa ......... 433 Interpublic Group Cos Inc .......... 434 Intricon Corp .............................. 435 Invacare Corp ............................. 436 Iteris Inc ..................................... 437 Itt Corp. ...................................... 438 J & J Snack Foods Corp ............. 439 Jack In The Box Inc.................... 440 Jacobs Engr Group Inc Del ......... 441 Jefferies Finl Group Inc .............. 442 Johnson & Johnson..................... 443 Johnson Controls Inc Plc ............ 444 Johnson Outdoors Inc ................. 445 Jpmorgan Chase & Co ................ 446 Kaman Corp ............................... 447 Kansas City Southern ................. 448 Kb Home .................................... 449 Kellogg Co ................................. 450 Kelly Svcs Inc ............................ 451 Kennametal Inc .......................... 452
Keycorp ...................................... 453 Kimball Intl Inc .......................... 454 Kimberly Clark Corp .................. 455 Kirby Corp ................................. 456 Kla Corp .................................... 457 Koninklijke Philips N V ............. 458 Kopin Corp ................................. 459 Kroger Co ................................... 460 Kulicke & Soffa Inds Inc ............ 461 L Brands Inc ............................... 462 L3 Harris Technologies, I ........... 463 La Z Boy Inc .............................. 464 Laboratory Corp Amer Hldg ....... 465 Lakeland Inds Inc ....................... 466 Lam Research Corp .................... 467 Lancaster Colony Corp ............... 468 Landstar Sys Inc ......................... 469 Lawson Prods Inc ....................... 470 Lci Inds ...................................... 471 Legg Mason Inc .......................... 472 Leggett & Platt Inc ..................... 473 Lennar Corp ............................... 474 Lilly Eli & Co ............................. 475 Lincoln Natl Corp Ind ................. 476 Lindsay Corporation ................... 477 Liveramp Holdings Inc. .............. 478 Lockheed Martin Corp ................ 479 Loews Corp ................................ 480 Louisiana Pac Corp ..................... 481 Lowes Cos Inc ............................ 482 Lsi Inds Inc ................................. 483 Lydall Inc Del............................. 484 M & T Bank Corporation ............ 485 M D C Hldgs Inc ........................ 486 Macys Inc ................................... 487 Magna Intl Inc ............................ 488 Manitowoc Co Inc ...................... 489 Marathon Oil Corp...................... 490 Marcus Corp ............................... 491 Markel Corp ............................... 492 Marriott International In ............. 493 Marsh & Mclennan Cos Inc ........ 494 Marten Trans Ltd ........................ 495 Masco Corp ................................ 496 Mastec Inc .................................. 497 Materion Corporation ................. 498 Mattel Inc ................................... 499 Maxim Integrated Prods In ......... 500 Mbia Inc ..................................... 501 Mcclatchy Co ............................. 502 Mccormick & Co Inc .................. 503 Mcdermott Intl Inc ...................... 504 Mcdonalds Corp ......................... 505 Mcgrath Rentcorp ....................... 506 Mckesson Corp ........................... 507 Mdu Resources Group Incor ....... 508 Medtronic Plc ............................. 509 Mercer Intl Inc ............................ 510 Merck & Co Inc .......................... 511 Mercury Genl Corp. .................... 512 Meredith Corp ............................ 513 Meridian Bioscience Inc ............. 514 Merit Med Sys Inc ...................... 515 Meritor Inc ................................. 516 Mesabi Tr ................................... 517 Methode Electrs Inc .................... 518 Mgm Resorts International.......... 519
Mgp Ingredients Inc New ............ 520 Micron Technology Inc ............... 521 Microsoft Corp ........................... 522 Middleby Corp ............................ 523 Middlesex Water Company ......... 524 Miller Herman Inc ...................... 525 Modine Mfg Co .......................... 526 Mohawk Inds Inc ........................ 527 Molson Coors Beverage Co......... 528 Monmouth Real Estate Inve ........ 529 Moodys Corp .............................. 530 Moog Inc .................................... 531 Mosaic Co New .......................... 532 Motorola Solutions Inc ................ 533 Msa Safety Inc ............................ 534 Mts Sys Corp .............................. 535 Murphy Oil Corp ........................ 536 Myers Inds Inc ............................ 537 Mylan N V .................................. 538 Nabors Industries Ltd .................. 539 National Fuel Gas Company ....... 540 National Retail Propertie ............. 541 Navistar Intl Corp ....................... 542 Nbt Bancorp Inc .......................... 543 Neogen Corp ............................... 544 New Jersey Resources Corp ........ 545 New York Times Co ................... 546 Newell Brands Inc ...................... 547 Newmont Goldcorp .................... 548 Newpark Res Inc ......................... 549 Nextera Energy Inc ..................... 550 Nike Inc ...................................... 551 Nisource Incorporated Hol .......... 552 Nl Inds Inc .................................. 553 Noble Corporation ...................... 554 Noble Energy Inc ........................ 555 Nokia Corp ................................. 556 Nordson Corp ............................. 557 Nordstrom Inc ............................. 558 Norfolk Southern Corp ................ 559 Northern Trust Corp .................... 560 Northrop Grumman Corp ............ 561 Northwest Nat Hldg Co ............... 562 Nortonlifelock Corp. ................... 563 Novo Nordisk As Vormals N ...... 564 Nucor Corp ................................. 565 Occidental Pete Corp .................. 566 Oceaneering Intl Inc .................... 567 Office Depot Inc ......................... 568 Ofg Bancorp ............................... 569 Oge Energy Corporation ............. 570 Old Natl Bancorp Ind .................. 571 Old Rep Intl Corp ....................... 572 Olin Corp .................................... 573 Omnicom Group Inc ................... 574 One Liberty Properties In ............ 575 Oneok Incorporated .................... 576 Onto Innovation .......................... 577 Oracle Corp ................................ 578 Orasure Technologies Inc ............ 579 Orthofix Med Inc ........................ 580 Oshkosh Corp ............................. 581 Otter Tail Corp ............................ 582 Owens & Minor Inc .................... 583 Owens Corning ........................... 584
Oxford Inds Inc .......................... 585 Paccar Inc .................................. 586 Panhandle Oil And Gas Inc ........ 587 Park Aerospace Corp .................. 588 Park Ohio Hldgs Corp ................ 589 Parker Hannifin Corp ................. 590 Patrick Inds Inc .......................... 591 Paychex Inc ................................ 592 Pdc Energy Inc ........................... 593 Pdl Biopharma Inc...................... 594 Penney J C Inc ........................... 595 Pennsylvania Real Estate ........... 596 Pentair Inc .................................. 597 Peoples United Financial ........... 598 Pepsico Inc ................................. 599 Perkinelmer Inc .......................... 600 Perrigo Co Plc ............................ 601 Pfizer Inc.................................... 602 Pg&E Corporation ...................... 603 Photronics Inc ............................ 604 Pier 1 Imports Inc ....................... 605 Pinnacle West Capital Cor .......... 606 Pitney Bowes Inc ....................... 607 Pldt Inc....................................... 608 Plexus Corp ................................ 609 Pnc Financial Services Gr........... 610 Pnm Resources Incorporate ........ 611 Polaris Inc .................................. 612 Polyone Corp ............................. 613 Popular Inc ................................. 614 Potlatchdeltic Corp. .................... 615 Powell Inds Inc .......................... 616 Ppg Inds Inc ............................... 617 Ppl Corporation .......................... 618 Price T Rowe Group Inc ............. 619 Procter & Gamble Co ................. 620 Progressive Corp Ohio ............... 621 Protective Ins Corp ..................... 622 Public Service Enterprise............ 623 Public Storage ............................ 624 Pulte Group Inc .......................... 625 Pvh Corp .................................... 626 Quaker Chem Corp .................... 627 Qualcomm Inc ............................ 628 Quanex Building Products ......... 629 Quidel Corp ............................... 630 Ramco-Gershenson Properti ....... 631 Raven Inds Inc ........................... 632 Raymond James Financial I ........ 633 Raytheon Co .............................. 634 Reading International Inc ........... 635 Regal Beloit Corp ....................... 636 Regions Financial Corp .............. 637 Regis Corp Minn ........................ 638 Renasant Corp ............................ 639 Repligen Corp ............................ 640 Rex American Resources Co ...... 641 Richardson Electrs Ltd ............... 642 Rite Aid Corp ............................. 643 Rli Corp ..................................... 644 Robert Half Intl Inc .................... 645 Rockwell Automation Inc ........... 646 Rocky Mtn Chocolate Facto ....... 647 Rogers Communications Inc ....... 648

INDEX
Rogers Corp ................................ 649 Rollins Inc .................................. 650 Roper Industries Inc. ................... 651 Ross Stores Inc ........................... 652 Royal Caribbean Cruises L .......... 653 Royal Dutch Shell Plc ................. 654 Royal Dutch Shell Plc ................. 655 Royal Gold Inc ............................ 656 Rpc Inc ....................................... 657 Rpm Intl Inc ................................ 658 Ryder System Incorporated ......... 659 Ryman Hospitality Pptys I .......... 660 S & T Bancorp Inc ...................... 661 S&P Global Inc ........................... 662 Safeguard Scientifics Inc ............. 663 Sallie Mae Corp .......................... 664 Sanderson Farms Inc ................... 665 Sanfilippo John B & Son I .......... 666 Sanmina Corp ............................. 667 Sap Se ......................................... 668 Sasol Ltd ..................................... 669 Schlumberger Ltd........................ 670 Scholastic Corp ........................... 671 Schwab Charles Corp .................. 672 Scientific Games Corp ................ 673 Scotts Miracle Gro Co ................. 674 Scripps E W Co Ohio .................. 675 Seacoast Bkg Corp Fla ................ 676 Sealed Air Corp .......................... 677 Sei Investments Co ..................... 678 Selective Ins Group Inc ............... 679 Sempra Energy............................ 680 Semtech Corp ............................. 681 Sensient Technologies Cor .......... 682 Service Corp Intl ......................... 683 Sherwin Williams Co .................. 684 Shoe Carnival Inc ........................ 685 Simmons 1St Natl Corp............... 686 Site Centers ................................. 687 Sjw Corporation .......................... 688 Skyline Corp ............................... 689 Skywest Inc ................................ 690 Skyworks Solutions Inc ............... 691 Smith A O Corp. ......................... 692 Smucker J M Co ......................... 693 Snap On Inc ................................ 694 Sonoco Prods Co ......................... 695 Sony Corp ................................... 696 South Jersey Industries, .............. 697 Southern Company...................... 698 Southwest Airlines Co................. 699 Southwest Gas Corporation ......... 700 Southwestern Energy Co ............. 701 Spartan Mtrs Inc.......................... 702 Spire Inc. .................................... 703 Sprint Corporation ..................... 704 Spx Corp ..................................... 705 Staar Surgical Co ........................ 706 Standard Mtr Prods Inc ............... 707 Standex Intl Corp ........................ 708 Stanley Black & Decker, ........... 709 State Street Corp ......................... 710 Stepan Co ................................... 711 Stewart Information Svcs ........... 712 Stifel Finl Corp ........................... 713 Stryker Corp ............................... 714
Sturm Ruger & Co Inc ................ 715 Sunopta Inc ................................ 716 Suntrust Banks Inc ..................... 717 Superior Grp Of Companies ....... 718 Superior Inds Intl Inc .................. 719 Svb Financial Group ................... 720 Synopsys Inc .............................. 721 Synovus Financial Corp.............. 722 Sysco Corp ................................. 723 Tailored Brands Inc .................... 724 Target Corp ................................ 725 Tcf Financial Corp.(New) ........... 726 Team Inc .................................... 727 Tech Data Corp .......................... 728 Tegna, Inc. ................................. 729 Teleflex Inc ................................ 730 Telefonica S A ........................... 731 Telephone & Data Sys Inc .......... 732 Tenet Healthcare Corp ................ 733 Tennant Co ................................. 734 Tenneco Inc ................................ 735 Teradyne Inc .............................. 736 Terex Corporation ...................... 737 Tetra Tech Inc. ........................... 738 Teva Pharmaceutical Inds .......... 739 Texas Instruments Inc................. 740 Textron Inc ................................. 741 Thermo Fisher Scientific ........... 742 Thor Industries Inc ..................... 743 Tiffany & Co .............................. 744 Timken Co ................................. 745 Tivity Health Inc ........................ 746 Tjx Cos Inc................................. 747 Toll Brothers Inc ........................ 748 Tompkins Financial Corpor ........ 749 Toro Co ...................................... 750 Toyota Motor Corp..................... 751 Transcanada Corp ....................... 752 Travelers Companies Inc ............ 753 Trinity Industries Inc .................. 754 Truist Financial Corp. ................. 755 Trustco Bk Corp N Y ................. 756 Trustmark Corp .......................... 757 Tsr Inc ........................................ 758 Tutor Perini Corp ....................... 759 Twin Disc Inc ............................. 760 Tyler Technologies Inc ............... 761 Tyson Foods Inc ......................... 762 Udr Inc ....................................... 763 Ugi Corporation ......................... 764 Umb Financial Corp ................... 765 Umh Pptys Inc ............................ 766 Unifi Inc ..................................... 767 Unifirst Corp Mass ..................... 768 Unilever N V .............................. 769 Unilever Plc ............................... 770 Union Pacific Corporation .......... 771 Unisys Corp ............................... 772 Unit Corp ................................... 773 United Airlines Holdings, ........... 774 United Bankshares Inc Wes ........ 775 United Fire Group Inc ................ 776 United States Cellular Co ........... 777 United States Steel Corp ............. 778 United Technologies Corp .......... 779
Unitedhealth Group Inc .............. 780 Unitil Corporation ...................... 781 Universal Health Svcs Inc ........... 782 Unum Group ............................... 783 Us Bancorp ................................. 784 Us Ecology Inc ........................... 785 Usa Truck Inc ............................. 786 V F Corp .................................... 787 Valaris Plc .................................. 788 Valero Energy Corp .................... 789 Valhi Inc ..................................... 790 Valley National Bancorp............. 791 Valmont Inds Inc ........................ 792 Varian Medical Systems In ......... 793 Vector Group Ltd ....................... 794 Ventas Inc .................................. 795 Verizon Communications In ....... 796 Viacom Inc. ................................ 797 Viad Corp ................................... 798 Virco Mfg Co ............................. 799 Vishay Intertechnology In ........... 800 Vodafone Group Plc ................... 801 Vornado Realty Trust ................. 802 Voxx Intl Corp ........................... 803 Vulcan Materials Co ................... 804 W R Berkley Corporation ........... 805 Wal-Mart Stores Inc ................... 806 Walgreen Boots Alliance I .......... 807 Washington Fed Inc .................... 808 Washington Real Estate In .......... 809 Washington Tr Bancorp .............. 810 Waste Management Inc .............. 811 Watsco Inc .................................. 812 Watts Water Technologies ......... 813 Wd-40 Co ................................... 814 Webster Finl Corp Conn ............. 815 Wec Energy Group, Inc. ............. 816 Weingarten Realty Investm ......... 817 Wells Fargo & Co ....................... 818 Welltower Inc. ............................ 819 Wendys Co ................................. 820 Werner Enterprises Inc ............... 821 Wesbanco Inc ............................. 822 West Pharmaceutical Svsc ......... 823 Westamerica Bancorporatio ........ 824 Western Digital Corp .................. 825 Westrock Co ............................... 826 Weyerhaeuser Co........................ 827 Whirlpool Corp........................... 828 White Mountains Insurance ........ 829 Wiley John & Sons Inc ............... 830 Williams Cos Inc ........................ 831 Williams Sonoma Inc ................. 832 Winnebago Inds Inc .................... 833 Wolverine World Wide Inc ......... 834 Woodward Inc ............................ 835 World Fuel Svcs Corp ................ 836 Worthington Inds Inc .................. 837 Wpp Plc ..................................... 838 Wsfs Finl Corp ........................... 839 Xcel Energy Incorporated ........... 840 Xerox Holdings Corp .................. 841 Xilinx Inc ................................... 842 Xoma Corp Del .......................... 843
Zebra Technologies Corp ............ 844 Zions Bancorporation .................. 845 Zix Corp ..................................... 846

D OW JON ES IN D U STR IAL AVER AG E (D JIA)
Copyright 2019 Securities Research Company
'85 '86 '87 '88 '89 '90 '91 '92 '93 '94 '95 '96 '97 '98 '99 '00 '01 '02 '03 '04 '05 '06 '07 '08 '09 '10 '11 '12 '13 '14 '15 '16 '17 '18 '19 '20
180
200
220
240 260 280 300
340
380
420
460
500
600
700
800
900
1000
1100
1200 1300 1400 1500
1700
1900
2200
2400 2600 2800 3000
3400
3800
4200
4600
5000
5500
6000
6500 7000 7500
8500
9500
10500
11500
13000 14000 15000
17000
19000
21000
23000
25000 27000 29000
32000
35000
38000 41000
12
14
16
18
20
25
30
35
40
45
50
60
70
80
90
100
110
120
130140150
170
190
210
230
250270290
320
360
400
440
480
550
600
650700
800
900
1000
1100
1200
130014001500
1700
1900
2100
2300
250027002900
1 12 23 34 45 5B
Ind P/ E N / AN YSE Bond $.0 M ils.Com .000 M ils.Book value .00P/ E 18.75Country U S
G rowth Performance M easurementYears Price Earn. D iv. Total Ret.Last 1 15.3 5.5 .1 15.9Last 5 10.9 7.3 7.2 12.5
Last 10 11.1 10.7 7.8 12.5Last 25 8.4 7.7 7.0 9.3
An index of 30 "blue chip" stocks of U .S. "Industrial" companies
LEG EN DRead from Right Scale:PriceRelative Strength
Bottom Band VolumeM oving Avg (48 months)Recession (G rey Shaded Bars)
Read from Left Scale:EarningsD ividends
Charts are updated daily at www.SrcStockCharts.com.
1

D OW JON ES TR AN SPOR TATION AVER AG E (D JTA)
Copyright 2019 Securities Research Company
'85 '86 '87 '88 '89 '90 '91 '92 '93 '94 '95 '96 '97 '98 '99 '00 '01 '02 '03 '04 '05 '06 '07 '08 '09 '10 '11 '12 '13 '14 '15 '16 '17 '18 '19 '20
75
85
95
110
120
130 140 150
170
190
220
240 260 280 300
340
380
420
460
500
600
700
800
900
1000
1100
1200
1300 1400 1500
1700
1900
2200
2400 2600 2800 3000
3400
3800
4200
4600
5000
5500
6000
6500 7000 7500
8500
9500
10500
11500
13000 14000 15000
17000
5.0
5.5
6.06.57.07.5
8.5
9.5
12
14
16
18
20
25
30
35
40
45
50
60
70
80
90
100
110
120
130140150
170
190
210
230
250270290
320
360
400
440
480
550
600650700
800
900
1000
1100
400 400800 800
1200 12001600 16002000 2000M
AlsoPaid
$39.75
Earnings & D ividendsdata from Barron's
1/ 06/ 2020
Ind P/ E N / AN YSE Bond $.0 M ils.Com .000 M ils.Book value .00P/ E 18.84Country U S
G rowth Performance M easurementYears Price Earn. D iv. Total Ret.Last 1 9.1 -5.7 9.6 10.8Last 5 4.9 4.5 11.6 6.2
Last 10 10.9 24.4 9.9 12.0Last 25 8.3 10.3 8.7 8.9
E An index of 20 "blue chip" stocks of U .S. "Transportation" companies
LEG EN DRead from Right Scale:PriceRelative Strength
Bottom Band VolumeM oving Avg (48 months)Recession (G rey Shaded Bars)
Read from Left Scale:EarningsD ividends
Charts are updated daily at www.SrcStockCharts.com.
2

D OW JON ES U TILITY AVER AG E (D JU A)
Copyright 2019 Securities Research Company
'85 '86 '87 '88 '89 '90 '91 '92 '93 '94 '95 '96 '97 '98 '99 '00 '01 '02 '03 '04 '05 '06 '07 '08 '09 '10 '11 '12 '13 '14 '15 '16 '17 '18 '19 '20
11
12 13 14 15
17
19
22
24 26 28 30
34
38
42
46
50
55
60 65 70 75
85
95
110
120 130 140 150
170
190
220
240 260 280 300
340
380
420
460
500
600
700
800
900
1000
1100
1200 1300 1400 1500
1700
1900
2200
2400 2600
.80
.90
1.0
1.5
2.0
2.5
3.0
3.5
4.0
4.5
5.0
5.5
6.0
6.57.07.5
8.5
9.5
12
14
16
18
20
25
30
35
40
45
50
60
70
80
90
100
110
120130140150
170
200 200400 400600 600800 800
1000 1000M
Earnings & D ividendsdata from Barron's
1/ 06/ 2020
Ind P/ E N / AN YSE Bond $.0 M ils.Com .000 M ils.Book value .00P/ E 24.71Country U S
G rowth Performance M easurementYears Price Earn. D iv. Total Ret.Last 1 20.2 -3.4 6.1 23.7Last 5 6.5 1.2 5.4 9.2
Last 10 8.7 2.3 5.1 11.1Last 25 6.2 3.5 2.8 7.8
An index of 15 "blue chip" stocks of U .S. "U tility" companies
LEG EN DRead from Right Scale:PriceRelative Strength
Bottom Band VolumeM oving Avg (48 months)Recession (G rey Shaded Bars)
Read from Left Scale:EarningsD ividends
Charts are updated daily at www.SrcStockCharts.com.
3

D OW JON ES C OM POSITE 65 (D JA)
Copyright 2019 Securities Research Company
'85 '86 '87 '88 '89 '90 '91 '92 '93 '94 '95 '96 '97 '98 '99 '00 '01 '02 '03 '04 '05 '06 '07 '08 '09 '10 '11 '12 '13 '14 '15 '16 '17 '18 '19 '20
60 65 70 75
85
95
110
120 130 140 150
170
190
220
240 260 280 300
340
380
420
460
500
600
700
800
900
1000
1100
1200 1300 1400 1500
1700
1900
2200
2400 2600 2800 3000
3400
3800
4200
4600
5000
5500
6000 6500 7000 7500
8500
9500
10500
11500
13000 14000
4.0
4.5
5.0
5.5
6.06.57.07.5
8.5
9.5
12
14
16
18
20
25
30
35
40
45
50
60
70
80
90
100
110
120130140150
170
190
210
230
250270290
320
360
400
440
480
550
600650700
800
900
12 1224 2436 3648 4860 60B
Ind P/ E N / A Bonds $.0 M ils.Com .000 M ils.Book value .00P/ E N / ACountry U S
G rowth Performance M easurementYears Price Earn. D iv. Total Ret.Last 1 14.5 .0 .0 14.5Last 5 8.5 - .8 2.4 9.0
Last 10 10.7 8.1 4.6 11.6Last 25 8.3 -- - - - - 8.8
30 Industrials + 20 Transportation + 15 U tility Stocks
LEG EN DRead from Right Scale:PriceRelative Strength
Bottom Band VolumeM oving Avg (48 months)Recession (G rey Shaded Bars)
Read from Left Scale:EarningsD ividends
Charts are updated daily at www.SrcStockCharts.com.
4

N YSE M AR KET C OM POSITE IN D EX (XAX)
Copyright 2019 Securities Research Company
'85 '86 '87 '88 '89 '90 '91 '92 '93 '94 '95 '96 '97 '98 '99 '00 '01 '02 '03 '04 '05 '06 '07 '08 '09 '10 '11 '12 '13 '14 '15 '16 '17 '18 '19 '20
22
24 26 28 30
34
38
42
46
50
55
60 65 70 75
85
95
110
120 130 140 150
170
190
220
240 260 280 300
340
380
420
460
500
600
700
800
900
1000
1100
1200 1300 1400 1500
1700
1900
2200
2400 2600 2800 3000
3400
3800
4200
4600
5000
1.5
2.0
2.5
3.0
3.5
4.0
4.5
5.0
5.5
6.0
6.57.07.5
8.5
9.5
12
14
16
18
20
25
30
35
40
45
50
60
70
80
90
100
110
120
130140150
170
190
210
230
250270290
320
300 300600 600900 900
1200 12001500 1500M
Ind P/ E N / AAM EX Bond $.0 M ils.Com .000 M ils.Book value .00P/ E N / ACountry U S
G rowth Performance M easurementYears Price Earn. D iv. Total Ret.Last 1 1.9 -- - - - - 1.9Last 5 1.2 -- - - - - 1.2
Last 10 3.7 -- - - - - 3.7Last 25 7.4 -- - - - - 7.4
AM EX Index reflects the aggregate market value of all its components
LEG EN DRead from Right Scale:PriceRelative Strength
Bottom Band VolumeM oving Avg (48 months)Recession (G rey Shaded Bars)
Read from Left Scale:EarningsD ividends
Charts are updated daily at www.SrcStockCharts.com.
5

N ASD AQ C OM POSITE IN D EX (C OM PQ)
Copyright 2019 Securities Research Company
'85 '86 '87 '88 '89 '90 '91 '92 '93 '94 '95 '96 '97 '98 '99 '00 '01 '02 '03 '04 '05 '06 '07 '08 '09 '10 '11 '12 '13 '14 '15 '16 '17 '18 '19 '20
55
60 65 70 75
85
95
110
120 130 140 150
170
190
220
240
260 280 300
340
380
420
460
500
600
700
800
900
1000
1100
1200 1300 1400 1500
1700
1900
2200
2400
2600 2800 3000
3400
3800
4200
4600
5000
5500
6000 6500 7000 7500
8500
9500
10500
11500
13000
4.0
4.5
5.0
5.5
6.06.57.07.5
8.5
9.5
12
14
16
18
20
25
30
35
40
45
50
60
70
80
90
100
110
120130140150
170
190
210
230
250270290
320
360
400
440
480
550
600650700
800
12 1224 2436 3648 4860 60B
Ind P/ E N / AN asdaq Bond $.0 M ils.Com .000 M ils.Book value 577.08P/ E N / ACountry U S
G rowth Performance M easurementYears Price Earn. D iv. Total Ret.Last 1 26.1 .0 .0 26.1Last 5 14.6 .8 -2.9 14.7
Last 10 15.6 8.0 8.5 15.9Last 25 10.5 11.4 -- - 10.7
Broad-based market capitalization weighted methodology index
LEG EN DRead from Right Scale:PriceRelative Strength
Bottom Band VolumeM oving Avg (48 months)Recession (G rey Shaded Bars)
Read from Left Scale:EarningsD ividends
Charts are updated daily at www.SrcStockCharts.com.
6

N IKKEI STOC K AVER AG E (N 225)
Copyright 2019 Securities Research Company
'85 '86 '87 '88 '89 '90 '91 '92 '93 '94 '95 '96 '97 '98 '99 '00 '01 '02 '03 '04 '05 '06 '07 '08 '09 '10 '11 '12 '13 '14 '15 '16 '17 '18 '19 '20
1100
1200 1300 1400 1500
1700
1900
2200
2400 2600 2800 3000
3400
3800
4200
4600
5000
5500
6000 6500 7000 7500
8500
9500
10500
11500
13000 14000 15000
17000
19000
21000
23000
25000 27000 29000
32000
35000
38000 41000 44000
48000
52000 56000 60000 65000 70000 75000 81000 87000 94000 101000 108000 116000 125000 135000 145000
160000
175000
190000
210000
230000
250000
80
90
100
110
120130140150
170
190
210
230
250270290
320
360
400
440
480
550
600
650700
800
900
1000
1100
1200130014001500
1700
1900
2100
2300
250027002900
3200
3500
380041004400
4800520056006000
650070007500810087009400
102001100011800
12800138001480016000
17500
20 2040 4060 6080 80
100 100B
Ind P/ E N / AN YSE Bond $.0 M ils.Com .000 M ils.Book value .00P/ E N / ACountry Japan
G rowth Performance M easurementYears Price Earn. D iv. Total Ret.Last 1 14.8 -- - - - - 14.8Last 5 6.2 -- - - - - 6.2
Last 10 8.9 -- - - - - 8.9Last 25 1.0 -- - - - - 1.0
Price-weighted index comprised of Japan's top 225 blue-chip companies
LEG EN DRead from Right Scale:PriceRelative Strength
Bottom Band VolumeM oving Avg (48 months)Recession (G rey Shaded Bars)
Read from Left Scale:EarningsD ividends
Charts are updated daily at www.SrcStockCharts.com.
7

N YSE C OM POSITE IN D EX (N YSI)
Copyright 2019 Securities Research Company
'85 '86 '87 '88 '89 '90 '91 '92 '93 '94 '95 '96 '97 '98 '99 '00 '01 '02 '03 '04 '05 '06 '07 '08 '09 '10 '11 '12 '13 '14 '15 '16 '17 '18 '19 '20
85
95
110
120 130 140 150
170
190
220
240
260 280 300
340
380
420
460
500
600
700
800
900
1000
1100
1200 1300 1400 1500
1700
1900
2200
2400
2600 2800 3000
3400
3800
4200
4600
5000
5500
6000 6500 7000 7500
8500
9500
10500
11500
13000 14000 15000
17000
19000
21000
6.06.57.07.5
8.5
9.5
12
14
16
18
20
25
30
35
40
45
50
60
70
80
90
100
110
120
130140150
170
190
210
230
250270290
320
360
400
440
480
550
600650700
800
900
1000
1100
1200
13001400
6 612 1218 1824 2430 30B
Ind P/ E N / AN YSE Bond $.0 M ils.Com .000 M ils.Book value .00P/ E N / ACountry U S
G rowth Performance M easurementYears Price Earn. D iv. Total Ret.Last 1 13.5 -- - - - - 13.5Last 5 5.8 -- - - - - 5.8
Last 10 7.3 -- - - - - 7.3Last 25 6.8 -- - - - - 6.8
A measure of the changes in aggregate market value of N YSE stocks
LEG EN DRead from Right Scale:PriceRelative Strength
Bottom Band VolumeM oving Avg (48 months)Recession (G rey Shaded Bars)
Read from Left Scale:EarningsD ividends
Charts are updated daily at www.SrcStockCharts.com.
8

S&P 500 C OM POSITE IN D EX (SPX)
Copyright 2019 Securities Research Company
'85 '86 '87 '88 '89 '90 '91 '92 '93 '94 '95 '96 '97 '98 '99 '00 '01 '02 '03 '04 '05 '06 '07 '08 '09 '10 '11 '12 '13 '14 '15 '16 '17 '18 '19 '20
20
22
24 26 28 30
34
38
42
46
50
55
60
65 70 75
85
95
110
120
130 140 150
170
190
220
240 260 280 300
340
380
420
460
500
600
700
800
900
1000
1100
1200
1300 1400 1500
1700
1900
2200
2400 2600 2800 3000
3400
3800
4200
4600
1.5
2.0
2.5
3.0
3.5
4.0
4.5
5.0
5.5
6.06.57.07.5
8.5
9.5
12
14
16
18
20
25
30
35
40
45
50
60
70
80
90
100
110
120
130140150
170
190
210
230
250270290
320
40 4080 80
120 120160 160200 200B
9/ 30 & 12/ 31 earningsestimates
as of 12/ 19
Ind P/ E N / AN YSE Bond $.0 M ils.Com .000 M ils.Book value 478.95P/ E 20.63Country U S
G rowth Performance M easurementYears Price Earn. D iv. Total Ret.Last 1 20.8 4.4 4.3 22.3Last 5 10.4 7.0 7.2 11.9
Last 10 11.8 10.8 10.1 13.0Last 25 8.1 6.6 6.1 8.9
D A capitalization-weighted index of 500 stocks from major industries
LEG EN DRead from Right Scale:PriceRelative Strength
Bottom Band VolumeM oving Avg (48 months)Recession (G rey Shaded Bars)
Read from Left Scale:EarningsD ividends
Charts are updated daily at www.SrcStockCharts.com.
9

VALU E LIN E G EOM ETR IC IN D EX (VALU Z)
Copyright 2019 Securities Research Company
'85 '86 '87 '88 '89 '90 '91 '92 '93 '94 '95 '96 '97 '98 '99 '00 '01 '02 '03 '04 '05 '06 '07 '08 '09 '10 '11 '12 '13 '14 '15 '16 '17 '18 '19 '20
22
24 26 28 30
34
38
42
46
50
55
60 65 70 75
85
95
110
120 130 140 150
170
190
220
240 260 280 300
340
380
420
460
500
600
700
800
900
1000
1100
1200 1300 1400 1500
1700
1900
2200
2400 2600 2800 3000
3400
3800
4200
4600
5000
1.5
2.0
2.5
3.0
3.5
4.0
4.5
5.0
5.5
6.0
6.57.07.5
8.5
9.5
12
14
16
18
20
25
30
35
40
45
50
60
70
80
90
100
110
120
130140150
170
190
210
230
250270290
320
1 12 23 34 45 5T
Ind P/ E N / AN YSE Bond $.0 M ils.Com .000 M ils.Book value .00P/ E N / ACountry U S
G rowth Performance M easurementYears Price Earn. D iv. Total Ret.Last 1 5.1 -- - - - - 5.1Last 5 2.5 -- - - - - 2.5
Last 10 6.3 -- - - - - 6.3Last 25 2.8 -- - - - - 2.8
An equally weighted price index of all stocks covered in its survey
LEG EN DRead from Right Scale:PriceRelative Strength
Bottom Band VolumeM oving Avg (48 months)Recession (G rey Shaded Bars)
Read from Left Scale:EarningsD ividends
Charts are updated daily at www.SrcStockCharts.com.
10

WILSH IR E 5000 IN D EX (W5000)
Copyright 2019 Securities Research Company
'85 '86 '87 '88 '89 '90 '91 '92 '93 '94 '95 '96 '97 '98 '99 '00 '01 '02 '03 '04 '05 '06 '07 '08 '09 '10 '11 '12 '13 '14 '15 '16 '17 '18 '19 '20
220
240
260 280 300
340
380
420
460
500
600
700
800
900
1000
1100
1200
1300 1400 1500
1700
1900
2200
2400
2600 2800 3000
3400
3800
4200
4600
5000
5500
6000 6500 7000 7500
8500
9500
10500
11500
13000 14000 15000
17000
19000
21000
23000
25000 27000 29000 31000
34000
37000 40000 43000 46000
50000
14
16
18
20
25
30
35
40
45
50
60
70
80
90
100
110
120130140150
170
190
210
230
250270290
320
360
400
440
480
550
600650700
800
900
1000
1100
1200130014001500
1700
1900
2100
2300
2500270029003100
1 12 23 34 45 5T
Ind P/ E N / AN YSE Bond $.0 M ils.Com .000 M ils.Book value .00P/ E N / ACountry U S
G rowth Performance M easurementYears Price Earn. D iv. Total Ret.Last 1 19.1 -- - - - - 19.1Last 5 9.6 -- - - - - 9.6
Last 10 11.6 -- - - - - 11.6Last 25 8.2 -- - - - - 8.2
M arket cap weighted, broad-based index of actively traded U .S. stocks
LEG EN DRead from Right Scale:PriceRelative Strength
Bottom Band VolumeM oving Avg (48 months)Recession (G rey Shaded Bars)
Read from Left Scale:EarningsD ividends
Charts are updated daily at www.SrcStockCharts.com.
11

1ST SOU R C E C OR P OR ATION (SR C E)
Copyright 2019 Securities Research Company
'85 '86 '87 '88 '89 '90 '91 '92 '93 '94 '95 '96 '97 '98 '99 '00 '01 '02 '03 '04 '05 '06 '07 '08 '09 '10 '11 '12 '13 '14 '15 '16 '17 '18 '19 '20
1/ 2
3/ 4
1
1 1/ 4
1 1/ 2
1 3/ 4
2
2 1/ 4
2 1/ 2
2 3/ 4
3 3 1/ 43 1/ 23 3/ 4
4 1/ 2
5
5 1/ 2
6 6 1/ 27 7 1/ 2
8 1/ 2
9 1/ 2
11
12 13 14 15
17
19
22
24 26 28 30
34
38
42
46
50
55
60 65 70 75
85
.03
.04
.05
.06
.07
.08
.09
.10
.20
.25
.30
.35
.40
.45
.50
.60
.70
.80
.90
1.0
1.5
2.0
2.5
3.0
3.5
4.0
4.5
5.0
5.5
600 6001200 12001800 18002400 24003000 3000T
Adj. for10% SD2/ 4/ 85
Adj. for10% SD2/ 2/ 90
Adj. for5% SD2/ 4/ 91
Adj. for5 for 4
2/ 19/ 92
Adj. for3 for 22/ 16/ 93
Adj. for5% SD1/ 31/ 94
Adj. for5% SD1/ 31/ 95
Adj. for3 for 28/ 21/ 95
Adj. for5% SD2/ 1/ 96
Adj. for5 for 42/ 18/ 97
Adj. for10% SD2/ 3/ 98
Adj. for10% SD2/ 2/ 99
Adj. for5% SD8/ 2/ 00
Adj. for5% SD5/ 2/ 01
Adj. for10% SD8/ 3/ 06
Adj. for10% SD8/ 3/ 15
M arco Capital Corp.acquired 12/ 2/ 85
Ind RBAN K P/ E N / AN asdaq Bond$102.8 M ils.Com 25.965 M ils.Book value 26.00P/ E 14.22Country U S
G rowth Performance M easurementYears Price Earn. D iv. Total Ret.Last 1 10.9 12.4 16.0 13.3Last 5 13.3 10.3 12.1 15.1
Last 10 13.8 17.3 7.1 15.3Last 25 7.4 6.6 9.1 8.4
E Consumer and commercial banking services
LEG EN DRead from Right Scale:PriceRelative Strength
Bottom Band VolumeM oving Avg (48 months)Recession (G rey Shaded Bars)
Read from Left Scale:EarningsD ividends
Charts are updated daily at www.SrcStockCharts.com.
12

3- D SYS C OR P D EL (D D D )
Copyright 2019 Securities Research Company
'85 '86 '87 '88 '89 '90 '91 '92 '93 '94 '95 '96 '97 '98 '99 '00 '01 '02 '03 '04 '05 '06 '07 '08 '09 '10 '11 '12 '13 '14 '15 '16 '17 '18 '19 '20
3/ 4
1
1 1/ 4
1 1/ 2
1 3/ 4
2
2 1/ 4
2 1/ 2
2 3/ 4
3
3 1/ 43 1/ 23 3/ 4
4 1/ 2
5
5 1/ 2
6
6 1/ 27 7 1/ 2
8 1/ 2
9 1/ 2
11
12 13 14 15
17
19
22
24 26 28 30
34
38
42
46
50
55
60
65 70 75
85
95
110
120 130 140
.04
.05
.06
.07
.08
.09
.10
.20
.25
.30
.35
.40
.45
.50
.60
.70
.80
.90
1.0
1.5
2.0
2.5
3.0
3.5
4.0
4.5
5.0
5.5
6.0
6.57.07.5
8.5
9.5
30 3060 6090 90
120 120150 150M
0.02 (0.01)
(0.13)
(0.13)
(0.11)
(0.03)
(0.01)
(0.14)
(0.18)
(0.16)
0.03 (0.04)
(0.12)
(0.21)
(0.31)
(0.27)
(0.37)
(0.33)
(0.38)
(0.48)
(0.37)
(0.34)
(0.18)
0.03 (0.11)
(0.33)
(0.52)
(0.52)
(0.43)
(0.22)
(0.10)
(0.12)
(0.08)
(0.10)
(0.11)
(0.08)
(0.02)
0.00
0.02
0.00
0.03
(0.03)
Adj. for1 for 35/ 24/ 95
Adj. for2 for 15/ 19/ 11
Adj. for3 for 22/ 25/ 13
Ind TH STP P/ E N / AN YSE Bond $24.2 M ils.Com 114.030 M ils.Book value 6.36P/ E N / ACountry U S
G rowth Performance M easurementYears Price Earn. D iv. Total Ret.Last 1 -21.7 -- - - - - -21.7Last 5 -19.2 -- - - - - -19.2
Last 10 11.1 -- - - - - 11.1Last 25 -- - - - - - - - - - -
Creates 3-D prototypes using CAD / CAM software
LEG EN DRead from Right Scale:PriceRelative Strength
Bottom Band VolumeM oving Avg (48 months)Recession (G rey Shaded Bars)
Read from Left Scale:EarningsD ividends
Charts are updated daily at www.SrcStockCharts.com.
13

3M C OM PAN Y (M M M )
Copyright 2019 Securities Research Company
'85 '86 '87 '88 '89 '90 '91 '92 '93 '94 '95 '96 '97 '98 '99 '00 '01 '02 '03 '04 '05 '06 '07 '08 '09 '10 '11 '12 '13 '14 '15 '16 '17 '18 '19 '20
1 3/ 4
2
2 1/ 4
2 1/ 2
2 3/ 4
3
3 1/ 43 1/ 23 3/ 4
4 1/ 2
5
5 1/ 2
6 6 1/ 27 7 1/ 2
8 1/ 2
9 1/ 2
11
12 13 14 15
17
19
22
24 26 28 30
34
38
42
46
50
55
60 65 70 75
85
95
110
120 130 140 150
170
190
220
240 260 280 300
340
380
.20
.25
.30
.35
.40
.45
.50
.60
.70
.80
.90
1.0
1.5
2.0
2.5
3.0
3.5
4.0
4.5
5.0
5.5
6.06.57.07.5
8.5
9.5
12
14
16
18
20
25
50 50100 100150 150200 200250 250M
D ist. 1 sh. Imation Corp.for ea. 20 shs. M M M
7/ 15/ 96
M icroTouch Sysacquired 2/ 12/ 01
M innesota M ining & M fg.prior to 4/ 8/ 02
Cuno Inc.acquired 8/ 2/ 05
Cogent Inc.Acquired12/ 2/ 10
Ceradyne, Inc.acquired 11/ 28/ 12
Ind CON G L P/ E N / AN YSE Bond$111.2 M ils.Com 586.613 M ils.Book value 17.26P/ E 19.36Country U S
G rowth Performance M easurementYears Price Earn. D iv. Total Ret.Last 1 -9.9 -6.6 5.9 -7.0Last 5 2.1 4.5 11.0 4.8
Last 10 8.4 7.1 10.9 10.5Last 25 8.0 7.3 7.8 9.2
D Industrial, consumer, life sciences products
LEG EN DRead from Right Scale:PriceRelative Strength
Bottom Band VolumeM oving Avg (48 months)Recession (G rey Shaded Bars)
Read from Left Scale:EarningsD ividends
Charts are updated daily at www.SrcStockCharts.com.
14

AAON IN C (AAON )
Copyright 2019 Securities Research Company
'85 '86 '87 '88 '89 '90 '91 '92 '93 '94 '95 '96 '97 '98 '99 '00 '01 '02 '03 '04 '05 '06 '07 '08 '09 '10 '11 '12 '13 '14 '15 '16 '17 '18 '19 '20
1/ 4
1/ 2
3/ 4
1
1 1/ 4
1 1/ 2
1 3/ 4
2
2 1/ 42 1/ 22 3/ 4
3 1/ 4
3 3/ 4
4 1/ 25
6
7
8
9 10 11
13
15
17 19
22
26
30
34 38 42
48
55
65
75
.005
.01
.02
.03
.04
.05
.06
.07
.08
.09
.10
.20
.25
.30
.35
.40
.45
.50
.60
.70
.80
.901.0
1.5
2.0
2.5
3.0
3.5
4.0
4.55.0
8 816 1624 2432 3240 40M
Adj. for10% SD3/ 7/ 95
Adj. for3 for 210/ 1/ 01
Adj. for3 for 26/ 5/ 02
Adj. for3 for 2
8/ 22/ 07
Adj. for3 for 2
6/ 14/ 11
Adj. for3 for 27/ 3/ 13
Adj. for3 for 2
7/ 17/ 14
Special$0.107
D IVID EN D SEQU EN CE IS SEM I-AN N U AL
Ind BLD G P P/ E N / AN asdaq Bond $.0 M ils.Com 52.265 M ils.Book value 4.11P/ E 52.93Country U S
G rowth Performance M easurementYears Price Earn. D iv. Total Ret.Last 1 37.5 18.5 .0 38.4Last 5 18.4 4.2 12.6 19.1
Last 10 23.6 7.2 12.3 24.1Last 25 17.0 11.0 -- - 17.2
P D M arkets rooftop air-conditioning and heating 70% SC ALE
LEG EN DRead from Right Scale:PriceRelative Strength
Bottom Band VolumeM oving Avg (48 months)Recession (G rey Shaded Bars)
Read from Left Scale:EarningsD ividends
Charts are updated daily at www.SrcStockCharts.com.
15

AAR C OR POR ATION (AIR )
Copyright 2019 Securities Research Company
'85 '86 '87 '88 '89 '90 '91 '92 '93 '94 '95 '96 '97 '98 '99 '00 '01 '02 '03 '04 '05 '06 '07 '08 '09 '10 '11 '12 '13 '14 '15 '16 '17 '18 '19 '20
3/ 4
1
1 1/ 4
1 1/ 2
1 3/ 4
2
2 1/ 4
2 1/ 2
2 3/ 4
3 3 1/ 43 1/ 23 3/ 4
4 1/ 2
5
5 1/ 2
6 6 1/ 27 7 1/ 2
8 1/ 2
9 1/ 2
11
12 13 14 15
17
19
22
24
26 28 30
34
38
42
46
50
55
60 65 70 75
85
95
110
120 130
.04
.05
.06
.07
.08
.09
.10
.20
.25
.30
.35
.40
.45
.50
.60
.70
.80
.90
1.0
1.5
2.0
2.5
3.0
3.5
4.0
4.5
5.0
5.5
6.06.57.07.5
8.5
4 48 8
12 1216 1620 20M
0.01
(0.01)
0.02
(0.26)
(0.43)
(0.35)
(0.25)
(0.27)
(0.18)
(0.13)
(0.06)Adj. for3 for 2
2/ 11/ 86
Adj. for3 for 2
10/ 27/ 87
Adj. for3 for 2
2/ 24/ 98
D ividendsuspended10/ 10/ 02
Ind AEROD P/ E N / AN YSE Bond$318.6 M ils.Com 35.041 M ils.Book value 25.95P/ E 23.41Country U S
G rowth Performance M easurementYears Price Earn. D iv. Total Ret.Last 1 21.8 -9.3 .0 22.6Last 5 9.9 3.9 .0 10.6
Last 10 7.1 2.2 11.6 7.7Last 25 6.7 6.9 - .3 7.2
D Commercial, military and industrial products
LEG EN DRead from Right Scale:PriceRelative Strength
Bottom Band VolumeM oving Avg (48 months)Recession (G rey Shaded Bars)
Read from Left Scale:EarningsD ividends
Charts are updated daily at www.SrcStockCharts.com.
16

AAR ON 'S, IN C (AAN )
Copyright 2019 Securities Research Company
'85 '86 '87 '88 '89 '90 '91 '92 '93 '94 '95 '96 '97 '98 '99 '00 '01 '02 '03 '04 '05 '06 '07 '08 '09 '10 '11 '12 '13 '14 '15 '16 '17 '18 '19 '20
1/ 2
3/ 4
1
1 1/ 4
1 1/ 2
1 3/ 4
2
2 1/ 4
2 1/ 2
2 3/ 43 3 1/ 43 1/ 2
4
4 1/ 2
5
5 1/ 26 6 1/ 27
8
9
10
11 12 13 14
16
18
20
22 24 26 28
32
36
40
44 48
55 60 65 70
80
90
100
110 120
.02
.03
.04
.05
.06
.07
.08
.09
.10
.20
.25
.30
.35
.40
.45
.50
.60
.70
.80
.90
1.0
1.5
2.0
2.5
3.0
3.5
4.0
4.5
5.0
5.56.06.57.0
8.0
10 1020 2030 3040 4050 50M
0.01
0.01
0.01
0.01
0.01
0.01
0.01
0.01
0.01
0.01
0.01
0.01
0.01
0.01
0.01
0.01
0.01
0.01
0.01
0.01
Adj. for2 for 16/ 4/ 96
Adj. for3 for 2
8/ 18/ 03
Adj. for3 for 28/ 17/ 04
Adj. for3 for 2
4/ 16/ 10
Listed N YSE 3/ 20/ 98
OTC prior
Aaron Rents, Inc.prior to 4/ 20/ 09
Ind H OM EF P/ E N / AN YSE Bond$130.0 M ils.Com 69.176 M ils.Book value 20.75P/ E 15.35Country U S
G rowth Performance M easurementYears Price Earn. D iv. Total Ret.Last 1 15.3 11.9 16.7 15.6Last 5 12.8 17.5 10.8 13.0
Last 10 12.0 10.6 11.9 12.2Last 25 14.5 13.3 10.8 14.6
D Rents and sells furniture, electronics and business equipment 90% SC ALE
LEG EN DRead from Right Scale:PriceRelative Strength
Bottom Band VolumeM oving Avg (48 months)Recession (G rey Shaded Bars)
Read from Left Scale:EarningsD ividends
Charts are updated daily at www.SrcStockCharts.com.
17

ABBOTT LABOR ATOR IES (ABT)
Copyright 2019 Securities Research Company
'85 '86 '87 '88 '89 '90 '91 '92 '93 '94 '95 '96 '97 '98 '99 '00 '01 '02 '03 '04 '05 '06 '07 '08 '09 '10 '11 '12 '13 '14 '15 '16 '17 '18 '19 '20
1 1/ 4
1 1/ 2
1 3/ 4
2
2 1/ 4
2 1/ 2
2 3/ 4
3 3 1/ 43 1/ 23 3/ 4
4 1/ 2
5
5 1/ 2
6 6 1/ 27 7 1/ 2
8 1/ 2
9 1/ 2
11
12 13 14 15
17
19
22
24 26 28 30
34
38
42
46
50
55
60 65 70 75
85
95
110
120 130 140 150
170
190
220
240 260
.08
.09
.10
.20
.25
.30
.35
.40
.45
.50
.60
.70
.80
.90
1.0
1.5
2.0
2.5
3.0
3.5
4.0
4.5
5.0
5.5
6.0
6.57.07.5
8.5
9.5
12
14
16
100 100200 200300 300400 400500 500M
Oximetrix Inc.acquired 6/ 19/ 85
Special$0.002
M ediSense, Inc.acquired 8/ 7/ 96
Kos Pharmaceuticalsacquired 12/ 15/ 06
D ist. 1 sh. AbbVie Incfor ea. sh. ABT
1/ 1/ 13
Ind D RU G S P/ E N / AN YSE Bond$7009.7 M ils.Com 1754.319 M ils.Book value 14.16P/ E 27.54Country U S
G rowth Performance M easurementYears Price Earn. D iv. Total Ret.Last 1 17.0 7.6 14.3 18.7Last 5 13.8 8.0 7.8 15.3
Last 10 4.9 -1.8 -2.2 6.4Last 25 6.5 4.9 5.0 7.7
Pharmaceuticals, hospital and laboratory products, consumer goods
LEG EN DRead from Right Scale:PriceRelative Strength
Bottom Band VolumeM oving Avg (48 months)Recession (G rey Shaded Bars)
Read from Left Scale:EarningsD ividends
Charts are updated daily at www.SrcStockCharts.com.
18

ABIOM ED IN C (ABM D )
Copyright 2019 Securities Research Company
'85 '86 '87 '88 '89 '90 '91 '92 '93 '94 '95 '96 '97 '98 '99 '00 '01 '02 '03 '04 '05 '06 '07 '08 '09 '10 '11 '12 '13 '14 '15 '16 '17 '18 '19 '20
1 1/ 2
1 3/ 4
2
2 1/ 4
2 1/ 2
2 3/ 43 3 1/ 43 1/ 2
4
4 1/ 2
5
5 1/ 26 6 1/ 27
8
9
10
11 12 13 14
16
18
20
22 24 26
30
34
38
42
46 50
55 60 65 70
80
90
100
110 120 130 140
160
180
200
220 240 260
300
340
380
420
460 500
600
.10
.20
.25
.30
.35
.40
.45
.50
.60
.70
.80
.90
1.0
1.5
2.0
2.5
3.0
3.5
4.0
4.5
5.0
5.56.06.57.0
8.0
9.0
10
12
14
16
18
20
25
30
35
40
45
6 612 1218 1824 2430 30M
(0.07)
(0.13)
(0.17)
(0.25)
(0.24)
(0.22)
(0.21)
(0.16)
(0.18)
(0.19)
(0.46)
(0.49)
(0.54)
(0.56)
(0.34)
(0.37)
(0.39)
(0.40)
(0.40)
(0.37)
(0.30)
(0.27)
(0.20)
(0.16)
(0.16)
(0.12)
(0.10)
(0.07)
(0.03)
0.02
0.05
0.05
0.07
0.08
0.02
0.06
0.08
(0.06)
(0.16)
(0.35)
(0.42)
(0.39)
(0.41)
(0.44)
(0.51)
(0.60)
(0.65)
(0.54)
(1.11)
(0.55)
(0.75)
(1.02)
(1.15)
(1.27)
(1.23)
(1.14)
(1.04)
(0.87)
(0.76)
(0.64)
(0.52)
(0.45)
(0.41)
(0.26)
(0.18)
(0.11)
(0.22)
(0.35)
(0.51)
(0.64)
(0.65)
(0.87)
(0.95)
(1.03)
(1.02)
(0.98)
(0.99)
(1.04)
(1.10)
(0.99)
(0.94)
(0.90)
(0.83)
(0.86)
(0.77)
(0.66)
(0.60)
(0.48)
(0.38)
(0.30)
(0.24)
(0.13)
(0.06)
0.04
Ind H CEQP P/ E N / AN asdaq Bond $.0 M ils.Com 44.877 M ils.Book value 9.96P/ E 43.26Country U S
G rowth Performance M easurementYears Price Earn. D iv. Total Ret.Last 1 -46.1 -9.1 -- - -46.1Last 5 29.6 58.3 -- - 29.6
Last 10 37.3 -- - - - - 37.3Last 25 18.3 -- - - - - 18.3
P Temporary external hearts & other cardiac-related technology 90% SC ALE
LEG EN DRead from Right Scale:PriceRelative Strength
Bottom Band VolumeM oving Avg (48 months)Recession (G rey Shaded Bars)
Read from Left Scale:EarningsD ividends
Charts are updated daily at www.SrcStockCharts.com.
19

ABM IN D U STR IES IN C OR POR ATED (ABM )
Copyright 2019 Securities Research Company
'85 '86 '87 '88 '89 '90 '91 '92 '93 '94 '95 '96 '97 '98 '99 '00 '01 '02 '03 '04 '05 '06 '07 '08 '09 '10 '11 '12 '13 '14 '15 '16 '17 '18 '19 '20
3/ 4
1
1 1/ 4
1 1/ 2
1 3/ 4
2
2 1/ 4
2 1/ 2
2 3/ 4
3 3 1/ 43 1/ 23 3/ 4
4 1/ 2
5
5 1/ 2
6 6 1/ 27 7 1/ 2
8 1/ 2
9 1/ 2
11
12 13 14 15
17
19
22
24
26 28 30
34
38
42
46
50
55
60 65 70 75
85
95
110
120 130
.04
.05
.06
.07
.08
.09
.10
.20
.25
.30
.35
.40
.45
.50
.60
.70
.80
.90
1.0
1.5
2.0
2.5
3.0
3.5
4.0
4.5
5.0
5.5
6.06.57.07.5
8.5
2 24 46 68 8
10 10M
Adj. for2 for 17/ 31/ 92
Adj. for2 for 18/ 6/ 96
Adj. for2 for 15/ 7/ 02
American BuildingM aintenance
prior to 3/ 16/ 94
Accelerateddividendpayment12/ 28/ 12
Ind PCTRL P/ E N / AN YSE Bond $.0 M ils.Com 65.852 M ils.Book value 18.06P/ E 19.62Country U S
G rowth Performance M easurementYears Price Earn. D iv. Total Ret.Last 1 13.1 -1.0 2.9 15.2Last 5 6.0 4.6 3.0 7.9
Last 10 7.1 4.1 3.3 8.8Last 25 7.8 6.5 7.1 8.9
Janitorial and building maintenance services
LEG EN DRead from Right Scale:PriceRelative Strength
Bottom Band VolumeM oving Avg (48 months)Recession (G rey Shaded Bars)
Read from Left Scale:EarningsD ividends
Charts are updated daily at www.SrcStockCharts.com.
20

AC AD IA R EALTY TR U ST (AKR )
Copyright 2019 Securities Research Company
'85 '86 '87 '88 '89 '90 '91 '92 '93 '94 '95 '96 '97 '98 '99 '00 '01 '02 '03 '04 '05 '06 '07 '08 '09 '10 '11 '12 '13 '14 '15 '16 '17 '18 '19 '20
1/ 2
3/ 4
1
1 1/ 4
1 1/ 2
1 3/ 4
2
2 1/ 4
2 1/ 2
2 3/ 4
3 3 1/ 43 1/ 23 3/ 4
4 1/ 2
5
5 1/ 2
6 6 1/ 27 7 1/ 2
8 1/ 2
9 1/ 2
11
12
13 14 15
17
19
22
24
26 28 30
34
38
42
46
50
55
60 65 70 75
85
95
110
.04
.05
.06
.07
.08
.09
.10
.20
.25
.30
.35
.40
.45
.50
.60
.70
.80
.90
1.0
1.5
2.0
2.5
3.0
3.5
4.0
4.5
5.0
5.5
6.06.57.07.5
5 510 1015 1520 2025 25M
M ark CTRS TRprior to 8/ 12/ 98
D ividendssuspended
4/ 15/ 98
All earnings representfunds from operations
Special$0.223
Special$0.55
Special$0.30
Special$0.25
Special$0.15
Ind EREIT P/ E N / AN YSE Bond$326.7 M ils.Com 81.503 M ils.Book value 19.14P/ E 53.47Country U S
G rowth Performance M easurementYears Price Earn. D iv. Total Ret.Last 1 -12.5 23.7 3.7 -8.6Last 5 -7.0 -18.7 4.0 -3.5
Last 10 4.7 -9.6 4.5 8.0Last 25 2.8 -4.7 -1.0 5.3
Specializes in shopping centers
LEG EN DRead from Right Scale:PriceRelative Strength
Bottom Band VolumeM oving Avg (48 months)Recession (G rey Shaded Bars)
Read from Left Scale:EarningsD ividends
Charts are updated daily at www.SrcStockCharts.com.
21

AC M E U N ITED C OR POR ATION (AC U )
Copyright 2019 Securities Research Company
'85 '86 '87 '88 '89 '90 '91 '92 '93 '94 '95 '96 '97 '98 '99 '00 '01 '02 '03 '04 '05 '06 '07 '08 '09 '10 '11 '12 '13 '14 '15 '16 '17 '18 '19 '20
1/ 2
3/ 4
1
1 1/ 4
1 1/ 2
1 3/ 4
2
2 1/ 4
2 1/ 2
2 3/ 4
3 3 1/ 43 1/ 23 3/ 4
4 1/ 2
5
5 1/ 2
6 6 1/ 27 7 1/ 2
8 1/ 2
9 1/ 2
11
12
13 14 15
17
19
22
24
26 28 30
34
38
42
46
50
55
60 65
.02
.03
.04
.05
.06
.07
.08
.09
.10
.20
.25
.30
.35
.40
.45
.50
.60
.70
.80
.90
1.0
1.5
2.0
2.5
3.0
3.5
4.0
200 200400 400600 600800 800
1000 1000T
(0.14)
0.01
(0.23)
(0.44)
(0.61)
(0.85)
(0.73)
(0.55)
(0.43)
(0.70)
(0.75)
(0.68)
(0.59)
(0.04)
D ividend omitted4/ 27/ 87
D ividendomitted2/ 8/ 89
D ividendomitted4/ 26/ 93
Ind H SWRE P/ E N / AN YSE Bond $10.2 M ils.Com 3.374 M ils.Book value 14.20P/ E 15.84Country U S
G rowth Performance M easurementYears Price Earn. D iv. Total Ret.Last 1 40.3 15.6 9.1 43.2Last 5 4.4 1.7 5.9 6.2
Last 10 10.2 8.2 9.1 11.7Last 25 7.7 22.1 3.6 8.5
Producer of first aid kits
LEG EN DRead from Right Scale:PriceRelative Strength
Bottom Band VolumeM oving Avg (48 months)Recession (G rey Shaded Bars)
Read from Left Scale:EarningsD ividends
Charts are updated daily at www.SrcStockCharts.com.
22

AC TIVISION BLIZZAR D IN C OR P OR ATED (ATVI)
Copyright 2019 Securities Research Company
'85 '86 '87 '88 '89 '90 '91 '92 '93 '94 '95 '96 '97 '98 '99 '00 '01 '02 '03 '04 '05 '06 '07 '08 '09 '10 '11 '12 '13 '14 '15 '16 '17 '18 '19 '20
1/ 4
1/ 2
3/ 4
1
1 1/ 4
1 1/ 21 3/ 42
2 1/ 2
3 3 1/ 24
5
6 7 8
9 1/ 211
13 15
18
22
26 30
36 42 48 55
65 75
90
110
.005
.01
.02
.03
.04
.05
.06
.07
.08
.10
.20
.25
.30
.35
.40
.50
.60
.70
.80
1.0
1.5
2.0
2.5
3.03.54.0
5.0
6.07.0
150 150300 300450 450600 600750 750M
(0.03)
(0.03)
(0.08)
(0.05)
(0.04)
(0.02)
(0.01)
(0.03)
(0.01)
(0.01)
Adj. for1 for 101/ 17/ 89
Adj. for1 for 3
10/ 20/ 93
Adj. for3 for 2
11/ 21/ 01
Adj. for3 for 26/ 9/ 03
Adj. for3 for 23/ 16/ 04
Adj. for4 for 3
3/ 23/ 05
Adj. for4 for 3
10/ 25/ 05
Adj. for2 for 19/ 8/ 08
Activision Inc.prior to 8/ 17/ 88
M ediagenicprior to 8/ 3/ 92
Activision Inc.prior to 7/ 9/ 08
Vivendi's entertainment division (Blizzard)
merged 7/ 9/ 08
D IVID EN D SEQU EN CE IS AN N U AL
Ind H SOFT P/ E N / AN asdaq Bond $.0 M ils.Com 762.409 M ils.Book value 12.27P/ E 25.63Country U S
G rowth Performance M easurementYears Price Earn. D iv. Total Ret.Last 1 24.8 -11.5 8.8 25.6Last 5 23.1 10.1 13.1 23.7
Last 10 19.2 12.8 -- - 19.7Last 25 20.5 -- - - - - 20.6
M akes and distributes video games 50% SC ALE
LEG EN DRead from Right Scale:PriceRelative Strength
Bottom Band VolumeM oving Avg (48 months)Recession (G rey Shaded Bars)
Read from Left Scale:EarningsD ividends
Charts are updated daily at www.SrcStockCharts.com.
23

AD OBE SYSTEM S IN C (AD BE)
Copyright 2019 Securities Research Company
'85 '86 '87 '88 '89 '90 '91 '92 '93 '94 '95 '96 '97 '98 '99 '00 '01 '02 '03 '04 '05 '06 '07 '08 '09 '10 '11 '12 '13 '14 '15 '16 '17 '18 '19 '20
1/ 4
1/ 2
3/ 4
1
1 1/ 4
1 1/ 2
1 3/ 4
2 2 1/ 42 1/ 2
3
3 1/ 2
4 4 1/ 25
6
7
8 9 10
12
14
16 18 20
24
28
32 36 40
46
55
65
75
85 95
110
130
150
170 190
220
260
300
340 380
440
500
600
700
800 900 1000
.02
.03
.04
.05
.06
.07
.08
.09
.10
.20
.25
.30
.35
.40
.45
.50
.60
.70
.80
.901.0
1.5
2.0
2.5
3.0
3.5
4.04.55.0
6.0
7.0
8.09.010
12
14
161820
25
30
35
404550
60
150 150300 300450 450600 600750 750M
0.00
0.00
0.01
0.01
0.01
0.01
0.01
0.01
0.01
0.01
0.01
Adj. for2 for 13/ 12/ 87
Adj. for2 for 1
11/ 23/ 88
Adj. for2 for 18/ 11/ 93
Adj. for2 for 1
10/ 27/ 99
Adj. for2 for 1
10/ 25/ 00
Adj. for2 for 15/ 24/ 05
Aldus Corp.acquired 8/ 31/ 94
D ist. 1 sh.N etscape Comm.
for ea. 800 shs.AD BE 8/ 27/ 97
F rame Technologyacquired 10/ 28/ 95
D ist. 1 sh.Siebel Systems, Inc.
for ea.2400 shs.AD BE 12/ 1/ 97
M acromedia Inc.acquired 12/ 3/ 05
N o actionon
D ividends
Omniture Inc.Acquired10/ 26/ 09
Ind APPSF P/ E N / AN asdaq Bond $.0 M ils.Com 488.134 M ils.Book value 16.98P/ E 43.45Country U S
G rowth Performance M easurementYears Price Earn. D iv. Total Ret.Last 1 37.1 8.6 .0 37.1Last 5 37.1 40.1 .0 37.1
Last 10 26.5 17.6 .0 26.5Last 25 19.9 16.5 .0 19.9
P E Computer-aided publishing systems and applications software 65% SC ALE
LEG EN DRead from Right Scale:PriceRelative Strength
Bottom Band VolumeM oving Avg (48 months)Recession (G rey Shaded Bars)
Read from Left Scale:EarningsD ividends
Charts are updated daily at www.SrcStockCharts.com.
24

AD TALEM G LOBAL ED IN C (ATG E)
Copyright 2019 Securities Research Company
'85 '86 '87 '88 '89 '90 '91 '92 '93 '94 '95 '96 '97 '98 '99 '00 '01 '02 '03 '04 '05 '06 '07 '08 '09 '10 '11 '12 '13 '14 '15 '16 '17 '18 '19 '20
1/ 2
3/ 4
1
1 1/ 4
1 1/ 2
1 3/ 4
2
2 1/ 4
2 1/ 2
2 3/ 4
3 3 1/ 43 1/ 23 3/ 4
4 1/ 2
5
5 1/ 2
6 6 1/ 27 7 1/ 2
8 1/ 2
9 1/ 2
11
12 13 14 15
17
19
22
24 26 28 30
34
38
42
46
50
55
60 65 70 75
85
95
110
.03
.04
.05
.06
.07
.08
.09
.10
.20
.25
.30
.35
.40
.45
.50
.60
.70
.80
.90
1.0
1.5
2.0
2.5
3.0
3.5
4.0
4.5
5.0
5.5
6.0
6.57.0
10 1020 2030 3040 4050 50M
(2.10)
(2.33)
(0.64)
(0.10)
(0.71)
(0.35)
(0.35)
(0.37)
Adj. for2 for 1
6/ 22/ 95
Adj. for2 for 1
12/ 19/ 96
Adj. for2 for 16/ 22/ 98
Ind ED SER P/ E N / AN YSE Bond $65.0 M ils.Com 59.368 M ils.Book value 25.29P/ E 13.00Country U S
G rowth Performance M easurementYears Price Earn. D iv. Total Ret.Last 1 -27.4 -1.4 .0 -27.4Last 5 -3.5 - .6 .6 -3.1
Last 10 -5.3 -1.1 8.4 -4.7Last 25 9.2 11.2 -- - 9.5
Career-oriented specialty schools
LEG EN DRead from Right Scale:PriceRelative Strength
Bottom Band VolumeM oving Avg (48 months)Recession (G rey Shaded Bars)
Read from Left Scale:EarningsD ividends
Charts are updated daily at www.SrcStockCharts.com.
25

AD VAN C ED M IC R O D EVIC ES IN C (AM D )
Copyright 2019 Securities Research Company
'85 '86 '87 '88 '89 '90 '91 '92 '93 '94 '95 '96 '97 '98 '99 '00 '01 '02 '03 '04 '05 '06 '07 '08 '09 '10 '11 '12 '13 '14 '15 '16 '17 '18 '19 '20
1/ 4
1/ 2
3/ 4
1
1 1/ 4
1 1/ 2
1 3/ 4
2
2 1/ 4
2 1/ 22 3/ 43
3 1/ 2
4
4 1/ 2
5 5 1/ 26
7
8
9
10 11 12
14
16
18
20 22 24
28
32
36
40 44 48
55 60
70
80
90
100
.01
.02
.03
.04
.05
.06
.07
.08
.09
.10
.20
.25
.30
.35
.40
.45
.50
.60
.70
.80
.90
1.0
1.5
2.0
2.5
3.0
3.5
4.0
4.5
5.05.56.0
7.0
600 6001200 12001800 18002400 24003000 3000M
(0.01)
(0.33)
(0.57)
(0.68)
(0.73)
(0.83)
(0.57)
(0.42)
(0.36)
(0.06) (0.01)
(0.10)
(0.07)
(0.06)
(0.39)
(0.45)
(0.31)
(0.11)
(0.26)
(0.30)
(0.14)
(0.11)
(0.07)
(0.32)
(0.57)
(0.46)
(0.36)
(0.60)
(0.98)
(1.35)
(1.17)
(0.15)
(0.31)
(0.90)
(1.36)
(2.00)
(2.39)
(2.25)
(1.60)
(0.82)
(0.28)
(0.51)
(1.58)
(2.34)
(2.47)
(2.08)
(1.77)
(1.15)
(1.67)
(1.78)
(1.80)
(2.27)
(1.55)
(0.84)
(0.11)
(0.16)
(0.41)
(0.56)
(0.32)
(0.12)
(0.04)
(0.23)
(0.43)
(0.53)
(0.56)
(0.44)
(0.24)
(0.15)
(0.07)
0.00
Adj. for2 for 18/ 22/ 00
Paid$0.025
ATI Technologies Inc.acquired 10/ 26/ 06
ListedN asdaq 1/ 2/ 15
N YSE 10/ 15/ 79OTC prior
Ind SEM IC P/ E N / AN asdaq Bond$3672.0 M ils.Com 974.872 M ils.Book value .41P/ E 120.41Country U S
G rowth Performance M easurementYears Price Earn. D iv. Total Ret.Last 1 97.3 -13.0 -- - 97.3Last 5 79.7 41.7 -- - 79.7
Last 10 20.5 -- - - - - 20.5Last 25 4.9 -6.0 -- - 4.9
P Integrated circuits 80% SC ALE
LEG EN DRead from Right Scale:PriceRelative Strength
Bottom Band VolumeM oving Avg (48 months)Recession (G rey Shaded Bars)
Read from Left Scale:EarningsD ividends
Charts are updated daily at www.SrcStockCharts.com.
26

AEG ION C OR P (AEG N )
Copyright 2019 Securities Research Company
'85 '86 '87 '88 '89 '90 '91 '92 '93 '94 '95 '96 '97 '98 '99 '00 '01 '02 '03 '04 '05 '06 '07 '08 '09 '10 '11 '12 '13 '14 '15 '16 '17 '18 '19 '20
1 1/ 4
1 1/ 2
1 3/ 4
2
2 1/ 4
2 1/ 2
2 3/ 4
3 3 1/ 43 1/ 23 3/ 4
4 1/ 2
5
5 1/ 2
6 6 1/ 27 7 1/ 2
8 1/ 2
9 1/ 2
11
12 13 14 15
17
19
22
24 26 28 30
34
38
42
46
50
55
60 65 70 75
85
95
110
120 130 140 150
170
190
220
240 260
.08
.09
.10
.20
.25
.30
.35
.40
.45
.50
.60
.70
.80
.90
1.0
1.5
2.0
2.5
3.0
3.5
4.0
4.5
5.0
5.5
6.0
6.57.07.5
8.5
9.5
12
14
16
3 36 69 9
12 1215 15M
(0.10)
(0.08)
(0.05)
0.01 (0.45)
(0.46)
(0.56)
(0.47) (0.04)
(0.09)
(0.02)
0.03 0.02
0.01
0.02
Insituform Technologies, Inc.prior to 12/ 11/ 11
Ind EN G N R P/ E N / AN asdaq Bond$115.0 M ils.Com 32.311 M ils.Book value 17.32P/ E 19.74Country U S
G rowth Performance M easurementYears Price Earn. D iv. Total Ret.Last 1 19.6 -7.6 -- - 19.6Last 5 7.2 -4.4 -- - 7.2
Last 10 .6 .6 -- - .6Last 25 2.4 2.5 -- - 2.4
H olds U .S. rights to the sewer and pipe repair process
LEG EN DRead from Right Scale:PriceRelative Strength
Bottom Band VolumeM oving Avg (48 months)Recession (G rey Shaded Bars)
Read from Left Scale:EarningsD ividends
Charts are updated daily at www.SrcStockCharts.com.
27

AEG ON N V AD R (AEG )
Copyright 2019 Securities Research Company
'85 '86 '87 '88 '89 '90 '91 '92 '93 '94 '95 '96 '97 '98 '99 '00 '01 '02 '03 '04 '05 '06 '07 '08 '09 '10 '11 '12 '13 '14 '15 '16 '17 '18 '19 '20
1/ 4
1/ 2
3/ 4
1
1 1/ 4
1 1/ 2
1 3/ 4
2
2 1/ 4
2 1/ 2
2 3/ 43 3 1/ 43 1/ 2
4
4 1/ 2
5
5 1/ 26 6 1/ 27
8
9
10
11 12 13 14
16
18
20
22 24 26 28
32
36
40
44 48
55 60 65 70
.02
.03
.04
.05
.06
.07
.08
.09
.10
.20
.25
.30
.35
.40
.45
.50
.60
.70
.80
.90
1.0
1.5
2.0
2.5
3.0
3.5
4.0
4.5
25 2550 5075 75
100 100125 125M
(0.18) (0.08)
Adj. for2.2% SD5/ 28/ 86
Adj. for2.4% SD5/ 26/ 87
Adj. for2.5% SD5/ 19/ 89
Adj. for2 for 16/ 16/ 92
Adj. for5 for 26/ 9/ 95
Adj. for2 for 1
5/ 26/ 98
Adj. for2 for 1
5/ 31/ 00
Adj. for4% SD4/ 17/ 03
Adj. for2.222% SD
8/ 20/ 15
Transamerica Corp.acquired 7/ 21/ 99
D ividends in U S currency net after N etherlands tax to U .S. residents
Clark Incacquired 3/ 13/ 07
D IVID EN D SEQU EN CE IS SEM I-AN N U AL
Ind IN SLH P/ E N / AN YSE Bond$2051.0 M ils.Com 2095.648 M ils.Book value 13.02P/ E N / ACountry N etherlands
G rowth Performance M easurementYears Price Earn. D iv. Total Ret.Last 1 -14.7 .0 18.0 -8.2Last 5 -9.2 2.3 6.5 -3.9
Last 10 -2.9 -- - -8.3 1.0Last 25 -1.3 2.3 2.4 3.0
AD R - International insurance company 90% SC ALE
LEG EN DRead from Right Scale:PriceRelative Strength
Bottom Band VolumeM oving Avg (48 months)Recession (G rey Shaded Bars)
Read from Left Scale:EarningsD ividends
Charts are updated daily at www.SrcStockCharts.com.
28

AER OJET R OC KETD YN E H OLD IN G S, IN C . (AJR D )
Copyright 2019 Securities Research Company
'85 '86 '87 '88 '89 '90 '91 '92 '93 '94 '95 '96 '97 '98 '99 '00 '01 '02 '03 '04 '05 '06 '07 '08 '09 '10 '11 '12 '13 '14 '15 '16 '17 '18 '19 '20
1/ 2
3/ 4
1
1 1/ 4
1 1/ 2
1 3/ 4
2
2 1/ 4
2 1/ 2
2 3/ 4
3 3 1/ 43 1/ 23 3/ 4
4 1/ 2
5
5 1/ 2
6 6 1/ 27 7 1/ 2
8 1/ 2
9 1/ 2
11
12 13 14 15
17
19
22
24
26 28 30
34
38
42
46
50
55
60 65 70 75
.03
.04
.05
.06
.07
.08
.09
.10
.20
.25
.30
.35
.40
.45
.50
.60
.70
.80
.90
1.0
1.5
2.0
2.5
3.0
3.5
4.0
4.5
5.0
3 36 69 9
12 1215 15M
(0.41)
(0.09)
(0.04)
0.01
(1.01)
(1.29)
(1.87)
(1.95)
(1.28)
(1.03)
(3.92)
(3.67)
(3.72)
(3.75)
(0.56)
(0.34) (0.10)
(0.10)
(0.12)
(0.34)
(0.32)
(0.30)
(0.16)
(0.03)
0.01
Adj. for2% SD2/ 26/ 85
Adj. for2% SD3/ 3/ 86
Adj. for3 for 1
12/ 23/ 87
Reener-F ilms Corp.acq. 7/ 19/ 93
D ividenddeferred9/ 10/ 99
D ist. 1 sh. OmnovaSolutions for ea.sh. G Y 10/ 4/ 99
D ividendomitted7/ 19/ 04
G enCorp, Inc.prior to 4/ 27/ 15
Ind AEROD P/ E N / AN YSE Bond$441.1 M ils.Com 75.600 M ils.Book value -1.98P/ E 30.92Country U S
G rowth Performance M easurementYears Price Earn. D iv. Total Ret.Last 1 32.4 26.1 .0 32.4Last 5 25.5 47.8 .0 25.5
Last 10 25.0 8.2 .0 25.0Last 25 5.8 -- - -6.2 6.1
PTires, plastics, aerospace, bottling, radio/ TV stations
LEG EN DRead from Right Scale:PriceRelative Strength
Bottom Band VolumeM oving Avg (48 months)Recession (G rey Shaded Bars)
Read from Left Scale:EarningsD ividends
Charts are updated daily at www.SrcStockCharts.com.
29

AES C OR P (AES)
Copyright 2019 Securities Research Company
'85 '86 '87 '88 '89 '90 '91 '92 '93 '94 '95 '96 '97 '98 '99 '00 '01 '02 '03 '04 '05 '06 '07 '08 '09 '10 '11 '12 '13 '14 '15 '16 '17 '18 '19 '20
3/ 4
1
1 1/ 4
1 1/ 2
1 3/ 4
2
2 1/ 4
2 1/ 2
2 3/ 4
3 3 1/ 43 1/ 23 3/ 4
4 1/ 2
5
5 1/ 2
6 6 1/ 27 7 1/ 2
8 1/ 2
9 1/ 2
11
12 13 14 15
17
19
22
24
26 28 30
34
38
42
46
50
55
60 65 70 75
85
95
110
120 130
.04
.05
.06
.07
.08
.09
.10
.20
.25
.30
.35
.40
.45
.50
.60
.70
.80
.90
1.0
1.5
2.0
2.5
3.0
3.5
4.0
4.5
5.0
5.5
6.06.57.07.5
8.5
60 60120 120180 180240 240300 300M
0.01
0.01
0.02
Adj. for5 for 1
6/ 17/ 91
Adj. for3 for 22/ 1/ 94
Adj. for3% SD3/ 4/ 94
Adj. for2 for 18/ 29/ 97
Adj. for2 for 16/ 2/ 00
Applied Energy Svc.prior to 5/ 1/ 91
Paid$0.033
Paid$0.033
& $0.065optionalcash/ stk.
Paid$0.146opt.l
cash/ stk.
ListedN YSE 10/ 16/ 96
OTC prior
Ipalco Enterprisesacquired 3/ 27/ 01
D PL, Inc.acquired 11/ 28/ 11
Ind IPPET P/ E N / AN YSE Bond $15.9 M ils.Com 661.683 M ils.Book value 5.25P/ E 14.62Country U S
G rowth Performance M easurementYears Price Earn. D iv. Total Ret.Last 1 23.1 11.3 5.0 26.5Last 5 10.6 1.2 22.2 13.1
Last 10 4.8 2.0 -- - 6.2Last 25 6.3 6.0 -- - 6.9
D evelops and operates co-generation power facilities
LEG EN DRead from Right Scale:PriceRelative Strength
Bottom Band VolumeM oving Avg (48 months)Recession (G rey Shaded Bars)
Read from Left Scale:EarningsD ividends
Charts are updated daily at www.SrcStockCharts.com.
30

AF LAC IN C (AF L)
Copyright 2019 Securities Research Company
'85 '86 '87 '88 '89 '90 '91 '92 '93 '94 '95 '96 '97 '98 '99 '00 '01 '02 '03 '04 '05 '06 '07 '08 '09 '10 '11 '12 '13 '14 '15 '16 '17 '18 '19 '20
1/ 4
1/ 2
3/ 4
1
1 1/ 4
1 1/ 2
1 3/ 4
2
2 1/ 4
2 1/ 2
2 3/ 43 3 1/ 4
3 3/ 4
4 1/ 2
5
5 1/ 26 6 1/ 2
7 1/ 2
8 1/ 2
9 1/ 2
11 12 13
15
17
19
22 24 26
30
34
38
42 46 50
55 60 65
75
85
95
110 120
.02
.03
.04
.05
.06
.07
.08
.09
.10
.20
.25
.30
.35
.40
.45
.50
.60
.70
.80
.90
1.0
1.5
2.0
2.5
3.0
3.5
4.0
4.5
5.0
5.56.06.5
7.5
8.5
30 3060 6090 90
120 120150 150M
0.01
0.01
Adj. for2 for 13/ 3/ 87
Adj. for5 for 4
6/ 15/ 93
Adj. for3 for 23/ 18/ 96
Adj. for2 for 16/ 9/ 98
Adj. for2 for 1
3/ 19/ 01
Adj. for2 for 13/ 16/ 18
American F amilyprior to 1/ 2/ 92
Ind IN SLH P/ E N / AN YSE Bond$1426.0 M ils.Com 767.800 M ils.Book value 50.47P/ E 11.75Country U S
G rowth Performance M easurementYears Price Earn. D iv. Total Ret.Last 1 9.2 7.5 3.8 11.4Last 5 12.8 7.6 6.7 14.7
Last 10 8.0 6.2 6.8 9.5Last 25 12.3 12.4 14.3 13.1
Accident and health insurance, broadcasting 85% SC ALE
LEG EN DRead from Right Scale:PriceRelative Strength
Bottom Band VolumeM oving Avg (48 months)Recession (G rey Shaded Bars)
Read from Left Scale:EarningsD ividends
Charts are updated daily at www.SrcStockCharts.com.
31

AG C O C OR P (AG C O)
Copyright 2019 Securities Research Company
'85 '86 '87 '88 '89 '90 '91 '92 '93 '94 '95 '96 '97 '98 '99 '00 '01 '02 '03 '04 '05 '06 '07 '08 '09 '10 '11 '12 '13 '14 '15 '16 '17 '18 '19 '20
3/ 4
1
1 1/ 4
1 1/ 2
1 3/ 4
2
2 1/ 4
2 1/ 2
2 3/ 4
3 3 1/ 43 1/ 23 3/ 4
4 1/ 2
5
5 1/ 2
6 6 1/ 27 7 1/ 2
8 1/ 2
9 1/ 2
11
12 13 14 15
17
19
22
24
26 28 30
34
38
42
46
50
55
60 65 70 75
85
95
110
120 130
.04
.05
.06
.07
.08
.09
.10
.20
.25
.30
.35
.40
.45
.50
.60
.70
.80
.90
1.0
1.5
2.0
2.5
3.0
3.5
4.0
4.5
5.0
5.5
6.06.57.07.5
8.5
15 1530 3045 4560 6075 75M
(0.09) 0.03
(0.03)
(0.07)
0.01
0.01
0.01
0.01
0.01
0.01
0.01
0.01
0.01
0.02
0.02
0.02
0.02
Adj. for3 for 2
12/ 16/ 94
Adj. for2 for 12/ 1/ 96
Listed N YSE4/ 6/ 94
OTC prior
D ividendomitted4/ 26/ 01
Ind TRKPT P/ E N / AN YSE Bond$577.4 M ils.Com 79.119 M ils.Book value 34.59P/ E 15.34Country U S
G rowth Performance M easurementYears Price Earn. D iv. Total Ret.Last 1 14.9 23.7 6.7 15.9Last 5 11.2 .5 7.8 12.1
Last 10 9.1 12.0 32.0 9.6Last 25 6.7 1.8 19.2 6.9
D Farm equipment, machinery and related parts
LEG EN DRead from Right Scale:PriceRelative Strength
Bottom Band VolumeM oving Avg (48 months)Recession (G rey Shaded Bars)
Read from Left Scale:EarningsD ividends
Charts are updated daily at www.SrcStockCharts.com.
32

AG ILYSYS, IN C . (AG YS)
Copyright 2019 Securities Research Company
'85 '86 '87 '88 '89 '90 '91 '92 '93 '94 '95 '96 '97 '98 '99 '00 '01 '02 '03 '04 '05 '06 '07 '08 '09 '10 '11 '12 '13 '14 '15 '16 '17 '18 '19 '20
1/ 4
1/ 2
3/ 4
1
1 1/ 4
1 1/ 2
1 3/ 4
2
2 1/ 4
2 1/ 2
2 3/ 4
3
3 1/ 43 1/ 23 3/ 4
4 1/ 2
5
5 1/ 2
6 6 1/ 27 7 1/ 2
8 1/ 2
9 1/ 2
11
12 13 14 15
17
19
22
24 26 28 30
34
38
42
46
50
.02
.03
.04
.05
.06
.07
.08
.09
.10
.20
.25
.30
.35
.40
.45
.50
.60
.70
.80
.90
1.0
1.5
2.0
2.5
3.0
3.5
3 36 69 9
12 1215 15M
0.01
(0.11)
(0.09)
(0.04)
(0.02)
(0.10)
(0.13)
(0.12)
(0.09)
(0.05)
(0.07)
(2.71)
(0.38)
(0.58)
(0.58)
(0.08)
(0.49)
(0.84)
(0.50)
(0.44)
(0.63)
(0.43)
(0.29)
(0.19)
0.00 0.01
(0.12)
(0.11)
(0.17)
(0.17)
(0.14)
(0.23)
(0.31)
(0.26)
(0.45)
(0.48)
(0.51)
(0.58)
(0.36)
(0.26)
(0.21)
(0.24)
(0.39)
(0.43)
(0.39)
Adj. for3 for 2
3/ 16/ 93
Adj. for3 for 28/ 2/ 94
Adj. for3 for 29/ 7/ 95
Pioneer Standard Electronicsprior to 9/ 16/ 03
D ividendOmitted
|05/ 18/ 10
Ind TD STR P/ E N / AN asdaq Bond$320.2 M ils.Com 23.525 M ils.Book value 4.93P/ E N / ACountry U S
G rowth Performance M easurementYears Price Earn. D iv. Total Ret.Last 1 46.4 -62.5 .0 46.4Last 5 20.1 -- - .0 20.1
Last 10 11.9 3.9 .0 11.9Last 25 3.4 -- - 1.6 3.6
D istributes enterprise computer systems to medium and large business
LEG EN DRead from Right Scale:PriceRelative Strength
Bottom Band VolumeM oving Avg (48 months)Recession (G rey Shaded Bars)
Read from Left Scale:EarningsD ividends
Charts are updated daily at www.SrcStockCharts.com.
33
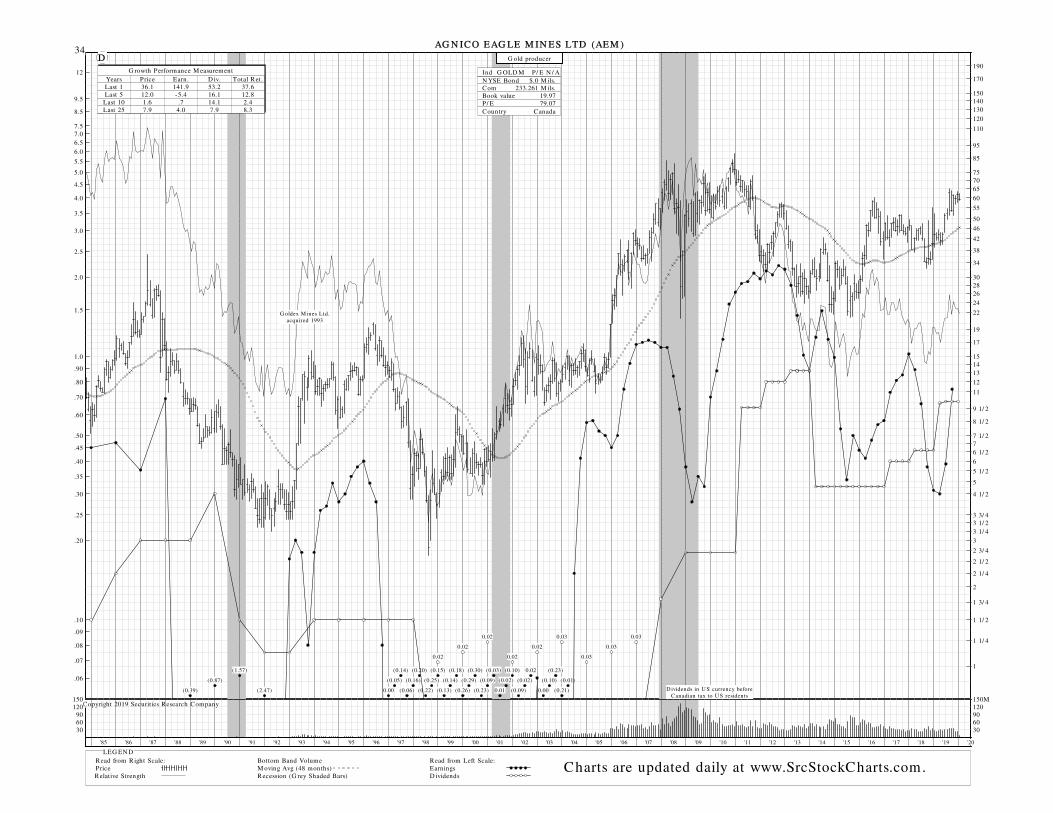
AG N IC O EAG LE M IN ES LTD (AEM )
Copyright 2019 Securities Research Company
'85 '86 '87 '88 '89 '90 '91 '92 '93 '94 '95 '96 '97 '98 '99 '00 '01 '02 '03 '04 '05 '06 '07 '08 '09 '10 '11 '12 '13 '14 '15 '16 '17 '18 '19 '20
1
1 1/ 4
1 1/ 2
1 3/ 4
2
2 1/ 4
2 1/ 2
2 3/ 4
3 3 1/ 43 1/ 23 3/ 4
4 1/ 2
5
5 1/ 2
6
6 1/ 27 7 1/ 2
8 1/ 2
9 1/ 2
11
12
13 14 15
17
19
22
24
26 28 30
34
38
42
46
50
55
60
65 70 75
85
95
110
120
130 140 150
170
190
.06
.07
.08
.09
.10
.20
.25
.30
.35
.40
.45
.50
.60
.70
.80
.90
1.0
1.5
2.0
2.5
3.0
3.5
4.0
4.5
5.0
5.5
6.06.57.07.5
8.5
9.5
12
30 3060 6090 90
120 120150 150M
(0.39)
(0.87)
(1.57)
(2.47) 0.00
(0.05)
(0.14)
(0.06)
(0.16)
(0.20)
(0.22)
(0.25)
(0.15)
(0.13)
(0.14)
(0.18)
(0.26)
(0.29)
(0.30)
(0.23)
(0.09)
(0.03)
0.01
(0.02)
(0.10)
(0.09)
(0.02)
0.02
0.00
(0.10)
(0.23)
(0.21)
(0.01)
0.02
0.02
0.02
0.02
0.02
0.03
0.03
0.03
0.03
G oldex M ines Ltd.acquired 1993
D ividends in U S currency beforeCanadian tax to U S residents
Ind G OLD M P/ E N / AN YSE Bond $.0 M ils.Com 233.261 M ils.Book value 19.97P/ E 79.07Country Canada
G rowth Performance M easurementYears Price Earn. D iv. Total Ret.Last 1 36.1 141.9 53.2 37.6Last 5 12.0 -5.4 16.1 12.8
Last 10 1.6 .7 14.1 2.4Last 25 7.9 4.0 7.9 8.3
D G old producer
LEG EN DRead from Right Scale:PriceRelative Strength
Bottom Band VolumeM oving Avg (48 months)Recession (G rey Shaded Bars)
Read from Left Scale:EarningsD ividends
Charts are updated daily at www.SrcStockCharts.com.
34

AIR P R OD U C TS & C H EM IC ALS IN C (AP D )
Copyright 2019 Securities Research Company
'85 '86 '87 '88 '89 '90 '91 '92 '93 '94 '95 '96 '97 '98 '99 '00 '01 '02 '03 '04 '05 '06 '07 '08 '09 '10 '11 '12 '13 '14 '15 '16 '17 '18 '19 '20
1 3/ 4
2
2 1/ 4
2 1/ 2
2 3/ 4
3 3 1/ 43 1/ 23 3/ 4
4 1/ 2
5
5 1/ 2
6 6 1/ 27 7 1/ 2
8 1/ 2
9 1/ 2
11
12
13 14 15
17
19
22
24
26 28 30
34
38
42
46
50
55
60 65 70 75
85
95
110
120
130 140 150
170
190
220
240
260 280 300
340
380
.20
.25
.30
.35
.40
.45
.50
.60
.70
.80
.90
1.0
1.5
2.0
2.5
3.0
3.5
4.0
4.5
5.0
5.5
6.06.57.07.5
8.5
9.5
12
14
16
18
20
25
15 1530 3045 4560 6075 75M
Adj. for2 for 16/ 6/ 86
Adj. for2 for 13/ 10/ 92
Adj. for2 for 16/ 16/ 98
D ist. 1 sh. Versum for ea 2 shs. APD
held 10/ 1/ 16
Ind IN G AS P/ E N / AN YSE Bond$2280.2 M ils.Com 219.273 M ils.Book value 33.75P/ E 28.22Country U S
G rowth Performance M easurementYears Price Earn. D iv. Total Ret.Last 1 41.1 9.3 5.5 43.9Last 5 9.8 6.5 8.5 11.5
Last 10 11.8 6.8 9.9 13.2Last 25 9.8 7.3 9.4 10.6
Industrial gases, equipment, chemicals
LEG EN DRead from Right Scale:PriceRelative Strength
Bottom Band VolumeM oving Avg (48 months)Recession (G rey Shaded Bars)
Read from Left Scale:EarningsD ividends
Charts are updated daily at www.SrcStockCharts.com.
35

ALAM O G R OU P IN C (ALG )
Copyright 2019 Securities Research Company
'85 '86 '87 '88 '89 '90 '91 '92 '93 '94 '95 '96 '97 '98 '99 '00 '01 '02 '03 '04 '05 '06 '07 '08 '09 '10 '11 '12 '13 '14 '15 '16 '17 '18 '19 '20
1 1/ 4
1 1/ 2
1 3/ 4
2
2 1/ 4
2 1/ 2
2 3/ 4
3 3 1/ 43 1/ 23 3/ 4
4 1/ 2
5
5 1/ 2
6 6 1/ 27 7 1/ 2
8 1/ 2
9 1/ 2
11
12 13 14 15
17
19
22
24 26 28 30
34
38
42
46
50
55
60 65 70 75
85
95
110
120 130 140 150
170
190
220
240 260
.08
.09
.10
.20
.25
.30
.35
.40
.45
.50
.60
.70
.80
.90
1.0
1.5
2.0
2.5
3.0
3.5
4.0
4.5
5.0
5.5
6.0
6.57.07.5
8.5
9.5
12
14
16
800 8001600 16002400 24003200 32004000 4000T
Ind TRKPT P/ E N / AN YSE Bond $78.5 M ils.Com 11.728 M ils.Book value 35.97P/ E 20.74Country U S
G rowth Performance M easurementYears Price Earn. D iv. Total Ret.Last 1 44.0 .5 9.1 44.6Last 5 22.5 10.0 11.4 22.8
Last 10 21.3 15.7 7.2 21.6Last 25 8.5 6.6 1.2 8.7
P E Tractor-mounted mowing and trimming equipment
LEG EN DRead from Right Scale:PriceRelative Strength
Bottom Band VolumeM oving Avg (48 months)Recession (G rey Shaded Bars)
Read from Left Scale:EarningsD ividends
Charts are updated daily at www.SrcStockCharts.com.
36

ALASKA AIR G R OU P IN C (ALK)
Copyright 2019 Securities Research Company
'85 '86 '87 '88 '89 '90 '91 '92 '93 '94 '95 '96 '97 '98 '99 '00 '01 '02 '03 '04 '05 '06 '07 '08 '09 '10 '11 '12 '13 '14 '15 '16 '17 '18 '19 '20
3/ 4
1
1 1/ 4
1 1/ 2
1 3/ 4
2
2 1/ 4
2 1/ 2
2 3/ 4
3 3 1/ 43 1/ 23 3/ 4
4 1/ 2
5
5 1/ 2
6 6 1/ 27 7 1/ 2
8 1/ 2
9 1/ 2
11
12 13 14 15
17
19
22
24
26 28 30
34
38
42
46
50
55
60 65 70 75
85
95
110
120 130
.04
.05
.06
.07
.08
.09
.10
.20
.25
.30
.35
.40
.45
.50
.60
.70
.80
.90
1.0
1.5
2.0
2.5
3.0
3.5
4.0
4.5
5.0
5.5
6.06.57.07.5
8.5
25 2550 5075 75
100 100125 125M
(0.06)
(0.12)
(0.04)
(0.46)
(0.81)
(1.63)
(1.62)
(1.34)
(1.11)
(0.63)
(0.43)
(0.17)
(0.21)
(0.40)
(0.47)
(0.83)
(0.81)
(0.87)
(0.83)
(0.63)
(0.84)
(0.81)
(0.55)
(0.34)
(0.19)
(0.12)
0.02
(0.18)
Adj. for2 for 13/ 19/ 12
Adj. for2 for 1
7/ 10/ 14
Alaska Airlines, Inc.prior to 5/ 23/ 85
D ividendomitted12/ 1/ 92
Ind ARLN S P/ E N / AN YSE Bond$1031.7 M ils.Com 123.398 M ils.Book value 24.52P/ E 11.52Country U S
G rowth Performance M easurementYears Price Earn. D iv. Total Ret.Last 1 3.0 28.3 9.4 5.2Last 5 - .6 6.5 22.9 1.1
Last 10 23.7 24.9 39.5 24.9Last 25 12.2 11.0 14.3 12.6
P D E H olding company for Alaska Airlines
LEG EN DRead from Right Scale:PriceRelative Strength
Bottom Band VolumeM oving Avg (48 months)Recession (G rey Shaded Bars)
Read from Left Scale:EarningsD ividends
Charts are updated daily at www.SrcStockCharts.com.
37

ALBAN Y IN TL C OR P (AIN )
Copyright 2019 Securities Research Company
'85 '86 '87 '88 '89 '90 '91 '92 '93 '94 '95 '96 '97 '98 '99 '00 '01 '02 '03 '04 '05 '06 '07 '08 '09 '10 '11 '12 '13 '14 '15 '16 '17 '18 '19 '20
1 1/ 4
1 1/ 2
1 3/ 4
2
2 1/ 4
2 1/ 2
2 3/ 4
3 3 1/ 43 1/ 23 3/ 4
4 1/ 2
5
5 1/ 2
6 6 1/ 27 7 1/ 2
8 1/ 2
9 1/ 2
11
12 13 14 15
17
19
22
24 26 28 30
34
38
42
46
50
55
60 65 70 75
85
95
110
120 130 140 150
170
190
220
240 260
.08
.09
.10
.20
.25
.30
.35
.40
.45
.50
.60
.70
.80
.90
1.0
1.5
2.0
2.5
3.0
3.5
4.0
4.5
5.0
5.5
6.0
6.57.07.5
8.5
9.5
12
14
16
3 36 69 9
12 1215 15M
Adj. for.5% SD6/ 3/ 98
Adj. for.5% SD9/ 2/ 98
Adj. for2% SD12/ 2/ 98
Adj. for2% SD12/ 8/ 99
D ividendsomitted
11/ 17/ 00
Ind M ACH N P/ E N / AN YSE Bond$354.6 M ils.Com 29.000 M ils.Book value 16.10P/ E 19.58Country U S
G rowth Performance M easurementYears Price Earn. D iv. Total Ret.Last 1 9.2 29.8 5.9 10.3Last 5 17.1 22.3 2.4 18.1
Last 10 14.2 13.5 4.1 15.1Last 25 6.1 6.7 3.1 6.7
Belts for paper making machines
LEG EN DRead from Right Scale:PriceRelative Strength
Bottom Band VolumeM oving Avg (48 months)Recession (G rey Shaded Bars)
Read from Left Scale:EarningsD ividends
Charts are updated daily at www.SrcStockCharts.com.
38

ALC OA IN C (AA)
Copyright 2019 Securities Research Company
'85 '86 '87 '88 '89 '90 '91 '92 '93 '94 '95 '96 '97 '98 '99 '00 '01 '02 '03 '04 '05 '06 '07 '08 '09 '10 '11 '12 '13 '14 '15 '16 '17 '18 '19 '20
1
1 1/ 4
1 1/ 2
1 3/ 4
2
2 1/ 4
2 1/ 2
2 3/ 4
3 3 1/ 43 1/ 23 3/ 4
4 1/ 2
5
5 1/ 2
6
6 1/ 27 7 1/ 2
8 1/ 2
9 1/ 2
11
12
13 14 15
17
19
22
24 26 28 30
34
38
42
46
50
55
60
65 70 75
85
95
110
120
130 140 150
170
190
220
.06
.07
.08
.09
.10
.20
.25
.30
.35
.40
.45
.50
.60
.70
.80
.90
1.0
1.5
2.0
2.5
3.0
3.5
4.0
4.5
5.0
5.5
6.06.57.07.5
8.5
9.5
12
14
100 100200 200300 300400 400500 500M
(2.04)
(3.03)
(2.16)
(0.33) (0.03)
Adj. for2 for 12/ 27/ 95
Adj. for2 for 12/ 26/ 99
Adj. for2 for 16/ 12/ 00
Adj. for1 for 3
10/ 6/ 16
Year End$0.14
Year End$0.175
Year End$0.023
Special$0.108
Special$0.125
Special$.028
Reynolds M etalsacquired 5/ 3/ 00
Aluminum Co. of Amer.prior to 1/ 4/ 99
D elistedD ow 309/ 23/ 13
D ata prior to 11/ 1/ 16 for Alcoa, Inc.
nowArconic
Ind ALU M N P/ E N / AN YSE Bond$5910.0 M ils.Com 186.473 M ils.Book value 28.16P/ E N / ACountry U S
G rowth Performance M easurementYears Price Earn. D iv. Total Ret.Last 1 -34.5 -- - .0 -34.5Last 5 -16.2 -- - - .0 -15.5
Last 10 -6.5 34.8 - .0 -5.4Last 25 -1.7 -- - -2.0 1.5
E Large integrated aluminum producer
LEG EN DRead from Right Scale:PriceRelative Strength
Bottom Band VolumeM oving Avg (48 months)Recession (G rey Shaded Bars)
Read from Left Scale:EarningsD ividends
Charts are updated daily at www.SrcStockCharts.com.
39

ALEXAN D ER & BALD WIN H OLD IN G S IN C . (ALEX)
Copyright 2019 Securities Research Company
'85 '86 '87 '88 '89 '90 '91 '92 '93 '94 '95 '96 '97 '98 '99 '00 '01 '02 '03 '04 '05 '06 '07 '08 '09 '10 '11 '12 '13 '14 '15 '16 '17 '18 '19 '20
3/ 4
1
1 1/ 4
1 1/ 2
1 3/ 4
2
2 1/ 4
2 1/ 2
2 3/ 4
3 3 1/ 43 1/ 23 3/ 4
4 1/ 2
5
5 1/ 2
6 6 1/ 27 7 1/ 2
8 1/ 2
9 1/ 2
11
12 13 14 15
17
19
22
24
26 28 30
34
38
42
46
50
55
60 65 70 75
85
95
110
120 130
.04
.05
.06
.07
.08
.09
.10
.20
.25
.30
.35
.40
.45
.50
.60
.70
.80
.90
1.0
1.5
2.0
2.5
3.0
3.5
4.0
4.5
5.0
5.5
6.06.57.07.5
8.5
3 36 69 9
12 1215 15M
(0.47)
(0.51)
(1.40)
Adj. for3 for 26/ 6/ 86
Adj. for2 for 16/ 3/ 88
ListedN YSE 10/ 1/ 08N asdaq prior
Alexander & Baldwin(OLD )now M atson Inc.prior to 6/ 29/ 12
D ist. 1 sh. M atson, Inc.for ea. sh. ALEX 7/ 2/ 12
Special$15.92
Ind REM D V P/ E N / AN YSE Bond$401.0 M ils.Com 72.023 M ils.Book value 25.90P/ E N / ACountry U S
G rowth Performance M easurementYears Price Earn. D iv. Total Ret.Last 1 -5.9 -- - 171.4 -2.3Last 5 -10.7 -- - 30.6 -9.5
Last 10 -3.8 -- - -4.9 -1.8Last 25 .0 -- - - .6 2.6
Produces sugar and coffee, engages in real estate, and ships cargo
LEG EN DRead from Right Scale:PriceRelative Strength
Bottom Band VolumeM oving Avg (48 months)Recession (G rey Shaded Bars)
Read from Left Scale:EarningsD ividends
Charts are updated daily at www.SrcStockCharts.com.
40

ALKER M ES P LC (ALKS)
Copyright 2019 Securities Research Company
'85 '86 '87 '88 '89 '90 '91 '92 '93 '94 '95 '96 '97 '98 '99 '00 '01 '02 '03 '04 '05 '06 '07 '08 '09 '10 '11 '12 '13 '14 '15 '16 '17 '18 '19 '20
3/ 4
1
1 1/ 4
1 1/ 2
1 3/ 4
2
2 1/ 4
2 1/ 2
2 3/ 4
3 3 1/ 43 1/ 23 3/ 4
4 1/ 2
5
5 1/ 2
6 6 1/ 27 7 1/ 2
8 1/ 2
9 1/ 2
11
12 13 14 15
17
19
22
24
26 28 30
34
38
42
46
50
55
60 65 70 75
85
95
110
120 130
.04
.05
.06
.07
.08
.09
.10
.20
.25
.30
.35
.40
.45
.50
.60
.70
.80
.90
1.0
1.5
2.0
2.5
3.0
3.5
4.0
4.5
5.0
5.5
6.06.57.07.5
8.5
15 1530 3045 4560 6075 75M
(0.16)
(0.18)
(0.54)
(0.67)
(0.46)
(0.50)
(0.49)
(0.36)
(0.40)
(0.38)
(0.42)
(0.55)
(0.58)
(0.67)
(0.65)
(0.60)
(0.58)
(0.47)
(0.44)
(0.40)
(0.39)
(0.41)
(0.47)
(0.52)
(0.54)
(0.57)
(0.52)
(0.47)
(0.37)
(0.32)
(0.23)
(0.30)
(0.50)
(0.63)
(0.93)
(0.97)
(1.09)
(1.27)
(1.50)
(1.17)
(1.02)
(0.90)
(0.43)
(0.69)
(0.72)
(0.83)
(0.96)
(1.16)
(1.37)
(1.29)
(1.31)
(1.42)
(1.32)
(1.35)
(1.22)
(1.07)
(0.92)
(0.83)
(0.71)
(0.57)
(0.29)
(0.17)
0.03
0.02
0.03
(0.01)
(0.15)
(0.22)
(0.27)
(0.22)
(0.20)
(0.32)
(0.35)
(0.44)
(0.46)
(0.37)
(0.41)
(0.37)
(0.25)
0.02
(0.10)
(0.36)
(0.58)
(0.50)
(0.41)
(0.11)
(0.13)
(0.13)
(0.01)
Adj. for2 for 1
5/ 15/ 00
Ind BIOTK P/ E N / AN asdaq Bond$222.8 M ils.Com 155.303 M ils.Book value 7.75P/ E 88.73Country U S
G rowth Performance M easurementYears Price Earn. D iv. Total Ret.Last 1 -40.6 -63.9 -- - -40.6Last 5 -23.0 -4.0 -- - -23.0
Last 10 6.0 -- - - - - 6.0Last 25 11.2 -- - - - - 11.2
Therapeutics and drug delivery systems
LEG EN DRead from Right Scale:PriceRelative Strength
Bottom Band VolumeM oving Avg (48 months)Recession (G rey Shaded Bars)
Read from Left Scale:EarningsD ividends
Charts are updated daily at www.SrcStockCharts.com.
41

ALLEG H AN Y C OR P D EL (Y)
Copyright 2019 Securities Research Company
'85 '86 '87 '88 '89 '90 '91 '92 '93 '94 '95 '96 '97 '98 '99 '00 '01 '02 '03 '04 '05 '06 '07 '08 '09 '10 '11 '12 '13 '14 '15 '16 '17 '18 '19 '20
4 1/ 2
5
5 1/ 26 6 1/ 27
8
9
10
11 12 13 14
16
18
20
22 24 26 28
32
36
40
44 48
55 60 65 70
80
90
100
110 120 130 140
160
180
200
220 240 260 280
320
360
400
440 480
600
700
800
900
1000
1100 1200 1300 1400
1600
1800
.30
.35
.40
.45
.50
.60
.70
.80
.90
1.0
1.5
2.0
2.5
3.0
3.5
4.0
4.5
5.0
5.56.06.5
7.5
8.5
9.5
12
14
16
18
20
25
30
35
40
45
50
60
70
80
90
100
110120130
300 300600 600900 900
1200 12001500 1500T
(1.09)
(0.94)
(4.06)
(9.14)
(3.76)
(5.19)
(3.53)
(1.35)
Adj. for2% SD3/ 27/ 90
Adj. for2% SD3/ 25/ 91
Adj. for2% SD3/ 26/ 92
Adj. for2% SD3/ 26/ 93
Adj. for2% SD3/ 26/ 94
Adj. for2% SD3/ 26/ 95
Adj. for2% SD3/ 29/ 96
Adj. for2% SD3/ 27/ 97
Adj. for2% SD3/ 30/ 99
Adj. for2% SD3/ 30/ 00
Adj. for2% SD3/ 29/ 01
Adj. for2% SD3/ 27/ 02
Adj. for2% SD3/ 28/ 03
Adj. for2% SD3/ 30/ 04
Adj. for2% SD3/ 30/ 05
Adj. for2% SD3/ 30/ 06
Adj. for2% SD3/ 29/ 07
Adj. for2% SD3/ 28/ 08
Adj. for2% SD3/ 30/ 09
Adj. for2% SD3/ 30/ 10
Adj. for2% SD3/ 30/ 11
Chicago Title & Trustmerged 6/ 20/ 85
Exchanged 1 sh. of newAlleghany Corp. & $27.84cash for each 1.54598 shs.
of Y 12/ 23/ 86
D ist. 1 sh. CyclopsIndus. for ea. 1.515
shs. Y 3/ 30/ 87
Ceilite Corp.acquired 7/ 19/ 91
D ist. 3 shs. Chicago Title Corp.for ea. 1.233 shs. Y 6/ 18/ 98
Transatlantic H oldings, Inc.acquired 3/ 5/ 12
Special$10.00
Ind REIN S P/ E N / AN YSE Bond $80.0 M ils.Com 14.937 M ils.Book value 512.98P/ E 31.16Country U S
G rowth Performance M easurementYears Price Earn. D iv. Total Ret.Last 1 24.9 62.3 .0 24.9Last 5 12.3 -9.3 .0 12.3
Last 10 12.1 3.7 .0 12.1Last 25 8.1 5.1 .0 8.1
F inancial services, steel products 90% SC ALE
LEG EN DRead from Right Scale:PriceRelative Strength
Bottom Band VolumeM oving Avg (48 months)Recession (G rey Shaded Bars)
Read from Left Scale:EarningsD ividends
Charts are updated daily at www.SrcStockCharts.com.
42

ALLEG H EN Y TEC H N OLOG IES IN C (ATI)
Copyright 2019 Securities Research Company
'85 '86 '87 '88 '89 '90 '91 '92 '93 '94 '95 '96 '97 '98 '99 '00 '01 '02 '03 '04 '05 '06 '07 '08 '09 '10 '11 '12 '13 '14 '15 '16 '17 '18 '19 '20
3/ 4
1
1 1/ 4
1 1/ 2
1 3/ 4
2
2 1/ 4
2 1/ 2
2 3/ 4
3
3 1/ 43 1/ 23 3/ 4
4 1/ 2
5
5 1/ 2
6
6 1/ 27 7 1/ 2
8 1/ 2
9 1/ 2
11
12
13 14 15
17
19
22
24 26 28 30
34
38
42
46
50
55
60
65 70 75
85
95
110
120
130 140 150
170
.05
.06
.07
.08
.09
.10
.20
.25
.30
.35
.40
.45
.50
.60
.70
.80
.90
1.0
1.5
2.0
2.5
3.0
3.5
4.0
4.5
5.0
5.5
6.06.57.07.5
8.5
9.5
12
25 2550 5075 75
100 100125 125M
(0.11)
(0.24)
(0.40)
(1.00)
(1.23)
(1.49)
(1.39)
(1.70)
(1.55)
(1.14)
(0.36)
0.04
(0.22)
(0.48)
(0.45)
0.01
(0.17)
(0.91)
(1.58)
(1.64)
(1.56)
(1.04)
(0.30)
0.00
Adj. for3 for 27/ 3/ 90
Adj. for2 for 17/ 2/ 93
Adj. for1 for 2
11/ 29/ 99
D ividendomitted3/ 6/ 86
Special$4.66
Athlone Inds.merged 11/ 10/ 93
Teledyne Inc.merged 8/ 16/ 96
Alsopaid
$0.64
Allegheny Int'l.prior to 8/ 16/ 96
D ist. 1 sh. Teledyne Tech.for ea. 7 shs. & 1 sh.
Water P ik Tech. for ea.20 shs. ALT 11/ 29/ 99
Oregon M etallurgicalacq. 3/ 24/ 98
Allegheny Teledyne Inc.prior to 11/ 29/ 99
Ladish Co.acquired 5/ 9/ 11
Ind STEEL P/ E N / AN YSE Bond$529.9 M ils.Com 125.684 M ils.Book value 12.44P/ E 15.67Country U S
G rowth Performance M easurementYears Price Earn. D iv. Total Ret.Last 1 -33.6 -23.7 .0 -33.6Last 5 -8.6 33.9 -15.0 -7.8
Last 10 -7.8 6.0 -7.8 -5.7Last 25 -3.0 9.5 -4.3 - .5
Specialty metals, materials, and finished products
LEG EN DRead from Right Scale:PriceRelative Strength
Bottom Band VolumeM oving Avg (48 months)Recession (G rey Shaded Bars)
Read from Left Scale:EarningsD ividends
Charts are updated daily at www.SrcStockCharts.com.
43

ALLER G AN P LC (AG N )
Copyright 2019 Securities Research Company
'85 '86 '87 '88 '89 '90 '91 '92 '93 '94 '95 '96 '97 '98 '99 '00 '01 '02 '03 '04 '05 '06 '07 '08 '09 '10 '11 '12 '13 '14 '15 '16 '17 '18 '19 '20
2 1/ 4
2 1/ 2
2 3/ 4
3
3 1/ 43 1/ 23 3/ 4
4 1/ 2
5
5 1/ 2
6 6 1/ 27 7 1/ 2
8 1/ 2
9 1/ 2
11
12 13 14 15
17
19
22
24 26 28 30
34
38
42
46
50
55
60 65 70 75
85
95
110
120 130 140 150
170
190
220
240 260 280 300
340
380
420
460
500
.20
.25
.30
.35
.40
.45
.50
.60
.70
.80
.90
1.0
1.5
2.0
2.5
3.0
3.5
4.0
4.5
5.0
5.5
6.0
6.57.07.5
8.5
9.5
12
14
16
18
20
25
30
35
40 4080 80
120 120160 160200 200M
0.06
0.09
0.10
0.09
0.13
Adj. for2 for 1
10/ 30/ 97
Circa Pharm.acq. 7/ 17/ 95
Royce Labsmerged 4/ 16/ 97
Listed N YSE 9/ 17/ 97
OTC prior
Circa Pharmaceuticalsacquired 7/ 17/ 97
Andrx Corpacquired 11/ 6/ 06
Watson Pharmaceuticals Incprior to 1/ 24/ 13
F orest Labs, Inc.acquired 7/ 1/ 14
F uriex Pharmaceuticals, Inc.acquired 7/ 2/ 14
D urata Therapeuticsacquired 11/ 17/ 14
Actavis PLCprior to mergerwith Allergan
6/ 17/ 15
To be acquired byAbbVie
Ind D RU G S P/ E N / AN YSE Bond$1124.1 M ils.Com 339.444 M ils.Book value 197.91P/ E 11.48Country U S
G rowth Performance M easurementYears Price Earn. D iv. Total Ret.Last 1 33.2 .1 2.8 35.3Last 5 -6.4 3.6 -- - -5.5
Last 10 17.5 20.0 -- - 18.0Last 25 11.6 14.8 -- - 11.8
E Pharmaceuticals and drug delivery systems
LEG EN DRead from Right Scale:PriceRelative Strength
Bottom Band VolumeM oving Avg (48 months)Recession (G rey Shaded Bars)
Read from Left Scale:EarningsD ividends
Charts are updated daily at www.SrcStockCharts.com.
44

ALLETE IN C OR POR ATED (ALE)
Copyright 2019 Securities Research Company
'85 '86 '87 '88 '89 '90 '91 '92 '93 '94 '95 '96 '97 '98 '99 '00 '01 '02 '03 '04 '05 '06 '07 '08 '09 '10 '11 '12 '13 '14 '15 '16 '17 '18 '19 '20
2 1/ 4
2 1/ 2
2 3/ 4
3
3 1/ 43 1/ 23 3/ 4
4 1/ 2
5
5 1/ 2
6 6 1/ 27 7 1/ 2
8 1/ 2
9 1/ 2
11
12 13 14 15
17
19
22
24 26 28 30
34
38
42
46
50
55
60 65 70 75
85
95
110
120 130 140 150
170
190
220
240 260 280 300
340
380
420
460
500
.20
.25
.30
.35
.40
.45
.50
.60
.70
.80
.90
1.0
1.5
2.0
2.5
3.0
3.5
4.0
4.5
5.0
5.5
6.0
6.57.07.5
8.5
9.5
12
14
16
18
20
25
30
35
4 48 8
12 1216 1620 20M
M innesota Power & Lightprior to 5/ 27/ 98
M innesota Powerprior to 9/ 1/ 00
D ist. 1 sh. AD ESA, Inc.for ea. .333 sh. ALE
9/ 20/ 04
Ind EU TIL P/ E N / AN YSE Bond$359.8 M ils.Com 51.361 M ils.Book value 38.61P/ E 21.85Country U S
G rowth Performance M easurementYears Price Earn. D iv. Total Ret.Last 1 5.1 10.8 4.9 8.1Last 5 7.4 5.0 3.7 10.1
Last 10 10.0 6.7 2.9 12.4Last 25 3.0 .7 -1.0 5.3
Electric, gas, and water services; auto auctions
LEG EN DRead from Right Scale:PriceRelative Strength
Bottom Band VolumeM oving Avg (48 months)Recession (G rey Shaded Bars)
Read from Left Scale:EarningsD ividends
Charts are updated daily at www.SrcStockCharts.com.
45

ALLIAN C EBER N STEIN H OLD IN G LP (AB)
Copyright 2019 Securities Research Company
'85 '86 '87 '88 '89 '90 '91 '92 '93 '94 '95 '96 '97 '98 '99 '00 '01 '02 '03 '04 '05 '06 '07 '08 '09 '10 '11 '12 '13 '14 '15 '16 '17 '18 '19 '20
1
1 1/ 4
1 1/ 2
1 3/ 4
2
2 1/ 4
2 1/ 2
2 3/ 4
3 3 1/ 43 1/ 23 3/ 4
4 1/ 2
5
5 1/ 2
6
6 1/ 27 7 1/ 2
8 1/ 2
9 1/ 2
11
12
13 14 15
17
19
22
24
26 28 30
34
38
42
46
50
55
60
65 70 75
85
95
110
120
130 140 150
170
190
.06
.07
.08
.09
.10
.20
.25
.30
.35
.40
.45
.50
.60
.70
.80
.90
1.0
1.5
2.0
2.5
3.0
3.5
4.0
4.5
5.0
5.5
6.06.57.07.5
8.5
9.5
12
5 510 1015 1520 2025 25M
Adj. for2 for 1
3/ 16/ 93
Adj. for2 for 14/ 3/ 98
Alliance Capital M gmtL.P . prior to 10/ 30/ 99
Alliance Capital mgmt.prior to 2/ 27/ 06
Ind ASM G T P/ E N / AN YSE Bond$334.9 M ils.Com 98.029 M ils.Book value 15.93P/ E 13.74Country U S
G rowth Performance M easurementYears Price Earn. D iv. Total Ret.Last 1 4.6 -13.4 -8.7 12.2Last 5 5.7 4.5 7.0 12.2
Last 10 2.2 1.8 5.8 6.9Last 25 5.4 4.1 4.6 9.7
Investment and cash management services, mutual funds
LEG EN DRead from Right Scale:PriceRelative Strength
Bottom Band VolumeM oving Avg (48 months)Recession (G rey Shaded Bars)
Read from Left Scale:EarningsD ividends
Charts are updated daily at www.SrcStockCharts.com.
46

ALLIAN T EN ER G Y C OR POR ATION (LN T)
Copyright 2019 Securities Research Company
'85 '86 '87 '88 '89 '90 '91 '92 '93 '94 '95 '96 '97 '98 '99 '00 '01 '02 '03 '04 '05 '06 '07 '08 '09 '10 '11 '12 '13 '14 '15 '16 '17 '18 '19 '20
1
1 1/ 4
1 1/ 2
1 3/ 4
2
2 1/ 4
2 1/ 2
2 3/ 4
3 3 1/ 43 1/ 23 3/ 4
4 1/ 2
5
5 1/ 2
6
6 1/ 27 7 1/ 2
8 1/ 2
9 1/ 2
11
12
13 14 15
17
19
22
24
26 28 30
34
38
42
46
50
55
60
65 70 75
85
95
110
120
130 140 150
170
190
.06
.07
.08
.09
.10
.20
.25
.30
.35
.40
.45
.50
.60
.70
.80
.90
1.0
1.5
2.0
2.5
3.0
3.5
4.0
4.5
5.0
5.5
6.06.57.07.5
8.5
9.5
12
10 1020 2030 3040 4050 50M
Adj. for2 for 19/ 26/ 88
Adj. for2 for 15/ 20/ 16
Wisconsin Power & Light prior to 2/ 15/ 88
Interstate Power Co.&
IES Inds. Inc.merged 1998
WPL H oldingsprior to 4/ 21/ 98
Interstate Energy Cp.(Wisc)prior to 5/ 19/ 99
Special$0.0005
Ind M U TIL P/ E N / AN YSE Bond$1323.3 M ils.Com 233.773 M ils.Book value 17.12P/ E 24.70Country U S
G rowth Performance M easurementYears Price Earn. D iv. Total Ret.Last 1 23.8 3.2 6.0 27.0Last 5 9.9 5.1 6.8 12.3
Last 10 13.4 9.0 6.6 15.5Last 25 5.4 3.0 1.6 6.9
Provides electric energy, natural gas and water
LEG EN DRead from Right Scale:PriceRelative Strength
Bottom Band VolumeM oving Avg (48 months)Recession (G rey Shaded Bars)
Read from Left Scale:EarningsD ividends
Charts are updated daily at www.SrcStockCharts.com.
47

ALLSTATE C OR P (ALL)
Copyright 2019 Securities Research Company
'85 '86 '87 '88 '89 '90 '91 '92 '93 '94 '95 '96 '97 '98 '99 '00 '01 '02 '03 '04 '05 '06 '07 '08 '09 '10 '11 '12 '13 '14 '15 '16 '17 '18 '19 '20
1 1/ 4
1 1/ 2
1 3/ 4
2
2 1/ 4
2 1/ 2
2 3/ 4
3 3 1/ 43 1/ 23 3/ 4
4 1/ 2
5
5 1/ 2
6 6 1/ 27 7 1/ 2
8 1/ 2
9 1/ 2
11
12 13 14 15
17
19
22
24 26 28 30
34
38
42
46
50
55
60 65 70 75
85
95
110
120 130 140 150
170
190
220
240 260
.08
.09
.10
.20
.25
.30
.35
.40
.45
.50
.60
.70
.80
.90
1.0
1.5
2.0
2.5
3.0
3.5
4.0
4.5
5.0
5.5
6.0
6.57.07.5
8.5
9.5
12
14
16
40 4080 80
120 120160 160200 200M
(0.70)
(0.67)
(0.52)
Adj. for2 for 17/ 2/ 98
Extra$0.24
Ind IN SPC P/ E N / AN YSE Bond $4.7 M ils.Com 346.232 M ils.Book value 52.71P/ E 13.25Country U S
G rowth Performance M easurementYears Price Earn. D iv. Total Ret.Last 1 29.1 6.6 8.7 31.3Last 5 10.2 9.6 12.3 11.6
Last 10 14.3 9.4 9.6 15.4Last 25 9.4 13.0 7.1 10.3
Large property- liability and life insurer
LEG EN DRead from Right Scale:PriceRelative Strength
Bottom Band VolumeM oving Avg (48 months)Recession (G rey Shaded Bars)
Read from Left Scale:EarningsD ividends
Charts are updated daily at www.SrcStockCharts.com.
48

ALTR IA G R OU P IN C (M O)
Copyright 2019 Securities Research Company
'85 '86 '87 '88 '89 '90 '91 '92 '93 '94 '95 '96 '97 '98 '99 '00 '01 '02 '03 '04 '05 '06 '07 '08 '09 '10 '11 '12 '13 '14 '15 '16 '17 '18 '19 '20
1
1 1/ 4
1 1/ 2
1 3/ 4
2
2 1/ 4
2 1/ 2
2 3/ 4
3 3 1/ 43 1/ 23 3/ 4
4 1/ 2
5
5 1/ 2
6
6 1/ 27 7 1/ 2
8 1/ 2
9 1/ 2
11
12
13 14 15
17
19
22
24
26 28 30
34
38
42
46
50
55
60
65 70 75
85
95
110
120
130 140 150
170
190
.06
.07
.08
.09
.10
.20
.25
.30
.35
.40
.45
.50
.60
.70
.80
.90
1.0
1.5
2.0
2.5
3.0
3.5
4.0
4.5
5.0
5.5
6.06.57.07.5
8.5
9.5
12
100 100200 200300 300400 400500 500M
Adj. for2 for 14/ 11/ 86
Adj. for4 for 1
10/ 11/ 89
Adj. for3 for 1
4/ 11/ 97
G eneral F oodsacquired 11/ 1/ 85
Kraftacq. 12/ 17/ 88
Carolina H ldg. AGacq. 8/ 16/ 90
F reia M arabou AGacq. 4/ 93
Philip M orrisprior to1/ 27/ 03
D ist. 0.69 shs. Kraft F oodsfor ea. sh. M o held
3/ 30/ 07
D ist. 1 sh. Philip M orris Int'l.for ea. sh. M O
3/ 28/ 08
U ST Inc.acquired 1/ 5/ 09
Ind TBACO P/ E N / AN YSE Bond$6740.0 M ils.Com 1885.175 M ils.Book value 6.69P/ E 12.13Country U S
G rowth Performance M easurementYears Price Earn. D iv. Total Ret.Last 1 1.8 3.8 5.0 8.3Last 5 -1.1 10.0 10.1 3.6
Last 10 9.7 8.9 9.5 13.7Last 25 3.8 3.3 4.6 6.8
Philip M orris U SA Inc., John M iddleton, Inc.,SABM iller
LEG EN DRead from Right Scale:PriceRelative Strength
Bottom Band VolumeM oving Avg (48 months)Recession (G rey Shaded Bars)
Read from Left Scale:EarningsD ividends
Charts are updated daily at www.SrcStockCharts.com.
49

AM AG PH AR M AC EU TIC ALS IN C (AM AG )
Copyright 2019 Securities Research Company
'85 '86 '87 '88 '89 '90 '91 '92 '93 '94 '95 '96 '97 '98 '99 '00 '01 '02 '03 '04 '05 '06 '07 '08 '09 '10 '11 '12 '13 '14 '15 '16 '17 '18 '19 '20
3/ 4
1
1 1/ 4
1 1/ 2
1 3/ 4
2
2 1/ 4
2 1/ 2
2 3/ 4
3 3 1/ 43 1/ 2
4
4 1/ 2
5
5 1/ 2
6 6 1/ 27
8
9
10
11
12 13 14
16
18
20
22
24 26 28
32
36
40
44
48
55
60 65 70
80
90
100
110
120 130 140
160
.04
.05
.06
.07
.08
.09
.10
.20
.25
.30
.35
.40
.45
.50
.60
.70
.80
.90
1.0
1.5
2.0
2.5
3.0
3.5
4.0
4.5
5.0
5.5
6.06.57.0
8.0
9.0
10
10 1020 2030 3040 4050 50M
(0.70)
(0.36)
(0.27)
(0.16)
(0.64)
(0.87)
(1.43)
(0.52)
(0.32)
0.02
(0.79)
(0.80)
(0.94)
(0.94)
(1.08)
(1.03)
(1.16)
(1.05)
(0.87)
(0.90)
(0.64)
(0.64)
(0.51)
(0.28)
(0.08) (0.02)
(0.18)
(0.06)
(0.12)
(0.57)
(0.77)
(1.12)
(1.40)
(1.48)
(1.59)
(1.67)
(1.86)
(2.28)
(2.45)
(2.67)
(2.56)
(2.20)
(2.17)
(2.00)
(2.54)
(3.51)
(4.22)
(5.22)
(5.77)
(5.67)
(5.46)
(5.06)
(4.52)
(4.04)
(3.81)
(3.71)
(3.62)
(3.50)
(3.36)
(2.89)
(1.78)
(1.25)
(0.69)
(0.30)
(0.61)
(0.46)
(0.49)
(0.63)
(0.58)
(0.51)
(0.30) (3.95)
(4.65)
(4.21)
(4.50)
(3.04)
Adj. for3 for 2
9/ 26/ 91
Listed N ASD AQ 6/ 27/ 06
ASE prior
Advanced M agnetics Inc.prior to 7/ 24/ 07
Ind LFSCT P/ E N / AN asdaq Bond $.0 M ils.Com 34.473 M ils.Book value 34.10P/ E N / ACountry U S
G rowth Performance M easurementYears Price Earn. D iv. Total Ret.Last 1 -29.6 34.6 -- - -29.6Last 5 -23.6 -58.9 -- - -23.6
Last 10 -12.5 5.7 -- - -12.5Last 25 -1.1 -10.2 -- - -1.1
D eveloper of superparamagnetic iron oxide nanoparticles used in drugs 95% SC ALE
LEG EN DRead from Right Scale:PriceRelative Strength
Bottom Band VolumeM oving Avg (48 months)Recession (G rey Shaded Bars)
Read from Left Scale:EarningsD ividends
Charts are updated daily at www.SrcStockCharts.com.
50

AM AR IN C OR P P LC (AM R N )
Copyright 2019 Securities Research Company
'85 '86 '87 '88 '89 '90 '91 '92 '93 '94 '95 '96 '97 '98 '99 '00 '01 '02 '03 '04 '05 '06 '07 '08 '09 '10 '11 '12 '13 '14 '15 '16 '17 '18 '19 '20
1/ 4
1/ 2
3/ 4
1
1 1/ 4
1 1/ 2
1 3/ 42
2 1/ 2
3
3 1/ 24
5
6
7 8
9 1/ 2
11
13 15 17
20
24
28 32
38
44 50
60
70 80
95
110
130 150 170
200
240
280 320
380
440 500
600
700 800
1000
1200
1400 1600
1900
2200
2600 3000
.01
.02
.03
.04
.05
.06
.07
.08
.10
.20
.25
.30
.35
.40
.50
.60
.70
.80
1.0
1.5
2.0
2.5
3.0
3.54.0
5.0
6.0
7.08.0
9.5
12
1416
20
25
30
3540
50
60
7080
100
120
140160
190
100 100200 200300 300400 400500 500M
0.00
(0.50)
(0.20)
(5.40)
(9.10)
(7.30)
(13.40)
(11.30)
(8.70)
(7.50)
(4.60)
(4.10)
(4.40)
(4.10)
(4.00)
(3.50)
(3.50)
(3.30)
(3.50)
(4.40)
(4.10)
(4.02)
(3.61)
(1.90)
(0.91)
(1.40)
(2.49)
(2.25)
(3.44)
(2.55)
(0.72)
(0.96)
(0.46)
(0.86)
(1.15)
(1.31)
(1.30)
(1.44)
(1.19)
(0.97)
(0.85)
(0.54)
(0.54)
(0.55)
(0.56)
(0.55)
(0.53)
(0.45)
(0.39)
(0.39)
(0.33)
(0.31)
(0.27)
(0.34)
(0.34)
(0.41)
(0.45)
(0.39)
(0.38)
(0.27)
(0.20)
Adj. for1 for 1010/ 19/ 98
Adj. for1 for 101/ 18/ 08
Ind D RU G S P/ E N / AN asdaq Bond $.0 M ils.Com 329.167 M ils.Book value -1.31P/ E N / ACountry Ireland
G rowth Performance M easurementYears Price Earn. D iv. Total Ret.Last 1 8.3 48.7 -- - 8.3Last 5 79.4 18.0 -- - 79.4
Last 10 32.3 17.7 -- - 32.3Last 25 -13.0 -- - - - - -13.0
P E AD R - Focused on the development of new drugs for rare disease 55% SC ALE
LEG EN DRead from Right Scale:PriceRelative Strength
Bottom Band VolumeM oving Avg (48 months)Recession (G rey Shaded Bars)
Read from Left Scale:EarningsD ividends
Charts are updated daily at www.SrcStockCharts.com.
51
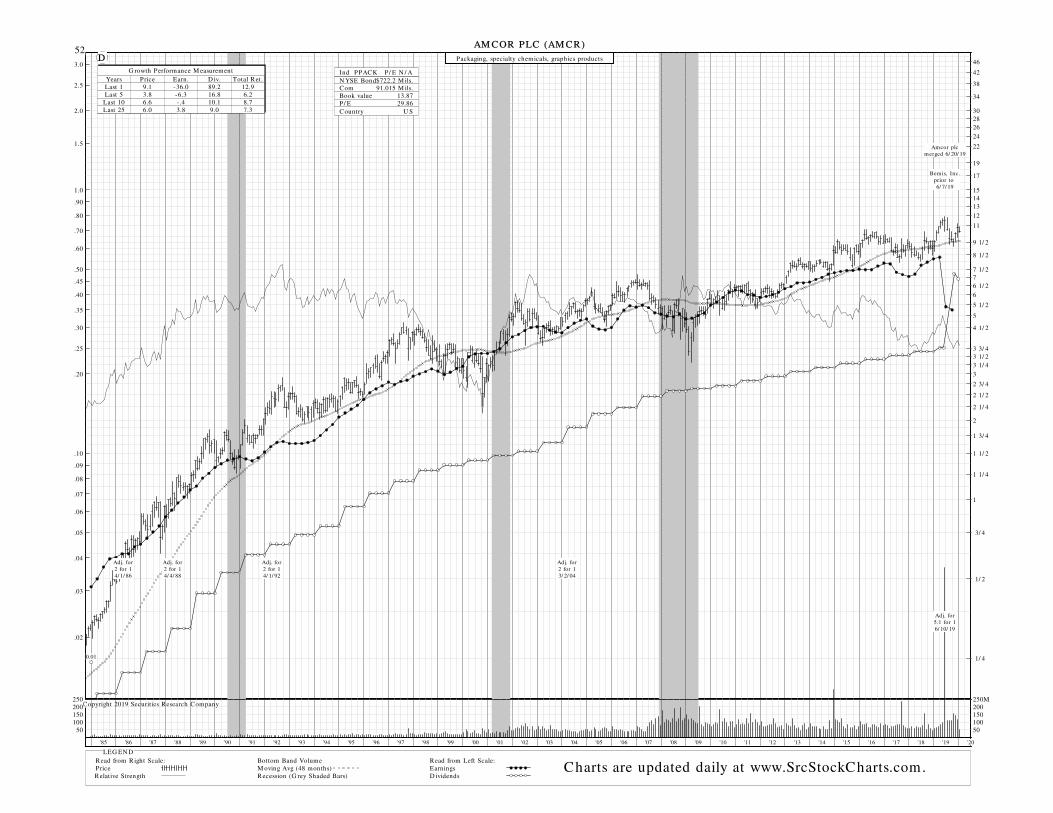
AM C OR P LC (AM C R )
Copyright 2019 Securities Research Company
'85 '86 '87 '88 '89 '90 '91 '92 '93 '94 '95 '96 '97 '98 '99 '00 '01 '02 '03 '04 '05 '06 '07 '08 '09 '10 '11 '12 '13 '14 '15 '16 '17 '18 '19 '20
1/ 4
1/ 2
3/ 4
1
1 1/ 4
1 1/ 2
1 3/ 4
2
2 1/ 4
2 1/ 2
2 3/ 4
3 3 1/ 43 1/ 23 3/ 4
4 1/ 2
5
5 1/ 2
6 6 1/ 27 7 1/ 2
8 1/ 2
9 1/ 2
11
12
13 14 15
17
19
22
24 26 28 30
34
38
42
46
.02
.03
.04
.05
.06
.07
.08
.09
.10
.20
.25
.30
.35
.40
.45
.50
.60
.70
.80
.90
1.0
1.5
2.0
2.5
3.0
50 50100 100150 150200 200250 250M
0.01
Adj. for2 for 14/ 1/ 86
Adj. for2 for 14/ 4/ 88
Adj. for2 for 14/ 1/ 92
Adj. for2 for 13/ 2/ 04
Adj. for5.1 for 16/ 10/ 19
Bemis, Inc.prior to 6/ 7/ 19
Amcor plcmerged 6/ 20/ 19
Ind PPACK P/ E N / AN YSE Bond$722.2 M ils.Com 91.015 M ils.Book value 13.87P/ E 29.86Country U S
G rowth Performance M easurementYears Price Earn. D iv. Total Ret.Last 1 9.1 -36.0 89.2 12.9Last 5 3.8 -6.3 16.8 6.2
Last 10 6.6 - .4 10.1 8.7Last 25 6.0 3.8 9.0 7.3
D Packaging, specialty chemicals, graphics products
LEG EN DRead from Right Scale:PriceRelative Strength
Bottom Band VolumeM oving Avg (48 months)Recession (G rey Shaded Bars)
Read from Left Scale:EarningsD ividends
Charts are updated daily at www.SrcStockCharts.com.
52

AM ER EN C OR POR ATION (AEE)
Copyright 2019 Securities Research Company
'85 '86 '87 '88 '89 '90 '91 '92 '93 '94 '95 '96 '97 '98 '99 '00 '01 '02 '03 '04 '05 '06 '07 '08 '09 '10 '11 '12 '13 '14 '15 '16 '17 '18 '19 '20
2 1/ 4
2 1/ 2
2 3/ 4
3
3 1/ 43 1/ 23 3/ 4
4 1/ 2
5
5 1/ 2
6 6 1/ 27 7 1/ 2
8 1/ 2
9 1/ 2
11
12 13 14 15
17
19
22
24 26 28 30
34
38
42
46
50
55
60 65 70 75
85
95
110
120 130 140 150
170
190
220
240 260 280 300
340
380
420
460
500
.20
.25
.30
.35
.40
.45
.50
.60
.70
.80
.90
1.0
1.5
2.0
2.5
3.0
3.5
4.0
4.5
5.0
5.5
6.0
6.57.07.5
8.5
9.5
12
14
16
18
20
25
30
35
8 816 1624 2432 3240 40M
U nion Electric Co.& CIPSCO, Inc.
merged to form Ameren Corp.12/ 31/ 97
U nion Electric Co.prior to 1/ 2/ 98
Ind M U TIL P/ E N / AN YSE Bond$5285.0 M ils.Com 244.040 M ils.Book value 29.26P/ E 28.00Country U S
G rowth Performance M easurementYears Price Earn. D iv. Total Ret.Last 1 11.1 -18.4 4.2 13.8Last 5 11.2 2.7 3.8 13.7
Last 10 11.7 - .3 2.5 13.9Last 25 3.0 - .4 - .8 5.2
Electric utility based in St. Louis
LEG EN DRead from Right Scale:PriceRelative Strength
Bottom Band VolumeM oving Avg (48 months)Recession (G rey Shaded Bars)
Read from Left Scale:EarningsD ividends
Charts are updated daily at www.SrcStockCharts.com.
53

AM ER IC AN ELEC TR IC POWER C OM PAN Y, IN C OR POR ATED (AEP)
Copyright 2019 Securities Research Company
'85 '86 '87 '88 '89 '90 '91 '92 '93 '94 '95 '96 '97 '98 '99 '00 '01 '02 '03 '04 '05 '06 '07 '08 '09 '10 '11 '12 '13 '14 '15 '16 '17 '18 '19 '20
2 1/ 4
2 1/ 2
2 3/ 4
3
3 1/ 43 1/ 23 3/ 4
4 1/ 2
5
5 1/ 2
6 6 1/ 27 7 1/ 2
8 1/ 2
9 1/ 2
11
12 13 14 15
17
19
22
24 26 28 30
34
38
42
46
50
55
60 65 70 75
85
95
110
120 130 140 150
170
190
220
240 260 280 300
340
380
420
460
500
.20
.25
.30
.35
.40
.45
.50
.60
.70
.80
.90
1.0
1.5
2.0
2.5
3.0
3.5
4.0
4.5
5.0
5.5
6.0
6.57.07.5
8.5
9.5
12
14
16
18
20
25
30
35
15 1530 3045 4560 6075 75M
Special$0.05
Ind EU TIL P/ E N / AN YSE Bond$12429.0 M ils.Com 492.934 M ils.Book value 38.48P/ E 21.59Country U S
G rowth Performance M easurementYears Price Earn. D iv. Total Ret.Last 1 19.2 10.6 4.5 22.7Last 5 8.5 4.9 5.7 11.1
Last 10 10.5 3.8 5.5 12.8Last 25 4.0 1.9 .6 5.9
Integrated electric utility company
LEG EN DRead from Right Scale:PriceRelative Strength
Bottom Band VolumeM oving Avg (48 months)Recession (G rey Shaded Bars)
Read from Left Scale:EarningsD ividends
Charts are updated daily at www.SrcStockCharts.com.
54

AM ER IC AN EXPR ESS C O (AXP)
Copyright 2019 Securities Research Company
'85 '86 '87 '88 '89 '90 '91 '92 '93 '94 '95 '96 '97 '98 '99 '00 '01 '02 '03 '04 '05 '06 '07 '08 '09 '10 '11 '12 '13 '14 '15 '16 '17 '18 '19 '20
1 1/ 4
1 1/ 2
1 3/ 4
2
2 1/ 4
2 1/ 2
2 3/ 4
3 3 1/ 43 1/ 23 3/ 4
4 1/ 2
5
5 1/ 2
6 6 1/ 27 7 1/ 2
8 1/ 2
9 1/ 2
11
12 13 14 15
17
19
22
24 26 28 30
34
38
42
46
50
55
60 65 70 75
85
95
110
120 130 140 150
170
190
220
240 260
.08
.09
.10
.20
.25
.30
.35
.40
.45
.50
.60
.70
.80
.90
1.0
1.5
2.0
2.5
3.0
3.5
4.0
4.5
5.0
5.5
6.0
6.57.07.5
8.5
9.5
12
14
16
200 200400 400600 600800 800
1000 1000M
Adj. for2 for 15/ 11/ 87
Adj. for3 for 1
5/ 11/ 00
Warner Amax Cablesold 4/ 16/ 86
D ist. 1/ 5 com. sh. LehmanBros. H ldg. Svc. for ea.
3 com. shs. AXP 5/ 30/ 94
D ist. 1 sh. Ameriprise F inancialfor ea. 5 shs. AXP held 9/ 19/ 05
Ind F IN AN P/ E N / AN YSE Bond $42.7 M ils.Com 861.054 M ils.Book value 23.70P/ E 16.11Country U S
G rowth Performance M easurementYears Price Earn. D iv. Total Ret.Last 1 23.9 7.9 10.3 25.5Last 5 9.5 8.2 10.6 10.7
Last 10 13.0 18.7 9.1 13.9Last 25 10.5 9.1 7.2 11.1
E Travel and investment services, international banking, insurance
LEG EN DRead from Right Scale:PriceRelative Strength
Bottom Band VolumeM oving Avg (48 months)Recession (G rey Shaded Bars)
Read from Left Scale:EarningsD ividends
Charts are updated daily at www.SrcStockCharts.com.
55

AM ER IC AN F IN AN C IAL G R OU P (AF G )
Copyright 2019 Securities Research Company
'85 '86 '87 '88 '89 '90 '91 '92 '93 '94 '95 '96 '97 '98 '99 '00 '01 '02 '03 '04 '05 '06 '07 '08 '09 '10 '11 '12 '13 '14 '15 '16 '17 '18 '19 '20
1
1 1/ 4
1 1/ 2
1 3/ 4
2
2 1/ 4
2 1/ 2
2 3/ 4
3 3 1/ 43 1/ 23 3/ 4
4 1/ 2
5
5 1/ 2
6
6 1/ 27 7 1/ 2
8 1/ 2
9 1/ 2
11
12
13 14 15
17
19
22
24
26 28 30
34
38
42
46
50
55
60
65 70 75
85
95
110
120
130 140 150
170
190
.06
.07
.08
.09
.10
.20
.25
.30
.35
.40
.45
.50
.60
.70
.80
.90
1.0
1.5
2.0
2.5
3.0
3.5
4.0
4.5
5.0
5.5
6.06.57.07.5
8.5
9.5
12
4 48 8
12 1216 1620 20M
0.01
0.02
0.02
Adj. for2 for 1
3/ 14/ 88
Adj. for3 for 2
12/ 18/ 06
D ist. 1 sh. Sprague Tech.for ea. 6 shs. AF G 8/ 12/ 87
Penn Central Corp.prior to 3/ 25/ 94
D ist. 1 sh. G en.Cable for ea. 6 shs. AF G 7/ 1/ 92
Amer. PremierU nderwriters
prior to 3/ 23/ 95
Amer. F inancialmerged 4/ 4/ 95
Amer. Premier G pprior to 6/ 12/ 95
G reat American F inabcial Resources Inc.
acquired 9/ 28/ 07
Special$0.25
Special$1.00
Special1.00
Special$1.00
Special$1.00
Specials$3.50
Special$1.50
Specials$3.30
Ind IN SM L P/ E N / AN YSE Bond$921.0 M ils.Com 89.088 M ils.Book value 58.75P/ E 13.47Country U S
G rowth Performance M easurementYears Price Earn. D iv. Total Ret.Last 1 15.0 -3.1 12.5 16.7Last 5 13.6 11.0 12.5 14.9
Last 10 16.0 6.8 13.2 17.1Last 25 7.8 29.2 4.6 8.5
D Property and casualty insurance
LEG EN DRead from Right Scale:PriceRelative Strength
Bottom Band VolumeM oving Avg (48 months)Recession (G rey Shaded Bars)
Read from Left Scale:EarningsD ividends
Charts are updated daily at www.SrcStockCharts.com.
56

AM ER IC AN IN TER N ATION AL G R OU P, IN C . (AIG )
Copyright 2019 Securities Research Company
'85 '86 '87 '88 '89 '90 '91 '92 '93 '94 '95 '96 '97 '98 '99 '00 '01 '02 '03 '04 '05 '06 '07 '08 '09 '10 '11 '12 '13 '14 '15 '16 '17 '18 '19 '20
1/ 2
3/ 4
1
1 1/ 4
1 1/ 2
1 3/ 4
2 2 1/ 42 1/ 2
3
3 1/ 2
4 4 1/ 25
6
7
8 9 10
12
14
16 18 20
24
28
32 36 40
46
55
65
75
85 95
110
130
150
170 190
220
260
300
340 380
440
500
600
700
800 900 1000
1200
1400
1600 1800 2000
2400
.04
.05
.06
.07
.08
.09
.10
.20
.25
.30
.35
.40
.45
.50
.60
.70
.80
.901.0
1.5
2.0
2.5
3.0
3.5
4.04.55.0
6.0
7.0
8.09.010
12
14
161820
25
30
35
404550
60
70
8090
100
120
140
160
1 12 23 34 45 5B
(34.60)
(131.80)
(390.20)
(381.00)
(369.00)
(297.00)
(67.21)
(46.60)
(47.18)
(26.99) (13.18) (1.28)
Adj. for2 for 1
11/ 18/ 86
Adj. for3 for 27/ 30/ 93
Adj. for3 for 27/ 31/ 95
Adj. for3 for 27/ 28/ 97
Adj. for3 for 28/ 3/ 98
Adj. for5 for 48/ 2/ 99
Adj. for3 for 27/ 31/ 00
Adj. for1 for 206/ 30/ 09
ListedN YSE 10/ 10/ 84
OTC prior
M ascotech acquired11/ 30/ 00
American G eneral Cp.acquired 8/ 29/ 01
21st. Century Insurance G roupacq. 9/ 28/ 07
D ividend Omitted9/ 23/ 08
Ind IN SM L P/ E N / AN YSE Bond$134.2 M ils.Com 888.446 M ils.Book value 74.77P/ E 17.70Country U S
G rowth Performance M easurementYears Price Earn. D iv. Total Ret.Last 1 20.4 230.3 .0 23.3Last 5 1.3 -8.5 20.7 3.5
Last 10 7.9 -- - -23.1 9.2Last 25 -7.1 -7.6 - .5 -3.4
Insurance and financial services 65% SC ALE
LEG EN DRead from Right Scale:PriceRelative Strength
Bottom Band VolumeM oving Avg (48 months)Recession (G rey Shaded Bars)
Read from Left Scale:EarningsD ividends
Charts are updated daily at www.SrcStockCharts.com.
57

AM ER IC AN N ATION AL IN SU R AN C E C OM PAN Y (AN AT)
Copyright 2019 Securities Research Company
'85 '86 '87 '88 '89 '90 '91 '92 '93 '94 '95 '96 '97 '98 '99 '00 '01 '02 '03 '04 '05 '06 '07 '08 '09 '10 '11 '12 '13 '14 '15 '16 '17 '18 '19 '20
3 1/ 43 1/ 23 3/ 4
4 1/ 2
5
5 1/ 2
6 6 1/ 27 7 1/ 2
8 1/ 2
9 1/ 2
11
12 13 14 15
17
19
22
24
26 28 30
34
38
42
46
50
55
60 65 70 75
85
95
110
120 130 140 150
170
190
220
240
260 280 300
340
380
420
460
500
600
700
.25
.30
.35
.40
.45
.50
.60
.70
.80
.90
1.0
1.5
2.0
2.5
3.0
3.5
4.0
4.5
5.0
5.5
6.06.57.07.5
8.5
9.5
12
14
16
18
20
25
30
35
40
45
50
200 200400 400600 600800 800
1000 1000T
Ind IN SM L P/ E N / AN asdaq Bond $.0 M ils.Com 26.885 M ils.Book value 167.47P/ E 13.04Country U S
G rowth Performance M easurementYears Price Earn. D iv. Total Ret.Last 1 -16.4 11.6 .0 -14.1Last 5 2.3 1.6 1.3 5.0
Last 10 .9 13.1 .6 3.4Last 25 3.7 .6 1.3 5.8
Offers life, accident, health, property and casualty insurance
LEG EN DRead from Right Scale:PriceRelative Strength
Bottom Band VolumeM oving Avg (48 months)Recession (G rey Shaded Bars)
Read from Left Scale:EarningsD ividends
Charts are updated daily at www.SrcStockCharts.com.
58

AM ER IC AN N ATL BAN KSH AR ES IN C (AM N B)
Copyright 2019 Securities Research Company
'85 '86 '87 '88 '89 '90 '91 '92 '93 '94 '95 '96 '97 '98 '99 '00 '01 '02 '03 '04 '05 '06 '07 '08 '09 '10 '11 '12 '13 '14 '15 '16 '17 '18 '19 '20
1 1/ 4
1 1/ 2
1 3/ 4
2
2 1/ 4
2 1/ 2
2 3/ 4
3 3 1/ 43 1/ 23 3/ 4
4 1/ 2
5
5 1/ 2
6 6 1/ 27 7 1/ 2
8 1/ 2
9 1/ 2
11
12 13 14 15
17
19
22
24 26 28 30
34
38
42
46
50
55
60 65 70 75
85
95
110
120 130 140 150
170
190
220
240 260
.08
.09
.10
.20
.25
.30
.35
.40
.45
.50
.60
.70
.80
.90
1.0
1.5
2.0
2.5
3.0
3.5
4.0
4.5
5.0
5.5
6.0
6.57.07.5
8.5
9.5
12
14
16
300 300600 600900 900
1200 12001500 1500T
Adj. for2 for 14/ 18/ 88
Adj. for2 for 1
5/ 22/ 92
Adj. for2 for 17/ 16/ 99
Ind RBAN K P/ E N / AN asdaq Bond$20.6 M ils.Com 8.714 M ils.Book value 23.60P/ E 18.79Country U S
G rowth Performance M easurementYears Price Earn. D iv. Total Ret.Last 1 16.7 -24.5 8.0 19.9Last 5 12.1 4.0 3.3 14.9
Last 10 7.3 6.1 1.6 9.7Last 25 -- - - - - - - - - - -
Bank holding company
LEG EN DRead from Right Scale:PriceRelative Strength
Bottom Band VolumeM oving Avg (48 months)Recession (G rey Shaded Bars)
Read from Left Scale:EarningsD ividends
Charts are updated daily at www.SrcStockCharts.com.
59

AM ER IC AN SOF TWAR E IN C (AM SWA)
Copyright 2019 Securities Research Company
'85 '86 '87 '88 '89 '90 '91 '92 '93 '94 '95 '96 '97 '98 '99 '00 '01 '02 '03 '04 '05 '06 '07 '08 '09 '10 '11 '12 '13 '14 '15 '16 '17 '18 '19 '20
1/ 4
1/ 2
3/ 4
1
1 1/ 4
1 1/ 2
1 3/ 4
2
2 1/ 4
2 1/ 2
2 3/ 4
3 3 1/ 43 1/ 23 3/ 4
4 1/ 2
5
5 1/ 2
6 6 1/ 27 7 1/ 2
8 1/ 2
9 1/ 2
11
12
13 14 15
17
19
22
24
26 28 30
34
38
.02
.03
.04
.05
.06
.07
.08
.09
.10
.20
.25
.30
.35
.40
.45
.50
.60
.70
.80
.90
1.0
1.5
2.0
2.5
3 36 69 9
12 1215 15M
(0.03)
(0.30)
(0.48)
(0.48)
(0.52)
(0.30)
(0.15)
(0.44)
(0.51)
(0.51)
(0.42)
(0.29)
(0.32)
(0.38)
(0.19)
(0.06)
(0.26)
(0.56)
(0.70)
(0.56)
(0.30)
Adj. for3 for 2
4/ 16/ 85
Adj. for3 for 24/ 1/ 87
Adj. for3 for 25/ 8/ 89
Adj. for3 for 2
7/ 24/ 90
Paid$0.024
Paid$0.024
Paid$0.058
Special$0.044
D ividendomitted
11/ 23/ 94
Extra$0.10
&Special$0.20
accelerated 2013
dividend
Ind APPSF P/ E N / AN asdaq Bond $.9 M ils.Com 29.085 M ils.Book value 3.37P/ E 67.55Country U S
G rowth Performance M easurementYears Price Earn. D iv. Total Ret.Last 1 34.4 -29.0 .0 38.3Last 5 12.4 -7.2 1.9 15.4
Last 10 10.5 1.0 2.0 13.0Last 25 6.6 -- - 1.3 8.0
Supply chain management software
LEG EN DRead from Right Scale:PriceRelative Strength
Bottom Band VolumeM oving Avg (48 months)Recession (G rey Shaded Bars)
Read from Left Scale:EarningsD ividends
Charts are updated daily at www.SrcStockCharts.com.
60

AM ER IC AN STATES WATER C OM PAN Y (AWR )
Copyright 2019 Securities Research Company
'85 '86 '87 '88 '89 '90 '91 '92 '93 '94 '95 '96 '97 '98 '99 '00 '01 '02 '03 '04 '05 '06 '07 '08 '09 '10 '11 '12 '13 '14 '15 '16 '17 '18 '19 '20
1 1/ 4
1 1/ 2
1 3/ 4
2
2 1/ 4
2 1/ 2
2 3/ 4
3 3 1/ 43 1/ 23 3/ 4
4 1/ 2
5
5 1/ 2
6 6 1/ 27 7 1/ 2
8 1/ 2
9 1/ 2
11
12 13 14 15
17
19
22
24 26 28 30
34
38
42
46
50
55
60 65 70 75
85
95
110
120 130 140 150
170
190
220
240 260
.08
.09
.10
.20
.25
.30
.35
.40
.45
.50
.60
.70
.80
.90
1.0
1.5
2.0
2.5
3.0
3.5
4.0
4.5
5.0
5.5
6.0
6.57.07.5
8.5
9.5
12
14
16
3 36 69 9
12 1215 15M
Adj. for2 for 110/ 6/ 93
Adj. for3 for 26/ 10/ 02
Adj. for2 for 19/ 4/ 13
Listed N YSE6/ 17/ 93
OTC prior
Southern CaliforniaWater Co. prior to
7/ 1/ 98
Ind WU TIL P/ E N / AN YSE Bond$267.8 M ils.Com 36.734 M ils.Book value 13.56P/ E 40.99Country U S
G rowth Performance M easurementYears Price Earn. D iv. Total Ret.Last 1 24.1 19.2 10.9 25.8Last 5 16.2 5.6 7.4 17.6
Last 10 17.6 9.7 8.9 18.7Last 25 11.3 6.0 4.6 12.0
D istributes water and electricity
LEG EN DRead from Right Scale:PriceRelative Strength
Bottom Band VolumeM oving Avg (48 months)Recession (G rey Shaded Bars)
Read from Left Scale:EarningsD ividends
Charts are updated daily at www.SrcStockCharts.com.
61

AM ER IC AN SU PER C ON D U C TOR C OR P (AM SC )
Copyright 2019 Securities Research Company
'85 '86 '87 '88 '89 '90 '91 '92 '93 '94 '95 '96 '97 '98 '99 '00 '01 '02 '03 '04 '05 '06 '07 '08 '09 '10 '11 '12 '13 '14 '15 '16 '17 '18 '19 '20
3/ 4
1
1 1/ 4
1 1/ 2
1 3/ 4
2
2 1/ 42 1/ 2
3
3 1/ 2
4
4 1/ 25 5 1/ 2
6 1/ 2
7 1/ 2
8 1/ 29 1/ 2
11
13
15
17 19
22
26
30
34 38 42
48
55
65
75
85 95
110
130
150
170 190
220
260
300
340 380 420
480
600
700
800
900 1000 1100
1300
.04
.05
.06
.07
.08
.09
.10
.20
.25
.30
.35
.40
.45
.50
.60
.70
.80
.901.0
1.5
2.0
2.5
3.0
3.5
4.0
4.55.05.5
6.5
7.5
8.59.5
12
14
16
1820
25
30
35
40
4550
60
70
80
90
3 36 69 9
12 1215 15M
(1.00)
(0.90)
(0.90)
(1.00)
(1.60)
(1.70)
(1.90)
(6.60)
(6.20)
(7.30)
(7.80)
(8.50)
(7.80)
(8.90)
(9.40)
(10.00)
(12.00)
(11.00)
(10.90)
(10.60)
(10.60)
(11.00)
(11.00)
(10.50)
(10.10)
(10.60)
(11.30)
(10.80)
(11.10)
(10.10)
(9.50)
(9.60)
(10.80)
(13.00)
(15.00)
(18.30)
(21.10)
(22.10)
(22.60)
(23.30)
(20.30)
(18.90)
(16.70)
(13.20)
(10.80)
(8.70)
(7.40)
(5.80)
(6.10)
(6.00)
(6.60)
(8.00)
(7.50)
(7.80)
(7.80)
(8.40)
(10.40)
(10.20)
(9.80)
(8.00)
(4.40)
(3.40)
(2.70)
(3.40)
(3.30)
(1.80)
(5.00)
(11.70)
(19.10)
(16.90)
(12.80)
(11.30)
(10.50)
(9.60)
(9.00)
(7.90)
(6.20)
(5.50)
(5.60)
(5.20)
(5.40)
(4.69)
(3.94)
(3.18)
(2.44)
(2.03)
(1.92)
(1.88)
(1.73)
(1.96)
(2.16)
(2.00)
(1.97)
(1.71)
(1.05)
(0.74)
Adj. for3 for 2
11/ 29/ 94
Adj. for1 for 103/ 25/ 15
Ind EEQPM P/ E N / AN asdaq Bond $.0 M ils.Com 21.228 M ils.Book value 3.98P/ E 31.48Country U S
G rowth Performance M easurementYears Price Earn. D iv. Total Ret.Last 1 -44.6 -14.8 -- - -44.6Last 5 .7 -- - - - - .7
Last 10 -32.7 -23.4 -- - -32.7Last 25 -12.5 -- - - - - -12.5
Superconducting products for electric power applications 70% SC ALE
LEG EN DRead from Right Scale:PriceRelative Strength
Bottom Band VolumeM oving Avg (48 months)Recession (G rey Shaded Bars)
Read from Left Scale:EarningsD ividends
Charts are updated daily at www.SrcStockCharts.com.
62

AM ER IC AN VAN G U AR D C OR P (AVD )
Copyright 2019 Securities Research Company
'85 '86 '87 '88 '89 '90 '91 '92 '93 '94 '95 '96 '97 '98 '99 '00 '01 '02 '03 '04 '05 '06 '07 '08 '09 '10 '11 '12 '13 '14 '15 '16 '17 '18 '19 '20
1/ 4
1/ 2
3/ 4
1
1 1/ 4
1 1/ 2
1 3/ 4
2
2 1/ 4
2 1/ 2
2 3/ 43 3 1/ 43 1/ 2
4
4 1/ 2
5
5 1/ 26 6 1/ 27
8
9
10
11 12 13 14
16
18
20
22 24 26 28
32
36
40
44 48
55
.01
.02
.03
.04
.05
.06
.07
.08
.09
.10
.20
.25
.30
.35
.40
.45
.50
.60
.70
.80
.90
1.0
1.5
2.0
2.5
3.0
3.5
2 24 46 68 8
10 10M
(0.03)
(0.04)
(0.04)
(0.03) 0.00
Adj. for5 for 411/ 2/ 88
Adj. for10% SD2/ 27/ 96
Adj. for10% SD3/ 29/ 00
Adj. for10% SD3/ 28/ 01
Adj. for4 for 3
4/ 15/ 02
Adj. for3 for 24/ 14/ 03
Adj. for3 for 24/ 19/ 04
Adj. for2 for 1
4/ 18/ 05
Adj. for4 for 3
4/ 18/ 06
ListedN YSE 3/ 7/ 06
ASE prior
Special$0.10
Ind FERTL P/ E N / AN YSE Bond$102.2 M ils.Com 30.324 M ils.Book value 9.62P/ E 30.47Country U S
G rowth Performance M easurementYears Price Earn. D iv. Total Ret.Last 1 4.3 -26.8 .0 4.8Last 5 10.3 28.7 -16.7 10.7
Last 10 9.2 6.5 2.9 9.7Last 25 13.9 7.3 -- - 14.3
Specialty chemical manufacturer-safe effective products 90% SC ALE
LEG EN DRead from Right Scale:PriceRelative Strength
Bottom Band VolumeM oving Avg (48 months)Recession (G rey Shaded Bars)
Read from Left Scale:EarningsD ividends
Charts are updated daily at www.SrcStockCharts.com.
63

AM ER IC AN WOOD M AR K C OR P OR ATIO (AM WD )
Copyright 2019 Securities Research Company
'85 '86 '87 '88 '89 '90 '91 '92 '93 '94 '95 '96 '97 '98 '99 '00 '01 '02 '03 '04 '05 '06 '07 '08 '09 '10 '11 '12 '13 '14 '15 '16 '17 '18 '19 '20
3/ 4
1
1 1/ 4
1 1/ 2
1 3/ 4
2
2 1/ 4
2 1/ 2
2 3/ 4
3 3 1/ 43 1/ 2
4
4 1/ 2
5
5 1/ 2
6 6 1/ 27
8
9
10
11
12 13 14
16
18
20
22
24 26 28
32
36
40
44
48
55
60 65 70
80
90
100
110
120 130 140
160
180
200
220
.05
.06
.07
.08
.09
.10
.20
.25
.30
.35
.40
.45
.50
.60
.70
.80
.90
1.0
1.5
2.0
2.5
3.0
3.5
4.0
4.5
5.0
5.5
6.06.57.0
8.0
9.0
10
12
14
2 24 46 68 8
10 10M
0.04
(0.05)
(0.11)
(0.26)
(0.17)
(0.16)
(0.13)
(0.14)
(0.27)
(0.35)
(0.33)
(0.16)
(0.20)
(0.04)
0.01
0.01 (0.05)
(0.16)
(0.02)
(0.15)
(0.48)
(1.13)
(1.57)
(1.47)
(1.63)
(1.63)
(1.59)
(1.54)
(1.23)
(0.94)
(0.87)
(0.61)
(0.26)
0.04
0.04
0.04
0.04
Adj. for10% SD5/ 24/ 88
Adj. for10% SD9/ 13/ 93
Adj. for2 for 19/ 27/ 04
D ividendomitted
12/ 28/ 11
Ind BLD G P P/ E N / AN asdaq Bond$22.0 M ils.Com 17.594 M ils.Book value 21.65P/ E 14.89Country U S
G rowth Performance M easurementYears Price Earn. D iv. Total Ret.Last 1 54.1 18.3 .0 54.1Last 5 21.2 36.3 .0 21.2
Last 10 18.2 -- - .0 18.3Last 25 15.7 13.0 -- - 15.8
M anufacturer of kitchen cabinets and other home furnishings 95% SC ALE
LEG EN DRead from Right Scale:PriceRelative Strength
Bottom Band VolumeM oving Avg (48 months)Recession (G rey Shaded Bars)
Read from Left Scale:EarningsD ividends
Charts are updated daily at www.SrcStockCharts.com.
64

AM ER IC AS C AR M AR T IN C (C R M T)
Copyright 2019 Securities Research Company
'85 '86 '87 '88 '89 '90 '91 '92 '93 '94 '95 '96 '97 '98 '99 '00 '01 '02 '03 '04 '05 '06 '07 '08 '09 '10 '11 '12 '13 '14 '15 '16 '17 '18 '19 '20
1/ 4
1/ 2
3/ 4
1
1 1/ 4
1 1/ 2
1 3/ 4
2
2 1/ 42 1/ 22 3/ 4
3 1/ 4
3 3/ 4
4 1/ 25 5 1/ 2
6 1/ 2
7 1/ 2
8 1/ 2
9 1/ 2
11
13
15
17
19
22
26
30
34
38 42 46
55
65
75
85
95
110
130
150
170
.01
.02
.03
.04
.05
.06
.07
.08
.09
.10
.20
.25
.30
.35
.40
.45
.50
.60
.70
.80
.901.0
1.5
2.0
2.5
3.0
3.5
4.0
4.55.05.5
6.5
7.5
8.5
9.5
3 36 69 9
12 1215 15M
(0.26)
(0.24)
(0.01)
Adj. for3 for 2
4/ 15/ 05
Ind AU TOR P/ E N / AN asdaq Bond$191.1 M ils.Com 6.883 M ils.Book value 30.83P/ E 12.76Country U S
G rowth Performance M easurementYears Price Earn. D iv. Total Ret.Last 1 54.9 59.6 -- - 54.9Last 5 15.3 23.3 -- - 15.3
Last 10 16.5 16.0 -- - 16.5Last 25 16.4 -- - - - - 16.4
E Targets car buyers with poor or limited credit histories 75% SC ALE
LEG EN DRead from Right Scale:PriceRelative Strength
Bottom Band VolumeM oving Avg (48 months)Recession (G rey Shaded Bars)
Read from Left Scale:EarningsD ividends
Charts are updated daily at www.SrcStockCharts.com.
65

AM ETEK IN C . (AM E)
Copyright 2019 Securities Research Company
'85 '86 '87 '88 '89 '90 '91 '92 '93 '94 '95 '96 '97 '98 '99 '00 '01 '02 '03 '04 '05 '06 '07 '08 '09 '10 '11 '12 '13 '14 '15 '16 '17 '18 '19 '20
1/ 2
3/ 4
1
1 1/ 4
1 1/ 2
1 3/ 4
2
2 1/ 4
2 1/ 2
2 3/ 43 3 1/ 4
3 3/ 4
4 1/ 2
5
5 1/ 26 6 1/ 2
7 1/ 2
8 1/ 2
9 1/ 2
11 12 13
15
17
19
22 24 26
30
34
38
42 46 50
55 60 65
75
85
95
110 120 130
150
170
.02
.03
.04
.05
.06
.07
.08
.09
.10
.20
.25
.30
.35
.40
.45
.50
.60
.70
.80
.90
1.0
1.5
2.0
2.5
3.0
3.5
4.0
4.5
5.0
5.56.06.5
7.5
8.5
9.5
15 1530 3045 4560 6075 75M
(0.03)
(0.01)
0.00
Adj. for2 for 1
11/ 20/ 87
Adj. for2 for 13/ 1/ 04
Adj. for3 for 2
11/ 28/ 06
Adj. for3 for 2
12/ 22/ 10
Adj. for3 for 27/ 2/ 12
D ist. 1 sh. AM E (N EW)& .105 sh. Culligan Water
for ea. 6.75 shs. AM E (OLD )8/ 7/ 97
Zygo Corp.acquired 6/ 23/ 14
Ind EEQPM P/ E N / AN YSE Bond$107.6 M ils.Com 231.897 M ils.Book value 14.58P/ E 25.38Country U S
G rowth Performance M easurementYears Price Earn. D iv. Total Ret.Last 1 38.2 20.3 .0 39.0Last 5 16.0 10.3 9.2 16.5
Last 10 20.1 16.6 18.0 20.4Last 25 16.1 13.8 11.7 16.3
P D E Electro-mechanical and process equipment, precision instruments 85% SC ALE
LEG EN DRead from Right Scale:PriceRelative Strength
Bottom Band VolumeM oving Avg (48 months)Recession (G rey Shaded Bars)
Read from Left Scale:EarningsD ividends
Charts are updated daily at www.SrcStockCharts.com.
66

AM G EN IN C (AM G N )
Copyright 2019 Securities Research Company
'85 '86 '87 '88 '89 '90 '91 '92 '93 '94 '95 '96 '97 '98 '99 '00 '01 '02 '03 '04 '05 '06 '07 '08 '09 '10 '11 '12 '13 '14 '15 '16 '17 '18 '19 '20
1/ 4
1/ 2
3/ 4
1
1 1/ 4
1 1/ 2
1 3/ 4
2 2 1/ 42 1/ 2
3
3 1/ 2
4 4 1/ 25
6
7
8 9 10
12
14
16 18 20
24
28
32 36 40
46
55
65
75
85 95
110
130
150
170 190
220
260
300
340 380
.01
.02
.03
.04
.05
.06
.07
.08
.09
.10
.20
.25
.30
.35
.40
.45
.50
.60
.70
.80
.901.0
1.5
2.0
2.5
3.0
3.5
4.04.55.0
6.0
7.0
8.09.010
12
14
161820
25
200 200400 400600 600800 800
1000 1000M
(0.01)
(0.01)
(0.01)
(0.01)
(0.00)
0.00
0.00
0.00
0.00
0.00
0.00
0.00
0.00
0.00
0.00
0.00
(0.01)
(0.01)
(0.01)
0.00
Adj. for2 for 1
8/ 13/ 90
Adj. for3 for 1
9/ 11/ 91
Adj. for2 for 18/ 16/ 95
Adj. for2 for 13/ 1/ 99
Adj. for2 for 1
11/ 22/ 99
Immunex Corp.acq. 7/ 16/ 02
Tularik Inc.acq. 8/ 13/ 04
Abgenix Inc.acquired 4/ 3/ 06
M icromet, Inc,acquired 3/ 8/ 12
Onyx Pharmaceuticals, Inc.acquired 10/ 2/ 13
Ind BIOTK P/ E N / AN asdaq Bond$7134.0 M ils.Com 647.272 M ils.Book value 42.47P/ E 16.31Country U S
G rowth Performance M easurementYears Price Earn. D iv. Total Ret.Last 1 27.3 1.4 9.8 30.4Last 5 9.4 10.9 18.9 11.4
Last 10 15.1 11.5 -- - 16.4Last 25 14.6 15.6 -- - 15.1
U ses cellular biology & medicinal chemistry to target certain diseases 65% SC ALE
LEG EN DRead from Right Scale:PriceRelative Strength
Bottom Band VolumeM oving Avg (48 months)Recession (G rey Shaded Bars)
Read from Left Scale:EarningsD ividends
Charts are updated daily at www.SrcStockCharts.com.
67

AM P C O- P ITTSBU R G H C OR P (AP )
Copyright 2019 Securities Research Company
'85 '86 '87 '88 '89 '90 '91 '92 '93 '94 '95 '96 '97 '98 '99 '00 '01 '02 '03 '04 '05 '06 '07 '08 '09 '10 '11 '12 '13 '14 '15 '16 '17 '18 '19 '20
3/ 4
1
1 1/ 4
1 1/ 2
1 3/ 4
2
2 1/ 4
2 1/ 2
2 3/ 4
3 3 1/ 43 1/ 23 3/ 4
4 1/ 2
5
5 1/ 2
6 6 1/ 27 7 1/ 2
8 1/ 2
9 1/ 2
11
12 13 14 15
17
19
22
24
26 28 30
34
38
42
46
50
55
60 65 70 75
85
95
110
120 130
.04
.05
.06
.07
.08
.09
.10
.20
.25
.30
.35
.40
.45
.50
.60
.70
.80
.90
1.0
1.5
2.0
2.5
3.0
3.5
4.0
4.5
5.0
5.5
6.06.57.07.5
8.5
1 12 23 34 45 5M
(4.85)
(0.22)
(0.33)
(0.10)
(0.30)
(0.39)
(0.21)
(0.23)
(0.26)
(0.22)
(0.15)
(0.02) (0.30)
(0.27)
(0.04)
(0.07)
(0.11)
(0.11)
(0.16)
(0.27)
(0.45)
(0.72)
(0.64)
(3.29)
(3.98)
(4.11)
0.00
(1.69)
(0.86)
(0.51)
(0.59)
(0.97)
(1.57)
(1.64)
(1.18)
(0.64)
D ividendomitted6/ 15/ 17
Ind M ACH N P/ E N / AN YSE Bond$102.8 M ils.Com 12.491 M ils.Book value 15.52P/ E N / ACountry U S
G rowth Performance M easurementYears Price Earn. D iv. Total Ret.Last 1 -16.7 59.2 .0 -16.7Last 5 -30.7 -42.2 -12.9 -24.9
Last 10 -19.5 -- - -6.7 -11.0Last 25 -4.4 -- - 5.3 1.8
M anufactures industrial products
LEG EN DRead from Right Scale:PriceRelative Strength
Bottom Band VolumeM oving Avg (48 months)Recession (G rey Shaded Bars)
Read from Left Scale:EarningsD ividends
Charts are updated daily at www.SrcStockCharts.com.
68

AM P H EN OL C OR P . (AP H )
Copyright 2019 Securities Research Company
'85 '86 '87 '88 '89 '90 '91 '92 '93 '94 '95 '96 '97 '98 '99 '00 '01 '02 '03 '04 '05 '06 '07 '08 '09 '10 '11 '12 '13 '14 '15 '16 '17 '18 '19 '20
1/ 4
1/ 2
3/ 4
1
1 1/ 4
1 1/ 2
1 3/ 4
2
2 1/ 4
2 1/ 2
2 3/ 43 3 1/ 4
3 3/ 4
4 1/ 2
5
5 1/ 26 6 1/ 2
7 1/ 2
8 1/ 2
9 1/ 2
11 12 13
15
17
19
22 24 26
30
34
38
42 46 50
55 60 65
75
85
95
110 120 130
150
.02
.03
.04
.05
.06
.07
.08
.09
.10
.20
.25
.30
.35
.40
.45
.50
.60
.70
.80
.90
1.0
1.5
2.0
2.5
3.0
3.5
4.0
4.5
5.0
5.56.06.5
7.5
8.5
9.5
40 4080 80
120 120160 160200 200M
(0.03)
0.00
0.01
Adj. for2 for 14/ 26/ 00
Adj. for2 for 13/ 30/ 04
Adj. for2 for 14/ 2/ 07
Adj. for2 for 1
10/ 10/ 14
Ind ELCOM P/ E N / AN YSE Bond$677.2 M ils.Com 300.353 M ils.Book value 12.47P/ E 28.43Country U S
G rowth Performance M easurementYears Price Earn. D iv. Total Ret.Last 1 23.2 1.1 8.7 24.3Last 5 15.1 11.1 14.9 15.8
Last 10 18.5 15.3 42.0 18.9Last 25 18.9 18.3 -- - 19.1
D E Electric and fiber-optic connectors 85% SC ALE
LEG EN DRead from Right Scale:PriceRelative Strength
Bottom Band VolumeM oving Avg (48 months)Recession (G rey Shaded Bars)
Read from Left Scale:EarningsD ividends
Charts are updated daily at www.SrcStockCharts.com.
69

AN ALOG D EVIC ES IN C (AD I)
Copyright 2019 Securities Research Company
'85 '86 '87 '88 '89 '90 '91 '92 '93 '94 '95 '96 '97 '98 '99 '00 '01 '02 '03 '04 '05 '06 '07 '08 '09 '10 '11 '12 '13 '14 '15 '16 '17 '18 '19 '20
1
1 1/ 4
1 1/ 2
1 3/ 4
2
2 1/ 4
2 1/ 2
2 3/ 4
3 3 1/ 43 1/ 23 3/ 4
4 1/ 2
5
5 1/ 2
6
6 1/ 27 7 1/ 2
8 1/ 2
9 1/ 2
11
12
13 14 15
17
19
22
24
26 28 30
34
38
42
46
50
55
60
65 70 75
85
95
110
120
130 140 150
170
190
.06
.07
.08
.09
.10
.20
.25
.30
.35
.40
.45
.50
.60
.70
.80
.90
1.0
1.5
2.0
2.5
3.0
3.5
4.0
4.5
5.0
5.5
6.06.57.07.5
8.5
9.5
12
40 4080 80
120 120160 160200 200M
0.05
0.04
(0.05)
(0.04)
(0.03)
(0.05)
0.03
0.01
0.00
0.02Adj. for25% SD4/ 16/ 85
Adj. for4 for 34/ 11/ 86
Adj. for3 for 21/ 5/ 95
Adj. for3 for 21/ 4/ 96
Adj. for4 for 31/ 7/ 97
Adj. for2 for 13/ 16/ 00
Precision M onolithicsacq. 8/ 31/ 90
ListedN asdaq 4/ 2/ 12
N YSE prior
Added toN asdaq 100
12/ 14/ 12
H itite M icrowave Corp.acquired 7/ 23/ 14
To acquireLinear Technology Corp.
Ind SEM IC P/ E N / AN asdaq Bond $.0 M ils.Com 371.670 M ils.Book value 17.86P/ E 23.07Country U S
G rowth Performance M easurementYears Price Earn. D iv. Total Ret.Last 1 19.9 -13.6 12.5 22.1Last 5 17.9 16.5 7.9 19.6
Last 10 16.0 18.1 10.4 17.4Last 25 13.2 13.0 -- - 13.8
D E Precision electronic components and subsystems
LEG EN DRead from Right Scale:PriceRelative Strength
Bottom Band VolumeM oving Avg (48 months)Recession (G rey Shaded Bars)
Read from Left Scale:EarningsD ividends
Charts are updated daily at www.SrcStockCharts.com.
70

AN IKA TH ER APEU TIC S IN C (AN IK)
Copyright 2019 Securities Research Company
'85 '86 '87 '88 '89 '90 '91 '92 '93 '94 '95 '96 '97 '98 '99 '00 '01 '02 '03 '04 '05 '06 '07 '08 '09 '10 '11 '12 '13 '14 '15 '16 '17 '18 '19 '20
1/ 2
3/ 4
1
1 1/ 4
1 1/ 2
1 3/ 4
2
2 1/ 4
2 1/ 2
2 3/ 4
3 3 1/ 43 1/ 23 3/ 4
4 1/ 2
5
5 1/ 2
6
6 1/ 27 7 1/ 2
8 1/ 2
9 1/ 2
11
12
13 14 15
17
19
22
24
26 28 30
34
38
42
46
50
55
60
65 70 75
85
95
110
.04
.05
.06
.07
.08
.09
.10
.20
.25
.30
.35
.40
.45
.50
.60
.70
.80
.90
1.0
1.5
2.0
2.5
3.0
3.5
4.0
4.5
5.0
5.5
6.06.57.07.5
3 36 69 9
12 1215 15M
(0.41)
(0.44)
(0.45)
(0.55)
(0.56)
(0.57)
(0.60)
(0.69)
(0.63)
(0.83)
(0.81)
(0.70)
(0.96)
(0.73)
(0.42)
0.02
(0.04)
(0.18)
(0.15)
(0.40)
(0.39)
(0.54)
(0.63)
(0.48)
(0.42)
(0.31)
(0.16)
(0.05)
Ind H CSU P P/ E N / AN asdaq Bond $.0 M ils.Com 14.584 M ils.Book value 15.60P/ E 22.95Country U S
G rowth Performance M easurementYears Price Earn. D iv. Total Ret.Last 1 31.1 68.2 -- - 31.1Last 5 4.9 -2.6 -- - 4.9
Last 10 22.9 17.6 -- - 22.9Last 25 14.0 -- - - - - 14.0
P E M akes therapeutic products and devices
LEG EN DRead from Right Scale:PriceRelative Strength
Bottom Band VolumeM oving Avg (48 months)Recession (G rey Shaded Bars)
Read from Left Scale:EarningsD ividends
Charts are updated daily at www.SrcStockCharts.com.
71

AN IXTER IN TL IN C (AXE)
Copyright 2019 Securities Research Company
'85 '86 '87 '88 '89 '90 '91 '92 '93 '94 '95 '96 '97 '98 '99 '00 '01 '02 '03 '04 '05 '06 '07 '08 '09 '10 '11 '12 '13 '14 '15 '16 '17 '18 '19 '20
3/ 4
1
1 1/ 4
1 1/ 2
1 3/ 4
2
2 1/ 4
2 1/ 2
2 3/ 43 3 1/ 43 1/ 2
4
4 1/ 2
5
5 1/ 26 6 1/ 27
8
9
10
11 12 13 14
16
18
20
22 24 26 28
32
36
40
44 48
55 60 65 70
80
90
100
110 120 130 140
160
180
200
220 240
.04
.05
.06
.07
.08
.09
.10
.20
.25
.30
.35
.40
.45
.50
.60
.70
.80
.90
1.0
1.5
2.0
2.5
3.0
3.5
4.0
4.5
5.0
5.56.06.5
7.5
8.5
9.5
12
14
16
5 510 1015 1520 2025 25M
(0.30)
(0.29)
(0.14)
(0.11)
(0.21)
(0.27)
(0.33)
(0.22)
(0.22)
(0.30)
(0.13)
(0.17)
(0.04) (0.41)
(0.78)
(0.94)
(1.84)
(1.21)
(1.04)
(1.33)
(0.60)
(1.13)
(1.05)
(0.76)
(0.73)
(0.50)
(0.38)
(0.17)
Adj. for2 for 1
10/ 26/ 95
ListedN YSE 5/ 4/ 89
OTC prior
Itel Corp.prior to 9/ 1/ 95
Special$1.50
Special$4.00
Special$3.25
Special$5.00
Ind TD STR P/ E N / AN YSE Bond$597.0 M ils.Com 33.464 M ils.Book value 39.79P/ E 14.46Country U S
G rowth Performance M easurementYears Price Earn. D iv. Total Ret.Last 1 62.7 17.2 .0 62.7Last 5 5.6 2.3 .0 5.6
Last 10 9.0 10.8 .0 9.0Last 25 7.2 9.4 .0 7.2
Communications and networking equipment 90% SC ALE
LEG EN DRead from Right Scale:PriceRelative Strength
Bottom Band VolumeM oving Avg (48 months)Recession (G rey Shaded Bars)
Read from Left Scale:EarningsD ividends
Charts are updated daily at www.SrcStockCharts.com.
72

AON C OR P OR ATION P LC (AON )
Copyright 2019 Securities Research Company
'85 '86 '87 '88 '89 '90 '91 '92 '93 '94 '95 '96 '97 '98 '99 '00 '01 '02 '03 '04 '05 '06 '07 '08 '09 '10 '11 '12 '13 '14 '15 '16 '17 '18 '19 '20
1 1/ 2
1 3/ 4
2
2 1/ 4
2 1/ 2
2 3/ 4
3 3 1/ 43 1/ 23 3/ 4
4 1/ 2
5
5 1/ 2
6 6 1/ 27 7 1/ 2
8 1/ 2
9 1/ 2
11
12 13 14 15
17
19
22
24 26 28 30
34
38
42
46
50
55
60 65 70 75
85
95
110
120 130 140 150
170
190
220
240 260 280 300
.09
.10
.20
.25
.30
.35
.40
.45
.50
.60
.70
.80
.90
1.0
1.5
2.0
2.5
3.0
3.5
4.0
4.5
5.0
5.5
6.0
6.57.07.5
8.5
9.5
12
14
16
18
20
20 2040 4060 6080 80
100 100M
Adj. for2 for 15/ 27/ 87
Adj. for3 for 2
5/ 17/ 94
Adj. for3 for 25/ 15/ 97
Adj. for3 for 25/ 18/ 99
Combined Internationalprior to 5/ 1/ 87
Alexander & AlexanderSvcs, Inc. acq. 7/ 21/ 97
H ewitt Associatesacquired 10/ 2/ 10
1 for 1exchange
for AON PLC
4/ 2/ 12
AON Corp.prior to4/ 2/ 12
Ind IN SBR P/ E N / AN YSE Bond$2243.0 M ils.Com 242.655 M ils.Book value 20.81P/ E 23.67CountryG reat Britian (U K)
G rowth Performance M easurementYears Price Earn. D iv. Total Ret.Last 1 33.2 8.0 10.0 34.3Last 5 18.2 9.0 12.0 19.0
Last 10 18.3 10.9 11.4 18.8Last 25 11.2 9.3 4.6 11.6
D Insurance holding company
LEG EN DRead from Right Scale:PriceRelative Strength
Bottom Band VolumeM oving Avg (48 months)Recession (G rey Shaded Bars)
Read from Left Scale:EarningsD ividends
Charts are updated daily at www.SrcStockCharts.com.
73

APAC H E C OR P (APA)
Copyright 2019 Securities Research Company
'85 '86 '87 '88 '89 '90 '91 '92 '93 '94 '95 '96 '97 '98 '99 '00 '01 '02 '03 '04 '05 '06 '07 '08 '09 '10 '11 '12 '13 '14 '15 '16 '17 '18 '19 '20
1 1/ 4
1 1/ 2
1 3/ 4
2
2 1/ 4
2 1/ 2
2 3/ 4
3 3 1/ 43 1/ 23 3/ 4
4 1/ 2
5
5 1/ 2
6 6 1/ 27 7 1/ 2
8 1/ 2
9 1/ 2
11
12 13 14 15
17
19
22
24 26 28 30
34
38
42
46
50
55
60 65 70 75
85
95
110
120 130 140 150
170
190
220
240 260
.08
.09
.10
.20
.25
.30
.35
.40
.45
.50
.60
.70
.80
.90
1.0
1.5
2.0
2.5
3.0
3.5
4.0
4.5
5.0
5.5
6.0
6.57.07.5
8.5
9.5
12
14
16
40 4080 80
120 120160 160200 200M
0.03
0.01
(0.04)
(0.14)
(0.09)
(0.09)
(0.05) 0.02 (0.26)
(0.29)
(0.77)
(0.75)
(0.75)
(0.27)
(0.22)
(0.15)
Adj. for10% SD12/ 27/ 01
Adj. for5% SD3/ 10/ 03
Adj. for2 for 11/ 15/ 04
H udson Energy Resourcesmerged 11/ 16/ 93
D ekalb Energymerged 5/ 17/ 95
Phoenix Resource Cos.merged 5/ 20/ 96
Ind OG EXP P/ E N / AN YSE Bond$2019.8 M ils.Com 382.486 M ils.Book value 4.87P/ E 140.78Country U S
G rowth Performance M easurementYears Price Earn. D iv. Total Ret.Last 1 -1.3 -86.9 .0 1.7Last 5 -12.3 -47.7 .0 -9.8
Last 10 -10.6 -27.3 5.2 -8.4Last 25 4.8 - .8 8.8 6.2
Oil and gas exploration, agricultural operations
LEG EN DRead from Right Scale:PriceRelative Strength
Bottom Band VolumeM oving Avg (48 months)Recession (G rey Shaded Bars)
Read from Left Scale:EarningsD ividends
Charts are updated daily at www.SrcStockCharts.com.
74

APOG EE EN TER P R ISES IN C (AP OG )
Copyright 2019 Securities Research Company
'85 '86 '87 '88 '89 '90 '91 '92 '93 '94 '95 '96 '97 '98 '99 '00 '01 '02 '03 '04 '05 '06 '07 '08 '09 '10 '11 '12 '13 '14 '15 '16 '17 '18 '19 '20
3/ 4
1
1 1/ 4
1 1/ 2
1 3/ 4
2
2 1/ 4
2 1/ 2
2 3/ 4
3 3 1/ 43 1/ 23 3/ 4
4 1/ 2
5
5 1/ 2
6 6 1/ 27 7 1/ 2
8 1/ 2
9 1/ 2
11
12 13 14 15
17
19
22
24
26 28 30
34
38
42
46
50
55
60 65 70 75
85
95
110
120 130
.04
.05
.06
.07
.08
.09
.10
.20
.25
.30
.35
.40
.45
.50
.60
.70
.80
.90
1.0
1.5
2.0
2.5
3.0
3.5
4.0
4.5
5.0
5.5
6.06.57.07.5
8.5
3 36 69 9
12 1215 15M
(0.01)
(0.03)
(0.38)
(0.51)
(0.46)
(0.29)
(0.01)
Adj. for4 for 39/ 15/ 86
Adj. for2 for 12/ 18/ 97
Ind BLD G P P/ E N / AN asdaq Bond$164.4 M ils.Com 28.182 M ils.Book value 17.09P/ E 12.24Country U S
G rowth Performance M easurementYears Price Earn. D iv. Total Ret.Last 1 -2.3 -8.7 11.1 - .3Last 5 -5.1 15.9 11.8 -3.5
Last 10 9.2 6.0 7.9 10.7Last 25 5.9 7.4 6.1 6.8
Custom aluminum window systems, automobile and flat glass
LEG EN DRead from Right Scale:PriceRelative Strength
Bottom Band VolumeM oving Avg (48 months)Recession (G rey Shaded Bars)
Read from Left Scale:EarningsD ividends
Charts are updated daily at www.SrcStockCharts.com.
75

APPLE IN C (AAPL)
Copyright 2019 Securities Research Company
'85 '86 '87 '88 '89 '90 '91 '92 '93 '94 '95 '96 '97 '98 '99 '00 '01 '02 '03 '04 '05 '06 '07 '08 '09 '10 '11 '12 '13 '14 '15 '16 '17 '18 '19 '20
1/ 4
1/ 2
3/ 4
1
1 1/ 4
1 1/ 2
1 3/ 4
2
2 1/ 42 1/ 22 3/ 4
3 1/ 4
3 3/ 4
4 1/ 25 5 1/ 2
6 1/ 2
7 1/ 2
8 1/ 29 1/ 2
11
13
15
17 19
22
26
30
34 38 42
48
55
65
75
85 95
110
130
150
170 190
220
260
300
340
.01
.02
.03
.04
.05
.06
.07
.08
.09
.10
.20
.25
.30
.35
.40
.45
.50
.60
.70
.80
.901.0
1.5
2.0
2.5
3.0
3.5
4.0
4.55.05.5
6.5
7.5
8.59.5
12
14
16
1820
3 36 69 9
12 1215 15B
(0.02)
(0.07)
(0.09)
(0.12)
(0.10)
(0.10)
(0.11)
(0.06)
0.00
(0.01)
(0.02)
Adj. for2 for 1
6/ 16/ 87
Adj. for2 for 16/ 21/ 00
Adj. for2 for 12/ 28/ 05
Adj. for7 for 16/ 9/ 14
D ividendomitted2/ 13/ 96
Autnentic Inc.acquired 10/ 5/ 12
Added ToD ow 303/ 18/ 15
Ind TH STP P/ E N / AN asdaq Bond $.0 M ils.Com 4829.926 M ils.Book value 24.03P/ E 26.19Country U S
G rowth Performance M easurementYears Price Earn. D iv. Total Ret.Last 1 86.5 -2.5 5.5 88.3Last 5 21.5 9.8 10.4 22.5
Last 10 27.5 23.3 68.1 28.1Last 25 24.0 20.6 23.1 24.2
P D E Personal and business computer systems 70% SC ALE
LEG EN DRead from Right Scale:PriceRelative Strength
Bottom Band VolumeM oving Avg (48 months)Recession (G rey Shaded Bars)
Read from Left Scale:EarningsD ividends
Charts are updated daily at www.SrcStockCharts.com.
76

APPLIED IN D U STR IAL TEC H N OLOG IES (AIT)
Copyright 2019 Securities Research Company
'85 '86 '87 '88 '89 '90 '91 '92 '93 '94 '95 '96 '97 '98 '99 '00 '01 '02 '03 '04 '05 '06 '07 '08 '09 '10 '11 '12 '13 '14 '15 '16 '17 '18 '19 '20
1/ 2
3/ 4
1
1 1/ 4
1 1/ 2
1 3/ 4
2
2 1/ 4
2 1/ 2
2 3/ 4
3 3 1/ 43 1/ 23 3/ 4
4 1/ 2
5
5 1/ 2
6
6 1/ 27 7 1/ 2
8 1/ 2
9 1/ 2
11
12 13 14 15
17
19
22
24 26 28 30
34
38
42
46
50
55
60
65 70 75
85
95
110
120
.04
.05
.06
.07
.08
.09
.10
.20
.25
.30
.35
.40
.45
.50
.60
.70
.80
.90
1.0
1.5
2.0
2.5
3.0
3.5
4.0
4.5
5.0
5.5
6.06.57.07.5
2 24 46 68 8
10 10M
0.01 (0.05)
(0.04)
(0.00)
Adj. for3 for 26/ 2/ 88
Adj. for3 for 26/ 6/ 89
Adj. for3 for 2
12/ 5/ 95
Adj. for3 for 2
9/ 16/ 97
Adj. for3 for 2
12/ 20/ 04
Adj. for3 for 26/ 16/ 06
Special$0 0013
Bearings, Inc.prior to 1/ 2/ 97
Ind TRAD E P/ E N / AN YSE Bond$318.6 M ils.Com 38.751 M ils.Book value 18.06P/ E 14.87Country U S
G rowth Performance M easurementYears Price Earn. D iv. Total Ret.Last 1 10.2 4.3 3.3 12.3Last 5 10.0 9.5 4.4 11.9
Last 10 11.5 14.6 7.5 13.1Last 25 9.8 10.3 9.0 10.6
Bearings and power transmission components
LEG EN DRead from Right Scale:PriceRelative Strength
Bottom Band VolumeM oving Avg (48 months)Recession (G rey Shaded Bars)
Read from Left Scale:EarningsD ividends
Charts are updated daily at www.SrcStockCharts.com.
77

APPLIED M ATER IALS IN C (AM AT)
Copyright 2019 Securities Research Company
'85 '86 '87 '88 '89 '90 '91 '92 '93 '94 '95 '96 '97 '98 '99 '00 '01 '02 '03 '04 '05 '06 '07 '08 '09 '10 '11 '12 '13 '14 '15 '16 '17 '18 '19 '20
1/ 4
1/ 2
3/ 4
1
1 1/ 4
1 1/ 2
1 3/ 4
2
2 1/ 42 1/ 22 3/ 4
3 1/ 4
3 3/ 4
4 1/ 25 5 1/ 2
6 1/ 2
7 1/ 2
8 1/ 2
9 1/ 2
11
13
15
17
19
22
26
30
34
38 42 46
55
65
75
85
95
110
130
150
.01
.02
.03
.04
.05
.06
.07
.08
.09
.10
.20
.25
.30
.35
.40
.45
.50
.60
.70
.80
.901.0
1.5
2.0
2.5
3.0
3.5
4.0
4.55.05.5
6.5
7.5
8.5
9.5
200 200400 400600 600800 800
1000 1000M
0.00
0.00
0.00
(0.00)
(0.00)
0.00
(0.05)
Adj. for2 for 1
5/ 16/ 86
Adj. for2 for 14/ 7/ 92
Adj. for2 for 110/ 6/ 93
Adj. for2 for 1
10/ 13/ 95
Adj. for2 for 1
10/ 14/ 97
Adj. for2 for 13/ 16/ 00
Adj. for2 for 1
4/ 17/ 02
Opal, Inc.acq. 1/ 9/ 97
Etec Sys. Inc.acq. 3/ 29/ 00
N ortem N .V.acquired 12/ 14/ 04
Applied F ilms Corp.acquired 7/ 7/ 06
Varian Semiconductor Equipment acquired
11/ 11/ 11
Ind SEM IQ P/ E N / AN asdaq Bond$205.0 M ils.Com 982.991 M ils.Book value 7.95P/ E 20.15Country U S
G rowth Performance M easurementYears Price Earn. D iv. Total Ret.Last 1 57.3 -31.5 5.0 59.4Last 5 21.9 23.5 16.0 23.0
Last 10 17.6 -- - 13.3 18.4Last 25 13.8 12.6 -- - 14.2
D M aker of semiconductor production equipment 75% SC ALE
LEG EN DRead from Right Scale:PriceRelative Strength
Bottom Band VolumeM oving Avg (48 months)Recession (G rey Shaded Bars)
Read from Left Scale:EarningsD ividends
Charts are updated daily at www.SrcStockCharts.com.
78

APTAR G R OU P IN C (ATR )
Copyright 2019 Securities Research Company
'85 '86 '87 '88 '89 '90 '91 '92 '93 '94 '95 '96 '97 '98 '99 '00 '01 '02 '03 '04 '05 '06 '07 '08 '09 '10 '11 '12 '13 '14 '15 '16 '17 '18 '19 '20
1
1 1/ 4
1 1/ 2
1 3/ 4
2
2 1/ 4
2 1/ 2
2 3/ 4
3 3 1/ 43 1/ 23 3/ 4
4 1/ 2
5
5 1/ 2
6
6 1/ 27 7 1/ 2
8 1/ 2
9 1/ 2
11
12
13 14 15
17
19
22
24 26 28 30
34
38
42
46
50
55
60
65 70 75
85
95
110
120
130 140 150
170
.06
.07
.08
.09
.10
.20
.25
.30
.35
.40
.45
.50
.60
.70
.80
.90
1.0
1.5
2.0
2.5
3.0
3.5
4.0
4.5
5.0
5.5
6.06.57.07.5
8.5
9.5
12
4 48 8
12 1216 1620 20M
Adj. for2 for 1
8/ 26/ 98
Adj. for2 for 15/ 10/ 07
Ind CON TM P/ E N / AN YSE Bond$168.9 M ils.Com 62.183 M ils.Book value 19.22P/ E 28.45Country U S
G rowth Performance M easurementYears Price Earn. D iv. Total Ret.Last 1 16.8 2.0 5.9 18.3Last 5 12.9 7.3 5.2 14.1
Last 10 12.6 8.1 9.1 13.6Last 25 12.3 9.6 13.6 12.8
Packaging pumps, aerosol valves, and closures
LEG EN DRead from Right Scale:PriceRelative Strength
Bottom Band VolumeM oving Avg (48 months)Recession (G rey Shaded Bars)
Read from Left Scale:EarningsD ividends
Charts are updated daily at www.SrcStockCharts.com.
79

AQU A AM ER IC A IN C OR POR ATED (WTR )
Copyright 2019 Securities Research Company
'85 '86 '87 '88 '89 '90 '91 '92 '93 '94 '95 '96 '97 '98 '99 '00 '01 '02 '03 '04 '05 '06 '07 '08 '09 '10 '11 '12 '13 '14 '15 '16 '17 '18 '19 '20
3/ 4
1
1 1/ 4
1 1/ 2
1 3/ 4
2
2 1/ 4
2 1/ 2
2 3/ 4
3 3 1/ 43 1/ 23 3/ 4
4 1/ 2
5
5 1/ 2
6 6 1/ 27 7 1/ 2
8 1/ 2
9 1/ 2
11
12 13 14 15
17
19
22
24
26 28 30
34
38
42
46
50
55
60 65 70 75
85
95
110
120 130
.04
.05
.06
.07
.08
.09
.10
.20
.25
.30
.35
.40
.45
.50
.60
.70
.80
.90
1.0
1.5
2.0
2.5
3.0
3.5
4.0
4.5
5.0
5.5
6.06.57.07.5
8.5
15 1530 3045 4560 6075 75M
Adj. for3 for 29/ 3/ 86
Adj. for3 for 27/ 11/ 96
Adj. for4 for 31/ 13/ 98
Adj. for5 for 4
12/ 4/ 00
Adj. for5 for 412/ 3/ 01
Adj. for5 for 4
12/ 2/ 03
Adj. for4 for 312/ 2/ 05
Adj. for5 for 49/ 3/ 13
Philadelphia Suburban Cp.prior to 1/ 18/ 04
Ind WU TIL P/ E N / AN YSE Bond$1028.5 M ils.Com 177.914 M ils.Book value 10.44P/ E 32.51Country U S
G rowth Performance M easurementYears Price Earn. D iv. Total Ret.Last 1 33.6 2.1 7.0 36.2Last 5 11.6 1.9 7.3 13.4
Last 10 13.4 8.7 7.3 15.0Last 25 11.0 8.0 7.0 11.9
Water utility
LEG EN DRead from Right Scale:PriceRelative Strength
Bottom Band VolumeM oving Avg (48 months)Recession (G rey Shaded Bars)
Read from Left Scale:EarningsD ividends
Charts are updated daily at www.SrcStockCharts.com.
80

AR C BEST C OR P (AR C B)
Copyright 2019 Securities Research Company
'85 '86 '87 '88 '89 '90 '91 '92 '93 '94 '95 '96 '97 '98 '99 '00 '01 '02 '03 '04 '05 '06 '07 '08 '09 '10 '11 '12 '13 '14 '15 '16 '17 '18 '19 '20
3/ 4
1
1 1/ 4
1 1/ 2
1 3/ 4
2
2 1/ 4
2 1/ 2
2 3/ 4
3 3 1/ 43 1/ 23 3/ 4
4 1/ 2
5
5 1/ 2
6 6 1/ 27 7 1/ 2
8 1/ 2
9 1/ 2
11
12 13 14 15
17
19
22
24
26 28 30
34
38
42
46
50
55
60 65 70 75
85
95
110
120 130
.04
.05
.06
.07
.08
.09
.10
.20
.25
.30
.35
.40
.45
.50
.60
.70
.80
.90
1.0
1.5
2.0
2.5
3.0
3.5
4.0
4.5
5.0
5.5
6.06.57.07.5
8.5
6 612 1218 1824 2430 30M
(0.15)
(1.90)
(2.65)
(3.19)
(2.95)
(2.10)
(1.59)
(0.82)
(0.83)
(1.50)
(2.19)
(2.46)
(2.26)
(2.06)
(1.30)
(0.96)
(0.46)
0.03 (0.14)
(0.53)
(0.41)
(0.41)
(0.11)
Best H olding Corp.prior to 3/ 16/ 92
D ividendomitted5/ 10/ 96
Arkansas Bestprior to 5/ 5/ 14
Ind RAILR P/ E N / AN asdaq Bond$173.7 M ils.Com 25.684 M ils.Book value 23.09P/ E 8.74Country U S
G rowth Performance M easurementYears Price Earn. D iv. Total Ret.Last 1 -27.3 -18.9 .0 -26.4Last 5 -6.0 11.6 5.9 -5.0
Last 10 2.0 -- - -6.1 2.7Last 25 3.3 5.9 8.7 4.1
Provides freight transportation services throughout N orth America
LEG EN DRead from Right Scale:PriceRelative Strength
Bottom Band VolumeM oving Avg (48 months)Recession (G rey Shaded Bars)
Read from Left Scale:EarningsD ividends
Charts are updated daily at www.SrcStockCharts.com.
81

AR C H ER D AN IELS M ID LAN D C O (AD M )
Copyright 2019 Securities Research Company
'85 '86 '87 '88 '89 '90 '91 '92 '93 '94 '95 '96 '97 '98 '99 '00 '01 '02 '03 '04 '05 '06 '07 '08 '09 '10 '11 '12 '13 '14 '15 '16 '17 '18 '19 '20
1/ 2
3/ 4
1
1 1/ 4
1 1/ 2
1 3/ 4
2
2 1/ 4
2 1/ 2
2 3/ 4
3 3 1/ 43 1/ 23 3/ 4
4 1/ 2
5
5 1/ 2
6 6 1/ 27 7 1/ 2
8 1/ 2
9 1/ 2
11
12
13 14 15
17
19
22
24
26 28 30
34
38
42
46
50
55
60 65
.02
.03
.04
.05
.06
.07
.08
.09
.10
.20
.25
.30
.35
.40
.45
.50
.60
.70
.80
.90
1.0
1.5
2.0
2.5
3.0
3.5
4.0
50 50100 100150 150200 200250 250M
Adj. for5% SD8/ 13/ 85
Adj. for3 for 26/ 3/ 86
Adj. for5% SD8/ 12/ 86
Adj. for5% SD8/ 11/ 87
Adj. for5% SD8/ 11/ 88
Adj. for5% SD8/ 22/ 89
Adj. for3 for 212/ 5/ 89
Adj. for5% SD8/ 14/ 90
Adj. for5% SD8/ 13/ 91
Adj. for5% SD8/ 11/ 92
Adj. for5% SD8/ 17/ 93
Adj. for5% SD8/ 16/ 94
Adj. for3 for 212/ 6/ 94
Adj. for5% SD8/ 17/ 95
Adj. for5% SD8/ 15/ 96
Adj. for5% SD8/ 14/ 97
Adj. for5% SD8/ 20/ 98
Adj. for5% SD8/ 19/ 99
Adj. for5% SD8/ 30/ 01
Earns. onLIF O basis
Ind AG PRD P/ E N / AN YSE Bond$4011.2 M ils.Com 559.737 M ils.Book value 30.25P/ E 16.22Country U S
G rowth Performance M easurementYears Price Earn. D iv. Total Ret.Last 1 -2.1 -22.6 4.5 1.0Last 5 -1.2 -2.8 7.8 1.5
Last 10 3.9 1.9 9.6 6.1Last 25 4.4 4.9 12.4 5.6
Agricultural processing and refining
LEG EN DRead from Right Scale:PriceRelative Strength
Bottom Band VolumeM oving Avg (48 months)Recession (G rey Shaded Bars)
Read from Left Scale:EarningsD ividends
Charts are updated daily at www.SrcStockCharts.com.
82

AR C ON IC IN C (AR N C )
Copyright 2019 Securities Research Company
'85 '86 '87 '88 '89 '90 '91 '92 '93 '94 '95 '96 '97 '98 '99 '00 '01 '02 '03 '04 '05 '06 '07 '08 '09 '10 '11 '12 '13 '14 '15 '16 '17 '18 '19 '20
1 1/ 4
1 1/ 2
1 3/ 4
2
2 1/ 4
2 1/ 2
2 3/ 4
3 3 1/ 43 1/ 23 3/ 4
4 1/ 2
5
5 1/ 2
6 6 1/ 27 7 1/ 2
8 1/ 2
9 1/ 2
11
12 13 14 15
17
19
22
24 26 28 30
34
38
42
46
50
55
60 65 70 75
85
95
110
120 130 140 150
170
190
220
240 260
.08
.09
.10
.20
.25
.30
.35
.40
.45
.50
.60
.70
.80
.90
1.0
1.5
2.0
2.5
3.0
3.5
4.0
4.5
5.0
5.5
6.0
6.57.07.5
8.5
9.5
12
14
16
60 60120 120180 180240 240300 300M
Adj. for2 for 12/ 26/ 99
Adj. for2 for 16/ 12/ 00
Adj. for1 for 3
10/ 6/ 16
See Alcoa Chart (AA)for Alcoa data
prior to spin-off
Alcoa, Inc.prior to 11/ 1/ 16
D ist. 1sh N ew Alcoafor ea. 3 shs. held
11/ 3/ 16
Ind ALU M N P/ E N / AN YSE Bond $.0 M ils.Com 482.955 M ils.Book value 11.58P/ E 15.03Country U S
G rowth Performance M easurementYears Price Earn. D iv. Total Ret.Last 1 53.3 41.2 -66.7 53.9Last 5 -9.3 -7.0 -- - -8.9
Last 10 -2.8 -- - - - - -2.6Last 25 -2.8 -- - - - - -2.7
Parent company of Alcoa, Inc.
LEG EN DRead from Right Scale:PriceRelative Strength
Bottom Band VolumeM oving Avg (48 months)Recession (G rey Shaded Bars)
Read from Left Scale:EarningsD ividends
Charts are updated daily at www.SrcStockCharts.com.
83

AR R OW ELEC TR ON IC S IN C (AR W)
Copyright 2019 Securities Research Company
'85 '86 '87 '88 '89 '90 '91 '92 '93 '94 '95 '96 '97 '98 '99 '00 '01 '02 '03 '04 '05 '06 '07 '08 '09 '10 '11 '12 '13 '14 '15 '16 '17 '18 '19 '20
3/ 4
1
1 1/ 4
1 1/ 2
1 3/ 4
2
2 1/ 4
2 1/ 2
2 3/ 4
3
3 1/ 43 1/ 23 3/ 4
4 1/ 2
5
5 1/ 2
6
6 1/ 27 7 1/ 2
8 1/ 2
9 1/ 2
11
12
13 14 15
17
19
22
24 26 28 30
34
38
42
46
50
55
60
65 70 75
85
95
110
120
130 140 150
.05
.06
.07
.08
.09
.10
.20
.25
.30
.35
.40
.45
.50
.60
.70
.80
.90
1.0
1.5
2.0
2.5
3.0
3.5
4.0
4.5
5.0
5.5
6.06.57.07.5
8.5
9.5
10 1020 2030 3040 4050 50M
(0.04)
(0.84)
(1.28)
(1.90)
(2.46)
(2.41)
(1.88)
(1.58)
(0.81)
(1.59)
(1.59)
(1.05)
(0.67)
(0.17)
(0.64)
(0.10)
(0.07)
0.04
0.03
Adj. for2 for 1
10/ 16/ 97D ividend omitted
12/ 17/ 86
Anthem Electronicsacq. 11/ 28/ 94
Ind TD STR P/ E N / AN YSE Bond$976.8 M ils.Com 87.389 M ils.Book value 51.10P/ E 10.73Country U S
G rowth Performance M easurementYears Price Earn. D iv. Total Ret.Last 1 11.2 -13.8 .0 11.2Last 5 8.9 5.8 .0 8.9
Last 10 12.4 16.7 .0 12.4Last 25 6.3 6.4 .0 6.3
E D istributes electronic components and computer products
LEG EN DRead from Right Scale:PriceRelative Strength
Bottom Band VolumeM oving Avg (48 months)Recession (G rey Shaded Bars)
Read from Left Scale:EarningsD ividends
Charts are updated daily at www.SrcStockCharts.com.
84

AR R OW F IN AN C IAL C OR P OR ATION (AR OW)
Copyright 2019 Securities Research Company
'85 '86 '87 '88 '89 '90 '91 '92 '93 '94 '95 '96 '97 '98 '99 '00 '01 '02 '03 '04 '05 '06 '07 '08 '09 '10 '11 '12 '13 '14 '15 '16 '17 '18 '19 '20
1/ 4
1/ 2
3/ 4
1
1 1/ 4
1 1/ 2
1 3/ 4
2
2 1/ 4
2 1/ 2
2 3/ 4
3
3 1/ 43 1/ 23 3/ 4
4 1/ 2
5
5 1/ 2
6 6 1/ 27 7 1/ 2
8 1/ 2
9 1/ 2
11
12 13 14 15
17
19
22
24 26 28 30
34
38
42
46
50
55
.02
.03
.04
.05
.06
.07
.08
.09
.10
.20
.25
.30
.35
.40
.45
.50
.60
.70
.80
.90
1.0
1.5
2.0
2.5
3.0
3.5
200 200400 400600 600800 800
1000 1000T
(1.95)
Adj. for5% SD5/ 9/ 85
Adj. for5 for 410/ 2/ 85
Adj. for2 for 16/ 2/ 86
Adj. for2 for 19/ 2/ 87
Adj. for5% SD1/ 27/ 88
Adj. for5% SD1/ 31/ 89
Adj. for2% SD8/ 9/ 91
Adj. for4% SD11/ 9/ 92
Adj. for4% SD10/ 5/ 93
Adj. for4% SD10/ 5/ 94
Adj. for4% SD
10/ 10/ 95
Adj. for10% SD10/ 9/ 96
Adj. for5% SD
11/ 12/ 97
Adj. for10% SD7/ 30/ 98
Adj. for25% SD11/ 1/ 99
Adj. for5% SD
10/ 31/ 01
Adj. for5% SD
10/ 31/ 02
Adj. for5 for 4
9/ 30/ 03
Adj. for3% SD9/ 20/ 04
Adj. for3% SD9/ 20/ 05
Adj. for3% SD9/ 20/ 06
Adj. for3% SD9/ 19/ 07
Adj. for3% SD9/ 16/ 09
Adj. for3% SD9/ 17/ 10
Adj. for3% SD9/ 19/ 11
Adj. for2% SD9/ 17/ 12
Adj. for2% SD9/ 17/ 13
Adj. for2% SD9/ 17/ 14
Adj. for2% SD9/ 17/ 15
Adj. for3% SD9/ 17/ 16
Adj. for3% SD9/ 19/ 17
Adj. for3% SD9/ 18/ 18
Adj. for3% SD9/ 16/ 19
Arrow Bank Corp.prior to 7/ 2/ 90
D ividendOmitted8/ 1/ 91
Ind RBAN K P/ E N / AN asdaq Bond$85.0 M ils.Com 14.436 M ils.Book value 16.49P/ E 15.17Country U S
G rowth Performance M easurementYears Price Earn. D iv. Total Ret.Last 1 19.7 .3 3.0 23.0Last 5 10.7 8.7 3.6 13.4
Last 10 6.3 5.3 3.0 8.6Last 25 8.7 5.9 8.3 10.3
Offer retail services, money market accounts, CD s, and IRAs
LEG EN DRead from Right Scale:PriceRelative Strength
Bottom Band VolumeM oving Avg (48 months)Recession (G rey Shaded Bars)
Read from Left Scale:EarningsD ividends
Charts are updated daily at www.SrcStockCharts.com.
85

ASC EN A R ETAIL G R OU P IN C (ASN A)
Copyright 2019 Securities Research Company
'85 '86 '87 '88 '89 '90 '91 '92 '93 '94 '95 '96 '97 '98 '99 '00 '01 '02 '03 '04 '05 '06 '07 '08 '09 '10 '11 '12 '13 '14 '15 '16 '17 '18 '19 '20
2 1/ 4
2 1/ 2
2 3/ 4
3 3 1/ 43 1/ 2
4
4 1/ 2
5
5 1/ 2
6 6 1/ 27
8
9
10
11
12 13 14
16
18
20
22
24 26 28
32
36
40
44
48
55
60 65 70
80
90
100
110
120 130 140
160
180
200
220
240 260 280
320
360
400
440
480
600
.20
.25
.30
.35
.40
.45
.50
.60
.70
.80
.90
1.0
1.5
2.0
2.5
3.0
3.5
4.0
4.5
5.0
5.5
6.06.57.0
8.0
9.0
10
12
14
16
18
20
25
30
35
40
45
2 24 46 68 8
10 10M
(30.80)
(29.20)
(30.40)
(31.00) (0.60)
(0.20)
(1.20)
(1.40)
(1.40)
(8.00)
Adj. for5 for 25/ 5/ 86
Adj. for2 for 15/ 26/ 87
Adj. for2 for 16/ 3/ 02
Adj. for2 for 14/ 3/ 06
Adj. for2 for 14/ 4/ 12
Adj. for1 for 2012/ 18/ 19
AcquiredTween Brands
11/ 25/ 09
D ress Barn, Inc.prior to 1/ 3/ 11
Charming Shoppesacquired 6/ 15/ 12
Ann, Inc.acquired 8/ 21/ 15
Ind RTAPP P/ E N / AN asdaq Bond $.0 M ils.Com 196.374 M ils.Book value 9.75P/ E N / ACountry U S
G rowth Performance M easurementYears Price Earn. D iv. Total Ret.Last 1 -86.2 -471.4 -- - -86.2Last 5 -50.7 -- - - - - -50.7
Last 10 -29.9 -- - - - - -29.9Last 25 -5.1 -- - - - - -5.1
Women's apparel stores 95% SC ALE
LEG EN DRead from Right Scale:PriceRelative Strength
Bottom Band VolumeM oving Avg (48 months)Recession (G rey Shaded Bars)
Read from Left Scale:EarningsD ividends
Charts are updated daily at www.SrcStockCharts.com.
86

ASH LAN D IN C . (ASH )
Copyright 2019 Securities Research Company
'85 '86 '87 '88 '89 '90 '91 '92 '93 '94 '95 '96 '97 '98 '99 '00 '01 '02 '03 '04 '05 '06 '07 '08 '09 '10 '11 '12 '13 '14 '15 '16 '17 '18 '19 '20
1 1/ 2
1 3/ 4
2
2 1/ 4
2 1/ 2
2 3/ 4
3 3 1/ 43 1/ 23 3/ 4
4 1/ 2
5
5 1/ 2
6
6 1/ 27 7 1/ 2
8 1/ 2
9 1/ 2
11
12
13 14 15
17
19
22
24
26 28 30
34
38
42
46
50
55
60
65 70 75
85
95
110
120
130 140 150
170
190
220
240
260 280 300
.09
.10
.20
.25
.30
.35
.40
.45
.50
.60
.70
.80
.90
1.0
1.5
2.0
2.5
3.0
3.5
4.0
4.5
5.0
5.5
6.06.57.07.5
8.5
9.5
12
14
16
18
20
20 2040 4060 6080 80
100 100M
Adj. for2 for 17/ 27/ 88
Earns. onLIF O basis
J.T. Baker Chem.acq. 10/ 7/ 85
Ashland Oilprior to 1/ 30/ 95
D ist. .2461 sh.Arch Coal for ea.sh. ASH 3/ 30/ 00
D ist. .2364 sh.M arathon OilCorp. for ea.
sh. ASH 6/ 30/ 05
Special$10.20
D ist. 2.745 shs. Valvaline Inc.for ea. sh. ASH
5/ 5/ 17
Ind D CH EM P/ E N / AN YSE Bond $70.0 M ils.Com 62.426 M ils.Book value 54.75P/ E 29.63Country U S
G rowth Performance M easurementYears Price Earn. D iv. Total Ret.Last 1 -2.0 -30.3 10.0 - .6Last 5 -8.9 -16.1 -4.2 -7.4
Last 10 6.3 -3.8 13.9 7.7Last 25 3.4 - .0 .0 4.6
D Petroleum refining, chemicals, engineering services, coal
LEG EN DRead from Right Scale:PriceRelative Strength
Bottom Band VolumeM oving Avg (48 months)Recession (G rey Shaded Bars)
Read from Left Scale:EarningsD ividends
Charts are updated daily at www.SrcStockCharts.com.
87

ASSOC IATED BAN C C OR P (ASB)
Copyright 2019 Securities Research Company
'85 '86 '87 '88 '89 '90 '91 '92 '93 '94 '95 '96 '97 '98 '99 '00 '01 '02 '03 '04 '05 '06 '07 '08 '09 '10 '11 '12 '13 '14 '15 '16 '17 '18 '19 '20
1/ 2
3/ 4
1
1 1/ 4
1 1/ 2
1 3/ 4
2
2 1/ 4
2 1/ 2
2 3/ 4
3 3 1/ 43 1/ 23 3/ 4
4 1/ 2
5
5 1/ 2
6 6 1/ 27 7 1/ 2
8 1/ 2
9 1/ 2
11
12
13 14 15
17
19
22
24
26 28 30
34
38
42
46
50
55
60 65
.02
.03
.04
.05
.06
.07
.08
.09
.10
.20
.25
.30
.35
.40
.45
.50
.60
.70
.80
.90
1.0
1.5
2.0
2.5
3.0
3.5
4.0
10 1020 2030 3040 4050 50M
(1.15)
(1.73)
(1.60)
(1.63)
(0.18)
Adj. for2 for 1
9/ 18/ 85
Adj. for10% SD5/ 12/ 87
Adj. for10% SD5/ 10/ 90
Adj. for10% SD8/ 16/ 93
Adj. for5 for 4
6/ 16/ 95
Adj. for6 for 53/ 3/ 97
Adj. for5 for 46/ 15/ 98
Adj. for10% SD5/ 30/ 00
Adj. for10% SD4/ 25/ 02
Adj. for3 for 2
5/ 13/ 04
F irst F inancial Corp. (Wis.)acquired 10/ 29/ 97
ListedN YSE 12/ 24/ 14
N asdaq prior
Ind RBAN K P/ E N / AN YSE Bond $24.3 M ils.Com 172.094 M ils.Book value 19.27P/ E 10.46Country U S
G rowth Performance M easurementYears Price Earn. D iv. Total Ret.Last 1 -3.4 -1.0 5.9 - .2Last 5 4.5 11.3 12.5 7.0
Last 10 5.1 -- - 13.7 6.8Last 25 2.8 3.1 3.3 5.1
D Bank holding company based in Wisconsin
LEG EN DRead from Right Scale:PriceRelative Strength
Bottom Band VolumeM oving Avg (48 months)Recession (G rey Shaded Bars)
Read from Left Scale:EarningsD ividends
Charts are updated daily at www.SrcStockCharts.com.
88

ASTEC IN D S IN C (ASTE)
Copyright 2019 Securities Research Company
'85 '86 '87 '88 '89 '90 '91 '92 '93 '94 '95 '96 '97 '98 '99 '00 '01 '02 '03 '04 '05 '06 '07 '08 '09 '10 '11 '12 '13 '14 '15 '16 '17 '18 '19 '20
1/ 2
3/ 4
1
1 1/ 4
1 1/ 2
1 3/ 4
2
2 1/ 4
2 1/ 2
2 3/ 4
3 3 1/ 43 1/ 2
4
4 1/ 2
5
5 1/ 2
6 6 1/ 27
8
9
10
11
12 13 14
16
18
20
22
24 26 28
32
36
40
44
48
55
60 65 70
80
90
100
110
.03
.04
.05
.06
.07
.08
.09
.10
.20
.25
.30
.35
.40
.45
.50
.60
.70
.80
.90
1.0
1.5
2.0
2.5
3.0
3.5
4.0
4.5
5.0
5.5
6.06.57.0
3 36 69 9
12 1215 15M
(0.27)
(0.34)
(0.94)
(1.04)
(1.13)
(1.12)
(0.56)
(0.26)
(0.02)
(0.06)
(0.07)
(0.24)
(0.57)
(0.58)
(0.55)
(1.26)
(0.87)
(0.66)
(0.61)
Adj. for2 for 1
9/ 13/ 93
Adj. for2 for 1
1/ 19/ 99
Ind TRKPT P/ E N / AN asdaq Bond$102.7 M ils.Com 23.094 M ils.Book value 28.44P/ E 24.37Country U S
G rowth Performance M easurementYears Price Earn. D iv. Total Ret.Last 1 13.9 -38.4 .0 15.1Last 5 3.5 3.0 1.9 4.5
Last 10 5.4 8.9 -- - 6.1Last 25 8.2 4.0 -- - 8.4
Equipment/ components for road building & other construction 95% SC ALE
LEG EN DRead from Right Scale:PriceRelative Strength
Bottom Band VolumeM oving Avg (48 months)Recession (G rey Shaded Bars)
Read from Left Scale:EarningsD ividends
Charts are updated daily at www.SrcStockCharts.com.
89

ASTR AZEN EC A PLC (AZN )
Copyright 2019 Securities Research Company
'85 '86 '87 '88 '89 '90 '91 '92 '93 '94 '95 '96 '97 '98 '99 '00 '01 '02 '03 '04 '05 '06 '07 '08 '09 '10 '11 '12 '13 '14 '15 '16 '17 '18 '19 '20
1
1 1/ 4
1 1/ 2
1 3/ 4
2
2 1/ 4
2 1/ 2
2 3/ 4
3 3 1/ 43 1/ 23 3/ 4
4 1/ 2
5
5 1/ 2
6
6 1/ 27 7 1/ 2
8 1/ 2
9 1/ 2
11
12
13 14 15
17
19
22
24
26 28 30
34
38
42
46
50
55
60
65 70 75
85
95
110
120
130 140 150
170
190
.06
.07
.08
.09
.10
.20
.25
.30
.35
.40
.45
.50
.60
.70
.80
.90
1.0
1.5
2.0
2.5
3.0
3.5
4.0
4.5
5.0
5.5
6.06.57.07.5
8.5
9.5
12
100 100200 200300 300400 400500 500M
Adj. for3 for 14/ 8/ 98
Adj. for2 for 17/ 27/ 15
Zeneca G roup plcprior to 4/ 9/ 99
D ist. .1243 Amer. D ep.shs. Syngenta AG for
ea. sh. AZN 11/ 14/ 00
M edImmune Incacquired 6/ 18/ 07
D ividends free of British tax
D IVID EN D SEQU EN CE IS VARIABLE
Ind D RU G S P/ E N / AN YSE Bond$740.0 M ils.Com 1266.785 M ils.Book value 11.74P/ E 20.35CountryG reat Britian (U K)
G rowth Performance M easurementYears Price Earn. D iv. Total Ret.Last 1 36.3 41.6 1.5 40.1Last 5 7.0 2.7 - .1 9.8
Last 10 7.9 -1.9 2.9 10.6Last 25 8.2 8.0 7.5 9.7
AD R - Pharmaceuticals, agricultural chemicals, healthcare services
LEG EN DRead from Right Scale:PriceRelative Strength
Bottom Band VolumeM oving Avg (48 months)Recession (G rey Shaded Bars)
Read from Left Scale:EarningsD ividends
Charts are updated daily at www.SrcStockCharts.com.
90

ASTR O- M ED , IN C . (ALOT)
Copyright 2019 Securities Research Company
'85 '86 '87 '88 '89 '90 '91 '92 '93 '94 '95 '96 '97 '98 '99 '00 '01 '02 '03 '04 '05 '06 '07 '08 '09 '10 '11 '12 '13 '14 '15 '16 '17 '18 '19 '20
1/ 2
3/ 4
1
1 1/ 4
1 1/ 2
1 3/ 4
2
2 1/ 4
2 1/ 2
2 3/ 4
3 3 1/ 43 1/ 23 3/ 4
4 1/ 2
5
5 1/ 2
6 6 1/ 27 7 1/ 2
8 1/ 2
9 1/ 2
11
12
13 14 15
17
19
22
24
26 28 30
34
38
42
46
50
55
60 65
.02
.03
.04
.05
.06
.07
.08
.09
.10
.20
.25
.30
.35
.40
.45
.50
.60
.70
.80
.90
1.0
1.5
2.0
2.5
3.0
3.5
4.0
400 400800 800
1200 12001600 16002000 2000T
(0.03)
(0.04)
(0.17)
(0.04)
(0.12)
(0.32)
(0.12)
(0.01)
Adj. for3 for 28/ 16/ 88
Adj. for3 for 2
5/ 19/ 92
Adj. for10% SD4/ 30/ 04
Adj. for5 for 47/ 3/ 06
Special$0.07
Ind D ISKS P/ E N / AN asdaq Bond $.0 M ils.Com 6.924 M ils.Book value 9.43P/ E 17.77Country U S
G rowth Performance M easurementYears Price Earn. D iv. Total Ret.Last 1 -33.3 29.3 .0 -31.5Last 5 -2.3 5.6 .0 - .1
Last 10 6.3 15.3 1.6 8.4Last 25 1.8 3.1 4.8 3.1
E Specialty printers for the aerospace and medical industries
LEG EN DRead from Right Scale:PriceRelative Strength
Bottom Band VolumeM oving Avg (48 months)Recession (G rey Shaded Bars)
Read from Left Scale:EarningsD ividends
Charts are updated daily at www.SrcStockCharts.com.
91

ASTR ON IC S C OR P (ATR O)
Copyright 2019 Securities Research Company
'85 '86 '87 '88 '89 '90 '91 '92 '93 '94 '95 '96 '97 '98 '99 '00 '01 '02 '03 '04 '05 '06 '07 '08 '09 '10 '11 '12 '13 '14 '15 '16 '17 '18 '19 '20
1/ 2
3/ 4
1
1 1/ 4
1 1/ 2
1 3/ 4
2
2 1/ 4
2 1/ 2
2 3/ 4
3 3 1/ 43 1/ 2
4
4 1/ 2
5
5 1/ 2
6 6 1/ 27
8
9
10
11
12 13 14
16
18
20
22
24 26 28
32
36
40
44
48
55
60 65 70
80
90
100
110
.03
.04
.05
.06
.07
.08
.09
.10
.20
.25
.30
.35
.40
.45
.50
.60
.70
.80
.90
1.0
1.5
2.0
2.5
3.0
3.5
4.0
4.5
5.0
5.5
6.06.57.0
2 24 46 68 8
10 10M
(0.03)
(0.03)
(0.10)
(0.18)
(0.14)
(0.06)
0.01
0.02
(0.09)
(0.04)
(0.03)
Adj. for5 for 45/ 28/ 85
Adj. for5 for 4
5/ 27/ 86
Adj. for5 for 45/ 26/ 87
Adj. for2 for 1
10/ 5/ 88
Adj. for5 for 4
10/ 1/ 96
Adj. for10% SD10/ 14/ 98
Adj. for10% SD10/ 13/ 00
Ind AEROD P/ E N / AN asdaq Bond $9.4 M ils.Com 21.544 M ils.Book value 13.87P/ E 25.75Country U S
G rowth Performance M easurementYears Price Earn. D iv. Total Ret.Last 1 -8.5 -26.8 -- - -8.5Last 5 -12.8 -18.5 -- - -12.8
Last 10 13.2 3.9 -- - 13.2Last 25 12.0 6.6 -- - 12.0
M anufactures lighting and packaging products 95% SC ALE
LEG EN DRead from Right Scale:PriceRelative Strength
Bottom Band VolumeM oving Avg (48 months)Recession (G rey Shaded Bars)
Read from Left Scale:EarningsD ividends
Charts are updated daily at www.SrcStockCharts.com.
92

ASU R E SOF TWAR E IN C (ASU R )
Copyright 2019 Securities Research Company
'85 '86 '87 '88 '89 '90 '91 '92 '93 '94 '95 '96 '97 '98 '99 '00 '01 '02 '03 '04 '05 '06 '07 '08 '09 '10 '11 '12 '13 '14 '15 '16 '17 '18 '19 '20
1/ 4
1/ 2
3/ 4
1
1 1/ 4
1 1/ 2
1 3/ 4
2 2 1/ 42 1/ 2
3
3 1/ 2
4 4 1/ 25
6
7
8 9 10
12
14
16 18 20
24
28
32 36 40
46
55
65
75
85 95
110
130
150
170 190
220
260
300
340 380
440
500
600
700
800 900
.02
.03
.04
.05
.06
.07
.08
.09
.10
.20
.25
.30
.35
.40
.45
.50
.60
.70
.80
.901.0
1.5
2.0
2.5
3.0
3.5
4.04.55.0
6.0
7.0
8.09.010
12
14
161820
25
30
35
404550
60
4 48 8
12 1216 1620 20M
(3.07)
(0.60)
(3.07)
(5.13)
(7.00)
(6.53)
(4.53)
(2.47)
(3.80)
(3.40)
(3.00)
(1.40)
(16.33)
(17.73)
(18.00)
(17.93)
(1.27)
(3.53)
(3.67)
(4.40)
(3.73)
(2.47)
(4.60)
(7.27)
(8.47)
(9.40)
(9.40)
(9.00)
(6.53)
(4.60) (2.13)
(3.73)
(5.67)
(4.87)
(1.33)
(1.27)
(2.67)
(3.13)
(2.27)
(1.53)
(0.93)
(0.33)
(1.13)
(1.27)
(1.27)
(1.20)
(1.93)
(1.93)
(1.93)
(0.25)
(0.22)
0.01
(0.14)
(0.31)
(0.40)
(0.53)
(0.41)
(0.42)
(0.42)
(0.26)
(0.15)
(0.02)
(0.04)
(0.16)
(0.24)
(0.13)
Adj. for1 for 10
12/ 29/ 09
Adj. for3 for 25/ 1/ 12
Video Telecom Corp.prior to 7/ 7/ 93
Compression Labs, Inc.acquired 5/ 27/ 97
F orgent N etwork prior to 9/ 13/ 07
Ind APPSF P/ E N / AN asdaq Bond $4.7 M ils.Com 15.223 M ils.Book value .92P/ E 16.76Country U S
G rowth Performance M easurementYears Price Earn. D iv. Total Ret.Last 1 54.6 -12.5 -- - 54.6Last 5 8.4 43.7 -- - 8.4
Last 10 18.5 -- - - - - 18.5Last 25 -8.2 8.3 -- - -8.2
Videoconferencing technology 65% SC ALE
LEG EN DRead from Right Scale:PriceRelative Strength
Bottom Band VolumeM oving Avg (48 months)Recession (G rey Shaded Bars)
Read from Left Scale:EarningsD ividends
Charts are updated daily at www.SrcStockCharts.com.
93

AT&T IN C (T)
Copyright 2019 Securities Research Company
'85 '86 '87 '88 '89 '90 '91 '92 '93 '94 '95 '96 '97 '98 '99 '00 '01 '02 '03 '04 '05 '06 '07 '08 '09 '10 '11 '12 '13 '14 '15 '16 '17 '18 '19 '20
2 1/ 4
2 1/ 2
2 3/ 4
3
3 1/ 43 1/ 23 3/ 4
4 1/ 2
5
5 1/ 2
6 6 1/ 27 7 1/ 2
8 1/ 2
9 1/ 2
11
12 13 14 15
17
19
22
24 26 28 30
34
38
42
46
50
55
60 65 70 75
85
95
110
120 130 140 150
170
190
220
240 260 280 300
340
380
420
460
500
.20
.25
.30
.35
.40
.45
.50
.60
.70
.80
.90
1.0
1.5
2.0
2.5
3.0
3.5
4.0
4.5
5.0
5.5
6.0
6.57.07.5
8.5
9.5
12
14
16
18
20
25
30
35
150 150300 300450 450600 600750 750M
Adj. for3 for 15/ 26/ 87
Adj. for2 for 15/ 26/ 93
Adj. for2 for 13/ 20/ 98
N CR Corp.acquired 9/ 19/ 91by AT&T (old)
Southwestern Bellprior to 5/ 1/ 95
Pacific Telesisacq. 4/ 1/ 97
Ameritech Corp.acquired 10/ 8/ 99
Specials$0.25
AT&T (OLD )acquired11/ 18/ 05
SBC Communicationsprior to 11/ 18/ 05
BellSouthacquired 1/ 2/ 07
D obson Commacquired 11/ 19/ 07 Centennial Comm.
Acquired11/ 09/ 09
Leap Wireless Int'l.acquired 3/ 14/ 14
To acquire}D IRECTV
To acquireTime Warner Inc.
To acquireLeap Wireless Int'l. Inc.
Ind PH ON E P/ E N / AN YSE Bond$50063.0 M ils.Com 7262.000 M ils.Book value 20.31P/ E 10.86Country U S
G rowth Performance M easurementYears Price Earn. D iv. Total Ret.Last 1 28.3 .9 2.0 35.1Last 5 3.2 7.2 2.1 8.0
Last 10 4.3 4.9 2.2 8.5Last 25 2.4 3.9 3.9 5.1
Provides global telecommunication services
LEG EN DRead from Right Scale:PriceRelative Strength
Bottom Band VolumeM oving Avg (48 months)Recession (G rey Shaded Bars)
Read from Left Scale:EarningsD ividends
Charts are updated daily at www.SrcStockCharts.com.
94

ATM OS EN ER G Y C OR POR ATION (ATO)
Copyright 2019 Securities Research Company
'85 '86 '87 '88 '89 '90 '91 '92 '93 '94 '95 '96 '97 '98 '99 '00 '01 '02 '03 '04 '05 '06 '07 '08 '09 '10 '11 '12 '13 '14 '15 '16 '17 '18 '19 '20
1 1/ 4
1 1/ 2
1 3/ 4
2
2 1/ 4
2 1/ 2
2 3/ 4
3 3 1/ 43 1/ 23 3/ 4
4 1/ 2
5
5 1/ 2
6 6 1/ 27 7 1/ 2
8 1/ 2
9 1/ 2
11
12 13 14 15
17
19
22
24 26 28 30
34
38
42
46
50
55
60 65 70 75
85
95
110
120 130 140 150
170
190
220
240 260
.08
.09
.10
.20
.25
.30
.35
.40
.45
.50
.60
.70
.80
.90
1.0
1.5
2.0
2.5
3.0
3.5
4.0
4.5
5.0
5.5
6.0
6.57.07.5
8.5
9.5
12
14
16
12 1224 2436 3648 4860 60M
Adj. for2 for 1
6/ 13/ 85
Adj. for3 for 2
5/ 17/ 94
Energas Co.prior to 1988
Ind G U TIL P/ E N / AN YSE Bond$2180.4 M ils.Com 111.201 M ils.Book value 35.02P/ E 25.49Country U S
G rowth Performance M easurementYears Price Earn. D iv. Total Ret.Last 1 14.1 9.3 9.5 16.3Last 5 14.4 8.0 8.1 16.2
Last 10 15.0 8.5 5.6 16.5Last 25 8.0 6.4 3.7 9.1
N atural gas and propane distributor
LEG EN DRead from Right Scale:PriceRelative Strength
Bottom Band VolumeM oving Avg (48 months)Recession (G rey Shaded Bars)
Read from Left Scale:EarningsD ividends
Charts are updated daily at www.SrcStockCharts.com.
95

ATN IN TL IN C (ATN I)
Copyright 2019 Securities Research Company
'85 '86 '87 '88 '89 '90 '91 '92 '93 '94 '95 '96 '97 '98 '99 '00 '01 '02 '03 '04 '05 '06 '07 '08 '09 '10 '11 '12 '13 '14 '15 '16 '17 '18 '19 '20
3/ 4
1
1 1/ 4
1 1/ 2
1 3/ 4
2
2 1/ 4
2 1/ 2
2 3/ 4
3 3 1/ 43 1/ 23 3/ 4
4 1/ 2
5
5 1/ 2
6
6 1/ 27 7 1/ 2
8 1/ 2
9 1/ 2
11
12
13 14 15
17
19
22
24 26 28 30
34
38
42
46
50
55
60
65 70 75
85
95
110
120
130
.04
.05
.06
.07
.08
.09
.10
.20
.25
.30
.35
.40
.45
.50
.60
.70
.80
.90
1.0
1.5
2.0
2.5
3.0
3.5
4.0
4.5
5.0
5.5
6.06.57.07.5
8.5
4 48 8
12 1216 1620 20M
(0.10) 0.01
Adj. for5 for 24/ 3/ 06
D ividendomitted8/ 17/ 93
ListedN ASD AQ 5/ 23/ 06
ASE prior
Ind PH ON E P/ E N / AN asdaq Bond $8.0 M ils.Com 15.957 M ils.Book value 42.59P/ E 5569.00Country Virgin Islands
G rowth Performance M easurementYears Price Earn. D iv. Total Ret.Last 1 -25.3 -99.2 .0 -24.4Last 5 -3.5 -68.3 -10.1 -1.8
Last 10 1.4 -42.6 -1.6 3.1Last 25 11.8 -14.0 6.0 12.9
Telecommunications services in G uyana & the Virgin Islands
LEG EN DRead from Right Scale:PriceRelative Strength
Bottom Band VolumeM oving Avg (48 months)Recession (G rey Shaded Bars)
Read from Left Scale:EarningsD ividends
Charts are updated daily at www.SrcStockCharts.com.
96

AU TOD ESK IN C (AD SK)
Copyright 2019 Securities Research Company
'85 '86 '87 '88 '89 '90 '91 '92 '93 '94 '95 '96 '97 '98 '99 '00 '01 '02 '03 '04 '05 '06 '07 '08 '09 '10 '11 '12 '13 '14 '15 '16 '17 '18 '19 '20
1/ 2
3/ 4
1
1 1/ 4
1 1/ 2
1 3/ 4
2
2 1/ 4
2 1/ 22 3/ 43
3 1/ 2
4
4 1/ 2
5 5 1/ 26
7
8
9
10 11 12
14
16
18
20 22 24
28
32
36
40 44 48
55 60
70
80
90
100 110 120
140
160
180
200 220 240
280
320
360
400
.03
.04
.05
.06
.07
.08
.09
.10
.20
.25
.30
.35
.40
.45
.50
.60
.70
.80
.90
1.0
1.5
2.0
2.5
3.0
3.5
4.0
4.5
5.05.56.0
7.0
8.0
9.0
10
12
14
16
18
20
25
40 4080 80
120 120160 160200 200M
0.01
0.02
(0.02)
(0.51)
(0.57)
(0.73)
(0.67)
(0.48)
(0.26)
Adj. for3 for 13/ 30/ 87
Adj. for2 for 1
10/ 31/ 94
Adj. for2 for 1
4/ 19/ 02
Adj. for2 for 1
12/ 21/ 04Special$0.188
Softdesk Inc.acq. 3/ 31/ 97
D ividendomitted7/ 18/ 05
Ind APPSF P/ E N / AN asdaq Bond $.0 M ils.Com 218.617 M ils.Book value 6.55P/ E 82.21Country U S
G rowth Performance M easurementYears Price Earn. D iv. Total Ret.Last 1 30.7 420.0 .0 30.7Last 5 28.9 12.1 .0 28.9
Last 10 23.2 8.9 .0 23.2Last 25 13.4 8.2 .0 13.4
P Provider of CAD and drafting software 80% SC ALE
LEG EN DRead from Right Scale:PriceRelative Strength
Bottom Band VolumeM oving Avg (48 months)Recession (G rey Shaded Bars)
Read from Left Scale:EarningsD ividends
Charts are updated daily at www.SrcStockCharts.com.
97

AU TOM ATIC D ATA PR OC ESSIN G IN (AD P)
Copyright 2019 Securities Research Company
'85 '86 '87 '88 '89 '90 '91 '92 '93 '94 '95 '96 '97 '98 '99 '00 '01 '02 '03 '04 '05 '06 '07 '08 '09 '10 '11 '12 '13 '14 '15 '16 '17 '18 '19 '20
1/ 2
3/ 4
1
1 1/ 4
1 1/ 2
1 3/ 4
2
2 1/ 4
2 1/ 2
2 3/ 43 3 1/ 4
3 3/ 4
4 1/ 2
5
5 1/ 26 6 1/ 2
7 1/ 2
8 1/ 2
9 1/ 2
11 12 13
15
17
19
22 24 26
30
34
38
42 46 50
55 60 65
75
85
95
110 120 130
150
170
190
220 240 260
.03
.04
.05
.06
.07
.08
.09
.10
.20
.25
.30
.35
.40
.45
.50
.60
.70
.80
.90
1.0
1.5
2.0
2.5
3.0
3.5
4.0
4.5
5.0
5.56.06.5
7.5
8.5
9.5
12
14
16
20 2040 4060 6080 80
100 100M
Adj. for2 for 16/ 9/ 86
Adj. for2 for 15/ 1/ 91
Adj. for2 for 11/ 2/ 96
Adj. for2 for 11/ 4/ 99
D ist. 1 sh. Broadridge F inancial Solutionsfor ea. 4 shs. AD P held 3/ 23/ 07
Ind D PSVS P/ E N / AN asdaq Bond$17861.7 M ils.Com 437.440 M ils.Book value 11.20P/ E 30.61Country U S
G rowth Performance M easurementYears Price Earn. D iv. Total Ret.Last 1 22.3 12.2 14.5 25.3Last 5 15.7 13.2 10.5 17.4
Last 10 15.4 8.8 9.1 16.8Last 25 10.3 9.1 12.9 11.0
Wide variety of computer services 85% SC ALE
LEG EN DRead from Right Scale:PriceRelative Strength
Bottom Band VolumeM oving Avg (48 months)Recession (G rey Shaded Bars)
Read from Left Scale:EarningsD ividends
Charts are updated daily at www.SrcStockCharts.com.
98

AU TON ATION IN C (AN )
Copyright 2019 Securities Research Company
'85 '86 '87 '88 '89 '90 '91 '92 '93 '94 '95 '96 '97 '98 '99 '00 '01 '02 '03 '04 '05 '06 '07 '08 '09 '10 '11 '12 '13 '14 '15 '16 '17 '18 '19 '20
3/ 4
1
1 1/ 4
1 1/ 2
1 3/ 4
2
2 1/ 4
2 1/ 2
2 3/ 4
3 3 1/ 43 1/ 23 3/ 4
4 1/ 2
5
5 1/ 2
6 6 1/ 27 7 1/ 2
8 1/ 2
9 1/ 2
11
12 13 14 15
17
19
22
24
26 28 30
34
38
42
46
50
55
60 65 70 75
85
95
110
120 130
.04
.05
.06
.07
.08
.09
.10
.20
.25
.30
.35
.40
.45
.50
.60
.70
.80
.90
1.0
1.5
2.0
2.5
3.0
3.5
4.0
4.5
5.0
5.5
6.06.57.07.5
8.5
40 4080 80
120 120160 160200 200M
0.01 (0.34)
(0.31)
(0.28)
(0.25) (0.12)
(0.10)
(0.01)
(0.11)
Adj. for2 for 16/ 10/ 96
Republic Waste Inds.prior to 11/ 28/ 95
Addington Res.acq, 12/ 9/ 96
Alamo Rent-a-Caracq. 11/ 25/ 96
D ist. 1 sh. RepublicEnvironmental Sys.
for ea. 2 sh. AN4/ 26/ 95
Continental WasteInds. acq. 12/ 30/ 96
ListedN YSE 6/ 20/ 97
OTC prior
Republic Industries, Inc.prior to 4/ 6/ 99
D ist. .125 sh.AN C Rental for
ea. sh. AN 7/ 3/ 00
Ind AU TOR P/ E N / AN YSE Bond$1557.9 M ils.Com 89.865 M ils.Book value 22.95P/ E 10.49Country U S
G rowth Performance M easurementYears Price Earn. D iv. Total Ret.Last 1 17.2 - .2 -- - 17.2Last 5 -5.3 4.3 -- - -5.3
Last 10 9.7 14.0 -- - 9.7Last 25 13.8 13.1 -- - 13.8
Auto rental and retailing, waste management, home security systems
LEG EN DRead from Right Scale:PriceRelative Strength
Bottom Band VolumeM oving Avg (48 months)Recession (G rey Shaded Bars)
Read from Left Scale:EarningsD ividends
Charts are updated daily at www.SrcStockCharts.com.
99

AU TOZON E IN C (AZO)
Copyright 2019 Securities Research Company
'85 '86 '87 '88 '89 '90 '91 '92 '93 '94 '95 '96 '97 '98 '99 '00 '01 '02 '03 '04 '05 '06 '07 '08 '09 '10 '11 '12 '13 '14 '15 '16 '17 '18 '19 '20
4 1/ 2
5
5 1/ 26 6 1/ 2
7 1/ 2
8 1/ 2
9 1/ 2
11 12 13
15
17
19
22 24 26
30
34
38
42
46 50
55 60 65
75
85
95
110 120 130
150
170
190
220 240 260
300
340
380
420
460 500
600
700
800
900
1000
1100 1200 1300
1500
1700
1900
.30
.35
.40
.45
.50
.60
.70
.80
.90
1.0
1.5
2.0
2.5
3.0
3.5
4.0
4.5
5.0
5.56.06.57.0
8.0
9.0
10
12
14
16
18
20
25
30
35
40
45
50
60
70
80
90
100
110120
10 1020 2030 3040 4050 50M
0.02
0.03
0.04
0.07
0.10
0.11
0.14
0.20
0.23
0.25
Adj. for2 for 12/ 3/ 92
Adj. for2 for 14/ 21/ 94
Ind AU TOR P/ E N / AN YSE Bond$1857.2 M ils.Com 25.742 M ils.Book value -32.51P/ E 17.59Country U S
G rowth Performance M easurementYears Price Earn. D iv. Total Ret.Last 1 33.6 19.7 -- - 33.6Last 5 13.7 14.5 -- - 13.7
Last 10 22.0 17.9 -- - 22.0Last 25 16.2 19.1 -- - 16.2
P E Automotive parts and accessories retailer 90% SC ALE
LEG EN DRead from Right Scale:PriceRelative Strength
Bottom Band VolumeM oving Avg (48 months)Recession (G rey Shaded Bars)
Read from Left Scale:EarningsD ividends
Charts are updated daily at www.SrcStockCharts.com.
100

AVER Y D EN N ISON C OR P (AVY)
Copyright 2019 Securities Research Company
'85 '86 '87 '88 '89 '90 '91 '92 '93 '94 '95 '96 '97 '98 '99 '00 '01 '02 '03 '04 '05 '06 '07 '08 '09 '10 '11 '12 '13 '14 '15 '16 '17 '18 '19 '20
1
1 1/ 4
1 1/ 2
1 3/ 4
2
2 1/ 4
2 1/ 2
2 3/ 4
3 3 1/ 43 1/ 23 3/ 4
4 1/ 2
5
5 1/ 2
6
6 1/ 27 7 1/ 2
8 1/ 2
9 1/ 2
11
12
13 14 15
17
19
22
24
26 28 30
34
38
42
46
50
55
60
65 70 75
85
95
110
120
130 140 150
170
190
.06
.07
.08
.09
.10
.20
.25
.30
.35
.40
.45
.50
.60
.70
.80
.90
1.0
1.5
2.0
2.5
3.0
3.5
4.0
4.5
5.0
5.5
6.06.57.07.5
8.5
9.5
12
6 612 1218 1824 2430 30M
Adj. for2 for 13/ 17/ 87
Adj. for2 for 1
12/ 23/ 96
D ennison M fg.acq. 10/ 16/ 90
Avery Int'l prior to mergerwith D ennison M fg. 10/ 16/ 90
Paxar Corp.acquired 6/ 14/ 07
Ind OFICE P/ E N / AN YSE Bond$501.6 M ils.Com 87.418 M ils.Book value 11.10P/ E 20.14Country U S
G rowth Performance M easurementYears Price Earn. D iv. Total Ret.Last 1 23.0 5.1 11.5 25.2Last 5 19.7 15.4 10.6 21.4
Last 10 14.7 11.2 11.2 16.0Last 25 8.3 7.8 6.0 9.3
D Self-adhesive labels, office products
LEG EN DRead from Right Scale:PriceRelative Strength
Bottom Band VolumeM oving Avg (48 months)Recession (G rey Shaded Bars)
Read from Left Scale:EarningsD ividends
Charts are updated daily at www.SrcStockCharts.com.
101

AVIS BU D G ET G R OU P (C AR )
Copyright 2019 Securities Research Company
'85 '86 '87 '88 '89 '90 '91 '92 '93 '94 '95 '96 '97 '98 '99 '00 '01 '02 '03 '04 '05 '06 '07 '08 '09 '10 '11 '12 '13 '14 '15 '16 '17 '18 '19 '20
1/ 4
1/ 2
3/ 4
1
1 1/ 4
1 1/ 2
1 3/ 4
2 2 1/ 42 1/ 2
3
3 1/ 2
4 4 1/ 25
6
7
8 9 10
12
14
16 18 20
24
28
32 36 40
46
55
65
75
85 95
110
130
150
170 190
220
260
300
340 380
440
500
600
700
800
.02
.03
.04
.05
.06
.07
.08
.09
.10
.20
.25
.30
.35
.40
.45
.50
.60
.70
.80
.901.0
1.5
2.0
2.5
3.0
3.5
4.04.55.0
6.0
7.0
8.09.010
12
14
161820
25
30
35
404550
25 2550 5075 75
100 100125 125M
(0.76)
(0.95)
(1.29)
(1.63) (4.48) (0.40)
(0.81)
(0.99)
(0.89)
(0.06)
Adj. for3 for 23/ 19/ 85
Adj. for3 for 2
7/ 21/ 86
Adj. for3 for 23/ 1/ 91
Adj. for3 for 27/ 6/ 92
Adj. for3 for 25/ 3/ 93
Adj. for3 for 27/ 3/ 95
Adj. for3 for 2
10/ 22/ 96
Adj. for1 for 109/ 5/ 06
ListedN YSE 8/ 23/ 89
OTC prior
G alileo Int'l.acquired 10/ 1/ 01
D ist. 1 sh.PH H for ea.2 shs. CAR
01/ 31/ 05
D ist. 1 sh. Realogy Corp.for ea. .4 shrs. CAR &
1 sh. Wyndham Worldwidefor ea. .5 shrs. CAR 7/ 31/ 06
Orbitz Inc.acquired 11/ 12/ 04
Cendant Corp.prior to 9/ 5/ 06
Ind TRU CK P/ E N / AN asdaq Bond$2572.0 M ils.Com 79.194 M ils.Book value 6.51P/ E 9.86Country U S
G rowth Performance M easurementYears Price Earn. D iv. Total Ret.Last 1 29.5 -5.1 .0 29.5Last 5 -9.7 3.3 .0 -9.7
Last 10 12.3 -- - .0 12.3Last 25 -5.8 - .7 -- - -5.0
Provider of vehicle rental services, worldwide 65% SC ALE
LEG EN DRead from Right Scale:PriceRelative Strength
Bottom Band VolumeM oving Avg (48 months)Recession (G rey Shaded Bars)
Read from Left Scale:EarningsD ividends
Charts are updated daily at www.SrcStockCharts.com.
102

AVISTA C OR P OR ATION (AVA)
Copyright 2019 Securities Research Company
'85 '86 '87 '88 '89 '90 '91 '92 '93 '94 '95 '96 '97 '98 '99 '00 '01 '02 '03 '04 '05 '06 '07 '08 '09 '10 '11 '12 '13 '14 '15 '16 '17 '18 '19 '20
1 1/ 4
1 1/ 2
1 3/ 4
2
2 1/ 4
2 1/ 2
2 3/ 4
3 3 1/ 43 1/ 23 3/ 4
4 1/ 2
5
5 1/ 2
6 6 1/ 27 7 1/ 2
8 1/ 2
9 1/ 2
11
12 13 14 15
17
19
22
24 26 28 30
34
38
42
46
50
55
60 65 70 75
85
95
110
120 130 140 150
170
190
220
240 260
.08
.09
.10
.20
.25
.30
.35
.40
.45
.50
.60
.70
.80
.90
1.0
1.5
2.0
2.5
3.0
3.5
4.0
4.5
5.0
5.5
6.0
6.57.07.5
8.5
9.5
12
14
16
8 816 1624 2432 3240 40M
Adj. for2 for 1
11/ 10/ 93
Washington Water Powerprior to 1/ 4/ 99
To be acquired byH ydro One Ltd
Ind M U TIL P/ E N / AN YSE Bond$1388.6 M ils.Com 65.688 M ils.Book value 25.89P/ E 16.17Country U S
G rowth Performance M easurementYears Price Earn. D iv. Total Ret.Last 1 12.8 41.1 4.0 16.5Last 5 4.9 8.2 4.1 7.9
Last 10 8.8 6.3 6.3 11.4Last 25 4.6 3.4 .9 6.3
Electric and gas service in Washington and Idaho
LEG EN DRead from Right Scale:PriceRelative Strength
Bottom Band VolumeM oving Avg (48 months)Recession (G rey Shaded Bars)
Read from Left Scale:EarningsD ividends
Charts are updated daily at www.SrcStockCharts.com.
103

AVN ET IN C (AVT)
Copyright 2019 Securities Research Company
'85 '86 '87 '88 '89 '90 '91 '92 '93 '94 '95 '96 '97 '98 '99 '00 '01 '02 '03 '04 '05 '06 '07 '08 '09 '10 '11 '12 '13 '14 '15 '16 '17 '18 '19 '20
1/ 2
3/ 4
1
1 1/ 4
1 1/ 2
1 3/ 4
2
2 1/ 4
2 1/ 2
2 3/ 4
3
3 1/ 43 1/ 23 3/ 4
4 1/ 2
5
5 1/ 2
6
6 1/ 27 7 1/ 2
8 1/ 2
9 1/ 2
11
12
13 14 15
17
19
22
24 26 28 30
34
38
42
46
50
55
60
65 70 75
85
95
.03
.04
.05
.06
.07
.08
.09
.10
.20
.25
.30
.35
.40
.45
.50
.60
.70
.80
.90
1.0
1.5
2.0
2.5
3.0
3.5
4.0
4.5
5.0
5.5
6.06.5
10 1020 2030 3040 4050 50M
(0.13)
(0.19)
(0.03)
Adj. for2 for 19/ 29/ 00
H all-M ark Electronicsacq. 7/ 1/ 93
M arshall Inds.acq. 10/ 21/ 99
Kent Electronicsacquired 6/ 8/ 01
D ividendomitted1/ 24/ 02
Premier F arnell plcacquired 10/ 25/ 16
Ind TD STR P/ E N / AN asdaq Bond$918.8 M ils.Com 114.085 M ils.Book value 39.30P/ E 11.54Country U S
G rowth Performance M easurementYears Price Earn. D iv. Total Ret.Last 1 3.1 -9.8 5.0 5.1Last 5 .4 -3.3 5.6 2.1
Last 10 4.9 7.9 10.8 5.9Last 25 3.4 4.1 4.2 4.0
D Electronic components, electrical equipment, consumer products
LEG EN DRead from Right Scale:PriceRelative Strength
Bottom Band VolumeM oving Avg (48 months)Recession (G rey Shaded Bars)
Read from Left Scale:EarningsD ividends
Charts are updated daily at www.SrcStockCharts.com.
104

AVON PR OD U C TS IN C (AVP)
Copyright 2019 Securities Research Company
'85 '86 '87 '88 '89 '90 '91 '92 '93 '94 '95 '96 '97 '98 '99 '00 '01 '02 '03 '04 '05 '06 '07 '08 '09 '10 '11 '12 '13 '14 '15 '16 '17 '18 '19 '20
1/ 2
3/ 4
1
1 1/ 4
1 1/ 2
1 3/ 4
2
2 1/ 4
2 1/ 2
2 3/ 4
3 3 1/ 43 1/ 23 3/ 4
4 1/ 2
5
5 1/ 2
6 6 1/ 27 7 1/ 2
8 1/ 2
9 1/ 2
11
12 13 14 15
17
19
22
24
26 28 30
34
38
42
46
50
55
60 65 70 75
.03
.04
.05
.06
.07
.08
.09
.10
.20
.25
.30
.35
.40
.45
.50
.60
.70
.80
.90
1.0
1.5
2.0
2.5
3.0
3.5
4.0
4.5
5.0
5.5
40 4080 80
120 120160 160200 200M
(0.07)
(0.11)
0.02
(0.07)
(0.06)
0.02
Adj. for2 for 16/ 4/ 96
Adj. for2 for 19/ 14/ 98
Adj. for2 for 16/ 1/ 04
Tiffany sold10/ 17/ 84
M allinckrodtsold 4/ 1/ 86
F oster M edicalsold 9/ 30/ 88
Special$0.375
Special$0.0161/ 6/ 20
Ind CSM TG P/ E N / AN YSE Bond$1170.7 M ils.Com 442.345 M ils.Book value -2.01P/ E 20.74Country U S
G rowth Performance M easurementYears Price Earn. D iv. Total Ret.Last 1 139.3 1250.0 .0 139.3Last 5 -6.3 -18.5 .0 -5.5
Last 10 -15.5 -17.1 -11.8 -11.5Last 25 -1.0 -2.2 - .2 3.4
Cosmetics, fragrances, jewelry, health care products
LEG EN DRead from Right Scale:PriceRelative Strength
Bottom Band VolumeM oving Avg (48 months)Recession (G rey Shaded Bars)
Read from Left Scale:EarningsD ividends
Charts are updated daily at www.SrcStockCharts.com.
105

AZZ IN C (AZZ)
Copyright 2019 Securities Research Company
'85 '86 '87 '88 '89 '90 '91 '92 '93 '94 '95 '96 '97 '98 '99 '00 '01 '02 '03 '04 '05 '06 '07 '08 '09 '10 '11 '12 '13 '14 '15 '16 '17 '18 '19 '20
1/ 4
1/ 2
3/ 4
1
1 1/ 4
1 1/ 2
1 3/ 4
2
2 1/ 4
2 1/ 2
2 3/ 43 3 1/ 4
3 3/ 4
4 1/ 2
5
5 1/ 26 6 1/ 2
7 1/ 2
8 1/ 2
9 1/ 2
11 12 13
15
17
19
22 24 26
30
34
38
42
46 50
55 60 65
75
.02
.03
.04
.05
.06
.07
.08
.09
.10
.20
.25
.30
.35
.40
.45
.50
.60
.70
.80
.90
1.0
1.5
2.0
2.5
3.0
3.5
4.0
4.5
5.0
5.5
3 36 69 9
12 1215 15M
(0.04)
(0.36)
(0.18)
0.01
0.01
0.01
Adj. for5% SD8/ 31/ 90
Adj. for5% SD8/ 30/ 91
Adj. for2 for 15/ 7/ 07
Adj. for2 for 17/ 31/ 12
Aztec M anufacturing prior to 8/ 14/ 00
D ividendomitted4/ 2/ 02
Ind M ACH N P/ E N / AN YSE Bond $35.2 M ils.Com 26.050 M ils.Book value 20.29P/ E 18.98Country U S
G rowth Performance M easurementYears Price Earn. D iv. Total Ret.Last 1 -1.2 61.3 .0 .4Last 5 .9 2.1 2.5 2.4
Last 10 11.4 5.0 32.8 12.8Last 25 15.3 13.3 21.7 15.9
D Electrical and industrial products and galvanizing services 90% SC ALE
LEG EN DRead from Right Scale:PriceRelative Strength
Bottom Band VolumeM oving Avg (48 months)Recession (G rey Shaded Bars)
Read from Left Scale:EarningsD ividends
Charts are updated daily at www.SrcStockCharts.com.
106

BAD G ER M ETER IN C (BM I)
Copyright 2019 Securities Research Company
'85 '86 '87 '88 '89 '90 '91 '92 '93 '94 '95 '96 '97 '98 '99 '00 '01 '02 '03 '04 '05 '06 '07 '08 '09 '10 '11 '12 '13 '14 '15 '16 '17 '18 '19 '20
1/ 2
3/ 4
1
1 1/ 4
1 1/ 2
1 3/ 4
2
2 1/ 4
2 1/ 2
2 3/ 4
3
3 1/ 43 1/ 23 3/ 4
4 1/ 2
5
5 1/ 2
6
6 1/ 27 7 1/ 2
8 1/ 2
9 1/ 2
11
12 13 14 15
17
19
22
24 26 28 30
34
38
42
46
50
55
60
65 70 75
85
95
.03
.04
.05
.06
.07
.08
.09
.10
.20
.25
.30
.35
.40
.45
.50
.60
.70
.80
.90
1.0
1.5
2.0
2.5
3.0
3.5
4.0
4.5
5.0
5.5
6.06.57.0
4 48 8
12 1216 1620 20M
0.03
0.03
0.03
0.03
0.03
0.03
Adj. for2 for 1
4/ 21/ 97
Adj. for2 for 1
12/ 13/ 04
Adj. for2 for 16/ 16/ 06
Adj. for2 for 19/ 16/ 16
ListedN YSE 6/ 18/ 08
Amex prior
Ind M ACH N P/ E N / AN YSE Bond $5.9 M ils.Com 29.114 M ils.Book value 9.01P/ E 39.38Country U S
G rowth Performance M easurementYears Price Earn. D iv. Total Ret.Last 1 19.4 3.9 13.3 20.6Last 5 16.1 9.2 12.3 17.0
Last 10 12.8 5.9 11.0 13.5Last 25 16.4 11.0 11.4 16.8
D Water and gas meters, flow control products
LEG EN DRead from Right Scale:PriceRelative Strength
Bottom Band VolumeM oving Avg (48 months)Recession (G rey Shaded Bars)
Read from Left Scale:EarningsD ividends
Charts are updated daily at www.SrcStockCharts.com.
107

BAKER H U G H ES IN C (BKR )
Copyright 2019 Securities Research Company
'85 '86 '87 '88 '89 '90 '91 '92 '93 '94 '95 '96 '97 '98 '99 '00 '01 '02 '03 '04 '05 '06 '07 '08 '09 '10 '11 '12 '13 '14 '15 '16 '17 '18 '19 '20
1
1 1/ 4
1 1/ 2
1 3/ 4
2
2 1/ 4
2 1/ 2
2 3/ 4
3 3 1/ 43 1/ 23 3/ 4
4 1/ 2
5
5 1/ 2
6
6 1/ 27 7 1/ 2
8 1/ 2
9 1/ 2
11
12
13 14 15
17
19
22
24 26 28 30
34
38
42
46
50
55
60
65 70 75
85
95
110
120
130 140 150
170
190
.06
.07
.08
.09
.10
.20
.25
.30
.35
.40
.45
.50
.60
.70
.80
.90
1.0
1.5
2.0
2.5
3.0
3.5
4.0
4.5
5.0
5.5
6.06.57.07.5
8.5
9.5
12
14
60 60120 120180 180240 240300 300M
(3.92)
(4.49)
(5.15)
(5.86)
(2.43)
(2.55)
(3.33)
(2.72)
(1.27)
(0.84) (0.17)
(0.30)
(0.32)
(0.59)
(0.92)
(1.18) (0.47)
(0.59)
(1.35)
(1.45)
(1.54)
(1.58)
(0.79)
(0.59)
(0.14)
Vetco G rey G p.acq. 1986
Plotted data for BakerInt'l. prior to merger
with H ughes Tool 4/ 7/ 87
D evelco, Inc.acq. 7/ 87
Eastman Christiansianacq. 4/ 90
Instruments G p.acq. 5/ 25/ 90
Chemlink Inc.acq. 10/ 18/ 90
Elder, Inc.acq. 12/ 90
Toleco Oilfield Svcs,Inc. acq. 4/ 23/ 92
D rilex Int'l.acq. 7/ 14/ 97
Western Atlas, Inc.acquired 8/ 10/ 98
M ergedG E's Oil & G as Business
7/ 3/ 17
Ind OG EQP P/ E N / AN YSE Bond$1073.8 M ils.Com 411.652 M ils.Book value 29.45P/ E 30.32Country U S
G rowth Performance M easurementYears Price Earn. D iv. Total Ret.Last 1 5.5 22.4 .0 9.3Last 5 -15.6 -27.9 1.1 -13.2
Last 10 -5.8 -8.2 1.8 -3.5Last 25 1.4 - .4 1.8 3.2
Oil field and gas well tools and equipment
LEG EN DRead from Right Scale:PriceRelative Strength
Bottom Band VolumeM oving Avg (48 months)Recession (G rey Shaded Bars)
Read from Left Scale:EarningsD ividends
Charts are updated daily at www.SrcStockCharts.com.
108

BALC H EM C OR P (BC P C )
Copyright 2019 Securities Research Company
'85 '86 '87 '88 '89 '90 '91 '92 '93 '94 '95 '96 '97 '98 '99 '00 '01 '02 '03 '04 '05 '06 '07 '08 '09 '10 '11 '12 '13 '14 '15 '16 '17 '18 '19 '20
1/ 4
1/ 2
3/ 4
1
1 1/ 4
1 1/ 2
1 3/ 4
2 2 1/ 42 1/ 2
3
3 1/ 2
4 4 1/ 25
6
7
8 9 10
12
14
16 18 20
24
28
32 36 40
46
55
65
75
85 95
110
130
150
170 190
.005
.01
.02
.03
.04
.05
.06
.07
.08
.09
.10
.20
.25
.30
.35
.40
.45
.50
.60
.70
.80
.901.0
1.5
2.0
2.5
3.0
3.5
4.04.55.0
6.0
7.0
8.09.010
12
14
1 12 23 34 45 5M
0.00
0.00
0.00
0.00
0.00
0.00
Adj. for5 for 4
12/ 31/ 90Adj. for4 for 3
12/ 30/ 91
Adj. for3 for 2
10/ 4/ 94
Adj. for3 for 26/ 4/ 98
Adj. for3 for 2
1/ 21/ 05
Adj. for3 for 21/ 23/ 06
Adj. for3 for 21/ 22/ 07
Adj. for3 for 21/ 21/ 10
ListedN ASD AQ12/ 22/ 06
ASE prior
D IVID EN D SEQU EN CE IS AN N U AL
Ind SCH EM P/ E N / AN asdaq Bond $.7 M ils.Com 32.211 M ils.Book value 16.85P/ E 35.93Country U S
G rowth Performance M easurementYears Price Earn. D iv. Total Ret.Last 1 25.9 -3.6 11.9 26.5Last 5 14.6 10.6 12.6 15.0
Last 10 18.4 12.1 20.4 18.6Last 25 21.8 19.6 22.5 21.9
D Performance ingredients for food and livestock feed 65% SC ALE
LEG EN DRead from Right Scale:PriceRelative Strength
Bottom Band VolumeM oving Avg (48 months)Recession (G rey Shaded Bars)
Read from Left Scale:EarningsD ividends
Charts are updated daily at www.SrcStockCharts.com.
109

BALL C OR P (BLL)
Copyright 2019 Securities Research Company
'85 '86 '87 '88 '89 '90 '91 '92 '93 '94 '95 '96 '97 '98 '99 '00 '01 '02 '03 '04 '05 '06 '07 '08 '09 '10 '11 '12 '13 '14 '15 '16 '17 '18 '19 '20
3/ 4
1
1 1/ 4
1 1/ 2
1 3/ 4
2
2 1/ 4
2 1/ 2
2 3/ 4
3 3 1/ 43 1/ 23 3/ 4
4 1/ 2
5
5 1/ 2
6 6 1/ 27 7 1/ 2
8 1/ 2
9 1/ 2
11
12 13 14 15
17
19
22
24
26 28 30
34
38
42
46
50
55
60 65 70 75
85
95
110
120 130
.04
.05
.06
.07
.08
.09
.10
.20
.25
.30
.35
.40
.45
.50
.60
.70
.80
.90
1.0
1.5
2.0
2.5
3.0
3.5
4.0
4.5
5.0
5.5
6.06.57.07.5
8.5
20 2040 4060 6080 80
100 100M
Adj. for2 for 110/ 2/ 85
Adj. for2 for 1
2/ 25/ 02
Adj. for2 for 18/ 24/ 04
Adj. for2 for 12/ 16/ 11
Adj. for2 for 15/ 17/ 17
Ind CON TM P/ E N / AN YSE Bond$2270.4 M ils.Com 343.911 M ils.Book value 10.33P/ E 27.84Country U S
G rowth Performance M easurementYears Price Earn. D iv. Total Ret.Last 1 26.8 8.7 50.0 27.8Last 5 15.9 4.2 18.2 16.6
Last 10 18.0 8.9 19.6 18.5Last 25 15.3 11.8 11.7 15.5
D G lass and metal containers, industrial and technical products
LEG EN DRead from Right Scale:PriceRelative Strength
Bottom Band VolumeM oving Avg (48 months)Recession (G rey Shaded Bars)
Read from Left Scale:EarningsD ividends
Charts are updated daily at www.SrcStockCharts.com.
110

BAN C F IR ST C OR P (BAN F )
Copyright 2019 Securities Research Company
'85 '86 '87 '88 '89 '90 '91 '92 '93 '94 '95 '96 '97 '98 '99 '00 '01 '02 '03 '04 '05 '06 '07 '08 '09 '10 '11 '12 '13 '14 '15 '16 '17 '18 '19 '20
1/ 2
3/ 4
1
1 1/ 4
1 1/ 2
1 3/ 4
2
2 1/ 4
2 1/ 2
2 3/ 4
3 3 1/ 43 1/ 23 3/ 4
4 1/ 2
5
5 1/ 2
6 6 1/ 27 7 1/ 2
8 1/ 2
9 1/ 2
11
12 13 14 15
17
19
22
24
26 28 30
34
38
42
46
50
55
60 65 70 75
85
95
.03
.04
.05
.06
.07
.08
.09
.10
.20
.25
.30
.35
.40
.45
.50
.60
.70
.80
.90
1.0
1.5
2.0
2.5
3.0
3.5
4.0
4.5
5.0
5.5
6.06.5
3 36 69 9
12 1215 15M
Adj. for3 for 26/ 15/ 92
Adj. for2 for 13/ 2/ 06
Adj. for2 for 18/ 1/ 17
Ind RBAN K P/ E N / AN asdaq Bond$26.4 M ils.Com 32.738 M ils.Book value 45.95P/ E 15.60Country U S
G rowth Performance M easurementYears Price Earn. D iv. Total Ret.Last 1 15.1 3.9 6.7 17.3Last 5 16.5 14.4 13.5 18.1
Last 10 11.9 14.3 10.8 13.1Last 25 12.0 9.1 13.0 12.8
D Commercial banking services in Oklahoma
LEG EN DRead from Right Scale:PriceRelative Strength
Bottom Band VolumeM oving Avg (48 months)Recession (G rey Shaded Bars)
Read from Left Scale:EarningsD ividends
Charts are updated daily at www.SrcStockCharts.com.
111

BAN C O LATIN OAM ER IC AN O D E EXPOR TAC ION ES S A (BLX)
Copyright 2019 Securities Research Company
'85 '86 '87 '88 '89 '90 '91 '92 '93 '94 '95 '96 '97 '98 '99 '00 '01 '02 '03 '04 '05 '06 '07 '08 '09 '10 '11 '12 '13 '14 '15 '16 '17 '18 '19 '20
1 1/ 4
1 1/ 2
1 3/ 4
2
2 1/ 4
2 1/ 2
2 3/ 4
3 3 1/ 43 1/ 23 3/ 4
4 1/ 2
5
5 1/ 2
6 6 1/ 27 7 1/ 2
8 1/ 2
9 1/ 2
11
12 13 14 15
17
19
22
24 26 28 30
34
38
42
46
50
55
60 65 70 75
85
95
110
120 130 140 150
170
190
220
240 260
.08
.09
.10
.20
.25
.30
.35
.40
.45
.50
.60
.70
.80
.90
1.0
1.5
2.0
2.5
3.0
3.5
4.0
4.5
5.0
5.5
6.0
6.57.07.5
8.5
9.5
12
14
16
2 24 46 68 8
10 10M
(0.58)
(1.99)
(20.69)
(20.84)
(15.56)
(14.99)
D ividendsomitted2/ 28/ 02
Special$2.00
Special$1.00
Ind BAN KS P/ E N / AN YSE Bond$533.9 M ils.Com 30.951 M ils.Book value 24.75P/ E 10.23Country Panama
G rowth Performance M easurementYears Price Earn. D iv. Total Ret.Last 1 16.6 23.0 .0 24.8Last 5 -4.7 -5.2 1.9 1.2
Last 10 4.5 3.5 9.9 9.4Last 25 -1.4 - .7 5.0 1.6
AD R - Short- term trade related financing to stockholder banks
LEG EN DRead from Right Scale:PriceRelative Strength
Bottom Band VolumeM oving Avg (48 months)Recession (G rey Shaded Bars)
Read from Left Scale:EarningsD ividends
Charts are updated daily at www.SrcStockCharts.com.
112

BAN C O SAN TAN D ER SA (SAN )
Copyright 2019 Securities Research Company
'85 '86 '87 '88 '89 '90 '91 '92 '93 '94 '95 '96 '97 '98 '99 '00 '01 '02 '03 '04 '05 '06 '07 '08 '09 '10 '11 '12 '13 '14 '15 '16 '17 '18 '19 '20
3/ 4
1
1 1/ 4
1 1/ 2
1 3/ 4
2
2 1/ 4
2 1/ 2
2 3/ 4
3 3 1/ 43 1/ 23 3/ 4
4 1/ 2
5
5 1/ 2
6 6 1/ 27 7 1/ 2
8 1/ 2
9 1/ 2
11
12 13 14 15
17
19
22
24
26 28 30
34
38
42
46
50
55
60 65 70 75
85
95
110
120 130
.04
.05
.06
.07
.08
.09
.10
.20
.25
.30
.35
.40
.45
.50
.60
.70
.80
.90
1.0
1.5
2.0
2.5
3.0
3.5
4.0
4.5
5.0
5.5
6.06.57.07.5
8.5
100 100200 200300 300400 400500 500M
0.00
Adj. for3 for 1
6/ 23/ 97
Adj. for2 for 17/ 6/ 98
Adj. for2% SD8/ 18/ 98
Adj. for2 for 1
6/ 21/ 99
Banco Santander S.A.prior to 4/ 17/ 99
Sovereign Bancorp IncAcquired01/ 29/ 09
D ividends in U S currency net after Spanish taxto U .S. residents
Ind BAN KS P/ E N / AN YSE Bond $.0 M ils.Com 1613.615 M ils.Book value 6.57P/ E N / ACountry Spain
G rowth Performance M easurementYears Price Earn. D iv. Total Ret.Last 1 -13.7 .0 260.8 -8.3Last 5 -9.4 - .9 -5.8 -4.2
Last 10 -11.6 -11.2 -4.7 -4.8Last 25 1.4 2.2 3.7 6.5
AD R - International banking and other financial services
LEG EN DRead from Right Scale:PriceRelative Strength
Bottom Band VolumeM oving Avg (48 months)Recession (G rey Shaded Bars)
Read from Left Scale:EarningsD ividends
Charts are updated daily at www.SrcStockCharts.com.
113

BAN C OR PSOU TH IN C (BXS)
Copyright 2019 Securities Research Company
'85 '86 '87 '88 '89 '90 '91 '92 '93 '94 '95 '96 '97 '98 '99 '00 '01 '02 '03 '04 '05 '06 '07 '08 '09 '10 '11 '12 '13 '14 '15 '16 '17 '18 '19 '20
1/ 2
3/ 4
1
1 1/ 4
1 1/ 2
1 3/ 4
2
2 1/ 4
2 1/ 2
2 3/ 4
3
3 1/ 43 1/ 23 3/ 4
4 1/ 2
5
5 1/ 2
6
6 1/ 27 7 1/ 2
8 1/ 2
9 1/ 2
11
12
13 14 15
17
19
22
24 26 28 30
34
38
42
46
50
55
60
65 70 75
85
95
.03
.04
.05
.06
.07
.08
.09
.10
.20
.25
.30
.35
.40
.45
.50
.60
.70
.80
.90
1.0
1.5
2.0
2.5
3.0
3.5
4.0
4.5
5.0
5.5
6.06.5
8 816 1624 2432 3240 40M
Adj. for2 for 1
12/ 19/ 85
Adj. for2 for 1
10/ 7/ 86
Adj. for15% SD11/ 8/ 93
Adj. for2 for 1
11/ 21/ 95
Adj. for2 for 1
5/ 18/ 98
Bancorp of M ississippi Inc.prior to 1992
ListedN YSE 5/ 15/ 97
OTC prior
Ind RBAN K P/ E N / AN YSE Bond$280.6 M ils.Com 98.842 M ils.Book value 18.69P/ E 14.20Country U S
G rowth Performance M easurementYears Price Earn. D iv. Total Ret.Last 1 4.6 -1.4 8.8 7.0Last 5 9.0 11.6 19.8 10.7
Last 10 2.9 5.6 -1.7 4.2Last 25 5.2 4.0 4.1 6.7
Bank holding company based in M ississippi
LEG EN DRead from Right Scale:PriceRelative Strength
Bottom Band VolumeM oving Avg (48 months)Recession (G rey Shaded Bars)
Read from Left Scale:EarningsD ividends
Charts are updated daily at www.SrcStockCharts.com.
114

BAN K H AWAII C OR P (BOH )
Copyright 2019 Securities Research Company
'85 '86 '87 '88 '89 '90 '91 '92 '93 '94 '95 '96 '97 '98 '99 '00 '01 '02 '03 '04 '05 '06 '07 '08 '09 '10 '11 '12 '13 '14 '15 '16 '17 '18 '19 '20
3/ 4
1
1 1/ 4
1 1/ 2
1 3/ 4
2
2 1/ 4
2 1/ 2
2 3/ 4
3
3 1/ 43 1/ 23 3/ 4
4 1/ 2
5
5 1/ 2
6 6 1/ 27 7 1/ 2
8 1/ 2
9 1/ 2
11
12 13 14 15
17
19
22
24
26 28 30
34
38
42
46
50
55
60 65 70 75
85
95
110
120 130 140
.04
.05
.06
.07
.08
.09
.10
.20
.25
.30
.35
.40
.45
.50
.60
.70
.80
.90
1.0
1.5
2.0
2.5
3.0
3.5
4.0
4.5
5.0
5.5
6.0
6.57.07.5
8.5
9.5
5 510 1015 1520 2025 25M
Adj. for3 for 2
11/ 17/ 88
Adj. for10% SD4/ 6/ 90
Adj. for3 for 2
9/ 16/ 91
Adj. for3 for 23/ 16/ 94
Adj. for100% SD12/ 15/ 97
Bancorp H awaiiprior to 4/ 28/ 97
Pacific Centy F inl Cp.prior to 4/ 29/ 02
Ind RBAN K P/ E N / AN YSE Bond$260.3 M ils.Com 42.031 M ils.Book value 27.24P/ E 17.21Country U S
G rowth Performance M easurementYears Price Earn. D iv. Total Ret.Last 1 20.6 3.4 8.1 23.9Last 5 10.6 7.9 8.3 13.0
Last 10 7.4 7.0 4.1 9.5Last 25 8.0 5.6 6.8 9.4
Serves H awaii, Pacific Basin areas, Asia, and mainland U nited States.
LEG EN DRead from Right Scale:PriceRelative Strength
Bottom Band VolumeM oving Avg (48 months)Recession (G rey Shaded Bars)
Read from Left Scale:EarningsD ividends
Charts are updated daily at www.SrcStockCharts.com.
115

BAN K OF AM ER IC A C OR POR ATION (BAC )
Copyright 2019 Securities Research Company
'85 '86 '87 '88 '89 '90 '91 '92 '93 '94 '95 '96 '97 '98 '99 '00 '01 '02 '03 '04 '05 '06 '07 '08 '09 '10 '11 '12 '13 '14 '15 '16 '17 '18 '19 '20
1/ 4
1/ 2
3/ 4
1
1 1/ 4
1 1/ 2
1 3/ 4
2
2 1/ 4
2 1/ 22 3/ 43
3 1/ 2
4
4 1/ 2
5 5 1/ 26
7
8
9
10 11 12
14
16
18
20 22 24
28
32
36
40 44 48
55 60
70
80
90
100 110 120
140
160
.02
.03
.04
.05
.06
.07
.08
.09
.10
.20
.25
.30
.35
.40
.45
.50
.60
.70
.80
.90
1.0
1.5
2.0
2.5
3.0
3.5
4.0
4.5
5.05.56.0
7.0
8.0
9.0
10
1 12 23 34 45 5B
(0.12)
Adj. for2 for 1
11/ 21/ 86
Adj. for2 for 12/ 28/ 97
Adj. for2 for 18/ 30/ 04
N CN B and C & S Sovrancombined to form
N ationsBank 1/ 2/ 92
D ata prior to 1/ 2/ 92for N CN B
M N C F inancialacq. 10/ 1/ 93
Chicago Research & Trading G p. Ltd.
acq. 7/ 2/ 93
CSF H oldingsacq. 1/ 10/ 96
BankSouth Corp.acq. 1/ 9/ 96
LD I Corp.acq. 4/ 29/ 96
Boatmen's Bancsharesacq. 1/ 10/ 97
N ationsBank Corp.prior to 10/ 1/ 98
BankAmerica (Old)acquired 10/ 1/ 98
BankAmerica Corp. (N ew)prior to 4/ 29/ 99 F leetBoston F in'l.
acquired 4/ 1/ 04
M BN A Corp.acquired 1/ 1/ 06
Countrywide F inancialacquired 7/ 1/ 08
M errill Lynch & Co.acquired 1/ 1/ 09
Ind D IVFN P/ E N / AN YSE Bond$230009.0 M ils.Com 9858.300 M ils.Book value 24.38P/ E 12.77Country U S
G rowth Performance M easurementYears Price Earn. D iv. Total Ret.Last 1 22.0 4.2 20.0 24.3Last 5 18.1 12.6 29.2 19.4
Last 10 8.6 28.6 33.5 9.3Last 25 4.5 2.3 1.5 6.5
D E Large multi-bank holding company 80% SC ALE
LEG EN DRead from Right Scale:PriceRelative Strength
Bottom Band VolumeM oving Avg (48 months)Recession (G rey Shaded Bars)
Read from Left Scale:EarningsD ividends
Charts are updated daily at www.SrcStockCharts.com.
116

BAN K OF N EW YOR K M ELLON C OR P (BK)
Copyright 2019 Securities Research Company
'85 '86 '87 '88 '89 '90 '91 '92 '93 '94 '95 '96 '97 '98 '99 '00 '01 '02 '03 '04 '05 '06 '07 '08 '09 '10 '11 '12 '13 '14 '15 '16 '17 '18 '19 '20
3/ 4
1
1 1/ 4
1 1/ 2
1 3/ 4
2
2 1/ 4
2 1/ 2
2 3/ 4
3 3 1/ 43 1/ 23 3/ 4
4 1/ 2
5
5 1/ 2
6 6 1/ 27 7 1/ 2
8 1/ 2
9 1/ 2
11
12 13 14 15
17
19
22
24
26 28 30
34
38
42
46
50
55
60 65 70 75
85
95
110
120 130
.04
.05
.06
.07
.08
.09
.10
.20
.25
.30
.35
.40
.45
.50
.60
.70
.80
.90
1.0
1.5
2.0
2.5
3.0
3.5
4.0
4.5
5.0
5.5
6.06.57.07.5
8.5
60 60120 120180 180240 240300 300M
Adj. for3 for 2
11/ 7/ 86
Adj. for2 for 1
5/ 16/ 94
Adj. for2 for 19/ 9/ 96
Adj. for2 for 1
8/ 14/ 98
Special$0.0068
N at'l Community BanksInc. merged 6/ 8/ 93
Putnam Trust Co.(Conn.) merged 9/ 1/ 95
Bank of N ew York Co, Incprior to 7/ 3/ 07
M ellon F inancial Corp.merged 7/ 3/ 07
Ind ASM G T P/ E N / AN YSE Bond$10398.0 M ils.Com 999.945 M ils.Book value 33.67P/ E 12.60Country U S
G rowth Performance M easurementYears Price Earn. D iv. Total Ret.Last 1 -3.4 -3.6 10.7 -1.1Last 5 7.0 10.7 12.8 8.9
Last 10 5.7 6.7 13.2 7.1Last 25 7.9 5.8 5.6 9.2
D Bank holding company based in N ew York
LEG EN DRead from Right Scale:PriceRelative Strength
Bottom Band VolumeM oving Avg (48 months)Recession (G rey Shaded Bars)
Read from Left Scale:EarningsD ividends
Charts are updated daily at www.SrcStockCharts.com.
117

BAR C LAYS P LC (BC S)
Copyright 2019 Securities Research Company
'85 '86 '87 '88 '89 '90 '91 '92 '93 '94 '95 '96 '97 '98 '99 '00 '01 '02 '03 '04 '05 '06 '07 '08 '09 '10 '11 '12 '13 '14 '15 '16 '17 '18 '19 '20
1/ 2
3/ 4
1
1 1/ 4
1 1/ 2
1 3/ 4
2
2 1/ 4
2 1/ 2
2 3/ 43 3 1/ 43 1/ 2
4
4 1/ 2
5
5 1/ 26 6 1/ 27
8
9
10
11 12 13 14
16
18
20
22 24 26 28
32
36
40
44 48
55 60 65 70
80
90
100
110 120
.02
.03
.04
.05
.06
.07
.08
.09
.10
.20
.25
.30
.35
.40
.45
.50
.60
.70
.80
.90
1.0
1.5
2.0
2.5
3.0
3.5
4.0
4.5
5.0
5.56.06.57.0
8.0
100 100200 200300 300400 400500 500M
(0.01)
(0.32)
(0.08)
Adj. for7 for 56/ 8/ 90
Adj. for4 for 15/ 6/ 02
D ividends free of British tax to U .S. residents
Ind BAN KS P/ E N / AN YSE Bond$7428.0 M ils.Com 4281.718 M ils.Book value 21.00P/ E N / ACountryG reat Britian (U K)
G rowth Performance M easurementYears Price Earn. D iv. Total Ret.Last 1 12.6 .0 -37.8 16.8Last 5 -7.7 .7 -9.8 -5.1
Last 10 -5.8 -3.7 8.3 -3.0Last 25 .0 .0 -3.5 4.9
AD R - Largest bank in Britain with worldwide operations 90% SC ALE
LEG EN DRead from Right Scale:PriceRelative Strength
Bottom Band VolumeM oving Avg (48 months)Recession (G rey Shaded Bars)
Read from Left Scale:EarningsD ividends
Charts are updated daily at www.SrcStockCharts.com.
118

BAR N ES G R OU P IN C (B)
Copyright 2019 Securities Research Company
'85 '86 '87 '88 '89 '90 '91 '92 '93 '94 '95 '96 '97 '98 '99 '00 '01 '02 '03 '04 '05 '06 '07 '08 '09 '10 '11 '12 '13 '14 '15 '16 '17 '18 '19 '20
1/ 2
3/ 4
1
1 1/ 4
1 1/ 2
1 3/ 4
2
2 1/ 4
2 1/ 2
2 3/ 4
3
3 1/ 43 1/ 23 3/ 4
4 1/ 2
5
5 1/ 2
6
6 1/ 27 7 1/ 2
8 1/ 2
9 1/ 2
11
12 13 14 15
17
19
22
24 26 28 30
34
38
42
46
50
55
60
65 70 75
85
95
.03
.04
.05
.06
.07
.08
.09
.10
.20
.25
.30
.35
.40
.45
.50
.60
.70
.80
.90
1.0
1.5
2.0
2.5
3.0
3.5
4.0
4.5
5.0
5.5
6.0
6.57.0
5 510 1015 1520 2025 25M
Adj. for3 for 1
4/ 28/ 97
Adj. for2 for 16/ 12/ 06
H einz H anggi AG acquired 5/ 17/ 06
Ind M ACH N P/ E N / AN YSE Bond$376.3 M ils.Com 51.193 M ils.Book value 21.72P/ E 19.68Country U S
G rowth Performance M easurementYears Price Earn. D iv. Total Ret.Last 1 6.2 -1.5 .0 7.3Last 5 12.8 6.3 5.9 13.8
Last 10 14.6 15.6 7.2 15.5Last 25 9.6 7.4 3.6 10.3
E Springs, engineered metal components, fabricated assemblies
LEG EN DRead from Right Scale:PriceRelative Strength
Bottom Band VolumeM oving Avg (48 months)Recession (G rey Shaded Bars)
Read from Left Scale:EarningsD ividends
Charts are updated daily at www.SrcStockCharts.com.
119

BAR R IC K G OLD C OR P (G OLD )
Copyright 2019 Securities Research Company
'85 '86 '87 '88 '89 '90 '91 '92 '93 '94 '95 '96 '97 '98 '99 '00 '01 '02 '03 '04 '05 '06 '07 '08 '09 '10 '11 '12 '13 '14 '15 '16 '17 '18 '19 '20
1/ 2
3/ 4
1
1 1/ 4
1 1/ 2
1 3/ 4
2
2 1/ 4
2 1/ 2
2 3/ 4
3 3 1/ 43 1/ 23 3/ 4
4 1/ 2
5
5 1/ 2
6 6 1/ 27 7 1/ 2
8 1/ 2
9 1/ 2
11
12 13 14 15
17
19
22
24 26 28 30
34
38
42
46
50
55
60 65 70 75
.03
.04
.05
.06
.07
.08
.09
.10
.20
.25
.30
.35
.40
.45
.50
.60
.70
.80
.90
1.0
1.5
2.0
2.5
3.0
3.5
4.0
4.5
5.0
5.5
150 150300 300450 450600 600750 750M
(0.03)
0.01Adj. for1 for 5
12/ 13/ 85
Adj. for2 for 17/ 16/ 87
Adj. for2 for 11/ 2/ 90
Adj. for2 for 13/ 2/ 93
Listed N YSE2/ 25/ 87
OTC prior
Extra$0.013
Amer. Barrick Res.prior to 1/ 18/ 95
Lac M ineralsacq. 10/ 18/ 94
H omestake M iningacquired 12/ 14/ 01
Placer D omeacquired3/ 10/ 06
D ividends in U .S. fds. before Canadian taxto U .S. residents
Ind G OLD M P/ E N / AN YSE Bond$3244.0 M ils.Com 1167.159 M ils.Book value 6.81P/ E 38.05Country Canada
G rowth Performance M easurementYears Price Earn. D iv. Total Ret.Last 1 1.5 11.9 66.7 2.9Last 5 6.9 -7.2 .0 7.7
Last 10 -6.5 -13.4 -6.7 -5.0Last 25 - .4 -2.1 2.8 .8
G old mining and production
LEG EN DRead from Right Scale:PriceRelative Strength
Bottom Band VolumeM oving Avg (48 months)Recession (G rey Shaded Bars)
Read from Left Scale:EarningsD ividends
Charts are updated daily at www.SrcStockCharts.com.
120

BASSETT F U R N ITU R E IN D S IN C (BSET)
Copyright 2019 Securities Research Company
'85 '86 '87 '88 '89 '90 '91 '92 '93 '94 '95 '96 '97 '98 '99 '00 '01 '02 '03 '04 '05 '06 '07 '08 '09 '10 '11 '12 '13 '14 '15 '16 '17 '18 '19 '20
3/ 4
1
1 1/ 4
1 1/ 2
1 3/ 4
2
2 1/ 4
2 1/ 2
2 3/ 4
3 3 1/ 43 1/ 2
4
4 1/ 2
5
5 1/ 2
6 6 1/ 27
8
9
10
11
12 13 14
16
18
20
22
24 26 28
32
36
40
44
48
55
60 65 70
80
90
100
110
120 130 140
160
.04
.05
.06
.07
.08
.09
.10
.20
.25
.30
.35
.40
.45
.50
.60
.70
.80
.90
1.0
1.5
2.0
2.5
3.0
3.5
4.0
4.5
5.0
5.5
6.06.57.0
8.0
9.0
10
600 6001200 12001800 18002400 24003000 3000T
(0.10)
(0.08)
(0.21)
(0.01)
(0.02)
(0.27)
(1.05)
(1.85)
(2.56)
(2.51)
(1.52)
(0.67)
Adj. for3 for 24/ 7/ 92
Adj. for5 for 45/ 29/ 93
Special$0.536
Special$0.20
Special$0.75
D ividendOmitted06/ 07/ 10
Special$1.25
Special$0.20
Special$0.20
Special$0.20
Special$0.30
Special$0.35
Ind H M FRN P/ E N / AN asdaq Bond$18.0 M ils.Com 10.638 M ils.Book value 17.34P/ E 30.63Country U S
G rowth Performance M easurementYears Price Earn. D iv. Total Ret.Last 1 -13.3 -44.3 .0 -10.6Last 5 -5.7 -10.1 9.3 -3.4
Last 10 14.3 -- - 2.3 16.1Last 25 -2.4 -4.6 -1.9 .1
Wood and upholstered furniture manufacturer 95% SC ALE
LEG EN DRead from Right Scale:PriceRelative Strength
Bottom Band VolumeM oving Avg (48 months)Recession (G rey Shaded Bars)
Read from Left Scale:EarningsD ividends
Charts are updated daily at www.SrcStockCharts.com.
121

BAXTER IN TER N ATION AL IN C (BAX)
Copyright 2019 Securities Research Company
'85 '86 '87 '88 '89 '90 '91 '92 '93 '94 '95 '96 '97 '98 '99 '00 '01 '02 '03 '04 '05 '06 '07 '08 '09 '10 '11 '12 '13 '14 '15 '16 '17 '18 '19 '20
3/ 4
1
1 1/ 4
1 1/ 2
1 3/ 4
2
2 1/ 4
2 1/ 2
2 3/ 4
3 3 1/ 43 1/ 23 3/ 4
4 1/ 2
5
5 1/ 2
6 6 1/ 27 7 1/ 2
8 1/ 2
9 1/ 2
11
12 13 14 15
17
19
22
24
26 28 30
34
38
42
46
50
55
60 65 70 75
85
95
110
120 130
.04
.05
.06
.07
.08
.09
.10
.20
.25
.30
.35
.40
.45
.50
.60
.70
.80
.90
1.0
1.5
2.0
2.5
3.0
3.5
4.0
4.5
5.0
5.5
6.06.57.07.5
8.5
100 100200 200300 300400 400500 500M
Adj. for2 for 15/ 31/ 01
Compucase Inc.merged 5/ 29/ 85
American H ospitalmerged 11/ 25/ 85
Baxter Travenolprior to 5/ 7/ 88
D ist. 1 com. sh.Caremark Int'l.
for ea. 4 shs.BAX 11/ 30/ 92
D ist 1 sh. Allegiance Cp.for ea. 5 shs. BAX 9/ 30/ 96
Research M edicalInc. acq. 3/ 17/ 97
Somatogen, Inc.acq. 5/ 4/ 98
D ist 1 sh. EdwardsLifesciences for ea.10 shs. BAX 4/ 3/ 00
Synovis Life Technologiesacquired 2/ 15/ 12
D ist. 1 sh. Baxalta Inc.for ea. sh. BAX held
7/ 1/ 15
Ind H CEQP P/ E N / AN YSE Bond$2567.0 M ils.Com 534.266 M ils.Book value 17.60P/ E 26.59Country U S
G rowth Performance M easurementYears Price Earn. D iv. Total Ret.Last 1 18.5 5.2 15.8 19.6Last 5 4.1 -8.7 -15.8 5.1
Last 10 4.1 -1.6 -1.7 5.5Last 25 7.3 6.1 2.1 8.2
M edical care equipment
LEG EN DRead from Right Scale:PriceRelative Strength
Bottom Band VolumeM oving Avg (48 months)Recession (G rey Shaded Bars)
Read from Left Scale:EarningsD ividends
Charts are updated daily at www.SrcStockCharts.com.
122

BC E IN C (BC E)
Copyright 2019 Securities Research Company
'85 '86 '87 '88 '89 '90 '91 '92 '93 '94 '95 '96 '97 '98 '99 '00 '01 '02 '03 '04 '05 '06 '07 '08 '09 '10 '11 '12 '13 '14 '15 '16 '17 '18 '19 '20
1
1 1/ 4
1 1/ 2
1 3/ 4
2
2 1/ 4
2 1/ 2
2 3/ 4
3 3 1/ 43 1/ 23 3/ 4
4 1/ 2
5
5 1/ 2
6 6 1/ 27 7 1/ 2
8 1/ 2
9 1/ 2
11
12 13 14 15
17
19
22
24 26 28 30
34
38
42
46
50
55
60 65 70 75
85
95
110
120 130 140 150
170
190
220
.07
.08
.09
.10
.20
.25
.30
.35
.40
.45
.50
.60
.70
.80
.90
1.0
1.5
2.0
2.5
3.0
3.5
4.0
4.5
5.0
5.5
6.06.57.07.5
8.5
9.5
12
14
15 1530 3045 4560 6075 75M
Adj. for2 for 15/ 23/ 97
Adj. for11 for 127/ 11/ 06
Bell Canada Enterprisesprior to 1/ 1/ 88
D ist. 1 sh. N ortel N etworks for ea.
sh. BCE 5/ 9/ 00
D ist. .0725 unit (N EW) Bell Aliant RegionalCommunications Income F und
for ea. shr. held (BCE)
D ividend omitted7/ 7/ 08
D ividends in Canadian fds. before taxto U .S. residents
Ind PH ON E P/ E N / AN YSE Bond$6068.7 M ils.Com 898.009 M ils.Book value 12.56P/ E 13.16Country Canada
G rowth Performance M easurementYears Price Earn. D iv. Total Ret.Last 1 6.7 -1.0 5.0 13.9Last 5 .2 2.1 5.1 5.7
Last 10 6.1 4.7 6.9 10.7Last 25 4.2 1.8 3.1 7.2
Telecommunications equipment and services in Canada
LEG EN DRead from Right Scale:PriceRelative Strength
Bottom Band VolumeM oving Avg (48 months)Recession (G rey Shaded Bars)
Read from Left Scale:EarningsD ividends
Charts are updated daily at www.SrcStockCharts.com.
123

BEC TON D IC KIN SON & C O (BD X)
Copyright 2019 Securities Research Company
'85 '86 '87 '88 '89 '90 '91 '92 '93 '94 '95 '96 '97 '98 '99 '00 '01 '02 '03 '04 '05 '06 '07 '08 '09 '10 '11 '12 '13 '14 '15 '16 '17 '18 '19 '20
1 3/ 4
2
2 1/ 4
2 1/ 2
2 3/ 4
3 3 1/ 43 1/ 23 3/ 4
4 1/ 2
5
5 1/ 2
6 6 1/ 27 7 1/ 2
8 1/ 2
9 1/ 2
11
12
13 14 15
17
19
22
24
26 28 30
34
38
42
46
50
55
60 65 70 75
85
95
110
120
130 140 150
170
190
220
240
260 280 300
340
380
.20
.25
.30
.35
.40
.45
.50
.60
.70
.80
.90
1.0
1.5
2.0
2.5
3.0
3.5
4.0
4.5
5.0
5.5
6.06.57.07.5
8.5
9.5
12
14
16
18
20
25
12 1224 2436 3648 4860 60M
0.07
0.07
0.07
0.07
0.08
0.08
0.08
0.08
0.09
0.09
0.09
0.09
Adj. for2 for 13/ 3/ 86
Adj. for2 for 13/ 1/ 93
Adj. for2 for 18/ 16/ 96
Adj. for2 for 1
8/ 21/ 98
TriPath Imaging acquired12/ 20/ 06
CareF usion Corp.acquired 3/ 17/ 15
AcquiredC.R. Bard
1/ 3/ 18
Ind H CEQP P/ E N / AN YSE Bond$957.0 M ils.Com 267.564 M ils.Book value 38.96P/ E 23.50Country U S
G rowth Performance M easurementYears Price Earn. D iv. Total Ret.Last 1 10.0 4.4 2.6 11.3Last 5 14.7 12.7 5.7 15.9
Last 10 13.8 8.8 9.1 14.8Last 25 12.9 11.3 12.0 13.4
M edical and laboratory products, safety items
LEG EN DRead from Right Scale:PriceRelative Strength
Bottom Band VolumeM oving Avg (48 months)Recession (G rey Shaded Bars)
Read from Left Scale:EarningsD ividends
Charts are updated daily at www.SrcStockCharts.com.
124

BED BATH & BEYON D IN C (BBBY)
Copyright 2019 Securities Research Company
'85 '86 '87 '88 '89 '90 '91 '92 '93 '94 '95 '96 '97 '98 '99 '00 '01 '02 '03 '04 '05 '06 '07 '08 '09 '10 '11 '12 '13 '14 '15 '16 '17 '18 '19 '20
1/ 2
3/ 4
1
1 1/ 4
1 1/ 2
1 3/ 4
2
2 1/ 4
2 1/ 2
2 3/ 4
3 3 1/ 43 1/ 23 3/ 4
4 1/ 2
5
5 1/ 2
6 6 1/ 27 7 1/ 2
8 1/ 2
9 1/ 2
11
12
13 14 15
17
19
22
24
26 28 30
34
38
42
46
50
55
60 65 70 75
85
95
110
120
.04
.05
.06
.07
.08
.09
.10
.20
.25
.30
.35
.40
.45
.50
.60
.70
.80
.90
1.0
1.5
2.0
2.5
3.0
3.5
4.0
4.5
5.0
5.5
6.06.57.07.5
60 60120 120180 180240 240300 300M
Adj. for2 for 17/ 9/ 93
Adj. for2 for 15/ 1/ 96
Adj. for2 for 18/ 3/ 98
Adj. for2 for 18/ 14/ 00
Christmas TreeShops acquired
6/ 19/ 2003
Ind H OM EF P/ E N / AN asdaq Bond $.0 M ils.Com 138.051 M ils.Book value 20.82P/ E 11.37Country U S
G rowth Performance M easurementYears Price Earn. D iv. Total Ret.Last 1 -3.5 -45.5 6.3 .8Last 5 -27.9 -23.5 -- - -25.9
Last 10 -9.3 -4.3 -- - -8.0Last 25 6.1 10.3 -- - 6.7
D omestics and home furnishings stores
LEG EN DRead from Right Scale:PriceRelative Strength
Bottom Band VolumeM oving Avg (48 months)Recession (G rey Shaded Bars)
Read from Left Scale:EarningsD ividends
Charts are updated daily at www.SrcStockCharts.com.
125

BEN C H M AR K ELEC TR S IN C (BH E)
Copyright 2019 Securities Research Company
'85 '86 '87 '88 '89 '90 '91 '92 '93 '94 '95 '96 '97 '98 '99 '00 '01 '02 '03 '04 '05 '06 '07 '08 '09 '10 '11 '12 '13 '14 '15 '16 '17 '18 '19 '20
1/ 4
1/ 2
3/ 4
1
1 1/ 4
1 1/ 2
1 3/ 4
2
2 1/ 4
2 1/ 2
2 3/ 4
3 3 1/ 43 1/ 23 3/ 4
4 1/ 2
5
5 1/ 2
6
6 1/ 27 7 1/ 2
8 1/ 2
9 1/ 2
11
12 13 14 15
17
19
22
24 26 28 30
34
38
42
46
50
.02
.03
.04
.05
.06
.07
.08
.09
.10
.20
.25
.30
.35
.40
.45
.50
.60
.70
.80
.90
1.0
1.5
2.0
2.5
3.0
3.5
8 816 1624 2432 3240 40M
Adj. for2 for 18/ 15/ 97
Adj. for3 for 2
11/ 14/ 03
Adj. for3 for 24/ 4/ 06
Pemstar Inc.acquired 1/ 8/ 07
Ind EM SVC P/ E N / AN YSE Bond $.0 M ils.Com 46.586 M ils.Book value 28.35P/ E 25.90Country U S
G rowth Performance M easurementYears Price Earn. D iv. Total Ret.Last 1 36.5 -7.6 .0 38.9Last 5 7.4 -4.0 -- - 8.1
Last 10 6.7 3.9 -- - 7.0Last 25 7.4 6.0 -- - 7.5
Contract manufacturing services
LEG EN DRead from Right Scale:PriceRelative Strength
Bottom Band VolumeM oving Avg (48 months)Recession (G rey Shaded Bars)
Read from Left Scale:EarningsD ividends
Charts are updated daily at www.SrcStockCharts.com.
126

BER KSH IR E H ATH AWAY IN C D EL (BR KA)
Copyright 2019 Securities Research Company
'85 '86 '87 '88 '89 '90 '91 '92 '93 '94 '95 '96 '97 '98 '99 '00 '01 '02 '03 '04 '05 '06 '07 '08 '09 '10 '11 '12 '13 '14 '15 '16 '17 '18 '19 '20
600
700
800
900
1000 1100 1200
1400
1600
1800
2000 2200 2400
2800
3200
3600
4000 4400 4800
5500 6000
7000
8000
9000
10000 11000 12000
14000
16000
18000
20000 22000 24000
27000
30000 33000 36000
40000 44000 48000 53000 58000 64000 70000 77000 84000 92000 101000 110000 120000
135000
150000 165000 180000
200000 220000 240000
270000
300000 330000 360000
400000
40
45
50
60
70
80
90
100110120
140
160
180
200220240
270
300
340
380420460
550600
700
800
900
100011001200
1400
1600
1800
200022002400
2700
300033003600
4000440048005300580064007000770084009200
1000011000120001320014400
1600017500
1950021500
5 510 1015 1520 2025 25T
Scott F etzer Co.acq. 1/ 86
H .H . Brown ShoeCo. Inc. acq. 7/ 91
D exter Shoe Co.acq. 11/ 8/ 93
G EICO Corp.acq. 1/ 2/ 96
F light Saftey Int'lacq. 12/ 23/ 96
Int'l. D airy Queenacquired 1/ 5/ 98
G eneral Reacq. 12/ 21/ 98
Benjamin M oore & Co. acquired 1/ 2/ 01
Johns M anvilleacquired 2/ 27/ 01
XTRA Cp.acq. 9/ 10/ 02
Clayton H omesacquired 8/ 7/ 03
Business Wireacquired3/ 1/ 06
Iscar M etalworkingacquired 5/ 5/ 06
Applied U nderwritersacquired 5/ 22/ 06
AcquiredBurlington N orthern Santa F e
2/ 9/ 10
Lubrizol Co.acquired 9/ 16/ 11
Wesco F inancial Corp. acquired 6/ 24/ 11
H einz (H .J.) &Co.acquired 6/ 10/ 13
Ind IN SPC P/ E N / AN YSE Bond $36.5 M ils.Com .735 M ils.Book value 98504.00P/ E 22.20Country U S
G rowth Performance M easurementYears Price Earn. D iv. Total Ret.Last 1 9.2 1.7 .0 9.2Last 5 9.5 8.8 .0 9.5
Last 10 11.5 12.1 .0 11.5Last 25 11.1 14.5 .0 11.1
Interests in insurance, publishing, retailing and manufacturing 80% SC ALE
LEG EN DRead from Right Scale:PriceRelative Strength
Bottom Band VolumeM oving Avg (48 months)Recession (G rey Shaded Bars)
Read from Left Scale:EarningsD ividends
Charts are updated daily at www.SrcStockCharts.com.
127

BEST BU Y IN C (BBY)
Copyright 2019 Securities Research Company
'85 '86 '87 '88 '89 '90 '91 '92 '93 '94 '95 '96 '97 '98 '99 '00 '01 '02 '03 '04 '05 '06 '07 '08 '09 '10 '11 '12 '13 '14 '15 '16 '17 '18 '19 '20
1/ 4
1/ 2
3/ 4
1
1 1/ 4
1 1/ 2
1 3/ 4
2
2 1/ 42 1/ 22 3/ 4
3 1/ 4
3 3/ 4
4 1/ 25 5 1/ 2
6 1/ 2
7 1/ 2
8 1/ 2
9 1/ 2
11
13
15
17
19
22
26
30
34
38 42 46
55
65
75
85
95
110
130
150
170
.01
.02
.03
.04
.05
.06
.07
.08
.09
.10
.20
.25
.30
.35
.40
.45
.50
.60
.70
.80
.901.0
1.5
2.0
2.5
3.0
3.5
4.0
4.55.05.5
6.5
7.5
8.5
9.5
100 100200 200300 300400 400500 500M
0.01 0.01 0.00 0.00
(0.00)
0.00
Adj. for3 for 23/ 5/ 85
Adj. for2 for 14/ 1/ 86
Adj. for3 for 22/ 24/ 87
Adj. for3 for 29/ 2/ 93
Adj. for2 for 14/ 29/ 94
Adj. for2 for 1
5/ 27/ 98
Adj. for2 for 13/ 19/ 99
Adj. for3 for 2
5/ 13/ 02
Adj. for3 for 28/ 4/ 05
Listed N YSE7/ 20/ 87
OTC prior
Special$0.17
Special$0.51
Special$0.45
Ind RTCOM P/ E N / AN YSE Bond$590.0 M ils.Com 274.558 M ils.Book value 16.24P/ E 15.24Country U S
G rowth Performance M easurementYears Price Earn. D iv. Total Ret.Last 1 53.0 17.1 11.1 55.6Last 5 20.8 20.6 21.4 22.6
Last 10 9.5 7.3 13.6 10.6Last 25 14.0 16.4 -- - 14.6
D D iscount stores selling electronics, computers and appliances 75% SC ALE
LEG EN DRead from Right Scale:PriceRelative Strength
Bottom Band VolumeM oving Avg (48 months)Recession (G rey Shaded Bars)
Read from Left Scale:EarningsD ividends
Charts are updated daily at www.SrcStockCharts.com.
128

BH P BILLITON LTD (BH P)
Copyright 2019 Securities Research Company
'85 '86 '87 '88 '89 '90 '91 '92 '93 '94 '95 '96 '97 '98 '99 '00 '01 '02 '03 '04 '05 '06 '07 '08 '09 '10 '11 '12 '13 '14 '15 '16 '17 '18 '19 '20
3/ 4
1
1 1/ 4
1 1/ 2
1 3/ 4
2
2 1/ 4
2 1/ 2
2 3/ 4
3 3 1/ 43 1/ 23 3/ 4
4 1/ 2
5
5 1/ 2
6 6 1/ 27 7 1/ 2
8 1/ 2
9 1/ 2
11
12 13 14 15
17
19
22
24
26 28 30
34
38
42
46
50
55
60 65 70 75
85
95
110
120 130
.04
.05
.06
.07
.08
.09
.10
.20
.25
.30
.35
.40
.45
.50
.60
.70
.80
.90
1.0
1.5
2.0
2.5
3.0
3.5
4.0
4.5
5.0
5.5
6.06.57.07.5
8.5
40 4080 80
120 120160 160200 200M
Adj. for12.5% SD
4/ 19/ 85
Adj. for20% SD1/ 31/ 86
Adj. for1 for 26/ 4/ 87
Adj. for10% SD4/ 24/ 89
Adj. for10% SD5/ 12/ 95
Adj. for2 for 16/ 25/ 96
Adj. for2.0651 for 1
7/ 13/ 01
Two "AD R"(OLD ) exchanged for
1 'AD R'(N EW) to effect 1 for 2 reverse split
6/ 4/ 87
D ist. 1 sh. Onestellfor ea. 4.13 shs. BH P 10/ 24/ 00
Broken H ill Property Ltd.prior to10/ 30/ 00
D ist. 0.40 shs.BH P Steel for ea.
AD R BH P 7/ 15/ 02
WM C Resources Ltd.acquired 6/ 6/ 05
D ividends free of Australian tax
Special$2.04
1/ 30/ 19
Ind M ETAL P/ E N / AN YSE Bond$740.0 M ils.Com 1605.846 M ils.Book value 33.82P/ E N / ACountry Australia
G rowth Performance M easurementYears Price Earn. D iv. Total Ret.Last 1 6.3 .0 12.7 11.4Last 5 3.3 -6.5 1.9 6.7
Last 10 -2.4 - .2 5.0 .8Last 25 6.8 6.8 9.0 8.6
AD R - D iversified resources company
LEG EN DRead from Right Scale:PriceRelative Strength
Bottom Band VolumeM oving Avg (48 months)Recession (G rey Shaded Bars)
Read from Left Scale:EarningsD ividends
Charts are updated daily at www.SrcStockCharts.com.
129

BIG LOTS IN C (BIG )
Copyright 2019 Securities Research Company
'85 '86 '87 '88 '89 '90 '91 '92 '93 '94 '95 '96 '97 '98 '99 '00 '01 '02 '03 '04 '05 '06 '07 '08 '09 '10 '11 '12 '13 '14 '15 '16 '17 '18 '19 '20
1/ 2
3/ 4
1
1 1/ 4
1 1/ 2
1 3/ 4
2
2 1/ 4
2 1/ 2
2 3/ 4
3
3 1/ 43 1/ 23 3/ 4
4 1/ 2
5
5 1/ 2
6
6 1/ 27 7 1/ 2
8 1/ 2
9 1/ 2
11
12
13 14 15
17
19
22
24 26 28 30
34
38
42
46
50
55
60
65 70 75
85
95
.03
.04
.05
.06
.07
.08
.09
.10
.20
.25
.30
.35
.40
.45
.50
.60
.70
.80
.90
1.0
1.5
2.0
2.5
3.0
3.5
4.0
4.5
5.0
5.5
6.0
20 2040 4060 6080 80
100 100M
(0.10)
(0.13)
(0.12)
(0.10)
Adj. for2 for 1
11/ 26/ 85
Adj. for2 for 16/ 17/ 86
Adj. for5 for 4
12/ 26/ 96
Adj. for5 for 4
6/ 25/ 97
ListedN YSE 7/ 9/ 86ASE 6/ 20/ 85
OTC prior
Consolidated Storesprior to 5/ 16/ 01
Ind RTG EN P/ E N / AN YSE Bond $.0 M ils.Com 40.341 M ils.Book value 18.37P/ E 7.36Country U S
G rowth Performance M easurementYears Price Earn. D iv. Total Ret.Last 1 -7.8 .0 .0 -4.0Last 5 -8.7 18.0 12.0 -5.8
Last 10 .2 6.7 -- - 2.0Last 25 3.7 7.8 -- - 4.4
Retail stores selling close-out merchandise
LEG EN DRead from Right Scale:PriceRelative Strength
Bottom Band VolumeM oving Avg (48 months)Recession (G rey Shaded Bars)
Read from Left Scale:EarningsD ividends
Charts are updated daily at www.SrcStockCharts.com.
130

BIO R AD LABS IN C (BIO)
Copyright 2019 Securities Research Company
'85 '86 '87 '88 '89 '90 '91 '92 '93 '94 '95 '96 '97 '98 '99 '00 '01 '02 '03 '04 '05 '06 '07 '08 '09 '10 '11 '12 '13 '14 '15 '16 '17 '18 '19 '20
2
2 1/ 4
2 1/ 2
2 3/ 4
3 3 1/ 43 1/ 2
4
4 1/ 2
5
5 1/ 2
6 6 1/ 27
8
9
10
11
12 13 14
16
18
20
22
24 26 28
32
36
40
44
48
55
60 65 70
80
90
100
110
120 130 140
160
180
200
220
240 260 280
320
360
400
440
480
.20
.25
.30
.35
.40
.45
.50
.60
.70
.80
.90
1.0
1.5
2.0
2.5
3.0
3.5
4.0
4.5
5.0
5.5
6.06.57.0
8.0
9.0
10
12
14
16
18
20
25
30
35
2 24 46 68 8
10 10M
Adj. for3 for 26/ 3/ 96
Adj. for2 for 13/ 8/ 02
ListedN YSE 10/ 28/ 08
ASE prior
Ind LFSCT P/ E N / AN YSE Bond$425.6 M ils.Com 24.735 M ils.Book value 86.60P/ E 55.10Country U S
G rowth Performance M easurementYears Price Earn. D iv. Total Ret.Last 1 53.5 19.0 -- - 53.5Last 5 27.4 13.5 -- - 27.4
Last 10 15.2 2.2 -- - 15.2Last 25 16.2 9.9 -- - 16.2
Systems used to separate complex chemical and biological materials 95% SC ALE
LEG EN DRead from Right Scale:PriceRelative Strength
Bottom Band VolumeM oving Avg (48 months)Recession (G rey Shaded Bars)
Read from Left Scale:EarningsD ividends
Charts are updated daily at www.SrcStockCharts.com.
131

BIO TEC H N E C OR P (TEC H )
Copyright 2019 Securities Research Company
'85 '86 '87 '88 '89 '90 '91 '92 '93 '94 '95 '96 '97 '98 '99 '00 '01 '02 '03 '04 '05 '06 '07 '08 '09 '10 '11 '12 '13 '14 '15 '16 '17 '18 '19 '20
1/ 4
1/ 2
3/ 4
1
1 1/ 4
1 1/ 2
1 3/ 4
2
2 1/ 42 1/ 22 3/ 4
3 1/ 4
3 3/ 4
4 1/ 25 5 1/ 2
6 1/ 2
7 1/ 2
8 1/ 2
9 1/ 2
11
13
15
17
19
22
26
30
34
38 42 46
55
65
75
85
95
110
130
150
170
190
220
260
300
.02
.03
.04
.05
.06
.07
.08
.09
.10
.20
.25
.30
.35
.40
.45
.50
.60
.70
.80
.901.0
1.5
2.0
2.5
3.0
3.5
4.0
4.55.05.5
6.5
7.5
8.5
9.5
12
14
16
1820
6 612 1218 1824 2430 30M
0.01
Adj. for2 for 1
11/ 18/ 97
Adj. for2 for 1
12/ 4/ 00
Ind LFSCT P/ E N / AN asdaq Bond$18.9 M ils.Com 37.731 M ils.Book value 23.60P/ E 47.19Country U S
G rowth Performance M easurementYears Price Earn. D iv. Total Ret.Last 1 23.9 - .2 .0 24.6Last 5 18.4 5.6 .0 19.1
Last 10 12.7 4.8 2.1 13.3Last 25 19.1 14.4 -- - 19.4
M anufactures biological products 75% SC ALE
LEG EN DRead from Right Scale:PriceRelative Strength
Bottom Band VolumeM oving Avg (48 months)Recession (G rey Shaded Bars)
Read from Left Scale:EarningsD ividends
Charts are updated daily at www.SrcStockCharts.com.
132

BLAC K H ILLS C OR POR ATION (BKH )
Copyright 2019 Securities Research Company
'85 '86 '87 '88 '89 '90 '91 '92 '93 '94 '95 '96 '97 '98 '99 '00 '01 '02 '03 '04 '05 '06 '07 '08 '09 '10 '11 '12 '13 '14 '15 '16 '17 '18 '19 '20
1 1/ 4
1 1/ 2
1 3/ 4
2
2 1/ 4
2 1/ 2
2 3/ 4
3 3 1/ 43 1/ 23 3/ 4
4 1/ 2
5
5 1/ 2
6 6 1/ 27 7 1/ 2
8 1/ 2
9 1/ 2
11
12 13 14 15
17
19
22
24 26 28 30
34
38
42
46
50
55
60 65 70 75
85
95
110
120 130 140 150
170
190
220
240 260
.08
.09
.10
.20
.25
.30
.35
.40
.45
.50
.60
.70
.80
.90
1.0
1.5
2.0
2.5
3.0
3.5
4.0
4.5
5.0
5.5
6.0
6.57.07.5
8.5
9.5
12
14
16
5 510 1015 1520 2025 25M
Adj. for2 for 13/ 3/ 86
Adj. for3 for 23/ 3/ 92
Adj. for3 for 23/ 11/ 98
Black H ills Power & Lightprior to 1986
Ind M U TIL P/ E N / AN YSE Bond$628.3 M ils.Com 53.595 M ils.Book value 30.48P/ E 24.13Country U S
G rowth Performance M easurementYears Price Earn. D iv. Total Ret.Last 1 14.1 -9.6 5.9 17.1Last 5 9.1 2.2 6.5 11.5
Last 10 11.5 9.1 4.2 13.7Last 25 6.9 4.3 3.6 8.4
Electric service, coal mining, and oil & gas production
LEG EN DRead from Right Scale:PriceRelative Strength
Bottom Band VolumeM oving Avg (48 months)Recession (G rey Shaded Bars)
Read from Left Scale:EarningsD ividends
Charts are updated daily at www.SrcStockCharts.com.
133

BLAC KSTON E M OR TG AG E TR U ST IN C . (BXM T)
Copyright 2019 Securities Research Company
'85 '86 '87 '88 '89 '90 '91 '92 '93 '94 '95 '96 '97 '98 '99 '00 '01 '02 '03 '04 '05 '06 '07 '08 '09 '10 '11 '12 '13 '14 '15 '16 '17 '18 '19 '20
3/ 4
1
1 1/ 4
1 1/ 2
1 3/ 4
2
2 1/ 42 1/ 22 3/ 4
3 1/ 4
3 3/ 4
4 1/ 25 5 1/ 2
6 1/ 2
7 1/ 2
8 1/ 2
9 1/ 2
11
13
15
17
19
22
26
30
34
38 42 46
55
65
75
85
95
110
130
150
170
190
220
260
300
340
380 420 460
600
700
800
.04
.05
.06
.07
.08
.09
.10
.20
.25
.30
.35
.40
.45
.50
.60
.70
.80
.901.0
1.5
2.0
2.5
3.0
3.5
4.0
4.55.05.5
6.5
7.5
8.5
9.5
12
14
16
1820
25
30
35
40
4550
8 816 1624 2432 3240 40M
(3.00)
(6.00)
(9.30)
(6.60) (11.70)
(12.60)
(13.50)
(13.50)
(33.90)
(34.50)
(26.70)
(28.50)
(9.00)
(8.40)
(11.10)
(1.80) (16.20) (15.90)
(22.90)
(47.10)
(206.30)
(198.00)
(196.30)
(178.50)
(13.70)
(0.29)
Adj. for1 for 34/ 3/ 03
Adj. for1 for 105/ 7/ 13Special
$3.75Paid$3.00
Exchanged forCl. A new
4/ 3/ 03
Special$10.00
D ividendOmitted07/ 28/ 10
Special$20.00
Capital Trust Inc.prior to 5/ 7/ 13
Ind M REIT P/ E N / AN YSE Bond$505.1 M ils.Com 118.342 M ils.Book value 26.37P/ E 13.62Country U S
G rowth Performance M easurementYears Price Earn. D iv. Total Ret.Last 1 7.4 -6.5 .0 14.6Last 5 4.9 7.6 4.4 11.0
Last 10 10.6 -- - -20.3 14.3Last 25 -1.4 -- - -3.5 5.3
REIT - Invests in commercial real estate 75% SC ALE
LEG EN DRead from Right Scale:PriceRelative Strength
Bottom Band VolumeM oving Avg (48 months)Recession (G rey Shaded Bars)
Read from Left Scale:EarningsD ividends
Charts are updated daily at www.SrcStockCharts.com.
134

BLOC K H & R IN C (H R B)
Copyright 2019 Securities Research Company
'85 '86 '87 '88 '89 '90 '91 '92 '93 '94 '95 '96 '97 '98 '99 '00 '01 '02 '03 '04 '05 '06 '07 '08 '09 '10 '11 '12 '13 '14 '15 '16 '17 '18 '19 '20
1/ 2
3/ 4
1
1 1/ 4
1 1/ 2
1 3/ 4
2
2 1/ 4
2 1/ 2
2 3/ 4
3 3 1/ 43 1/ 23 3/ 4
4 1/ 2
5
5 1/ 2
6 6 1/ 27 7 1/ 2
8 1/ 2
9 1/ 2
11
12
13 14 15
17
19
22
24
26 28 30
34
38
42
46
50
55
60 65
.02
.03
.04
.05
.06
.07
.08
.09
.10
.20
.25
.30
.35
.40
.45
.50
.60
.70
.80
.90
1.0
1.5
2.0
2.5
3.0
3.5
4.0
20 2040 4060 6080 80
100 100M
(2.85)
(2.85)
(2.95)
Adj. for2 for 110/ 2/ 85
Adj. for2 for 110/ 2/ 87
Adj. for2 for 110/ 2/ 91
Adj. for2 for 18/ 2/ 01
Adj. for2 for 18/ 23/ 05
Ind SPECS P/ E N / AN YSE Bond$417.5 M ils.Com 205.521 M ils.Book value 1.27P/ E N / ACountry U S
G rowth Performance M easurementYears Price Earn. D iv. Total Ret.Last 1 .3 -- - 4.0 4.6Last 5 -7.2 -- - 5.4 -3.8
Last 10 .9 -- - 5.7 4.0Last 25 4.0 -- - 4.9 5.9
Tax return preparation, personnel and computer services
LEG EN DRead from Right Scale:PriceRelative Strength
Bottom Band VolumeM oving Avg (48 months)Recession (G rey Shaded Bars)
Read from Left Scale:EarningsD ividends
Charts are updated daily at www.SrcStockCharts.com.
135

BOEIN G C O (BA)
Copyright 2019 Securities Research Company
'85 '86 '87 '88 '89 '90 '91 '92 '93 '94 '95 '96 '97 '98 '99 '00 '01 '02 '03 '04 '05 '06 '07 '08 '09 '10 '11 '12 '13 '14 '15 '16 '17 '18 '19 '20
2 1/ 4
2 1/ 2
2 3/ 4
3
3 1/ 43 1/ 23 3/ 4
4 1/ 2
5
5 1/ 2
6 6 1/ 27 7 1/ 2
8 1/ 2
9 1/ 2
11
12 13 14 15
17
19
22
24 26 28 30
34
38
42
46
50
55
60 65 70 75
85
95
110
120 130 140 150
170
190
220
240 260 280 300
340
380
420
460
500
.20
.25
.30
.35
.40
.45
.50
.60
.70
.80
.90
1.0
1.5
2.0
2.5
3.0
3.5
4.0
4.5
5.0
5.5
6.0
6.57.07.5
8.5
9.5
12
14
16
18
20
25
30
35
30 3060 6090 90
120 120150 150M
(0.18)
(0.68)
(0.97)
0.11 (0.02)
Adj. for3 for 2
6/ 10/ 85
Adj. for3 for 2
6/ 12/ 89
Adj. for3 for 26/ 11/ 90
Adj. for2 for 16/ 9/ 97
M cD onnell D ouglasacq. 8/ 1/ 97
Aviall Inc.acquired 9/ 21/ 06
Ind AEROD P/ E N / AN YSE Bond$8157.0 M ils.Com 574.508 M ils.Book value 1.32P/ E 25.36Country U S
G rowth Performance M easurementYears Price Earn. D iv. Total Ret.Last 1 -14.4 -18.8 20.2 -12.3Last 5 17.8 8.6 23.0 19.8
Last 10 18.5 21.7 17.2 19.8Last 25 11.4 9.8 11.9 12.0
D E Commercial and military aircraft, missiles
LEG EN DRead from Right Scale:PriceRelative Strength
Bottom Band VolumeM oving Avg (48 months)Recession (G rey Shaded Bars)
Read from Left Scale:EarningsD ividends
Charts are updated daily at www.SrcStockCharts.com.
136

BOR G WAR N ER IN C (BWA)
Copyright 2019 Securities Research Company
'85 '86 '87 '88 '89 '90 '91 '92 '93 '94 '95 '96 '97 '98 '99 '00 '01 '02 '03 '04 '05 '06 '07 '08 '09 '10 '11 '12 '13 '14 '15 '16 '17 '18 '19 '20
1/ 2
3/ 4
1
1 1/ 4
1 1/ 2
1 3/ 4
2
2 1/ 4
2 1/ 2
2 3/ 4
3 3 1/ 43 1/ 23 3/ 4
4 1/ 2
5
5 1/ 2
6 6 1/ 27 7 1/ 2
8 1/ 2
9 1/ 2
11
12
13 14 15
17
19
22
24
26 28 30
34
38
42
46
50
55
60 65 70 75
85
95
.03
.04
.05
.06
.07
.08
.09
.10
.20
.25
.30
.35
.40
.45
.50
.60
.70
.80
.90
1.0
1.5
2.0
2.5
3.0
3.5
4.0
4.5
5.0
5.5
6.06.5
30 3060 6090 90
120 120150 150M
0.01
Adj. for2 for 1
5/ 18/ 04
Adj. for2 for 1
12/ 18/ 07
Adj. for2 for 1
12/ 17/ 13
D ividendOmitted05/ 19/ 10
Ind AU TOP P/ E N / AN YSE Bond$569.4 M ils.Com 210.550 M ils.Book value 15.16P/ E 9.93Country U S
G rowth Performance M easurementYears Price Earn. D iv. Total Ret.Last 1 1.3 -7.1 .0 2.9Last 5 -5.2 5.0 5.5 -3.8
Last 10 9.0 34.5 11.0 9.9Last 25 11.3 10.5 9.2 11.9
D E Automotive components and engineered systems
LEG EN DRead from Right Scale:PriceRelative Strength
Bottom Band VolumeM oving Avg (48 months)Recession (G rey Shaded Bars)
Read from Left Scale:EarningsD ividends
Charts are updated daily at www.SrcStockCharts.com.
137

BOSTON SC IEN TIF IC C OR P (BSX)
Copyright 2019 Securities Research Company
'85 '86 '87 '88 '89 '90 '91 '92 '93 '94 '95 '96 '97 '98 '99 '00 '01 '02 '03 '04 '05 '06 '07 '08 '09 '10 '11 '12 '13 '14 '15 '16 '17 '18 '19 '20
1/ 4
1/ 2
3/ 4
1
1 1/ 4
1 1/ 2
1 3/ 4
2
2 1/ 4
2 1/ 2
2 3/ 43 3 1/ 4
3 3/ 4
4 1/ 2
5
5 1/ 26 6 1/ 2
7 1/ 2
8 1/ 2
9 1/ 2
11 12 13
15
17
19
22 24 26
30
34
38
42 46 50
55 60 65
.01
.02
.03
.04
.05
.06
.07
.08
.09
.10
.20
.25
.30
.35
.40
.45
.50
.60
.70
.80
.90
1.0
1.5
2.0
2.5
3.0
3.5
4.0
4.5
300 300600 600900 900
1200 12001500 1500M
(0.00) (0.37)
(0.34)
(0.30)
(0.27)
Adj. for2 for 112/ 1/ 98
Adj. for2 for 1
11/ 6/ 03
ListedN YSE
5/ 19/ 92
EP Technologies, Inc.acquired 1/ 23/ 96
SciM ed Life Sys.acquired 2/ 24/ 95
H eart Technologyacquired 12/ 29/ 95
Cardiac Pathways Corp acquired11/ 30/ 00
Rubicon M edical Corp.acquired 6/ 15/ 05
G uidant Corp.acquired 4/ 21/ 06 CRYOCOR IN C.
acquired 5/ 29/ 08
Ind H CEQP P/ E N / AN YSE Bond$8895.0 M ils.Com 1382.925 M ils.Book value 5.23P/ E 30.05Country U S
G rowth Performance M easurementYears Price Earn. D iv. Total Ret.Last 1 19.7 2.7 -- - 19.7Last 5 25.3 12.9 -- - 25.3
Last 10 18.1 11.8 -- - 18.1Last 25 9.6 8.4 -- - 9.6
Produces a wide variety of medical devices 85% SC ALE
LEG EN DRead from Right Scale:PriceRelative Strength
Bottom Band VolumeM oving Avg (48 months)Recession (G rey Shaded Bars)
Read from Left Scale:EarningsD ividends
Charts are updated daily at www.SrcStockCharts.com.
138

BOYD G AM IN G C OR P (BYD )
Copyright 2019 Securities Research Company
'85 '86 '87 '88 '89 '90 '91 '92 '93 '94 '95 '96 '97 '98 '99 '00 '01 '02 '03 '04 '05 '06 '07 '08 '09 '10 '11 '12 '13 '14 '15 '16 '17 '18 '19 '20
1/ 2
3/ 4
1
1 1/ 4
1 1/ 2
1 3/ 4
2
2 1/ 4
2 1/ 2
2 3/ 4
3
3 1/ 43 1/ 23 3/ 4
4 1/ 2
5
5 1/ 2
6
6 1/ 27 7 1/ 2
8 1/ 2
9 1/ 2
11
12
13 14 15
17
19
22
24 26 28 30
34
38
42
46
50
55
60
65 70 75
85
.03
.04
.05
.06
.07
.08
.09
.10
.20
.25
.30
.35
.40
.45
.50
.60
.70
.80
.90
1.0
1.5
2.0
2.5
3.0
3.5
4.0
4.5
5.0
5.5
25 2550 5075 75
100 100125 125M
0.00 0.00
(0.28)
(0.37)
(0.31)
(0.28)
(0.21)
(0.26)
(0.31)
(0.23)
0.01
D ividendOmitted8/ 19/ 08
Ind CSIN O P/ E N / AN YSE Bond$2133.0 M ils.Com 112.274 M ils.Book value 5.95P/ E 17.90Country U S
G rowth Performance M easurementYears Price Earn. D iv. Total Ret.Last 1 4.8 21.2 16.7 5.8Last 5 17.0 175.9 -14.1 17.5
Last 10 13.9 16.1 -7.3 14.1Last 25 3.6 7.1 -- - 4.0
E G aming company which owns various casino entertainment facilities
LEG EN DRead from Right Scale:PriceRelative Strength
Bottom Band VolumeM oving Avg (48 months)Recession (G rey Shaded Bars)
Read from Left Scale:EarningsD ividends
Charts are updated daily at www.SrcStockCharts.com.
139

BP P LC (BP )
Copyright 2019 Securities Research Company
'85 '86 '87 '88 '89 '90 '91 '92 '93 '94 '95 '96 '97 '98 '99 '00 '01 '02 '03 '04 '05 '06 '07 '08 '09 '10 '11 '12 '13 '14 '15 '16 '17 '18 '19 '20
1
1 1/ 4
1 1/ 2
1 3/ 4
2
2 1/ 4
2 1/ 2
2 3/ 4
3 3 1/ 43 1/ 23 3/ 4
4 1/ 2
5
5 1/ 2
6
6 1/ 27 7 1/ 2
8 1/ 2
9 1/ 2
11
12
13 14 15
17
19
22
24
26 28 30
34
38
42
46
50
55
60
65 70 75
85
95
110
120
130 140 150
170
190
.06
.07
.08
.09
.10
.20
.25
.30
.35
.40
.45
.50
.60
.70
.80
.90
1.0
1.5
2.0
2.5
3.0
3.5
4.0
4.5
5.0
5.5
6.06.57.07.5
8.5
9.5
12
100 100200 200300 300400 400500 500M
Adj. for2 for 16/ 6/ 97
Adj. for2 for 110/ 4/ 99
British Petroleumprior to 4/ 1/ 99
Atlantic Richfieldacq. 4/ 18/ 00
Amoco Corp.acq. 1/ 4/ 99BP Amoco plc
prior to 5/ 1/ 01
D ividends free of British tax
Ind OG IN T P/ E N / AN YSE Bond$9644.0 M ils.Com 3343.000 M ils.Book value 29.35P/ E 12.03CountryG reat Britian (U K)
G rowth Performance M easurementYears Price Earn. D iv. Total Ret.Last 1 -5.8 -15.0 .0 .2Last 5 - .0 -4.5 .5 5.5
Last 10 -3.6 -3.7 -3.1 .6Last 25 2.8 4.5 6.7 6.1
AD R - Large international oil company
LEG EN DRead from Right Scale:PriceRelative Strength
Bottom Band VolumeM oving Avg (48 months)Recession (G rey Shaded Bars)
Read from Left Scale:EarningsD ividends
Charts are updated daily at www.SrcStockCharts.com.
140

BR AD Y C OR P (BR C )
Copyright 2019 Securities Research Company
'85 '86 '87 '88 '89 '90 '91 '92 '93 '94 '95 '96 '97 '98 '99 '00 '01 '02 '03 '04 '05 '06 '07 '08 '09 '10 '11 '12 '13 '14 '15 '16 '17 '18 '19 '20
1/ 2
3/ 4
1
1 1/ 4
1 1/ 2
1 3/ 4
2
2 1/ 4
2 1/ 2
2 3/ 4
3
3 1/ 43 1/ 23 3/ 4
4 1/ 2
5
5 1/ 2
6
6 1/ 27 7 1/ 2
8 1/ 2
9 1/ 2
11
12 13 14 15
17
19
22
24 26 28 30
34
38
42
46
50
55
60
65 70 75
85
95
.03
.04
.05
.06
.07
.08
.09
.10
.20
.25
.30
.35
.40
.45
.50
.60
.70
.80
.90
1.0
1.5
2.0
2.5
3.0
3.5
4.0
4.5
5.0
5.5
6.06.57.0
4 48 8
12 1216 1620 20M
.02
0.02
0.02
0.02
0.02
0.02
0.02
0.02
0.02
Adj. for2 for 1
11/ 3/ 86
Adj. for3 for 1
12/ 18/ 95
Adj. for2 for 11/ 3/ 05
Ind EEQPM P/ E N / AN YSE Bond$350.0 M ils.Com 48.466 M ils.Book value 12.62P/ E 22.04Country U S
G rowth Performance M easurementYears Price Earn. D iv. Total Ret.Last 1 27.2 21.7 2.4 29.1Last 5 16.8 12.2 1.7 18.4
Last 10 7.2 5.9 2.2 8.6Last 25 8.6 7.2 7.8 9.6
M akes a variety of industrial and facility identification products
LEG EN DRead from Right Scale:PriceRelative Strength
Bottom Band VolumeM oving Avg (48 months)Recession (G rey Shaded Bars)
Read from Left Scale:EarningsD ividends
Charts are updated daily at www.SrcStockCharts.com.
141

BR AN D YWIN E R EALTY TR U ST (BD N )
Copyright 2019 Securities Research Company
'85 '86 '87 '88 '89 '90 '91 '92 '93 '94 '95 '96 '97 '98 '99 '00 '01 '02 '03 '04 '05 '06 '07 '08 '09 '10 '11 '12 '13 '14 '15 '16 '17 '18 '19 '20
1/ 2
3/ 4
1
1 1/ 4
1 1/ 2
1 3/ 4
2
2 1/ 4
2 1/ 2
2 3/ 4
3
3 1/ 43 1/ 23 3/ 4
4 1/ 2
5
5 1/ 2
6
6 1/ 27 7 1/ 2
8 1/ 2
9 1/ 2
11
12
13 14 15
17
19
22
24 26 28 30
34
38
42
46
50
55
60
65 70 75
85
95
.03
.04
.05
.06
.07
.08
.09
.10
.20
.25
.30
.35
.40
.45
.50
.60
.70
.80
.90
1.0
1.5
2.0
2.5
3.0
3.5
4.0
4.5
5.0
5.5
6.06.5
20 2040 4060 6080 80
100 100M
(0.31)
(0.31)
(0.12)
(0.12)
(0.03)
(0.01)
(0.06)
(0.02)
0.01 (0.22)
Adj. for1 for 3
11/ 26/ 96
Linpro Specified Pptysprior to 1989
Specials$2.19
Specials$3.00
Special$0.12
Prentiss Propertiesacquired 1/ 5/ 2006
Ind OREIT P/ E N / AN YSE Bond$828.1 M ils.Com 178.603 M ils.Book value 10.82P/ E 24.95Country U S
G rowth Performance M easurementYears Price Earn. D iv. Total Ret.Last 1 2.8 -32.6 5.6 7.8Last 5 -1.4 128.3 4.8 2.7
Last 10 3.3 2.0 6.6 6.9Last 25 1.1 -3.0 1.0 5.4
REIT - Owns and leases office properties
LEG EN DRead from Right Scale:PriceRelative Strength
Bottom Band VolumeM oving Avg (48 months)Recession (G rey Shaded Bars)
Read from Left Scale:EarningsD ividends
Charts are updated daily at www.SrcStockCharts.com.
142

BR IG G S & STR ATTON C OR P (BG G )
Copyright 2019 Securities Research Company
'85 '86 '87 '88 '89 '90 '91 '92 '93 '94 '95 '96 '97 '98 '99 '00 '01 '02 '03 '04 '05 '06 '07 '08 '09 '10 '11 '12 '13 '14 '15 '16 '17 '18 '19 '20
1/ 2
3/ 4
1
1 1/ 4
1 1/ 2
1 3/ 4
2
2 1/ 4
2 1/ 2
2 3/ 4
3
3 1/ 43 1/ 23 3/ 4
4 1/ 2
5
5 1/ 2
6
6 1/ 27 7 1/ 2
8 1/ 2
9 1/ 2
11
12
13 14 15
17
19
22
24 26 28 30
34
38
42
46
50
55
60
65 70 75
85
95
.03
.04
.05
.06
.07
.08
.09
.10
.20
.25
.30
.35
.40
.45
.50
.60
.70
.80
.90
1.0
1.5
2.0
2.5
3.0
3.5
4.0
4.5
5.0
5.5
6.06.5
6 612 1218 1824 2430 30M
(0.35)
(0.34)
(0.15)
(0.21)
(0.37)
Adj. for2 for 1
11/ 15/ 94
Adj. for2 for 1
11/ 10/ 04
Earns. onLIF O basis
D ist. 1 sh. StrattecSecurity for ea. 10 shs.
of BG G 2/ 27/ 95
Special$0.12
Ind M ACH N P/ E N / AN YSE Bond$383.3 M ils.Com 42.388 M ils.Book value 11.43P/ E N / ACountry U S
G rowth Performance M easurementYears Price Earn. D iv. Total Ret.Last 1 -59.9 -- - -64.3 -56.3Last 5 -22.5 -- - -16.7 -16.0
Last 10 -11.0 -- - -7.6 -4.8Last 25 -4.8 -- - -3.3 .5
Small gasoline engines, automobile locks
LEG EN DRead from Right Scale:PriceRelative Strength
Bottom Band VolumeM oving Avg (48 months)Recession (G rey Shaded Bars)
Read from Left Scale:EarningsD ividends
Charts are updated daily at www.SrcStockCharts.com.
143

BR IN KER IN TER N ATION AL IN C (EAT)
Copyright 2019 Securities Research Company
'85 '86 '87 '88 '89 '90 '91 '92 '93 '94 '95 '96 '97 '98 '99 '00 '01 '02 '03 '04 '05 '06 '07 '08 '09 '10 '11 '12 '13 '14 '15 '16 '17 '18 '19 '20
1/ 2
3/ 4
1
1 1/ 4
1 1/ 2
1 3/ 4
2
2 1/ 4
2 1/ 2
2 3/ 4
3 3 1/ 43 1/ 23 3/ 4
4 1/ 2
5
5 1/ 2
6 6 1/ 27 7 1/ 2
8 1/ 2
9 1/ 2
11
12
13 14 15
17
19
22
24
26 28 30
34
38
42
46
50
55
60 65 70 75
85
95
.03
.04
.05
.06
.07
.08
.09
.10
.20
.25
.30
.35
.40
.45
.50
.60
.70
.80
.90
1.0
1.5
2.0
2.5
3.0
3.5
4.0
4.5
5.0
5.5
6.0
20 2040 4060 6080 80
100 100M
Adj. for3 for 2
6/ 19/ 89
Adj. for3 for 23/ 19/ 91
Adj. for3 for 2
11/ 27/ 91
Adj. for3 for 25/ 14/ 93
Adj. for3 for 23/ 31/ 94
Adj. for3 for 2
1/ 17/ 01
Adj. for3 for 212/ 1/ 06
Listed N YSE7/ 28/ 89
OTC prior
Chili's priorto 5/ 9/ 91
Ind RESTR P/ E N / AN YSE Bond$500.5 M ils.Com 38.820 M ils.Book value -3.33P/ E 10.78Country U S
G rowth Performance M easurementYears Price Earn. D iv. Total Ret.Last 1 4.2 8.0 .0 8.0Last 5 -6.3 6.2 6.3 -3.4
Last 10 10.0 10.6 13.2 12.5Last 25 7.0 9.6 -- - 8.1
D Restaurant chain
LEG EN DRead from Right Scale:PriceRelative Strength
Bottom Band VolumeM oving Avg (48 months)Recession (G rey Shaded Bars)
Read from Left Scale:EarningsD ividends
Charts are updated daily at www.SrcStockCharts.com.
144

BR IN KS C O (BC O)
Copyright 2019 Securities Research Company
'85 '86 '87 '88 '89 '90 '91 '92 '93 '94 '95 '96 '97 '98 '99 '00 '01 '02 '03 '04 '05 '06 '07 '08 '09 '10 '11 '12 '13 '14 '15 '16 '17 '18 '19 '20
1
1 1/ 4
1 1/ 2
1 3/ 4
2
2 1/ 4
2 1/ 2
2 3/ 4
3 3 1/ 43 1/ 23 3/ 4
4 1/ 2
5
5 1/ 2
6
6 1/ 27 7 1/ 2
8 1/ 2
9 1/ 2
11
12
13 14 15
17
19
22
24
26 28 30
34
38
42
46
50
55
60
65 70 75
85
95
110
120
130 140 150
170
190
.06
.07
.08
.09
.10
.20
.25
.30
.35
.40
.45
.50
.60
.70
.80
.90
1.0
1.5
2.0
2.5
3.0
3.5
4.0
4.5
5.0
5.5
6.06.57.07.5
8.5
9.5
12
4 48 8
12 1216 1620 20M
(0.42)
(0.41)
(0.36)
(0.41)
0.01
(3.40)
(3.34)
(3.16)
(3.00) (0.46)
(0.05)
(0.77)
(0.83)
(0.82)
(1.01)
Pittston Co.prior to 7/ 27/ 93
D ist. 1 sh.P ittston M ineralsfor ea. 5 shs. PZB
7/ 27/ 93
Pittston Co. split into twoclasses: P ittston M inerals &
Pittston Svcs. 7/ 27/ 93
D ist. .5 sh. P ittstonBurlington G roup for ea.
sh. PZB held 1/ 30/ 96
D ata prior to1/ 23/ 96 for
Pittston ServicesG roup
Pittston Svcs.prior to 1/ 23/ 96
Pittston-Brinksprior to5/ 5/ 03
D ist. 1 sh. Brinks H ome Security for ea. sh.BCO held 10/ 31/ 08
Spun-offBrink's H ome Security H oldings Inc
11/ 3/ 08
Ind SECAS P/ E N / AN YSE Bond$126.3 M ils.Com 50.952 M ils.Book value 8.76P/ E 25.83Country U S
G rowth Performance M easurementYears Price Earn. D iv. Total Ret.Last 1 30.1 11.3 .0 30.9Last 5 33.9 18.7 8.4 34.6
Last 10 15.2 8.6 4.1 15.7Last 25 5.2 2.3 4.5 5.5
Armored car and home security services
LEG EN DRead from Right Scale:PriceRelative Strength
Bottom Band VolumeM oving Avg (48 months)Recession (G rey Shaded Bars)
Read from Left Scale:EarningsD ividends
Charts are updated daily at www.SrcStockCharts.com.
145

BR ISTOL M YER S SQU IBB C O (BM Y)
Copyright 2019 Securities Research Company
'85 '86 '87 '88 '89 '90 '91 '92 '93 '94 '95 '96 '97 '98 '99 '00 '01 '02 '03 '04 '05 '06 '07 '08 '09 '10 '11 '12 '13 '14 '15 '16 '17 '18 '19 '20
3/ 4
1
1 1/ 4
1 1/ 2
1 3/ 4
2
2 1/ 4
2 1/ 2
2 3/ 4
3
3 1/ 43 1/ 23 3/ 4
4 1/ 2
5
5 1/ 2
6
6 1/ 27 7 1/ 2
8 1/ 2
9 1/ 2
11
12 13 14 15
17
19
22
24 26 28 30
34
38
42
46
50
55
60
65 70 75
85
95
110
120 130 140
.04
.05
.06
.07
.08
.09
.10
.20
.25
.30
.35
.40
.45
.50
.60
.70
.80
.90
1.0
1.5
2.0
2.5
3.0
3.5
4.0
4.5
5.0
5.5
6.0
6.57.07.5
8.5
9.5
60 60120 120180 180240 240300 300M
Adj. for2 for 1
6/ 10/ 87
Adj. for2 for 13/ 3/ 97
Adj. for2 for 13/ 1/ 99
G enetic Systemsacq. 2/ 21/ 86
Bristol-M yersprior to 10/ 4/ 89
D rackett Co.sold 12/ 16/ 92
D ist. .1 sh. Z immer H ldgs.for ea. sh. BM Y 8/ 7/ 01
Zymogenetics, Inc.acquired 10/ 12/ 10
Inhibitex Inc.acquired 2/ 14/ 12
Amylin Pharmaceuticalsacquired 8/ 9/ 12
Ind D RU G S P/ E N / AN YSE Bond$7248.0 M ils.Com 1631.877 M ils.Book value 10.17P/ E 14.86Country U S
G rowth Performance M easurementYears Price Earn. D iv. Total Ret.Last 1 32.1 10.3 2.5 35.4Last 5 1.6 18.9 2.6 3.9
Last 10 10.4 8.0 2.8 12.6Last 25 6.0 5.5 3.3 7.6
Pharmaceuticals, medical devices, health products, toiletries
LEG EN DRead from Right Scale:PriceRelative Strength
Bottom Band VolumeM oving Avg (48 months)Recession (G rey Shaded Bars)
Read from Left Scale:EarningsD ividends
Charts are updated daily at www.SrcStockCharts.com.
146

BR ITISH AM ER IC AN TOBAC C O PLC (BTI)
Copyright 2019 Securities Research Company
'85 '86 '87 '88 '89 '90 '91 '92 '93 '94 '95 '96 '97 '98 '99 '00 '01 '02 '03 '04 '05 '06 '07 '08 '09 '10 '11 '12 '13 '14 '15 '16 '17 '18 '19 '20
1
1 1/ 4
1 1/ 2
1 3/ 4
2
2 1/ 4
2 1/ 2
2 3/ 4
3 3 1/ 43 1/ 23 3/ 4
4 1/ 2
5
5 1/ 2
6
6 1/ 27 7 1/ 2
8 1/ 2
9 1/ 2
11
12
13 14 15
17
19
22
24
26 28 30
34
38
42
46
50
55
60
65 70 75
85
95
110
120
130 140 150
170
190
.06
.07
.08
.09
.10
.20
.25
.30
.35
.40
.45
.50
.60
.70
.80
.90
1.0
1.5
2.0
2.5
3.0
3.5
4.0
4.5
5.0
5.5
6.06.57.07.5
8.5
9.5
12
60 60120 120180 180240 240300 300M
0.03
0.04
Adj. for2 for 15/ 27/ 93
Adj. for2 for 12/ 14/ 17
Each old sh. exch. for2 new AD R's to effect2 for 1 split 3/ 15/ 94
D ist. 1 sh. BritishAmerican Tobacco (N EW)
& 1 sh. Allied Zurichfor ea. 2(OLD ) shs.
BTI 9/ 8/ 98
B.A.T. Industriesprior to 9/ 9/ 98
D ividends in U S currency net afterBritish tax to U .S. residents
Ind TBACO P/ E N / AAM EX Bond$3058.9 M ils.Com 2293.747 M ils.Book value 3.87P/ E N / ACountryG reat Britian (U K)
G rowth Performance M easurementYears Price Earn. D iv. Total Ret.Last 1 28.2 .0 4.2 33.9Last 5 -4.3 2.4 2.0 .0
Last 10 3.1 4.9 7.0 7.2Last 25 7.7 7.9 10.4 10.0
AD R - Tobacco, retailing, paper, financial services
LEG EN DRead from Right Scale:PriceRelative Strength
Bottom Band VolumeM oving Avg (48 months)Recession (G rey Shaded Bars)
Read from Left Scale:EarningsD ividends
Charts are updated daily at www.SrcStockCharts.com.
147

BR OOKF IELD ASSET M G M T IN C (BAM )
Copyright 2019 Securities Research Company
'85 '86 '87 '88 '89 '90 '91 '92 '93 '94 '95 '96 '97 '98 '99 '00 '01 '02 '03 '04 '05 '06 '07 '08 '09 '10 '11 '12 '13 '14 '15 '16 '17 '18 '19 '20
3/ 4
1
1 1/ 4
1 1/ 2
1 3/ 4
2
2 1/ 4
2 1/ 2
2 3/ 4
3 3 1/ 43 1/ 23 3/ 4
4 1/ 2
5
5 1/ 2
6 6 1/ 27 7 1/ 2
8 1/ 2
9 1/ 2
11
12 13 14 15
17
19
22
24
26 28 30
34
38
42
46
50
55
60 65 70 75
85
95
110
120 130
.04
.05
.06
.07
.08
.09
.10
.20
.25
.30
.35
.40
.45
.50
.60
.70
.80
.90
1.0
1.5
2.0
2.5
3.0
3.5
4.0
4.5
5.0
5.5
6.06.57.07.5
8.5
20 2040 4060 6080 80
100 100M
Adj. for2 for 14/ 14/ 86
Adj. for3 for 28/ 11/ 97
Adj. for3 for 26/ 2/ 04
Adj. for3 for 2
4/ 28/ 06
Adj. for3 for 26/ 4/ 07
Adj. for3 for 25/ 13/ 15
Brascan Ltd. prior to 8/ 11/ 97
EdperBrascan Corp.prior to 5/ 1/ 00
BrascanCorporation
prior to11/ 10/ 2005
Longview F ibreacquired 4/ 20/ 07
D ist. 1 unit of Brookfield Infrostructure P tr.
for ea. 37.5 shs. BAM held 1/ 31/ 08
D ividends in U S currency before Canadian tax
to U .S. residents
D ist. 0.0861 BPY units for each Brookfield share held
3/ 26/ 13
Ind REM D V P/ E N / AN YSE Bond$1204.0 M ils.Com 992.645 M ils.Book value 23.72P/ E 29.53Country Canada
G rowth Performance M easurementYears Price Earn. D iv. Total Ret.Last 1 35.6 -3.5 -19.7 37.4Last 5 11.4 -5.4 8.4 12.5
Last 10 15.9 15.4 6.3 16.8Last 25 12.8 10.9 6.4 13.4
E An asset management company, real estate and power generation
LEG EN DRead from Right Scale:PriceRelative Strength
Bottom Band VolumeM oving Avg (48 months)Recession (G rey Shaded Bars)
Read from Left Scale:EarningsD ividends
Charts are updated daily at www.SrcStockCharts.com.
148

BR OWN & BR OWN IN C (BR O)
Copyright 2019 Securities Research Company
'85 '86 '87 '88 '89 '90 '91 '92 '93 '94 '95 '96 '97 '98 '99 '00 '01 '02 '03 '04 '05 '06 '07 '08 '09 '10 '11 '12 '13 '14 '15 '16 '17 '18 '19 '20
1/ 4
1/ 2
3/ 4
1
1 1/ 4
1 1/ 2
1 3/ 4
2
2 1/ 4
2 1/ 22 3/ 43
3 1/ 2
4
4 1/ 2
5 5 1/ 26
7
8
9
10 11 12
14
16
18
20 22 24
28
32
36
40 44 48
.005
.01
.02
.03
.04
.05
.06
.07
.08
.09
.10
.20
.25
.30
.35
.40
.45
.50
.60
.70
.80
.90
1.0
1.5
2.0
2.5
3.0
3.5
20 2040 4060 6080 80
100 100M
Adj. for3 for 2
5/ 12/ 86
Adj. for5 for 45/ 30/ 91
Adj. for3 for 23/ 2/ 98
Adj. for2 for 18/ 24/ 00
Adj. for2 for 1
11/ 23/ 01
Adj. for2 for 1
11/ 29/ 05
Adj. for2 for 13/ 29/ 18
Poe & Associates Inc. prior to 4/ 28/ 93
Poe & Brown Inc.prior to 4/ 28/ 99
Ind IN SBR P/ E N / AN YSE Bond$226.3 M ils.Com 279.274 M ils.Book value 8.57P/ E 29.28Country U S
G rowth Performance M easurementYears Price Earn. D iv. Total Ret.Last 1 48.7 12.2 6.3 49.9Last 5 21.2 11.9 9.1 22.1
Last 10 16.5 9.7 8.2 17.1Last 25 16.7 13.5 12.0 17.0
Insurance brokerage/ agency for property-casualty insurance 80% SC ALE
LEG EN DRead from Right Scale:PriceRelative Strength
Bottom Band VolumeM oving Avg (48 months)Recession (G rey Shaded Bars)
Read from Left Scale:EarningsD ividends
Charts are updated daily at www.SrcStockCharts.com.
149

BR OWN F OR M AN C OR P (BF B)
Copyright 2019 Securities Research Company
'85 '86 '87 '88 '89 '90 '91 '92 '93 '94 '95 '96 '97 '98 '99 '00 '01 '02 '03 '04 '05 '06 '07 '08 '09 '10 '11 '12 '13 '14 '15 '16 '17 '18 '19 '20
1/ 2
3/ 4
1
1 1/ 4
1 1/ 2
1 3/ 4
2
2 1/ 4
2 1/ 2
2 3/ 4
3
3 1/ 43 1/ 23 3/ 4
4 1/ 2
5
5 1/ 2
6
6 1/ 27 7 1/ 2
8 1/ 2
9 1/ 2
11
12 13 14 15
17
19
22
24 26 28 30
34
38
42
46
50
55
60
65 70 75
85
95
.03
.04
.05
.06
.07
.08
.09
.10
.20
.25
.30
.35
.40
.45
.50
.60
.70
.80
.90
1.0
1.5
2.0
2.5
3.0
3.5
4.0
4.5
5.0
5.5
6.06.57.0
8 816 1624 2432 3240 40M
.02
0.02
0.02
0.02
0.02
0.02
0.02
Adj. for3 for 24/ 2/ 87
Adj. for3 for 1
5/ 31/ 94
Adj. for2 for 11/ 21/ 04
Adj. for5 for 4
10/ 28/ 08
Adj. for3 for 28/ 13/ 12
Adj. for2 for 18/ 19/ 16
Adj. for5 for 43/ 1/ 18
ListedN YSE 5/ 9/ 91
ASE priorSpecial$0.355
Special$0.267
Special$1.60
Special$1.00
Ind D STLR P/ E N / AN YSE Bond$351.0 M ils.Com 312.104 M ils.Book value 3.88P/ E 37.80Country U S
G rowth Performance M easurementYears Price Earn. D iv. Total Ret.Last 1 42.4 11.9 5.1 43.8Last 5 13.6 7.4 5.7 14.5
Last 10 17.3 7.7 8.0 18.1Last 25 12.9 9.5 7.8 13.4
D istilled spirits, china, personal products
LEG EN DRead from Right Scale:PriceRelative Strength
Bottom Band VolumeM oving Avg (48 months)Recession (G rey Shaded Bars)
Read from Left Scale:EarningsD ividends
Charts are updated daily at www.SrcStockCharts.com.
150

BR T R EALTY TR U ST (BR T)
Copyright 2019 Securities Research Company
'85 '86 '87 '88 '89 '90 '91 '92 '93 '94 '95 '96 '97 '98 '99 '00 '01 '02 '03 '04 '05 '06 '07 '08 '09 '10 '11 '12 '13 '14 '15 '16 '17 '18 '19 '20
1/ 2
3/ 4
1
1 1/ 4
1 1/ 2
1 3/ 4
2
2 1/ 4
2 1/ 2
2 3/ 4
3
3 1/ 43 1/ 23 3/ 4
4 1/ 2
5
5 1/ 2
6
6 1/ 27 7 1/ 2
8 1/ 2
9 1/ 2
11
12
13 14 15
17
19
22
24 26 28 30
34
38
42
46
50
55
60
65 70 75
85
95
.03
.04
.05
.06
.07
.08
.09
.10
.20
.25
.30
.35
.40
.45
.50
.60
.70
.80
.90
1.0
1.5
2.0
2.5
3.0
3.5
4.0
4.5
5.0
5.5
6.06.5
600 6001200 12001800 18002400 24003000 3000T
(2.91)
(3.53)
(4.02)
(4.43)
(1.42)
(1.66)
(1.85)
(1.91)
(1.05)
(0.78)
(0.50)
(0.56)
(0.56)
(0.43)
(0.11)
(0.01) (0.29)
(0.87)
(1.12)
(1.84)
(1.33)
(1.73)
(2.07)
(1.02)
(1.24)
(0.81)
(0.53)
(0.45)
0.02 (0.29)
Adj. for1 for 3
8/ 21/ 86
D ist. 1 sh of BRT Realty Tr for ea Ben Int sh of G ould Investors Tr held.
Reorganized as G ould Invstment LP
prior to 1986D ividend omitted
1990 - 2000
Special$0.71
Special$1.15
D ividendOmitted03/ 23/ 10
Ind LREIT P/ E N / AN YSE Bond $1.2 M ils.Com 15.675 M ils.Book value 11.43P/ E N / ACountry U S
G rowth Performance M easurementYears Price Earn. D iv. Total Ret.Last 1 34.0 -- - 10.0 40.3Last 5 19.8 -- - -18.7 22.1
Last 10 14.7 17.8 -9.8 15.8Last 25 6.5 -- - 1.3 9.2
E Originates and holds senior mortgage loans
LEG EN DRead from Right Scale:PriceRelative Strength
Bottom Band VolumeM oving Avg (48 months)Recession (G rey Shaded Bars)
Read from Left Scale:EarningsD ividends
Charts are updated daily at www.SrcStockCharts.com.
151

BR U N SWIC K C OR P (BC )
Copyright 2019 Securities Research Company
'85 '86 '87 '88 '89 '90 '91 '92 '93 '94 '95 '96 '97 '98 '99 '00 '01 '02 '03 '04 '05 '06 '07 '08 '09 '10 '11 '12 '13 '14 '15 '16 '17 '18 '19 '20
3/ 4
1
1 1/ 4
1 1/ 2
1 3/ 4
2
2 1/ 4
2 1/ 2
2 3/ 4
3 3 1/ 43 1/ 23 3/ 4
4 1/ 2
5
5 1/ 2
6 6 1/ 27 7 1/ 2
8 1/ 2
9 1/ 2
11
12 13 14 15
17
19
22
24
26 28 30
34
38
42
46
50
55
60 65 70 75
85
95
110
120 130
.04
.05
.06
.07
.08
.09
.10
.20
.25
.30
.35
.40
.45
.50
.60
.70
.80
.90
1.0
1.5
2.0
2.5
3.0
3.5
4.0
4.5
5.0
5.5
6.06.57.07.5
8.5
10 1020 2030 3040 4050 50M
(0.49)
(0.74)
(0.76)
(0.77) (0.29)
(0.25)
(0.03)
(0.02)
(1.46)
(3.44)
(4.32)
(5.76)
(4.62)
(2.69)
(1.42)
(0.54)
(0.10)
Adj. for2 for 1
2/ 18/ 86
Adj. for2 for 16/ 9/ 87
Adj. for10% SD3/ 19/ 02
Ind LEISP P/ E N / AN YSE Bond$725.7 M ils.Com 86.723 M ils.Book value 16.12P/ E 12.57Country U S
G rowth Performance M easurementYears Price Earn. D iv. Total Ret.Last 1 12.9 -5.2 14.3 14.6Last 5 .9 12.5 13.9 2.1
Last 10 18.1 -- - 34.4 19.0Last 25 4.7 5.4 3.6 5.5
D M arine and recreational equipment, industrial products
LEG EN DRead from Right Scale:PriceRelative Strength
Bottom Band VolumeM oving Avg (48 months)Recession (G rey Shaded Bars)
Read from Left Scale:EarningsD ividends
Charts are updated daily at www.SrcStockCharts.com.
152

BR YN M AWR BK C OR P (BM TC )
Copyright 2019 Securities Research Company
'85 '86 '87 '88 '89 '90 '91 '92 '93 '94 '95 '96 '97 '98 '99 '00 '01 '02 '03 '04 '05 '06 '07 '08 '09 '10 '11 '12 '13 '14 '15 '16 '17 '18 '19 '20
1/ 2
3/ 4
1
1 1/ 4
1 1/ 2
1 3/ 4
2
2 1/ 4
2 1/ 2
2 3/ 4
3 3 1/ 43 1/ 23 3/ 4
4 1/ 2
5
5 1/ 2
6 6 1/ 27 7 1/ 2
8 1/ 2
9 1/ 2
11
12
13 14 15
17
19
22
24
26 28 30
34
38
42
46
50
55
60 65 70 75
.03
.04
.05
.06
.07
.08
.09
.10
.20
.25
.30
.35
.40
.45
.50
.60
.70
.80
.90
1.0
1.5
2.0
2.5
3.0
3.5
4.0
4.5
5.0
600 6001200 12001800 18002400 24003000 3000T
(0.63)
Adj. for2 for 11/ 2/ 96
Adj. for2 for 19/ 2/ 98
Adj. for2 for 110/ 2/ 03
Ind RBAN K P/ E N / AN asdaq Bond $.0 M ils.Com 20.245 M ils.Book value 22.84P/ E 13.61Country U S
G rowth Performance M easurementYears Price Earn. D iv. Total Ret.Last 1 8.9 -10.8 4.0 11.7Last 5 6.7 6.9 6.5 8.9
Last 10 9.7 9.5 6.4 11.6Last 25 9.7 7.7 9.8 10.9
Banking services in Pennsylvania
LEG EN DRead from Right Scale:PriceRelative Strength
Bottom Band VolumeM oving Avg (48 months)Recession (G rey Shaded Bars)
Read from Left Scale:EarningsD ividends
Charts are updated daily at www.SrcStockCharts.com.
153

BT G R OU P P LC (BT)
Copyright 2019 Securities Research Company
'85 '86 '87 '88 '89 '90 '91 '92 '93 '94 '95 '96 '97 '98 '99 '00 '01 '02 '03 '04 '05 '06 '07 '08 '09 '10 '11 '12 '13 '14 '15 '16 '17 '18 '19 '20
1 1/ 4
1 1/ 2
1 3/ 4
2
2 1/ 4
2 1/ 2
2 3/ 4
3 3 1/ 43 1/ 23 3/ 4
4 1/ 2
5
5 1/ 2
6 6 1/ 27 7 1/ 2
8 1/ 2
9 1/ 2
11
12 13 14 15
17
19
22
24 26 28 30
34
38
42
46
50
55
60 65 70 75
85
95
110
120 130 140 150
170
190
220
240 260
.08
.09
.10
.20
.25
.30
.35
.40
.45
.50
.60
.70
.80
.90
1.0
1.5
2.0
2.5
3.0
3.5
4.0
4.5
5.0
5.5
6.0
6.57.07.5
8.5
9.5
12
14
16
10 1020 2030 3040 4050 50M
Adj. for2 for 1
12/ 8/ 15
British Telecom.prior to 11/ 19/ 01
D ividends net after British taxto U .S. residents
D IVID EN D SEQU EN CE IS SEM I-AN N U AL
Ind PH ON E P/ E N / AN YSE Bond$8531.0 M ils.Com 992.190 M ils.Book value 14.97P/ E N / ACountryG reat Britian (U K)
G rowth Performance M easurementYears Price Earn. D iv. Total Ret.Last 1 -42.4 .0 -31.1 -19.8Last 5 -20.8 -5.6 -5.0 -12.5
Last 10 - .3 2.8 3.9 6.0Last 25 -4.3 .1 -2.7 .9
AD R - Local, and international telecommunications services
LEG EN DRead from Right Scale:PriceRelative Strength
Bottom Band VolumeM oving Avg (48 months)Recession (G rey Shaded Bars)
Read from Left Scale:EarningsD ividends
Charts are updated daily at www.SrcStockCharts.com.
154

BU C KLE IN C (BKE)
Copyright 2019 Securities Research Company
'85 '86 '87 '88 '89 '90 '91 '92 '93 '94 '95 '96 '97 '98 '99 '00 '01 '02 '03 '04 '05 '06 '07 '08 '09 '10 '11 '12 '13 '14 '15 '16 '17 '18 '19 '20
1/ 2
3/ 4
1
1 1/ 4
1 1/ 2
1 3/ 4
2
2 1/ 4
2 1/ 2
2 3/ 4
3 3 1/ 43 1/ 23 3/ 4
4 1/ 2
5
5 1/ 2
6
6 1/ 27 7 1/ 2
8 1/ 2
9 1/ 2
11
12
13 14 15
17
19
22
24 26 28 30
34
38
42
46
50
55
60
65 70 75
85
.03
.04
.05
.06
.07
.08
.09
.10
.20
.25
.30
.35
.40
.45
.50
.60
.70
.80
.90
1.0
1.5
2.0
2.5
3.0
3.5
4.0
4.5
5.0
5.5
8 816 1624 2432 3240 40M
Adj. for2 for 1
4/ 25/ 97
Adj. for3 for 27/ 9/ 98
Adj. for3 for 21/ 16/ 07
Adj. for3 for 2
10/ 31/ 08
Special$3.00
Special$2.00
Special$1.80
Special$2.50
Special$2,25
Special$4.50
Special$1.20
Special$2.77
Special$1.00
Special$0.75
Special$1.75
Special$1.00
Special$1.25
1/ 24/ 20
Ind RTAPP P/ E N / AN YSE Bond $.0 M ils.Com 49.018 M ils.Book value 9.88P/ E 12.87Country U S
G rowth Performance M easurementYears Price Earn. D iv. Total Ret.Last 1 49.6 1.5 .0 55.4Last 5 -12.5 -9.7 2.6 -9.2
Last 10 -1.5 -2.6 2.3 1.6Last 25 10.6 10.8 -- - 12.3
Retailer of casual apparel, footwear and accessories
LEG EN DRead from Right Scale:PriceRelative Strength
Bottom Band VolumeM oving Avg (48 months)Recession (G rey Shaded Bars)
Read from Left Scale:EarningsD ividends
Charts are updated daily at www.SrcStockCharts.com.
155