the 2012 unc system- wide e-journal survey patrick carr, robert wolf, and virginia bacon a...
TRANSCRIPT

The 2012 UNC System-Wide E-Journal Survey
Patrick Carr, Robert Wolf,and Virginia Bacon
A discussion of processes, data, and outcomes

• Introduction• UNC system-wide e-journal survey:
BackgroundData collectionFindings and recommendations of the UNC reportData analysis
• UNC e-journal working group• Conclusion
Outline

COUNTER • Sets a standard for e-resource use data
collection and reporting• Clear definitions of use measurements• Allows cross-platform comparisons• Imperfect but powerful

The importance of using this data to measure and evaluate use is growing.

Cost-per-use • An e-resource’s annual subscription cost
divided by the use of the resource over the term of the subscription period
• A powerful tool for assessing return on investment
• Must be contextualized with qualitative data

What might we discover if we compare e-resource
use data across institutions?

UNC system-wide survey

Appalachian State UniversityEast Carolina UniversityElizabeth City State UniversityFayetteville State UniversityNC Agricultural and Technical State UniversityNorth Carolina Central UniversityNC State University
UNC AshevilleUNC Chapel HillUNC CharlotteUNC GreensboroUNC PembrokeUNC WilmingtonWestern Carolina UniversityWinston-Salem State University
UNC system schools

Table 1

Publishers
Cambridge University PressElsevierInforma HealthcareKargerLippincott, Williams, & WilkinsMary Ann LiebertNature Publishing GroupOxford University PressSAGESpringerTaylor & FrancisWiley-BlackwellWorld Scientific

Table 2

Table 3

If the libraries are performing well, increases in expenditures should result
in increases in access.

Metrics for access • Increases to the numbers of titles and
uses• Growth in cost-per-title (CPT) and cost-
per-use (CPU) that is lower than growth in expenditure (as well as decreases in CPT and CPU)
• Increases in the number of highly used titles (HUTs)

Overall findingsFrom 2009-2011, there was a:• 17% increase in e-journal expenditures• 10% increase in titles• 6% increase in CPT• 18% increase in use• 1% decrease in CPU• 25-33% increase in HUTs

UNC System expenditures (+5%)
E-Journal price increases (+9%)

How do we maintain our lead?

1: Develop an online repository in which UNC libraries can share expenditure and access data

2: Procure purchases of common library products using SciQuest

3: Develop a standard template and checklist for e-journal licensing

4: Evaluate and pursue strategies to promote the publication of the results of UNC research in Open Access venues

5: Develop a system-wide plan to contain expenditures and expand access

System-wide plan • Give special attention to four “high-risk”
publishers: Elsevier, Wiley-Blackwell, Taylor & Francis, and Oxford University Press
• Reduce annual growth in expenditures to the point that it parallels growth in use
• Lower annual growth in CPU and CPT to the point that it is less than annual growth in expenditures
• Reduce annual changes in CPU or CPT

Imperfections • Emphasis on number of accessible titles
and CPT

Cost-per-title$0
$100
$200
$300
$400
$500
$600
$700
NC StateFSU
Cambridge University Press CPT
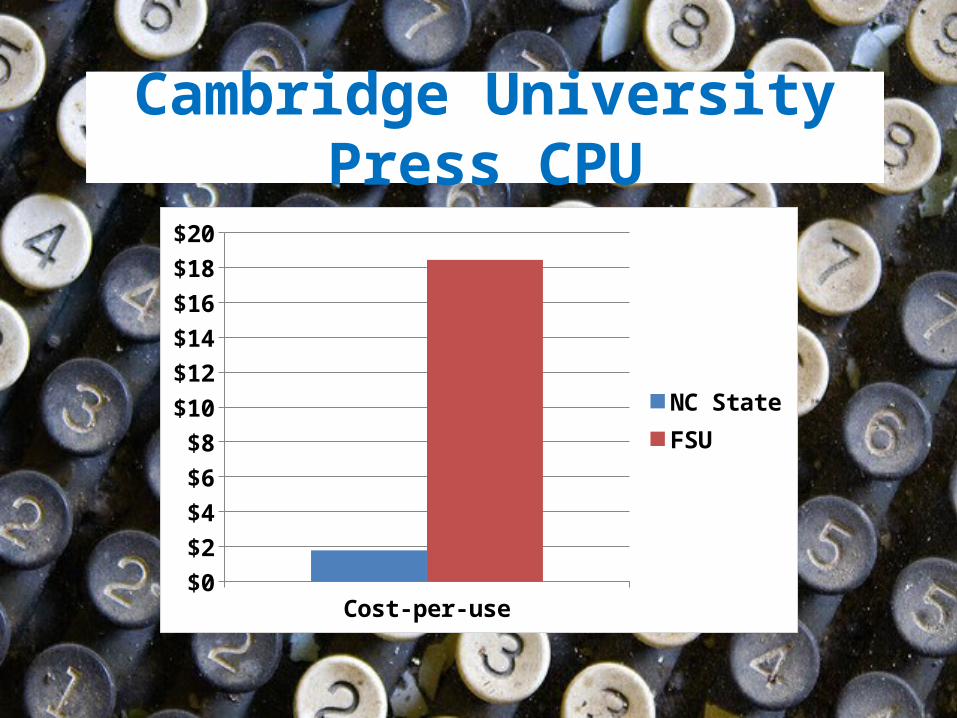
Cost-per-use$0$2$4$6$8
$10$12$14$16$18$20
NC StateFSU
Cambridge University Press CPU
Imperfections • Emphasis on number of accessible titles
and CPT• Emphasis on number of accessible titles
and CPT• Inconsistent data collection methods
among system schools

Goodenough.

5: Develop a system-wide plan to contain expenditures and expand access

Are these
publishers really “high-risk”?
Context is
everything.
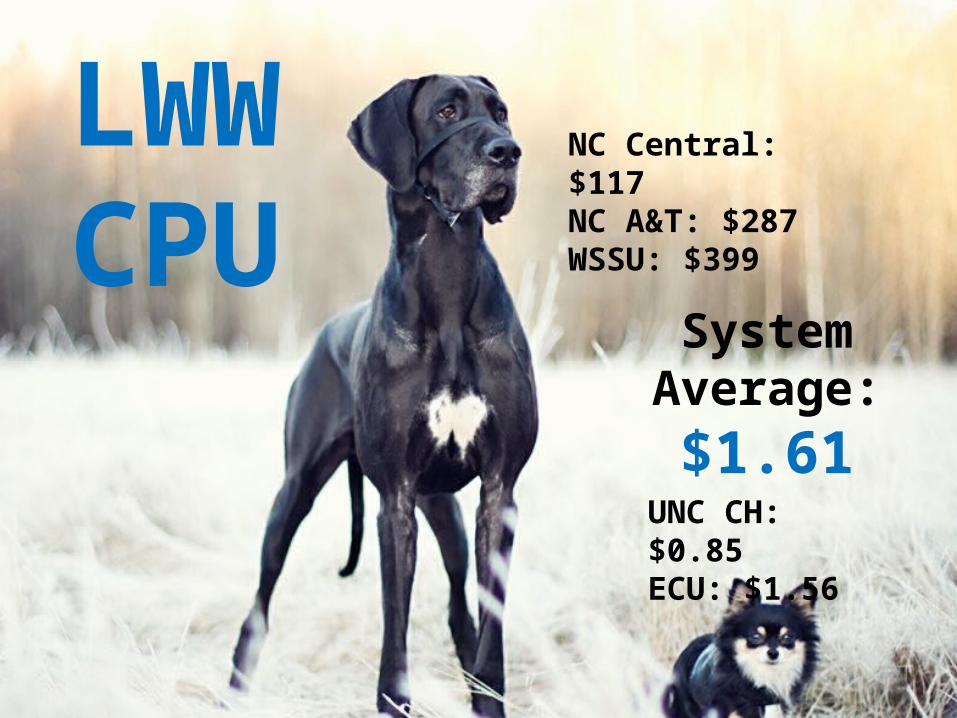
LWW CPU
System Average: $1.61
UNC CH: $0.85ECU: $1.56
NC Central: $117NC A&T: $287WSSU: $399
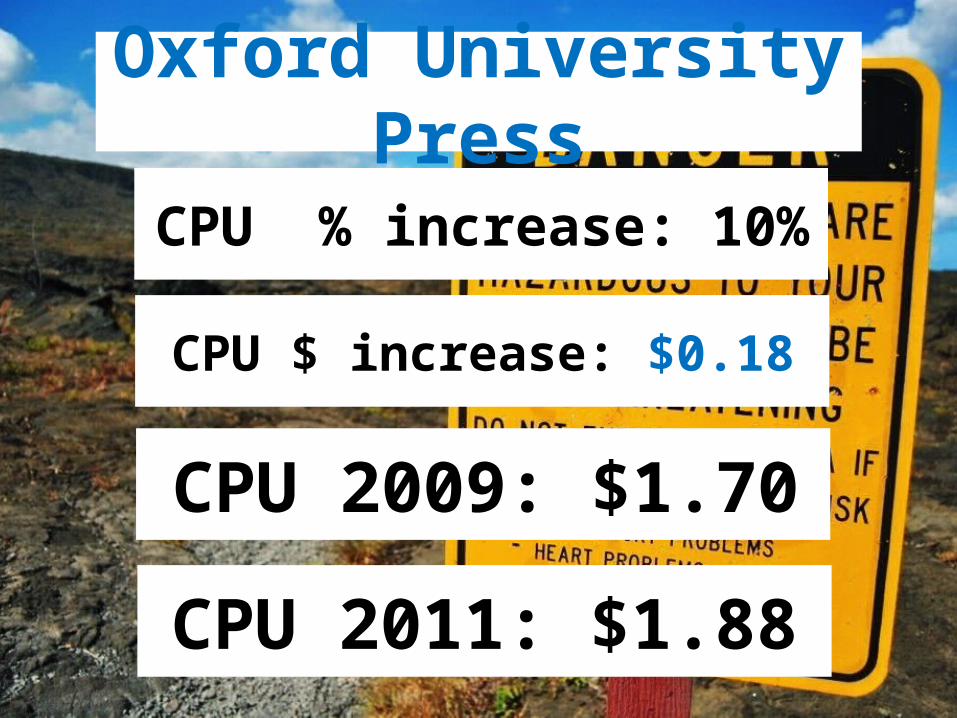
Oxford University Press
CPU 2011: $1.88
CPU 2009: $1.70
CPU % increase: 10%
CPU $ increase: $0.18

• System CPU: $13.31• CPU lower for big deal
subscriptions, higher for individual subscriptions
• Individual subscriptions may offer more flexibility than big deals
Taylor & Francis

Lower CPU does not always equal
a better deal.

The larger the
school, the lower the CPU.
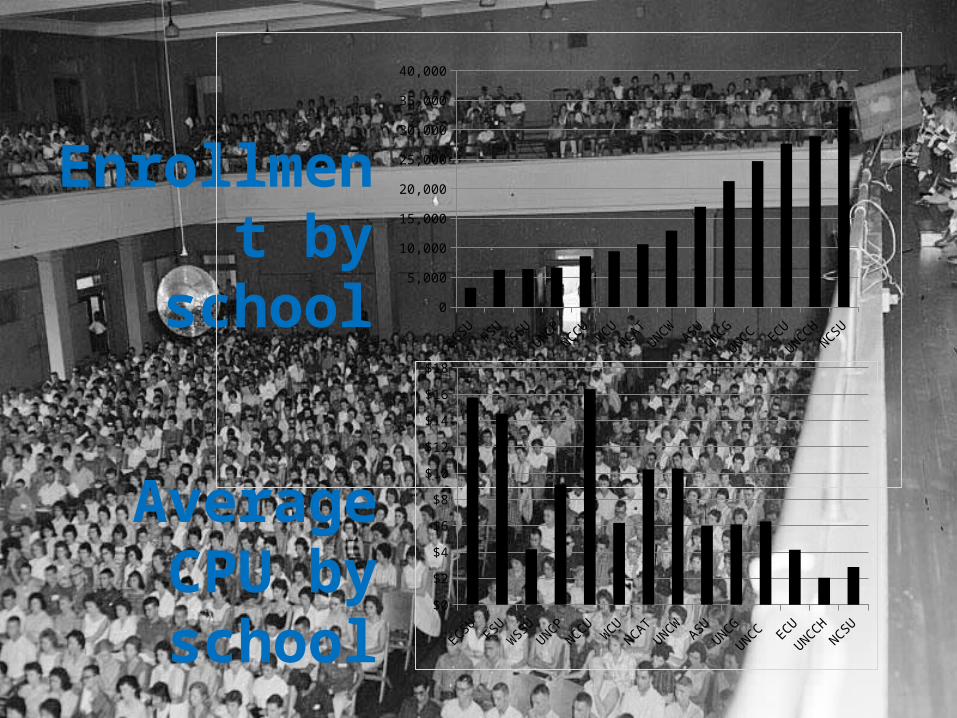
Enrollment by school
Average CPU by school
ECSU FS
UW
SSU
UNCPNCCU
WCU
NCAT
UNCW ASUUNCG
UNCC EC
U
UNCCHNCSU
0
5,000
10,000
15,000
20,000
25,000
30,000
35,000
40,000
ECSU FS
UW
SSU
UNCPNCCU
WCU
NCAT
UNCW ASUUNCG
UNCC EC
U
UNCCHNCSU
$0
$2
$4
$6
$8
$10
$12
$14
$16
$18

Are publishers’ pricing models fair?

Enrollment by school
Downloads per enrolled
student
ECSU FS
UW
SSU
UNCPNCCU
WCU
NCAT
UNCW ASUUNCG
UNCC EC
U
UNCCHNCSU
0
5,000
10,000
15,000
20,000
25,000
30,000
35,000
40,000
ECSU FS
UW
SSU
UNCPNCCU
WCU
NCAT
UNCW ASUUNCG
UNCC EC
U
UNCCHNCSU
0
10
20
30
40
50
60
70
80
90
100

SchoolCarnegie Classification
2011-2012 Full-text downloads
Student Enrollment Fall
2011 DPES
North Carolina Central University Master's 18,776 7,587 2.47UNC Pembroke Master's 18,233 5,477 3.33Elizabeth City State University Baccalaureate 12,686 2,772 4.58Fayetteville State University Master's 31,133 5,199 5.99
Winston-Salem State University Master's 35,414 5,765 6.14UNC Wilmington Master's 105,980 12,321 8.60Western Carolina University Master's 72,650 8,343 8.71Appalachian State University Master's 145,872 16,654 8.76UNC Charlotte Research 223,258 22,630 9.87NC A&T State University Research 110,023 10,063 10.93UNC Greensboro Research 214,738 16,855 12.74East Carolina University Research 484,984 24,588 19.72NC State University Research 1,248,504 30,950 40.34UNC - Chapel Hill Research 2,350,522 26,837 87.59
Schools by Carnegie Classification

Enrollment by school
Downloads per enrolled student
Average CPU by school
ECSU FS
UW
SSU
UNCPNCCU
WCU
NCAT
UNCW ASUUNCG
UNCC EC
U
UNCCHNCSU
0
5,000
10,000
15,000
20,000
25,000
30,000
35,000
40,000
ECSU FS
UW
SSU
UNCPNCCU
WCU
NCAT
UNCW ASUUNCG
UNCC EC
U
UNCCHNCSU
$0$2$4$6$8
$10$12$14$16$18
ECSU FS
UW
SSU
UNCPNCCU
WCU
NCAT
UNCW ASUUNCG
UNCC EC
U
UNCCHNCSU
0102030405060708090
100

UNC Libraries’ response
• Establish a working group to act on recommendations
• 5 year expenditure plan• 4% reduction by year 3• 8% reduction by year 5

A tip of the hat.

Our Final Recommendations

1: Carry out cross-institutional CPU analyses of e-journal collections to contextualize and maximize ROI

2: Develop consistent calculation guidelines and centralized data collection

3: Avoid and/or sidestep confidentiality clauses in licenses

4: Strive to improve ROI by working to enhance the discoverability of e-journal collections

5: Use cross-institutional analyses to make institution-level assessments rather than system-level assessments

6: Lobby publishers to develop pricing models that factor in research intensiveness as well as enrollment

Questions?Patrick Carr Robert Wolf Virginia [email protected] [email protected] [email protected]