the 2013 international visitors’ exit … _visitors...a the 2013 international visitors’ exit...
TRANSCRIPT

a
THE 2013 INTERNATIONALVISITORS’ EXIT SURVEY REPORT
THE TANZANIA TOURISMSECTOR SURVEY
Ministry of Natural Resources and Tourism (MNRT)www.mnrt.go.tz
Bank of Tanzania (BOT)www.bot.go.tz
Zanzibar Commission for Tourism (ZCT)www.zanzibartourism.net
National Bureau of Statistics (NBS)www.nbs.go.tz
Immigration Departmentwww.immigration.go.tz

b

c
TANZANIA TOURISM SECTOR SURVEY
THE 2013 INTERNATIONAL VISITORS’ EXIT SURVEY REPORT
MARCH 2015

d

i
TAbLE Of CONTENTSLIST OF TABLES . ...................................................................................... iiiLIST OF CHARTS ..................................................................................... ivACRONYMS ...................................................................................... vFOREWORD ....................................................................................... viACKNOWLEDGEMENT ........................................................................ viiEXECUTIVE SUMMARY ........................................................................ viii
Chapter 1: Recent Developments in the Tourism Industry ............. 11.1 Global Perspective ..................................................................... 11.2 Tourism Developments in East Africa ................................... 61.3 Tourism Developments in Tanzania ....................................... 7 1.3.1 International Tourist Arrivals .................................. 7 1.3.2 Promotion and Marketing ................................ ........ 9 1.3.2.1 Tourism Marketing Strategy .................................... 9 1.3.2.2 Tourism Trade Fair and Exhibitions ....................... 9 1.3.2.3 Cultural Tourism Programmes ............................... 10 1.3.2.4 Tanzania Voted the Best Safari Destination .......... 12 1.3.3 Meetings and Conferences ...................................... 13 1.3.4 The Fight Against Poaching ..................................... 13 1.3.5 Tourism Development Levy .................................... 14 1.3.6 Domestic and International Flights ........................ 14
Chapter 2: Analysis of the Survey’s Results ....................................... 152.1 Introduction ................................................................................ 152.2 Source Markets ........................................................................... 152.3 Age Group ................................................................................... 182.4 Gender .................................................................. ..................... 182.5 Purpose of Visit ......................................................................... 192.6 Travel Arrangement .................................................................. 212.7 First-Time and Repeat Visits .................................................... 242.8 Source of Information ............................................................... 262.9 Travel Party ................................................................................. 272.10 Departure Points ....................................................................... 282.11 Length of Stay ............................................................................. 31

ii
2.12 Mode of Payment ................................................................ 342.13 Tourism Activities ............................................................... 342.14 Average Expenditure ......................................................... 372.15 Cost of Touring Tanzania ................................................... 372.16 Tourism Earnings ................................................................ 382.17 Visitors’ Perception About Tanzania ................................ 392.18 Areas that Need Improvement ........................................... 40
Chapter 3: Conclusion and Policy Recommendations ............... 413.1 Conclusion ............................................................................ 413.2 Policy Recommendations .................................................... 41
Appendices ....................................................................................... 43Appendix A: The Survey’s Methodology ....................................... 44I. Introduction ......................................................................... 44II. Objective of the Survey ...................................................... 44III. Scope of the Survey ............................................................... 44IV. Sample Size .......................................................................... 44V. Fieldwork ............................................................................. 45VI. Survey’s Coverage ............................................................... 45VII. The Enumerators’ Manual ................................................. 45VIII. Training of the Enumerators .............................................. 45IX. The Questionnaire .............................................................. 46X. Data Processing ................................................................... 47XI. Tourist Expenditure Estimation ....................................... 47
Appendix b: Questionnaire .......................................................... 50Appendix C: Statistical Tables ........................................................ 55References ........................................................................................... 62

iii
LIST Of TAbLESTable 1.1: International Tourist Arrivals by Regions, 2006-2013 .................... 2Table 1.2: International Tourist Arrivals: Actual Growth and Projection ..... 3Table 1.3: International Tourism Receipts by Regions, 2006-2013 ................ 5Table 1.4: The Top 10 Ranking of Destinations by Receipts .......................... 6Table 1.5: International Tourist Arrivals to Tanzania by Regions, 2011-2013 8Table 1.6: International Tourist Arrivals to Tanzania from BRICS, 2012-2013 9Table 2.1: Percentage Distribution of Top 15 Source Markets by Purpose of Visit .. 20Table 2.2: Purpose of Visit by Regions, 2013 .................................................... 21Table 2.3: Proportion of Visitors by Travel Arrangement ............................... 21Table 2.4: Proportion of Visitors by Source Markets by Travel Arrangement 22Table 2.5: Distribution of Visitors by Travel Arrangement and Purpose of Visit 23Table 2.6: Distribution of Visitors under the Non-package by Purpose of Visit 23Table 2.7: Distribution of Visitors under Package by Purpose of Visit .......... 24Table 2.8: First-Time and Repeat Visit, 2013 ..................................................... 25Table 2.9: First-Time Visitors by Purpose of Visit ............................................. 26Table 2.10: Travel Party by Age Group ............................................................... 28Table 2.11: Distribution of Visitors by Departure Points .................................. 28Table 2.12: Average Length of Stay of Visitors to the United Republic of Tanzania 31Table 2.13: Average Length of Stay of Visitors to Zanzibar ........................... 33Table 2.14: Primary Tourism Activities by Country of Residence, 2013 .... 35Table 2.15: Cost of Touring Tanzania ................................................................ 38

iv
LIST Of CHARTSChart 1.1: International Tourist Arrivals, 2000-2013 ............................... 1Chart 1.2 Market Share of International Tourist Arrivals, 2013 ........... 3Chart 1.3: International Tourism Receipts, 2001-2013 .............................. 4Chart 1.4: Market Share of International Tourism Receipts, 2012-2013 .... 5Chart 1.5: International Tourist Arrivals to Tanzania, Top 15 Source Markets, 2013 8Chart 2.1: International Tourist Arrivals to Tanzania, 2009–2013 ....... 16Chart 2.2: Top 15 Source Markets for the United Republic of Tanzania 17Chart 2.3: Top 15 Source Markets for Tanzania Mainland .................. 18Chart 2.4: Top 15 Source Markets for Zanzibar ..................................... 18Chart 2.5: Visitors by Age Group ............................................................. 19Chart 2.6: Purpose of Visit ........................................................................ 20Chart 2.7: First-Time and Repeat Visitors by Source Markets ............ 26Chart 2.8: Source of Information about Destination Tanzania ............ 28Chart 2.9: Visitors by Travel Party, 2013 ................................................. 28Chart 2.10: Distribution of Visitors by Departure Points ...................... 30Chart 2.11: Distribution of Visitors by Purpose and Departure Points 31Chart 2.12: Proportion of Visitors by Night Spent in the URT, 2013 ..... 33Chart 2.13: Length of Stay by Purposes of Visit ...................................... 34Chart 2.14: Payment Mode ........................................................................ 35Chart 2.15: Tourism Earnings and International Tourist Arrivals to Tanzania 40Chart 2.16: What Impressed Visitors ....................................................... 40Chart 2.17: Areas that Need Improvement ............................................. 41

v
ACRONYMSAAKIA Abeid Amani Karume International AirportBOT Bank of TanzaniaBRICS Brazil, Russia, India, China and South AfricaDCC Dar es Salaam City CouncilHAT Hotel Association of TanzaniaJNIA Julius Nyerere International Airport KAS KasumuloKIA Kilimanjaro International Airport LGAs Local Government AuthoritiesMANY ManyovuMFAIC MinistryofForeignAffairsandInternationalCooperationMNRT Ministry of Natural Resources and TourismMoT Ministry of TransportMoW Ministry of WorksMTU MtukulaNAM Namanga NBS National Bureau of StatisticsTAA Tanzania Airport AuthorityTANAPA Tanzania National Parks AuthorityTCT Tourism Confederation of TanzaniaTIC Tanzania Investment Centre TTB Tanzania Tourist BoardTUN TundumaUNWTO United Nations World Tourism Organization URT United Republic of Tanzania VFR Visiting Friends and RelativesZATI Zanzibar Association of Tourism InvestorsZCT Zanzibar Commission for Tourism

vi
fOREwORD
Tourism, which accounts for about 24.0 percent of Tanzania’s exports of goods and services, has recorded an improved performance in recent years. This is evidenced by the increase in the number of international tourist arrivals by 1.7 percent to 1,095,885 in 2013 from 1,077,058 recorded in 2012. This performance is largely attributed to the ongoing macroeconomicreformsandenhancedpromotionalefforts.Asaresult,tourism earnings increased by 8.2 percent to USD 1,853.28 million in 2013 from USD 1,712.7 million recorded in 2012.
In view of the foregoing, we are glad to introduce the 2013 Tanzania Tourism Sector Survey (TTSS) Report produced by the multi-institutional committee comprising the Ministry of Natural Resources and Tourism (MNRT), Bank of Tanzania (BOT), National Bureau of Statistics (NBS), Immigration Department and the Zanzibar Commission for Tourism (ZCT).
The 2013 survey's results indicate that there has been an improved performanceofthetourismindustry,evidencedbyasignificantincreaseinearnings from international visitors. Most of the visitors were impressed by Tanzania as one of the unique destinations with friendly people and wonderful scenery. However, the majority of visitors indicated the need for further improvement of the infrastructure particularly roads within the national parks, and the quality of services in some of the hotels. It is expected that this report will be a useful source of information to policy makers, investors, academicians and other stakeholders.
Hon. Lazaro Nyalandu (MP) Prof. Benno NduluMinister GovernorMinistry of Natural Resources and Tourism bank of Tanzania
vii
ACKNOwLEDGEMENT
The Steering Committee of the Tanzania Tourism Sector Survey (TTSS) Project wishes to convey heartfelt thanks and appreciation to all those who were behind the successful completion of the 2013 International Visitors’ Exit Survey. Special appreciation should go to the Chief ExecutiveOfficersoftheparticipatinginstitutionsnamely;theMinistryof Natural Resources and Tourism, Bank of Tanzania, National Bureau of Statistics, Immigration Department, Zanzibar Commission for Tourism and the Tourism Confederation of Tanzania, for their valuable support and guidance.
SpecialrecognitionshouldalsogototheImmigrationDepartmentstaff,particularly the officers’ in-charge at the Julius Nyerere InternationalAirport, Abeid Amani Karume International Airport, Kilimanjaro International Airport, Namanga, Tunduma, Mtukula and Manyovu border points. Likewise, our profound thanks should go to researchers and those who handled the data entry exercise for making the survey a success.
This report was prepared under the overall supervision of Mr. Z. A. Kimwaga (Director of Tourism – MNRT) and Dr. J. L. Masawe (Director, Economic Research and Policy-BOT). The Technical Team was led by Mr. P. Mwiru, Assistant Director of Tourism (MNRT), in collaboration with Ms. N. Moshy, Manager, International Economics and Trade Department (BOT). Other members of the team were Dr. C. Masenya (BOT), Mrs. V. W. Kejo (BOT), Mr. P. Mboya (BOT), Mr. J. Msimbano (MNRT), Mr. V. Tesha (NBS), Ms. E. Lema (NBS), Mrs. J. Rugemalila (NBS), Mr. C. Mndeme (Immigration Department) and Mr. M. Jaffer (ZCT). Special thanksshould also go to Mr. R. Barongo and R. William from BOT for managing the data processing exercise.

viii
EXECUTIVE SUMMARY
The World Tourism Barometer (2014) shows that during 2013, the tourism sector at the global level showed remarkable growth despite the slowdown in economic activities and geopolitical challenges. The region that recordedthestrongestgrowthwasAsiaandthePacificwhichregistereda growth of 6.0 percent. Africa registered a growth of 5.6 percent reaching a record of 55 million tourists. In terms of receipts, Europe maintained a lion’s share as it accounted for about 42 percent of the global tourism receipts. Within East Africa, the number of international tourist arrivals in Kenya declined to 1,519,600 in 2013 from 1,710,829 recorded in 2012 largely associated with insecurity in the country. On the other hand, the number of international tourist arrivals in Uganda increased to 1,206,000 in 2013 from 1,197,000 registered in 2012, while in Tanzania it grew by 1.7 percent reaching 1,095,885 and in Rwanda it grew by 6.0 percent to 1,137,000.
This report presents the findings of the 11th international visitors’ exit survey, which was also the 4th comprehensive survey that is normally conductedaftereveryfiveyearstocoverhighandlowtouristseasons.High season lies between July and September, while the low season lies between March and May.
Main findings
Source Markets
Thesurvey’sfindingsshowthatthetop15sourcemarketsforTanzaniais largely similar to the comprehensive survey conducted in 2007. Kenya and Uganda are among the countries in the list of top 15 source markets largely associated with the ongoing regional integration initiatives under the East African Community. India has also featured as a prominent sourcemarketforTanzania,reflectingincreasedpromotionaleffortswitha view to decrease overdependence on the traditional markets of Europe and America.

ix
Visitors’ Expenditure
Tourism earnings for Tanzania increased by 8.2 percent to USD 1,853.3 million in 2013 compared with USD 1,712.7 million reported in 2012. For Zanzibar, earnings from tourism increased by 11.6 percent to USD 210.5 million compared with USD 175.4 million earned in 2012. The overall average expenditure per person per night was USD 284 slightly lower than USD 290 recorded in 2012. This implies that the growth in tourism earnings during 2013 largely emanated from increase in the number of international tourist arrivals. Visitors who came under the package tour arrangement spent an average of USD 372 per person per night while those under the non-package tour spent an average of USD 201 per person per night.
Purpose of Visit
Leisure and holidays continued to be the main purpose of visit for international tourists to Tanzania, followed by visiting friends and relatives; business andmeetings and conferences. Only a fewvisitorscame as volunteers and for scientific and academic purposes. Thedominance of leisure and holidays is largely attributed to the country’s unique nature and wide range of tourist attractions.
Length of Stay
The survey’s results show that most visitors spent between eight and 28 nights in Tanzania. The results reveal further that no visitors spent more than three months. The average length of stay was 10 nights, with visitors from Germany and Canada staying the longest – at the average of 13 nights. Visitors from the neighboring countries stayed fewer nights.
Tourism Activities
Wildlife tourism continued to be the most attractive tourism activity in 2013, which is consistent with the country’s wildlife endowment. The majority of tourists who visited wildlife attractions came from the United States of America, the United Kingdom and France. The second most attractive activity was beach tourism, which mainly attracted visitors

x
from Italy, the United Kingdom and France. The least attractive activity was hunting, which attracted visitors mostly from the United States of America, Kenya and the United Kingdom.
First-Time and Repeat Visits
Theshareoffirst-timevisitorstototalvisitorsdeclinedfrom77.0percentin 2012 to 66.0 percent in 2013. This implies that the share of repeat visitors is increasing, indicating that visitors were satisfied with the servicesreceived in the past and the tourist attractions available in the country.
Mode of Payment
The survey’s findings indicate that 89.8 percent of the visitors settledtheir bills by cash. The majority of visitors who used cash as a mode of payment were those who came for leisure and holidays. Only 9.3 percent of the visitors were able to pay through credit cards. Unacceptability of credit cards at most tourism establishments has been an issue of concern to visitors. It needs to be addressed in order to induce visitors to stay longer and spend more.
Policy Recommendations
a) The survey’s findings revealed that themajority of visitors usedcash as a mode of payment while few used credit cards. The small number of visitors using credit cards support raised concerns about the unacceptability of this facility by most tourism establishments. Therefore, the Government through the national Public-Private Partnership (PPP) policy should sensitize and encourage business community to accept the use of credit cards.
b) The survey’s results indicate that the overall average length of stay of visitors to the United Republic of Tanzania was 10 nights, which is similar to the number reported in 2012 and 2011. This implies thatthereisaneedofenhancingdiversificationoftourismproductsin order to increase the number of nights spent at a destination by tourists. This will have a positive impact on tourist expenditure in the country.

xi
c) Thesurvey’sfindingsrevealedthatonlyonepercentofthevisitorsheard about Tanzania’s tourist attractions through trade fairs and Tanzania’s missions abroad. This implies that the government and private sector should enhance promotional efforts and even useother sources of information such as television, web, newspapers and magazines. Tanzania’s missions abroad should spearhead the implementation of economic diplomacy in order to attract more tourists.
d) Further, the survey’s findings showed that wildlife tourismcontinued to be the leading activity in 2013, in spite of the country’s endowment with a wide range of other tourist attractions such as sandy beaches, historical sites, mountains, nature and landscapes. This implies thatmore concertedefforts shouldbeundertaken topromote other forms of tourist attractions to complement wildlife tourism.
e) The findings also indicate that more than a half of the visitors raised concerns regarding the improvement of the infrastructure and other facilities, such as roads within the national parks, toilets, water supply and air conditioners at the airports and signage. The governmentisthereforeurgedtocontinuewithitseffortstoimproveroads in the national parks and other facilities.
f) TrafficjaminDaresSalaamregionwasanothermajorconcernformosttourists.Thegovernmentisadvisedtocontinuewithitseffortsto address the infrastructural issues.

xii

1
Chapter 1: Recent Developments in the Tourism Industry
1.1 Global Perspective
The tourism sector has shown a remarkable growth despite the slowdown in global economic activities and the geopolitical challenges. According to the UNWTO World Tourism Barometer, January 2014, international tourist arrivals grew by 5.0 percent in 2013, reaching a record of 1,087 million arrivals (Chart 1.1).
Chart 1.1: International Tourist Arrivals, 2000 - 2013 In Millions
Source: UNWTO World Tourism Organization Barometer, January 2014
Region-wise, growth was strongest in Asia and the Pacific, where the number of international tourists grew by 6.0 percent and reached 248 million (Table 1.1). South-East Asia sub-region was the best performer with a growth rate of 10.0 percent, while a comparatively more moderate growth was recorded in South Asia (5.0 percent), Oceania and North-East Asia (4.0 percent each). Africa attracted a 5.6 percent increase in arrivals, reachinganewrecordof56million,whichreflectedtheongoingreboundin North Africa and the sustained growth in Sub-Saharan destinations. Europe recorded a 5.4 percent increase in international tourist arrivals in 2013, raising the total to 563 million. The Americas recorded an increase of

2
3.6 percent, reaching a total of 169 million in 2013. The leading destinations in the Americas were North and Central America, with a growth rate of 4.0 percent each, while South America and the Caribbean registered a slowdown of 2.0 percent and 1.0 percent, respectively. This performance is low compared to the levels recorded in 2012. The Middle East continued to attract low level of international tourist arrivals, recording a growth rate of about 0.2 percent.
Table 1.1: International Tourist Arrivals by Regions, 2006-2013 In Millions
Source: UNWTO World Tourism Organization Barometer, Various Issues
Europe continued to account for the largest share of international tourist arrivals,followedbyAsiaandthePacific,theAmericas,theMiddleEastand Africa, as indicated in Chart 1.2. The same pattern was observed in 2012.

3
Chart 1.2: Market Share of International Tourist Arrivals, 2013
Europe,52%
Asia and the Pacific,
23%
Middle East,5%
Africa,5%
Americas,16%
Source: UNWTO World Tourism Organization Barometer, January 2014
UNWTO projections indicate that international tourist arrivals will increase by between 4.0 and 4.5 percent in 2014, above the 3.8 percent average recorded between 2006 and 2013 (Table 1.2). The positive results of 2013, and the expected global economic improvement in 2014, set the prospect for an increase in international tourist arrivals in 2014.
Table 1.2: International Tourist Arrivals: Actual Growth and Projection
Actual Growth (Percent)
Source: UNWTO World Tourism Organization Barometer, Various Issues
According to the UNWTO World Tourism Barometer of April 2014, international tourism receipts reached USD 1,159 billion in 2013 worldwide, which is an increase of 7.5 percent from USD 1,078 billion recorded in 2012 (Chart 1.3). The growth rate of receipts is consistent with

4
theincreaseininternationaltouristarrivals.Thisperformanceconfirmsthe increasingly important role of the tourism sector in stimulating economic growth and contributing to international trade.
Chart 1.3: International Tourism Receipts, 2001-2013 billions of USD
Source: UNWTO World Tourism Organization Barometer, Various Issues
Region-wise, Asia and the Pacific recorded the largest increase ininternational tourism receipts in 2013, followed by Europe and the Americas (Table 1.3). Africa and the Middle East recorded a slight fall in international tourism receipts in 2013.

5
Table 1.3: International Tourism Receipts by Region, 2006-2013 In billions of USD
Percentage Change
Source: UNWTO World Tourism Organization Barometer, Various Issues
Europe continued to dominate by accounting for about 42.0 percent of the international tourism receipts in 2013 (Chart 1.4).AsiaandthePacificaccounted for 31.0 percent, followed by the Americas with 19.8 percent. TheshareofAsiaandthePacifichasbeenincreasingovertherecentpast,while that of Europe has been declining. The Middle East accounted for about four percent, while Africa accounted for the lowest share of three percent.
Chart 1.4: Market Share of International Tourism Receipts, 2012-2013
Source: UNWTO World Tourism Barometer, April 2013 and April 2014

6
The tourism sector also generates export earnings through international passenger transport which amounted to USD 218 billion in 2013, bringing total receipts generated by international tourism to USD 1,377 billion. International tourism (travel and passenger transport) accounted for about 30.0 percent of the world’s exports of services and six percent of the world’sexportsofgoodsandservices.Tourismrankedfifthafterfuels,chemicals, food and automotive products in world exports, while ranking firstinmanydevelopingcountries.
In the top ten tourism destinations by receipts, Thailand recorded the strongest growth of 19.7 percent, followed by Hongkong (China) and the United Kingdom (Table 1.4). The remaining destinations in the list of top ten recorded an increase of between 3.0 percent and 10.0 percent, with the exception of Australia which recorded a decline of 2.3 percent.
Table 1.4: The Top 10 Ranking of Destinations by Receipts In billions of USD
Source: UNWTO World Tourism Barometer, Various Issues
1.2 Tourism Developments in East Africa
The number of international tourist arrivals in Kenya declined to 1,519,600 in 2013 from 1,710,829 recorded in 2012, largely due to security warnings from her traditional source markets1. As a result of this, earnings from tourism declined to USD 1,092.0 million in 2013 from USD 1,140.0 million recorded in 2012. In Uganda, the number of international tourist arrivals
1 Kenya National Bureau of Statistics

7
increased to 1,206,000 in 2013 from 1,197,000 recorded in 20122. The majority of tourist arrivals to Uganda came mainly to visit friends and relatives, followed by those who came for business and professional conferencing and then leisure, recreation and holidays. In line with this development, tourism earnings increased to USD 979.0 million in 2013, from USD 834.0 million registered in 2012. In Rwanda, the number of international tourist arrivals increased by 6.0 percent to 1,137,000 in 2013 from the level recorded in 20123. Consistent with this development, earnings from tourism rose by 4.0 percent to USD 293.6 million in 2013.
1.3 Tourism Developments in Tanzania
Tanzania’s tourism industry, which accounts for about 24.0 percent of exports of goods and services, continues to be among the key sectors in generating foreign exchange. The industry continued to grow in 2013 as exhibited by the increase in the number of international tourist arrivals to 1,095,885 from 1,077,058 recorded in 2012. As a result, tourism earnings increased by 8.2 percent to USD 1,853.28 million compared to USD 1,712.7 million recorded in 2012.
1.3.1 International Tourist Arrivals
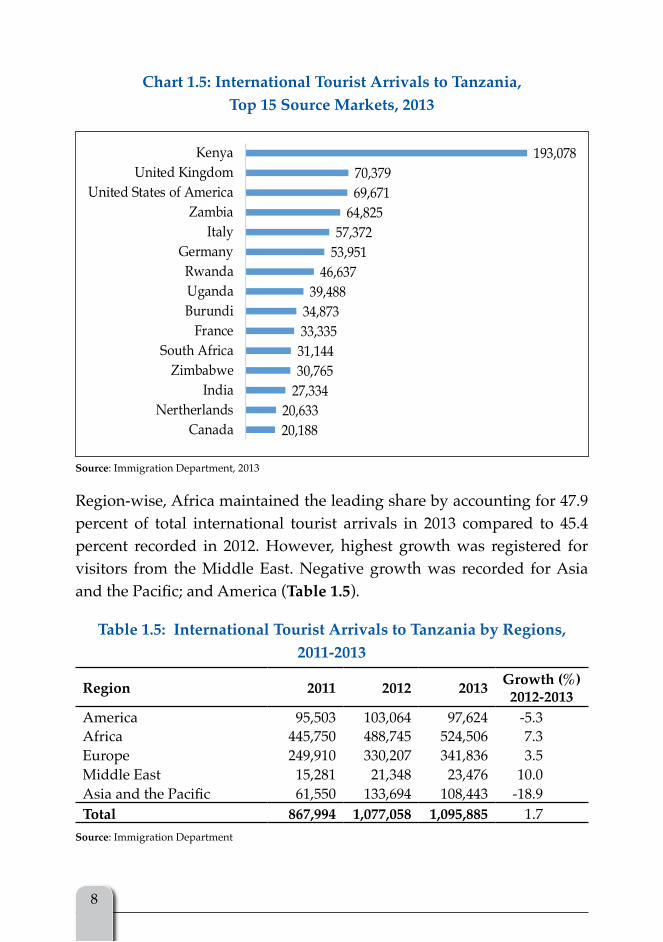
The immigration statistics show that out of total international tourist arrivals to Tanzania, tourists from Kenya led percent, followed by those from the United Kingdom, the United States of America and Zambia (Chart 1.5). The appearance of other EAC partner states in the list of themajor sourcemarkets for Tanzania reflects an increase in businessinteractions as well as movement of persons in light of the strengthening regional integration arrangements.
2 Uganda Bureau of Statistics, Statistical Abstract, 2014.3 Rwanda Development Board.
8
Chart 1.5: International Tourist Arrivals to Tanzania, Top 15 Source Markets, 2013
Source: Immigration Department, 2013
Region-wise, Africa maintained the leading share by accounting for 47.9 percent of total international tourist arrivals in 2013 compared to 45.4 percent recorded in 2012. However, highest growth was registered for visitors from the Middle East. Negative growth was recorded for Asia andthePacific;andAmerica(Table 1.5).
Table 1.5: International Tourist Arrivals to Tanzania by Regions, 2011-2013
Region 2011 2012 2013 Growth (%) 2012-2013
America 95,503 103,064 97,624 -5.3Africa 445,750 488,745 524,506 7.3Europe 249,910 330,207 341,836 3.5Middle East 15,281 21,348 23,476 10.0AsiaandthePacific 61,550 133,694 108,443 -18.9Total 867,994 1,077,058 1,095,885 1.7
Source: Immigration Department

9
During 2013, Tanzania registered a significant growth of visitors fromBrazil, Russia, India and China. However, South Africa registered a negative growth (Table 1.6).
Table 1.6: International Tourist Arrivals to Tanzania from bRICS, 2012-2013
Country of residence 2012 2013 Growth (%)Brazil 2,400 2,926 21.9Russia 4,021 5,699 41.7India 22,862 27,334 19.6China 13,760 17,336 26.0South Africa 32,701 31,144 -4.8
Source: Immigration Department
1.3.2 Promotion and Marketing1.3.2.1 Tourism Marketing Strategy
Following the launching of Tanzania Tourism Marketing Strategy on 16th November 2012, the Tanzania Tourist Board (TTB) started to implement the strategy by collaborating with tourism stakeholders such as ambassadors and high commissioners representing their countries in Tanzania. These countries include the United Kingdom, the United States of America, Germany and Italy. The strategy was also shared with other tourism stakeholders in various regions of Tanzania. The sharing was intended to create awareness among various tourism stakeholders so that they can make a positive contribution during its implementation.
1.3.2.2 Tourism Trade fair and Exhibitions
The Tanzania Tourist Board continued to participate in international trade fairs and exhibitions in various countries such as the United Kingdom (World Travel Market), Germany (International Tourism Bourse) and Spain (FITUR). However, TTB started an initial plan to organize another internationalexhibitionknownasSITEforthefirsttimeinTanzania.Theexhibition will take place in October 2014 at Mlimani City Dar-es-Salaam. In an effort to promote tourist attractions in Tanzania, TTB appointedgoodwill ambassadors in various countries such as the United State of

10
America,Australia and Japan in order to complementTTB’s efforts inmaking sure that tourist attractions are known to these countries.
1.3.2.3 Cultural Tourism Programmes
In 2013, the Tanzania Tourist Board through its Cultural Tourism Programme registered eight new Cultural Tourism Enterprises after complying with the National Cultural Tourism Guidelines of the Ministry of Natural Resources and Tourism. These include: • HaydomFourCornersCulturalTourism(Mbulu-Manyararegion);
• MinjinguCulturalTourismEnterprise(Manyararegion);
• TangaCulturalTourismInitiative(Tangaregion);
• SimangoriCulturalTourismEnterprise(Minjingu-Monduli-Arusharegion);
• OlpopongiCulturalTourismEnterprise(Longido-Arusharegion);
• MateruniCulturalTourism(Kilimanjaroregion);
• Tembea-MaraCulturalTourism(Bunda-Mararegion);and
• MasamaCulturalTourism(Kilimanjaroregion).

11
Haydom Four Corners Cultural Tourism(Mbulu-Manyara region)
Minjingu Cultural Tourism Enterprise (Manyara region)
Tanga Cultural Tourism Initiative (Tanga region)
Simangori Cultural Tourism Enterprise (Minjingu-Monduli-Arusha region)
Olpopongi Cultural Tourism Enterprise (Longido-Arusha region)
Materuni Cultural Tourism (Kilimanjaro region)
11

12
1.3.2.4 Tanzania Voted the best Safari Destination
According to the survey conducted by an online market place for African tours, SafariBookings.com, Tanzania was voted the best safari destination in Africa. The survey, which involved 276 specialized safari operators, eight major safari countries, 139 wildlife parks and reserves, 2,324 user reviews and 756 expert reviews, concluded that Tanzania leads in the continent,byscoringanaverageratingof4.8starsoutoffivestars(5.0);the highest score of all eight major safari countries. Botswana and Kenya scored 4.7 stars each, followed by South Africa and Zambia which scored 4.6 stars each, Namibia 4.5 stars, Uganda 4.2 stars and Zimbabwe 4.1 stars.
Visitors in Serengeti National Parks for game viewing
The main contributing factors towards this achievements include the fact thatTanzaniaisthelandoftwoofUNESCO’sWorldHeritageSitesnamely;Serengeti National Park, which is the home to the “great migration,” and theNgorongoroCrater.Otherfactorsinclude;thebestchimptrackinginAfrica and the world-famous Mount Kilimanjaro, which is the highest free-standing mountain in Africa. Visitors can also enjoy authentic African

13
wilderness without paved roads and fencing, beaches in Zanzibar Island, coupled with political stability and safety.
1.3.3 Meetings and Conferences
The Africa Climate Conference 2013 was organized under the auspices of the World Climate Research Programme (WCRP) and the African Climate Policy Center (ACPC) in October, 2013. The conference brought together decision-makers and climate researchers, scientists and practitioners from Africa and around the world. The main objective of the conference was to develop a framework for mainstreaming climate information into decision-making, as well as a network of experts who evaluate and interpret knowledge for practical applications in areas such as agriculture and food production, water resources management, climate risk management and adaptation planning.
1.3.4 The fight against Poaching
During his visit to Tanzania in July 2013, President Barrack Obama of the United States of America, stressed on the issue that is inseparable from Africa’s identity and prosperity, primarily the importance of wildlife to the African economies like Tanzania. The US president particularly emphasizedtheneedtocurbpoachingandtrafficking,whichiscurrentlythreatening Africa’s wildlife. It is on this note that he signed an executive order creating a special task force aimed at preventing poaching and internationalwildlife trafficking,especially thesaleof rhinohornsandelephant tusks. The presidential order earmarked additional funds for anti-poaching and other technical assistance to African governments.

14
Protect the elephants from poaching
1.3.5 Tourism Development Levy
The Ministry of Natural Resources and Tourism has introduced Tourism Development Levy (TDL) by using Section 59 of the Tourism Act, No. 29 of 2008. TDL regulations were developed in 2013 to facilitate the implementation of the said Act. The principal objective of the levy is to assistinfinancingtheimplementationoftheactivitiesrelatingtotourismdevelopment.
1.3.6 Domestic and International flights
fastjet introduced the first international route betweenDar es Salaamand Johannesburg in September 2013, flying three times aweek. Theflightbroughttoanendthemonopolyoverthisroutewhichformanyyears was operated by one airline. The route is expected to increase the number of international tourists from South Africa, which is one of the main tourist source markets for Tanzania. The airline also introduced dailyflightsbetweenDaresSalaamandMbeyaeffectiveDecember2013.The new route is expected to increase the number of tourists visiting the tourism attractions located in the southern circuit.

15
Chapter 2: Analysis of the Survey’s Results
2.1 Introduction
Thischapterpresentstheanalysisofthefindingsofthe11th International Visitors’ExitSurveywhichwasconductedforaperiodoffourweeks;twoweeks during the high season and two weeks during the low season. As indicated in Chart 2.1, the high tourist season for Tanzania lies between July and September, while the low season is between March and May. The comprehensive international visitors’ exit survey which covers both lowandhighseasonsisnormallyconductedaftereveryfiveyears.Theprevious comprehensive surveys were conducted in 2001 and 2007. The survey’s results provide useful information on international visitors to Tanzania such as their expenditure, length of stay, purposes of visits, gender, age group, travel arrangements and source markets. The results are used for policy formulation and tourism promotion.
Chart 2.1: International Tourist Arrivals to Tanzania, 2009–2013
Source: Immigration Department
2.2 Source Markets
Thesurvey’sfindingsfortheUnitedRepublicofTanzaniashowthatoutof a total of 24,004 visitors from 126 countries, 16.2 percent came from

16
the United States of America, followed by the United Kingdom which accounted for 13.0 percent (Chart 2.2). The list of the top 15 source markets remained broadly similar to that of the previous comprehensive survey with the exception of Netherlands, Belgium, Norway and Japan which have been replaced by Uganda, Sweden, Switzerland and India. The prominence of Uganda and Kenya is largely associated with the ongoing regional integration initiatives under the East African Community while theappearanceofIndiareflectsincreasedpromotionaleffortsinemergingmarkets geared towards decreasing overdependence on traditional source markets of Europe and America. Consequently, the concentration of visitors from the traditional top 15 source markets declined to 77.3 percent from 85.3 percent reported in the previous comprehensive survey.
Chart 2.2: Top 15 Source Markets for the United Republic of Tanzania Percent
The survey’s results show that the main source markets for Tanzania Mainland during 2013 were the United States of America and the United Kingdom. Further, the results show that Uganda, Zimbabwe, Switzerland and Norway are new major source markets that appear in the list of the top 15 source markets replacing Spain, Ireland, Netherlands and Belgium (Chart 2.3).

17
Chart 2.3: Top 15 Source Markets for Tanzania Mainland Percent
In the case of Zanzibar, Italy, the United Kingdom and France continued to be the major source markets (Chart 2.4). The composition of the top 15 source markets remained broadly the same, with countries changing ranks within the group and Sweden, Denmark and Norway replacing New Zealand, Kenya and UAE.
Chart 2.4: Top 15 Source Markets for Zanzibar Percent

18
2.3 Age Group
Thesurvey’sfindingsindicatethatyoungandactiveagegroupof“25-44” took the lead by accounting for about 42.0 percent of all visitors, followed by the age group of “45-64”, which accounted for 30.0 percent (Chart 2.5). The same pattern was observed in the previous surveys. The senior visitors (65 years and above) accounted for about 11.0 percent of all visitors, compared to seven percent recorded in the previous survey. This is a positive development since this age group has high disposable income and ample time for leisure. Visitors below 18 years accounted for the lowest share.
Chart 2.5: Visitors by Age Group
2.4 Gender
Out of the total visitors surveyed, 52.0 percent were male and 48.0 percent were female. This gender balance remained broadly unchanged over the last three years. However, if viewed in terms of purposes of visit, male visitors dominated in the business category (78.0 percent), meetings and

19
conferences(68.1percent),scientificandacademic(60.4percent)aswellas in visiting friends and relatives (53.6 percent). Female visitors were dominant in volunteering (62.0 percent) and leisure and holiday purposes (52.0 percent).
2.5 Purpose of Visit
The survey’s results indicate that the majority of visitors came to Tanzania for leisure and holidays (Chart 2.6). Second in prominence were tourists who came to visit friends and relatives, followed by those who came for business, meetings and conferences. On the other hand, visitors who came as volunteers and for scientific and academicpurposeswere theleast. The dominance of visitors who came for leisure and holidays is largely attributed to the country’s unique nature and wide range of tourist attractions.
Chart 2.6: Purpose of Visit
Note: Other purposes include education, medical, transit, sports, etc.

20
Most holiday makers came from the United States of America, followed by the United Kingdom and Italy. Visitors who came mainly for business purpose were from Zambia, South Africa and Kenya, while those who came as volunteers and to visit friends and relatives were from the United Kingdom and the United States of America (Table 2.1).
Table 2.1: Percentage Distribution of Top 15 Source Markets by Purpose of Visit
Table 2.2 indicates that region-wise, Europe was the leading source market for visitors who came for leisure and holidays, followed by the Americas, andEastAsia and the Pacific. On the other hand,most visitors fromAfrica came for business, meetings and conferences as well as visiting friends and relatives. The highest proportion of visitors who came for scientificandacademicpurposeswasfromEurope,followedbyAfrica.

21
Table 2.2: Purpose of Visit by Regions, 2013
2.6 Travel Arrangement
The choice of travel arrangements depends on factors such as price, destination(shortorlonghaul),purposeofvisitandwhetheritisafirsttime or a repeat visit. Other factors include security, social interaction and climate. Tourist can choose among two travel arrangements namely package and non -package (independent). The survey’s results show that more than 57.5 percent of visitors to Tanzania used the package travel arrangement. The same pattern was exhibited in the last six years with the exception of 2008 and 2011 (Table 2.3). The dominance of the non-package travel arrangement in 2008 and 2011 was partly explained by theglobalfinancialcrisisthatoccurredinthemid-2008andthesovereigndebt crisis in the Euro zone that took place in 2011.
Table 2.3: Proportion of Visitors by Travel Arrangements
YearTravel Arrangement (Percent)
Non-package Package2007 35.0 65.02008 56.2 43.82009 34.7 65.32010 36.5 63.52011 52.0 48.02012 34.0 66.02013 42.5 57.5

22
The survey’s results reveal that the majority of visitors from Italy, France, the United States of America, the United Kingdom, Australia, and Canada came under the package travel arrangement. Under the same travel arrangement, the results show that a small proportion of visitors were from Zambia, Uganda and Kenya. Under the non-package travel arrangement, the majority of visitors came from the neighboring countries, largely due to their knowledge and great social interactions with Tanzania (Table 2.4).
Table 2.4: Proportion of Visitors by Source Markets by Travel Arrangement
Top 15 Source MarketsTravel Arrangement (Percent)
Total VisitorsNon-package Package
United States of America 23.7 76.3 3,884United Kingdom 41.6 58.4 3,156Italy 17.8 82.2 1,876France 19.8 80.2 1,659Germany 41.4 58.6 1,459South Africa 46.4 53.6 987Canada 28.5 71.5 806Australia 24.8 75.2 793Kenya 83.3 16.7 778Uganda 95.7 4.3 713Zambia 97.0 3.0 595Sweden 51.0 49.0 473Switzerland 40.0 60.0 465India 72.7 27.3 454Others 55.4 44.6 5,423
The majority of visitors who came for business, conference, visiting friends and relatives prefer to make their own travel arrangements. However, more than three-quarters of the visitors who came for leisure and holidays had higher preference for the package travel arrangement (Table 2.5).

23
Table 2.5: Distribution of Visitors by Travel Arrangement and Purpose of Visit
Travel Arrangement
Purpose of Visit (Percent)
Total Visitorsbusiness
Leisure and
Holidays
Meetings and
Conferences
Visiting friends
and Relatives
Other
Non-Package Tour 91.0 24.7 85.9 89.9 72.8 10,203Package Tour 9.0 75.3 14.1 10.1 27.2 13,801Total 100.0 100.0 100.0 100.0 100.0 24,004
Table 2.6 depicts that under the non-package travel arrangement, Zambia took the lead in business, followed by Kenya, the United Kingdom and the United States of America. The dominance of Zambia is partly explained by their utilization of Dar es Salaam port for import and export of goods, given that Zambia is a landlocked country. Likewise, Kenya led in attending conferences while Uganda and the United Kingdom dominated in visiting friends and relatives.
Table 2.6: Distribution of Visitors under the Non-package by Purpose of Visit
Top 15 Source MarketsPurpose of Visit (Percent)
business Leisure and Holidays
Meetings and Conferences
Visiting friends and Relatives Others
United States of America 5.7 11.5 8.6 6.8 11.0United Kingdom 5.9 14.4 13.1 14.1 15.7Italy 0.7 5.3 0.4 1.8 6.5France 0.8 6.3 0.9 1.6 0.1Germany 1.2 9.0 4.6 5.7 3.0South Africa 7.3 3.4 8.1 3.7 1.0Canada 0.2 2.1 2.6 2.7 6.9Australia 1.1 2.9 0.8 0.8 3.5Kenya 6.8 2.2 23.4 4.6 11.0Uganda 5.7 2.1 7.9 14.8 8.7Zambia 22.7 0.6 1.6 4.0 1.8Spain 0.4 2.5 0.5 0.7 1.8Sweden 0.5 3.3 1.2 2.1 4.0Switzerland 0.3 3.1 1.1 1.4 0.4India 4.9 1.4 6.1 4.5 1.6Others 35.8 29.9 19.3 30.7 22.9Total 100.0 100.0 100.0 100.0 100.0Total visitors (absolute) 1,906 4,239 1,006 2,282 770
24
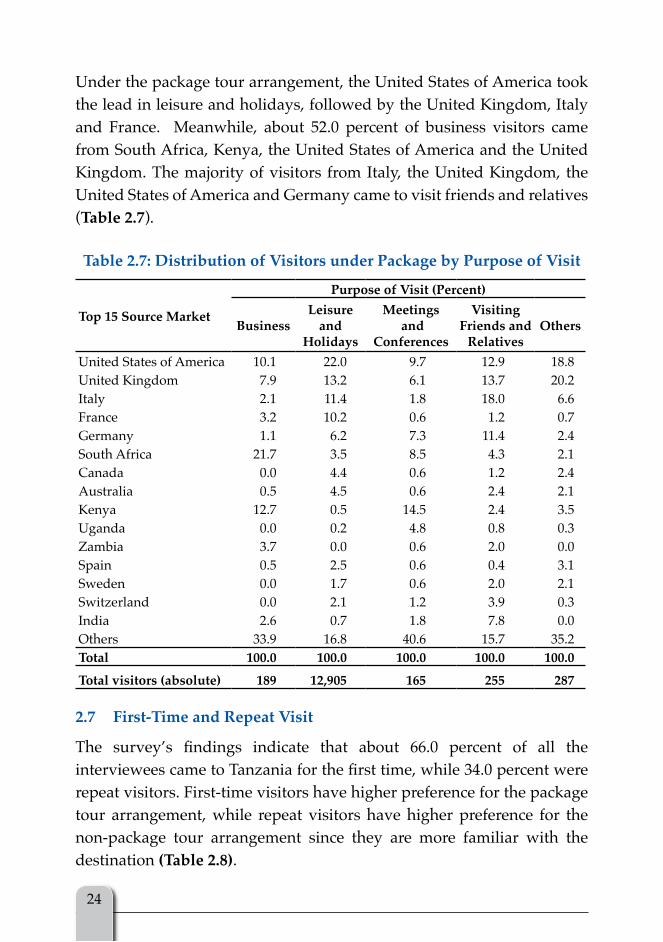
Under the package tour arrangement, the United States of America took the lead in leisure and holidays, followed by the United Kingdom, Italy and France. Meanwhile, about 52.0 percent of business visitors came from South Africa, Kenya, the United States of America and the United Kingdom. The majority of visitors from Italy, the United Kingdom, the United States of America and Germany came to visit friends and relatives (Table 2.7).
Table 2.7: Distribution of Visitors under Package by Purpose of Visit
Top 15 Source Market
Purpose of Visit (Percent)
businessLeisure
and Holidays
Meetings and
Conferences
Visiting friends and
RelativesOthers
United States of America 10.1 22.0 9.7 12.9 18.8United Kingdom 7.9 13.2 6.1 13.7 20.2Italy 2.1 11.4 1.8 18.0 6.6France 3.2 10.2 0.6 1.2 0.7Germany 1.1 6.2 7.3 11.4 2.4South Africa 21.7 3.5 8.5 4.3 2.1Canada 0.0 4.4 0.6 1.2 2.4Australia 0.5 4.5 0.6 2.4 2.1Kenya 12.7 0.5 14.5 2.4 3.5Uganda 0.0 0.2 4.8 0.8 0.3Zambia 3.7 0.0 0.6 2.0 0.0Spain 0.5 2.5 0.6 0.4 3.1Sweden 0.0 1.7 0.6 2.0 2.1Switzerland 0.0 2.1 1.2 3.9 0.3India 2.6 0.7 1.8 7.8 0.0Others 33.9 16.8 40.6 15.7 35.2Total 100.0 100.0 100.0 100.0 100.0
Total visitors (absolute) 189 12,905 165 255 287
2.7 first-Time and Repeat Visit
The survey’s findings indicate that about 66.0 percent of all the intervieweescametoTanzaniaforthefirsttime,while34.0percentwererepeat visitors. First-time visitors have higher preference for the package tour arrangement, while repeat visitors have higher preference for the non-package tour arrangement since they are more familiar with the destination (Table 2.8).

25
Table 2.8: first-Time and Repeat Visit, 2013
Type of VisitPackage Non-Package
Total %Interviewees % Interviewees %
First-time Visit 5,020 83.8 3,228 49.0 8,248 65.6
Repeat Visit 968 16.2 3,359 51.0 4,327 34.4
TOTAL 5,988 100.0 6,587 100.0 12,575 100.0
The results further show that with the exception of South Africa, Kenya, Uganda and Zambia, the majority of visitors from the top 15 source marketswerefirst-timevisitors(Chart 2.7).
Chart 2.7: first-Time and Repeat Visitors by Source MarketsPercent
As indicated in Table 2.9,mostofthetourists,whoarefirst-timevisitors,came for leisure and holidays, followed by those who came to visit friends and relatives.

26
Table 2.9: first-Time Visitors by Purpose of Visit
2.8 Source of Information
Thesurvey’sfindingsindicatethat48.3percentofallthevisitorsreceivedinformation about Tanzania’s tourist attractions through travel agents and tour operators, while 30.1 percent were informed by friends and relatives (Chart 2.8). Most of the visitors who heard about Tanzania through travel agents and tour operators were from the United States of America, the United Kingdom, Italy and France, while those who received information through friends and relatives were mostly from the United Kingdom and the United States of America. The other sources of information were radio, television, web, newspapers and magazines. About one percent of the visitors heard about Tanzania through trade fairs and the Tanzania’s missions abroad.

27
Chart 2.8: Source of Information About Destination Tanzania, 2013
2.9 Travel Party
Thesurvey’sfindingsshowthatmostofthevisitorswereaccompaniedby friends and relatives. This is different from the 2012 resultswhichindicated that the largest number of visitors travelled alone. Those who travelled with children continue to be the least (Chart 2.9).
Chart 2.9: Visitors by Travel Party, 2013

28
Table 2.10 indicates that the large number of visitors who travelled alone and those who travelled with friends and relatives were in the age group of 25-44.
Table 2.10: Travel Party by Age Group
2.10 Departure Points
The 2013 survey covered seven departure points - three airports and four border posts. The majority of the visitors (80.4 percent) departed through airports (Table 2.11). The prominence of airports as departure points is largely explained by the fact that most visitors to Tanzania are from long-haul destinations.
Table 2.11: Distribution of Visitors by Departure Points
Departure Points Visitors PercentJNIA 8,351 34.8KIA 6,058 25.2AAKIA 4,897 20.4NAM 2,309 9.6TUN 1,130 4.7MT 704 2.9MANY 555 2.3Total 24,004 100
The share of visitors who used land border posts increased to 19.5 percent in 2013 from 15.7 percent recorded in 2012 (Chart 2.10). A large number of visitors who used land border posts came from the neighbouring countries, i.e. Zambia, Kenya, Uganda, and Zimbabwe.

29
Chart 2.10: Distribution of Visitors by Departure Points
As shown in Table 2.11, the majority of the visitors departed through JNIA since it is the departure point for most international airlines coupled with the fact that Dar es Salaam is the commercial hub with vast economic activities.ThisisalsoreflectedinChart 2.11, where JNIA is the leading departure point for all purposes of visit with the exception of leisure and holidays. KIA, which is second in prominence, was used mostly by visitors who came for leisure and holidays, and meetings and conferences. This is due to its proximity to Arusha region, where most international conferences are held and the presence of a variety of tourist attractions in the northern circuit such as Mount Kilimanjaro, Ngorongoro Crater and Manyara National Park.
The most used departure point among the land border posts was Namanga and was mainly for visitors who came for leisure and holidays. Tunduma border post was dominated by visitors who came for business purposes reflectingan increase in tradeactivitiesbetweenTanzania andZambia(Chart 2.11).
2013 2012

30
Chart 2.11: Distribution of Visitors by Purpose and Departure Points
business
Meetings and Conference
Visiting friends and Relatives
Leisure and Holidays
Scientific and Academic
Volunteering

31
2.11 Length of Stay
Length of stay or nights spent by tourists is an important indicator in the tourism industry. It is a key variable used in the estimation of tourist expenditure in the country. The 2013 survey’s results show that the overall average length of stay of visitors to the United Republic of Tanzania was 10 nights, which is similar to the results obtained in 2012 and 2011 surveys. Visitors from Germany and Canada stayed the longest with 13 nights, followed by Sweden and Switzerland, which recorded 12 nights each. South Africa, Uganda, Zambia and India registered an average length of stay of less than 10 nights, with Kenya recording the lowest length of stay. Visitors under the non-package tour arrangements and package tour arrangements stayed nine nights and 10 nights, respectively (Table 2.12).
Table 2.12: Average Length of Stay of Visitors to the United Republic of Tanzania
Country of Residence
Non-Package Visitors’ Country Average
Package Visitors’ Country Average
Combined country Average
United States of America 10 10 10United Kingdom 11 11 11Italy 12 9 11France 10 10 10Germany 13 12 13South Africa 6 7 7Canada 13 12 13Australia 11 11 11Kenya 4 5 5Uganda 6 9 8Zambia 4 9 7Spain 10 10 10Sweden 12 11 12Switzerland 12 12 12India 7 7 7Average 9 10 10

32
Chart 2.12 indicates that 51.6 percent of visitors spent between eight and twenty-eight nights in the country, while those who spent between one and three months accounted for 5.5 percent. Very few visitors stayed beyond three months.
Chart 2.12: Proportion of Visitors by Night Spent in the URT, 2013
Percent
12.4
30.1
51.6
5.50.3
1 to 3 4 to 7 8 to 28 29 to 91 92 to 360
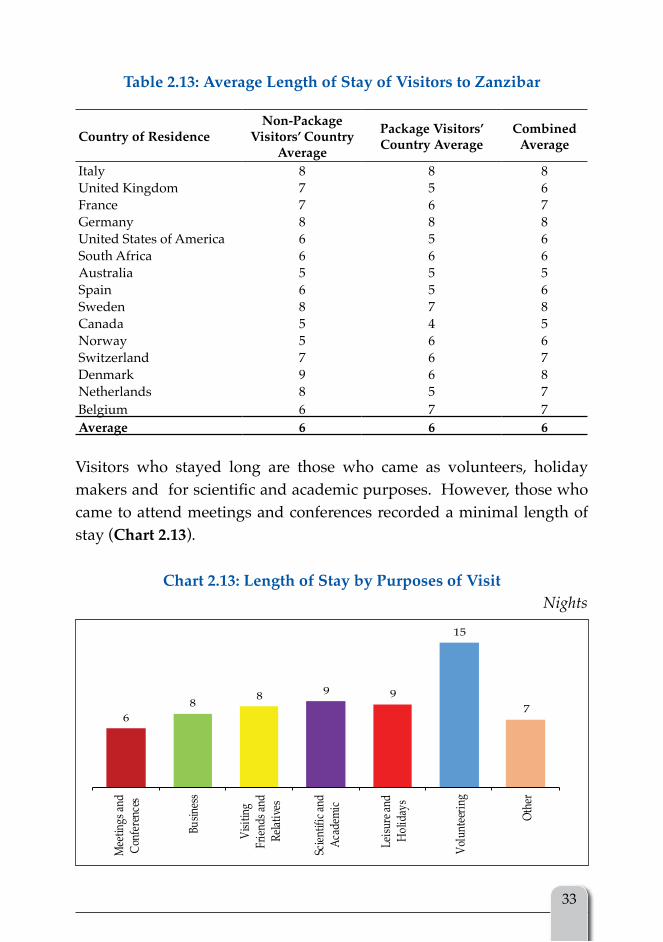
In the case of Zanzibar, the overall average length of stay was six nights. This length of stay has remained the same for the past three consecutive years. Visitors from Italy, Germany, Sweden and Denmark stayed the longest, with an overall average length of eight nights. On the other hand, AustraliaandCanadarecordedthelowestaveragelengthofstayoffivenights (Table 2.13).
33
Table 2.13: Average Length of Stay of Visitors to Zanzibar
Country of ResidenceNon-Package
Visitors’ Country Average
Package Visitors’ Country Average
Combined Average
Italy 8 8 8United Kingdom 7 5 6France 7 6 7Germany 8 8 8United States of America 6 5 6South Africa 6 6 6Australia 5 5 5Spain 6 5 6Sweden 8 7 8Canada 5 4 5Norway 5 6 6Switzerland 7 6 7Denmark 9 6 8Netherlands 8 5 7Belgium 6 7 7Average 6 6 6
Visitors who stayed long are those who came as volunteers, holiday makersandforscientificandacademicpurposes.However,thosewhocame to attend meetings and conferences recorded a minimal length of stay (Chart 2.13).
Chart 2.13: Length of Stay by Purposes of Visit Nights

34
2.12 Mode of Payment
Thesurvey’sfindingsindicatethat89.8percentofthevisitorssettledtheirbills by cash. Only 9.3 percent used credit cards while those who used travellers’ cheques were the least (Chart 2.14). Unacceptability of credit cards at most of the tourism establishments has largely contributed to the minimal use of credit cards as mode of payment. It is worth noting that this has been an issue of concern to visitors for quite some time. In this regards, there is a need for owners of tourism establishments and other relevant stakeholders to take deliberate initiatives to make the use of credit Cards facility possible.
Chart 2.14: Payment Mode
2.13 Tourism Activities
Table 2.14 depicts that wildlife tourism is the most preferred tourist activity inTanzania.Theseresultsreflectthecountry’swealthinwildlife,whichis known to be the home ofAfrica’smostmagnificent game reserves,fabulous national parks and the famous Ngorongoro Conservation Area. Visitors who were mostly attracted to wildlife tourism came from the United States of America, the United Kingdom, France and Germany. Beach tourism was the second activity, which attracted more visitors from Italy, the United Kingdom and France. Mountain climbing was the third most preferred activity, attracting the majority of visitors from the United Kingdom and the United States of America (Table 2.14).

35
Tabl
e 2.
14: P
rim
ary
Tour
ism
Act
iviti
es b
y C
ount
ry o
f Res
iden
ce, 2
013

36
Magnificent wildlife
Great view of Mount Kilimanjaro and Zanzibar Sandy beaches
The 2013 International Visitors’ Exit Survey Report36

37
2.14 Average Expenditure
In 2013, the overall average expenditure of a visitor to Tanzania was USD 284 per person per night compared to USD 217 recorded in 2007. The results further show that visitors who came independently spent an average of USD 201 per person per night and those under the package tour arrangement spent an average of USD 372 per person per night compared to an average of USD 132 and USD 284, respectively spent in 2007.
2.15 Cost of Touring Tanzania
During the 2013 survey, the majority (51.2 percent) of the interviewed visitors revealed that the cost of touring Tanzania is similar to those of other African countries. Most of visitors were from the United States of America, the United Kingdom and Australia. Most interviewed visitors from neighboring countries such as Zambia, Kenya and Uganda indicated that the cost is lower and this can be partly explained by their proximity to Tanzania. Meanwhile, visitors from France, South Africa, Spain and Germany showed that the cost is higher when compared with other African countries (Table 2.15).

38
Table 2.15: Cost of Touring Tanzania
Cost of Touring Tanzania (Percent)
2.16 Tourism Earnings
Tanzania’s tourism earnings increased by 8.2 percent to USD 1,853.3 million in 2013, from USD 1,712.7 million recorded in 2012 (Chart 2.15). This development is mainly driven by the increase in the number of international tourist arrivals. Similarly, Zanzibar earned USD 210.5 million in 2013 compared with USD 175.4 million earned in 2012, the development is largely associated with the increase in the number of international tourist arrivals to 195,553 from 149,586 in 2012.

39
Chart 2.15: Tourism Earnings and International Tourist Arrivals to Tanzania
2.17 Visitors’ Perception About Tanzania
Chart 2.16 reveals that about 41.0 percent of the visitors were impressed by the friendliness of the people and their hospitality to foreigners. Tourists were also impressed by the wildlife, wonderful country, nature and the landscape.Thesefindingsareconsistentwithwhatwasobservedintheprevious surveys.
Chart 2.16: what Impressed Visitors

40
2.18 Areas that Need Improvement
Chart 2.17 indicates that 55.2 percent of all the visitors raised concerns on the state of the infrastructure and other facilities such as roads within the national parks, toilets, water supply and air conditioners at the airports andsignage.Othermajorconcernsweretrafficjam,qualityofservices,slow airport procedures, visa processing at entry points, unacceptability of credit cards, unavailability of ATMs and unreliability of the internet access at most of the tourism establishments. Visitors were also concerned with the state of historical buildings, particularly in the Stone Town - Zanzibar.
Chart 2.17: Areas that Need Improvement

41
Chapter 3: Conclusion and Policy Recommendations
3.1 Conclusion
Tanzania’s tourism industry continued to grow in 2013 as indicated by an increase in the number of international tourist arrivals and tourism earnings. The number of international tourist arrivals to Tanzania increased by 1.7 percent to 1,095,885 in 2013 from 1,077,058 recorded in 2012. As a result, tourism earnings increased by 8.2 percent to USD 1,853.28 million in 2013 from USD 1,712.7 million recorded in 2012. The increasewaslargelyattributedtotheeffortstakenbytheGovernmenttopromote tourism as well as improvement in tourist services, particularly hotels, communication and infrastructure.
3.2 Policy Recommendations
a) The survey’s findings revealed that themajority of visitors usedcash as a mode of payment while few used credit cards. The small number of visitors using credit cards support raised concerns about the unacceptability of this facility by most tourism establishments. Therefore, the Government through national Public-Private Partnership (PPP) policy should sensitize and encourage the business community to accept the use of credit cards.
Responsible Institutions: MNRT, HAT, TCT, ZCT, and ZATI
b) The survey’s results indicated that an overall average length of stay of visitors to the United Republic of Tanzania was 10 nights, which is similar to the number reported in 2012 and 2011. This implies thatthereisaneedofenhancingdiversificationoftourismproductsin order to increase the number of nights spent at destination by tourists. This will have a positive impact on tourist expenditure in the country.
Responsible Institutions: MNRT, TTB, LGAs, TCT, ZCT and ZATI
c) Thesurvey’sfindingsrevealedthatonlyonepercentofthevisitorsheard about Tanzania’s tourist attractions through trade fairs and Tanzania’s missions abroad. This implies that the government and

42
theprivatesectorshouldincreasepromotionefforts,andevenuseother sources of information such as television, web, newspapers and magazines. Tanzania’s missions abroad should spearhead the implementation of economic diplomacy in order to attract more tourists.
Responsible Institutions: MFAIC, MNRT, TTB, TCT, ZCT and ZATI
d) Further, the survey’s findings showed that wildlife tourismcontinued to be the leading activity in 2013, inspite of the country’s endowment with a wide range of other tourist attractions such as sandy beaches, historical sites, mountains, nature and landscapes. This implies thatmore concertedefforts shouldbeundertaken topromote other forms of tourist attractions to complement wildlife tourism.
Responsible Institutions: MNRT, TTB, TCT, ZCT and ZATI
e) Thefindingsalsoindicatethatmorethanahalf of the visitors raised concerns regarding the improvement of the infrastructure and other facilities, such as roads within the national parks, toilets, water supply and air conditioners at the airports and signage. Therefore, the government is urged to continue with its efforts to improveroads in the national parks and other facilities.
Responsible Institutions: MoW, TAA, TCAA, TANAPA, MNRT and LGAs
f) TrafficjamsinDaresSalaamregionwasanothermainconcernofthetourists.Thegovernmentisadvisedtocontinuewithitseffortsto address such infrastructural issues.
Responsible Institutions: MoW, MoT and DCC

43
Appendices

44
Appendix A: The Survey’s Methodology
I. Introduction
The survey’s methodology was designed to collect data that would facilitate a better understanding of the status of the tourism sector and provide an instrument that will enable an appropriate follow-up mechanism.Itconsistsofdesigningasampleandsampleselection;surveyinstruments including a questionnaire; scope and coverage; training;data collection and processing; and estimation of tourist expenditure.The main objective of the survey is to provide reliable information about visitors to Tanzania, including their number, length of stay, expenditure, travel arrangement and their demographic characteristics.
II. Objective of the Survey
The primary objective of the survey was to collect up-to-date tourist expenditure information for use in the ‘’Tourist Expenditure Model” developed in 2001. The Model was developed as a tool for estimation of international tourism receipts required in the compilation of National Accounts (NA) and Balance of Payments (BOP) statistics. These statistics are used by the public and the private sector for policy formulation and strategic business planning, respectively.
III. Scope of the Survey
The respondents for the survey were the departing international visitors. A person is considered as an international visitor if he/she travels to a country other than that of his/her usual residence, for a period not exceedingtwelvemonths;andwhosemainpurposeofvisitisotherthanan activity remunerated from within the country visited.
IV. Sample Size
The survey was done on sample basis. It was planned to interview 10,771 departing international visitors, equivalent to one percent of the international visitors recorded in 2012. Ultimately, the survey managed to randomly interview about 12,575 respondents, who represented around

45
24,004visitors inthesample. Thissamplewasconsideredsufficienttomeet the survey’s objectives.
V. fieldwork
Thedatacollectionexercisewasundertakenforaperiodoffourweeks;two weeks during the high season and two weeks during the low season. It started from 30th August 2013 to 12th September 2013, during the high season and from 24th February 2014 to 9th March 2014 during the low season. High tourist season for Tanzania normally lies between July and September while the low season is between March and May. Data were collected by seven teams; five inMainland and one inZanzibar.Technical Committeemembers participated in the field supervision ofthe interviews to ensure the questionnaires’ completeness, quality and consistency.
VI. Survey’s Coverage
In order to obtain the required information from international visitors, it was important to conduct the survey at entry/exit border points. The survey covered seven departure points, namely: Julius Nyerere International Airport, Kilimanjaro International Airport, Abeid Amani Karume International Airport, Namanga, Tunduma, Mtukula and Manyovu border points.
VII. The Enumerators’ Manual
The Technical Committee developed the Enumerators’ Manual (EM) that was used by enumerators as a reference document during the survey. The manual contained information and guidelines on the concepts anddefinitionsofsomeof thekeywordsused in thequestionnaire. Inaddition, the manual provided the description of the questions and data cross checking mechanism.
VIII. Training of the Enumerators
A one day training of the enumerators and supervisors was organized by the Technical Committee members. A total of 26 enumerators and
46
seven supervisors were trained. The purpose of the training was to guide the enumerators to understand the questionnaire and equip them with interviewing techniques. The enumerators were also trained in methods of fieldediting,dataqualitycontrolproceduresandfieldworkcoordination.The Enumerators’ Manual was used as a guideline document during the training.
IX. The Questionnaire
The questionnaire was designed to ensure that the questions asked were in line with user’s data needs. The information collected is useful for tourism promotion and macroeconomic policy formulation. A single questionnaire was used to gather information for the 2013 International Visitors` Exit Survey. The content of the questionnaire was based on the previous years’ questionnaires with slight modifications. Thequestionnaire used in the survey had 24 questions and it comprised of four main parts, namely: visitor profiles, travel behavior, expenditurepatterns and visitor comments (Appendix III).
Questions 1 to 9 aimed at establishing visitor profiles (nationality,country of residence, age group, purposes of visit, type of tourism activity and source of information about Tanzania).
Questions 10 to 15 aimed at obtaining information about the type of tour arrangement (package/non-package), items in the package and number of nights spent.
Questions 16 to 18 were structured to establish tourists’ earnings ascribed to Tanzania. In addition, the questions probed for details on the amount of money spent in Tanzania.
Question 19 and 20 asked visitors about the most used mode of payment while in Tanzania and if they have travelled to any other African country.Question 21 and 22 aimed at comparing cost with other African countries andwhetherthevisitwasthefirsttimeornot.

47
Question 23 and 24 sought information about areas that impressed the visitors and those which need improvement.
X. Data Processing
The processing of the 2013 International Visitors` Exit Survey data began aftercompletionofthelowseasonfieldwork.Dataprocessinginvolvedmanual editing, coding of open-ended questions, data entry and editing ofcomputer-identifiederrors.Dataentryandeditingwereaccomplishedusing the ORACLE11g database and web-based application.
XI. Tourist Expenditure Estimation
Tourists’ expenditure in the country was estimated using Tourist Expenditure Model that was developed during the comprehensive International Visitors’ Exit Survey conducted in 2001. The model uses the following variables in estimating tourists’ expenditure: average expenditure by travel arrangement by purpose of visit, proportion of international tourist arrivals by travel arrangement and average length of stay. Data on average expenditure by travel arrangement by purpose of visit, proportion of international tourist arrivals by travel arrangement and average length of stay were obtained from the survey, while the number of international tourist arrivals was obtained from the Immigration Department.
The model is depicted in the following equation:Ev = (E
pχ VpχT) + (E
npχ VnpχT)
Whereby:Ev = Total tourist expenditure in Tanzania.E
p= Average package tour expenditure per visitor per night,
derived from the survey.E
np = Average Non-package tour expenditure per visitor per night,
derived from the survey.Vp = Number of international tourist arrivals under package travel arrangement (The number of international tourist arrivals as recorded by the Immigration Department, adjusted into package

48
visitors by using package tour arrangement ratio derived from the survey).Vnp = Number of international tourist arrivals under Non-package travel arrangement (The number of international tourist arrivals as recorded by the Immigration Department, proportionately adjusted into non-package visitors using the non-package tour arrangement ratio derived from the survey).T = Average length of stay, derived from the survey.
The Simplified Model
Procedure and assumptions used for the estimation of tourist expenditure for 2013:
• Calculation of average package tour expenditure involveddeduction of estimated cost for international fare to Tanzania and the commission accruing to an international tour wholesaler. Information on cost of international transport from source markets was updated using current information gathered from international carriers that bring visitors to Tanzania.
• Itwasassumedthat10percentofthevalueofthepackageisretainedby the international tour wholesaler to meet overhead costs and commission. The assumption was based on a study on Tourism Earnings in Tanzania that was conducted in 2000.

49
• Immigration data on the number of international tourist arrivalsby purpose of visit were distributed according to the package and non-package arrangements using the travel arrangement ratios, as established in the survey.
• In order to be able to estimate annual tourists’ expenditure, thesurvey’s results were applied to the total number of international tourist arrivals, as recorded by the Immigration Department. It is worth mentioning that given the homogeneity nature of the visitors’ characteristics, the information collected during the two weeks surveyisjustifiabletorepresentthetotalpopulation.
• The Immigration Department also provided the number ofinternational tourist arrivals for Zanzibar that enabled the estimation of tourists’ expenditure for Zanzibar.
• Theaveragelengthofstayusedwasbetweenoneandtwenty-eightnights.

50
Appendix b: Questionnaire
THE 2013 INTERNATIONAL VISITORS’ EXIT SURVEY
Please read the instructions carefully before filling the form.
INTRODUCTION
We hope that your stay in Tanzania was a pleasant one and a rewarding experience. Before you leave, you are kindly requested to provide information relating to your stay in Tanzania. The information will help us to improve and develop the tourism sector. The survey is jointly carried out by the Ministry of Natural Resources and Tourism, National Bureau of Statistics, Bank of Tanzania, Immigration Department and the Zanzibar Commission for Tourism.
Your Cooperation is highly appreciated
FOR OFFICIAL USE:
CODE NUMBER: ______________________________________________
NAME OF THE RESEARCHER: _____________ ______________________
DATE:_______________________ SIGNATURE: ____________________
NAME OF THE DATA ENTRANT: _________________________________

51
1. Nationality---------------------- Country of Residence ---------------------
2. What is your age group (tick one only)
< 18 18-24 25-44 45 -64 65+[ ] [ ] [ ] [ ] [ ]
3. Are you travelling alone? (Tick) Yes [ ] No [ ] If Yes go to question no. 6
4. With whom are you travelling? (tick one only)
With spouse/partner [ ]With children [ ]With spouse and children [ ]With other friends and relatives [ ]
5. What are ages of the people with whom you are travelling, whose expenditure is on one account, including children?
Age group < 18 18-24 25-44 45 -64 65+ Number of people [ ] [ ] [ ] [ ] [ ]
6. Gender Number of Females
Number of Males
7. Main purpose of visit to Tanzania (tick one only)
Meetings and Conference [ ] Medical [ ]Business [ ] ScientificandAcademic [ ]
Visiting Friends and Relatives [ ] Volunteering [ ]
Leisure and Holidays [ ] Other (please specify) …................. [ ]
8. What was your main tourism activity in Tanzania, in this trip? (tick one only)
Wildlife tourism [ ] Mountain climbingBeach tourism [ ] Hunting tourismCultural tourism [ ] Conference tourism [ ]Bird watching [ ] Others (please specify): ……. [ ]Diving and Sport Fishing [ ] [ ]

52
9. What was your main source of information about Tanzania (tick one only)
Travel agent, tour operator [ ] Inflightmagazines [ ]Friends, relatives [ ] Tanzania Mission Abroad [ ]Trade fair [ ] Radio, TV, Web (please specify): …... [ ]
Newspaper, magazines, brochures [ ] Others (please specify): ………….. [ ]Travel agent, tour operator [ ] [ ]
10. Did you travel independently or booked a package tour? Tick one
Independent Package(If you travelled independently, go to question 15)
11. Items included in your package tour (tick)
International transport (Air ticket/fare) [ ] Sightseeing/excursion/game activities [ ]
Accommodation [ ] Guided tour [ ]
Food and Drinks [ ] Travel insurance [ ]
Internal transportation in Tanzania [ ] Other (please specify)………..... [ ]
12. Total cost of the package tour: Currency …......
13. Is the total cost for the whole group? (Tick) Yes [ ] No [ ]
14. Total number of nights in the package tour (INCLUDING nights spent in other countries)
15. Number of nights spent in: Tanzania Mainland
Zanzibar Island
16. How much money did you spend (cash, travellers cheque, credit cards) in Tanzania during this trip, Please give your best estimate in case you do not remember the exact figures.
Currency .....................................................................................

53
17. Please give a breakdown of your expenditure in Tanzania on the following:
Amount Accommodation alone
Hotel Currency…. Others (Lodges, Motels, Campsites etc.) Currency….
Food and drinks Currency…. Internal transportation by:
Air Currency…. Road Currency…. Water Currency…. Railway Currency…. Air Currency….
Rentals (Car hires, Charters, Boats, etc) Currency…. Cultural Services (Museums, Historical Sites, etc.) Currency…. Sports and Recreational ( Diving, cycling etc) Currency…. Sight Seeing and Excursion Currency…. Mountain Climbing Currency…. Hunting Currency…. Access/entry/gate fees Currency…. Visa fees and Taxes Currency…. Shopping Currency…. Other (Please Specify)............................................... Currency….
18. Is the above breakdown for the whole party? (Tick) Yes [ ] No [ ]
19. Which mode of payment did you use mostly in Tanzania?
Cash [ ] Traveller’s Cheques [ ] Credit Card [ ] Other (please specify) [ ]
20. Have you travelled to other African countries? Yes [ ] No [ ]
21. HowdidyoufindthecostoftouringTanzaniaascomparedwithotherAfricancountries?Lower [ ]Higher [ ]
Same [ ]
22. WasthisyourfirsttriptoTanzania?(Tick)Yes [ ] No [ ]

54
23. What impressed you most during your trip to Tanzania? ..............................................................................................................................................
..............................................................................................................................................
..............................................................................................................................................
..............................................................................................................................................
24. What would you consider the most important areas that need improvements? ..............................................................................................................................................
..............................................................................................................................................
..............................................................................................................................................
..............................................................................................................................................
Thank you for your co-operation and for choosing Tanzania as your destination. Have a pleasant trip.

55
Appendix C: Statistical Tables
Table C1: Departure Points by Source Markets, 2013
Country of Residence JNIA KIA AAKIA NAM MT TUN MANYUnited States of America 14.3 43.4 3.8 34.3 0.9 0.3 5.0United Kingdom 21.5 21.4 8.2 20.0 1.1 1.2 0.0Italy 5.4 3.2 32.2 2.1 0.0 0.5 0.0France 6.3 7.2 19.9 4.1 0.6 0.0 0.0Germany 10.6 6.0 7.9 6.9 6.7 1.1 6.7South Africa 7.3 1.9 9.4 0.8 4.1 2.3 1.7Canada 4.6 6.4 2.7 4.9 0.3 0.0 0.0Australia 3.1 3.6 3.6 15.3 0.0 0.0 8.3Kenya 6.6 0.6 2.9 4.8 9.3 10.5 13.3Uganda 1.9 0.4 0.8 0.1 75.0 1.5 58.3Zambia 0.5 0.1 0.0 0.0 1.5 82.6 6.7Spain 3.3 1.4 4.2 2.4 0.0 0.0 0.0Sweden 3.9 2.0 2.8 0.9 0.3 0.0 0.0Switzerland 5.2 1.2 1.4 1.7 0.0 0.0 0.0India 5.6 1.2 0.3 2.0 0.2 0.2 0.0Total 100.0 100.0 100.0 100.0 100.0 100.0 100.0

56
Table C2: Source Markets for Tanzania
Country of ResidenceNumber of
VisitorsPercentage
of Total
Kenya 193,078 17.6United Kingdom 70,379 6.4United States of America 69,671 6.4Zambia 64,825 5.9Italy 57,372 5.2Germany 53,951 4.9Rwanda 46,637 4.3Uganda 39,488 3.6Burundi 34,873 3.2France 33,335 3.0South Africa 31,144 2.8Zimbabwe 30,765 2.8India 27,334 2.5Netherland 20,633 1.9Canada 20,188 1.8Malawi 18,197 1.7China 17,336 1.6Australia 17,001 1.6Mozambique 15,225 1.4Spain 13,149 1.2Congo 12,573 1.2Sweden 12,503 1.1Norway 12,386 1.1Denmark 9,982 0.9Belgium 9,157 0.8Switzerland 8,827 0.8Oman 8,697 0.8Comoros 8,123 0.7Japan 7,058 0.6Austria 6,834 0.6Russia 5,699 0.5

57
Country of ResidenceNumber of
VisitorsPercentage
of Total
Israel 5,344 0.5Turkey 4,915 0.5Korea (South) 4,815 0.4Finland 4,590 0.4Poland 4,334 0.4Nigeria 3,963 0.4Ireland 3,902 0.4Pakistan 3,714 0.3Czech 3,660 0.3New Zealand 3,033 0.3Brazil 2,926 0.3Ukraine 2,901 0.3Philippines 2,109 0.2Egypt 2,053 0.2Portugal 2,049 0.2Ethiopia 1,983 0.2Sri Lanka 1,976 0.2Ghana 1,871 0.2U.A.E 1,812 0.2Romania 1,560 0.1Kazakhstan 1,509 0.1Slovenia 1,382 0.1Sudan 1,301 0.1Berigin 1,293 0.1Syria 1,238 0.1Namibia 1,203 0.1Malaysia 1,189 0.1Uzbekistan 1,160 0.1Botswana 1,152 0.1Nepal 1,056 0.1Yemen 1,019 0.1Argentina 990 0.1

58
Country of ResidenceNumber of
VisitorsPercentage
of Total
Cameroon 988 0.1Mexico 960 0.1Singapore 958 0.1Congo (Brazaville) 919 0.1Swaziland 886 0.1Taiwan 881 0.1Somalia 869 0.1Afghanistan 860 0.1Indonesia 843 0.1Hungary 843 0.1Jordan 837 0.1Angola 811 0.1Morroco 791 0.1Saudi Arabia 791 0.1Burkina Faso 787 0.1Iran 769 0.1Colombia 767 0.1Slovakia 759 0.1Greece 757 0.1Mauritius 754 0.1Madagascar 715 0.1Iceland 714 0.1Thailand 687 0.1San Morino 678 0.1Estonia 634 0.1Bulgaria 627 0.1Croatia 606 0.1Chile 604 0.1Lesotho 589 0.1Bangladesh 583 0.1Ivory Coast 577 0.1Belarus 518 0.1

59
Country of ResidenceNumber of
VisitorsPercentage
of Total
Seychelles 506 0.1Benin 505 0.1Lithuanian 498 0.1Lebanon 483 0.0Tunisia 479 0.0Senegal 479 0.0Guinea 470 0.0Serbia 470 0.0Uruguay 437 0.0Gabon 420 0.0Gambia 417 0.0Djibouti 412 0.0Liberia 404 0.0Algeria 403 0.0Palestina 393 0.0Korean (North) 387 0.0Siera Leone 365 0.0Togo 336 0.0Luxembourg 319 0.0Latvia 314 0.0Mauritania 312 0.0Mali 292 0.0Nicaragua 285 0.0South Sudan 270 0.0Albania 269 0.0Ecuador 265 0.0Dominica 263 0.0Kuwait 255 0.0Cuba 247 0.0Jamaica 244 0.0Hellenic 241 0.0Cambodia 224 0.0

60
Country of ResidenceNumber of
VisitorsPercentage
of Total
Venezuela 223 0.0Bosnia 218 0.0Peru 215 0.0Libya 214 0.0Georgia 207 0.0Trinidad 205 0.0Macedonia 198 0.0Costa Rica 178 0.0Niger 175 0.0Hong Kong 170 0.0Bahrain 165 0.0Central Africa 165 0.0Cypriot 163 0.0Armenia 155 0.0Maltese 148 0.0Vietnam 143 0.0Moldovia 141 0.0St.Kitts & Devis 139 0.0Fiji 135 0.0Bolivia 128 0.0Azerbaijan 117 0.0Cape Verde 112 0.0Chad 110 0.0Guatemala 106 0.0Tajikstan 104 0.0Eritrea 102 0.0Iraq 101 0.0Honduras 93 0.0Suriname 88 0.0Qatar 84 0.0Myanamar 82 0.0Haitia 75 0.0

61
Country of ResidenceNumber of
VisitorsPercentage
of Total
Panama 66 0.0St. Laurencia 59 0.0Mongolia 56 0.0Stateless 52 0.0Papua New Guinea 47 0.0Paraguay 42 0.0El-Salvador 41 0.0Antigua 40 0.0Liechtestein 36 0.0Solomon 36 0.0Guyana 31 0.0St.Lucia 30 0.0Andorra 29 0.0Sao Tome 29 0.0Barbados 28 0.0Bruney 28 0.0Guinea Bissau 26 0.0Bahama 24 0.0Monecasque 23 0.0Maldives 19 0.0Kyrgyz 12 0.0Grenada 4 0.0Bhutan 3 0.0Belize 2 0.0St. Peirre 1 0.0Total 1,095,885 100.0
Source: Immigration Department

62
ReferencesBOT, MNRT, NBS, IMMIGRATION DEPARTMENT, ZCT (2007), Tanzania
Tourism Sector Survey Report
BOT, MNRT, NBS, IMMIGRATION DEPARTMENT, ZCT (2012), Tanzania Tourism Sector Survey Report
United Nation World Tourism Organization (2014), World Tourism Barometer;Volume12,January2014
United Nation World Tourism Organization (2014), World Tourism Barometer;Volume12,April2014
Websites;United Nation World Tourism Organization, http://www.unwto.orgTanzania Tourist Board, http://www.tanzaniatouristboard.com

63

64
THE 2013 INTERNATIONALVISITORS’ EXIT SURVEY REPORT
THE TANZANIA TOURISMSECTOR SURVEY
Ministry of Natural Resources and Tourism (MNRT)www.mnrt.go.tz
Bank of Tanzania (BOT)www.bot.go.tz
Zanzibar Commission for Tourism (ZCT)www.zanzibartourism.net
National Bureau of Statistics (NBS)www.nbs.go.tz
Immigration Departmentwww.immigration.go.tz