the 2014-2016 oil price fall: how is it different this time? · the 2014-2016 oil price fall: how...
TRANSCRIPT

The 2014-2016 Oil Price Fall: �How is it Different this Time?
Bassam Fattouh
MARCH24,2016,KUWAIT
Oxford Institute for Energy Studies
PRESENTEDATTHEGULFUNIVERSITYFORSCIENCEANDTECHNOLOGY

Supply-Demand Imbalance and Rising Stocks
EIA Estimates of Implied Stock Change, mb/d
Since 2014, the oil market has been adding stocks every month with EIA/IEA expecting this to continue well in 2016; although the stock-build will slow down, it is estimated to stay above 1 mb/d by end of 2016.
0
0.5
1
1.5
2
2.5
3
Q12014
Q22014
Q32014
Q42014
Q12015
Q22015
Q32015
Q42015
Q12016
Q22016
Q32016
Q42016
Source:EIA
2015 | December issue Fundamentals
Page 149
Inventories x September OECD inventories were revised lower by 9.1 mb, which means September’s
counter-seasonal builds are now at 5.1 mb instead of 13.8 mb as per preliminary data.
x OECD stocks fell by 8.2 mb in October to 2,971 mb, although the difference to the five-year average ballooned to 260 mb as the draw was shallower than the 20.7 mb five-year average.
x The draw was led by products, which fell by nearly 30 mb, offsetting a 21.6 mb build in crude, NGLs and other feedstocks. Distillate stocks fell by 13.2 mb while gasoline drew by 10.5 mb, but given the draw in distillates was less than the five-year average, the surplus to the five-year average widened to 43 mb, compared to a 33 mb deficit at the start of this year.
x In fact, even at the end of April, OECD distillate stocks were 10.5 mb below seasonal averages, but since then, stocks built at the rate of 0.5 mb/d through to end-August. September and October saw draws, but as they were less than seasonal averages, the surplus to seasonal averages blew out.
x The draw in October products stocks was largely concentrated in the US (gasoline: -10.7 mb, middle distillates: -12.3 mb), while product stocks in Europe fell by a meagre 0.3 mb, far weaker than the 11.4 mb five-year average draw, partly driven by low Rhine levels which curbed flows from the coast to the inland regions. OECD Pacific product stocks drew counter-seasonally by 5.4 mb.
x Non-OECD products stocks fell sharply in October led by China, while commercial crude stocks were flat, with a draw in China offset by builds in India and Saudi Arabia.
x Preliminary data show November OECD stocks drawing by 1.7 mb to 2,969 mb, led by a 1.6 mb draw in crude stocks. But this was much lower than the 11.6 mb draw (and 7.8 mb for crude) due to an unseasonal build in the US. Distillate stockbuilds were steeper than average, while gasoline’s builds were far weaker.
x Non-OECD inventories rose in November with Chinese stocks rising by nearly 6 mb m/m, although Indian crude stocks did not build due to record refinery runs in November.
Fig 474: OECD overhang relative to 5yr avg., mb Fig 475: Total inventories relative to 5yr avg, mb
(120)
(60)
0
60
120
180
09 10 11 12 13 14 15
CrudeProducts
(125)
(75)
(25)
25
75
125
175
225
09 10 11 12 13 14 15
North AmericaEuropeAsia-Pacific
Source: IEA, Energy Aspects Source: IEA, Energy Aspects Crude Stocks well above the 5-year average, but unlike the beginning of 2015, products stocks are at above the 5-year average mainly due to increase in diesel stocks
OECD overhang relative to 5yr avg., mb

The Demand Side
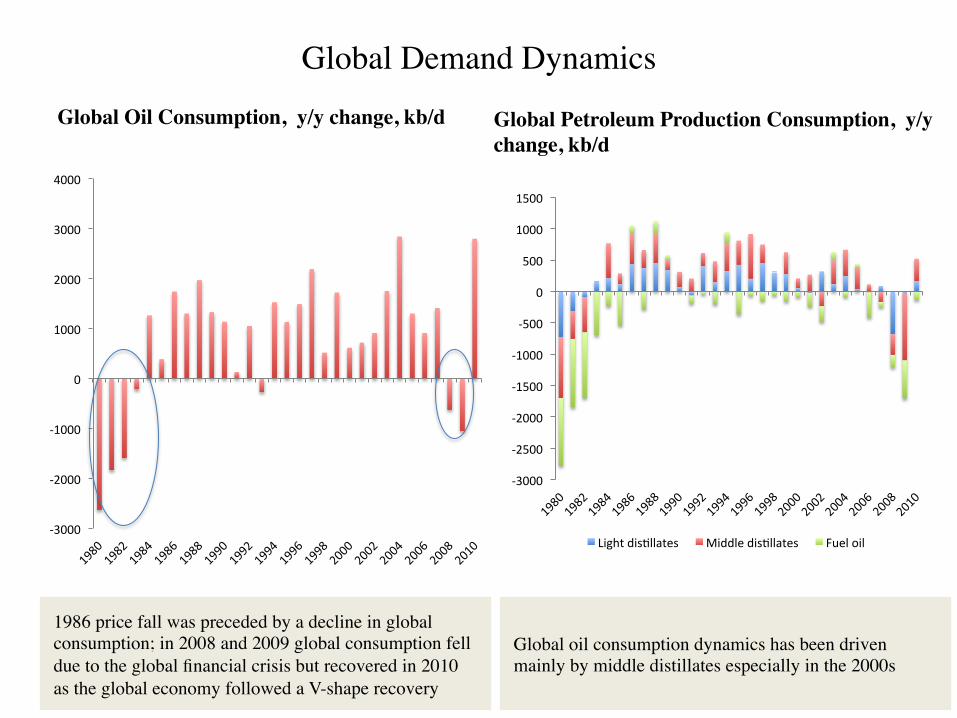
Global Demand Dynamics
-3000
-2000
-1000
0
1000
2000
3000
4000
Global Oil Consumption, y/y change, kb/d
1986 price fall was preceded by a decline in global consumption; in 2008 and 2009 global consumption fell due to the global financial crisis but recovered in 2010 as the global economy followed a V-shape recovery
-3000
-2500
-2000
-1500
-1000
-500
0
500
1000
1500
Lightdis=llates Middledis=llates Fueloil
Global Petroleum Production Consumption, y/y change, kb/d
Global oil consumption dynamics has been driven mainly by middle distillates especially in the 2000s

Oil Demand Robust and Responds to Low Oil PricesGlobal Oil Consumption, y/y change, kb/d
Oil demand has been stronger than initial expectations in 2015 driven in part by cheaper oil prices; latest data suggest growth is slowing down, but for 2016, oil demand growth is still expected to be above 1 mb/d
--
500
1,000
1,500
2,000
2,500
14Q114Q214Q314Q415Q115Q215Q315Q416Q116Q216Q316Q4
Source:EIA,EnergyAspects
(600)
(400)
(200)
--
200
400
600
800
1,000
1,200
Jan-14
Feb-14
Mar-14
Apr-14
May-14
Jun-14
Jul-1
4Au
g-14
Sep-14
Oct-14
Nov-14
Dec-14
Jan-15
Feb-15
Mar-15
Apr-15
May-15
Jun-15
Jul-1
5Au
g-15
Sep-15
Oct-15
Nov-15
Dec-15
Gasoline Diesel
Gasoline and not distillates has shown the strongest growth, especially in Asia
Gasoline and Diesel Demand, y/y

Sources of demand growth more varied and in the last two years was not about diesel
Oil Demand Growth 2015, y/y change, mb/d
Sources of demand growth have become more varied with China being an important but not the only engine of oil demand growth
0.00
0.05
0.10
0.15
0.20
0.25
0.30
0.35
0.40
0.45
0.50
US Europe MiddleEast China India OtherAsia
Source:EnergyAspects,EIA
22 Feb 2016 | Data review China oil data – Jan 2016
Page 16
Fig 23: Actual jet demand, mb/d Fig 24: Jet growth, y/y change, mb/d
0.3
0.4
0.5
0.6
0.7
11 12 13 14 15 16
(0.10)
(0.05)
0.00
0.05
0.10
0.15
0.20
12 13 14 15 16
Source: China Customs, Energy Aspects Source: China Customs, Energy Aspects
Fig 25: Gasoline vs. diesel demand, mb/d Fig 26: Gasoline vs. diesel, y/y change, mb/d
1.5
2.0
2.5
3.0
3.5
4.0
11 12 13 14 15 16
GasolineDiesel
(0.4)
(0.2)
0.0
0.2
0.4
0.6
0.8
12 13 14 15 16
Gasoline Diesel
Source: China Customs, Energy Aspects Source: China Customs, Energy Aspects
Fig 27: Jet vs. diesel, y/y change, mb/d Fig 28: Demand by product, y/y change, mb/d
(0.4)
(0.2)
0.0
0.2
0.4
0.6
12 13 14 15 16
Jet Diesel
(0.4)
(0.2)
0.0
0.2
0.4
0.6
0.8
1.0
12 13 14 15 16
Gasoline Diesel Jet
Source: China Customs, Energy Aspects Source: China Customs, Energy Aspects
China’s diesel/gasoline demand, mb/d
China’s diesel exports have jumped to a record level as demand growth for diesel slows down and topping refineries given licenses to import crude and export products

The Investment-Supply Response

Cut in Capex in Response to Fall in Oil Price been Sharp
Global Capex estimates, $ billion
Source:EnergyAspects
Region 2016E 2015E 2014A + / - %
United States 72.2 114.6 158.1 (42.3) (36.9%)
US Independents Intn. 8.5 13.6 21.0 (5.1) (37.5%)
Canada 22.4 30.1 36.8 (7.7) (25.5%)
Mexico 14.5 18.0 24.6 (3.5) (19.4%)
Asia Pacific 78.7 96.2 116.9 (17.5) (18.2%)
Majors International 77.3 95.7 107.5 (18.4) (19.3%)
Russia/FSU 37.9 33.2 43.9 4.6 13.9%
Latin America 35.7 47.8 53.2 (12.1) (25.3%)
Europe 27.6 34.5 45.1 (6.9) (19.9%)
Middle East 37.0 39.9 40.7 (2.9) (7.3%)
Africa 16.5 20.1 23.0 (3.6) (17.8%)
Other 8.0 10.7 10.4 (2.7) (25.0%)0.0 0.0 0.0
International 0.3 0.4 0.5 (0.1) (15.7%)
Global Capex 436.4 554.4 681.1 (118.0) (21.3%)
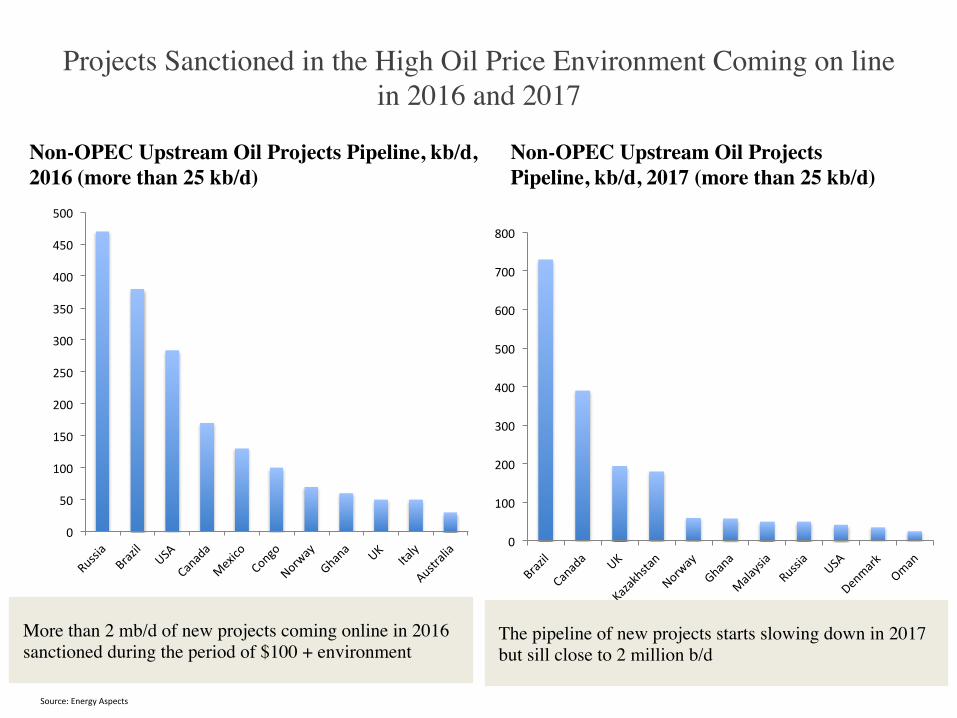
Projects Sanctioned in the High Oil Price Environment Coming on line in 2016 and 2017
0
50
100
150
200
250
300
350
400
450
500
Non-OPEC Upstream Oil Projects Pipeline, kb/d, 2016 (more than 25 kb/d)
More than 2 mb/d of new projects coming online in 2016 sanctioned during the period of $100 + environment
0
100
200
300
400
500
600
700
800
Non-OPEC Upstream Oil Projects Pipeline, kb/d, 2017 (more than 25 kb/d)
The pipeline of new projects starts slowing down in 2017 but sill close to 2 million b/d
Source:EnergyAspects

Supply is Inelastic in the Short Term with US Supply the Fastest to Respond
Key Areas of Growth in non-OPEC, y/y kb/d, 2015
In 2015, US remained main source of non-OPEC supply growth but areas of supply growth have become more varied (shale, Canadian Oil sands, Brazil deep offshore, Russia and China conventional) with different investment cycles
0
100
200
300
400
500
600
700
800
900
1000
US Brazil Russia China UK Canada Norway
Source:EnergyAspects,IEA,MEES
-400
-200
0
200
400
600
800
1000
1200
1400
2014 2015Q1 2015Q2 2015Q3 2015Q4 October NovemberDecember
US Crude Oil, y/y, kb/d
Despite efficiency gains and cutting cost and increase in production from the GOM, y/y growth has been slowing down with the EIA predicting sharp y/y declines in 2016
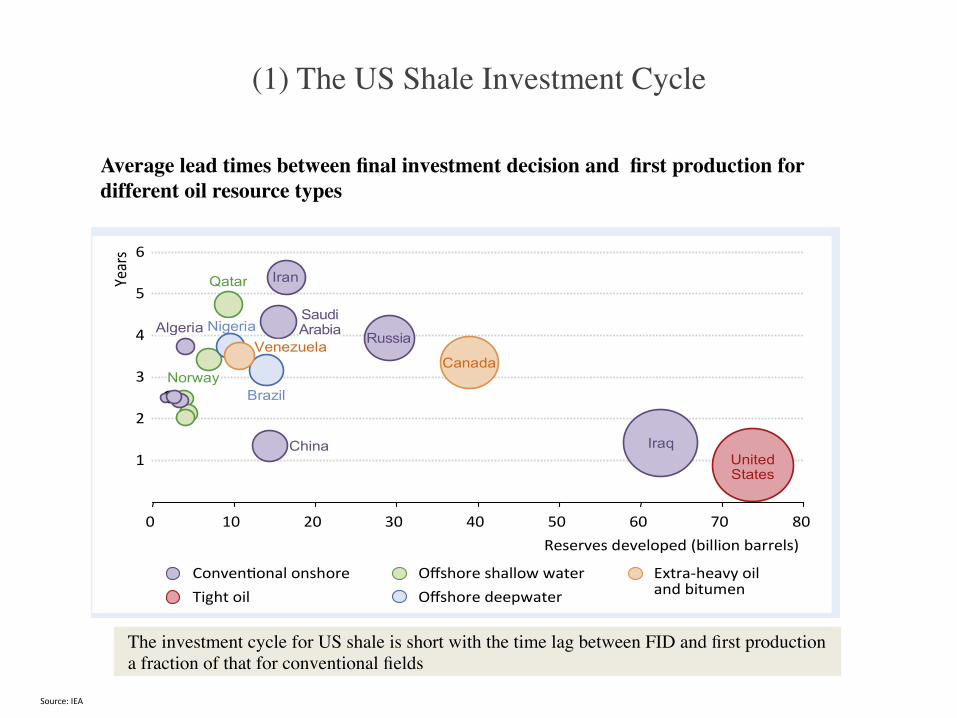
(1) The US Shale Investment Cycle
170 World Energy Outlook 2015 | Global Energy Trends
Box 4.4 ⊳ How quickly can oil supply respond to prices?
The bulk of global oil supply comes from a relatively slow-moving but high-volume development cycle, with Saudi Arabia’s spare capacity – available to be brought into production at shorter notice – ordinarily providing some flexibility to fine-tune supply. The lack of flexibility elsewhere is due to the time required to bring new resources online, a process requiring both exploration and development. The lead time between exploration activity and a development programme can span decades. The development part of the process has a more rigid timeline, but the lead times between final investment decision and first production – for most types of resources – span several years at least (Figure 4.11). This time span is unlikely to contract much further; technology and streamlined sanctioning processes can reduce the amount of time required, but these have to be set against the generally increasing level of field complexity.
Figure 4.11 ⊳ Average lead times between final investment decision and first production for different oil resource types
1
2
3
4
5
6
Reserves developed (billion barrels)
Year
s
Offshore shallow water Offshore deepwater
Conventional onshore Extra-heavy oil and bitumen Tight oil
Iran
Saudi Arabia
Qatar
Nigeria Venezuela
Canada Russia Algeria
Norway
China
Brazil
Iraq United States
0 10 20 30 40 50 60 70 80
Notes: Analysis includes the top-twenty crude oil producers in 2014. Bubble size indicates the quantity of reserves developed from 2000 to 2014. The average lead times for Iraq are brought down by three large rehabilitation projects in legacy fields, each of which was reported with one year between investment approval and the start of production. This is not a representative finding for greenfield developments in Iraq.
Source: IEA analysis based on Rystad Energy AS.
Tight oil in the United States operates on a different timeline. There is no exploration process to speak of, and the location and broad characteristics of the main plays are well known, even if the performance of wells within plays can vary dramatically. And the time from investment decision to actual production is measured in months, rather than years: an average of eight months over the period 2005-2014, compared with a resource-weighted average of three years for other sources of oil.
© O
ECD/
IEA,
201
5
Average lead times between final investment decision and first production for different oil resource types
The investment cycle for US shale is short with the time lag between FID and first production a fraction of that for conventional fields
Source:IEA

Very Different Profiles of Production and Decline Rates
Jul 2015 | In Focus Deepwater: The Golden Triangle
Page 7
Deepwater vs shale – who is the marginal barrel? Many have questioned whether the substantial investments required for the development of
deepwater projects are worthwhile, given the advent of tight oil. The development of these
differing unconventional resources is driven by companies at the opposite ends of the
spectrum. Deepwater projects are developed by IOC’s that have deep pockets and who invest for the long term. On the other hand, tight oil producers are smaller in size and have more
limited funding, and so their outlook is shorter. In order to try and answer which makes more
sense, we attempt to model and compare pre-salt wells in Brazil (primarily because good
quality data is available) to tight oil wells in the Bakken. Clearly, the comparison will be
different if deepwater wells are chosen from less prolific areas such as the Gulf of Mexico or
West Africa, so the below comparison should be used as a guide.
Production profile
We start by considering the production profiles for pre-salt Brazil and the Bakken, which in
many ways have been startlingly similar. Tight oil production from the Bakken commenced in
2007, averaging 20 thousand b/d across the year and, six-years later in 2013, output had risen
to 0.7 mb/d. Today, production stands at around 1.1 mb/d. Production from pre-salt wells
mirrored this behaviour almost exactly, only shifted by two years as the first well came online
in September 2009. After six years, in March 2015, production averaged 0.7 mb/d.
Fig 3: Bakken vs. pre-salt oil output, mb/d Fig 4: Bakken vs. pre-salt well count
0
10
20
30
40
50
0
4,000
8,000
12,000
05 07 09 11 13 15
Bakken (LHS) Pre-salt (RHS)
Note: Bakken month 1 is March 07, pre-salt is September 09
Source: BDEP, ANP, NDIC, Energy Aspects
Source: BDEP, ANP, NDIC, Energy Aspects
However, this is where the similarities end. To produce 0.7 mb/d in the Bakken, some five
thousand wells were brought online, producing at an average rate of 140 b/d. In the pre-salt,
0.7 mb/d was produced from 47 wells at an average of 15 thousand b/d. In the Bakken,
between December 2012 and March 2015, a further 4,500 wells were drilled to help
production rise by what appears to be a peak of just under 1.2 mb/d.
0
10
20
30
40
50
0
2000
4000
6000
8000
10000
12000
05 07 09 11 13 15
Bakken (LHS) Pre-salt (RHS)
Bakken vs. pre-salt well count (no of wells)
Bakken and pre-salt Brazil achieved similar production growth but the investment profile and the number of wells to achieve that growth fundamentally different
5 The contents of this paper are the author’s sole responsibility. They do not necessarily represent the views
of the Oxford Institute for Energy Studies or any of its Members.
The recognition that oil resources are probably never likely to be exhausted puts greater focus on future productivity trends when assessing the long-term outlook for oil prices. The possible implications of the US shale revolution are particularly fascinating in this regard.
The key point here is that the nature of fracking is far more akin to a standardised, repeated, manufacturing-like process, rather than the one-off, large-scale engineering projects that characterise many conventional oil projects. The same rigs are used to drill multiple wells using the same processes in similar locations. And, as with many repeated manufacturing processes, fracking is generating strong productivity gains. The strength of manufacturing productivity has led to a trend decline in the prices of goods relative to services. A fascinating question raised by fracking – and its manufacturing-type characteristics – is whether it will have the same impact on the relative price of oil. A key issue here is whether these types of repeated, standardised processes can be applied outside of the US and to more conventional types of production. Can the discipline of lean manufacturing be applied to conventional oil operations?
Revisiting Principle 2: Oil demand and supply curves are steep The limited responsiveness of conventional oil supply to price movements stems from the significant time lag between investment decisions and production. It can often take several years or more from the decision to invest in a particular field before it starts to produce oil, and once the oil is flowing, it will often last for many years.
Shale oil (and fracking) completely changes all that, in two important respects. First, the nature of the operation in which the same rigs and the same processes are used to drill many wells in similar locations means the time between a decision to drill a new well and oil being produced can be measured in weeks rather than years. Second, the life of a shale oil well tends to be far shorter than that for a conventional well: its decline rate is far steeper. Figure 3 compares production data taken from a typical US shale well, in this case in the Bakken in North Dakota, with that from a Deepwater well in the Gulf of Mexico (GOM). Daily production from the shale well declined by around 75% in its first year of production – a really steep rate of decline. The corresponding rate of decline for the GOM well was far slower.
Figure 3
These two characteristics – short production lags and high decline rates – mean there is a far closer correspondence between investment and production of shale oil. Investment decisions impact production far more quickly. And production levels fall off far more quickly unless investment in maintained.
Kboe/d
0.0
0.1
0.2
0.3
0.4
0.5
0.6
0
2
4
6
8
10
0 1 2 3 4 5 6 7
Gulf of Mexico*
Bakken Shale (right axis)
Kboe/d
Source: Wood Mackenzie Years
Sample well production profile
*Subsalt Miocene
Sample Well Production Profile
So are the decline rates which are much more prominent in the shale wells
Source:EnergyAspects,BP
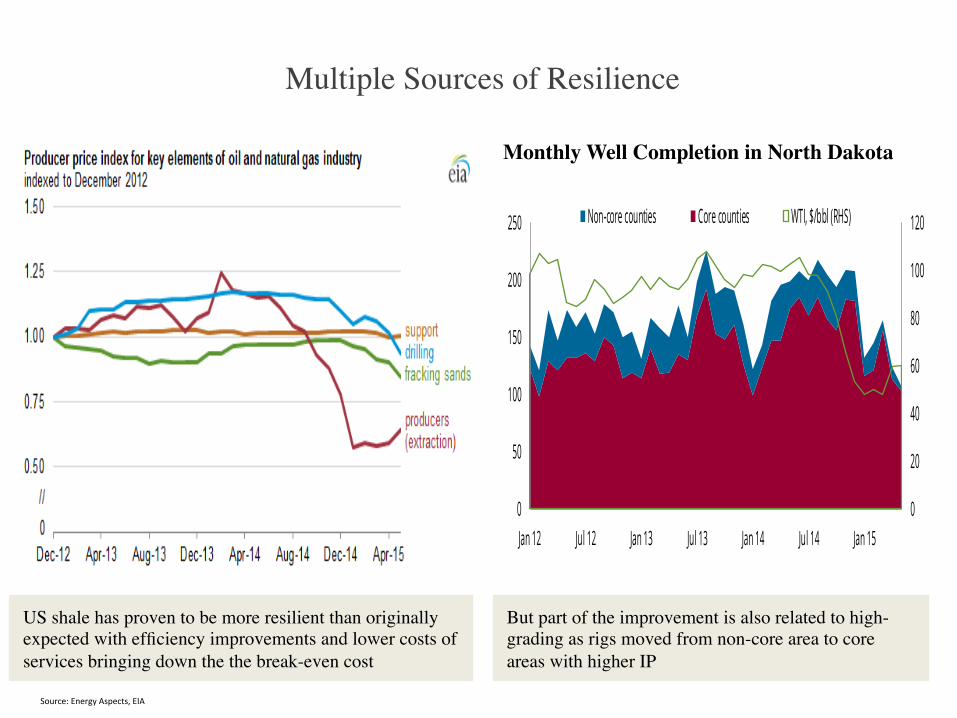
Multiple Sources of Resilience
Source:EnergyAspects,EIA
But part of the improvement is also related to high-grading as rigs moved from non-core area to core areas with higher IP
US shale has proven to be more resilient than originally expected with efficiency improvements and lower costs of services bringing down the the break-even cost
Monthly Well Completion in North Dakota
2015 | August North America Quarterly
Page 84
Fig 154: Monthly well completions in North Dakota
Source: NDIC, Energy Aspects
Intra-county high-grading has also impacted average production rates, and its effect can be measured in the production rates of new wells completed in the same county over time. Improvements in extraction processes have also significantly increased initial production (IP) rates. One newly implemented technique is slickwater fracture stimulation, which began seeing widespread use by most major producers in Q2 15. Whiting had reported 20% gains in the initial, 30-day, 60-day, and 90-day production rates from new wells utilising this technology.
Production rates have increased sharply when oil prices were at their lows at the start of 2015, indicating a widespread retreat to the best acreage. For example, the weighted-average 60-day production rate for wells completed in McKenzie increased from 490 b/d in March 2014 to 771 b/d twelve months later, a 57% increase. It is important to reiterate that these wells are producing over the highest-yielding geology, which is only a fraction of the overall basin.
Fig 155: Production rates in McKenzie wells, b/d Fig 156: Declines rates - McKenzie wells, b/d
Source: NDIC, Energy Aspects Source: NDIC, Energy Aspects
0
20
40
60
80
100
120
0
50
100
150
200
250
Jan 12 Jul 12 Jan 13 Jul 13 Jan 14 Jul 14 Jan 15
Non-core counties Core counties WTI, $/bbl (RHS)
200
400
600
800
1,000
1,200
Jan 13 Jan 14 Jan 15
IP rate 30-day rate60-day rate 90-day rate
0
300
600
900
1,200
1,500
Oct 14 Dec 14 Feb 15
WLL CLR OAS EOG

Dynamics of non-OPEC Supply
-1500
-1000
-500
0
500
1000
1500
2000
Non-OPEC FSU
Oil Production Growth, non-OPEC and FSUy/y change, kbd
Strong Non-OPEC supply growth preceding price fall in 1986 but the dynamics within non-OPEC shifting
-600
-400
-200
0
200
400
600
800
1000
19801981198219831984198519861987198819891990
Norway UK Mexico Brazil
Oil Production Growth, Selected Countriesy/y change, kbd
High cost producers such as the North Sea and Mexico with long-term investment cycles led the way but production started slowing down and eventually turned negative in key supply centers

Shocks from Credit Markets Can Impact Production
Source:EIA
Shale production has increased but activity mainly financed by debt which has risen sharply over the years
Cash flow from operations not large enough to cover to cover capex and the shortfall has been increasing over the years

(2) But non-OPEC is not only about US shale: �High Cost Producers with Long-Term Investment Cycle
Source:EnergyAspects,Petrobras,CanadianAssocia=onofPetroleumProducers
Some of the key growth centers such as Brazil are feeling the pinch. Brazil has already reduced its capex and revised downward its production target to 2.7 mb/d of liquid production by 2020
Petrobras Production Forecast, mb/d
And Canada’s oil production has been revised downward substantially as many projects get postponed or cancelled
Canada Production Forecast, mb/d

Canada and Brazil: Changing DynamicsCanada Crude Oil Production, y/y, kb/d
Canadian conventional production has been falling, but offset by the increase in oil sands production
Brazil Crude Oil Production, y/y, kb/d
Brazilian production growth has been slowing down mainly due to the decline in the production in the Campos basin
4 Mar 2016 | Data review Brazil oil data – Jan 2016
Page 3
Fig 5: Brazilian field-by-field crude production, thousand b/d
Nov Dec Jan YTD Nov Dec Jan YTD
Lula 171 327 381 442 405 405 205 208 127 127 Roncador 279 334 323 307 300 300 20 (25) (47) (47)Sapinhoá 88 182 186 172 206 206 60 24 63 63 Jubarte 160 191 201 198 173 173 21 11 (19) (19)Marlim 183 186 176 204 157 157 (12) 6 (43) (43)Marlim Sul 243 163 148 150 146 146 (59) (59) (38) (38)Marlim Leste 119 100 98 96 96 96 (17) (14) (13) (13)Peregrino 75 72 76 93 73 73 -- 19 3 3 Albacora Leste 52 59 70 67 65 65 13 11 7 7 Barracuda 88 78 73 68 61 61 16 (18) (19) (19)Others 368 327 276 366 257 257 (85) 10 (88) (88)
Total 1,826 2,021 2,008 2,163 1,939 1,939 162 173 (67) (67)
2014 20152015/16 actuals y/y change
Source: ANP, Energy Aspects
Fig 6: Campos vs. Santos y/y change, mb/d Fig 7: y/y change, top producing fields, mb/d
(0.3)
(0.1)
0.1
0.3
0.5
12 13 14 15 16
Campos Santos
(0.2)
0.0
0.2
0.4
12 13 14 15 16
Marlim Sul RoncadorMarlim JubarteLula Marlim Leste
Source: ANP, Energy Aspects Source: ANP, Energy Aspects
17 Mar 2016 | Data review Canada oil data – Jan 2016
Page 4
Production Fig 6: Production by product type, mb/d Fig 7: Production by product type, y/y chg., mb/d
0.9
1.2
1.5
1.8
2.1
2.4
2.7
3.0
10 11 12 13 14 15 16
Oil sands Conventional
(0.4)
(0.2)
0.0
0.2
0.4
0.6
10 11 12 13 14 15 16
Oil sands Conventional
Source: Statistics Canada, Energy Aspects Source: Statistics Canada, Energy Aspects
Fig 8: Light / Heavy split, mb/d Fig 9: Light / Heavy split, y/y change, mb/d
0.7
1.1
1.5
1.9
2.3
10 11 12 13 14 15 16
Light Heavy
(0.2)
0.0
0.2
0.4
0.6
10 11 12 13 14 15 16
Heavy Light
Source: Statistics Canada, Energy Aspects Source: NEB, Energy Aspects
Fig 10: Canada rigs, y/y change Fig 11: Inventories, mb
(300)
(200)
(100)
0
100
200
300
10 11 12 13 14 15 16
105
110
115
120
125
130
Jan Mar May Jul Sep Nov
2016 2015 5yr avg.
Source: Baker Hughes, Energy Aspects Source: Statistics Canada, Energy Aspects
Source:EnergyAspects

(3) The ME-OPEC Investment Cycle
Barclays | Iraq
10 September 2015 3
exports. In the short term, Iraqi output is susceptible to the winter loading problems that have cut output by 300-500 kb/d in the past few years. Port facilities are still problematic because there are insufficient tug boats to drag the oil tankers. Storage has been added in Fao, Ratawi, and Tuba, totalling about 14 mb from 4 mb in January, according to the Iraq Oil Report. However, the loading facilities and the single-point mooring systems remain insufficient for the winter season, and they will be especially challenged at current production levels.
Given these constraints, we do not believe such rapid growth is sustainable in the medium term. Increased water reinjection needs, human capacity constraints, heightened costs, capex cuts and logistical bottlenecks will constrain production and export gains during the next couple years, in our view. In recent months, IOCs have revised their volume targets lower in agreement with the Ministry of Oil by 4 mb/d over the next 10-15 years, reducing the production target from about 11 mb/d to about 7 mb/d, reflecting some of these pressures (Figure 4). The fight against ISIS, which does not appear to be ending any time soon, has exacerbated the government’s inability to pay IOCs. This summer, protests have blocked access to work sites at Rumaila and West Qurna. Rumaila has had its output target for 2016 cut 150 kb/d due to capex being reduced from $3.5bn to $2.5bn. This means essentially flat output y/y next year. Net of declines, we expect oil production to increase by slightly more than 500 kb/d to 4.5 mb/d by 2020. This is 1.5 mb/d below the Ministry of Oil’s target of 6 mb/d and slightly below IEA estimates of 800 kb/d of growth (Figure 5).
Fiscal adjustment prospects are highly uncertain The expected improvement in Iraq’s fiscal position stated in the IMF RFI agreement and endorsed by the authorities hinges on two critical factors: the ramp up in oil export volumes as of 2016; and continued fiscal adjustment leading to a surplus in 2019, according to the IMF’s RFI document. As discussed above, we have major concerns about the country’s ability to increase its production beyond 4.5 mb/d by 2020 in the current security environment, while the IMF and the authorities project a more ambitious path to production reaching 5.5 mb/d by 2020 up from their estimates of 3.4 mb/d in 2015. Accordingly, we expect a lower growth acceleration path beyond 2016 (Figure 6) predicated on slower oil output/export expansion, and more constrained non-oil sector growth given planned cuts to investment spending, continued political and security threats and tighter bank liquidity.
This increase is unlikely to be sustained due to financial and infrastructural bottlenecks Oil companies’ targets were revised downwards by 4 mb/d We do not foresee oil production exceeding 4.5 mb/d by 2020
FIGURE 4 Production targets revised down by 4 mb/d…
FIGURE 5 … leading to far less output by 2020 than originally hoped
Source: Iraq Oil Report, Reuters, Platts, Barclays Research Source: IEA (historical), Barclays Research (forecast)
The IMF predicates fiscal improvements on rising oil exports and implementation of fiscal reforms We think the IMF’s oil export path is over optimistic
Field Operator New Plateau
Was Finalized?
West Qurna-1 ExxonMobil 1.6 2.825 Yes
Zubair Eni 0.85 1.2 Yes
West Qurna-2 Lukoil 1.2 1.8 Yes
Rumaila BP 2.1 2.85 Yes (July ‘14)
Halfaya PetroChina 0.4 0.535 Yes (July ‘14)
Majnoun Shell 1-1.2 1.8 decision delayed to 2017
Gharaf Petronas unknown 0.23 No
Total *7.15-7.35 11.24 0.0
0.5
1.0
1.5
2.0
2.5
3.0
3.5
4.0
4.5
5.0
2010 2012 2014 2016 2018 2020
mb/d Iraq Oil Production
Rumaila Qurna 1 & 2 Zubair Other South KRG NOC
Iraq Rig Count
Iraqi rig count has halved with government facing serious fiscal pressures
Under fiscal pressures, Iraqi government has been forced to revise downwards it production target negotiating with oil companies new plateaus
40
50
60
70
80
90
100
Jul-1
3
Sep-13
Nov-13
Jan-14
Mar-14
May-14
Jul-1
4
Sep-14
Nov-14
Jan-15
Mar-15
May-15
Jul-1
5
Sep-15
Source:Barclays,BakerHughes

Key Questions
• Has the nature of the investment cycle in the oil sector changed?
• Has US shale taken the cyclicality element from the oil market?
• Does more varied investment cycles induce more or higher volatility in the price?
• Does it make the supply chain more resilient to decline in the oil price?
• Are cost curves still relevant in this new oil price environment?
• Where does the marginal barrel lie in the current oil market structure?

Instability in Market Expectations about Long-Term Oil Price?
Source:EnergyAspects
21 Mar 2016 In a rush
Page 25
Forward curves and trading ranges Fig 37: Brent forward curve, $/barrel Fig 38: Brent forward curve, $/barrel
27
32
37
42
47
52
57
1 2 3 4 5 6
Current
1 week ago
1 month ago
10
30
50
70
90
110
130
1 2 3 4 5 6
Current 1 year ago2 years ago 3 years ago4 years ago 5 years ago
Source: Datastream, Energy Aspects Source: Datastream, Energy Aspects
Fig 39: WTI forward curve, $/barrel Fig 40: WTI forward curve, $/barrel
26
30
34
38
42
46
50
54
1 2 3 4 5 6
Current1 week ago1 month ago
15
40
65
90
115
1 2 3 4 5 6
Current 1 year ago2 years ago 3 years ago4 years ago 5 years ago
Source: Datastream, Energy Aspects Source: Datastream, Energy Aspects
Fig 41: Brent trading range last 14 days, $/barrel Fig 42: WTI trading range last 14 days, $/barrel
34
36
38
40
42
44
1 2 3 4 7 8 9 10 11 14 15 16 17 18
31
33
35
37
39
41
43
1 2 3 4 7 8 9 10 11 14 15 16 17 18
Source: Reuters, Energy Aspects Source: Reuters, Energy Aspects
WTI forward curve, $/barrel
Parallel movements in the price curve and instability in market expectations; what does the back end of the price curve reflect?
21 Mar 2016 In a rush
Page 25
Forward curves and trading ranges Fig 37: Brent forward curve, $/barrel Fig 38: Brent forward curve, $/barrel
27
32
37
42
47
52
57
1 2 3 4 5 6
Current
1 week ago
1 month ago
10
30
50
70
90
110
130
1 2 3 4 5 6
Current 1 year ago2 years ago 3 years ago4 years ago 5 years ago
Source: Datastream, Energy Aspects Source: Datastream, Energy Aspects
Fig 39: WTI forward curve, $/barrel Fig 40: WTI forward curve, $/barrel
26
30
34
38
42
46
50
54
1 2 3 4 5 6
Current1 week ago1 month ago
15
40
65
90
115
1 2 3 4 5 6
Current 1 year ago2 years ago 3 years ago4 years ago 5 years ago
Source: Datastream, Energy Aspects Source: Datastream, Energy Aspects
Fig 41: Brent trading range last 14 days, $/barrel Fig 42: WTI trading range last 14 days, $/barrel
34
36
38
40
42
44
1 2 3 4 7 8 9 10 11 14 15 16 17 18
31
33
35
37
39
41
43
1 2 3 4 7 8 9 10 11 14 15 16 17 18
Source: Reuters, Energy Aspects Source: Reuters, Energy Aspects
WTI forward curve, $/barrel
Shape of the curve in contango reflecting the fact that storage over-ground is needed

The Investment and Surplus Capacity Question• Large size of its reserve base, relative
low cost of developing reserves and stable investment environment, SA can decide on how fast to develop its reserves affecting future supplies and size of spare capacity
• But spare capacity needed to control the market on the upside and stabilize expectations about a long-term price
• Willingness to be more pro-active in
rising market?
• Tools available to control the price on the upside?
Source:GS
October 9, 2015 Top 420 Spotlight
Goldman Sachs Global Investment Research 9
a sizeable buffer of spare capacity. During the period from 1995 to 2002, the buffer stayed at a healthy 1.1 mn bpd to 2.4 mn bpd, or around 2.0%-3.0% of global production. However, 2002-2007 saw strong demand growth driven by emerging market strength, which necessitated production growth causing the buffer to shrink in the 2003-2007 time period to between 0.6 to 1.2 mn bpd or 0.8-1.6% of global production.
Given that tightness in the oil market, Aramco announced in 2007 a long-term plan to increase production capacity to 12 mn bpd. This started major field developments including Khurais, Khursaniyah, Shaybah, Manifa and Nuayyim.
Saudi Aramco reached its production capacity target of 12 mn bpd in 2009.
Exhibit 12: Saudi has consistently maintained spare production capacity over the years in order to act as a balancing force for the global crude markets Saudi Arabia’s crude production, spare capacity and maximum sustainable production capacity
Source: Saudi Aramco, IEA, Goldman Sachs Global Investment Research.
Above-ground decisions key: Investment levels more than geology to drive production outlook; Shale reduces value of spare capacity
With a reserve base of around 267 bn barrels and recent oil and NGL production of around 11.5 mn bpd, Saudi Arabia has a reserve life of about 64 years. Given such a large reserve life, Saudi Arabia is able grow production, if it chooses to, but more important, if it is willing to commit capital to it. There is room to grow production given its stated capacity of 12.0 mn bpd (excluding the Neutral Zone).
The Neutral Zone is the undivided portion of land between Kuwait and Saudi Arabia, where the two countries share production equally. Chevron manages production for the two countries in the Neutral Zone. Recently, production in the Neutral Zone has been halted, owing to a dispute between the two Gulf countries. Based on data provided by OPEC, Saudi Arabia’s interest in the Neutral Zone’s production and production capacity is estimated to be 250K bpd.
Plentiful short-cycle US shale resource reduces importance of retaining meaningful spare capacity The major shift in the oil market in recent years is the emergence of US shale oil as a second short-term supply response mechanism to complement OPEC spare capacity. With
0.0
2.0
4.0
6.0
8.0
10.0
12.0
14.0
cap
acit
y/p
ro
du
cti
on
(m
n b
pd
)
Spare capacity (mn bpd)
Saudi crude production (mn bpd)
Saudi max. sustainable production capacity (mn bpd)
Saudi Arabia Surplus Production, mb/d

OPEC Dynamics

Saudi Arabia and the Role of the Swing Producer
Source:BP,OPEC
In 1998, SA reacted by increasing production and did cut output but only after agreement with other OPEC and non-OPEC members has been reached; took long time to forge such an agreement
Saudi Arabia not willing to cut output unilaterally; shaped by the mid 1980s events when its attempt to protect the price resulted in loss of large volumes of production and market share
-
2000
4000
6000
8000
10000
12000
14000
Saudi Arabia Oil Production, mb/d Saudi Arabia production vs Quota (000 b/d)

Bringing Back Iraq and Iran into the quota System Challenging
Source:EnergyAspects,MEES
How much and how fast can Iran increase its export is a major source of uncertainty facing Saudi Arabia and the wider market
In 2015, Iraq, a low cost producer, has been the major source of supply growth adding more than 650,000 b/d
Iraq Oil Production, mb/d Iran Oil Production, mb/d
2015 | December issue Fundamentals
Page 27
OPEC crude oil output
Fig 37: Saudi Arabian oil output, mb/d Fig 38: Iraqi oil output, mb/d
8
9
10
11
10 11 12 13 14 15 16
2.0
2.4
2.8
3.2
3.6
4.0
4.4
10 11 12 13 14 15 16
Source: IEA, EIA, Reuters, Bloomberg, Platts, Energy Aspects Source: IEA, EIA, Reuters, Bloomberg, Platts, Energy Aspects
Fig 39: Iranian oil output, mb/d Fig 40: Kuwaiti oil output, mb/d
2.5
3.0
3.5
4.0
10 11 12 13 14 15 16
2.1
2.3
2.5
2.7
2.9
3.1
10 11 12 13 14 15 16
Source: IEA, EIA, Reuters, Bloomberg, Platts, Energy Aspects Source: IEA, EIA, Reuters, Bloomberg, Platts, Energy Aspects
Fig 41: UAE oil output, mb/d Fig 42: Venezuelan oil output, mb/d
2.0
2.2
2.4
2.6
2.8
3.0
10 11 12 13 14 15 16
2.0
2.2
2.4
2.6
2.8
10 11 12 13 14 15 16
Source: IEA, EIA, Reuters, Bloomberg, Platts, Energy Aspects Source: IEA, EIA, Reuters, Bloomberg, Platts, Energy Aspects

Optimum Strategy in Face of Uncertainty: �The Elasticity of the US Shale Supply Curve
The Dynamics of the Revenue Maximization–Market Share Trade-Off: Saudi Arabia’s Oil Policy in the 2014–2015 Price Fall
13
their output without any possibility of substitution (-A is the highest level of loss that players make when they lose both their market share and revenue).17 B is a modest gain players make from a successful production cut of other players (-B is a moderate loss to due to a production cut in presence of falling market and possibility of substitution). C is the lowest gain players make from the successful production cut of its own (-C is the lowest loss due to production cut in presence of a falling market and substitution).
Table 2: Optimum strategy in the short run (falling market)
Elastic US supply (game 1)
Inelastic US supply (game 2)
Other-OPEC members cut output
Other-OPEC members do not change output
Other-OPEC members cut output
Other-OPEC members do not change output
SA cuts output
-C, -C
-A, 0
SA cuts output
A, A
C, B
SA does not change output
0, -A
0, 0
SA does not change output
B, C
0, 0
As seen from the table, when shale oil supply curve is highly inelastic (game 2) there is a strictly dominant strategy for the Kingdom. In the short-term, Saudi Arabia benefits from an output cut irrespective of the behavior of other players. There is also a dominant strategy for other suppliers: cutting output leaves them a level of gain higher than inaction, no matter what Saudi Arabia does. Therefore, under game (2), there is a single optimal strategy profile – Saudi Arabia should opt for an output cut with or without coordination from other members.
In similar manner, when shale oil supply curve is highly elastic (game 1) there is a dominant strategy both for Saudi Arabia and other players. Saudi Arabia would be better off not changing its output, irrespective of the behavior of other players. The same applies to other players. Thus, the game has a single optimal strategy: no player changes its output level because it loses both its market share and revenue.
The problem is at the time of decision there is no information available to the players regarding the elasticity of shale oil supply curve. Put another way, there is no way for the players, including Saudi Arabia, to find out which game they are in a priori. In fact, whether they are in game (1) or (2) will only be revealed after the players have implemented their strategy. If the players knew in advance which game they are in, then the problem would be simple. This is because each player can play their optimal strategy and, due to presence of a unique equilibrium under both games, an efficient outcome would be achieved. However, due to uncertainty the players are exposed to significant risk because four different possibilities exist:
17 This assumes that Saudi Arabia’s decision to cut output will have an immediate impact on price and hence on revenues. In practice, there may be lags between the time an announcement of a cut is made and the time the price responds to such news. This would depend on market conditions and whether market participants consider the announcement of a cut as credible signal or ‘cheap talk’. Furthermore, it is not always clear how the market will initially react to the announcement of an output cut (see for instance, Fattouh, 2008). This could add a further layer of uncertainty to the game. For simplicity, we assume that the output cut will be successful in raising the price.
The Dynamics of the Revenue Maximization–Market Share Trade-Off: Saudi Arabia’s Oil Policy in the 2014–2015 Price Fall
14
i.) Saudi Arabia might be in game (1) and plays as if it is in game (1)
ii.) Saudi Arabia might be in game (1) but plays as if it is in game (2)
iii.) Saudi Arabia might be in game (2) but plays as if it is in game (1)
iv.) Saudi Arabia might be in game (2) and plays as if it is in game (2)
In order to show how the decision is made under uncertainty, we depict the tree diagram of the game in Figure 4. It is clear from the diagram that if Saudi Arabia is in game (1) (elastic shale oil supply) and plays the optimal strategy of game one (no change in the output) the payoff would be zero. However, if Saudi Arabia plays the optimal strategy of game (2) (cutting output assuming inelastic shale oil supply) while in fact it is in game (1), the Kingdom incurs the biggest loss which is -A (losing both market share and revenue). Similarly, if Saudi Arabia is in game (2) and plays as if it is in game (1), the Kingdom makes a moderate gain B. But if Saudi Arabia plays as it is in game (2) the payoff is highest which is A.
Taking all four different possibilities into account, we can calculate the expected payoff of playing optimal strategy of game (1) in presence of full uncertainty about the game as: Exp[P(game1)]= 0.5 (0) +0.5 (B) =0.5B. Likewise the expected payoff of playing the optimal strategy of game (2) under uncertainty is: Exp[P(game2)]=0.5(A) +0.5(-A) =0. As the expected payoff of playing the optimal strategy of game (1) is strictly higher than the expected payoff of playing the optimal strategy of game (2), it is always better for Saudi Arabia to assume that it is in game (1) as long as there is no information available a priori. In other words, under uncertainty it is always safer for the Kingdom to assume that shale oil supply is elastic. As we saw in game (1) the optimal strategy under elastic shale oil is “no change in output”. This might be one of the reasons Saudi Arabia did not agree with a production cut in OPEC meeting in November 2014. This situation exists until the oil market transmits new information regarding the uncertainty to which the Kingdom can react and adjust its strategy accordingly.
Figure 4: Tree diagram of the whole game in presence of uncertainty induced by US shale oil
For example, in hindsight, the current downward phase of the cycle has revealed some interesting features regarding US tight oil production worth highlighting:
x The US tight oil industry is highly responsive to low oil prices as reflected in the sharp fall in the number of rigs and the large cuts in capital expenditure announced by the US shale producers;
x But the relationship between the fall in the number of rigs and the fall in production is not linear and is affected by factors such as efficiency gains, the ability of shale producers to renegotiate contracts with service providers, and high grading (i.e. shifting rigs into more productive areas or sweet spots). During the downturn, US shale producers have shown the ability to achieve strong
Under complete information about shale response in a rising price environment, there is a single and efficient solution to the game
Under uncertainty about US shale response, it is better off for Saudi Arabia to assume that shale supply curve is elastic and not to cut production (the losses are even larger if other OPEC members don’t cut and US supply proves to be elastic )

Pursue a Market Share Strategy
Source:EnergyAspects,EIA
In the absence of agreement on cuts and the wide range of uncertainties, Saudi Arabia is seeking to maintain market share and to keep exports above 7 mb/d; in winter, exports could jump
Saudi Arabia Oil Exports, mb/d
Saudi Arabia has succeeded in maintaining its share in key markets in Asia in face of very tough competition
For questions or support, contact
+44 20 3322 4100 | +1 (646) 606-2900 | +65 3158 9990 [email protected]
Oil & Oil Products
17 Mar 2016 | Data review
Middle East oil demand – Jan 2016 Middle Eastern oil demand rose y/y by 0.17 mb/d in January to 5.91 mb/d, despite Saudi Arabian demand being unchanged on the year, at 2.15 mb/d. Much of the growth stemmed from Iraq, where oil demand increased y/y for the eighth straight month, by 35 thousand b/d to 0.61 mb/d in January. Consumption also rose in the UAE, Kuwait, Oman, and Qatar, where demand rose by a collective 0.1 mb/d y/y. In Saudi Arabia, strong growth in transportation fuels (up by 0.10 mb/d collectively across gasoline, jet fuel and diesel, with gasoline demand particularly strong at 0.6 mb/d) was offset by weakness in fuel oil, which fell y/y by 91 thousand b/d, as cooler weather (CDDs lower y/y by 5%) resulted in lower power generation. Indeed, even direct crude burn rose by y/y by just 17 thousand b/d. Iranian demand was higher y/y by 26 thousand b/d (1.5%), the first increase in three months. Diesel demand totalled 0.56 mb/d, higher y/y by 23 thousand b/d (4%) while gasoline demand continues to surge, higher y/y by 76 thousand b/d (18%) to a record high, breaching 0.5 mb/d for the first time ever. Fuel oil demand, however, remains weak, as natural gas continues to make inroads into power generation. Consensus estimates peg 2016 Iranian GDP growth at roughly 5%, up from 2% in 2015, which should help oil demand rise y/y by at least 0.1 mb/d.
Refinery runs remained flat m/m at 7.26 mb/d in January, as increases in Saudi (up by 0.16 mb/d m/m to nearly 2.5 mb/d) were offset by lower runs in the UAE, Kuwait, and Oman. These included an unplanned outage at the Ruwais refinery in the UAE, as well as works at Orpic’s Sohar refinery in Oman. February runs remained unchanged, though runs are set to fall below 7.0 mb/d in March as planned works at the Ruwais refinery will see it out of action for 45 days.
Fig 1: Saudi crude exports, mb/d Fig 2: Saudi crude inventories, mb
6.2
6.6
7.0
7.4
7.8
8.2
Jan Mar May July Sep Nov
2016 20152014 2012
240
260
280
300
320
340
Jan Mar May July Sep Nov
2016 20152014 5 yr avg
Source: JODI, Energy Aspects Source: JODI, Energy Aspects

Competition in the Products MarketsSaudi Diesel Output, mb/d
Saudi diesel output has been on the rise as most of the new refineries are diesel biased
Source:EnergyAspects,JODI
17 Mar 2016 | Data review Middle East oil demand – Jan 2016
Page 6
Fig 21: Middle East refined products output, thousand b/d
Gasoline YoY Ch. Diesel YoY Ch. Fuel oilYoY Ch.
Kero-sene
YoY Ch.
Total YoY Ch.
2013 1,002 22 1,178 (15) 949 10 707 (20) 6,442 242014 986 (16) 1,244 65 943 (6) 734 27 6,290 (152)2015 1,067 81 1,487 243 905 (39) 759 24 6,643 353
2015 to Jan 1,033 (16) 1,308 82 900 (254) 737 (3) 6,197 (420)2016 to Jan 1,130 97 1,711 403 908 8 695 (42) 7,008 811
Q2 '15 1,041 82 1,428 217 947 (16) 767 34 6,679 356Q3 '15 1,118 162 1,525 233 909 12 772 30 6,839 633Q4 '15 1,109 75 1,669 371 847 (61) 734 19 6,740 587
Nov '15 1,055 63 1,555 295 816 (89) 794 127 6,522 499Dec '15 1,130 82 1,802 487 922 15 648 (69) 7,048 877Jan '16 1,130 97 1,711 403 908 8 695 (42) 7,008 811
Note: UAE numbers are EA estimates.
Source: JODI, Energy Aspects
Fig 22: Total refined products output, mb/d Fig 23: Fuel oil output, mb/d
5.4
5.8
6.2
6.6
7.0
7.4
Jan Mar May Jul Sep Nov
2016 2015 5yr avg.
0.7
0.8
0.9
1.0
1.1
1.2
Jan Mar May Jul Sep Nov
2016 2015 5yr avg.
Source: JODI, Energy Aspects Source: JODI, Energy Aspects
Fig 24: Diesel output, mb/d Fig 25: Gasoline output, mb/d
1.0
1.2
1.4
1.6
1.8
2.0
Jan Mar May Jul Sep Nov
2016 2015 5yr avg.
0.7
0.8
0.9
1.0
1.1
1.2
Jan Mar May Jul Sep Nov
2016 2015 5yr avg.
Source: JODI, Energy Aspects Source: JODI, Energy Aspects Saudi Arabia’s exports of diesel has increased in recent
months with the country turning from net importer to a net exporter of diesel in many months
2015 | September issue Middle East Quarterly
Page 9
gasoline deficit has been pared to around 70 thousand b/d (see Fig 6) and will fall further in H2
15 now Yasref has reached full capacity. During the commissioning phase, many shipments
from the Yasref refinery stayed within the Middle East, partly because they could not meet
more stringent quality standards. By June the refinery was producing diesel that reportedly
met European summer specifications and cargoes started to regularly head into that market.
Fig 5: Saudi net diesel exports, mb/d Fig 6: Saudi net gasoline exports, mb/d
Note: Imports-exports, positive = net exports
Source: JODI, Energy Aspects
Note: Imports-exports, positive = net exports
Source: JODI, Energy Aspects
UAE balances do not yet show a significant change given the Ruwais ramp up schedule and
start-up problems, but once it hits full capacity we expect average UAE diesel exports to rise to
around 85 thousand b/d, from an average of 15 thousand b/d in 2014, and gasoline exports to
exceed 90 thousand b/d from negligible levels in 2014. Meanwhile, although Iraq has lost
significant processing capacity y/y, demand has also been disrupted by the Islamic State
advance. As a result, balances for most products are largely unchanged apart from fuel oil,
where the closure of Baiji has reduced the country’s net surplus by around 70 thousand b/d y/y in H1 15.
Changing trade flows hurt Asia the most
The largest impact of these changing trade flows is undoubtedly on Asian export refineries.
Their export markets in the Middle East are shrinking, with Saudi Arabia and the UAE reducing
their own imports and able to supply more of the needs of neighbouring countries. The new
Middle Eastern plants are also better located to supply both Europe and the East African
market, effectively closing the arbitrage window for Asian refineries to send products west into
these markets. All of this is likely to hit Indian export refineries particularly hard, along with
other Asian exporters such as South Korea and Japan.
Product exports also flow directly from the MENA region to Asia, and the new refining capacity
is contributing to growth in these volumes. OPEC members in the Middle East and North Africa
are sending a combined 2.71 mb/d of petroleum products in 2014 according to the OPEC
Secretariat, up from 2.40 mb/d in 2011. At present the majority of this is dirty products, along
with around 0.7 mb/d of naphtha and some jet fuel. Middle Eastern product exporters hope to
boost the volumes of other clean products being sent into Asian markets.
(0.3)
(0.2)
(0.1)
0.0
0.1
0.2
0.3
0.4
09 11 13 15(0.2)
(0.1)
0.0
0.1
09 11 13 15
Saudi net diesel exports, mb/d

Different Thresholds of Pain

Fiscal buffers are large especially when compared to previous cycles
Fiscal buffers are large in some countries such as Saudi Arabia but foreign assets have fallen sharply in the first part of 2015
GCC government debt as a % of GDP is one of lowest in the world in countries like Kuwait and Saudi Arabia and hence the capacity to borrow is large
Saudi Net foreign Assets, Billion of US$ GCC Debt, % of GDP
2015 | December issue Middle East Quarterly
Page 21
has also been tapping the local debt market. By 2020, the IMF projects the ratio of gross debt to GDP will reach 44% from the low level of 1.5% in 2014. But this would still be a low ratio compared to many western economies and relative to the Saudi debt levels at the start of the last decade before oil prices began to rise dramatically.
Fig 19: Saudi net foreign reserves, $ bn Fig 20: Saudi debt/GDP ratio, IMF forecast, %
500
600
700
800
12 13 14 15
0
20
40
60
80
100
00 04 08 12 16 20
Forecast
Source: SAMA, Energy Aspects Source: IMF, Energy Aspects
If prices stay low, the government will have to cut expenditure
If the low oil price environment persists, the Saudi government will have little choice but to adjust its expenditure outlays, which have risen at a fast rate in the last decade. Between 2004 and 2014, current expenditure almost trebled. Capital expenditure grew even faster, by almost ten times during this period. Buoyed by high oil prices, Saudi Arabia has increased its spending on capital projects to upgrade and build new infrastructure. The Saudi government has embarked on an ambitious public investment programme—airport, metro, road and railway infrastructure—and other projects (e.g. refining and petrochemical plants) to try and diversify its economy. As a result, capital expenditure had risen to more than 33% of total expenditure in 2014, from 13% in 2004.
Fig 21: Saudi current expenditure, $ bn Fig 22: Saudi capital expenditure, $ bn
0
50
100
150
200
250
04 06 08 10 12 14
0%
10%
20%
30%
40%
50%
0
20
40
60
80
100
120
04 06 08 10 12 14
Capital expenditure (LHS)% of total (RHS)
Source: Ministry of Finance, Energy Aspects Source: Ministry of Finance, Energy Aspects
Source:SAMA,IMF
4. FISCAL ADJUSTMENT TO LOWER OIL PRICES IN MENA AND CCA OIL EXPORTERS
77
Box 4.2
Developing and Deepening Local Currency Debt Markets in the GCCThe choice of how fiscal deficits are financed could provide an opportunity for CC countries to develop their local debt markets, including sovereign issuance of long-term Islamic instruments. Developing deep and li uid domestic debt markets can strengthen the resilience of these economies to adverse shocks, facilitate the conduct of monetary policy by improving the monetary transmission mechanism and the implementation of Basel III li uidity norms, and help advance diversification agendas by expanding the availability of long-term financing. An actively traded government bond market in the CC region could provide a base from which to price local currency corporate bonds and help address maturity mismatches that restrict long-term bank lending.The CC countries domestic debt markets are at an early stage of development and much needs to be done to advance the agenda (Figure 4.2.1). The domestic corporate bond market is almost nonexistent. In uly 2015, Saudi Arabia, for example, issued its first sovereign bonds since 2007 to local banks to finance its fiscal deficit, and Oman and uwait are planning a Sukuk issuance. That said, the local currency debt issuance in the CC countries has yet to translate into ade uate secondary market li uidity, and only atar has made systematic progress in the development of its government securities market in recent years (Figure 4.2.2).Establishing a li uid and well-functioning market for long-term government and corporate debt re uires proactive and coordinated efforts from government, central banks, other regulatory bodies, and market participants. ey steps and conditions include: Initially concentrating on developing the short end
of the yield curve by building a li uid Treasury bill market where issuances are backed by li uidity forecasting with a transparent price-clearing mechanism.
Achieving a diversified domestic and foreign institutional investor base (including pension, insurance, and mutual funds) that can shift financial intermediation from banks to capital markets by increasing the demand for long-term financial assets.
Creating an efficient institutional infrastructure including a credible rating system, good corporate governance standards, transparency in reporting re uirements, and the adoption of international accounting standards to help foster market discipline.
Make pricing transparent and improve microstructures such as effective trading mechanisms, and custody and settlement systems to enhance li uidity and efficiency, while reducing trading costs and volatility.
Prepared by Prasad Ananthakrishnan.
Figure 4.2.1
Domestic Debt Issuance by NonfinancialCorporations, 2014(Percent of GDP)
Sources: National authorities; and IMF staff estimates.
United
States
0
4
8
12
16
20
Bahrain
Oman
Qatar
Kuwait
United
Arab Em
irates
Saud
i Arabia
Switz
erlan
dIta
ly
German
y
United
King
dom
Spain
Fran
ce
Figure 4.2.2
GCC Government Domestic Debt Stocks, 2015
Sources: National authorities; and IMF staff estimates.Note: Debt stock is composed of Treasury bills and government bonds;2015 data are last month available.
0
10
20
30
40
50
Bahrain Kuwait Oman Qatar Saudi Arabia
United ArabEmirates
Percent of GDP Billions of U.S. dollars

Cutting Energy Subsidies
In GCC countries (with exception of Kuwait) gasoline and diesel prices have been raised though these remain the cheapest in the region and in the world
Source:MEES

Geopolitics and Oil Price
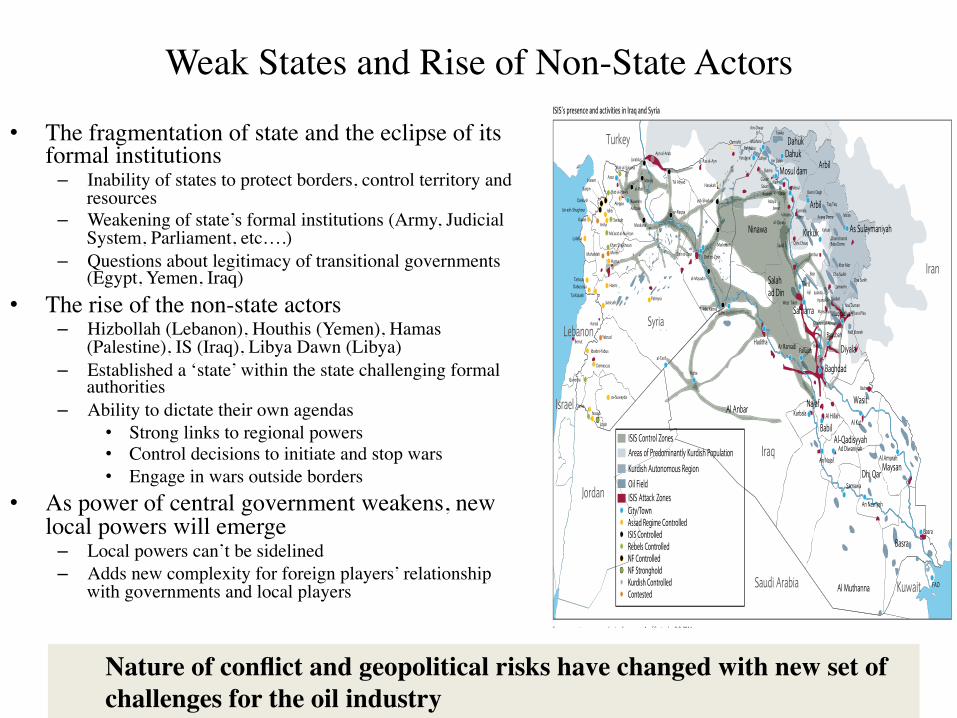
Weak States and Rise of Non-State Actors
• The fragmentation of state and the eclipse of its formal institutions– Inability of states to protect borders, control territory and
resources – Weakening of state’s formal institutions (Army, Judicial
System, Parliament, etc….)– Questions about legitimacy of transitional governments
(Egypt, Yemen, Iraq) • The rise of the non-state actors
– Hizbollah (Lebanon), Houthis (Yemen), Hamas (Palestine), IS (Iraq), Libya Dawn (Libya)
– Established a ‘state’ within the state challenging formal authorities
– Ability to dictate their own agendas• Strong links to regional powers• Control decisions to initiate and stop wars• Engage in wars outside borders
• As power of central government weakens, new local powers will emerge – Local powers can’t be sidelined – Adds new complexity for foreign players’ relationship
with governments and local players
Nature of conflict and geopolitical risks have changed with new set of challenges for the oil industry
Barclays | Middle East Geopolitics
17 September 2014 4
FIGURE 1 ISIS’s presence and activities in Iraq and Syria
Source: www.eia.gov, www.understandingwar.org. As of September 8-9, 2014.
Jordan
Turkey
Iran
Iraq
KuwaitSaudi Arabia
LebanonSyria
Israel
Ninawa
Salahad Din
Al Anbar Najaf
Al Muthanna
Basra
MaysanDhi Qar
Dahuk
Arbil
Kirkuk
Babil
Wasit
Al-Qadisyyah
Baghdad
Diyala
As Sulaymaniyah
Arbil
Samarra
Dahuk
Mosul dam
Fallujah
Baqubah
An Nasriyah
An Najaf
KarbalaAl Kut
Ar Ramadi
Tikrit
Al Amarah
Al Hillah
Ad Diwaniyah
Muqdadiyah
Samawa
Haditha
Basra
FAO
Naft Khaneh
Balad
Nau DumanJaria Pika
Khashim al-Ahrnar
Mansuriya
Chia Surkh
JawanNajma
al-Qayara
Sadid Qara Chauq
Taq Taq
Miran
Chamchamal
InjanaWest Tikrit
Judaida
Khor Mor
Jambur
Chia Surkh
Gilabat
QamarimAjil
Baiji
KurmalaDome Avana Dome
Baba Dome
Abu Kamal
al-Mayadin
Tawke
Mushora
Sufaye
AlanGusair
Butma
Ain Zalah
SasanIbrahim
Adayla
Demir DaghQalan
Badra
SaraqibAriha
Darkush
Salqin
Markadeh
Harem
Damascus
Quneitra
as-Suwayda
Palmyra
NassibDeraa
Jdaidet-Yabus
Jizzah
HomsTartous
Hama
Latakia
IdlibAleppo
Ayn al-Arab
ar-Raqqa
Deir ez-Zour
Hasakah
Mahardeh
JussiyehTal Kalakh
Dabussiya
Kasab
Bab al-Hawa
Bab al-Salama
Azaz
Jarablus
Tal Abyad
Ras al-Ayn
Qamishli
Ain-Diwar
Yarubiya
al-Tanf
Manbij
al-Bab
Maskana
KuweirisAirbase
ash-Shadadi
MorekKhan Sheikhoun
Ma’arat al-Nu’man
Jisr ash-Shughour
Yabrud
Aarsal
Beirut
Mosul
Kirkuk
Rutba
Qaim
Fishkabur
Deir ez-Zour
Areas of Predominantly Kurdish PopulationKurdish Autonomous Region
ISIS Control Zones
Oil FieldISIS Attack Zones
Assad Regime ControlledCity/Town
ISIS ControlledRebels Controlled
Kurdish ControlledContested
NF ControlledNF Stronghold

Unplanned Outages on the Rise
For questions or support, contact
+44 20 3322 4100 | +1 (646) 606-2900 | +65 3158 9990 [email protected]
Oil
29 Feb 2016 | Perspectives
Needle in a haystack
x For all the talk of brimming crude stocks overflowing into floating storage, our balances show global crude stocks drew in January, by around 12 mb. While US crude stocks built by a large 15 mb, stocks drew heavily in OECD Asia. Even non-OECD crude stocks fell, led by China and Brazil.
x Moreover, even crude being stored on water has been edging lower since peaking in late October 2015. On our estimates, ex-Iranian floating storage currently stands at no more than 35 mb. And of that, around 30 mb is sitting off the USGC due to run cuts, unplanned refinery outages, and Houston Ship Channel issues. Only 3-4 mb of the 30 mb is WTI, being floated as the WTI contango makes it economic to do so, and this may rise towards 10 mb.
x In contrast, the Brent and Dubai curves do not pay to hold crude on water, and tankers holding crude off Singapore when the Dubai contango had widened in December and January have in fact been offloaded. Asian crude demand is extremely robust as India and China fill their SPRs.
x Tankers appearing off the coast of China are not crude being floated, rather there is rising port congestion (waiting times at Qingdao have risen towards 15 days) given record imports into the country in February. Moreover, given the teapots’ propensity to buy distressed cargos, smaller vessels are being incentivised to hover around ports—this will be the new norm going forward.
x Product stocks, on the other hand, have risen by more than crude stockdraws in January and the market may be mistaking product tankers being floated off ARA as crude floating storage.
x Commercial crude stocks (ex SPR) may fall again in February and March given unplanned crude output outages (led by Iraq and Nigeria) have risen to their highest since June 2014, at 2.2 mb/d.
Fig 1: Ex-Iranian floating crude on VLCCs, mb Fig 2: Unplanned upstream outages, mb/d
Note: Does not include ships queueing due to congestion Source: Energy Aspects
Note: Does not include planned upstream maintenance Source: Energy Aspects
0
20
40
60
80
09 10 11 12 13 14 15 16
0
1
2
3
4
13 14 15 16
Non-OPEC
OPEC
Unplanned upstream outages, mb/d
Upstream outages have been on the rise in recent months led by countries like Nigeria, Iraq and Libya
16 Mar 2016 | Data review OPEC oil data – Feb 2016
Page 4
OPEC crude oil output (cont’d) Fig 13: Nigerian oil output, mb/d Fig 14: Angolan output, mb/d
1.5
1.7
1.9
2.1
2.3
2.5
10 11 12 13 14 15 16
1.4
1.6
1.8
2.0
10 11 12 13 14 15 16
Source: IEA, EIA, RTS, BBG, Platts, Energy Aspects Source: IEA, EIA, RTS, BBG, Platts, Energy Aspects
Fig 15: Libyan oil output, mb/d Fig 16: Algerian oil output, mb/d
0.0
0.6
1.2
1.8
10 11 12 13 14 15 16
1.0
1.1
1.2
1.3
1.4
10 11 12 13 14 15 16
Source: IEA, EIA, RTS, BBG, Platts, Energy Aspects Source: IEA, EIA, RTS, BBG, Platts, Energy Aspects
Fig 17: Qatari oil output, mb/d Fig 18: Indonesian oil output, mb/d
0.6
0.7
0.8
0.9
10 11 12 13 14 15 16
0.6
0.7
0.8
0.9
10 11 12 13 14 15 16
Source: IEA, EIA, RTS, BBG, Platts, Energy Aspects Note: Only IEA and EIA have released historic estimates Source: IEA, EIA, RTS, BBG, Platts, Energy Aspects
Nigerian Oil Output, mb/d
Especially in fragile states where dependency on oil revenues is very high
Source:EnergyAspects,IEA