the 2017 consumer financial literacy survey - nfcc · the 2017 consumer financial literacy survey...
TRANSCRIPT
1
The 2017 Consumer Financial Literacy Survey
Prepared For:
The National Foundation for Credit Counseling (NFCC) &
The Boeing Employees’ Credit Union (BECU)
Prepared By:
Harris Poll
2
Survey Methodology
The 2017 Financial Literacy Survey was conducted online within the United States by Harris Poll on behalf of the NFCC (National Foundation for Credit Counseling) between March 1 and March 13, 2017 among 1,649 adults ages 18+ and oversamples of 315 adults living in the greater Seattle area, 315 adults living in the greater Spokane area, and 313 adults living in the greater Portland area. Figures for age, sex, race/ethnicity, education, region and household income were weighted where necessary to bring them into line with their actual proportions in the population. Propensity score weighting was used to adjust for respondents’ propensity to be online. Prior to 2013, this survey was conducted by telephone. All sample surveys and polls, whether or not they use probability sampling, are subject to multiple sources of error which are most often not possible to quantify or estimate, including sampling error, coverage error, error associated with nonresponse, error associated with question wording and response options, and post-survey weighting and adjustments. Therefore, Harris Poll avoids the words “margin of error” as they are misleading. All that can be calculated are different possible sampling errors with different probabilities for pure, unweighted, random samples with 100% response rates. These are only theoretical because no published polls come close to this ideal. Respondents for this survey were selected from among those who have agreed to participate in Harris Poll surveys. The data have been weighted to reflect the composition of the adult population. Because the sample is based on those who agreed to participate in the Harris Poll panel, no estimates of theoretical sampling error can be calculated.
Significance Testing
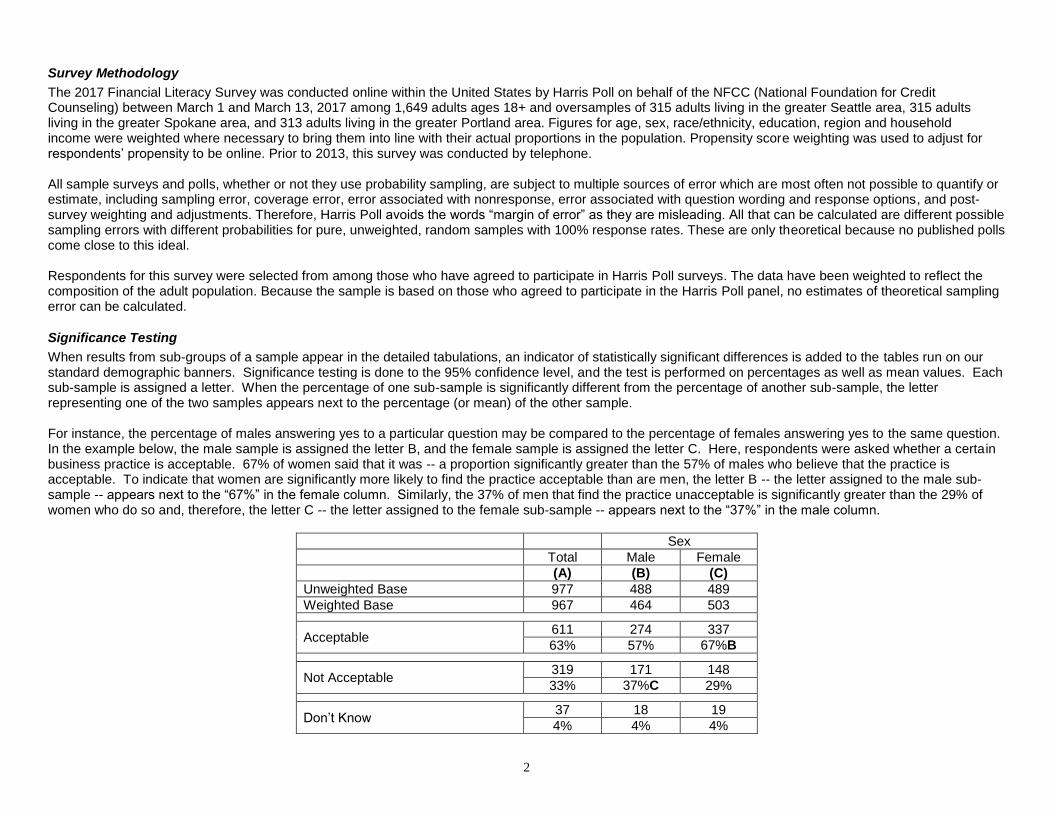
When results from sub-groups of a sample appear in the detailed tabulations, an indicator of statistically significant differences is added to the tables run on our standard demographic banners. Significance testing is done to the 95% confidence level, and the test is performed on percentages as well as mean values. Each sub-sample is assigned a letter. When the percentage of one sub-sample is significantly different from the percentage of another sub-sample, the letter representing one of the two samples appears next to the percentage (or mean) of the other sample. For instance, the percentage of males answering yes to a particular question may be compared to the percentage of females answering yes to the same question. In the example below, the male sample is assigned the letter B, and the female sample is assigned the letter C. Here, respondents were asked whether a certain business practice is acceptable. 67% of women said that it was -- a proportion significantly greater than the 57% of males who believe that the practice is acceptable. To indicate that women are significantly more likely to find the practice acceptable than are men, the letter B -- the letter assigned to the male sub-sample -- appears next to the “67%” in the female column. Similarly, the 37% of men that find the practice unacceptable is significantly greater than the 29% of women who do so and, therefore, the letter C -- the letter assigned to the female sub-sample -- appears next to the “37%” in the male column.
Sex
Total Male Female
(A) (B) (C)
Unweighted Base 977 488 489
Weighted Base 967 464 503
Acceptable 611 274 337
63% 57% 67%B
Not Acceptable 319 171 148
33% 37%C 29%
Don’t Know 37 18 19
4% 4% 4%

3
Key Findings Budget & Saving Once again, in 2017, two in five U.S. adults (40%) – a proportion that has held roughly steady since 2007 – say they have a budget and keep close track of their spending. A little over half of adults (54%) say they are now saving the same as last year, down by 4 percentage points from 2016. Those who say they are saving “more” has held steady since 2016 (26%). The proportion that has non-retirement savings has decreased slightly in the past year (68% vs. 69% in 2016). Where adults are saving their money varies. On par with last year, about 2 in 3 say they use a savings account (65% vs. 66% in 2016). The use of 401k plans (32%) and saving at their home (under the mattress or in a home safe) (12%) have both held steady since 2016. However, significantly fewer save through investments or mutual funds compared to last year (26% vs. 32% in 2016), and those who use IRAs dropped 3 percentage points from last year (26% vs. 29%).
Nationally, younger adults, aged 18-34, are significantly more likely than older adults, aged 35+, to be saving more than last year (36% vs. 22%). This is also true in Seattle (36% vs. 20%).
Conversely, older adults are more likely to have any non-retirement savings at all than younger adults (70% vs. 62%).
Nationally, older adults are more likely to invest their money in a 401k plan than younger adults (35% vs. 27%). This holds true, at least directionally, in Seattle, Portland and Spokane as well. In comparison, younger adults are more likely to save their money at home (e.g., under their mattress, in a home safe) than older adults (19% vs. 10%). This is also the case in Seattle (22% vs. 9%) and directionally in Spokane (16% vs. 10%).
When asked where they would get $400 for an emergency, most respondents say they would pull from a savings account (57%), but this number drops to 48% when the amount needed increases to $2,000.
Adults of all ages nationally are more likely than adults of all ages in Portland to get money from a savings account if they needed $400 for an emergency (57% vs. 48%).
Young adults are more likely than older adults to sell something they own if they needed $400 for an emergency (24% vs. 11%). This is also true in Seattle (23% vs. 11%), Portland (26% vs. 9%) and Spokane (34% vs. 16%). This also holds true when the amount is raised to $2,000 (22% vs. 10% National; 31% vs. 9% Seattle; 31% vs. 9% Portland; 36% vs.11% Spokane).
Retirement When it comes to retirement savings, a little over 1 in 4 U.S. adults (27%) do not save any portion of their household’s annual income for retirement, which, holds steady compared to 2016 (26%) – continuing the trend of a large percentage of adults not funding this important life event.
Adults in Seattle are more likely to save at least some percentage of their household income every year for retirement than adults in Portland (65% vs. 53%).
Half of adults in 2017 say they are very or somewhat confident that they are saving enough for retirement – the same as 2016 - while three in ten (30% vs. 29% in 2015) reveal they are not at all confident.
Young adults 18-34 in Portland are more likely to feel not at all or not very confident that they are saving enough for retirement (72%) than those of the same age group nationally (55%), and in Spokane (52%) as well as those 35+ nationally (48%), in Seattle (40%), and their own city (50%).
Despite the fact that most adults are saving at least some for retirement (and many feel confident that they’re saving enough), when asked what areas of personal finance are most worrisome, the top responses were: retiring without having enough money set aside, up significantly more than the previous two years (18% vs. 15% in both 2016 and 2015), and insufficient “rainy day” savings for an emergency (16%, similar to 14% in 2016).
Perhaps unsurprisingly, nationally, older adults, ages 35+, are more likely to be worried about retiring without having enough money set aside than younger adults, ages 18-34 (20% vs. 12%). Younger adults in Spokane are less worried about this than adults of the same age in Seattle (3% vs. 16%).

4
Key Findings (continued) Spending The most influential factor for U.S. adults when deciding how to pay in certain situations (i.e., cash vs. debit vs. credit) is the amount of the purchase (48%) followed by the points/rewards they can earn by using their credit card (39%) and the types of payment accepted where they are shopping (34%).
Adults 35+ nationally are more likely than adults of the same age group in Portland to find the amount of a purchase to be the most influential when deciding how to pay (49% vs. 39%).
Older adults, nationally, are also more likely than younger adults to find the points/rewards they can earn by using their credit card to be influential when deciding how to pay (43% vs. 31%)
On average, U.S. adults typically carry $25 in cash with them on a daily basis, with two-thirds carrying between $1-$99. However, over four in ten adults would not be willing to pay any money to use their debit card to take out cash from an out-of-network ATM. Of those willing to pay a fee – typically they would be willing to pay $3.
Younger adults are more likely to carry no cash with them on a daily basis than older adults (21% vs. 11%). Adults in Spokane are more likely than adults overall nationally and adults in Portland to carry no cash (20% Spokane, 14% National, 12% Portland).
Older adults, both nationally and across all subgroups, are more likely to be willing to spend no fee to use their debit card to take out cash from an out-of-network ATM than younger adults (52% vs. 18% National; 50% vs. 21% Seattle; 47% vs. 24% Portland; 51% vs. 26% Spokane).
Credit Card Debt Significantly more U.S. adults indicate their household carries credit card debt from month to month than last year (39% vs. 35% in 2016), with nearly two in ten adults saying they roll over $2,500 or more in credit card debt each month, up from 2016 (16% vs. 14% in 2016).
Adults in Spokane are more likely than those in Seattle or Portland to carry $2,500 or more in household credit card debt from month to month (20% vs. 12% vs. 11% respectively).
In the past 12 months, 19% report they have applied for a new credit card, while 8% have been rejected for a new card and 7% admit they have been late making a credit card payment, all similar to percentages in 2016.
Adults 18-34 in Seattle are more likely than adults in any age group nationally or in Portland or Spokane to have applied for a new credit card in the last 12 months (37%)
Younger adults are more likely than older adults to have committed a variety of credit card blunders in the last twelve months including being rejected for a new credit card (11% vs. 6%), being late making a credit card payment (11% vs. 5%), missing a credit card payment (12% vs. 4%), or making a payment that was less than the minimum payment required (13% vs 3%).

5
Key Findings (continued) Knowledge of, and Confidence in, Personal Finance In 2016, a little over half of U.S. adults (57%) – up a little from last year (56% in 2016) – give themselves a grade of A or B on their knowledge of personal finance. Eight in ten adults (80%) agree – and over three in ten (31%) strongly agree – that they could benefit from advice and answers to everyday financial questions from a professional, both up from last year (vs. 75% and 24% in 2016 respectively).
Older adults nationally are more likely than younger adults nationally and older adults in Portland to give themselves a grade of A or B on their knowledge of personal finance (60% vs. 50% vs. 50% respectively).
Unsurprisingly, younger adults are more likely to strongly agree that they could still benefit from some advice and answers to everyday financial questions from a professional than older adults both nationally and in Seattle, Portland or Spokane (48% vs. 24% National, 22% Seattle, 29% Portland, 24% Spokane).
In fact, when asked who they would turn to for general financial/money management guidance, the top response is a financial professional such as a CPA or financial planner. In addition, over half of U.S. adults say they would be likely to use the guidance of an online tool or app that automatically generates financial/money management advice based on information they enter/provide (55%).
Nationally, 18-34 year olds are more likely to use an online tool than those 35+ (74% vs. 46%). This trend carries across Seattle (75% vs. 51%), Portland (76% vs. 48%) and Spokane (62% vs. 42%) subgroups.
More than nine in ten (92%) say they are very or somewhat confident that the last time they made a big financial decision (such as picking a credit card, buying a car, or refinancing their mortgage), they made the right choice. The proof of this? Nearly 3 in 4 (75%) pay all their bills on time and have no debts in collection. Conversely, however, about 1 in 5 (22%) do not pay their bills on time.
Adults nationally as well as in Seattle are more likely than those in Portland to pay all of their bills on time and have no debts in collection (75% vs. 77% vs. 67% respectively)
Unsurprisingly, younger adults 18-34 are more likely to not pay all their bills on time than older adults nationally (27% vs. 20%). However, interestingly, older adults 35+ in Portland are more likely than adults nationally to not pay all their bills on time (28% vs. 20%)
Financial Problems and Credit Counseling If they were having financial problems related to debt, U.S. adults continue to say they would first turn to their friends and family for help (25%). When asked why they would not reach out to a professional non-profit credit counseling agency for help if they were having financial problems related to debt, roughly one in five adults (23%) say they can resolve their own problems without outside help, while roughly one in four (24%) – or almost 59 million Americans1 – indicated that they would reach out to a professional non-profit credit counseling agency for help.
Adults 35+ in Seattle (34%) are more likely than those of the same age group nationally (24%) or in Portland (22%) to say they would reach out to a professional non-profit credit counseling agency for help if they were having financial problems related to debt. They were also more likely than younger adults in Portland and Spokane (each 15%) to state this.
Calculation based on U.S. Census Bureau’s 2016 Current Population Survey (CPS), which estimates there are 244.81 million adults ages 18+ residing in the United States: 244.81M x 0.24 = 58.75M.

6
Key Findings (continued) Payday Loans Almost half of U.S. adults say they are knowledgeable about payday loans and other types of high-interest short-term loans (47%). In fact, nearly nine in ten have taken out a payday loan or other type of short-term loan either for themselves or to help a friend or family member in the past twelve months (9%).
Younger adults, nationally, are more likely to be knowledgeable about payday loans and other types of high-interest short-term loans than older adults (55% vs. 44%) or younger adults in Portland (35%) or Spokane (34%), and are much more likely to have taken out a payday loan in the past twelve months than older adults, nationally (21% vs. 5%).
However, young adults in Spokane (5%) are significantly less likely than those either nationally (21%) or in Seattle (25%) to have taken out a payday loan in the past twelve months.
The most common reason why adults have taken out a payday or short-term loan in the past twelve months was to pay for an unplanned emergency expense (49%). Other top reasons were needing cash to smooth out monthly finances (41%) or to pay off debt (30%). Over two in ten adults report that they took out a payday loan because they couldn’t get a loan elsewhere (21%).

7
Posted Topline Data
Q1 (Q3705) Total 2017
%
Total 2016
%
Total 2015
%
Total 2014
%
Total 2013
%
Total 2012
%
Total 2011
%
Total 2010
%
Total 2009
%
Total 2008
%
Total 2007
%
Which of the following best describes how you manage your money?
Base: Adults 18+
(n=1,649) (n=1,668) (n=2,017) (n=2,016) (n=2,037) (n=1,007) (n=1,010) (n=2,028) (n=1,000) (n=1,001) (n=1,003)
A B C D E F G H I J K
I have a budget and keep close track of how much I spend on such things as food, housing and entertainment
40 40 40 39 40 43 D 43 D 43 DK 42 42 39
Don’t Have A Budget (Net) 60 FGH 60 FGH 60 FGH 61 FGHI 60 FGH 56 56 56 57 N/A N/A
I have a somewhat good idea about how much I spend on such things as food, housing and entertainment, but I don’t keep strict track of my spending on these things
46 FGHIJK
46 FGHIJK
46 FGHIJK
48 FGHIJK
48 FGHIJK
34 34 37 39 FG 35 36
I don’t have a good idea how much I spend on such things as food, housing and entertainment, but I keep track of my overall spending and try to stay within certain limits that I’ve set for myself
9 9 9 8 8 15
ABCDEIJ
15 ABCDEI
J
14 ABCDEI
11 DE 12
ABCDE
15 ABCDEI
J
I don’t have a good idea how much I spend on such things as food, housing and entertainment, and I often don’t keep track of my overall spending
5 5 5 5 4 7
ABCDEH
7 ABCDE
H 5
7 ABCDE
H
7 ABCDE
H
7 ABCDE
H
Don’t know N/A N/A N/A N/A N/A 1 1 1 1 2 H 2 H
Refused N/A N/A N/A N/A N/A * * * * 2 FGHI 1

8
Q2 (Q3710) Total 2017 %
Total 2016 %
Total 2015 %
Total 2014 %
Total 2013 %
Total 2012 %
Total 2011 %
Total 2010 %
Total 2009 %
Total 2008 %
Which of the following best describes your financial situation?
Base: Adults 18+
(n=1,649) (n=1,668) (n=2,017) (n=2,016) (n=2,037) (n=1,007) (n=1,010) (n=2,028) (n=1,000) (n=1,001)
A B C D E F G H I J
I pay all of my bills on time and have no debts in collection
75 CDEFGHIJ
74 CDEFGHIJ
71 F 71 F 71 F 64 68 69 F 70 F 69 F
Do Not Pay All Bills On Time (Net)
22 22 24 24 26 AB 33
ABCDEGHI
28 ABCD 28 ABCD 26 AB N/A
I sometimes miss a payment but have no debts in collection
10 9 9 10 10 15
ABCDEIJ 14
ABCDEIJ 13
ABCDEI 10 11
I struggle to pay my bills every month but have no debts in collection
7 7 7 7 8 11
ABCDEG 8 9 ABCD 10 ABCD 9
I am getting calls from collectors and struggle to pay my bills every month
4 5 6 AFGHI 6 AFGHI 5 4 4 4 4 5
I am seriously considering filing for bankruptcy or have filed for bankruptcy in the past three years
1 1 1 1 2 ABCD 3 ABCD 2 ABCD 2 ABCD 2 ABCD 2 ABCD
I am not involved at all in any financial decisions including how money is spent in our household
3 FGI 3 FGI 5
ABEFGHIJ
4 FGHI 3 1 1 2 FGI 1 2
Don’t know N/A N/A N/A N/A N/A 2 H 2 H 1 1 2 H
Refused N/A N/A N/A N/A N/A * 1 1 1 1
Special Net: No debts in collection
92 BCDEG 90 88 89 90 C 90 89 91 CD 91 C N/A
Special Net: Debts in collection
5 6 7 A 7A 7 A 7 A 7 A 6 6 N/A

9
Q3 (Q3715) Total 2017 %
Total 2016 %
Total 2015 %
The last time you made a big financial decision (e.g., picking a credit card, buying a car, refinancing your mortgage), how confident were you that you made the right choice?
Base: Adults 18+
(n=1,649) (n=1668) (n=2,017)
A B C
Very/Somewhat Confident (Net) 92 91 92
Very confident 55 55 52
Somewhat confident 38 36 40 B
Not at all/Not Very Confident (Net) 8 9 8
Not very confident 5 6 6
Not confident at all 3 3 2

10
Q4 (Q3720) Total 2017
% Total 2016
% Total 2015
% Total 2014
%
Which of the following areas of personal finance currently worries you most?
Base: Adults 18+
(n=1,649) (n=1,668) (n=2,017) (n=2,016)
A B C D
Have Financial Worries (Net) 75 BCD 71 70 71
Not Enough Savings (Sub-Net) 34 BC 29 28 31 C
Retiring without having enough money set aside 18 BC 15 15 16
Not enough “rainy day” savings for an emergency 16 C 14 13 16 C
Job-Related (Sub-Net) 13 12 13 13
Losing my job 8 BC 6 6 7
Not being able to find a good-paying job 5 6 8 ABD 6
Not Being Able To Pay (Sub-Net) 8 8 8 7
Not being able to pay my credit card debt 3 3 2 4 C
Not being able to repay my student loan debt 3 3 4 2
Not being able to pay my existing medical debt 1 1 1 1
Not being able to make my monthly vehicle payments * 1 1 1
Credit Score/Access (Sub-Net) 5 6 C 4 4
My credit score 4 5 C 3 3
My lack of access to credit 1 1 2 AB 1
Not being able to afford health insurance 4 3 4 4
Feeling as though my personal financial situation is out of control 4 3 4 3
Not being able to afford to send my child(ren) to college 2 2 2 2
That I may have to file for bankruptcy 1 * 1 A *
Losing my home to foreclosure 1 1 2 AB 1
Not having a good, overall understanding of personal finance 1 2 AC 1 2
Other 3 4 3 3
None – I do not have any financial worries. 21 25 A 24 A 25
Not sure 3 4 6 AB 4

11
Q5 (Q3725) Total 2017 %
Total 2016 %
Total 2015 %
Total 2014 %
Total 2013 %
Total 2012 %
Total 2011 %
Total 2010 %
Total 2009 %
Total 2008 %
Do you have any savings, excluding retirement savings?
Base: Adults 18+
(n=1,649) (n=1,668) (n=2,017) (n=2,016) (n=2,037) (n=1,007) (n=1,010) (n=2,028) (n=1,000) (n=1,001)
A B C D E F G H I J
Yes 68 FGJ 69 FGIJ 66 F 66 69
CFGIJ 59 64 F 67 FJ 65 F 63
No 32 31 34 EH 34 EH 31 39
ABCDEGHI
33 30 32 36 ABEH
Don’t know N/A N/A N/A N/A N/A * 1 1 * *
Refused N/A N/A N/A N/A N/A 2 2 2 2 1

12
* Multiple responses were allowed.
Q7 (Q3732) Total 2017
%
Q6 (Q3730) Total 2017
% Total 2016
% Total 2015
%
Where do you save or invest your money? * Base: Adults 18+ Base: Adults 18+ Base: Adults 18+
(n=1,649) (n=1,668) (n=2,017)
A B C
Any Savings (Net) 83 83 82
A savings account (e.g., regular bank savings, certificate of deposit, money market)
65 66 65
401k plan 32 C 32 C 29
IRAs 26 29 C 25
Investments / mutual funds 26 32 A 30 A
At home (e.g., under mattress, in a home safe) 12 C 12 C 9
I have no savings or investments 17 17 18

13
If you needed $400 for an emergency, where/ how would you get the money? Please select all that apply.
Base: Adults 18+
(n=1,649)
A savings account 57
Borrow from friends and family 20
An emergency fund (separate from a savings account) 15
Sell something I own 14
Take out a payday loan or other short-term loan 6
Borrow from a retirement account (e.g., IRA, 401k) 6
Sell or liquidate investments / mutual funds 4
Crowdfunding (e.g., GoFundMe, Kickstarter) 4
Other 10
Not at all sure 8
* Multiple responses were allowed.
Q8 (Q3733) Total 2017
%

14
If you needed $2,000 for an emergency, where/ how would you get the money? Please select all that apply.
Base: Adults 18+
(n=1,649)
A savings account 48
Borrow from friends and family 16
An emergency fund (separate from a savings account) 14
Sell something I own 13
Take out a payday loan or other short-term loan 9
Borrow from a retirement account (e.g., IRA, 401k) 7
Sell or liquidate investments / mutual funds 5
Crowdfunding (e.g., GoFundMe, Kickstarter) 4
Other 10
Not at all sure 16
* Multiple responses were allowed.

15
Q9 (Q3735) Total 2017 %
Total 2016 %
Total 2015 %
Total 2014 %
Total 2013 %
Total 2012 %
Total 2011 %
Total 2010 %
Total 2009 %
Total 2008 %
On average, what percentage of your household’s income do you save every year for retirement?
Base: Adults 18+
(n=1,649) (n=1668) (n=2,017) (n=2,016) (n=2,037) (n=1,007) (n=1,010) (n=2,028) (n=1,000) (n=1,001)
A B C D E F G H I J
0% or nothing 27 26 29 B 32 ABCJ 31AB 36
ABCDEJ 32 AB 33 ABCJ 33 ABCJ 28
Any (Net) 60 62 C 57 58 59 59 61 BH 59 56 N/A
1% to 10% 34 36 34 35 37 35 35 35 34 33
11% to 20% 19 C 17 16 16 16 16 17 17 16 16
More than 20% 7 9 A 8 6 6 8 9 7 6 8
Already retired N/A N/A N/A N/A N/A N/A N/A N/A N/A 8
Decline to answer 12 12 13 11 10 N/A N/A N/A N/A N/A
Don’t know N/A N/A N/A N/A N/A 4 4 5 8 6
Refused N/A N/A N/A N/A N/A 2 3 3 2 2
Q10 (Q3740)
Total 2017 %
Total 2016 %
Total 2015 %

16
How confident are you that you are saving enough for retirement? Base: Adults 18+
(n=1,649) (n=1,668) (n=2,017)
A B C
Very/Somewhat Confident (Net) 50 50 48
Very confident 20 C 19 17
Somewhat confident 30 30 31
Not at all/Not Very Confident (Net) 50 50 52
Not very confident 20 22 22
Not confident at all 30 29 30

17
Q11 (Q3750)
Total 2017 %
Total 2016 %
Total 2015 %
Total 2014 %
Total 2013 %
Total 2012 %
Total 2011 %
Have you ordered or received your credit score in the past 12 months?
Base: Adults 18+
(n=1,649) (n=1,668) (n=2,017) (n=2,016) (n=2,037) (n=1,007) (n=1,010)
A B C D E F G
Yes 58 CDEFG 56 CDEFG 48 DEFG 40 40 44 DEG 37
No 42 44 52 AB 60 ABCF 60 ABCF 55 AB 63 ABCF
Don’t know N/A N/A N/A N/A N/A 1 *
Refused N/A N/A N/A N/A N/A * *

18
Q12 (Q3765) Total 2017 %
Total 2016 %
Total 2015 %
Total 2014 %
Total 2013 %
Total 2012 %
Total 2011 %
Total 2010 %
Total 2009 %
Roughly how much credit card debt, if any, does your household carry from month to month?
Base: Adults 18+
(n=1,649) (n=1,668) (n=2,017) (n=2,016) (n=2,037) (n=1,007) (n=1,010) (n=2,028) (n=1,000)
A B C D E F G H I
Any (Net) 39 BCD 35 33 34 37 CD 39 BCD 40 BCD 41 BCDE 44
ABCDEF
Less than $2,500 (Subnet) 23 D 21 D 22 D 18 21 D 25 BDE 28 ABCDE 25 BCDE 28 ABCDE
$1 to $499 11 DE 10 DE 11 DE 8 8 10 14
ABCDEFI 13 BDEF 11 DE
$500 to $999 6 D 5 5 4 5 6 D 6 D 5 7 BCDEH
$1,000 to $2,499 7 6 6 6 8 BCD 9 BCD 8 CD 8 BCD 10 ABCD
$2,500 or More (Subnet) 16 CG 14 C 11 15 CG 16 CG 14 C 12 16 CG 16 CG
$2,500 to $4,999 5 C 4 3 4 4 5 C 4 5 C 5 C
$5,000 to $9,999 4 4 3 5 CG 5 CG 5 CG 3 5 CG 5 CG
$10,000 or more 7 CFGH 6 FG 5 6 FG 7 CFGH 4 4 5 6 FG
None 43 48 A 49 AE 49 AE 45 53
ABCDEHI 50 AE 48 A 46
Decline to answer/Refused 18 17 18 18 18 4 6 FHI 4 4
Don’t know N/A N/A N/A N/A N/A 4 5 7 FG 6 F

19
Q13 (Q3770) Total 2017
% Total 2016
% Total 2015
% Total 2014
% Total 2013
% Total 2012
% Total 2011
% Total 2010
% Total 2009
%
In the last 12 months, have you…? * Base: Adults 18+
(n=1,649) (n=1,668) (n=2,017) (n=2,016) (n=2,037) (n=1,007) (n=1,010) (n=2,028) (n=1,000)
A B C D E F G H I
Any (Net) 38 CDG 35 CDG 31 31 35 CDG 38 CDG 30 40
BCDEG
40 BCDEG
Applied for a new credit card 19
CDFGHI 18 DFGHI 16 GHI 14 GI 17 DGHI 15 GHI 10 12 11
Been rejected for a new credit card 8 GHI 7 GH 7 GH 7 GH 8 GHI 7 GH 4 5 6 G
Transferred the balance from one credit card to another
7 BDFG 5 6 D 4 6 D 5 5 6 D 7 BD
Been late making a credit card payment 7 7 6 7 8 C 11 ABCDE 9 C 12
ABCDEG 15
ABCDEFGH
Missed a credit card payment 6 BCDE 4 4 3 4 8 BCDEG 5 D 8
ABCDEG 8 BCDEG
Made a payment that was less than the minimum payment required
6 CDEFG 5 D 4 3 4 4 4 5 D 7
BCDEFGH
Cancelled a credit card 5 6 C 4 5 6 C 13 ABCDE 12
ABCDE 17
ABCDEFG 15
ABCDEG
Obtained a cash advance from my credit card company
4 D 3 3 D 2 3 D 3 4 D 4 D 4 D
Consolidated my credit card debt into a personal bill consolidation loan
3 DF 3 DF 2 DF 1 2 DF 1 2 D 2 DF 2 D
None of these 62 I 65 FHI 69
ABEFHI 69
ABEFHI 65 FHI 61
69 ABEFHI
59 58
Don’t know N/A N/A N/A N/A N/A * * * *
Refused N/A N/A N/A N/A N/A * 1 1 1
* Multiple responses were allowed.
20
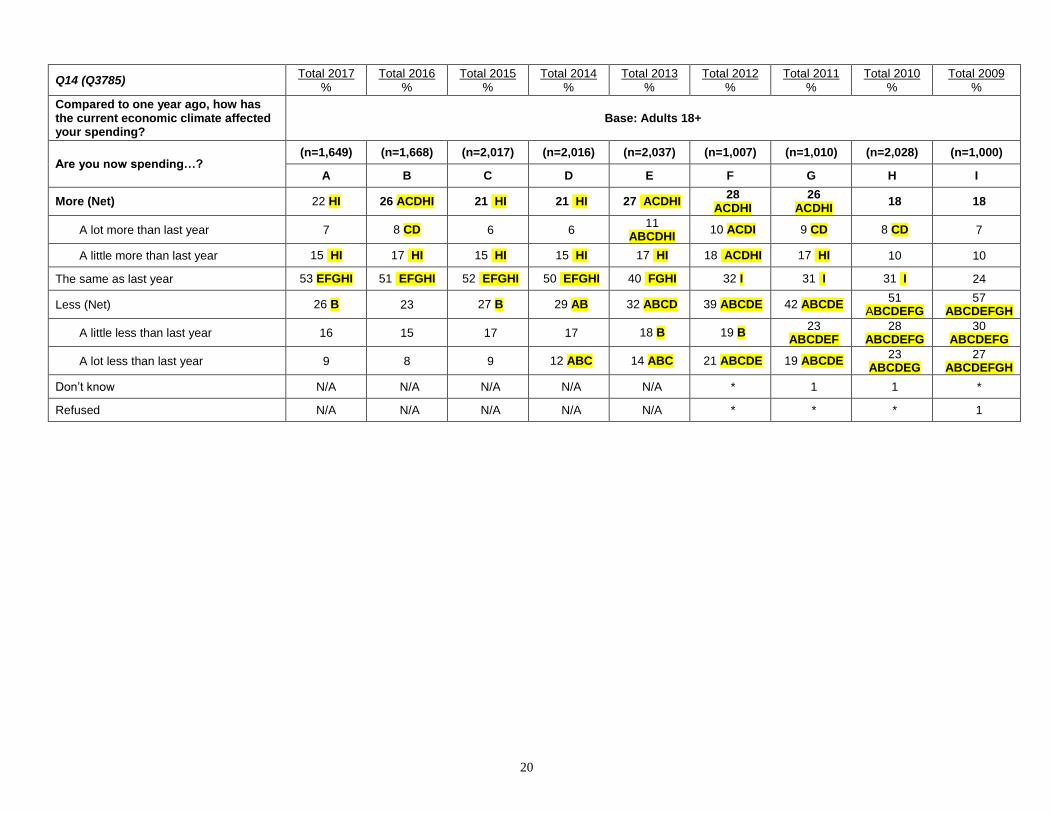
Q14 (Q3785) Total 2017
% Total 2016
% Total 2015
% Total 2014
% Total 2013
% Total 2012
% Total 2011
% Total 2010
% Total 2009
%
Compared to one year ago, how has the current economic climate affected your spending?
Base: Adults 18+
Are you now spending…? (n=1,649) (n=1,668) (n=2,017) (n=2,016) (n=2,037) (n=1,007) (n=1,010) (n=2,028) (n=1,000)
A B C D E F G H I
More (Net) 22 HI 26 ACDHI 21 HI 21 HI 27 ACDHI 28
ACDHI 26
ACDHI 18 18
A lot more than last year 7 8 CD 6 6 11
ABCDHI 10 ACDI 9 CD 8 CD 7
A little more than last year 15 HI 17 HI 15 HI 15 HI 17 HI 18 ACDHI 17 HI 10 10
The same as last year 53 EFGHI 51 EFGHI 52 EFGHI 50 EFGHI 40 FGHI 32 I 31 I 31 I 24
Less (Net) 26 B 23 27 B 29 AB 32 ABCD 39 ABCDE 42 ABCDE 51
ABCDEFG 57
ABCDEFGH
A little less than last year 16 15 17 17 18 B 19 B 23
ABCDEF 28
ABCDEFG 30
ABCDEFG
A lot less than last year 9 8 9 12 ABC 14 ABC 21 ABCDE 19 ABCDE 23
ABCDEG 27
ABCDEFGH
Don’t know N/A N/A N/A N/A N/A * 1 1 *
Refused N/A N/A N/A N/A N/A * * * 1

21
Q15 (Q3790)
Total 2017 %
Total 2016 %
Total 2015 %
Total 2014 %
Total 2013 %
Total 2012 %
Total 2011 %
Total 2010 %
Total 2009 %
Compared to one year ago, how has the current economic climate affected your saving habits?
Base: Adults 18+
Are you now saving…? (n=1,649) (n=1,668) (n=2,017) (n=2,016) (n=2,037) (n=1,007) (n=1,010) (n=2,028) (n=1,000)
A B C D E F G H I
More (Net) 26 DFG 26 DFG 24 23 29
ABCDFGHI 21 22 24 23
A lot more than last year 7 F 8 F 7 F 7 F 9 ACDF 5 7 8 F 9 F
A little more than last year 19 DFGI 18 GI 18 GI 16 20 DFGHI 16 14 17 G 15
The same as last year 54 EFGHI 58 AEFGHI 56 EFGHI 55 EFGHI 46 FGHI 38 41 38 39
Less (Net) 20 B 16 19 B 22 BC 25 ABCD 40
ABCDEHI 36 ABCDE
36 ABCDE
35 ABCDE
A little less than last year 10 9 10 11 B 11 B 19
ABCDEI 19
ABCDEI 18
ABCDEI 15
ABCDE
A lot less than last year 10 B 7 9 B 10 B 13 ABCD 21
ABCDEH 18
ABCDE 17
ABCDE 20
ABCDEH
Don’t know N/A N/A N/A N/A N/A 1 1 1 1
Refused N/A N/A N/A N/A N/A 0 * 1 F 2 FGH

22
Q16 (Q3795)
Total 2017 %
Total 2016 %
Total 2015 %
Total 2014 %
Total 2013 %
Total 2012 %
Total 2011 %
Total 2010 %
Total 2009 %
On a scale from A to F, what grade would you give yourself in terms of your knowledge about personal finance?
Base: Adults 18+
(n=1,649) (n=1,668) (n=2,017) (n=2,016) (n=2,037) (n=1,007) (n=1,010) (n=2,028) (n=1,000)
A B C D E F G H I
A/B (Net) 57 56 59 59 60 B 58 57 65
ABCDEFG 58
A 18 21 ADE 19 18 18 19 21 22 ACDEI 18
B 39 B 35 40B 41 BG 42 BG 39B 37 42 BG 40 B
C 28 32 AH 31 AH 31 AH 31 AH 29 30 H 26 29
D/F (Net) 14 CDEGH 13 CDEGH 10 H 10 H 9 12 EH 11 H 8 12 EH
D 9 CDEH 9 CDEH 7 7 7 9 7 7 9
F 5 CDEHI 4 EH 3 EH 3 EH 2 4 EH 5 CDEHI 2 3
Don’t know N/A N/A N/A N/A N/A * 1 1 1
Refused N/A N/A N/A N/A N/A * * * 1
Q17 (Q800) Total 2017
%

23
Which of the following, if any, would you turn to for general financial/money management guidance? Would you turn to...?
Base: Adults 18+
(n=1,649)
Any (Net) 81
A financial professional such as a Certified Public Accountant (CPA) or financial planner
37
My friends and family 34
Bank or credit union 32
An online do-it-yourself tool or app that automatically generates financial/money management advice based on information I enter/provide
22
A professional non-profit credit counseling agency 14
A lawyer 5
Other 5
None 19
* Multiple responses were allowed.
Q18 (Q802) Total 2017
%

24
How likely would you be to use/follow the guidance of an online tool or app that automatically generates financial/money management advice based on information you enter/provide?
Base: Adults 18+
(n=1,649)
Very/Somewhat Likely (Net) 55
Very likely 13
Somewhat likely 42
Not at all/ not very likely (Net) 45
Not very likely 26
Not at all likely 19
Q19 (Q3805) Total 2017
% Total 2016
% Total 2015
% Total 2014
% Total 2013
% Total 2012
% Total 2011
%

25
* Multiple responses were allowed.
If you were having financial problems related to debt, which of the following, if any, would you turn to for help first?
Base: Adults 18+
Would you turn to…? (n=1,649) (n=1,668) (n=2,017) (n=2,016) (n=2,037) (n=1,007) (n=1,010)
A B C D E F G
Any (Net) 82 81 82 85 ABC 86 ABC 95 ABCDEG 92 ABCDE
My friends and family 25 24 25 25 28 ABCDG 27 24
A financial professional such as a Certified Public Accountant (CPA) or financial planner
14 12 12 12 12 14 18 ABCDEF
The lender or credit card company to see what solutions they could offer 13 CG 11 G 10 12 CG 14 BCG 13 CG 8
A do-it-yourself tool to help me pay down debt myself
10 15 A 13 A 14 A 14 A 14 A 15 A
A professional non-profit credit counseling agency
8 BF 6 F 8 BF 9 BEF 7 F 4 7 F
The lender or credit card company specifically about settling the debt for less than the balance owed
4 4 3 4 4 6 ABCDE 7 ABCDE
A debt settlement company to settle the debt for less than the balance owed
4 4 3 3 3 3 3
A bankruptcy attorney 2 2 3 3 3 2 2
Other 4 4 5 E 5 E 3 11 ABCDE 10 ABCDE
None 18 DEFG 19 DEFG 18 DEFG 15 FG 14 FG 4 5
Don’t know N/A N/A N/A N/A N/A 1 2
Refused N/A N/A N/A N/A N/A * *
Q20 (Q3810) Total 2017
% Total 2016
% Total 2015
% Total 2014
% Total 2013
% Total 2012
% Total 2011
% Total 2010
% Total 2009
%

26
How strongly do you agree or disagree with the following statement?
Base: Adults 18+
Considering what I already know about personal finance, I could still benefit from
some advice and answers to everyday financial questions from a professional.
(n=1,649) (n=1,668) (n=2,017) (n=2,016) (n=2,037) (n=1,007) (n=1,010) (n=2,028) (n=1,000)
A B C D E F G H I
Agree (Net) 80 BCDG 75 75 73 78 BCD 80 BCDG 76 78 BCD 80 BCDG
Strongly agree 31 BCDE 24 D 23 D 20 27 BCD 32
BCDEG 28 BCD 31 BCDE
35 ABCDEGH
Somewhat agree 49 I 51 HI 52 FGHI 53 AFGHI 51 HI 48 48 46 45
Disagree (Net) 20 25 AEFHI 25 AEFHI 27
AEFGHI 22 19 23 FI 21 19
Somewhat disagree 13 FHI 17 AEFGHI 16 AFGHI 18
AEFGHI 14 FHI 10 12 10 10
Strongly disagree 8 9 9 10 AE 8 9 11 AEI 12
ABCDEFI 8
Don’t know N/A N/A N/A N/A N/A 1 1 1 1
Refused N/A N/A N/A N/A N/A 0 * * *

27
Q21 (Q3815) Total 2017
% Total 2016
% Total 2015
% Total 2014
% Total 2013
% Total 2012
% Total 2011
% Total 2010
% Total 2009
% Total 2008
% Total 2007
%
How familiar, if at all, are you with the National Foundation for Credit Counseling, also known as NFCC?
Base: Adults 18+
(n=1,649) (n=1,668) (n=2,017) (n=2,016) (n=2,037) (n=1,007) (n=1,010) (n=2,028) (n=1,000) (n=1,001) (n=1,003)
A B C D E F G H I J K
Familiar (Net) 17 CD 15 14 13 16 D 16 D 15 18
BCDG 17 CD N/A N/A
Very familiar 5
CDEFGHIJK
4 CDFGHIJ
2 2 3 CDH 2 2 2 2 2 3
Somewhat familiar 12 11 12 D 10 13 D 14 BD 13 D 16
ABCDEGK
15 ABCDK
15 ABCDK
12
Not Familiar (Net) 83 85 HI 86 AFHI 87
AEFHI 84 83 85 H 82 82 N/A N/A
Not too familiar 21 FJK 22 FJK 23 FHJK 22 FJK 21 FJK 17 20 JK 20 FJK 22 FJK 14 16
Not familiar at all 62 63 63 66
ACEHI 63 66 AHI 65 I 62 60 65 I
68 ABCEHI
Don’t know N/A N/A N/A N/A N/A * - * * 2 FGHI 2 FGHI
Refused N/A N/A N/A N/A N/A 0 * * * 1 F *

28
* Multiple responses were allowed.
Q23 (Q3825) Total 2017 %
Total 2016 %
Total 2015 %
Total 2014 %
Q22 (Q3820) Total 2017
% Total 2016
% Total 2015
% Total 2014
% Total 2013
%
For which of the following reasons, if any, would you not reach out to a professional non-profit credit counseling agency for help if you were having financial problems related to debt? *
Base: Adults 18+
(n=1,649) (n=1,668) (n=2,017) (n=2,016) (n=2,037)
A B C D E
Would Not Reach Out To Professional Non-Profit Credit Counseling Agency (Net)
58 C 59 CDE 53 55 55
I can resolve my own problems without outside help. 23 21 22 24 B 22
Credit counseling might cost too much. 17 C 17 C 14 15 17 C
I don’t know which agency to turn to. 15 D 16 CD 13 12 18 ACD
I’ve never heard of professional non-profit credit counseling agencies. 11 14 ACDE 11 10 11
I would be embarrassed to discuss my financial problems with a stranger.
8 C 9 CD 6 7 8 C
It might hurt my credit report and credit score. 8 C 9 CD 5 7 C 9 CD
Credit counseling agencies only offer advice, not real solutions. 8 CE 9 CDE 6 7 6
Debt settlement seems like a better solution. 5 CD 5 CD 3 3 4
I might be required to close all my credit card accounts. 5 BCD 3 3 3 5 BCD
It’s easier to file bankruptcy. 4 BCD 2 2 2 3 CD
I trust my creditors to offer me the best solution. 4 D 4 D 3 D 2 3 D
Some other reason 6 6 5 6 5
Not sure 18 18 22 ABDE 18 19
None – if I were having financial problems related to debt, I would reach out to a professional non-profit credit counseling agency for help.
24 23 25 27 AB 27 AB
29
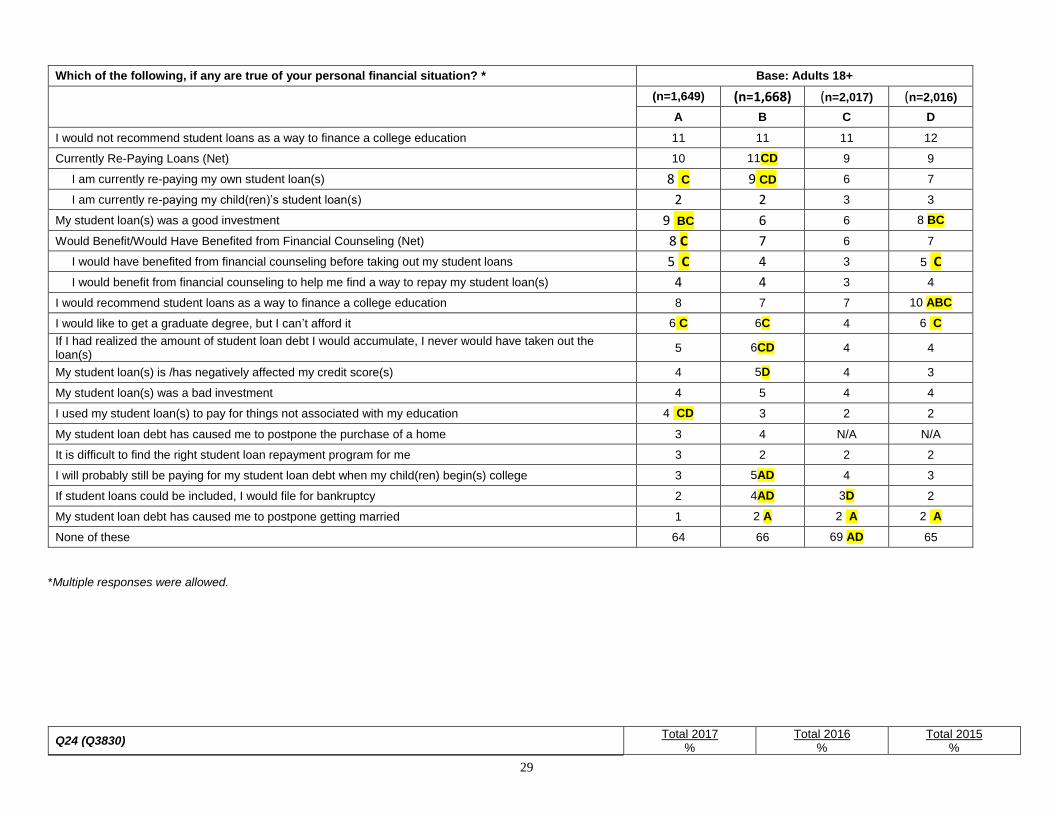
Which of the following, if any are true of your personal financial situation? * Base: Adults 18+
(n=1,649) (n=1,668) (n=2,017) (n=2,016)
A B C D
I would not recommend student loans as a way to finance a college education 11 11 11 12
Currently Re-Paying Loans (Net) 10 11CD 9 9
I am currently re-paying my own student loan(s) 8 C 9 CD 6 7
I am currently re-paying my child(ren)’s student loan(s) 2 2 3 3
My student loan(s) was a good investment 9 BC 6 6 8 BC
Would Benefit/Would Have Benefited from Financial Counseling (Net) 8 C 7 6 7
I would have benefited from financial counseling before taking out my student loans 5 C 4 3 5 C
I would benefit from financial counseling to help me find a way to repay my student loan(s) 4 4 3 4
I would recommend student loans as a way to finance a college education 8 7 7 10 ABC
I would like to get a graduate degree, but I can’t afford it 6 C 6C 4 6 C
If I had realized the amount of student loan debt I would accumulate, I never would have taken out the loan(s)
5 6CD 4 4
My student loan(s) is /has negatively affected my credit score(s) 4 5D 4 3
My student loan(s) was a bad investment 4 5 4 4
I used my student loan(s) to pay for things not associated with my education 4 CD 3 2 2
My student loan debt has caused me to postpone the purchase of a home 3 4 N/A N/A
It is difficult to find the right student loan repayment program for me 3 2 2 2
I will probably still be paying for my student loan debt when my child(ren) begin(s) college 3 5AD 4 3
If student loans could be included, I would file for bankruptcy 2 4AD 3D 2
My student loan debt has caused me to postpone getting married 1 2 A 2 A 2 A
None of these 64 66 69 AD 65
*Multiple responses were allowed.
Q24 (Q3830) Total 2017 %
Total 2016 %
Total 2015 %
30
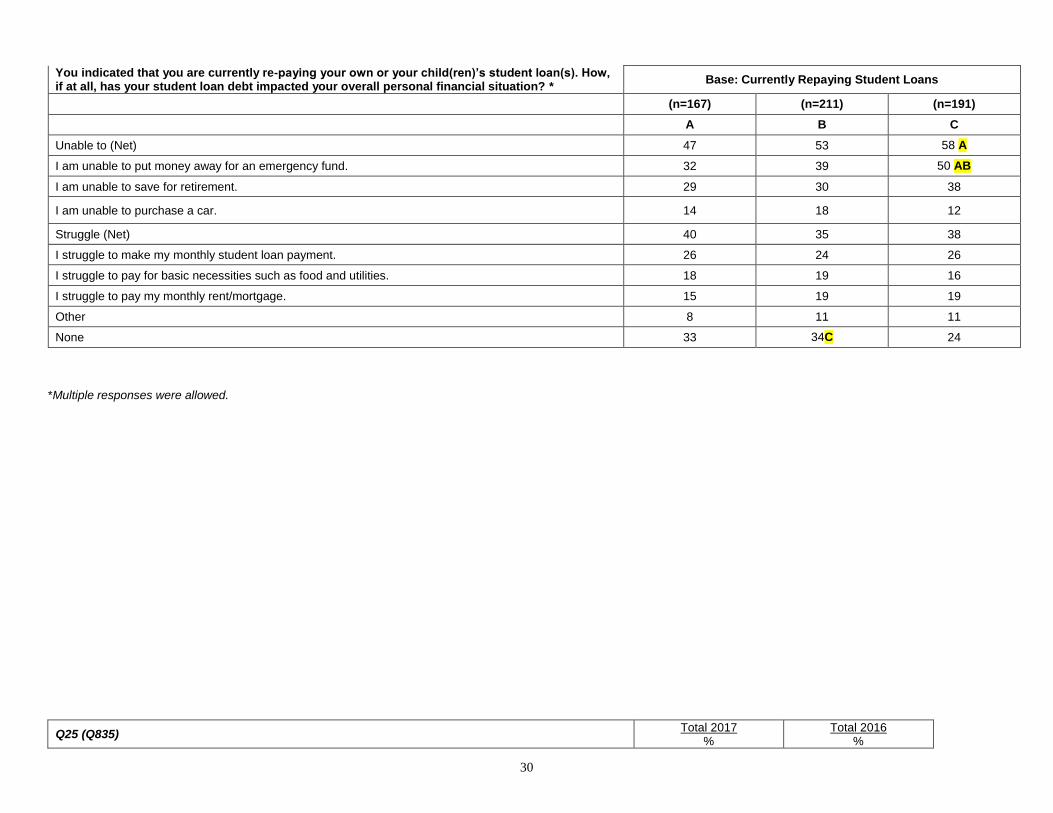
You indicated that you are currently re-paying your own or your child(ren)’s student loan(s). How, if at all, has your student loan debt impacted your overall personal financial situation? *
Base: Currently Repaying Student Loans
(n=167) (n=211) (n=191)
A B C
Unable to (Net) 47 53 58 A
I am unable to put money away for an emergency fund. 32 39 50 AB
I am unable to save for retirement. 29 30 38
I am unable to purchase a car. 14 18 12
Struggle (Net) 40 35 38
I struggle to make my monthly student loan payment. 26 24 26
I struggle to pay for basic necessities such as food and utilities. 18 19 16
I struggle to pay my monthly rent/mortgage. 15 19 19
Other 8 11 11
None 33 34C 24
*Multiple responses were allowed.
Q25 (Q835) Total 2017
% Total 2016
%

31
Considering the current housing market, which do you feel is the more affordable option? Base: Adults 18+
(n=1,649) (n=1,668)
A B
Renting 23 23
Buying 56 56
Not at all sure 21 21
Q26 (Q900) Total 2017
%
How knowledgeable are you about each of the following? 1.The fees (amount and for what) your bank/ financial institution
charges Base: Adults 18+
(n=1,649)
Very/Somewhat Knowledgeable (Net) 77
Very knowledgeable 30
Somewhat knowledgeable 47
Not at all/ Not Very Knowledgeable (Net) 23
Not very knowledgeable 13
Not at all knowledgeable 10
Q27 (Q900) Total 2017
%

32
How knowledgeable are you about each of the following? 2. Payday loans and other types of high-interest short-term loans (e.g.,
car title loans, pawn shop loans) Base: Adults 18+
(n=1,649)
Very/Somewhat Knowledgeable (Net) 47
Very knowledgeable 17
Somewhat knowledgeable 30
Not at all/ Not Very Knowledgeable (Net) 53
Not very knowledgeable 19
Not at all knowledgeable 34
Q28 (Q905) Total 2017
%
Which of the following factors are most influential when you decide how to pay in certain situations (i.e., cash vs. debit vs. credit)? Please select all that apply.
Base: Adults 18+
(n=1,649)
Amount 48
The points/rewards I can earn by using my credit card 39
Where/how I'm shopping (i.e., online vs. brick-and-mortar store) 37
The types of payment accepted where I am shopping 34
Desire to simplify or track my spending 23
Interest rates 22
Whether I need cash back at the time of my purchase 17
I do not use debit or credit cards 5
Other 6
* Multiple responses were allowed.
Q29 (Q910) Total 2017
%

33
How much cash do you typically carry with you on a daily basis? Base: Adults 18+
(n=1,649)
$0, or None 14
$1 or more (Net) 86
$1 to less than $100 (Sub-Net) 66
$1 - $5 6
$6 - $10 8
$11 - $20 22
$21 - $30 7
$31 - $40 7
$41 - $50 11
$51 - $99 5
$100 or more (Sub-Net) 20
$100 - $199 11
$200+ 9
Mean (incl. 0) $131
Median (incl. 0) $25
Mean (excl. 0) $152
Median (excl. 0) $40
Q30 (Q915) Total 2017
%

34
What is the maximum fee you would be willing to pay to use your debit card to take out cash from an out-of-network ATM?
Base: Adults 18+
(n=1,649)
$0, or None 42
$1 or more (Net) 58
$1 to less than $5 (Sub-net) 39
$1 11
$2 14
$3 13
$4 1
$5 or more (Sub-net) 19
$5 5
$6-$10 2
$11-$99 4
$100+ 8
Mean (incl. 0) $154
Median (incl. 0) $1
Mean (excl. 0) $264.5
Median (excl. 0) $3
Q31 (Q920) Total 2017
%

35
Have you taken out a payday loan or other type of short-term loan (e.g., car title loan, pawn shop loan) either for yourself or a friend or family member in the past 12 months? Please select all that apply.
Base: Adults 18+
(n=1,649)
Yes (Net) 9
Yes, I have taken out a payday/short-term loan for myself in the past 12 months
7
Yes, I have taken out a payday/short-term loan to help a friend or family member in the past 12 months
3
No, I have not taken out a payday/short-term loan in the past 12 months 88
Not sure 3
* Multiple responses were allowed.
Q32 (Q925) Total 2017
%
Why did you take out a payday or short-term loan in the past 12 months?
Base: Have Taken Out Payday/ Short-Term Loan In
Past 12 Months
(n=1,649)
To pay for an unplanned emergency expense 49
Needed cash to smooth out monthly finances 41
To pay off debt 30
To pay for general discretionary expenses 23
Couldn't get a loan elsewhere 21
Other 2
* Multiple responses were allowed.