the 2020 african-american market report - claritas
TRANSCRIPT

1
The 2020 African-American Market Report
The African American Market Report — ©2020 Claritas, LLC.
In celebration of Black History Month, Claritas has dipped into our extensive data lake to create our first African-American Market Report, providing in-depth insights into the changing face of the African-American consumer market.
In this report of the Claritas New American Mainstream series, we’ll explore the Black segment in great detail, including their population growth, household income, media behaviors and consumer spending within key categories.
Currently, more than 42 million Blacks live in the United States. The median age for Black females is 34.3 and 31.2 for Black males. Continue reading to see why you can’t afford to ignore this consumer segment.
Numbering over42 million in 2019, Blacks in the U.S. represent approximately 12% of the population
2
Executive Summary
Although, the U.S. ad expenditure in 2019 amounted to over $240 billion, up from $223.7 billion recorded in 2018, new research from Nielsen suggests that advertisers spent a total of 5% less on Black-focused media between 2017 and 2018. This under-representation in media spend for Blacks is rather shocking, especially knowing that this segment commands $1.3 trillion in annual buying power and holds a staggering aggregate spend worth $780 billion.
Moreover, other research suggests that the spend for Blacks, who represent 12.2% of the total U.S. population, accounted for only 1.4% share of targeted U.S. advertising and brand activation spending. In fact, media spend designed to reach Black consumers decreased year-over-year in all areas, including network TV (-13%), digital (-12%) and syndicated TV (-11%). These meager marketing investments targeting the under-valued Black consumer market suggests that corporate America has inadequate knowledge of the value of marketing to Blacks and the effect it may have on their bottom line.
To win in the new, more diverse marketplace of the 21st century and to fully-capitalize on this opportunity, marketing to Blacks must become a part of the overall corporate business strategy. This means replacing assumptions with information, ethnic and social stereotypes with facts and insights, committing to real funding, and establishing a dedicated corporate infrastructure that supports targeted marketing from top to bottom.
With this report, we intend to provide you with in-depth quantitative and qualitative data on U.S. Blacks, including their demographics, economics, cultural insights and buying trends. In summation, this report will give you the understanding needed to genuinely engage this valuable population segment and feel more secure in developing marketing strategies that will help your business gain their share of this large, fast-growing, and influential market. Any organization ignoring the importance, evolution, and influence of this projected trillion-dollar market segment may be losing valuable market share to competitors who have already committed to increasing top line sales by focusing on the Black consumer market.
The African American Market Report — ©2020 Claritas, LLC.

U.S. Black 2019 Population FactsCurrently, there are 131,815,386 multicultural Americans in the U.S. and they account for 37.5% of the U.S. population. Blacks account for 32.5% of the multicultural segment.
3
62.5%
12.2%
5.8%
19.5%
37.5%
Non-Hispanic All OthersNon-Hispanic BlackNon-Hispanic Asian & Pacific IslanderHispanic
Population Growth 1990-2019
10.44% 16.60% 20.61%13.51%
14.56% 12.03%
40.75%
55.77%68.02%
35.30%
13.06%
0%
25%
50%
75%
100%
Growth 1990-2000 Growth 2000-2010 Growth 2010-2019
Non-Hispanic Asian & Pacific Islander Non-Hispanic BlackHispanic All Other Non-Hispanic
Source: U.S. Census Bureau for 1990-2010 and Claritas AMDS 2019
Since 2010, Blacks experienced a 12% growth in population
All Other non-Hispanic: - 0.66%
Source: Claritas AMDS 2019
The African American Market Report — ©2020 Claritas, LLC.

Percent of the U.S. Population: 1990-2024
Blacks and Hispanics have become a larger portion of our nation’s population. Meanwhile, the Non-Hispanic White population proportion has been declining steadily as a proportion of overall American population.
4
75.8%
69.1%
63.7% 62.6%60.5%
11.8% 12.0% 12.2% 12.2% 12.2%
2.8% 3.7% 4.8% 5.6% 6.1%8.8%
12.5%16.3%
19.6% 21.1%
0%
10%
20%
30%
40%
50%
60%
70%
80%
1990 2000 2010 2019 2024
N-Hispanic All Others N-H Black N-H Asian & PI Hispanic
In 1990, the U.S. Black population was 29,930,490. By 2019, this population has grown by 40%to more than 42 million
Perc
ent P
opul
atio
n
Source: U.S. Census Bureau for 1990-2010 and Claritas AMDS Projections for 2019-2024.
The African American Market Report — ©2020 Claritas, LLC.

80.1% 75.2%64.4%
50.5%41.5%
7.6%9.4%
12.0%
12.9%
13.4%
3.8% 5.0%6.0%
8.1%
5.6%
7.8% 9.9%16.1%
25.3%32.1%
0.7% 0.5% 1.5% 3.2%7.4%
0%
10%
20%
30%
40%
50%
60%
70%
80%
90%
100%
Age 75+ Boomer 1946-65 Gen X 1966-80 Millennial (Gen Y)1981-97
Age 0-4
Perc
ent o
f Tot
al G
ener
atio
n C
ohor
t
Younger age groups are made up from a more diverse population, while older age groups tend to be less diverse. This dramatic trend in ethnicity by generation will have deep implications for marketers in the years and decades to come as they consume products and use and react to media differently, requiring a more personalized approach.
5
Source: U.S. Census Bureau for 1990-2010 and Claritas AMDS Projections for 2019-2024.
Generational Population 2024 - Nationwide
Non-Hispanic OtherHispanicNon-Hispanic AsianNon-Hispanic BlackNon-Hispanic White
The African American Market Report — ©2020 Claritas, LLC.
By 2024, the U.S. Black population will grow to almost 44 million

6
2019 U.S. Black Population Distribution by DMA
Source: Claritas AMDS 2019
Where Does the Black Population Live? When looking at the top census region, 60% of the Black population reside in the South. Moreover, when looking at the top census division, 36% of the Black population reside in the South Atlantic. When looking at the top DMA’s by count, New York, Atlanta, Washington DC, Chicago and Philadelphia came out on top. When looking at growth areas, the Black presence is showing significant growth in areas such as Atlanta, Houston, Dallas, Orlando, Tampa and New Orleans. Interestingly, areas seeing additional growth also include states such as Washington, Colorado, Arizona and Wyoming.
Top 20 DMAs By Black Count vs. Growth, 2010-2019
New
York Atlanta
Washington, D
C
Chicago
Philadelphia
Houston
Los Angeles
Dallas-Ft. W
orth
Miam
i-Ft. Lauderdale
Detroit
Raleigh-Durham
Baltimore
Mem
phis
Charlotte
Orlando
Norfolk
Tampa-St.PetersburgC
leveland-Akron
New
Orleans
St. Louis
0
10
20
30
40
50
60
0
2
4
6
8
10%persons, million Black Population, 2019 % Growth, 2010-2019
The African American Market Report — ©2020 Claritas, LLC.
Source: Claritas AMDS 2019
7
$60,194
$70,727
$43,966
$91,414
$51,747
$0
$10,000
$20,000
$30,000
$40,000
$50,000
$60,000
$70,000
$80,000
$90,000
$100,000
Total White Black Asian & P.Islander
Hispanic
Annu
al H
H In
com
e (D
olla
rs)
Median Annual Household Income
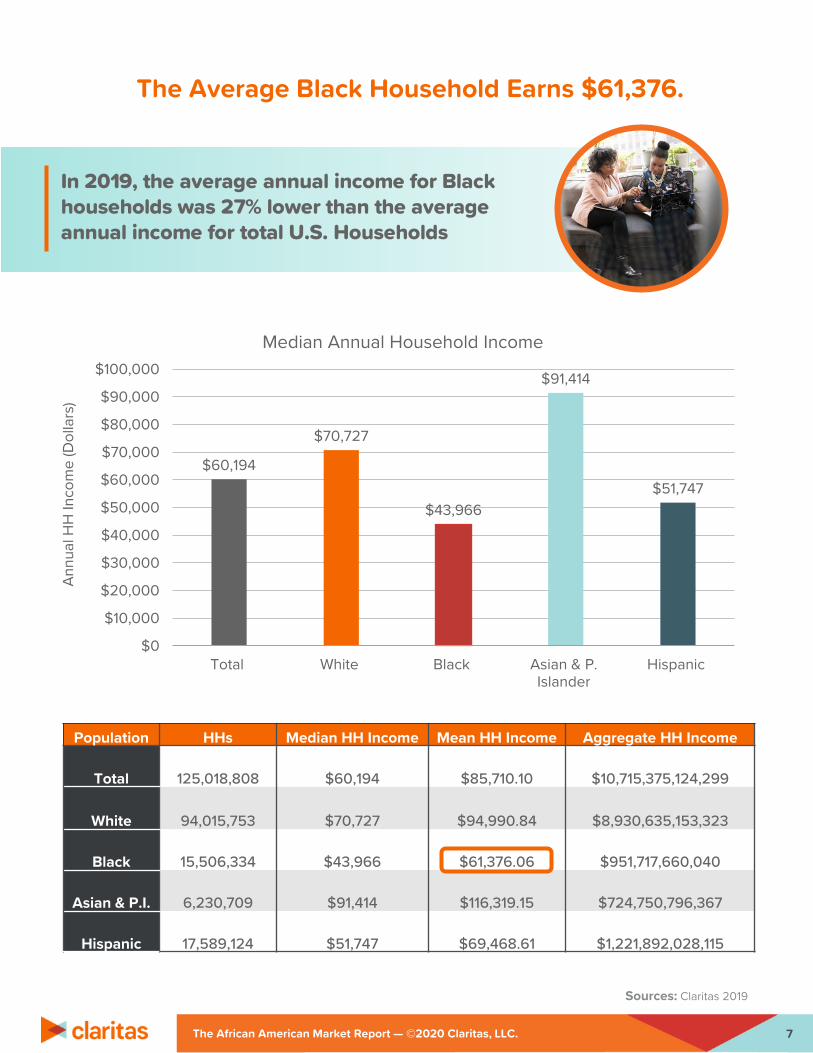
The Average Black Household Earns $61,376.
Population HHs Median HH Income Mean HH Income Aggregate HH Income
Total 125,018,808 $60,194 $85,710.10 $10,715,375,124,299
White 94,015,753 $70,727 $94,990.84 $8,930,635,153,323
Black 15,506,334 $43,966 $61,376.06 $951,717,660,040
Asian & P.I. 6,230,709 $91,414 $116,319.15 $724,750,796,367
Hispanic 17,589,124 $51,747 $69,468.61 $1,221,892,028,115
The African American Market Report — ©2020 Claritas, LLC.
In 2019, the average annual income for Black households was 27% lower than the average annual income for total U.S. Households
Sources: Claritas 2019

Black consumers are less likely than average to have a desktop or laptop, and more likely to own a smartphone, specifically an iPhone or a Samsung device. Also, when looking at the top wireless/cell phone carriers by count, Black consumers have more wireless accounts with Verizon Wireless and AT&T, but were more than twice as likely to use Boost Mobile and Metro by T-Mobile as represented by the indices below.
Blacks Are More Likely To Own A Smartphone. In Fact, They’re More Likely To Own A Samsung or iPhone.
13
21
27
16
0
5
10
15
20
25
30
Desktop Laptop Smartphone Tablet
Adul
ts (I
n M
illio
ns)
Computer/Mobile Devices Currently Owned by Blacks
Index 89
Index 96
Index 103
Index 93
3%
26%
2%
15%3%
29%
7%
15%
Wireless Cell Phone Brands Owned by Blacks
Alcatel
iPhone
HTC
LG
Motorola
Samsung
ZTE
Index 82
Index 274
Index 149
Index 226
Index 115
Index 113
Index 115
Index 88
Index 62
Index 154Index 70
8The African American Market Report — ©2020 Claritas, LLC.
Sources: Nielsen Scarborough 2018, Claritas 2019
5,609,429
1,926,262
1,210,539
3,941,922
2,762,975
944,658
3,908,366
920,485
5,661,158
375,311831,629
0
1,000,000
2,000,000
3,000,000
4,000,000
5,000,000
6,000,000
AT&T BoostMobile
Cricket Metro byT-Mobile
Sprint StraightTalk
T-Mobile TracFone VerizonWireless
VirginMobile
None
Adul
ts (I
n M
illio
ns)
Wireless/Cell Phone Carriers Currently Used by Blacks

By count, the top 3 streaming services visited/apps used by Blacks in the past 30 days were YouTube, Netflix and Pandora. The top internet sites visited/apps used were Google, Amazon and Yahoo. The top social media sites used by Blacks were Facebook and Instagram. In contrast, Blacks also over-index for using Groupon, Coupons.com and CareerBuilder.com websites.
Top Internet Sites Visited/Apps Used By Blacks In 2019 Were, YouTube, Netflix, Google, Amazon, Facebook And Instagram.
0
2
4
6
8
10
12
14
16
Adul
ts (I
n M
illio
ns)
Top Streaming Services Visited/Apps Used by Blacks
17,220,235
7,433,3708,715,357
3,659,6655,165,434 5,301,853 4,810,751
91
112103
79 79
92 94
0
20
40
60
80
100
120
02,000,0004,000,0006,000,0008,000,000
10,000,00012,000,00014,000,00016,000,00018,000,000
20,000,000
Facebook Google+ Instagram LinkedIn Pinterest Snapchat Twitter
Adul
ts (I
n M
illio
ns)
Top Social Media Sites Visited/Apps Used by Blacks
Count Index
Index
9The African American Market Report — ©2020 Claritas, LLC.
110121
231
145
0
50
100
150
200
250
0
5
10
15
20
25
Goo
gle
Am
azon
Yah
oo!
eBa
y G
roup
on C
raig
sLis
t E
SPN
CN
N B
ing
FO
XNew
s C
oupo
ns.c
om N
BCN
ews
Yel
p H
uffin
gton
Pos
t R
etai
lMeN
ot C
aree
rBui
lder
AAR
P
Adul
ts (I
n M
illio
ns)
Top Internet Sites Visited/Apps Used by Blacks
Count Index
Index
Sources: Nielsen Scarborough 2018, Claritas 2019
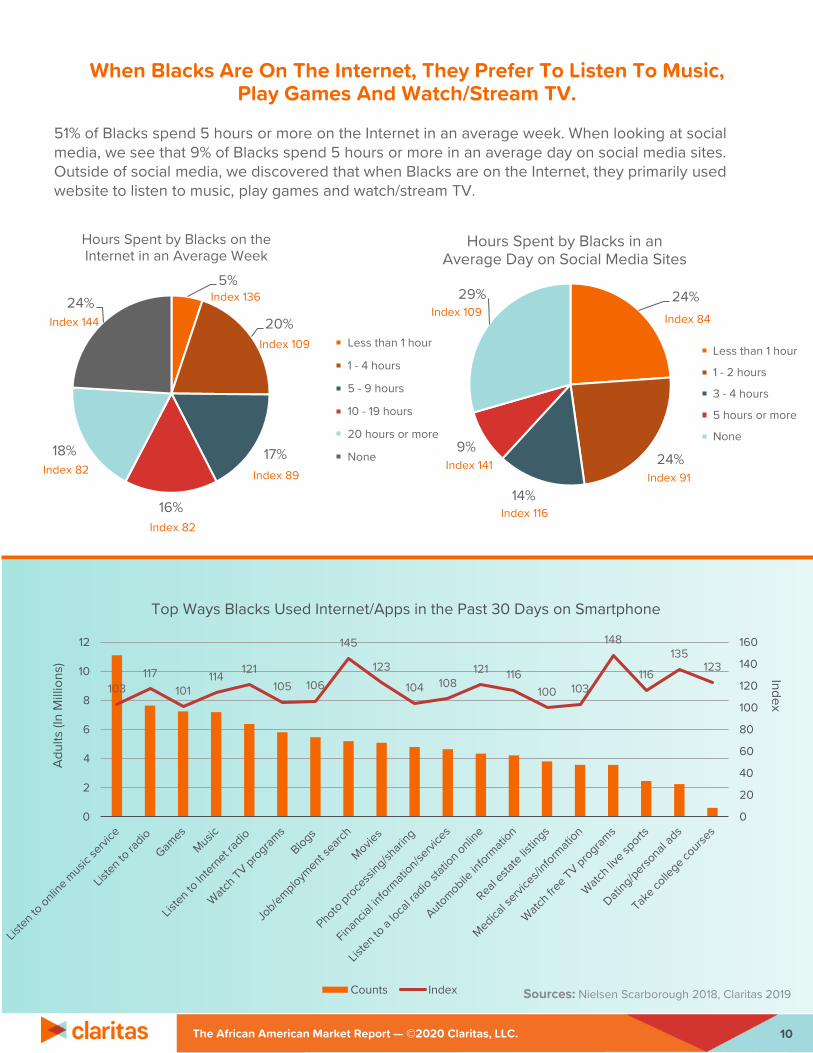
When Blacks Are On The Internet, They Prefer To Listen To Music, Play Games And Watch/Stream TV.
10The African American Market Report — ©2020 Claritas, LLC.
5%
20%
17%
16%
18%
24%
Hours Spent by Blacks on the Internet in an Average Week
Less than 1 hour
1 - 4 hours
5 - 9 hours
10 - 19 hours
20 hours or more
None
Index 136
Index 109
Index 89
Index 82
Index 82
Index 144
103117
101114 121
105 106
145
123
104 108121 116
100 103
148
116
135123
0
20
40
60
80
100
120
140
160
0
2
4
6
8
10
12
Adul
ts (I
n M
illio
ns)
Top Ways Blacks Used Internet/Apps in the Past 30 Days on Smartphone
Counts Index
Index
51% of Blacks spend 5 hours or more on the Internet in an average week. When looking at social media, we see that 9% of Blacks spend 5 hours or more in an average day on social media sites. Outside of social media, we discovered that when Blacks are on the Internet, they primarily used website to listen to music, play games and watch/stream TV.
24%
24%
14%
9%
29%
Hours Spent by Blacks in an Average Day on Social Media Sites
Less than 1 hour
1 - 2 hours
3 - 4 hours
5 hours or more
None
Index 84
Index 91
Index 116
Index 141
Index 109
Sources: Nielsen Scarborough 2018, Claritas 2019
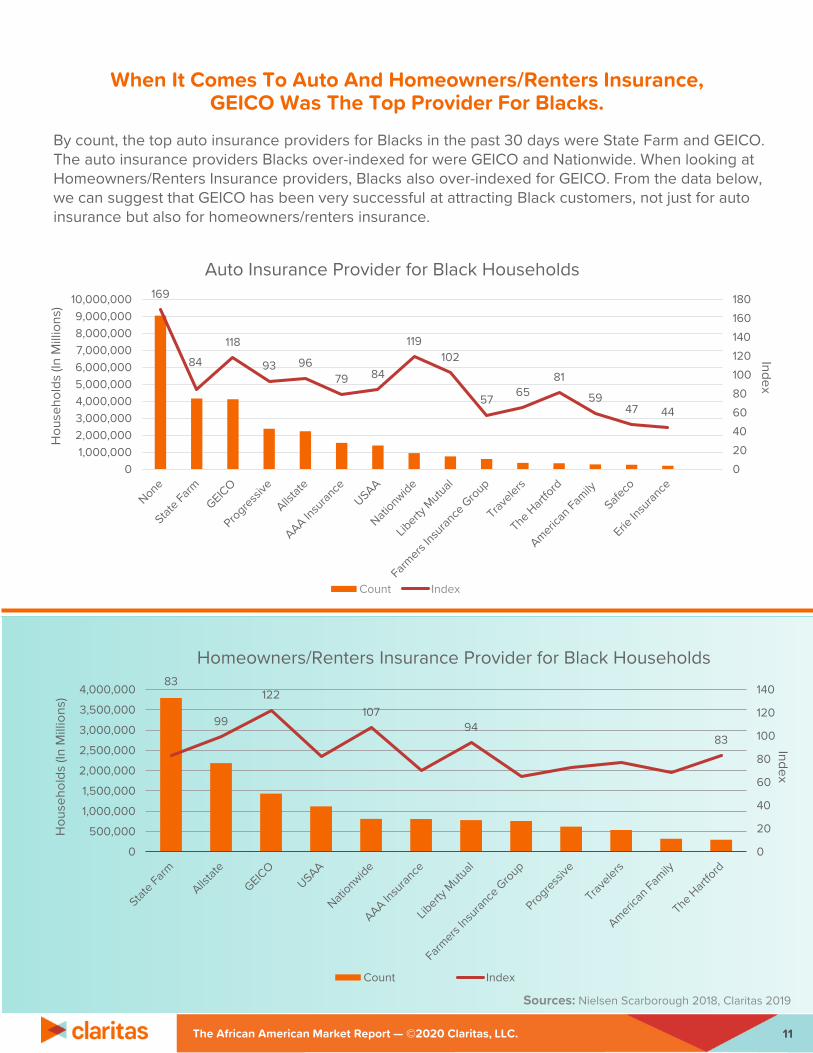
When It Comes To Auto And Homeowners/Renters Insurance, GEICO Was The Top Provider For Blacks.
11The African American Market Report — ©2020 Claritas, LLC.
83
99
122107
9483
0
20
40
60
80
100
120
140
0
500,000
1,000,000
1,500,000
2,000,000
2,500,000
3,000,000
3,500,000
4,000,000
Hou
seho
lds
(In M
illio
ns)
Homeowners/Renters Insurance Provider for Black Households
Count Index
By count, the top auto insurance providers for Blacks in the past 30 days were State Farm and GEICO. The auto insurance providers Blacks over-indexed for were GEICO and Nationwide. When looking at Homeowners/Renters Insurance providers, Blacks also over-indexed for GEICO. From the data below, we can suggest that GEICO has been very successful at attracting Black customers, not just for auto insurance but also for homeowners/renters insurance.
IndexIndex
Sources: Nielsen Scarborough 2018, Claritas 2019
169
84
118
93 9679 84
119102
57 6581
5947 44
020406080100120140160180
01,000,0002,000,0003,000,0004,000,0005,000,0006,000,0007,000,0008,000,0009,000,000
10,000,000
Hou
seho
lds
(In M
illio
ns)
Auto Insurance Provider for Black Households
Count Index

12
Black Household Consumer ExpendituresOn average, Black households spend $50,333 annually on goods and services. Selected categories for which Black households spend more than the average U.S. household by amount are skin items, athletic shoes, cosmetics/perfumes and women’s clothing. Selected categories for which Black household spending over-indexed are costume jewelry, women’s business clothing and fine jewelry. In the following sections, we’ll provide a detailed picture of their spending within these categories:
The African American Market Report — ©2020 Claritas, LLC.
9799 97 95
104110
78 86
112
92
126 123 120
87
64
0
20
40
60
80
100
120
140
0
2,000,000
4,000,000
6,000,000
8,000,000
10,000,000
12,000,000
14,000,000
Adul
ts (I
n M
illio
ns)
Items Bought By Blacks in the Past 12 Months
Count Index
APPAREL1
PERSONAL CARE2
FOOD AT HOME3
FOOD AWAY FROM HOME4
ENTERTAINMENT5
Index
Sources: Nielsen Scarborough 2018, Claritas 2019

13The African American Market Report — ©2020 Claritas, LLC.
202
140153 164
146
0
50
100
150
200
250
0
2
4
6
8
10
12
14
16
Wal
mar
t T
arge
t J
CPe
nney
Mac
y's
Bur
lingt
on O
ld N
avy
Koh
l's R
oss
Dre
ss F
or L
ess
Mar
shal
ls T
J M
axx
Sam
's C
lub
Vic
toria
's Se
cret
For
ever
21
The
Chi
ldre
n's
Plac
e K
mar
t H
&M S
ears
Dill
ard'
s G
ap/G
ap K
ids
Adul
ts (I
n M
illio
ns)
Clothing Stores Where Blacks Bought in the Past 3 Months
Count Index
115
185
102
157
0
20
40
60
80
100
120
140
160
180
200
0
1
2
3
4
5
6
Adul
ts (I
n M
illio
ns)
Sports Apparel With Team Logos Bought by Blacks in the Past 12 Months
Count Index
Black Consumer Spending: ApparelBlack households on average spend approximately $1,900 annually on apparel and related services – 6% less than the average U.S. household.
Even though Blacks spend less on apparel and services on average, there are some subcategories where they spend more than the average U.S. household. For example, Black households on average spend $164 annually on men’s footwear, which is 4% above the national average. They also spend 6% more on boy’s footwear and 6% more on boy’s coats and jackets.
The top clothing store for which Black household spending over-indexed for apparel purchases made in the past 3 months was Burlington. Additionally, NBA sports apparel with team logos was the most popular category by index over the past 12 months. NFL sport apparel with team logos was also very popular among Black consumers.
Index
Index
Sources: Nielsen Scarborough 2018, Claritas 2019

14The African American Market Report — ©2020 Claritas, LLC.
137
169
202
132
0
50
100
150
200
250
0
1
2
3
4
5
6
7
8
Hou
seho
lds
(In M
illio
ns)
Stores Where Blacks Bought Most of Their Groceries
Count Index
115 135 80 100
020406080100120140160
0
2
4
6
8
10
Agreesomewhat
Agreecompletely
Disagreesomewhat
Disagreecompletely
Adul
ts (
In M
illio
ns)
I Don't Allow Junk Food in my Home
Count Index
106 9192
127
020406080100120140
02468
1012
Agreesomewhat
Agreecompletely
Disagreesomewhat
Disagreecompletely
Adul
ts (I
n M
illio
ns)
I Rarely Eat Frozen Dinners at Home
Count Index
IndexIndex
Black Consumer Spending: Food At Home
Index
Black households on average spend around $3,553 annually on Food at Home – 14% less than the average U.S. household.
Even though Blacks spend less on Food at Home on average, there are some subcategories where they are equal or spend more than the average U.S. household. For example, Black households on average spend 4% more on pork chops, 2% more on fresh fruit juice and equal the national average on poultry, fresh and frozen chicken and fine sugar.
The top store for which Black households bought most of their groceries was Walmart. Blacks also over-indexed for "agreeing that they do not allow junk food in their homes" and that they "rarely eat frozen dinners" at home.
Sources: Nielsen Scarborough 2018, Claritas 2019

15The African American Market Report — ©2020 Claritas, LLC.
296311
232
0
50
100
150
200
250
300
350
0
1
2
3
4
5
6
McD
onal
d's
Pop
eyes
KFC
Piz
za H
ut W
endy
's T
aco
Bell
Bur
ger K
ing
Litt
le C
aesa
rs S
ubw
ay C
hick
-fil-A
Dom
ino'
s P
apa
John
's Pi
zza
Chu
rch'
s C
hick
en C
hipo
tle Z
axby
's
Adul
ts (I
n M
illio
ns)
QSR's Used by Blacks For Dinner in Past 30 Days
Count Index
260236
360
0
50
100
150
200
250
300
350
400
0
1
2
3
4
5
6
7
8
9
McD
onal
d's
Bur
ger K
ing
Sub
way
Wen
dy's
Chi
ck-fi
l-A T
aco
Bell
Pop
eyes
KFC
Arb
y's
Chi
potle
Pan
era
Brea
d Z
axby
's L
ittle
Cae
sars
Chu
rch'
s C
hick
en P
izza
Hut
Adul
ts (I
n M
illio
ns)
QSR's Used by BlacksFor Lunch in Past 30 Days
Count Index
Index
Index
Black Consumer Spending: Food Away From HomeBlack households on average spend around $2,722 annually on food & non-alcoholic beverages away from home.
Even though Blacks spend less on food & non-alcoholic beverages on average, there are some subcategories where they are close to the national average spend. For example, Black households on average spend only 8% less annually on breakfast away from home.
Blacks also are more likely to "use a quick service restaurant 10 times or more in the past 30 days" and when considering lunch & dinner, the top QSR’s by index for Blacks were Church’s Chicken, Popeyes and Zaxby’s. However by count, McDonald's ranks at the top for lunch and dinner purchases in the past 30 days and sandwich QSR chains are the predominant choice among Blacks for lunch.
Sources: Nielsen Scarborough 2018, Claritas 2019

16The African American Market Report — ©2020 Claritas, LLC.
101
265
141
182
150163
0
50
100
150
200
250
300
0
1
2
3
4
5
6
7
8
9
10
Adul
ts (I
n M
illio
ns)
Events Attended/Places Visited by Blacks
Count Index
102 104
113
0
20
40
60
80
100
120
0
2
4
6
8
10
12
14
16
18
None 1 time 2 times 3 times 4 timesor more
Adul
ts (I
n M
illio
ns)
No. of Times Blacks Attended Movie Theater in the Past 3 Months
Count Index
Index
Black Consumer Spending: EntertainmentBlack households on average spend more than $2,000 annually on entertainment.
Even though Blacks spend less on entertainment on average, there are some subcategories where they spend at or above the average U.S. household. For example, Black households on average spend equal to the average annual spend on Cable, Communication, and Satellite Services and Dishes. They also spend equal to the average annual spend on Online Entertainment and Games.
Also, by count, the average Black household prefers to attend professional sporting events, and they over-index for attending R&B/Rap/Hip-Hop concerts, Job Fairs and Health/Fitness Expos. When looking at the number of times Blacks attended the movie theater in the past 3 months, they indexed highest at 113 for attending a movie theater 4 times or more in the past 3 months.
Index
Sources: Nielsen Scarborough 2018, Claritas 2019

To learn more about how to find your next multicultural consumer, visit www.claritas.com or call 800.234.5973.
About ClaritasClaritas helps companies identify customers. Not just any customers–their best customers. We help engage and deliver those customers when and where they want to be engaged. And finally, we help clients optimize those engagements with remarkable transparency and precision in near-real-time.
Our tools and data define who your best customers are, how they behave, and how to connect with them. With powerful original research, trusted data partnerships, and an expert Analytics team, we provide the why behind the buy that is the key to selling smarter and winning bigger.
Targeting the New American MainstreamTo capture multicultural growth opportunities, you must first understand them: their likes, dislikes, preferences, behaviors, etc. These insights let you create personas, tailor messages and promotions specific to their wants and needs. Marketers leverage Claritas’ deep understanding of multicultural segments, using tools, such as CultureCodes across local, national and digital markets for smarter targeting, smarter planning and smarter buying to help drive bigger profits.
Multicultural Insights to Shape a Smarter PlanData from Claritas can be applied to a wide variety of situations and challenges using computerized applications, such as Claritas’ online Geoscape Intelligence System (GIS). Some of the applications are listed below.
• Strategic Planning• Market Potential Assessment• Product Development & Positioning• Database mining & modeling• Retail Site Selection & Distribution• Marketing Communications & Media Planning• Promotions & Direct Response• Market Research: Surveys, Focus Groups, etc.• Industry specific intelligence applications• Sales potential and forecasting• Consumer segmentation and targeting• Customer relationship management• Investment Valuation• Public & Social Services• Budget Allocation• Staffing• In-store experience management• Retail shelf-space planning
17The African American Market Report — ©2020 Claritas, LLC.