the 30th september 2009 west sumatra earthquake · the 30th september 2009 west sumatra earthquake...
TRANSCRIPT

G E O S C I E N C E A U S T R A L I A
Padang Region Damage Survey
Sengara, I.W.; Suarjana, M.; Beetham, D.; Corby, N.; Edwards, M.; Griffith, M.; Wehner, M.; Weller, R.
APPLYING GEOSCIENCE TO AUSTRALIA’S MOST IMPORTANT CHALLENGES
Record
2010/44
The 30TH September 2009 West Sumatra Earthquake
GeoCat # 70863
The 30th September 2009 West Sumatra Earthquake Padang Region Damage Survey GEOSCIENCE AUSTRALIA RECORD 2010/44 by Sengara, I.W.1, Suarjana, M.1, Beetham, D.2, Corby, N.3 Edwards, M.3, Griffith, M.4, Wehner, M.3, Weller, R.5
1. Institut Teknologi Bandung 2. GNS New Zealand 3. Geoscience Australia 4. University of Adelaide 5. Cardno
Department of Resources, Energy and Tourism Minister for Resources and Energy: The Hon. Martin Ferguson, AM MP Secretary: Mr Drew Clarke
Geoscience Australia Chief Executive Officer: Dr Chris Pigram © Commonwealth of Australia, 2010 This work is copyright. Apart from any fair dealings for the purpose of study, research, criticism, or review, as permitted under the Copyright Act 1968, no part may be reproduced by any process without written permission. Copyright is the responsibility of the Chief Executive Officer, Geoscience Australia. Requests and enquiries should be directed to the Chief Executive Officer, Geoscience Australia, GPO Box 378 Canberra ACT 2601. Geoscience Australia has tried to make the information in this product as accurate as possible. However, it does not guarantee that the information is totally accurate or complete. Therefore, you should not solely rely on this information when making a commercial decision. ISSN 1448-2177 ISBN 978-1-921781-55-1 GeoCat # 70863 Bibliographic reference: Sengara, I.W., Suarjana, M., Beetham, D., Corby, N., Edwards, M., Griffith, M., Wehner, M. and Weller, R. 2010. The 30th September 2009 West Sumatra Earthquake Padang Region Damage Survey. Geoscience Australia, Record 2010/44. 201pp.
The 30th September 2009 West Sumatra Earthquake Padang Region Damage Survey
III
Contents Executive Summary ......................................................................................... 1
Acknowledgements…………………………………………………………………………..……6
1 Introduction ................................................................................................ 9
2 Padang Region .......................................................................................... 10 2.1 Historical Development ......................................................................................................... 10 2.2 Built Environment Vulnerability ........................................................................................... 10 2.3 Regional Seismicity and Hazard Implications ....................................................................... 11
2.3.1 Ground Motion .............................................................................................................. 12 2.3.2 Liquefaction................................................................................................................... 15 2.3.3 Landslide ....................................................................................................................... 15 2.3.4 Tsunami ......................................................................................................................... 15
3 Earthquake Event ...................................................................................... 16 3.1 Epicentre ................................................................................................................................ 16 3.2 Nature of Faulting .................................................................................................................. 17 3.3 Hazard footprint ..................................................................................................................... 17
3.3.1 Severity of Ground Motion............................................................................................ 17 3.3.2 Liquefaction................................................................................................................... 19 3.3.3 Landslides...................................................................................................................... 19
3.4 Broad consequences............................................................................................................... 21 3.4.1 Buildings ....................................................................................................................... 21 3.4.2 Casualties....................................................................................................................... 22 3.4.3 Infrastructure Disruption ............................................................................................... 22 3.4.4 Public Response............................................................................................................. 22
4 Disaster Survey ......................................................................................... 24 4.1 Objectives .............................................................................................................................. 24 4.2 Teams and Deployment ......................................................................................................... 24 4.3 Survey Methodologies ........................................................................................................... 24
4.3.1 Building Stock Categorisation....................................................................................... 25 4.3.2 Detailed Survey of Schools and Medical Facilities ....................................................... 26 4.3.3 Population Based Survey............................................................................................... 27
5 MASW Survey and Spatial PGA Estimate ..................................................... 31 5.1 Aims and Objectives .............................................................................................................. 31 5.2 Teams..................................................................................................................................... 31 5.3 Survey and Analysis Methodologies...................................................................................... 31
5.3.1 MASW Survey .............................................................................................................. 31 5.3.2 PGA Estimation............................................................................................................. 35
5.4 PGA Spatial Distribution Results .......................................................................................... 35
6 Post Survey Analysis ................................................................................. 38 6.1 DALA Reporting ................................................................................................................... 38
The 30th September 2009 West Sumatra Earthquake Padang Region Damage Survey
6.2 Field Data Validation/Verification......................................................................................... 39 6.3 Earthquake Intensity Re-assessment...................................................................................... 39 6.4 Economic Measures for Damage ........................................................................................... 41 6.5 Vulnerability Assessment ...................................................................................................... 42 6.6 Infrastructure Disruption........................................................................................................ 47 6.7 Social Impacts........................................................................................................................ 49
7 Padang Earthquake Reconnaissance Workshop ........................................... 52 7.1 Workshop Activity................................................................................................................. 52 7.2 Workshop Outcomes.............................................................................................................. 52
7.2.1 Indonesian Seismicity and Regulation Development .................................................... 52 7.2.2 Padang Earthquake and Survey Activity ....................................................................... 52 7.2.3 MASW and PGA Estimate ............................................................................................ 53 7.2.4 Post-survey Analysis ..................................................................................................... 53 7.2.5 Building Stock Categorisation....................................................................................... 53 7.2.6 Preliminary Vulnerability Models ................................................................................. 56
7.3 Out-of-Session Vulnerability Ranking................................................................................... 59 7.4 Workshop Recommendations ................................................................................................ 60
8 Survey Findings ........................................................................................ 61 8.1 Detailed Survey of Schools and Medical Facilities ............................................................... 61
8.1.1 Observations and Findings ............................................................................................ 61 8.1.2 Recommendations ......................................................................................................... 62
8.2 Population-based Survey ....................................................................................................... 63
9 Recommendations and Future Work ............................................................ 65
10 Summary of Outcomes ............................................................................. 66
11 References .............................................................................................. 68 Appendices .................................................................................................. 71 A1 Modified Mercalli Intensity Scale and Building Irregularity Codes A2 Expert Group Reporting A3 MASW Study A4 Workshop Proceedings A5 Survey Information Metadata A6 Earthquake Damage State Descriptors
IV
The 30th September 2009 West Sumatra Earthquake Padang Region Damage Survey
1
Executive Summary BACKGROUND Natural hazard risk is high in some developing nations as a result of the nature of their building stock coupled with large populations and high natural hazard. This risk is manifested in severe events which inflict considerable damage, loss of life and place acute demands on emergency services. Ultimately, these devastating consequences can only be addressed with effective and targeted disaster risk reduction strategies. Understanding hazard, vulnerability and exposure can enable the identification of key factors contributing to community risk and assist in developing appropriate strategies for risk reduction. The establishment of the Australia-Indonesia Facility for Disaster Reduction (AIFDR) was jointly announced by Australia and Indonesia on 22 November 2008. AIFDR aims to work with Indonesian counterparts to quantify the prevailing natural disaster hazards and risks in Indonesia and then use this information to support activities, training and planning exercises for national-level and provincial-level disaster managers. The outcomes of these two activities are also shared with the region through partnerships with APEC, ASEAN and the United Nations. In this way, AIFDR will build Indonesian and regional capacity to self-manage disasters. AIFDR is a tangible response to the growing challenges posed by natural disasters to Indonesia and the Asia region. The Facility reflects Indonesia’s and Australia’s concern over the growing impact of disasters in the region, including their potential for human suffering and the reversal of hard-won development gains. THE EARTHQUAKE On 30 September 2009 a magnitude 7.6 earthquake struck West Sumatra. The exposed region is heavily populated and the earthquake significantly impacted the large coastal city of Padang. Widespread damage to buildings resulted and an estimated 1,117 lives in the Padang and Padang Pariaman Districts were lost. Thankfully the event occurred during daylight and after office hours when people were mobile and many were out of doors. The event prompted a large Indonesian relief effort which was assisted by an international response at the invitation of the Indonesian government. Significantly this was not the major plate boundary earthquake anticipated for the region, but rather an intra-plate event within the subducting tectonic plate off the Sumatran coast. The characteristics of the rupture were a high stress drop, high frequency content bedrock motions, very few aftershocks and no accompanying tsunami. THE SURVEY ACTIVITY Under its mandate the AIFDR responded to the earthquake event in pursuit of the primary objective of understanding of the factors that had contributed to the result of the earthquake. It supported a team of Indonesian and international engineers and scientists who collected and analysed damage information that could subsequently be used for future disaster risk reduction in West Sumatra and Indonesia more broadly. The activity was jointly led by the Centre for Disaster Mitigation at the Institut Teknologi Bandung (ITB) and Geoscience Australia. The teams convened in Jakarta on 22 October for a briefing by AusAID and arrived in Padang to commence work on 23 October 2009. The survey activity was undertaken from 24 October to 10 November with logistical support provided by the AIFDR.

The 30th September 2009 West Sumatra Earthquake Padang Region Damage Survey
The survey work had two primary aims. The first was to examine buildings to ascertain their performance when exposed to ground shaking and identify the structural characteristics that may have contributed to their damage state. The initial focus of this activity was on schools and medical facilities but this broadened to include other building uses and structural types. This work was undertaken by two teams of expert engineers and scientists. The second, and larger, activity was directed at systematically surveying complete populations of structures at a lower level of detail in targeted locations which were understood to cover a range of shaking intensities. This population-based survey was undertaken by eight further teams comprised of engineers and local engineering students. The work was directed at the capture of statistically useful information on building performance. Information on residential habitability, occupant injuries and utility service disruption was also captured. The activities of the combined survey group were supported by a logistical support team who provided food, accommodation, field equipment support and survey data processing. THE SURVEY OBSERVATIONS In total 3,896 buildings were surveyed in the Padang and Pariaman region. This comprised a range of types which included medical centres (108), educational buildings (460), commercial buildings (479) and residential structures (2,268). The survey work also entailed 1,700 interviews with local residents. The survey indicated widespread liquefaction and foundation related failures. Buildings of all age categories were damaged and nominally engineered structures also suffered significant damage. Often unreinforced masonry, that was not part of the structural system per se, was required to provide the needed resistance to seismic actions. Observations revealed poor structural configurations, poor detailing of reinforcement and the use of low quality construction materials. POST-SURVEY ACTIVITY It had been hoped that there would be a large variability in the hazard severity experienced across the region. Initial felt intensities were taken from individual building surveys but were found to be biased by the actual level of damage which varied from building to building. Reference to surficial geological mapping, the spatial extent of liquefaction and landslide locations resulted in Modified Mercalli Intensities (MMI) which ranged from MMI 7 to 8 (consistent with the USGS Pager assessment). This assessment was further refined by the use of the MASW survey derived peak ground accelerations (PGA) predicted by ITB. While the predicted PGA values varied across the city, conversion of these to MMI values indicated that they all fell within the MMI 8 range. Accordingly a MMI value of 8 was used as the typical ground motion intensity for the vulnerability assessment work reported herein. The field survey data collected were transcribed into digital form by the support team and linked to associated imagery (e.g. photos). In Australia this information was subjected to a record by record quality checking and editing process. In total some 70 different field staff had been involved in the information gathering and, as a result, the completeness and consistency of the field data required validation. The attributed earthquake intensity and damage data was subsequently used as validated data that could be used to develop vulnerability models. The physical damage was associated with the cost of repair using quantity surveying information sourced by ITB. Finally, for building types for which there was a useful sample size of damage observations, statistical analyses were undertaken to characterise the likelihood of each building type experiencing a specific level of damage (damage state) for the ground motion experienced in Padang.
2
The 30th September 2009 West Sumatra Earthquake Padang Region Damage Survey
The survey activity and the combined outcomes of the work were reviewed at a workshop convened at Geoscience Australia on 28 and 29 April 2010. Learnings on effective field survey processes were made, benchmark vulnerability models were derived for nine structure types, the categorisation schema for Indonesian building types was refined and a process was agreed upon for extrapolating the benchmark models to the full schema. Most importantly, the key outcomes of the survey pursuant to the original aims of the activity were distilled. OUTCOMES The survey work, post-survey analysis and workshop engagement have provided an illuminating picture of the evolution of building regulations in Indonesia and tangible evidence of the effectiveness of their implementation in local design and construction. While the current regulations align with best-practice in other earthquake prone countries they are not fully benefiting Indonesian communities in the Padang region due to shortfalls in their uptake. The survey activity was able to identify a number of factors contributing to this outcome which include poor structural configuration, poor detailing of reinforcement, the use of very poor construction materials and a lack of site investigation and specific foundation design for large buildings on soft soils. The survey has also highlighted some more recently adopted construction practices that have significantly reduced the likelihood of building damage and casualties. Confined masonry construction in particular suffered lower damage levels than the unreinforced masonry equivalent. Promotion of cost-effective construction practices which reduce vulnerability and the development of other structural systems with these attributes are central to reducing earthquake risk. The activity has also resulted in a broad categorisation of the Indonesian building stock and the commencement of a process that will furnish a full national suite of models defining the vulnerability of these structure types to earthquake ground motion. Padang damage data was directly applied in the workshop process to develop nine benchmark models that define both economic loss and the likelihood of physical damage. In addition, consensus was reached on a process for ranking other building types in the schema against these benchmarks and the utilisation of other Padang data. The process for delivering a national suite of earthquake vulnerability curves for Indonesia is presently underway. Finally, processes for capturing post-disaster information have been reviewed on the basis of the Padang reconnaissance and recommendations made for more effective capture of damage information in future surveys. The benefits of reaching a regional consensus on methodologies, survey templates and tools to cover a range of severe hazards have been highlighted and recommendations made for how these protocols could be transferred to Indonesian professionals and academics. RECOMMENDATIONS The earthquake was not the anticipated mega-thrust subduction earthquake for the section of the Sunda Arc in the Padang region. The section of the subduction zone in proximity to Padang last ruptured in the Great Sumatran earthquake of 25 November 1833 (Mw 8.8 to 9.2). More recently, other sections of the plate boundary have sequentially ruptured with transferral of stress to this region. As a consequence the subduction interface is considered to have a high likelihood of failure in the next 30 years. When this section does fail the mega-thrust earthquake it will generate is expected to produce ground motions possibly 30% stronger than those that occurred during the September 30 earthquake and be followed some 30 minutes later by a tsunami with maximum wave heights of 5 to 10 m. Within this risk context the West Sumatran Earthquake of 30 September 2009
3
The 30th September 2009 West Sumatra Earthquake Padang Region Damage Survey
gives urgency and impetus to “building back better” in Padang and addressing legacy issues with current substandard construction. The following specific recommendations are made:-
1) Buildings damaged in the 30 September earthquake should be repaired and strengthened to a high standard to be capable of withstanding the future megathrust earthquakes and any accompanying tsunami.
2) New buildings intended to provide vertical evacuation from a tsunami should be designed and built to a standard where they will be essentially undamaged after a worst-case future earthquake.
3) Other new buildings should be designed and constructed in accordance with current standards with particular attention required to ensure the use of appropriate foundation systems and quality construction materials. Enforcement mechanisms may require review to ensure compliance.
4) New residential construction should utilise cost-effective systems that were observed to perform well in the Padang earthquake. In particular, confinement of masonry was observed to result in a marked improvement in seismic performance when compared with ordinary unreinforced masonry.
5) That earthquake engineering principles be promoted with building professionals through industry seminars where the learnings of the Padang earthquake can be shared and the role of the code regulations in precluding premature failure highlighted. The choice of earthquake engineering as an elective in universities also needs to be promoted more strongly so new professionals will enter the industry with a greater awareness of the underpinning principles.
6) That post-disaster surveys continue to be undertaken in Indonesia to capture the variability in building vulnerability across the region and country. This should be all-hazards and encompass all the engineering and science contributions required to understand the nature of the causative natural events. The process would benefit greatly from deriving a regional expert consensus of the optimal approaches for investigating each hazard event type and the subsequent dissemination of the processes and methodologies to interested participants in Indonesia.
7) That targeted research be sponsored in key Indonesian research institutions to develop an improved understanding of the vulnerability of Indonesian construction to severe hazard. The work should also identify cost-effective strategies for reducing the vulnerability of current buildings and for developing affordable construction approaches for new development that will enhance structural resilience. Furthermore, the research program should develop and mentor earthquake engineering expertise within Indonesia to further augment the national skill base for built environment design.
The Padang Earthquake reconnaissance involved a significant allocation of resources, both in terms of the direct costs met by the AIFDR and in the time contributed by a large group of engineers, academics, scientists, AIFDR staff and engineering students. It also constitutes what is understood to be the largest systematic population-based study of an earthquake impact undertaken to date in the South East Asian and Pacific regions. While the investment has been considerable, the outcomes have been commensurate with this. The two survey strategies used, coupled with the post-survey activities, have provided insights into the nature of the built environment in Padang, its vulnerability to severe earthquakes, the factors behind this and how these can be effectively addressed through
4

The 30th September 2009 West Sumatra Earthquake Padang Region Damage Survey
new and legacy construction. The reconnaissance has demonstrated the value of effective post-disaster surveys in informing the understanding and mitigation of natural disaster risk and as a tool for supporting emergency management preparedness and planning.
5

The 30th September 2009 West Sumatra Earthquake Padang Region Damage Survey
Acknowledgements The Padang survey activity and subsequent data processing and analysis entailed the deployment of considerable resources and contributions made by many individuals. The support of the Australia-Indonesia Facility for Disaster Reduction (AIFDR) is firstly acknowledged for their liaison with key Indonesian Agencies, facilitation of access to the region and for their direct funding of the activity. Similarly, the mission would not have been possible without the support of the Indonesian Disaster Management Agency (BNPB) and the engagement and facilitation of the World Bank. The survey leadership jointly provided by the Centre for Disaster Mitigation at the Institut Teknologi Bandung and Geoscience Australia is also acknowledged as well as the significant contribution of expertise and students from Andalas University, Padang. Specifically the contributions of the following people in this reconnaissance are acknowledged.
Indonesia Engineering Detailed Survey Team
Dr. I Wayan Sengara Institut Teknologi Bandung
Dr. Made Suarjana Institut Teknologi Bandung
Dr. Febrin Ismail Andalas University, Padang
Dr. Abdul Hakam Andalas University, Padang
Dr. -Ing Ediansjah Zulkifli Institut Teknologi Bandung
Hendri Gusti Putra, MT Institut Teknologi Bandung
Oscar Fithrah Nur, MT Institut Teknologi Bandung
Wahyel Iffah, ST Andalas University, Padang
Engineering Population Survey Team
Dr. Ivindra Pane Institut Teknologi Bandung
Dr. Fauzan Andalas University, Padang
Ariehan, ST Andalas University, Padang
Bayu Novianto Andalas University, Padang
Susi Srihandayani, ST Andalas University, Padang
Widya Kasuma, ST Andalas University, Padang
Ilham Barlian, ST Andalas University, Padang
Agus Purnawan, ST
Andrio Plationa Andalas University, Padang
Dody Lastaruna Andalas University, Padang
Agus Wahyudi Andalas University, Padang
Afrijhon Saragih Andalas University, Padang
Fauzi Rohman Andalas University, Padang
Khris Danil Andalas University, Padang
Ivan Darma Sihite Andalas University, Padang
Febriano Vernanda Andalas University, Padang
6
The 30th September 2009 West Sumatra Earthquake Padang Region Damage Survey
Ryan Kurnia Andalas University, Padang
Benny Saputra Andalas University, Padang
Oce Papin Andalas University, Padang
Rizki Robi Andalas University, Padang
Vero Andron Andalas University, Padang
Rio Perdana Putra Andalas University, Padang
Ade Musrianto Andalas University, Padang
Edola Duangga Eryan Putra Andalas University, Padang
Yola Anda Rozza Andalas University, Padang
Harli Handayani A. ST Andalas University, Padang
KM. Abuhuroyroh, ST Institut Teknologi Bandung
Jacki H. Pratama, ST Institut Teknologi Bandung
Riano Hidratullah, ST Institut Teknologi Bandung
Almuhithsyah, ST Institut Teknologi Bandung
Anin Utami, ST, MT Institut Teknologi Bandung
Uun Jayasaputra, ST Institut Teknologi Bandung
Administration
Boy Perdana Putra HKL
Niken Trisnawati HKL
Nofri Sufryan HKL
Afri Yunita Sari, SS HKL
Interpreters
Arlan Yuliandrie Andalas University, Padang
Vike Vanesha HKL
Drivers
Intrisman TRAC/ASTRA
Asmeidi Alnur TRAC/ASTRA
Denny afrizal TRAC/ASTRA
Oktavianus TRAC/ASTRA
Alfazar Bakri TRAC/ASTRA
John S Cedy TRAC/ASTRA
Andri TRAC/ASTRA
Jul
Roby. S
Nus
Azwar
Nur Syamsul
Judisman Putra
7

The 30th September 2009 West Sumatra Earthquake Padang Region Damage Survey
International
Dick Beetham GNS New Zealand
Neil Corby Geoscience Australia
Ken Dale Geoscience Australia
Michael Griffith University of Adelaide
Matt Hayne Geoscience Australia
Gerhard Horoschun Australian Defence Force Academy
Jason Ingham University of Auckland
Huang Liping Nanyang Technological University Singapore
Kimreth Meas Nanyang Technological University Singapore
Kristy van Putten AIFDR
Jerry Vaculik University of Adelaide
Martin Wehner Geoscience Australia
Richard Weller Cardno
Huang Yi-Nan Nanyang Technological University Singapore
The survey activity was followed by a workshop convened at Geoscience Australia in Canberra from 28 to 29 April 2010. The outcomes of the workshop activity are included in this report and the individual workshop attendees who contributed to these are acknowledged below.
Padang Earthquake Reconnaissance Workshop
Dr. I Wayan Sengara Institut Teknologi Bandung
Dr. Made Suarjana Institut Teknologi Bandung
Dick Beetham GNS New Zealand
Roger Charng Geoscience Australia
Neil Corby Geoscience Australia
Phil Cummins Geoscience Australia / ANU
Ken Dale Geoscience Australia
Mark Edwards Geoscience Australia
Gerhard Horoschun Australian Defence Force Academy
Jason Ingham University of Auckland
Martin Wehner Geoscience Australia
Richard Weller Cardno
8
The 30th September 2009 West Sumatra Earthquake Padang Region Damage Survey
1 Introduction The establishment of the Australia-Indonesia Facility for Disaster Reduction (AIFDR) was jointly announced by Australia and Indonesia on 22 November 2008. AIFDR aims to work with Indonesian counterparts to quantify the prevailing natural disaster hazards and risks in Indonesia and then use this information to support activities, training and planning exercises for national-level and provincial-level disaster managers. The Facility reflects Indonesia’s and Australia’s concern over the growing impact of disasters in the region, including their potential for human suffering and the reversal of hard-won development gains. Natural hazard risk is typically high in Indonesia as a result of the nature of its building stock coupled with large populations and severe natural hazards. This risk is manifested in severe events which sometimes have devastating consequences. Understanding hazard, exposure and vulnerability can enable the identification of key factors contributing to community risk and assist in developing appropriate strategies for risk reduction. On 30 September 2009 a magnitude 7.6 earthquake struck West Sumatra in the Padang and Pariaman regions. It caused widespread damage to buildings and resulted in an estimated 1,117 fatalities. Thankfully the event was not accompanied by a tsunami that could have had additional devastating impacts and led to an increased mortality. Under its mandate the AIFDR responded to the earthquake event with the objective of deriving an understanding of the factors that had contributed to the effects of the earthquake. It supported a team of Indonesian and international engineers and scientists who collected and analysed damage information that could be used for future disaster risk reduction in West Sumatra and Indonesia more broadly. The activity was jointly led by the Centre for Disaster Mitigation at the Institut Teknologi Bandung (ITB) and Geoscience Australia. This report provides a background to the region, describes the nature of the earthquake and its impacts, details the survey activity and outlines the significant outcomes that have come from it. Importantly, a number of recommendations are proposed to assist in the regional reconstruction after the event and to guide future development in the Padang region and Indonesia more generally.
9
The 30th September 2009 West Sumatra Earthquake Padang Region Damage Survey
2 Padang Region 2.1 HISTORICAL DEVELOPMENT Since the 16th century Padang has been a centre of trade. During the 16th and 17th centuries pepper was cultivated and traded with India, Portugal, the United Kingdom and the Netherlands. In 1663 the settlement came under the authority of the Dutch, who built a trading post at Padang in 1680. The town came under British authority twice, the first time from 1781 to 1784 during the Fourth Anglo-Dutch War, and again from 1795 to 1819 during the Napoleonic Wars. Afterwards the city was transferred back to the Netherlands. At the time of independence in 1949 the town had around 50,000 inhabitants. Strong population growth has followed since that time, largely due to the migration within Indonesia of the rural populace to major cities. This has resulted in a present day Padang population of approximately 1 million. The development of Padang over time is summarised in Figure 2.1. The city of Padang is spread across the low lying coastal plain at the foot of the Barisan Mountains. The city is divided into 11 subdistricts (kecamatan): Bungus Teluk Kabung, Koto Tangah, Kuranji, Lubuk Begalung, Lubuk Kilangan, Nanggalo, Padang Barat, Padang Selatan, Padang Timur, Padang Utara and Pauh. The city is served by the newly-opened Minangkabau International Airport in Ketaping, Padang Pariaman. It replaced the old Tabing Airport which is now used as a military base. Padang's Teluk Bayur harbor is the largest and busiest harbour on the west coast of Sumatra. Figure 2.2 provides a present-day picture of the coastal spread of the city. 2.2 BUILT ENVIRONMENT VULNERABILITY The progressive development of the Padang region over 400 years has resulted in a range of construction types with differing vulnerabilities. The older parts of the city that date to colonial times feature heavy unreinforced masonry construction with thick walls, significant pre-existing earthquake damage and high vulnerability. Unreinforced construction has persisted since that time with similar vulnerability and older poorly detailed reinforced concrete construction. Material availability has also influenced construction styles. In the Pariaman region the availability of rounded cobble sized stones from the local rivers has promoted their use in wall construction. This practice has introduced a greater vulnerability to earthquake than where fired bricks are used. Light timber framed construction, which inherently performs better when subjected to strong ground motion, is a traditional construction type in the region. More recently the confinement of unreinforced masonry using reinforced concrete boundary elements has become more widely used for smaller residential buildings imparting improved bracing behaviour and the reduction of out-of-plane failure. These changes have resulted from the development and implementation of construction guidelines for house construction. Furthermore, the construction of larger reinforced concrete buildings has been influenced by the progressive development of Indonesian structural design and construction regulations that are well aligned with the standards of other seismically active countries. Overall, a greater vulnerability to earthquake is anticipated for the older masonry structures with minimal to moderate damage expected for code-compliant buildings when subjected to ground motions approaching the design event.
10
The 30th September 2009 West Sumatra Earthquake Padang Region Damage Survey
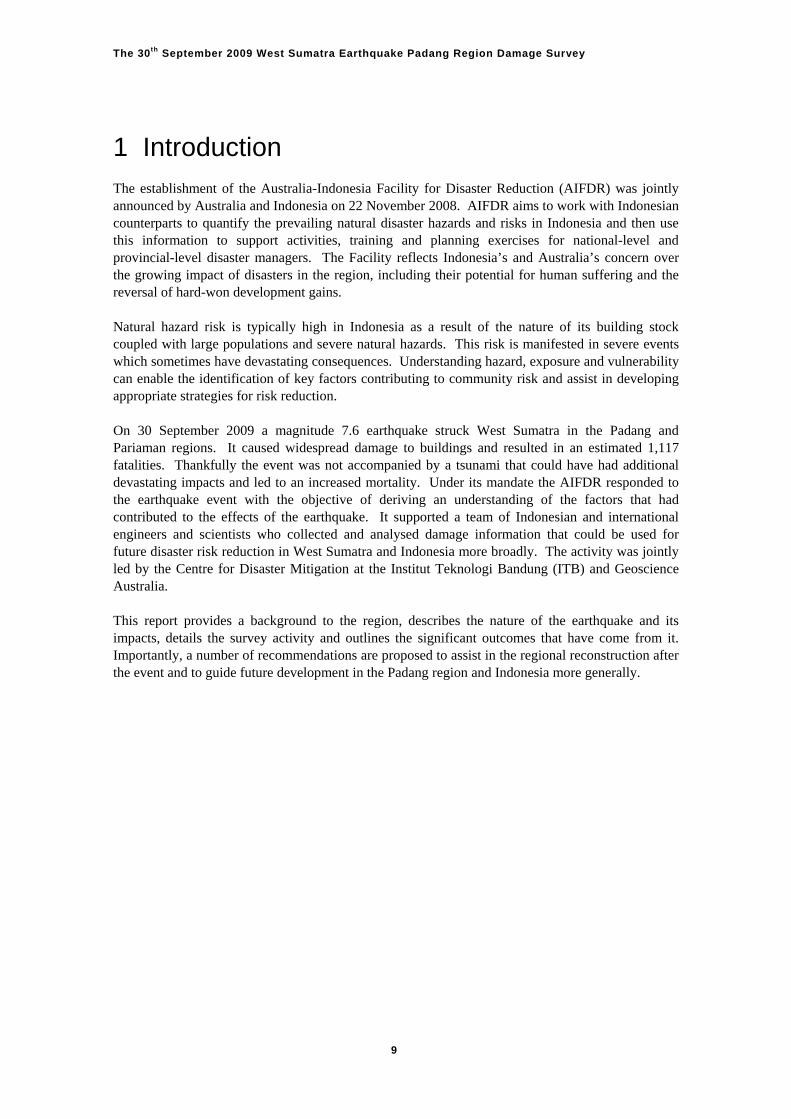
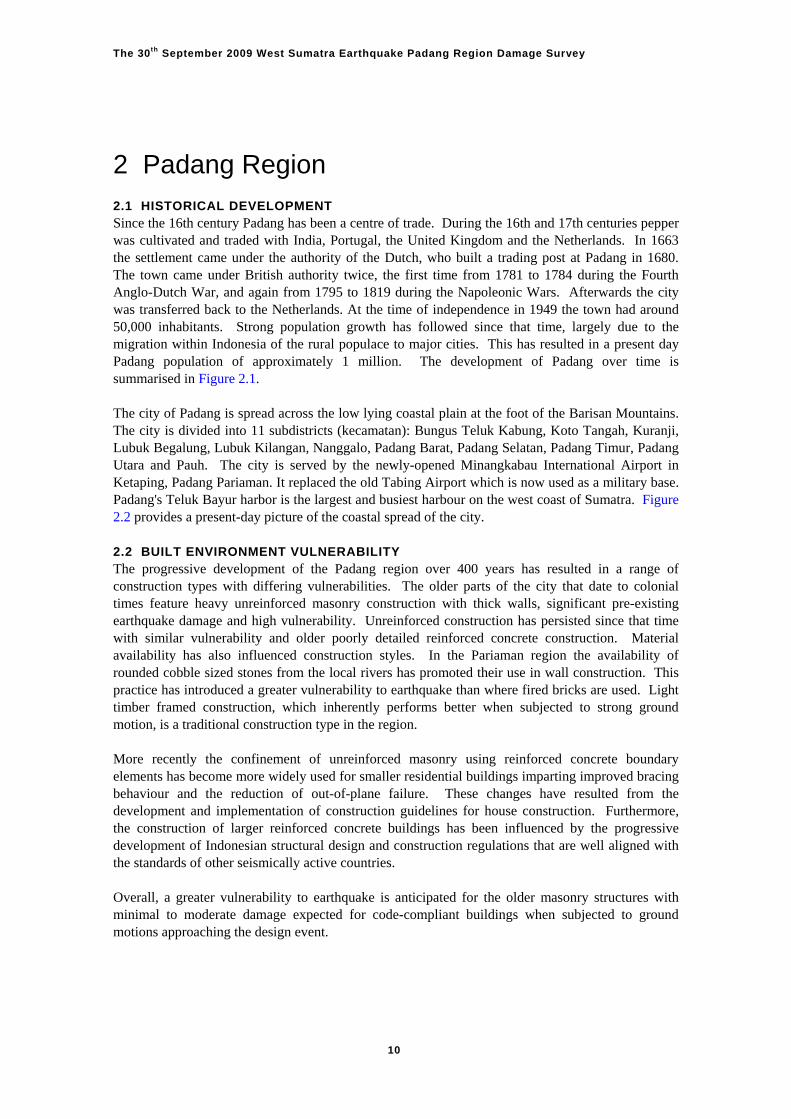
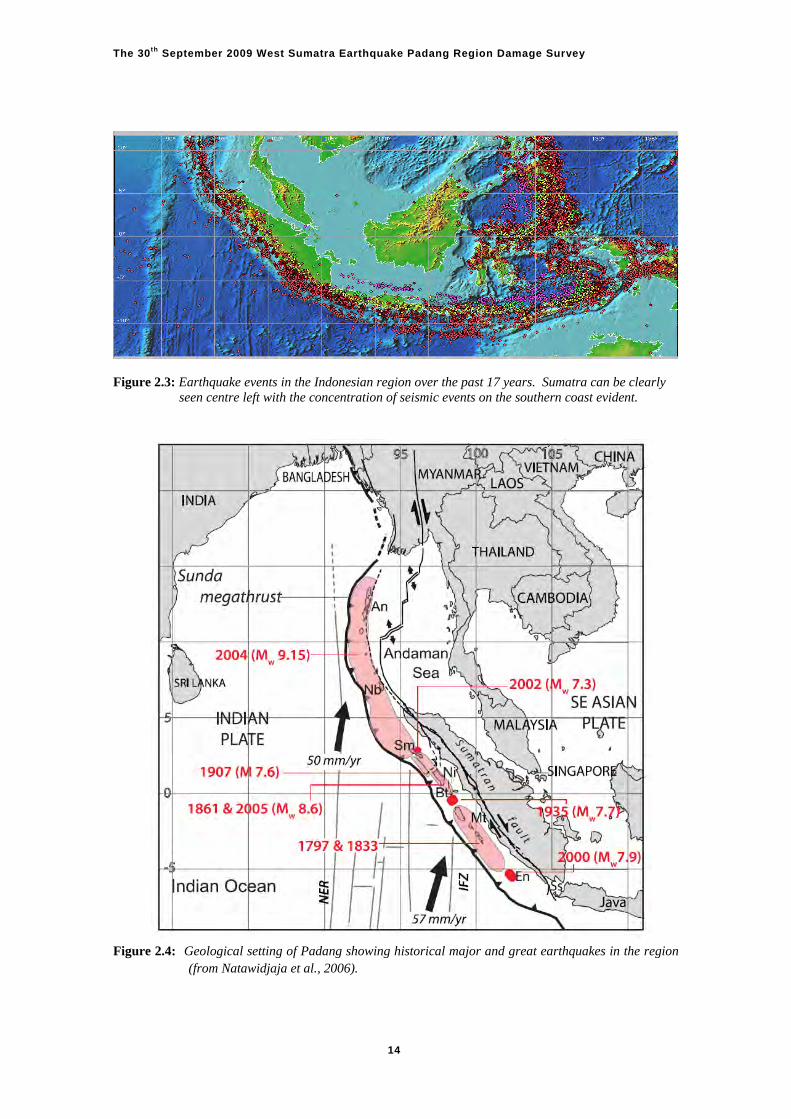
2.3 REGIONAL SEISMICITY AND HAZARD IMPLICATIONS The tectonic context of the Padang region is responsible for a high regional level of seismicity and hazard. Regular mega-thrust earthquakes (with tsunami) and active volcanism along the Sumatran section of the Sunda Arc are associated with the subduction of the Indo-Australian plate beneath the over-riding Sunda plate. Figure 2.3 shows the epicentres of earthquakes that have occurred over the past 17 years and the high level of activity along the subduction zone south of Sumatra. Given the relative oblique plate motion rate of ~50mm per year combined with the locking of the plate interface, mega-thrust earthquakes are likely to occur once every few hundred years. The historic earthquake record indicates such a recurrence for major and great earthquakes in the region (Figure 2.4). The regional seismicity is classified as high in global terms (Giardini 1999) and is reflected in the local history of damaging earthquakes and tsunami. Following an earthquake off the coast in 1797 (estimated to be Mw8.5 to 8.7) (Natawidjaja et al 2006) Padang was inundated by a tsunami with an estimated flow depth of 5 to 10m. Boats moored in the Arau River ended up on dry land, including a 200 ton sailing ship which was deposited about 1 km upstream. In 1833 another tsunami inundated Padang with an estimated flow depth of 3 to 4m as a result of an earthquake which occurred off Bengkulu estimated to be Mw8.6 to 8.9 (Natawidjaja et al 2006). More recently on 6 March 2007 a Mw6.4 earthquake occurred between Padang Panjang and the north end of Lake Singkarak. This “Singkarak” earthquake is the 5th strongest earthquake to occur in the Singkarak area along the Great Sumatran Fault over the last 100 years. The previous earthquakes were M6.5 and M6.75 three hours apart on 28 June, 1926 and M7.2 and M7.5 seven hours apart on 8 and 9 June, 1943 (M in these cases is the Richter Magnitude as listed by USGS on its web site).
11

The 30th September 2009 West Sumatra Earthquake Padang Region Damage Survey
Figure 2.1: Maps of Padang that include locations mentioned in historical accounts of the 1797 and
1833 earthquakes and tsunamis. (a) Padang in 1781, which was a small settlement of a few dozen private and government structures about a kilometre from the sea. (b) Padang in 1828, which was a larger settlement but still concentrated upstream from the river mouth. (c) Map of the modern city of Padang showing that dense settlement extends from the shoreline landward for more than 3 km and is mostly less than 5 m above sea level – from Natawidjaja et al (2006).
2.3.1 Ground Motion The geomorphology of the Padang area provides a good indication of the likely response of local regolith to bedrock shaking. Over the very recent geological past, the coastal plain on which Padang
12

The 30th September 2009 West Sumatra Earthquake Padang Region Damage Survey
city is located has been built up of accumulated sediments eroded from the volcanic cones and plateau inland to the east. The rivers from the hills have meandered across the flat coastal plain depositing and sorting loose, uniform and soft sediments in swampy areas behind prominent coastal beach ridges. To accommodate urban growth the city has spread over large areas of low-lying coastal land, much of which was formerly swampy and consists of soft and weak soils, such as sands, silts and muds. These materials are prone to liquefaction during strong earthquake shaking and can significantly amplify bedrock ground motions. Much of the land on which Padang is built would be classified as site classes D (deep or soft soil sites) and E (very soft soil sites) under NZS 1170.5 (2004) or AS 1170.4 (2007), while some of the better areas may be site class C (shallow soil sites). This site-classification for Padang city is identified from Sengara et al. (2009). In New Zealand soils in these site classes would require specific site investigations, and design may even necessitate a site-specific seismic hazard assessment for important structures (such as hospitals and schools).
Figure 2.2: North north-westerly view across coastal Padang today showing coastal fore dunes and low
lying topography behind.
13
The 30th September 2009 West Sumatra Earthquake Padang Region Damage Survey
Figure 2.3: Earthquake events in the Indonesian region over the past 17 years. Sumatra can be clearly
seen centre left with the concentration of seismic events on the southern coast evident.
Figure 2.4: Geological setting of Padang showing historical major and great earthquakes in the region
(from Natawidjaja et al., 2006).
14
The 30th September 2009 West Sumatra Earthquake Padang Region Damage Survey
15
2.3.2 Liquefaction The deposition process by low energy, meandering river action across the coastal plains has resulted in thick layers of loose, well sorted sands and coarse silts. The low-lying coastal topography with swamps developed behind broad beach ridges is also results in high watertables. Collectively the liquefaction potential across much of Padang is high and liquefaction is expected to become evident when felt intensities exceed MMI 6. Liquefaction can result in sand boils, catastrophic loss of foundation bearing capacity and lateral spreading of terraces alongside watercourses. 2.3.3 Landslide The geological setting of Padang involves the Indian plate subducting beneath the South East Asian plate offshore (Figures 2.3 & 2.4). Uplift of the Barisan mountain range and the development of volcanic centres are the result of this subduction. The uplifting topography, in combination with a high precipitation climate, has led to rapid and significant volumes of erosion material, and the consequent development of steep slopes. This environment of mixed geology and high relief is typically associated with marginally stable slopes which are susceptible to earthquake triggered landsliding. 2.3.4 Tsunami The Sunda Arc subduction zone to the south west of Padang is a major source of tsunamigenic earthquakes. Tectonic plate movement in the subduction zone results in a gradual build up of crustal stress and deformation along the interface between the plates which is then suddenly relieved when a major earthquake occurs. Rebound of the seafloor during the earthquake displaces the column of water above the subduction zone. This can then create devastating tsunami waves as the ocean surface returns to its original level. Crustal stress relief is also often accompanied by coastal subsidence which may be as great as 0.5m in Padang, and which would exacerbate the tsunami inundation and create future issues relating to storm surge and flooding. Since the Sunda Arc subduction zone runs parallel to the coast (see Figure 2.4) most of the wave energy from the tsunami will be directed towards Sumatra. The initial wave would arrive approximately 30mins after the time of the earthquake, but large waves could continue to impact the coast for many hours after the event. The Padang region has a very high tsunami hazard and, as discussed in Section 2.3, the region has experienced a number of tsunami historically.
The 30th September 2009 West Sumatra Earthquake Padang Region Damage Survey
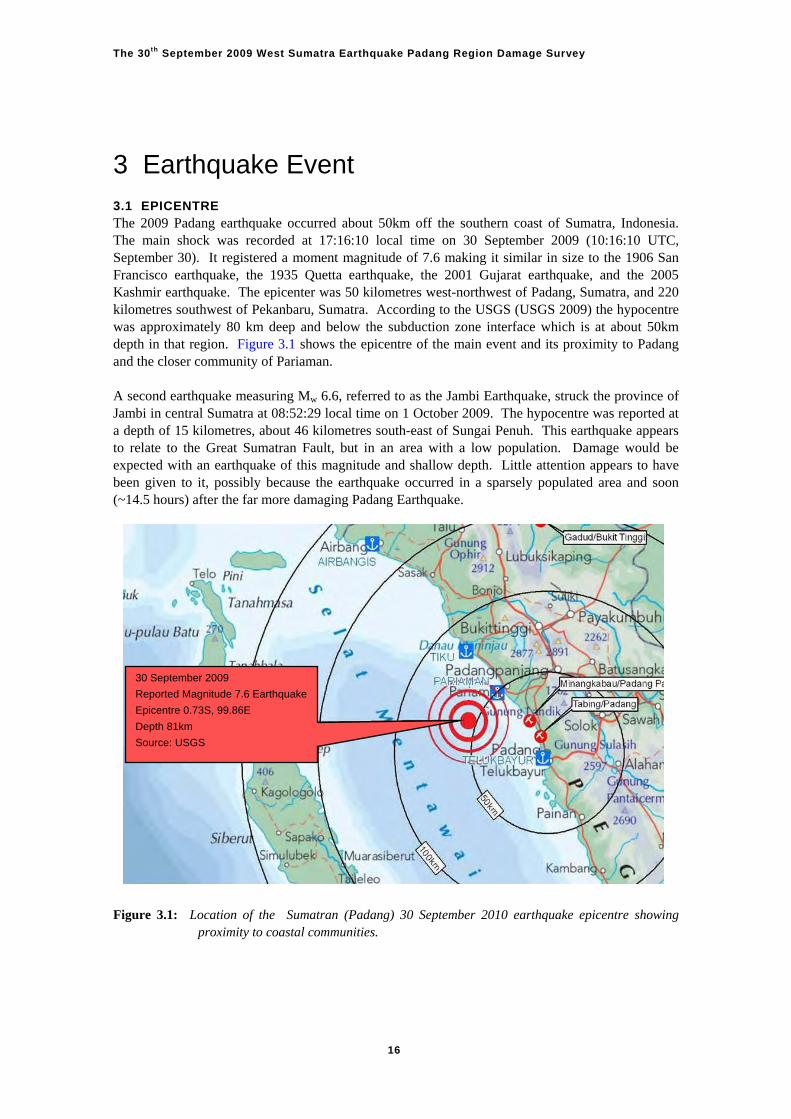
3 Earthquake Event 3.1 EPICENTRE The 2009 Padang earthquake occurred about 50km off the southern coast of Sumatra, Indonesia. The main shock was recorded at 17:16:10 local time on 30 September 2009 (10:16:10 UTC, September 30). It registered a moment magnitude of 7.6 making it similar in size to the 1906 San Francisco earthquake, the 1935 Quetta earthquake, the 2001 Gujarat earthquake, and the 2005 Kashmir earthquake. The epicenter was 50 kilometres west-northwest of Padang, Sumatra, and 220 kilometres southwest of Pekanbaru, Sumatra. According to the USGS (USGS 2009) the hypocentre was approximately 80 km deep and below the subduction zone interface which is at about 50km depth in that region. Figure 3.1 shows the epicentre of the main event and its proximity to Padang and the closer community of Pariaman. A second earthquake measuring Mw 6.6, referred to as the Jambi Earthquake, struck the province of Jambi in central Sumatra at 08:52:29 local time on 1 October 2009. The hypocentre was reported at a depth of 15 kilometres, about 46 kilometres south-east of Sungai Penuh. This earthquake appears to relate to the Great Sumatran Fault, but in an area with a low population. Damage would be expected with an earthquake of this magnitude and shallow depth. Little attention appears to have been given to it, possibly because the earthquake occurred in a sparsely populated area and soon (~14.5 hours) after the far more damaging Padang Earthquake.
30 September 2009
Reported Magnitude 7.6 Earthquake
Epicentre 0.73S, 99.86E
Depth 81km
Source: USGS
Figure 3.1: Location of the Sumatran (Padang) 30 September 2010 earthquake epicentre showing
proximity to coastal communities.
16
The 30th September 2009 West Sumatra Earthquake Padang Region Damage Survey
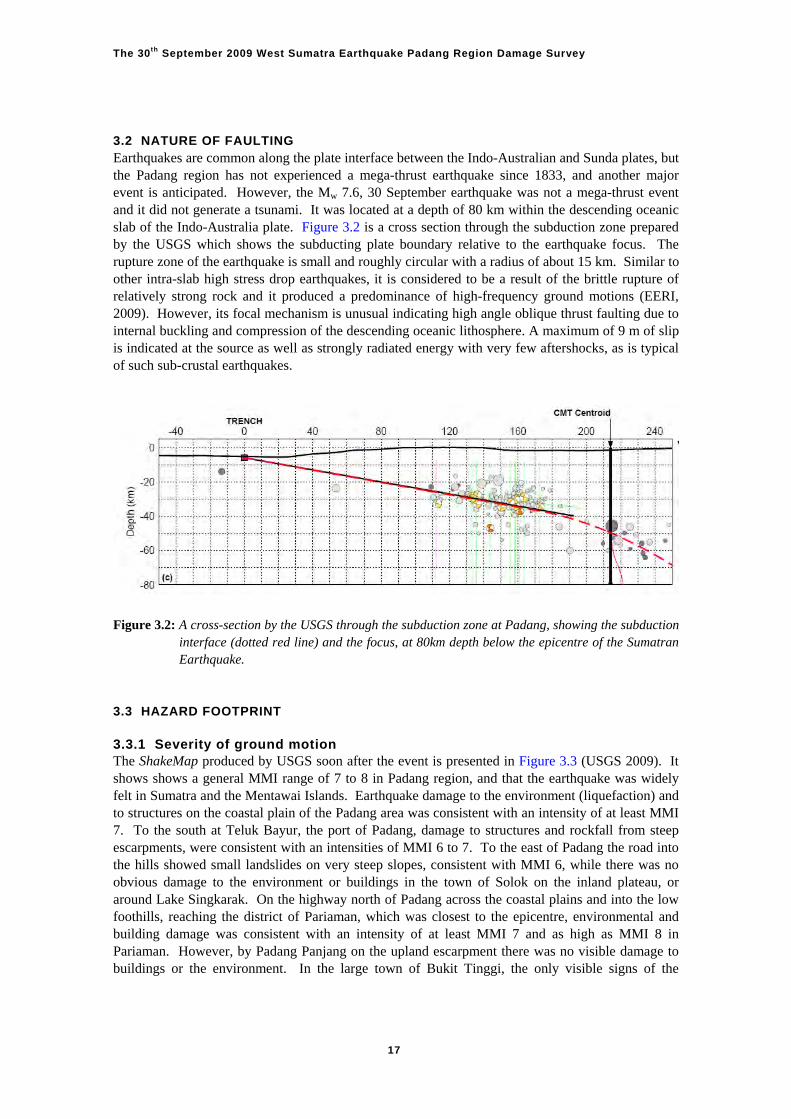
3.2 NATURE OF FAULTING Earthquakes are common along the plate interface between the Indo-Australian and Sunda plates, but the Padang region has not experienced a mega-thrust earthquake since 1833, and another major event is anticipated. However, the Mw 7.6, 30 September earthquake was not a mega-thrust event and it did not generate a tsunami. It was located at a depth of 80 km within the descending oceanic slab of the Indo-Australia plate. Figure 3.2 is a cross section through the subduction zone prepared by the USGS which shows the subducting plate boundary relative to the earthquake focus. The rupture zone of the earthquake is small and roughly circular with a radius of about 15 km. Similar to other intra-slab high stress drop earthquakes, it is considered to be a result of the brittle rupture of relatively strong rock and it produced a predominance of high-frequency ground motions (EERI, 2009). However, its focal mechanism is unusual indicating high angle oblique thrust faulting due to internal buckling and compression of the descending oceanic lithosphere. A maximum of 9 m of slip is indicated at the source as well as strongly radiated energy with very few aftershocks, as is typical of such sub-crustal earthquakes.
Figure 3.2: A cross-section by the USGS through the subduction zone at Padang, showing the subduction
interface (dotted red line) and the focus, at 80km depth below the epicentre of the Sumatran Earthquake.
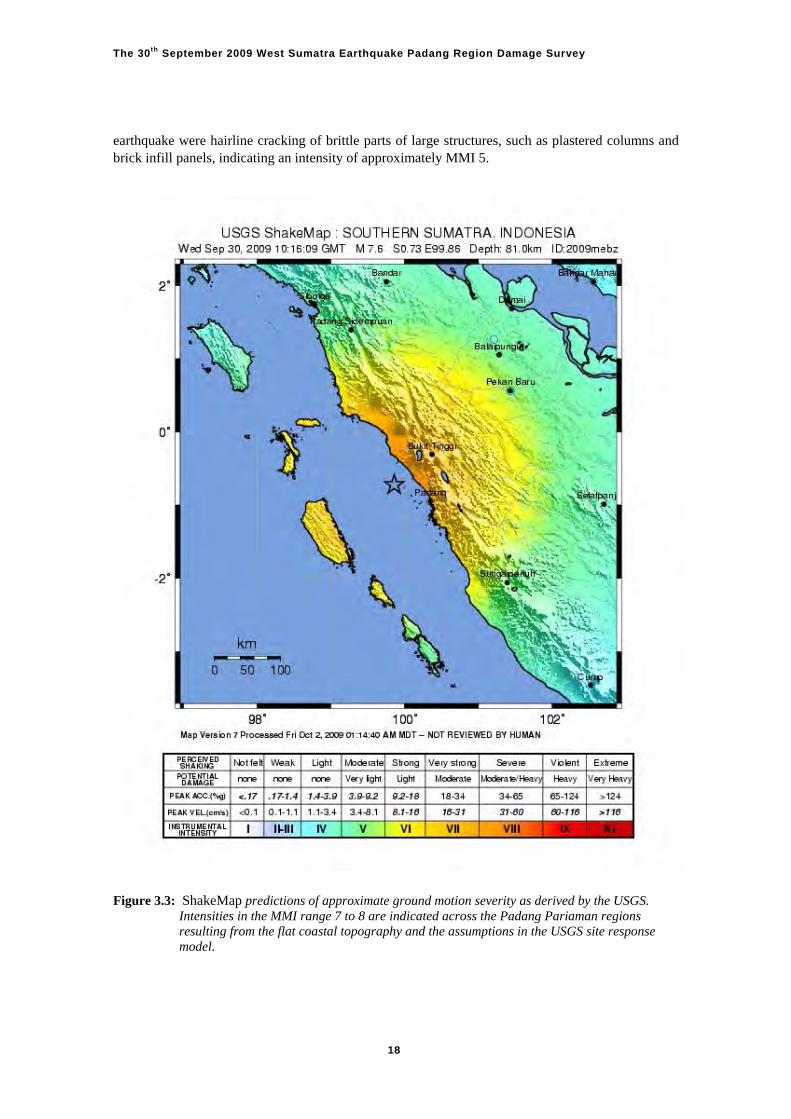
3.3 HAZARD FOOTPRINT 3.3.1 Severity of ground motion The ShakeMap produced by USGS soon after the event is presented in Figure 3.3 (USGS 2009). It shows shows a general MMI range of 7 to 8 in Padang region, and that the earthquake was widely felt in Sumatra and the Mentawai Islands. Earthquake damage to the environment (liquefaction) and to structures on the coastal plain of the Padang area was consistent with an intensity of at least MMI 7. To the south at Teluk Bayur, the port of Padang, damage to structures and rockfall from steep escarpments, were consistent with an intensities of MMI 6 to 7. To the east of Padang the road into the hills showed small landslides on very steep slopes, consistent with MMI 6, while there was no obvious damage to the environment or buildings in the town of Solok on the inland plateau, or around Lake Singkarak. On the highway north of Padang across the coastal plains and into the low foothills, reaching the district of Pariaman, which was closest to the epicentre, environmental and building damage was consistent with an intensity of at least MMI 7 and as high as MMI 8 in Pariaman. However, by Padang Panjang on the upland escarpment there was no visible damage to buildings or the environment. In the large town of Bukit Tinggi, the only visible signs of the
17
The 30th September 2009 West Sumatra Earthquake Padang Region Damage Survey
earthquake were hairline cracking of brittle parts of large structures, such as plastered columns and brick infill panels, indicating an intensity of approximately MMI 5.
Figure 3.3: ShakeMap predictions of approximate ground motion severity as derived by the USGS.
Intensities in the MMI range 7 to 8 are indicated across the Padang Pariaman regions resulting from the flat coastal topography and the assumptions in the USGS site response model.
18
The 30th September 2009 West Sumatra Earthquake Padang Region Damage Survey
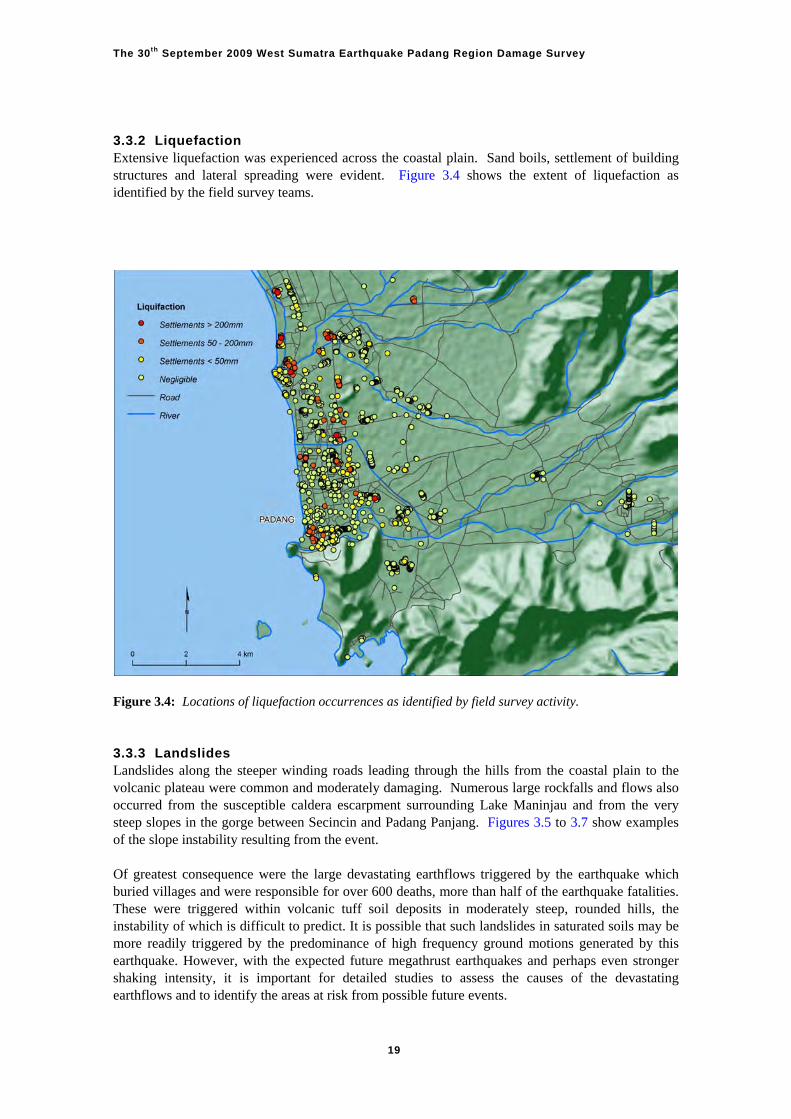
3.3.2 Liquefaction Extensive liquefaction was experienced across the coastal plain. Sand boils, settlement of building structures and lateral spreading were evident. Figure 3.4 shows the extent of liquefaction as identified by the field survey teams.
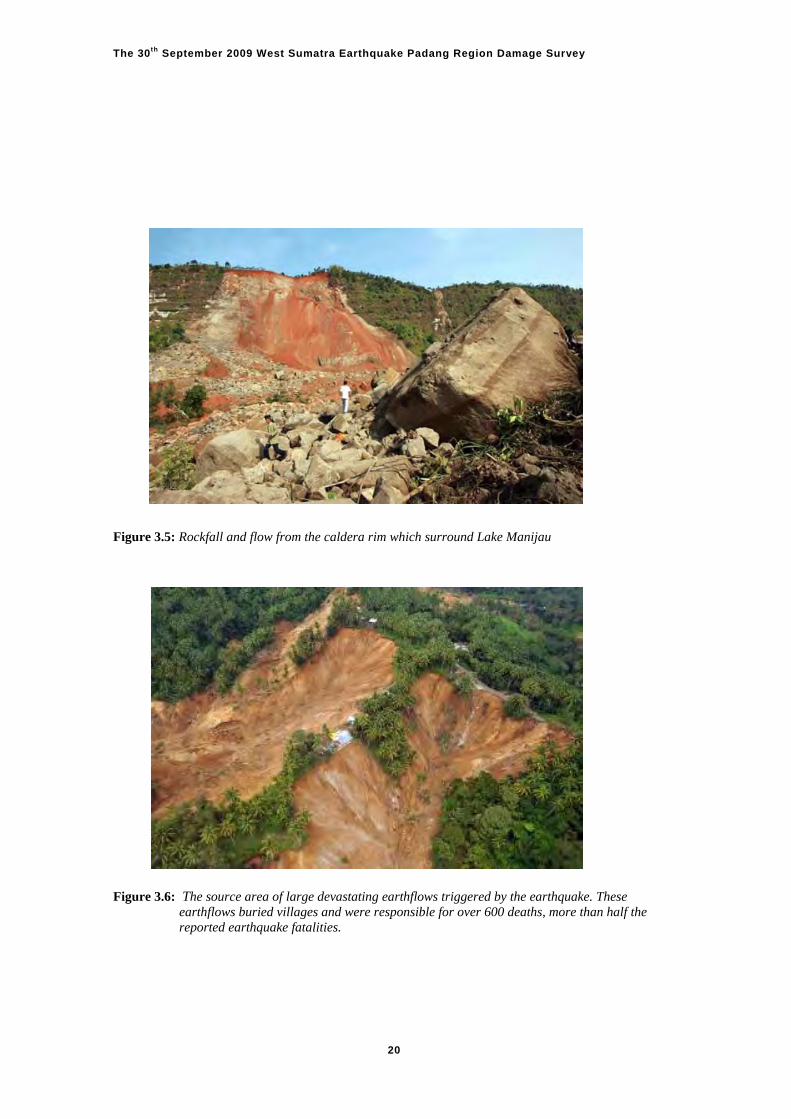
Figure 3.4: Locations of liquefaction occurrences as identified by field survey activity. 3.3.3 Landslides Landslides along the steeper winding roads leading through the hills from the coastal plain to the volcanic plateau were common and moderately damaging. Numerous large rockfalls and flows also occurred from the susceptible caldera escarpment surrounding Lake Maninjau and from the very steep slopes in the gorge between Secincin and Padang Panjang. Figures 3.5 to 3.7 show examples of the slope instability resulting from the event. Of greatest consequence were the large devastating earthflows triggered by the earthquake which buried villages and were responsible for over 600 deaths, more than half of the earthquake fatalities. These were triggered within volcanic tuff soil deposits in moderately steep, rounded hills, the instability of which is difficult to predict. It is possible that such landslides in saturated soils may be more readily triggered by the predominance of high frequency ground motions generated by this earthquake. However, with the expected future megathrust earthquakes and perhaps even stronger shaking intensity, it is important for detailed studies to assess the causes of the devastating earthflows and to identify the areas at risk from possible future events.
19
The 30th September 2009 West Sumatra Earthquake Padang Region Damage Survey
Figure 3.5: Rockfall and flow from the caldera rim which surround Lake Manijau
Figure 3.6: The source area of large devastating earthflows triggered by the earthquake. These
earthflows buried villages and were responsible for over 600 deaths, more than half the reported earthquake fatalities.
20
The 30th September 2009 West Sumatra Earthquake Padang Region Damage Survey
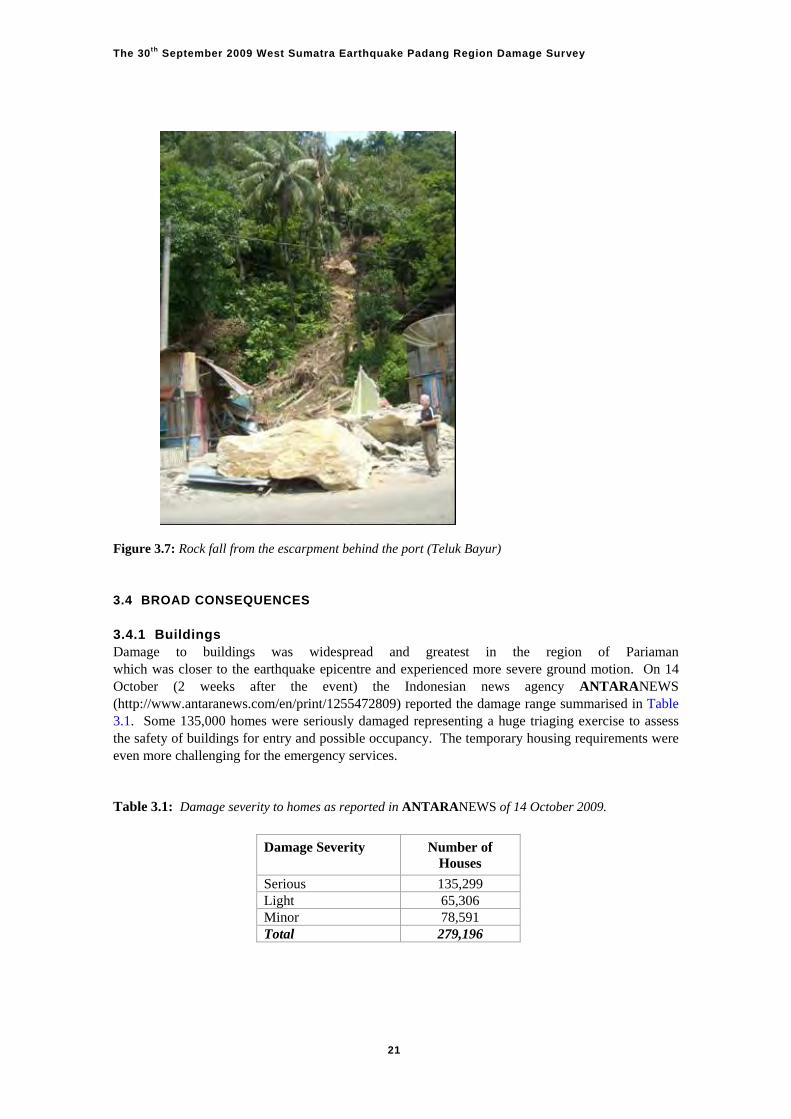
Figure 3.7: Rock fall from the escarpment behind the port (Teluk Bayur) 3.4 BROAD CONSEQUENCES 3.4.1 Buildings Damage to buildings was widespread and greatest in the region of Pariaman which was closer to the earthquake epicentre and experienced more severe ground motion. On 14 October (2 weeks after the event) the Indonesian news agency ANTARANEWS (http://www.antaranews.com/en/print/1255472809) reported the damage range summarised in Table 3.1. Some 135,000 homes were seriously damaged representing a huge triaging exercise to assess the safety of buildings for entry and possible occupancy. The temporary housing requirements were even more challenging for the emergency services.
Table 3.1: Damage severity to homes as reported in ANTARANEWS of 14 October 2009.
Damage Severity Number of Houses
Serious 135,299 Light 65,306 Minor 78,591 Total 279,196
21
The 30th September 2009 West Sumatra Earthquake Padang Region Damage Survey
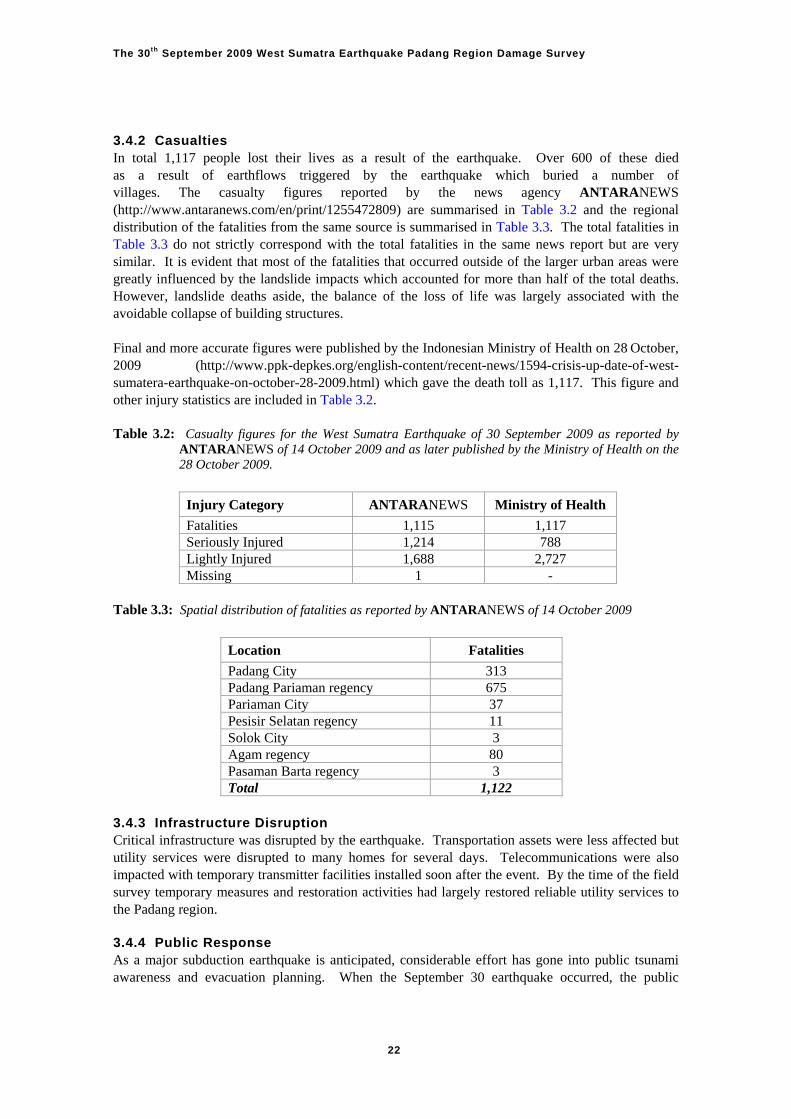
3.4.2 Casualties In total 1,117 people lost their lives as a result of the earthquake. Over 600 of these died as a result of earthflows triggered by the earthquake which buried a number of villages. The casualty figures reported by the news agency ANTARANEWS (http://www.antaranews.com/en/print/1255472809) are summarised in Table 3.2 and the regional distribution of the fatalities from the same source is summarised in Table 3.3. The total fatalities in Table 3.3 do not strictly correspond with the total fatalities in the same news report but are very similar. It is evident that most of the fatalities that occurred outside of the larger urban areas were greatly influenced by the landslide impacts which accounted for more than half of the total deaths. However, landslide deaths aside, the balance of the loss of life was largely associated with the avoidable collapse of building structures. Final and more accurate figures were published by the Indonesian Ministry of Health on 28 October, 2009 (http://www.ppk-depkes.org/english-content/recent-news/1594-crisis-up-date-of-west-sumatera-earthquake-on-october-28-2009.html) which gave the death toll as 1,117. This figure and other injury statistics are included in Table 3.2. Table 3.2: Casualty figures for the West Sumatra Earthquake of 30 September 2009 as reported by
ANTARANEWS of 14 October 2009 and as later published by the Ministry of Health on the 28 October 2009.
Injury Category ANTARANEWS Ministry of Health
Fatalities 1,115 1,117 Seriously Injured 1,214 788 Lightly Injured 1,688 2,727 Missing 1 -
Table 3.3: Spatial distribution of fatalities as reported by ANTARANEWS of 14 October 2009
Location Fatalities
Padang City 313 Padang Pariaman regency 675 Pariaman City 37 Pesisir Selatan regency 11 Solok City 3 Agam regency 80 Pasaman Barta regency 3 Total 1,122
3.4.3 Infrastructure Disruption Critical infrastructure was disrupted by the earthquake. Transportation assets were less affected but utility services were disrupted to many homes for several days. Telecommunications were also impacted with temporary transmitter facilities installed soon after the event. By the time of the field survey temporary measures and restoration activities had largely restored reliable utility services to the Padang region. 3.4.4 Public Response As a major subduction earthquake is anticipated, considerable effort has gone into public tsunami awareness and evacuation planning. When the September 30 earthquake occurred, the public
22

The 30th September 2009 West Sumatra Earthquake Padang Region Damage Survey
response was to evacuate, resulting in chaos as hundreds of thousands of people in Padang took to rubble strewn lanes and roads on foot, motorbikes and in cars. It was noted that buildings marked and intended for vertical evacuation from tsunami were damaged and some collapsed during the earthquake. Evidently the public did not enter buildings for vertical evacuation if they were even superficially damaged after the earthquake. Instead they took the potentially riskier option of joining chaotic streams of evacuees taking a longer escape route from any tsunami.
23
The 30th September 2009 West Sumatra Earthquake Padang Region Damage Survey
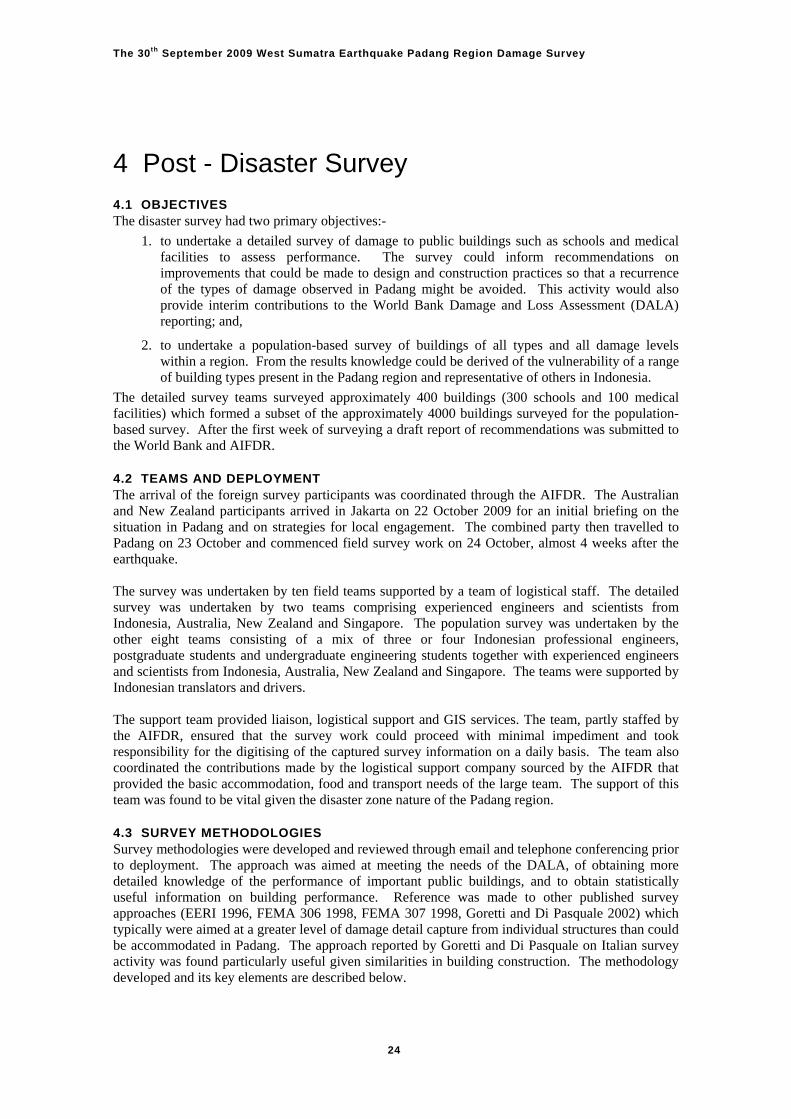
4 Post - Disaster Survey 4.1 OBJECTIVES The disaster survey had two primary objectives:-
1. to undertake a detailed survey of damage to public buildings such as schools and medical facilities to assess performance. The survey could inform recommendations on improvements that could be made to design and construction practices so that a recurrence of the types of damage observed in Padang might be avoided. This activity would also provide interim contributions to the World Bank Damage and Loss Assessment (DALA) reporting; and,
2. to undertake a population-based survey of buildings of all types and all damage levels within a region. From the results knowledge could be derived of the vulnerability of a range of building types present in the Padang region and representative of others in Indonesia.
The detailed survey teams surveyed approximately 400 buildings (300 schools and 100 medical facilities) which formed a subset of the approximately 4000 buildings surveyed for the population-based survey. After the first week of surveying a draft report of recommendations was submitted to the World Bank and AIFDR. 4.2 TEAMS AND DEPLOYMENT The arrival of the foreign survey participants was coordinated through the AIFDR. The Australian and New Zealand participants arrived in Jakarta on 22 October 2009 for an initial briefing on the situation in Padang and on strategies for local engagement. The combined party then travelled to Padang on 23 October and commenced field survey work on 24 October, almost 4 weeks after the earthquake. The survey was undertaken by ten field teams supported by a team of logistical staff. The detailed survey was undertaken by two teams comprising experienced engineers and scientists from Indonesia, Australia, New Zealand and Singapore. The population survey was undertaken by the other eight teams consisting of a mix of three or four Indonesian professional engineers, postgraduate students and undergraduate engineering students together with experienced engineers and scientists from Indonesia, Australia, New Zealand and Singapore. The teams were supported by Indonesian translators and drivers. The support team provided liaison, logistical support and GIS services. The team, partly staffed by the AIFDR, ensured that the survey work could proceed with minimal impediment and took responsibility for the digitising of the captured survey information on a daily basis. The team also coordinated the contributions made by the logistical support company sourced by the AIFDR that provided the basic accommodation, food and transport needs of the large team. The support of this team was found to be vital given the disaster zone nature of the Padang region. 4.3 SURVEY METHODOLOGIES Survey methodologies were developed and reviewed through email and telephone conferencing prior to deployment. The approach was aimed at meeting the needs of the DALA, of obtaining more detailed knowledge of the performance of important public buildings, and to obtain statistically useful information on building performance. Reference was made to other published survey approaches (EERI 1996, FEMA 306 1998, FEMA 307 1998, Goretti and Di Pasquale 2002) which typically were aimed at a greater level of damage detail capture from individual structures than could be accommodated in Padang. The approach reported by Goretti and Di Pasquale on Italian survey activity was found particularly useful given similarities in building construction. The methodology developed and its key elements are described below.
24
The 30th September 2009 West Sumatra Earthquake Padang Region Damage Survey
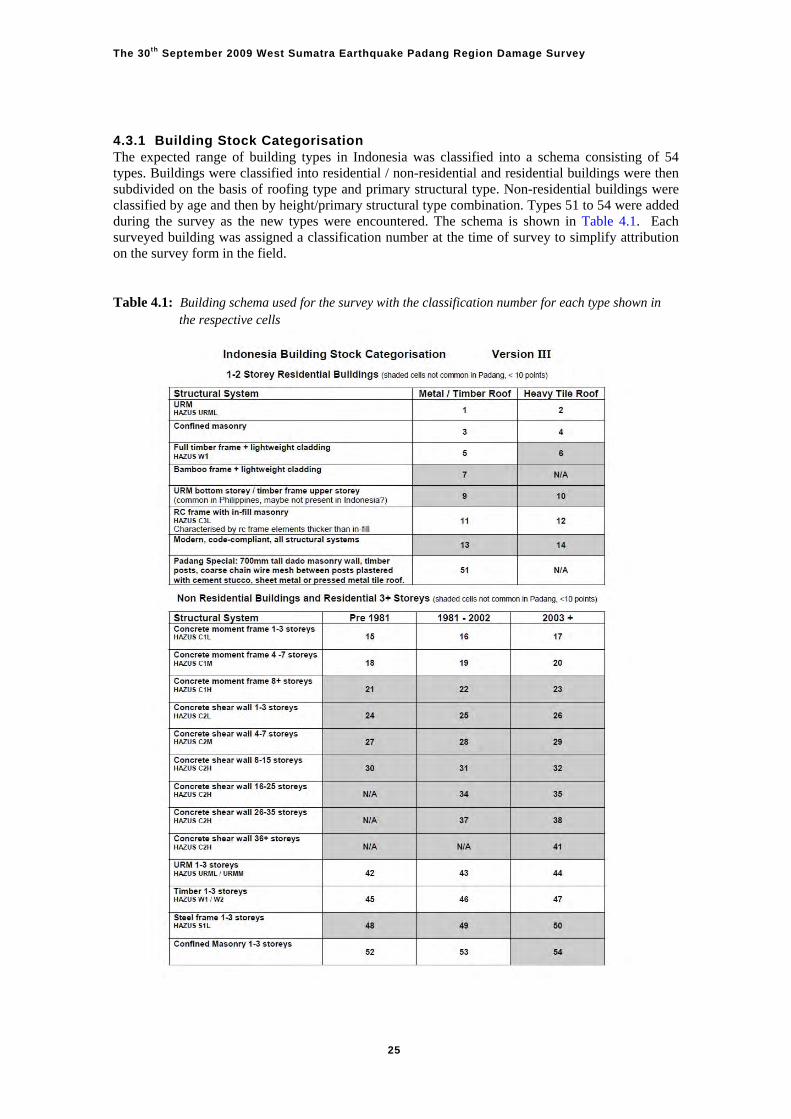
4.3.1 Building Stock Categorisation The expected range of building types in Indonesia was classified into a schema consisting of 54 types. Buildings were classified into residential / non-residential and residential buildings were then subdivided on the basis of roofing type and primary structural type. Non-residential buildings were classified by age and then by height/primary structural type combination. Types 51 to 54 were added during the survey as the new types were encountered. The schema is shown in Table 4.1. Each surveyed building was assigned a classification number at the time of survey to simplify attribution on the survey form in the field. Table 4.1: Building schema used for the survey with the classification number for each type shown in
the respective cells
25
The 30th September 2009 West Sumatra Earthquake Padang Region Damage Survey
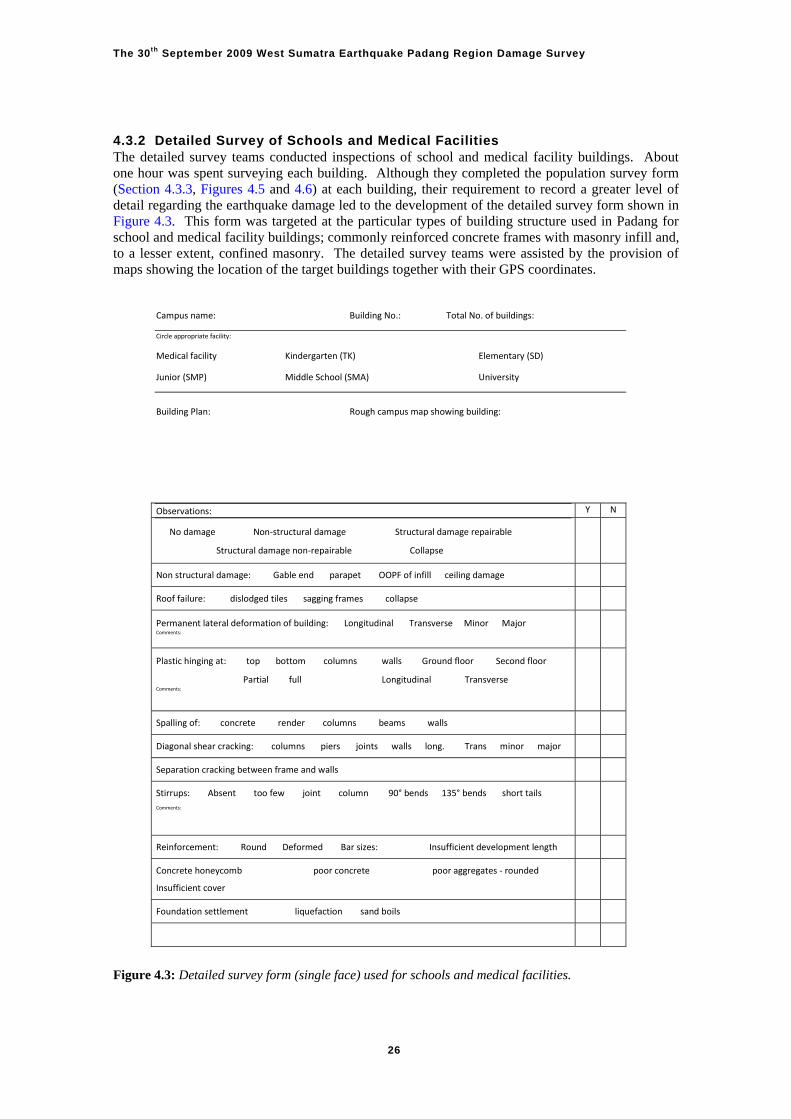
4.3.2 Detailed Survey of Schools and Medical Facilities The detailed survey teams conducted inspections of school and medical facility buildings. About one hour was spent surveying each building. Although they completed the population survey form (Section 4.3.3, Figures 4.5 and 4.6) at each building, their requirement to record a greater level of detail regarding the earthquake damage led to the development of the detailed survey form shown in Figure 4.3. This form was targeted at the particular types of building structure used in Padang for school and medical facility buildings; commonly reinforced concrete frames with masonry infill and, to a lesser extent, confined masonry. The detailed survey teams were assisted by the provision of maps showing the location of the target buildings together with their GPS coordinates.
Campus name: Building No.: Total No. of buildings:
Circle appropriate facility:
Medical facility Kindergarten (TK) Elementary (SD)
Junior (SMP) Middle School (SMA) University
Building Plan: Rough campus map showing building:
Observations: Y N
No damage Non‐structural damage Structural damage repairable
Structural damage non‐repairable Collapse
Non structural damage: Gable end parapet OOPF of infill ceiling damage
Roof failure: dislodged tiles sagging frames collapse
Permanent lateral deformation of building: Longitudinal Transverse Minor Major Comments:
Plastic hinging at: top bottom columns walls Ground floor Second floor
Partial full Longitudinal Transverse Comments:
Spalling of: concrete render columns beams walls
Diagonal shear cracking: columns piers joints walls long. Trans minor major
Separation cracking between frame and walls
Stirrups: Absent too few joint column 90° bends 135° bends short tails
Comments:
Reinforcement: Round Deformed Bar sizes: Insufficient development length
Concrete honeycomb poor concrete poor aggregates ‐ rounded
Insufficient cover
Foundation settlement liquefaction sand boils
Figure 4.3: Detailed survey form (single face) used for schools and medical facilities.
26
The 30th September 2009 West Sumatra Earthquake Padang Region Damage Survey
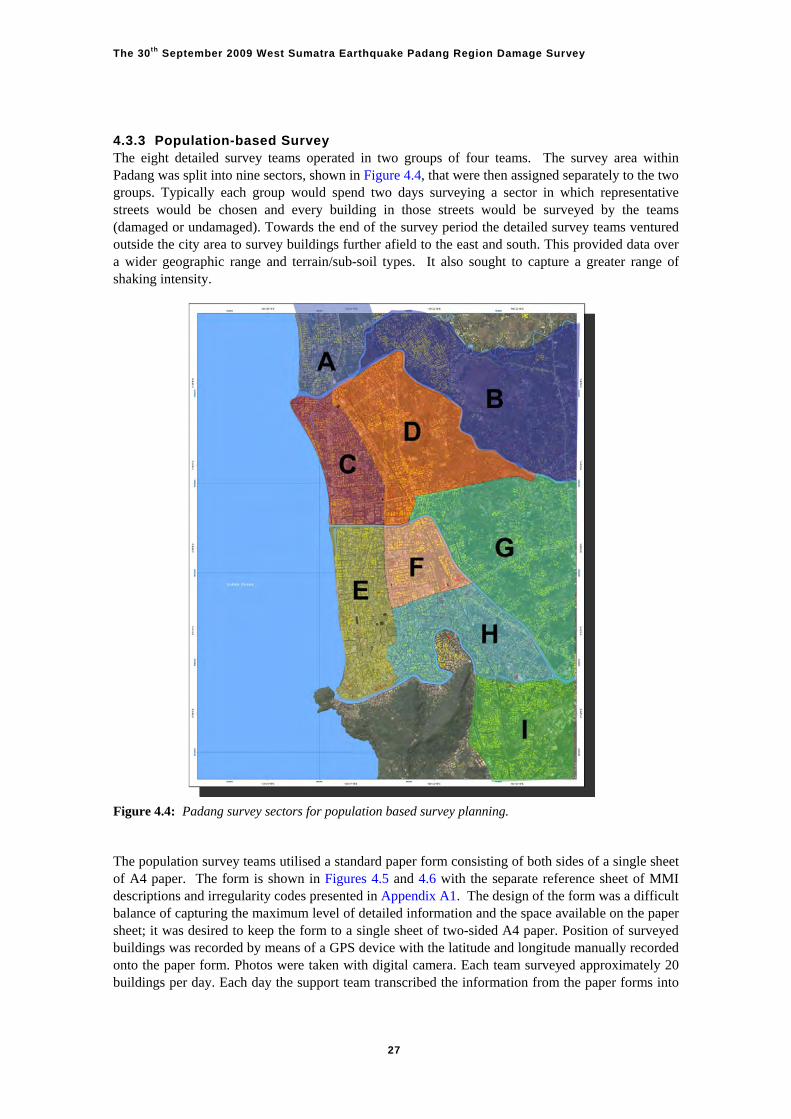
4.3.3 Population-based Survey The eight detailed survey teams operated in two groups of four teams. The survey area within Padang was split into nine sectors, shown in Figure 4.4, that were then assigned separately to the two groups. Typically each group would spend two days surveying a sector in which representative streets would be chosen and every building in those streets would be surveyed by the teams (damaged or undamaged). Towards the end of the survey period the detailed survey teams ventured outside the city area to survey buildings further afield to the east and south. This provided data over a wider geographic range and terrain/sub-soil types. It also sought to capture a greater range of shaking intensity.
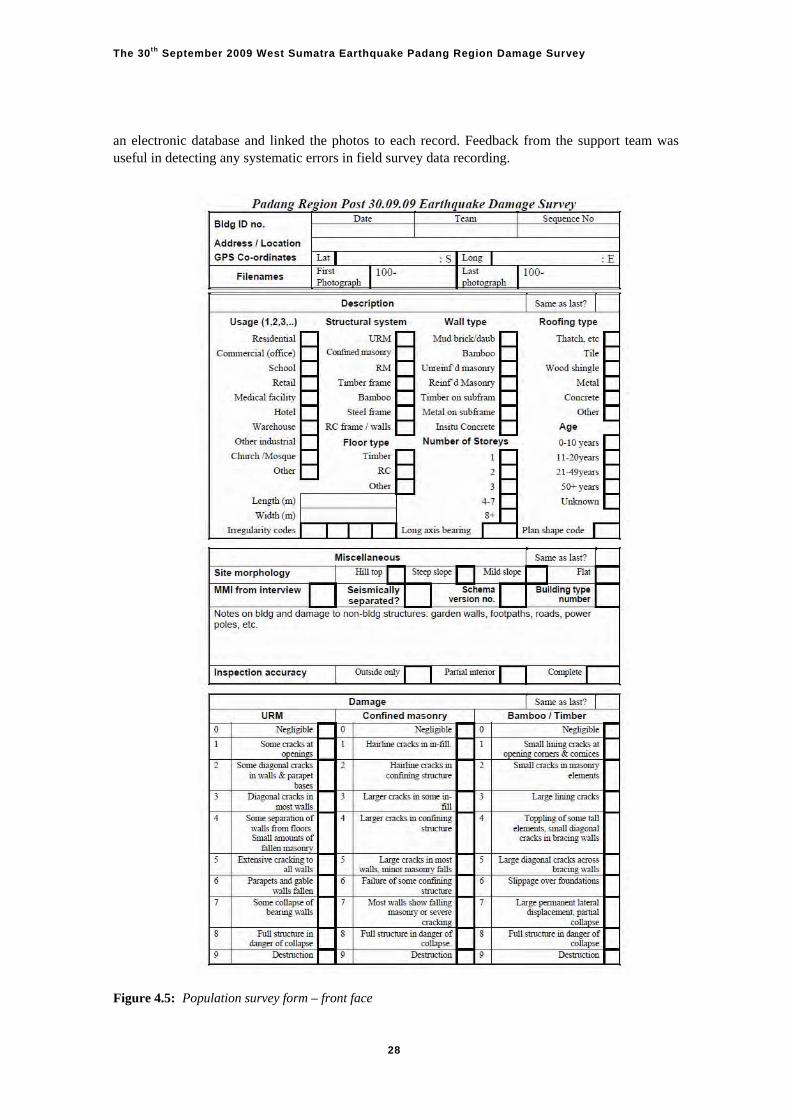
Figure 4.4: Padang survey sectors for population based survey planning. The population survey teams utilised a standard paper form consisting of both sides of a single sheet of A4 paper. The form is shown in Figures 4.5 and 4.6 with the separate reference sheet of MMI descriptions and irregularity codes presented in Appendix A1. The design of the form was a difficult balance of capturing the maximum level of detailed information and the space available on the paper sheet; it was desired to keep the form to a single sheet of two-sided A4 paper. Position of surveyed buildings was recorded by means of a GPS device with the latitude and longitude manually recorded onto the paper form. Photos were taken with digital camera. Each team surveyed approximately 20 buildings per day. Each day the support team transcribed the information from the paper forms into
27
The 30th September 2009 West Sumatra Earthquake Padang Region Damage Survey
an electronic database and linked the photos to each record. Feedback from the support team was useful in detecting any systematic errors in field survey data recording. Figure 4.5: Population survey form – front face
28
Pru/allO Re iOIl Post 30.09.09 Earthqllake Dalllaoe Sliney
Bldg 10 no. Dat~ ,,= , uellceNo
Add ress I Location
GPS Co-ordinates L" ,s Um, , E
Filena me s First ",ph 1100-Photog",
Last 1100-hotograph
Description I Same as laSl? I Usage (1.2.3 . .. ) Structu ra l s ystem Wall type Roofing type
Rtsickntial UB'" ,
Mud brick/daub 1kltch. nc
Commercial (offict) - Coof!!lON! m:tSOIlf)' I-- B=boo - Tilt
School - B'" I-- Unrtinf d masonry - Woodr.binglt
""" - Timbtr fr.unt I-- Reinf d Masonry - "'<O! Mtdical facility B=boo I- Timber on subfram COIICInt
Hotd - Sttel framt I-- Mnal on ",bfr.unt : o.h" War~hou", - KC fr.unt I wali, I-- lnsnu COIIcrttr A,.
Other industrial - Floor type '-
Numbe r of Storeys O-IO}'t=
Church /Mo",!"" Timber , , 1I -1Oyt=
o.h" Be I- , 11-49yt= - o.h" I-- ; -S(l-'- y~ars -Lnlgth(m) 4 -7 Unknown
Width (m) ,. Irr~gularity cocks I I Long ""is bearing r Plan shape coo. r
Misce lla neous Same as last?
S ite morphology Hill top I Strq> slopt I I l\1i1d ,!opt "" MMllrom inte rview S e ismically J SChem~ L Building type
s e parated? ve rs ion no. n umber
Notes on bldg a M dama ge to noo -bIdg structures garden walls , footpaths, roads. power poles, e tc_
Inspec tion accuracy I Outside"",,' I I I':Ini.al inImor I I Cornptttt I
Damage Same as Last' U.M Confined mas onry Bamboo I Tim ber , N~gible , Negligible , N~gib~ , S<:cnt CDCks at , Hairtior =l!; in in-fill_ , SmaU lining cr:><ks 31
COfIlt("S & cornic,"" , Somr di.gooa1 cracks , Hairlior cracks in , Sm.ill cracks in II""""')'
in wall, & p;>raptl confming SlrucTUft """,,,. ...., ; Diagona1 crack!; in ; ~ cracks in """" in- ; Large tining cr3Cks -,,,", ru, , S<:cnt s.rp"uTioo of , ~ crack!; in coofining , Topptin~ of"""'" talt
wall, from fIoor<. ,!n>:turt . Iemrnr ... SIll3il di.:Jgomt smaU amoums of cr:><ks in bncing ,,-..us
"""'~ , &tmsi\'t cracking 10 ; Largr crack!; in!l105l , l.d:rgt diagonal <nds:>CroSS "",..,,lls wills, minor tIl.15OOf)' f:ills br.Icing "dlJS
• Paraptls :md gabl~ • Failnrt of""""confming • Slipp:lg~ O\'tf foo.mdITions walls fall", ,tructur~ , S<:cnt roIlapst of , l\lost walls show filling , Large permanent latoral
btarinl! walls m:l5Oflf)' or ='tft di'pbcmYn~ = ,
~~!Urtin , Full ,trucTUfe in ~ • Fult structurt in <!:mgt< of
ofrol.lap;t ro~p><
• DrstrucTion , Drs!n>:Tioo • Destruclion

The 30th September 2009 West Sumatra Earthquake Padang Region Damage Survey
Figure 4.6: Population survey form – back face Data on the inhabitants and their experiences during the earthquake were captured by interview where possible. The interview was also used to assign a MMI value to the building being surveyed.
29

The 30th September 2009 West Sumatra Earthquake Padang Region Damage Survey
The numbers of buildings collectively surveyed with regards to their predominant usage type are presented in Table 4.2. The spatial distribution of the building types surveyed in the Padang region is presented in Figure 4.7. The region of Pariaman to the north was also surveyed. Table 4.2: Surveyed building usage types (primary) and total numbers for detailed and population
based surveys combined
PRIMARY BUILDING USAGE NUMBER
SURVEYED
Church/Mosque 34
Commercial (office) 183
Hotel 11
Medical Facility 108
Industrial 10
Retail 285
Warehouse 74
School 460
Residential 2,667
Other 54
Unknown 10
Total 3,896
Figure 4.7: Surveyed building types and spatial distribution in Padang region.
30
The 30th September 2009 West Sumatra Earthquake Padang Region Damage Survey
5 MASW Survey and Spatial PGA Estimate 5.1 AIM & OBJECTIVES The aim of this work is to estimate the distribution of peak ground acceleration (PGA) values resulting from the 30 September 2009 earthquake. These have been determined for buildings covered in the post-disaster survey in the cities of Padang and Pariaman. Specific objectives of the work were to:
• Conduct multi-channel analysis of surface wave (MASW) survey within the cities of Padang and Pariaman.
• Determine levels of peak ground acceleration on reference bedrock using earthquake source properties for the 30 September 2009 event and ground motion prediction equations.
• Estimate site amplification effects by analysing wave propagation analysis from bedrock to the ground surface.
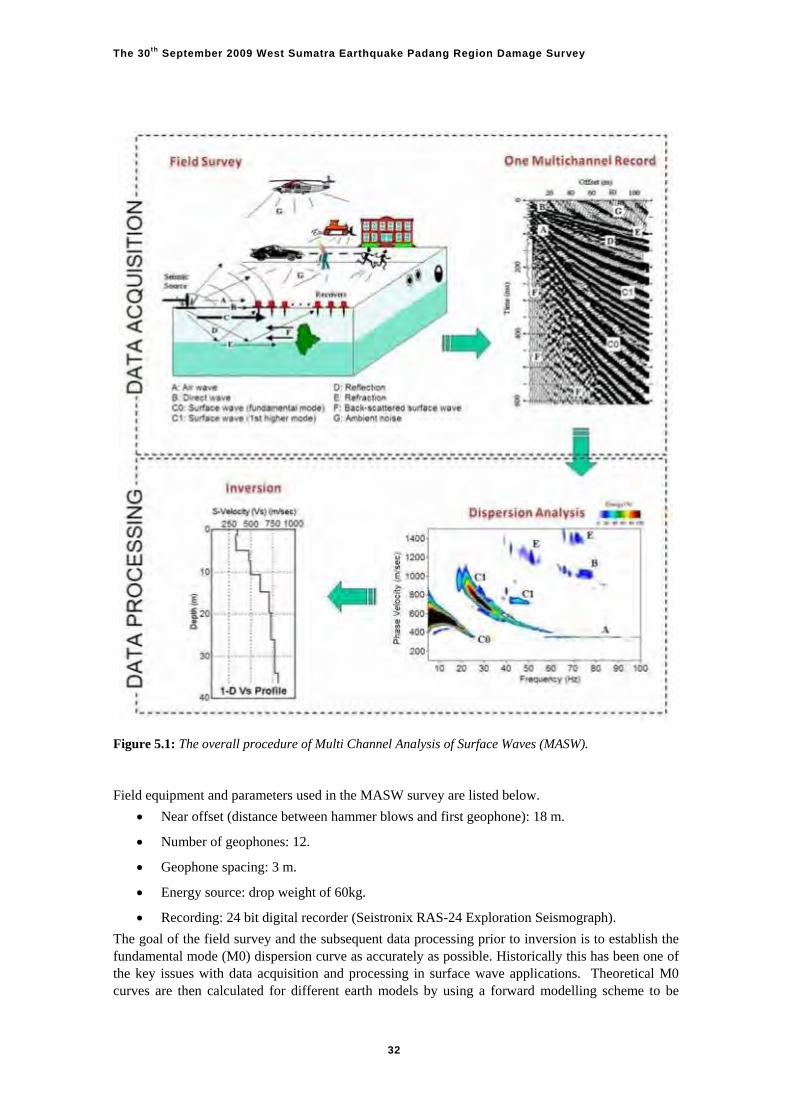
5.2 TEAMS The earthquake ground motion analysis and MASW survey to estimate a spatial PGA for the City of Padang and Pariaman was conducted by the Center for Disaster Mitigation - Institut Teknologi Bandung (CDM-ITB) team, with support from University of Andalas-Padang. 5.3 SURVEY AND ANALYSIS METHODOLOGY The following sections describe the survey and analysis methodology applied. 5.3.1 MASW Survey The Multi-channel Analysis of Surface Waves (MASW) technique is a seismic survey method for evaluating the elastic condition (stiffness) of the ground for geotechnical engineering purposes. MASW first measures seismic surface waves generated from various types of seismic sources, such as a sledge hammer, analyses the propagation velocities of those surface waves, and then calculates shear-wave velocity (Vs) variations below the surveyed area that are a best fit for the analysed propagation velocity pattern of surface waves. MASW surveys usually consist of three steps detailed below and shown diagrammatically in Figure 5.1:
1. Data Acquisition: field collection of multichannel data (commonly called shot gathers in conventional seismic exploration)
2. Dispersion Analysis: extracting dispersion curves (one from each record)
3. Inversion: back-calculating shear-wave velocity (Vs) variation with depth (called 1-D Vs profile) that gives theoretical dispersion curves closest to the extracted curves (one 1-D Vs profile from each curve).
31
The 30th September 2009 West Sumatra Earthquake Padang Region Damage Survey
Figure 5.1: The overall procedure of Multi Channel Analysis of Surface Waves (MASW). Field equipment and parameters used in the MASW survey are listed below.
Near offset (distance between hammer blows and first geophone): 18 m.
Number of geophones: 12.
Geophone spacing: 3 m.
Energy source: drop weight of 60kg.
Recording: 24 bit digital recorder (Seistronix RAS-24 Exploration Seismograph).
The goal of the field survey and the subsequent data processing prior to inversion is to establish the fundamental mode (M0) dispersion curve as accurately as possible. Historically this has been one of the key issues with data acquisition and processing in surface wave applications. Theoretical M0 curves are then calculated for different earth models by using a forward modelling scheme to be
32
The 30th September 2009 West Sumatra Earthquake Padang Region Damage Survey
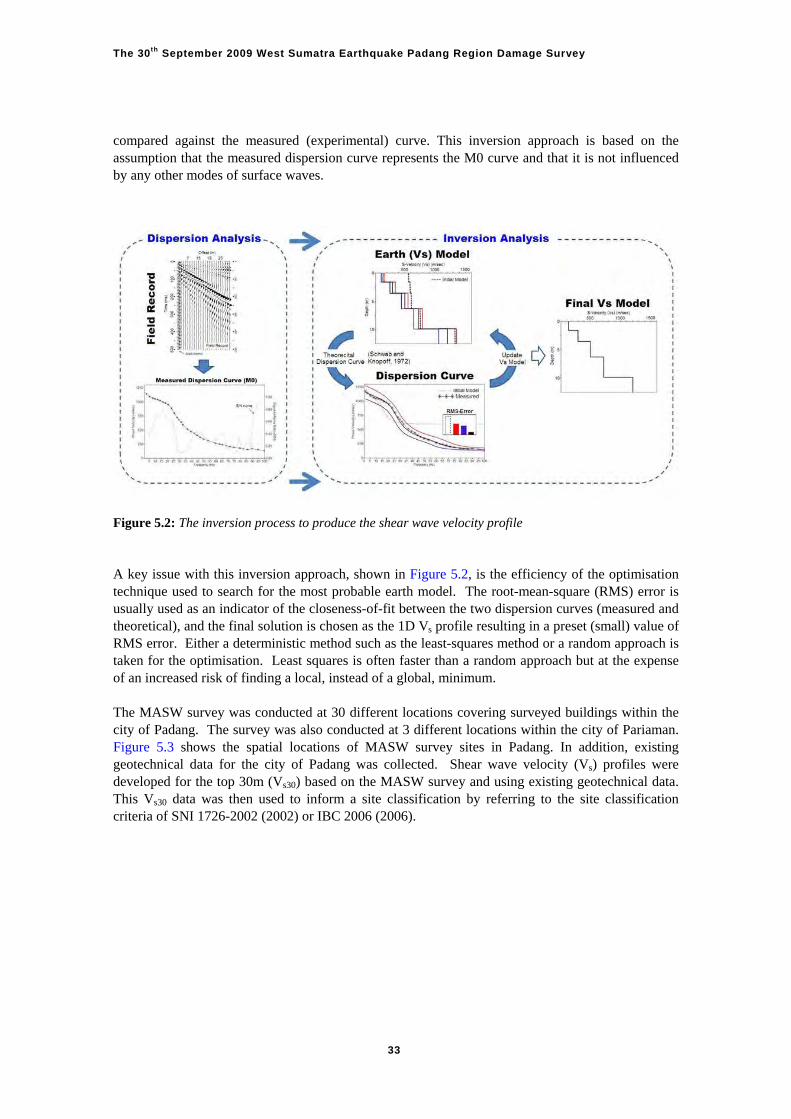
compared against the measured (experimental) curve. This inversion approach is based on the assumption that the measured dispersion curve represents the M0 curve and that it is not influenced by any other modes of surface waves.
Figure 5.2: The inversion process to produce the shear wave velocity profile A key issue with this inversion approach, shown in Figure 5.2, is the efficiency of the optimisation technique used to search for the most probable earth model. The root-mean-square (RMS) error is usually used as an indicator of the closeness-of-fit between the two dispersion curves (measured and theoretical), and the final solution is chosen as the 1D Vs profile resulting in a preset (small) value of RMS error. Either a deterministic method such as the least-squares method or a random approach is taken for the optimisation. Least squares is often faster than a random approach but at the expense of an increased risk of finding a local, instead of a global, minimum. The MASW survey was conducted at 30 different locations covering surveyed buildings within the city of Padang. The survey was also conducted at 3 different locations within the city of Pariaman. Figure 5.3 shows the spatial locations of MASW survey sites in Padang. In addition, existing geotechnical data for the city of Padang was collected. Shear wave velocity (Vs) profiles were developed for the top 30m (Vs30) based on the MASW survey and using existing geotechnical data. This Vs30 data was then used to inform a site classification by referring to the site classification criteria of SNI 1726-2002 (2002) or IBC 2006 (2006).
33
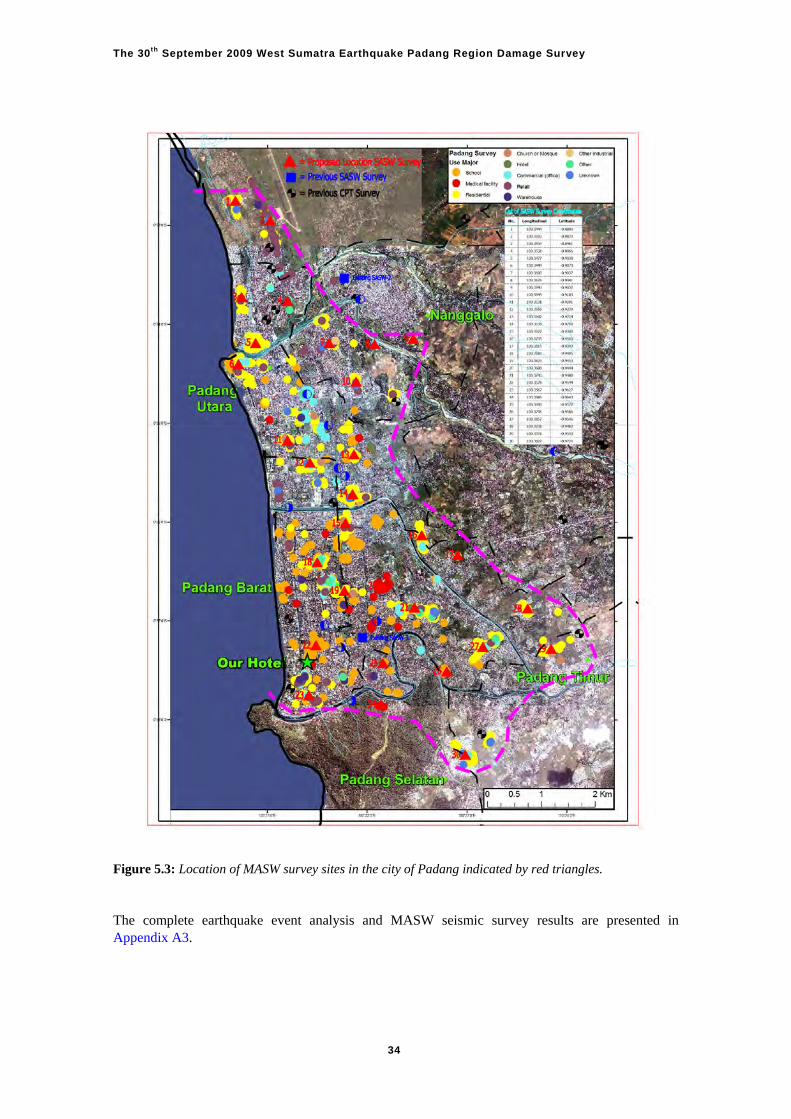
The 30th September 2009 West Sumatra Earthquake Padang Region Damage Survey
Figure 5.3: Location of MASW survey sites in the city of Padang indicated by red triangles. The complete earthquake event analysis and MASW seismic survey results are presented in Appendix A3.
34

The 30th September 2009 West Sumatra Earthquake Padang Region Damage Survey
5.3.2 PGA Estimation Firstly, a seismic attenuation analysis of the 30 September 2009 earthquake event was undertaken. The analysis was conducted by identifying the earthquake source characteristics and distances to sites of interest. In this process a deterministic seismic hazard analysis (DSHA) was completed to estimate the distribution of peak ground acceleration (PGA) at base-rock. The analysis was conducted using EZ-FRISK 7.32 software (Risk Engineering Inc., 2004). Attenuation functions by published by Youngs et al (1997) [Young intraslab] were adopted to represent the subduction earthquake sources. Secondly, a site-response analysis (SRA) was carried out to estimate peak ground surface acceleration and response-spectra by considering predicted input motions and dynamic soil properties of the sites. In the case of the cities of Padang and Pariaman, there is no strong motion data available, therefore the simplest conventional method of generating input motions by scaling available strong motion records from other sites was applied. Strong motion records are commonly scaled to match target PGA of the site of interest by spectral-matching techniques. In this study, spectral-matching techniques proposed by Abrahamson (Abrahamson 1998) and adopted and built into the EZ-FRISK Computer Program Version 7.2 were utilised. Time-domain wave propagation analyses from bedrock to ground surface were then completed using the NERA (nonlinear earthquake response analysis) computer program (Bardet and Tobita, 2001). Complete site-response analysis results are presented in Appendix A3.
5.4 PGA SPATIAL DISTRIBUTION RESULTS
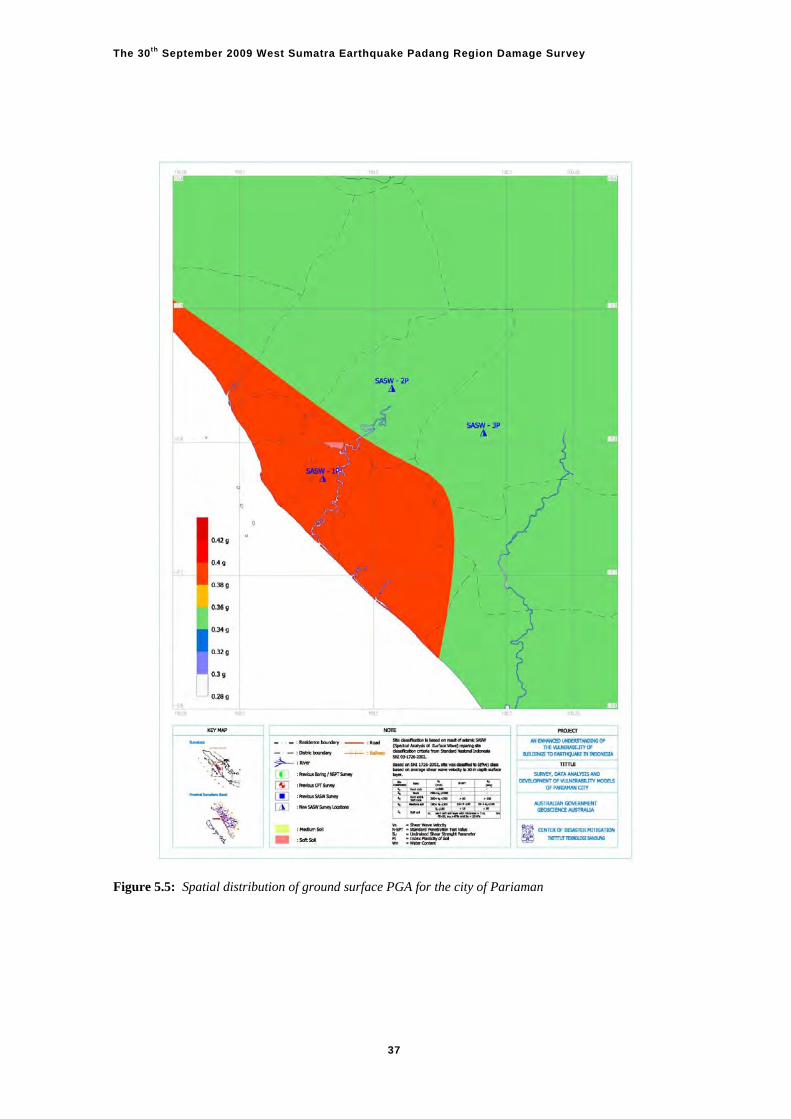
Based on the results of seismic wave propagation analysis, which were carried out by considering the Vs30 data for each location in the sub-district and the estimated earthquake PGA on bedrock, maps of the spatial distribution of PGA at the ground surface for the cities of Padang and Pariaman have been developed and are presented in Figures 5.4 and 5.5. The complete analysis and results of the PGA spatial distribution assessment are presented in Appendix A3.
35
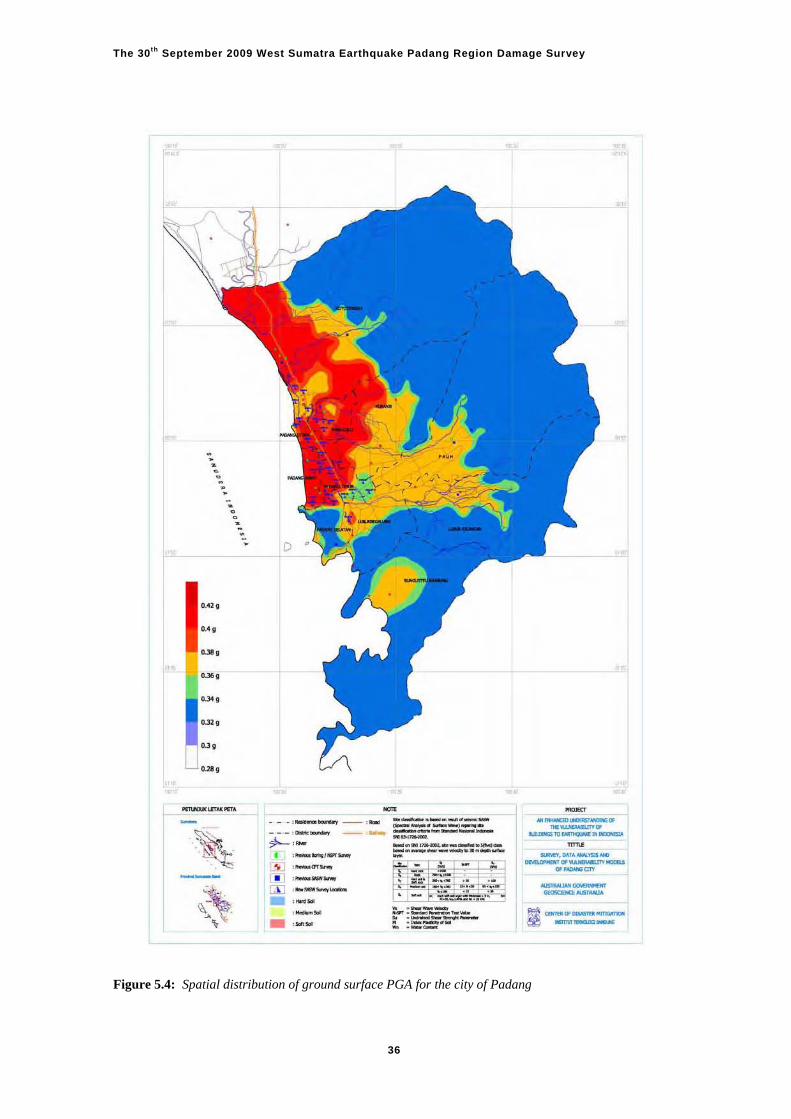
The 30th September 2009 West Sumatra Earthquake Padang Region Damage Survey
Figure 5.4: Spatial distribution of ground surface PGA for the city of Padang
36
~, ,
• '<l [j]
U!J • •
,----,'-- -'-.... 1-'-"'._--.... _-. _SoI ._SoI
--.------=---==--===------.. .".-------..... _---_ ... _-Rty}@ " ._--.---... _--" .-- -... ... . --
-... .....a> __ ..
~-. ........ "'_ ........... ~
........ ,"".---__ .. "-,-,,,-.s --= M """" ... ___ ~ _-.00._
The 30th September 2009 West Sumatra Earthquake Padang Region Damage Survey
Figure 5.5: Spatial distribution of ground surface PGA for the city of Pariaman
37
The 30th September 2009 West Sumatra Earthquake Padang Region Damage Survey
6 Post-Survey Analysis 6.1 DALA REPORTING While the survey activity was progressing a parallel assessment process was being advanced by a World Bank engineering team. Following major natural disasters the World Bank typically arranges for a Damage and Loss Assessment (DALA) to be made to inform strategies for promoting recovery in the affected region. Through the coordinating effort of the AIFDR a brief report was prepared by the detailed survey team to augment the structural assessment commentary of the DALA. The expert team contributions addressed what should be done as part of the recovery and what will be needed for regional development into the future. The DALA recommendations made by the expert (detailed) engineering team are contained as an addendum to their separate report in Appendix A2. The key recommendations made in the DALA contributions were:- Regulatory
The design criteria in the current building regulations should be reviewed to ensure that facilities intended to provide refuge and/or to have a post-disaster function will be functional in the event of the expected mega-thrust earthquake in the region. Ordinary buildings of three storeys height or greater should also be designed to a higher standard (e.g. to act as tsunami refuges following a large earthquake).
Existing key facilities that performed adequately in the 30 September earthquake should be checked for adequacy in the context of the expected mega-thrust earthquake and strategies for retrofit developed and implemented where required.
Other non-engineered structures should be reviewed and strategies developed to improve structurally deficient buildings.
Some apparently heavily damaged structures should be assessed in greater detail as they may not require demolition.
Confined masonry should be promoted for new masonry construction. Detailed hazard mapping should be carried out covering earthquake amplification, soil
liquefaction potential and landslide susceptibility for use in local development planning by government.
Enforcement of Regulations
The overall building construction and quality assurance process in West Sumatra should be assessed and modified to ensure buildings are designed and constructed to the required level. This will require education on appropriate construction techniques as well as a regime of building inspections during construction of engineered and non-engineered structures.
Building Permits should be required for all work to assist in quality control. An advisory team of experts and professionals would assist Provincial and Mayoral Offices to improve scrutiny of proposed designs.
A mandated inspection regime is required to ensure buildings are constructed to the design with particular attention to reinforcement placement and concrete quality.
Training in fundamentals of reinforced concrete construction and seismic detailing should be provided throughout the professional and construction communities in West Sumatra (and Indonesia) to improve design and construction quality. Training of building workers and the education of building owners will assist in the reform process.
38
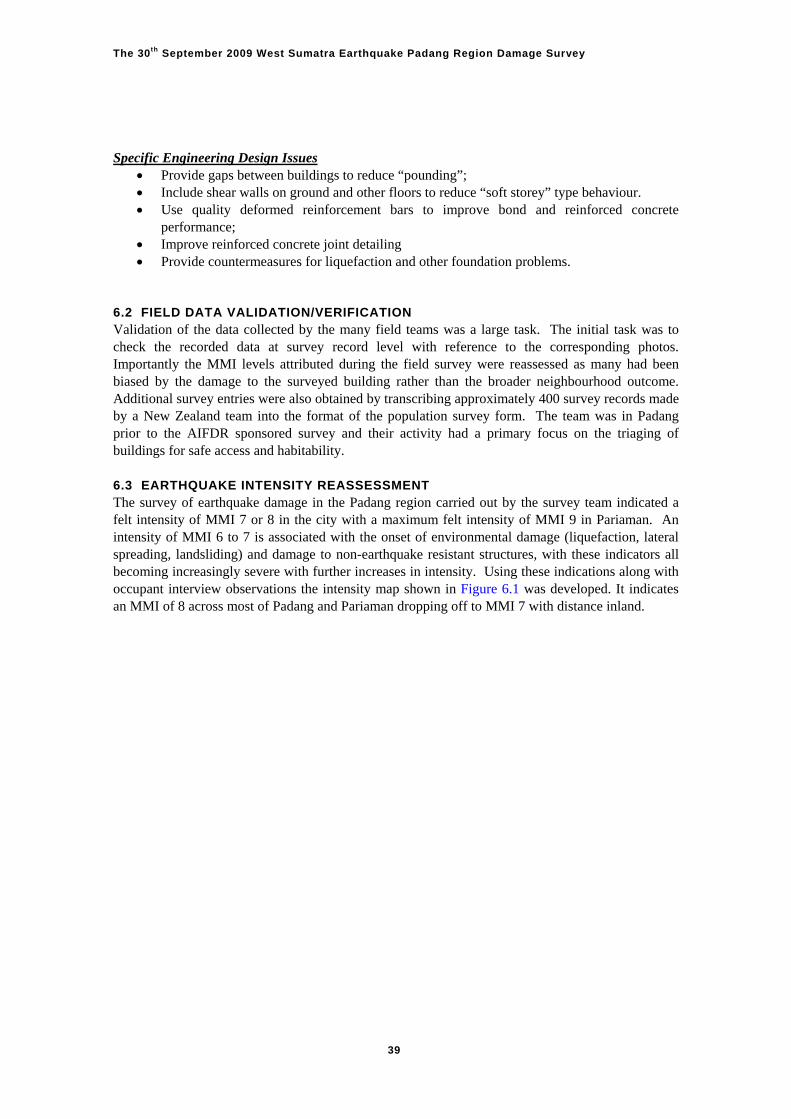
The 30th September 2009 West Sumatra Earthquake Padang Region Damage Survey
Specific Engineering Design Issues
Provide gaps between buildings to reduce “pounding”; Include shear walls on ground and other floors to reduce “soft storey” type behaviour. Use quality deformed reinforcement bars to improve bond and reinforced concrete
performance; Improve reinforced concrete joint detailing Provide countermeasures for liquefaction and other foundation problems.
6.2 FIELD DATA VALIDATION/VERIFICATION Validation of the data collected by the many field teams was a large task. The initial task was to check the recorded data at survey record level with reference to the corresponding photos. Importantly the MMI levels attributed during the field survey were reassessed as many had been biased by the damage to the surveyed building rather than the broader neighbourhood outcome. Additional survey entries were also obtained by transcribing approximately 400 survey records made by a New Zealand team into the format of the population survey form. The team was in Padang prior to the AIFDR sponsored survey and their activity had a primary focus on the triaging of buildings for safe access and habitability. 6.3 EARTHQUAKE INTENSITY REASSESSMENT The survey of earthquake damage in the Padang region carried out by the survey team indicated a felt intensity of MMI 7 or 8 in the city with a maximum felt intensity of MMI 9 in Pariaman. An intensity of MMI 6 to 7 is associated with the onset of environmental damage (liquefaction, lateral spreading, landsliding) and damage to non-earthquake resistant structures, with these indicators all becoming increasingly severe with further increases in intensity. Using these indications along with occupant interview observations the intensity map shown in Figure 6.1 was developed. It indicates an MMI of 8 across most of Padang and Pariaman dropping off to MMI 7 with distance inland.
39
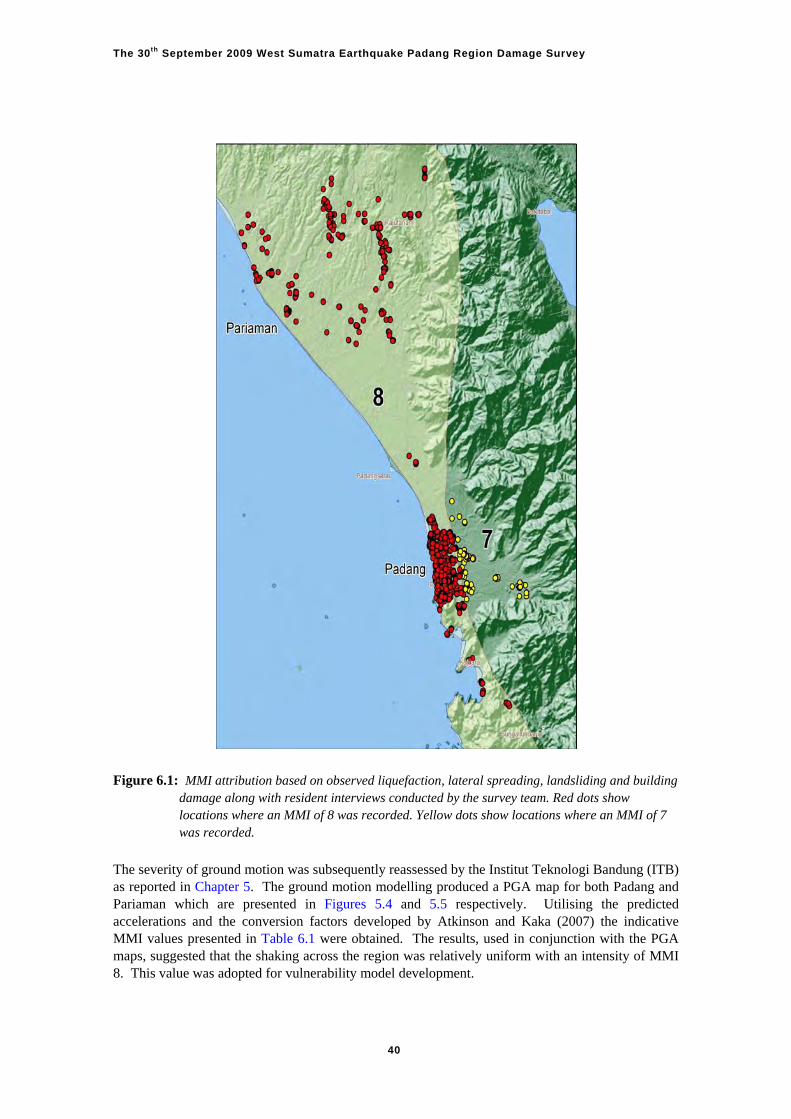
The 30th September 2009 West Sumatra Earthquake Padang Region Damage Survey
Figure 6.1: MMI attribution based on observed liquefaction, lateral spreading, landsliding and building
damage along with resident interviews conducted by the survey team. Red dots show locations where an MMI of 8 was recorded. Yellow dots show locations where an MMI of 7 was recorded.
The severity of ground motion was subsequently reassessed by the Institut Teknologi Bandung (ITB) as reported in Chapter 5. The ground motion modelling produced a PGA map for both Padang and Pariaman which are presented in Figures 5.4 and 5.5 respectively. Utilising the predicted accelerations and the conversion factors developed by Atkinson and Kaka (2007) the indicative MMI values presented in Table 6.1 were obtained. The results, used in conjunction with the PGA maps, suggested that the shaking across the region was relatively uniform with an intensity of MMI 8. This value was adopted for vulnerability model development.
40
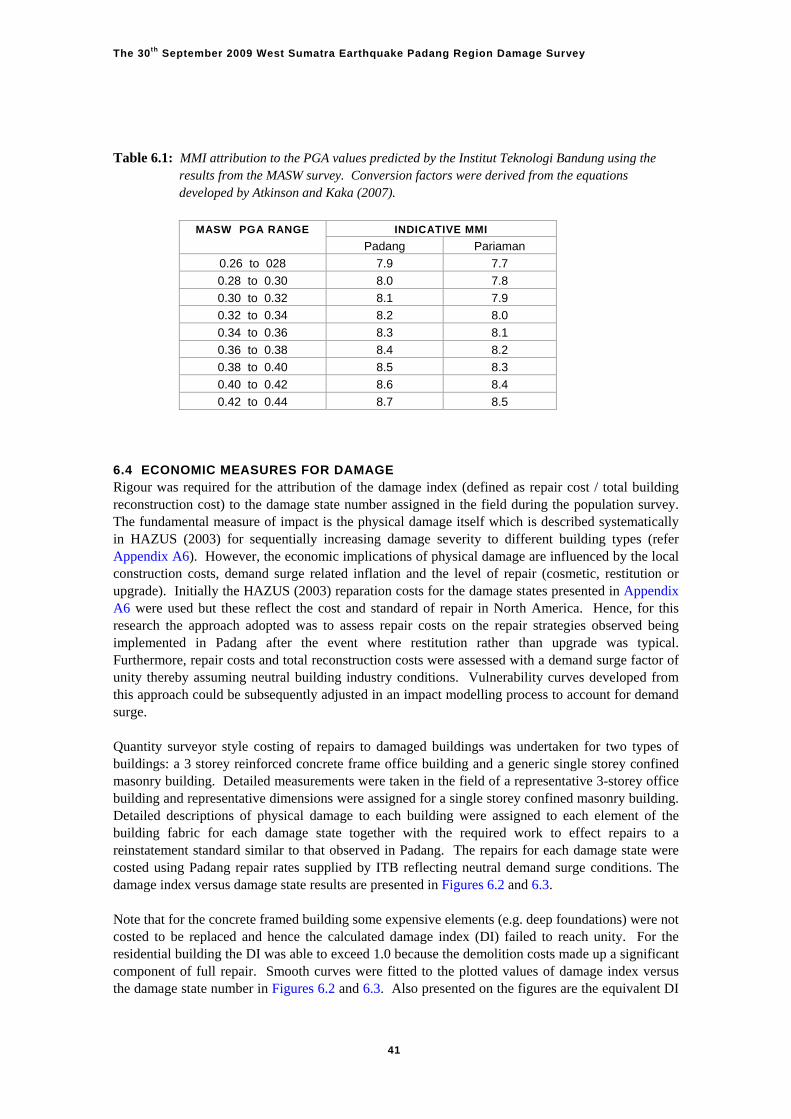
The 30th September 2009 West Sumatra Earthquake Padang Region Damage Survey
Table 6.1: MMI attribution to the PGA values predicted by the Institut Teknologi Bandung using the
results from the MASW survey. Conversion factors were derived from the equations developed by Atkinson and Kaka (2007).
INDICATIVE MMI MASW PGA RANGE
Padang Pariaman
0.26 to 028 7.9 7.7
0.28 to 0.30 8.0 7.8
0.30 to 0.32 8.1 7.9
0.32 to 0.34 8.2 8.0
0.34 to 0.36 8.3 8.1
0.36 to 0.38 8.4 8.2
0.38 to 0.40 8.5 8.3
0.40 to 0.42 8.6 8.4
0.42 to 0.44 8.7 8.5
6.4 ECONOMIC MEASURES FOR DAMAGE Rigour was required for the attribution of the damage index (defined as repair cost / total building reconstruction cost) to the damage state number assigned in the field during the population survey. The fundamental measure of impact is the physical damage itself which is described systematically in HAZUS (2003) for sequentially increasing damage severity to different building types (refer Appendix A6). However, the economic implications of physical damage are influenced by the local construction costs, demand surge related inflation and the level of repair (cosmetic, restitution or upgrade). Initially the HAZUS (2003) reparation costs for the damage states presented in Appendix A6 were used but these reflect the cost and standard of repair in North America. Hence, for this research the approach adopted was to assess repair costs on the repair strategies observed being implemented in Padang after the event where restitution rather than upgrade was typical. Furthermore, repair costs and total reconstruction costs were assessed with a demand surge factor of unity thereby assuming neutral building industry conditions. Vulnerability curves developed from this approach could be subsequently adjusted in an impact modelling process to account for demand surge. Quantity surveyor style costing of repairs to damaged buildings was undertaken for two types of buildings: a 3 storey reinforced concrete frame office building and a generic single storey confined masonry building. Detailed measurements were taken in the field of a representative 3-storey office building and representative dimensions were assigned for a single storey confined masonry building. Detailed descriptions of physical damage to each building were assigned to each element of the building fabric for each damage state together with the required work to effect repairs to a reinstatement standard similar to that observed in Padang. The repairs for each damage state were costed using Padang repair rates supplied by ITB reflecting neutral demand surge conditions. The damage index versus damage state results are presented in Figures 6.2 and 6.3. Note that for the concrete framed building some expensive elements (e.g. deep foundations) were not costed to be replaced and hence the calculated damage index (DI) failed to reach unity. For the residential building the DI was able to exceed 1.0 because the demolition costs made up a significant component of full repair. Smooth curves were fitted to the plotted values of damage index versus the damage state number in Figures 6.2 and 6.3. Also presented on the figures are the equivalent DI
41
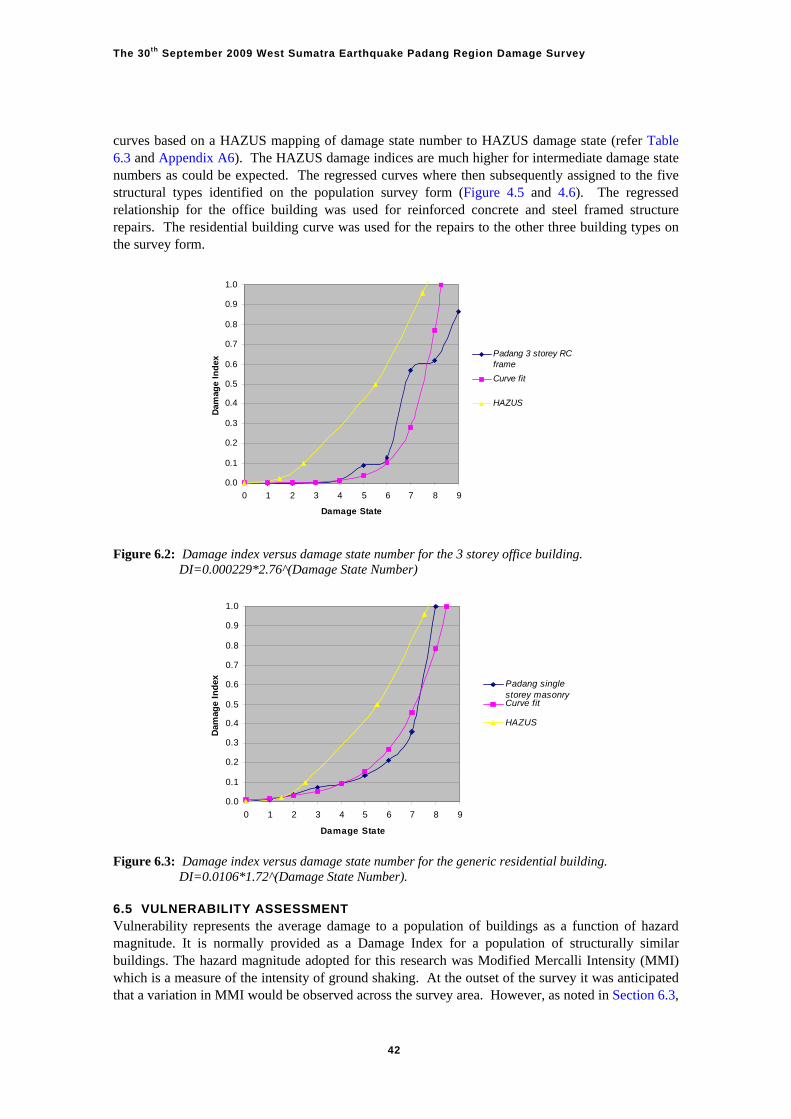
The 30th September 2009 West Sumatra Earthquake Padang Region Damage Survey
curves based on a HAZUS mapping of damage state number to HAZUS damage state (refer Table 6.3 and Appendix A6). The HAZUS damage indices are much higher for intermediate damage state numbers as could be expected. The regressed curves where then subsequently assigned to the five structural types identified on the population survey form (Figure 4.5 and 4.6). The regressed relationship for the office building was used for reinforced concrete and steel framed structure repairs. The residential building curve was used for the repairs to the other three building types on the survey form.
0.0
0.1
0.2
0.3
0.4
0.5
0.6
0.7
0.8
0.9
1.0
0 1 2 3 4 5 6 7 8 9
Damage State
Dam
age
Ind
ex
Pfra
adang 3 storey RC
me
Curv e fit
HA ZUS
Figure 6.2: Damage index versus damage state number for the 3 storey office building.
DI=0.000229*2.76^(Damage State Number)
0.0
0.1
0.2
0.3
0.4
0.5
0.6
0.7
0.8
0.9
1.0
0 1 2 3 4 5 6 7 8 9
Damage State
Dam
age
Ind
ex Padangstorey
single
masonryCurve f it
HAZUS Figure 6.3: Damage index versus damage state number for the generic residential building.
DI=0.0106*1.72^(Damage State Number). 6.5 VULNERABILITY ASSESSMENT Vulnerability represents the average damage to a population of buildings as a function of hazard magnitude. It is normally provided as a Damage Index for a population of structurally similar buildings. The hazard magnitude adopted for this research was Modified Mercalli Intensity (MMI) which is a measure of the intensity of ground shaking. At the outset of the survey it was anticipated that a variation in MMI would be observed across the survey area. However, as noted in Section 6.3,
42

The 30th September 2009 West Sumatra Earthquake Padang Region Damage Survey
very little variation in MMI was observed in the region with nearly all locations initially assessed as MMI 8 with a small proportion (9%) assessed as MMI 7. The reassessment of felt intensity using the MASW predictions of PGA (refer Section 6.3) resulted in the entire survey region being assessed as MMI 8 typically. Hence all surveyed points were grouped into a single set of results and vulnerability was calculated for the single hazard magnitude of MMI 8. The vulnerability results are presented in Table 6.2 Fragility represents the probability of a given building sustaining a predetermined level of damage for a given hazard magnitude. Fragilities were calculated for well represented building categories in the building schema using the damage state loss ranges summarised in Table 6.3. These were building type specific and were derived from the fitted curves shown in Figure 6.2 and 6.3. Also presented in Table 6.3 are the HAZUS damage index ranges for comparison purposes only. The fragility results are shown graphically in Figure 6.4 and presented in Table 6.4. It can be noted in Table 6.4 that the DI range for complete damage was les than 1.0. While this suggests that buildings that were completely damaged in a physical sense were repairable, in practice these were demolished in Padang rather than repaired. For this reason, the fragility categorisation herein presented does reflect the observed outcomes for damaged structures. Table 6.2: Vulnerability for well-represented building types in Padang at MMI 8. DI = Damage Index.
SCHEMA DESCRIPTION AVERAGE DI
URM / metal roof 0.35
URM / tile roof 0.48
Confined masonry residential / metal roof 0.07
Confined masonry residential / tile roof 0.04
Timber frame residential 0.07
RC frame residential / metal roof 0.06
RC frame residential / tile roof 0.09
C1L pre 1981 0.07
C1L 1981 - 2002 0.07
C1L 2003+ 0.06
C1M pre 1981 0.11
C1M 1981 - 2002 0.12
C1M 2003+ 0.29
URML / URMM 0.31
W1 / W2 0.19
Timber frame with stucco infill 0.10
43
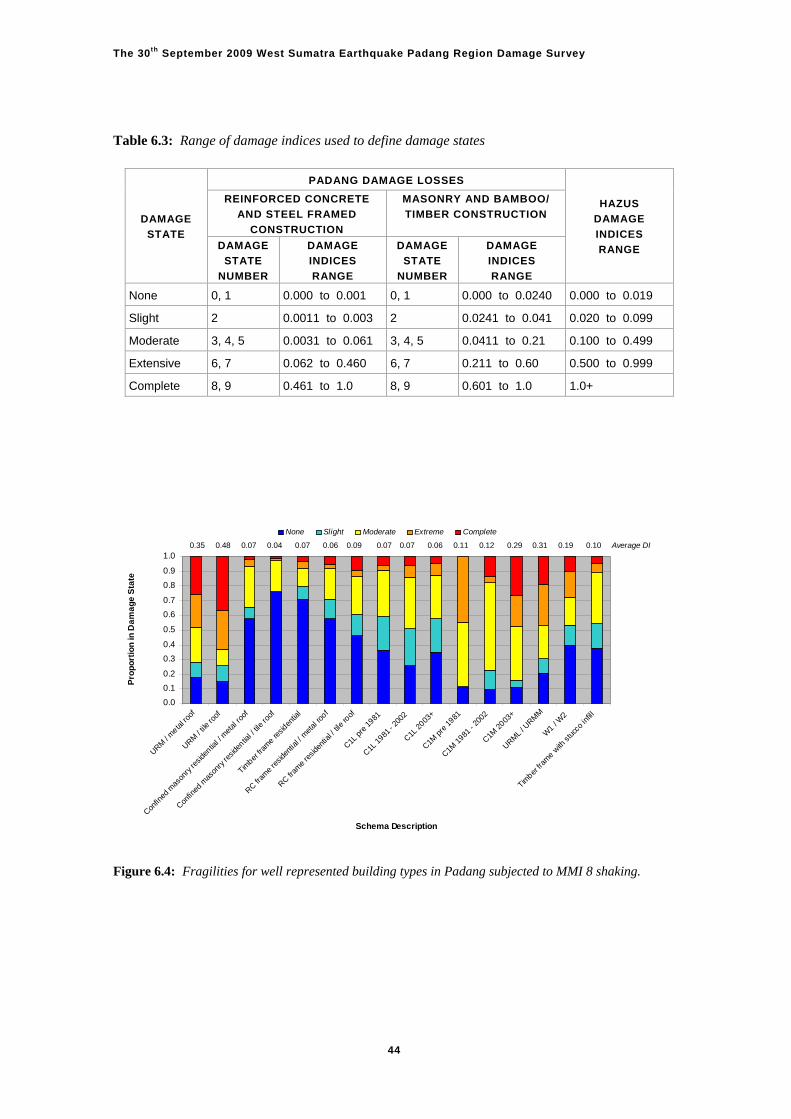
The 30th September 2009 West Sumatra Earthquake Padang Region Damage Survey
Table 6.3: Range of damage indices used to define damage states
PADANG DAMAGE LOSSES
REINFORCED CONCRETE
AND STEEL FRAMED
CONSTRUCTION
MASONRY AND BAMBOO/
TIMBER CONSTRUCTION DAMAGE
STATE DAMAGE
STATE
NUMBER
DAMAGE
INDICES
RANGE
DAMAGE
STATE
NUMBER
DAMAGE
INDICES
RANGE
HAZUS
DAMAGE
INDICES
RANGE
None 0, 1 0.000 to 0.001 0, 1 0.000 to 0.0240 0.000 to 0.019
Slight 2 0.0011 to 0.003 2 0.0241 to 0.041 0.020 to 0.099
Moderate 3, 4, 5 0.0031 to 0.061 3, 4, 5 0.0411 to 0.21 0.100 to 0.499
Extensive 6, 7 0.062 to 0.460 6, 7 0.211 to 0.60 0.500 to 0.999
Complete 8, 9 0.461 to 1.0 8, 9 0.601 to 1.0 1.0+
0.0
0.1
0.2
0.3
0.4
0.5
0.6
0.7
0.8
0.9
1.0
URM /
meta
l roo
f
URM /
tile ro
of
Confin
ed m
ason
ry re
siden
tial /
met
al ro
of
Confin
ed m
ason
ry re
siden
tial /
tile
roof
Timber
fram
e resid
entia
l
RC fram
e re
siden
tial /
met
al ro
of
RC fram
e re
siden
tial /
tile
roof
C1L p
re 1
981
C1L 1
981 -
2002
C1L 2
003+
C1M p
re 1
981
C1M 1
981 -
2002
C1M 2
003+
URML
/ URM
M
W1 /
W2
Timber
fram
e with
stu
cco
infill
Schema Description
Pro
po
rtio
n in
Da
ma
ge
Sta
te
None Slight Moderate Extreme Complete
0.35 0.48 0.07 0.04 0.07 0.06 0.09 0.07 0.07 0.06 0.11 0.12 0.29 0.31 0.19 0.10 Average DI
Figure 6.4: Fragilities for well represented building types in Padang subjected to MMI 8 shaking.
44
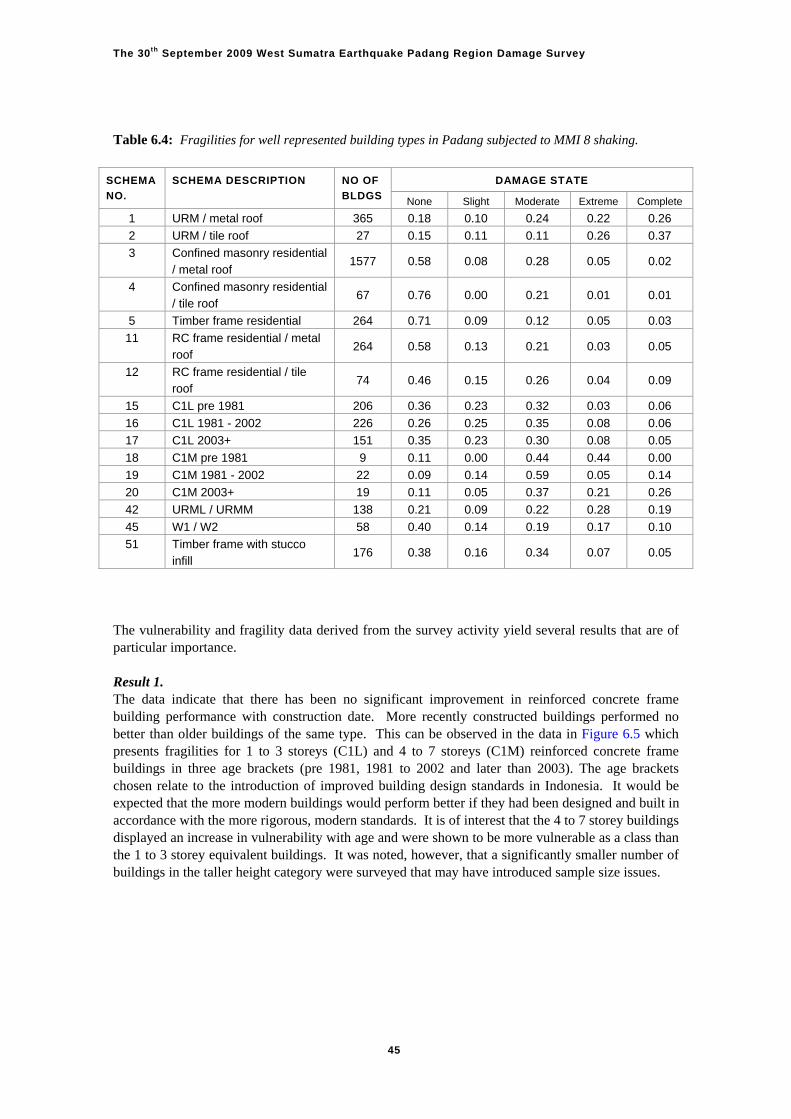
The 30th September 2009 West Sumatra Earthquake Padang Region Damage Survey
Table 6.4: Fragilities for well represented building types in Padang subjected to MMI 8 shaking.
DAMAGE STATE SCHEMA
NO.
SCHEMA DESCRIPTION NO OF
BLDGS None Slight Moderate Extreme Complete
1 URM / metal roof 365 0.18 0.10 0.24 0.22 0.26
2 URM / tile roof 27 0.15 0.11 0.11 0.26 0.37
3 Confined masonry residential / metal roof
1577 0.58 0.08 0.28 0.05 0.02
4 Confined masonry residential / tile roof
67 0.76 0.00 0.21 0.01 0.01
5 Timber frame residential 264 0.71 0.09 0.12 0.05 0.03
11 RC frame residential / metal roof
264 0.58 0.13 0.21 0.03 0.05
12 RC frame residential / tile roof
74 0.46 0.15 0.26 0.04 0.09
15 C1L pre 1981 206 0.36 0.23 0.32 0.03 0.06
16 C1L 1981 - 2002 226 0.26 0.25 0.35 0.08 0.06
17 C1L 2003+ 151 0.35 0.23 0.30 0.08 0.05
18 C1M pre 1981 9 0.11 0.00 0.44 0.44 0.00
19 C1M 1981 - 2002 22 0.09 0.14 0.59 0.05 0.14
20 C1M 2003+ 19 0.11 0.05 0.37 0.21 0.26
42 URML / URMM 138 0.21 0.09 0.22 0.28 0.19
45 W1 / W2 58 0.40 0.14 0.19 0.17 0.10
51 Timber frame with stucco infill
176 0.38 0.16 0.34 0.07 0.05
The vulnerability and fragility data derived from the survey activity yield several results that are of particular importance. Result 1. The data indicate that there has been no significant improvement in reinforced concrete frame building performance with construction date. More recently constructed buildings performed no better than older buildings of the same type. This can be observed in the data in Figure 6.5 which presents fragilities for 1 to 3 storeys (C1L) and 4 to 7 storeys (C1M) reinforced concrete frame buildings in three age brackets (pre 1981, 1981 to 2002 and later than 2003). The age brackets chosen relate to the introduction of improved building design standards in Indonesia. It would be expected that the more modern buildings would perform better if they had been designed and built in accordance with the more rigorous, modern standards. It is of interest that the 4 to 7 storey buildings displayed an increase in vulnerability with age and were shown to be more vulnerable as a class than the 1 to 3 storey equivalent buildings. It was noted, however, that a significantly smaller number of buildings in the taller height category were surveyed that may have introduced sample size issues.
45
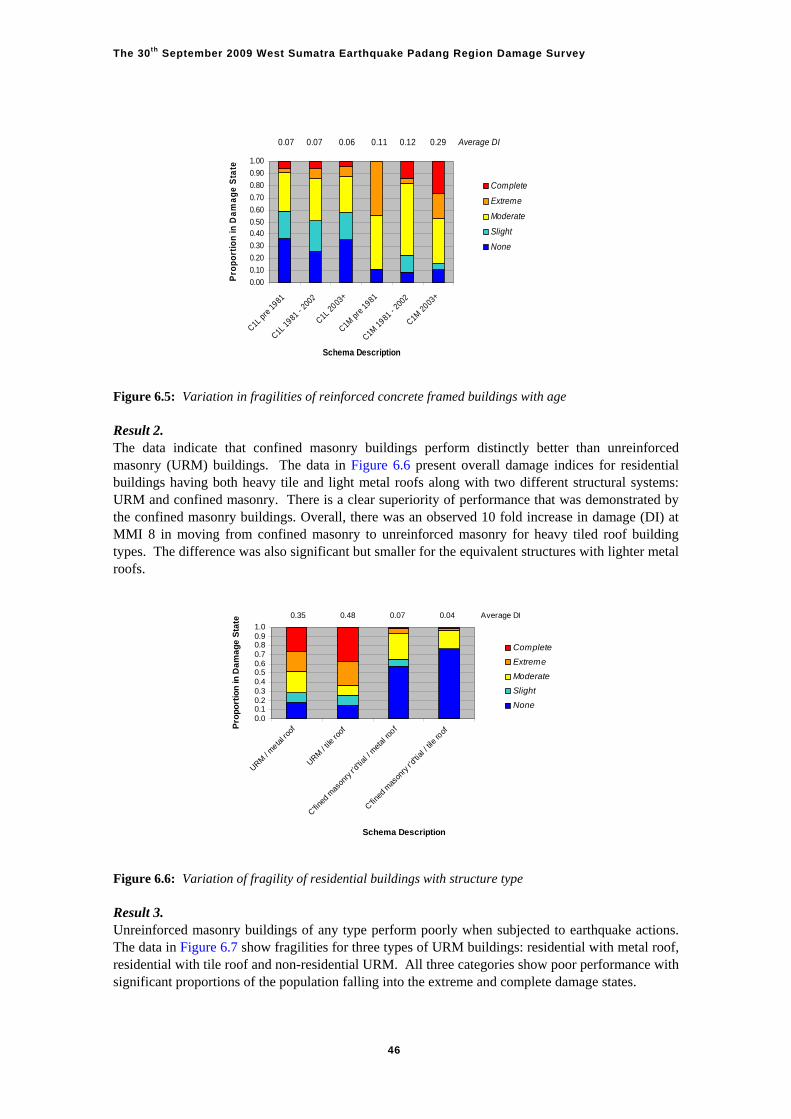
The 30th September 2009 West Sumatra Earthquake Padang Region Damage Survey
0.00
0.10
0.20
0.30
0.400.50
0.60
0.70
0.80
0.90
1.00
C1L pre
1981
C1L 19
81 -
2002
C1L 20
03+
C1M pr
e 1981
C1M 19
81 -
2002
C1M 20
03+
Schema Description
Pro
po
rtio
n in
Da
ma
ge
Sta
te
Figure 6.5: Variation in fragilities of reinforced concrete framed buildings with age Result 2. The data indicate that confined masonry buildings perform distinctly better than unreinforced masonry (URM) buildings. The data in Figure 6.6 present overall damage indices for residential buildings having both heavy tile and light metal roofs along with two different structural systems: URM and confined masonry. There is a clear superiority of performance that was demonstrated by the confined masonry buildings. Overall, there was an observed 10 fold increase in damage (DI) at MMI 8 in moving from confined masonry to unreinforced masonry for heavy tiled roof building types. The difference was also significant but smaller for the equivalent structures with lighter metal roofs.
Figure 6.6: Variation of fragility of residential buildings with structure type Result 3. Unreinforced masonry buildings of any type perform poorly when subjected to earthquake actions. The data in Figure 6.7 show fragilities for three types of URM buildings: residential with metal roof, residential with tile roof and non-residential URM. All three categories show poor performance with significant proportions of the population falling into the extreme and complete damage states.
Complete
Extreme
Moderate
Slight
None
age DI 0.07 0.07 0.06 0.11 0.12 0.29 Aver
0.00.10.20.30.40.50.60.70.80.91.0
URM /
meta
l roo
f
URM /
tile ro
of
C'fined
mas
onry
r'd't
ial /
met
al ro
of
C'fined
mas
onry
r'd't
ial /
tile
roof
Schema Description
Pro
po
rtio
n in
Da
ma
ge
Sta
te
Complete
Extreme
Moderate
Slight
None
0.35 0.48 0.07 0.04 Average DI
46
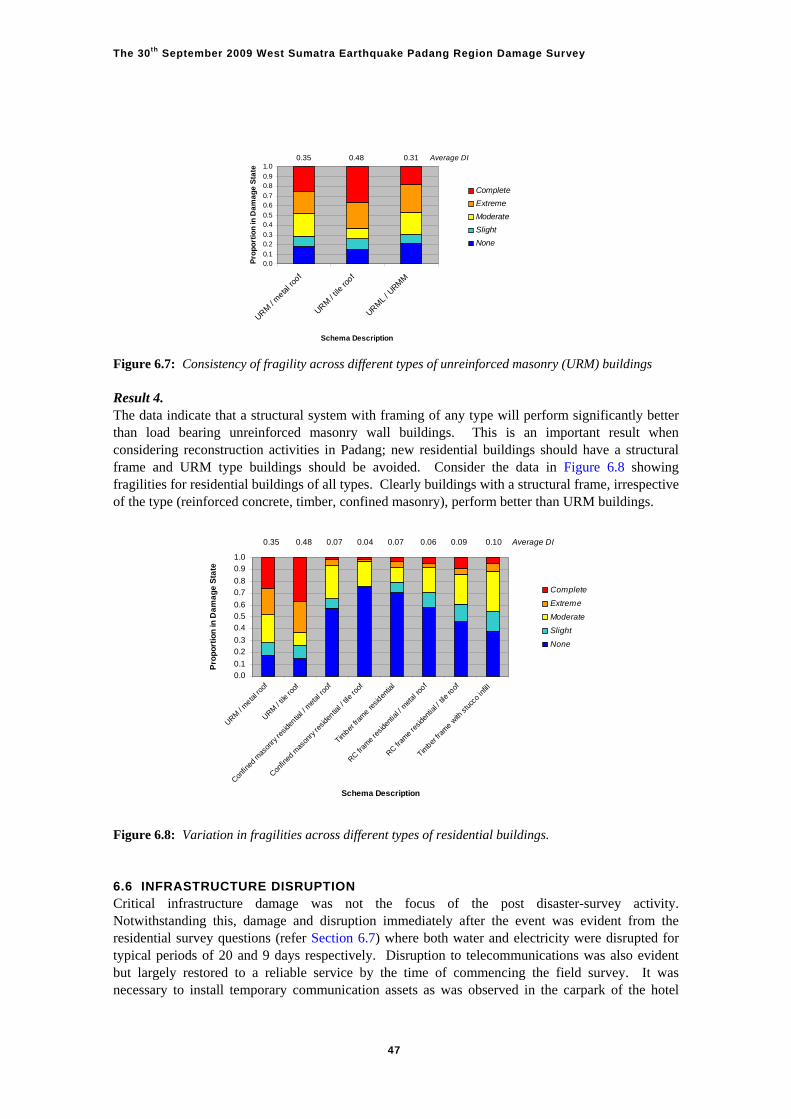
The 30th September 2009 West Sumatra Earthquake Padang Region Damage Survey
0.00.1
0.20.3
0.40.5
0.60.7
0.80.9
1.0
URM / m
etal ro
of
URM / t
ile ro
of
URML /
URM
M
Schema Description
Pro
po
rtio
n in
Da
ma
ge
Sta
te
Complete
Extreme
Moderate
Slight
None
0.35 0.48 0.31 Average DI
Figure 6.7: Consistency of fragility across different types of unreinforced masonry (URM) buildings Result 4. The data indicate that a structural system with framing of any type will perform significantly better than load bearing unreinforced masonry wall buildings. This is an important result when considering reconstruction activities in Padang; new residential buildings should have a structural frame and URM type buildings should be avoided. Consider the data in Figure 6.8 showing fragilities for residential buildings of all types. Clearly buildings with a structural frame, irrespective of the type (reinforced concrete, timber, confined masonry), perform better than URM buildings.
0.0
0.1
0.2
0.3
0.4
0.5
0.6
0.7
0.8
0.9
1.0
URM /
meta
l roo
f
URM /
tile ro
of
Confin
ed m
ason
ry re
siden
tial /
met
al ro
of
Confin
ed m
ason
ry re
siden
tial /
tile
roof
Timber
fram
e resid
entia
l
RC fram
e re
siden
tial /
met
al ro
of
RC fram
e re
siden
tial /
tile
roof
Timber
fram
e with
stu
cco
infill
Schema Description
Pro
po
rtio
n in
Da
ma
ge
Sta
te
Complete
Extreme
Moderate
Slight
None
0.35 0.48 0.07 0.04 0.07 0.06 0.09 0.10 Average DI
Figure 6.8: Variation in fragilities across different types of residential buildings. 6.6 INFRASTRUCTURE DISRUPTION Critical infrastructure damage was not the focus of the post disaster-survey activity. Notwithstanding this, damage and disruption immediately after the event was evident from the residential survey questions (refer Section 6.7) where both water and electricity were disrupted for typical periods of 20 and 9 days respectively. Disruption to telecommunications was also evident but largely restored to a reliable service by the time of commencing the field survey. It was necessary to install temporary communication assets as was observed in the carpark of the hotel
47
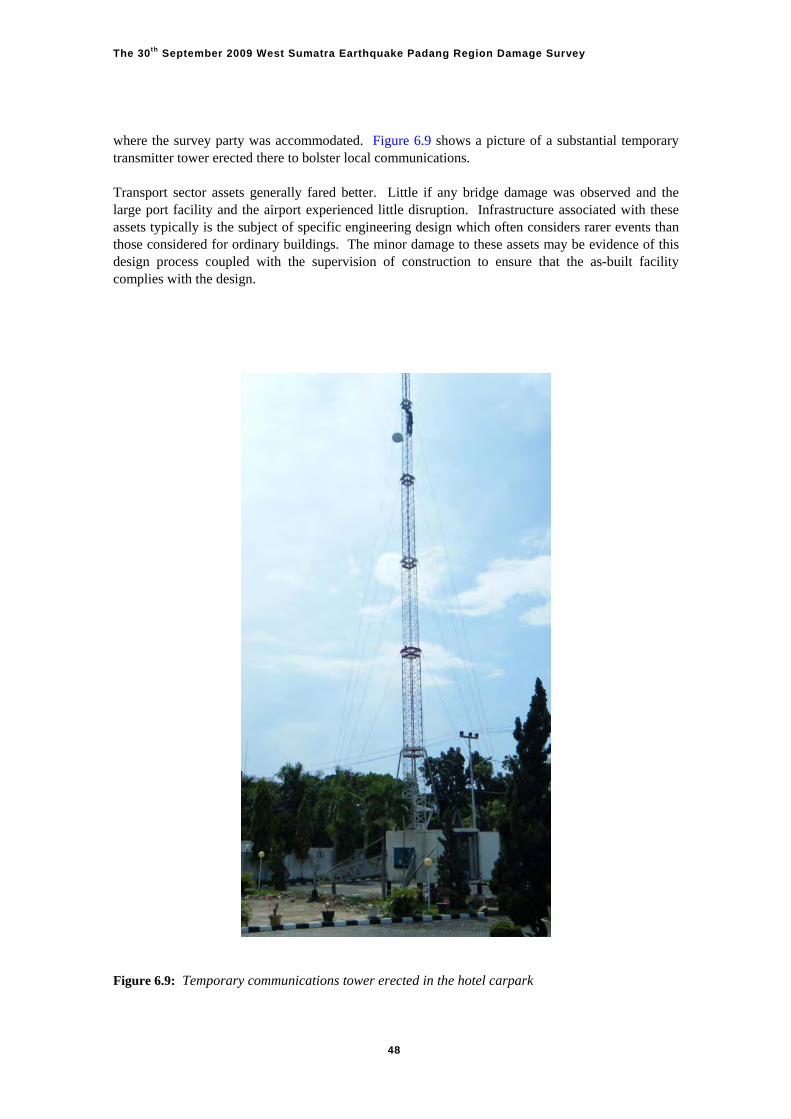
The 30th September 2009 West Sumatra Earthquake Padang Region Damage Survey
where the survey party was accommodated. Figure 6.9 shows a picture of a substantial temporary transmitter tower erected there to bolster local communications. Transport sector assets generally fared better. Little if any bridge damage was observed and the large port facility and the airport experienced little disruption. Infrastructure associated with these assets typically is the subject of specific engineering design which often considers rarer events than those considered for ordinary buildings. The minor damage to these assets may be evidence of this design process coupled with the supervision of construction to ensure that the as-built facility complies with the design.
Figure 6.9: Temporary communications tower erected in the hotel carpark
48
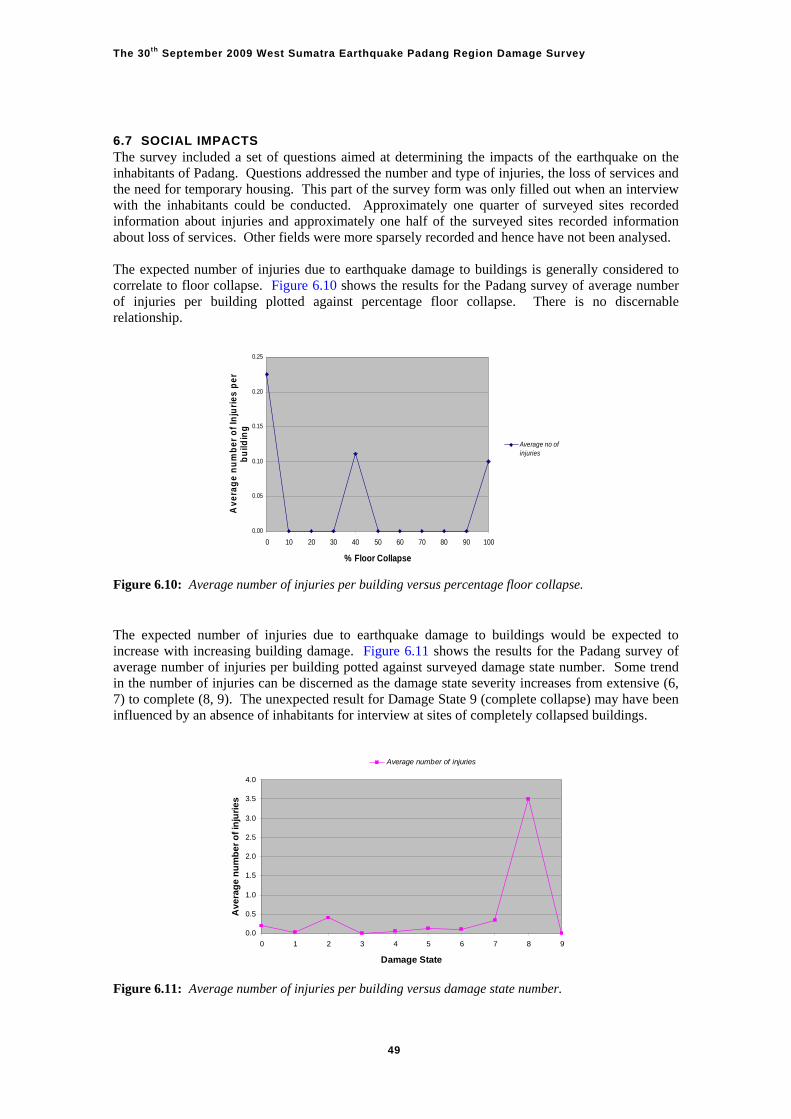
The 30th September 2009 West Sumatra Earthquake Padang Region Damage Survey
6.7 SOCIAL IMPACTS The survey included a set of questions aimed at determining the impacts of the earthquake on the inhabitants of Padang. Questions addressed the number and type of injuries, the loss of services and the need for temporary housing. This part of the survey form was only filled out when an interview with the inhabitants could be conducted. Approximately one quarter of surveyed sites recorded information about injuries and approximately one half of the surveyed sites recorded information about loss of services. Other fields were more sparsely recorded and hence have not been analysed. The expected number of injuries due to earthquake damage to buildings is generally considered to correlate to floor collapse. Figure 6.10 shows the results for the Padang survey of average number of injuries per building plotted against percentage floor collapse. There is no discernable relationship.
0.00
0.05
0.10
0.15
0.20
0.25
0 10 20 30 40 50 60 70 80 90 100
% Floor Collapse
Av
era
ge
nu
mb
er
of
Inju
rie
s p
er
bu
ildin
g
Average no ofinjuries
Figure 6.10: Average number of injuries per building versus percentage floor collapse. The expected number of injuries due to earthquake damage to buildings would be expected to increase with increasing building damage. Figure 6.11 shows the results for the Padang survey of average number of injuries per building potted against surveyed damage state number. Some trend in the number of injuries can be discerned as the damage state severity increases from extensive (6, 7) to complete (8, 9). The unexpected result for Damage State 9 (complete collapse) may have been influenced by an absence of inhabitants for interview at sites of completely collapsed buildings. Average number of injuries
0.0
0.5
1.0
1.5
2.0
2.5
3.0
3.5
4.0
0 1 2 3 4 5 6 7 8 9
Damage State
Av
era
ge
nu
mb
er
of
inju
rie
s
Figure 6.11: Average number of injuries per building versus damage state number.
49
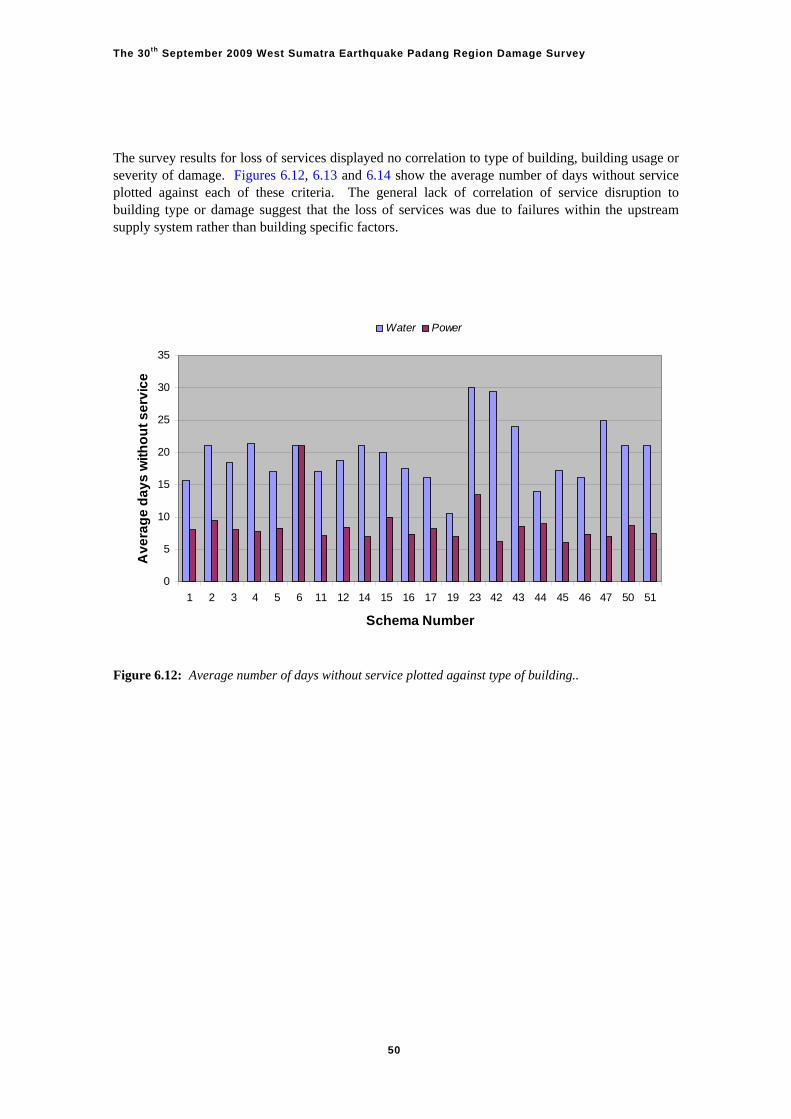
The 30th September 2009 West Sumatra Earthquake Padang Region Damage Survey
The survey results for loss of services displayed no correlation to type of building, building usage or severity of damage. Figures 6.12, 6.13 and 6.14 show the average number of days without service plotted against each of these criteria. The general lack of correlation of service disruption to building type or damage suggest that the loss of services was due to failures within the upstream supply system rather than building specific factors.
Water Power
0
5
10
15
20
25
30
35
1 2 3 4 5 6 11 12 14 15 16 17 19 23 42 43 44 45 46 47 50 51
Schema Number
Av
era
ge
da
ys
wit
ho
ut
se
rvic
e
Figure 6.12: Average number of days without service plotted against type of building..
50
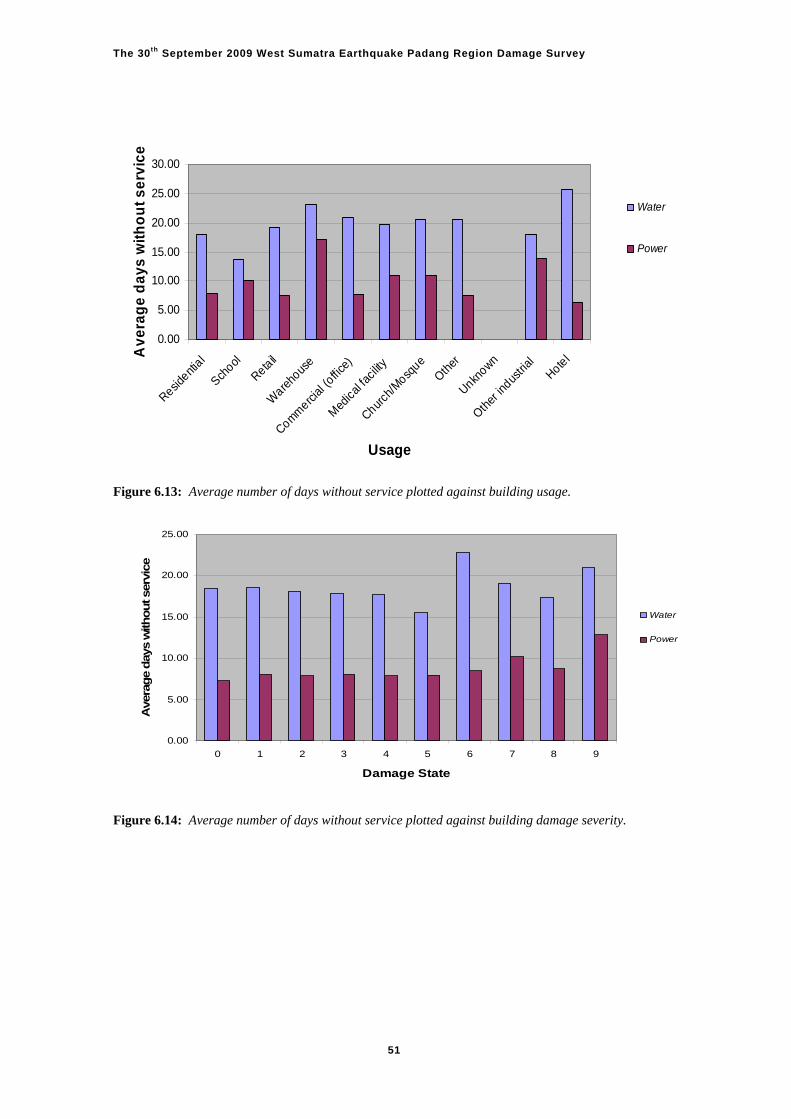
The 30th September 2009 West Sumatra Earthquake Padang Region Damage Survey
0.00
5.00
10.00
15.00
20.00
25.00
30.00
Residenti
al
School
Retail
Ware
hous
e
Commerci
al (o
ffice)
Med
ical fa
cility
Church
/Mosq
ueOth
er
Unknown
Other
indus
trial
Hotel
Usage
Av
era
ge
da
ys
wit
ho
ut
se
rvic
e
Water
Power
Figure 6.13: Average number of days without service plotted against building usage.
0.00
5.00
10.00
15.00
20.00
25.00
0 1 2 3 4 5 6 7 8 9
Damage State
Aver
age d
ays w
ithout ser
vice
Water
Power
Figure 6.14: Average number of days without service plotted against building damage severity.
51
The 30th September 2009 West Sumatra Earthquake Padang Region Damage Survey
7 Padang Earthquake Reconnaissance Workshop 7.1 WORKSHOP ACTIVITY An AIFDR sponsored workshop was held at Geoscience Australia on 28 and 29 April, 2010 which brought together many of the participants of the Padang Earthquake Reconnaissance Survey Team. The workshop reviewed Indonesian seismicity, the development of building regulations, historical building performance, the survey methodology, the survey outcomes, and the results of post survey analyses. It further considered the next steps for utilising the information to refine vulnerability knowledge and for disseminating the lessons learnt. The workshop report is presented in Appendix A4. 7.2 WORKSHOP OUTCOMES The workshop was structured along several themes with key presentations made to “seed” workshop discussion. The outcomes from the presentations and the ensuing workshop discussion are presented under thematic headings below. 7.2.1 Indonesian Seismicity and Regulation Development The following key points were noted on the seismicity of Indonesia and Padang and on the development of seismic design regulations:- Padang lies in the second most severe region defined in the current earthquake loadings code. The Padang earthquake was close to a design earthquake event for Padang but was short of the
latest assessment of seismic hazard which is more than 20% higher. Limit state design with capacity design approaches came into effect in the 1983 standard. The
later 2002 code significantly increased the seismic hazard for design through changes to both design return period and improved seismic hazard assessment. However, this was offset by concurrent changes to response modification factors (available ductility and reserve strength) that, together, resulted in little change to design loadings for engineered buildings.
Historical earthquakes have shown similar deficiencies to those observed in Padang which include; poor performance of unreinforced masonry, poor structural configuration leading to soft storey, short column and torsional response, poor response due to a lack of separation of non-structural elements; inadequate building separation leading to pounding; poor reinforcement detailing and poor material quality.
7.2.2 Padang Earthquake and Survey Activity The effectiveness of the survey activity was reviewed and the following observations made:- The two-stream approach with detailed survey work alongside population based survey proved
very effective. The benefit of a third logistical support team was very clear. The need for agreed survey protocols prior to deployment was noted. At the commencement of
the field work time was required with the survey participants from various organisations to ensure alignment of processes. This time could have been otherwise spent on productive survey work
There were many refinements identified to processes for future survey work. These are listed in detail in Appendix A4, but, in particular, the benefits of local interpreters for each team and access to adequate field transport were highlighted. Furthermore, several field safety issues were raised associated with the entering of damaged buildings and knowing the location of each surveyor in a badly damaged structure. Finally, the IT savvy nature of local survey personnel was noted pointing to the option of hand-held computers as a substitute for the paper templates used.
52
The 30th September 2009 West Sumatra Earthquake Padang Region Damage Survey
7.2.3 MASW and PGA Estimate The multi-channel analysis of surface waves (MASW) field survey and the utilisation of the outcomes in a simulation of the earthquake event provided valuable estimates of the local peak ground motions. This represented a significant improvement on the quantification of the effect of regolith amplification beyond the surface geology/liquefaction approach that was used prior to receipt of the outcomes of this work. It pointed to the need for future work to reassess felt intensities and refine vulnerability models in terms of spectral values of demand. 7.2.4 Post-Survey Analysis The following was noted in the post survey analysis:- Cleaning and validation of the data collected by a large survey group was a major task. More
attention to detail is needed to ensure consistency of capture including more extensive initial training and the incorporation of “data dictionaries” to provide reference information in the field to facilitate the correct selection of survey fields.
The MMI attribution was particularly problematic and could be aided by better descriptors which should also be written in Indonesian for the benefit of local surveyors.
The association of reparation cost with damage state needs to be improved. The cleaning and validation of hazard and damage data yielded a suite of very valuable information on effective structural forms and the present efficacy of building regulations to influence as-built structural vulnerability.
The number of respondents to the resident interviews was very high (greater than 50%) and yielded useful information on the social impacts of the event. Correlation of the social impacts with damage outcomes to buildings was not typically observed.
7.2.5 Building Stock Categorisation Post-survey analysis of data and workshop discussion indicated that the division between residential and non-residential was not descriptive of the observed trend in earthquake damage. A better classification was found to be by the standard of design and storey height irrespective of usage. Additionally, a finer division of the URM category to reflect variations in construction that were found to influence damage outcomes was also considered an appropriate schema refinement. Through an out-of-session process a revised schema was developed which is presented in Tables 7.1 and 7.2. It was proposed that these be used for future surveys but be subject to modification as identified through future survey activity in Indonesia.
53
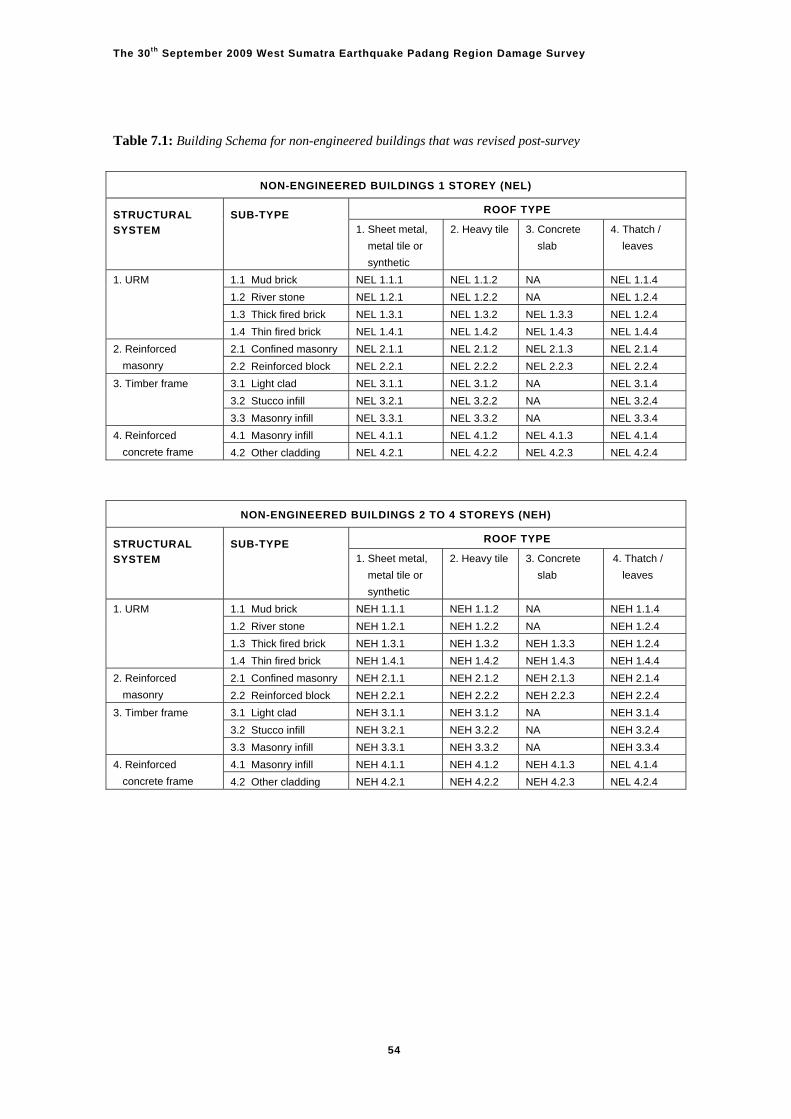
The 30th September 2009 West Sumatra Earthquake Padang Region Damage Survey
Table 7.1: Building Schema for non-engineered buildings that was revised post-survey
NON-ENGINEERED BUILDINGS 1 STOREY (NEL)
ROOF TYPE STRUCTURAL
SYSTEM
SUB-TYPE 1. Sheet metal,
metal tile or
synthetic
2. Heavy tile 3. Concrete
slab
4. Thatch /
leaves
1.1 Mud brick NEL 1.1.1 NEL 1.1.2 NA NEL 1.1.4
1.2 River stone NEL 1.2.1 NEL 1.2.2 NA NEL 1.2.4
1.3 Thick fired brick NEL 1.3.1 NEL 1.3.2 NEL 1.3.3 NEL 1.2.4
1. URM
1.4 Thin fired brick NEL 1.4.1 NEL 1.4.2 NEL 1.4.3 NEL 1.4.4
2.1 Confined masonry NEL 2.1.1 NEL 2.1.2 NEL 2.1.3 NEL 2.1.4 2. Reinforced
masonry 2.2 Reinforced block NEL 2.2.1 NEL 2.2.2 NEL 2.2.3 NEL 2.2.4
3.1 Light clad NEL 3.1.1 NEL 3.1.2 NA NEL 3.1.4
3.2 Stucco infill NEL 3.2.1 NEL 3.2.2 NA NEL 3.2.4
3. Timber frame
3.3 Masonry infill NEL 3.3.1 NEL 3.3.2 NA NEL 3.3.4
4.1 Masonry infill NEL 4.1.1 NEL 4.1.2 NEL 4.1.3 NEL 4.1.4 4. Reinforced
concrete frame 4.2 Other cladding NEL 4.2.1 NEL 4.2.2 NEL 4.2.3 NEL 4.2.4
NON-ENGINEERED BUILDINGS 2 TO 4 STOREYS (NEH)
ROOF TYPE STRUCTURAL
SYSTEM
SUB-TYPE 1. Sheet metal,
metal tile or
synthetic
2. Heavy tile 3. Concrete
slab
4. Thatch /
leaves
1.1 Mud brick NEH 1.1.1 NEH 1.1.2 NA NEH 1.1.4
1.2 River stone NEH 1.2.1 NEH 1.2.2 NA NEH 1.2.4
1.3 Thick fired brick NEH 1.3.1 NEH 1.3.2 NEH 1.3.3 NEH 1.2.4
1. URM
1.4 Thin fired brick NEH 1.4.1 NEH 1.4.2 NEH 1.4.3 NEH 1.4.4
2.1 Confined masonry NEH 2.1.1 NEH 2.1.2 NEH 2.1.3 NEH 2.1.4 2. Reinforced
masonry 2.2 Reinforced block NEH 2.2.1 NEH 2.2.2 NEH 2.2.3 NEH 2.2.4
3.1 Light clad NEH 3.1.1 NEH 3.1.2 NA NEH 3.1.4
3.2 Stucco infill NEH 3.2.1 NEH 3.2.2 NA NEH 3.2.4
3. Timber frame
3.3 Masonry infill NEH 3.3.1 NEH 3.3.2 NA NEH 3.3.4
4.1 Masonry infill NEH 4.1.1 NEH 4.1.2 NEH 4.1.3 NEL 4.1.4 4. Reinforced
concrete frame 4.2 Other cladding NEH 4.2.1 NEH 4.2.2 NEH 4.2.3 NEL 4.2.4
54
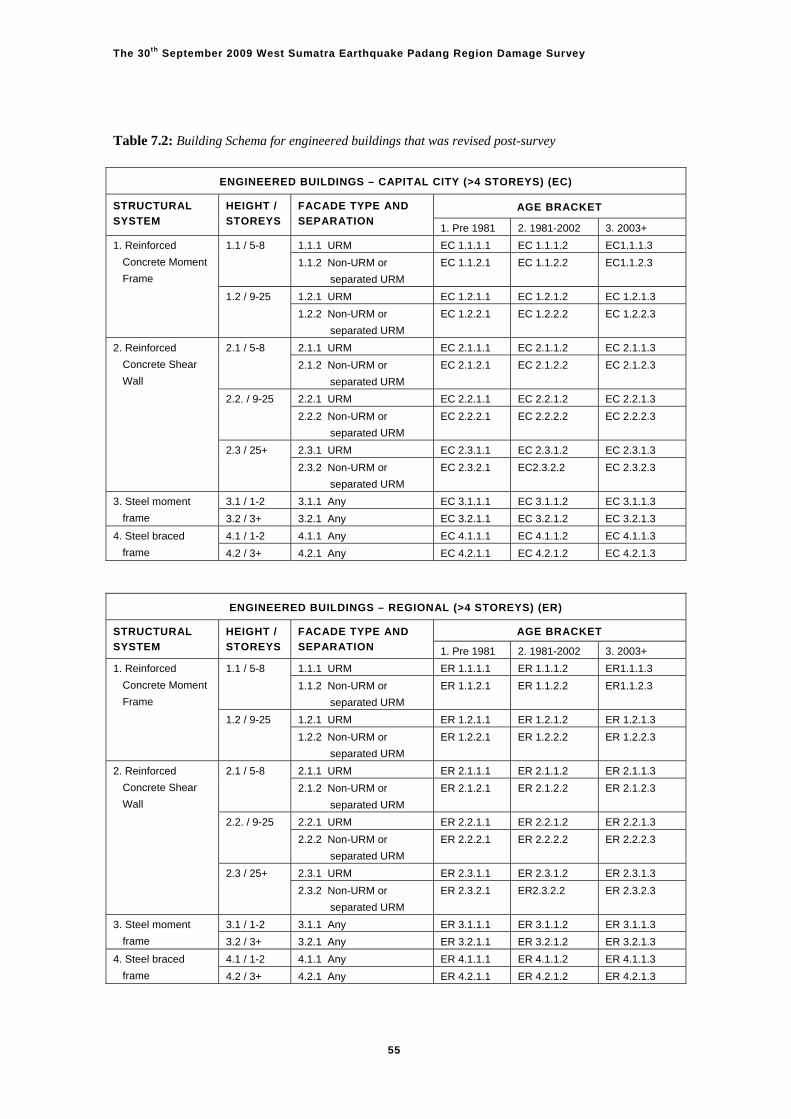
The 30th September 2009 West Sumatra Earthquake Padang Region Damage Survey
Table 7.2: Building Schema for engineered buildings that was revised post-survey
ENGINEERED BUILDINGS – CAPITAL CITY (>4 STOREYS) (EC)
AGE BRACKET STRUCTURAL
SYSTEM
HEIGHT /
STOREYS
FACADE TYPE AND
SEPARATION 1. Pre 1981 2. 1981-2002 3. 2003+
1.1.1 URM EC 1.1.1.1 EC 1.1.1.2 EC1.1.1.3 1.1 / 5-8
1.1.2 Non-URM or
separated URM
EC 1.1.2.1 EC 1.1.2.2 EC1.1.2.3
1.2.1 URM EC 1.2.1.1 EC 1.2.1.2 EC 1.2.1.3
1. Reinforced
Concrete Moment
Frame
1.2 / 9-25
1.2.2 Non-URM or
separated URM
EC 1.2.2.1 EC 1.2.2.2 EC 1.2.2.3
2.1.1 URM EC 2.1.1.1 EC 2.1.1.2 EC 2.1.1.3 2.1 / 5-8
2.1.2 Non-URM or
separated URM
EC 2.1.2.1 EC 2.1.2.2 EC 2.1.2.3
2.2.1 URM EC 2.2.1.1 EC 2.2.1.2 EC 2.2.1.3 2.2. / 9-25
2.2.2 Non-URM or
separated URM
EC 2.2.2.1 EC 2.2.2.2 EC 2.2.2.3
2.3.1 URM EC 2.3.1.1 EC 2.3.1.2 EC 2.3.1.3
2. Reinforced
Concrete Shear
Wall
2.3 / 25+
2.3.2 Non-URM or
separated URM
EC 2.3.2.1 EC2.3.2.2 EC 2.3.2.3
3.1 / 1-2 3.1.1 Any EC 3.1.1.1 EC 3.1.1.2 EC 3.1.1.3 3. Steel moment
frame 3.2 / 3+ 3.2.1 Any EC 3.2.1.1 EC 3.2.1.2 EC 3.2.1.3
4.1 / 1-2 4.1.1 Any EC 4.1.1.1 EC 4.1.1.2 EC 4.1.1.3 4. Steel braced
frame 4.2 / 3+ 4.2.1 Any EC 4.2.1.1 EC 4.2.1.2 EC 4.2.1.3
ENGINEERED BUILDINGS – REGIONAL (>4 STOREYS) (ER)
AGE BRACKET STRUCTURAL
SYSTEM
HEIGHT /
STOREYS
FACADE TYPE AND
SEPARATION 1. Pre 1981 2. 1981-2002 3. 2003+
1.1.1 URM ER 1.1.1.1 ER 1.1.1.2 ER1.1.1.3 1.1 / 5-8
1.1.2 Non-URM or
separated URM
ER 1.1.2.1 ER 1.1.2.2 ER1.1.2.3
1.2.1 URM ER 1.2.1.1 ER 1.2.1.2 ER 1.2.1.3
1. Reinforced
Concrete Moment
Frame
1.2 / 9-25
1.2.2 Non-URM or
separated URM
ER 1.2.2.1 ER 1.2.2.2 ER 1.2.2.3
2.1.1 URM ER 2.1.1.1 ER 2.1.1.2 ER 2.1.1.3 2.1 / 5-8
2.1.2 Non-URM or
separated URM
ER 2.1.2.1 ER 2.1.2.2 ER 2.1.2.3
2.2.1 URM ER 2.2.1.1 ER 2.2.1.2 ER 2.2.1.3 2.2. / 9-25
2.2.2 Non-URM or
separated URM
ER 2.2.2.1 ER 2.2.2.2 ER 2.2.2.3
2.3.1 URM ER 2.3.1.1 ER 2.3.1.2 ER 2.3.1.3
2. Reinforced
Concrete Shear
Wall
2.3 / 25+
2.3.2 Non-URM or
separated URM
ER 2.3.2.1 ER2.3.2.2 ER 2.3.2.3
3.1 / 1-2 3.1.1 Any ER 3.1.1.1 ER 3.1.1.2 ER 3.1.1.3 3. Steel moment
frame 3.2 / 3+ 3.2.1 Any ER 3.2.1.1 ER 3.2.1.2 ER 3.2.1.3
4.1 / 1-2 4.1.1 Any ER 4.1.1.1 ER 4.1.1.2 ER 4.1.1.3 4. Steel braced
frame 4.2 / 3+ 4.2.1 Any ER 4.2.1.1 ER 4.2.1.2 ER 4.2.1.3
55
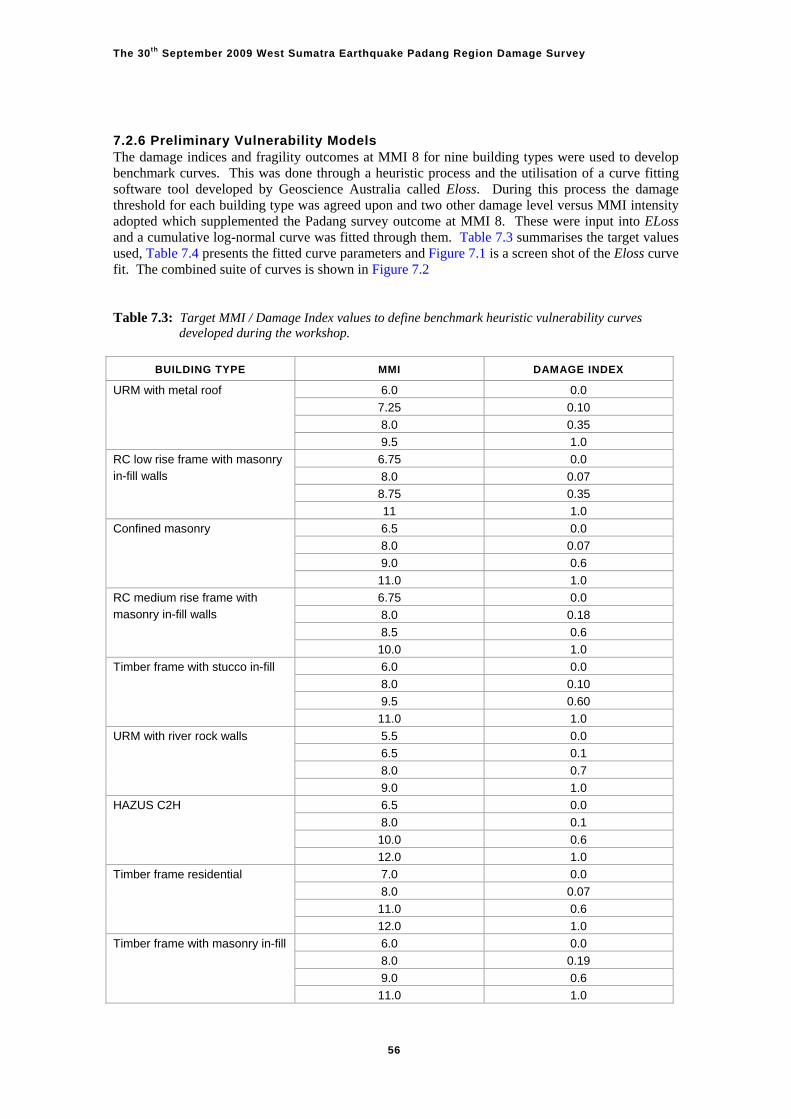
The 30th September 2009 West Sumatra Earthquake Padang Region Damage Survey
7.2.6 Preliminary Vulnerability Models The damage indices and fragility outcomes at MMI 8 for nine building types were used to develop benchmark curves. This was done through a heuristic process and the utilisation of a curve fitting software tool developed by Geoscience Australia called Eloss. During this process the damage threshold for each building type was agreed upon and two other damage level versus MMI intensity adopted which supplemented the Padang survey outcome at MMI 8. These were input into ELoss and a cumulative log-normal curve was fitted through them. Table 7.3 summarises the target values used, Table 7.4 presents the fitted curve parameters and Figure 7.1 is a screen shot of the Eloss curve fit. The combined suite of curves is shown in Figure 7.2 Table 7.3: Target MMI / Damage Index values to define benchmark heuristic vulnerability curves
developed during the workshop.
BUILDING TYPE MMI DAMAGE INDEX
6.0 0.0
7.25 0.10
8.0 0.35
URM with metal roof
9.5 1.0
6.75 0.0
8.0 0.07
8.75 0.35
RC low rise frame with masonry in-fill walls
11 1.0
6.5 0.0
8.0 0.07
9.0 0.6
Confined masonry
11.0 1.0
6.75 0.0
8.0 0.18
8.5 0.6
RC medium rise frame with masonry in-fill walls
10.0 1.0
6.0 0.0
8.0 0.10
9.5 0.60
Timber frame with stucco in-fill
11.0 1.0
5.5 0.0
6.5 0.1
8.0 0.7
URM with river rock walls
9.0 1.0
6.5 0.0
8.0 0.1
10.0 0.6
HAZUS C2H
12.0 1.0
7.0 0.0
8.0 0.07
11.0 0.6
Timber frame residential
12.0 1.0
6.0 0.0
8.0 0.19
9.0 0.6
Timber frame with masonry in-fill
11.0 1.0
56
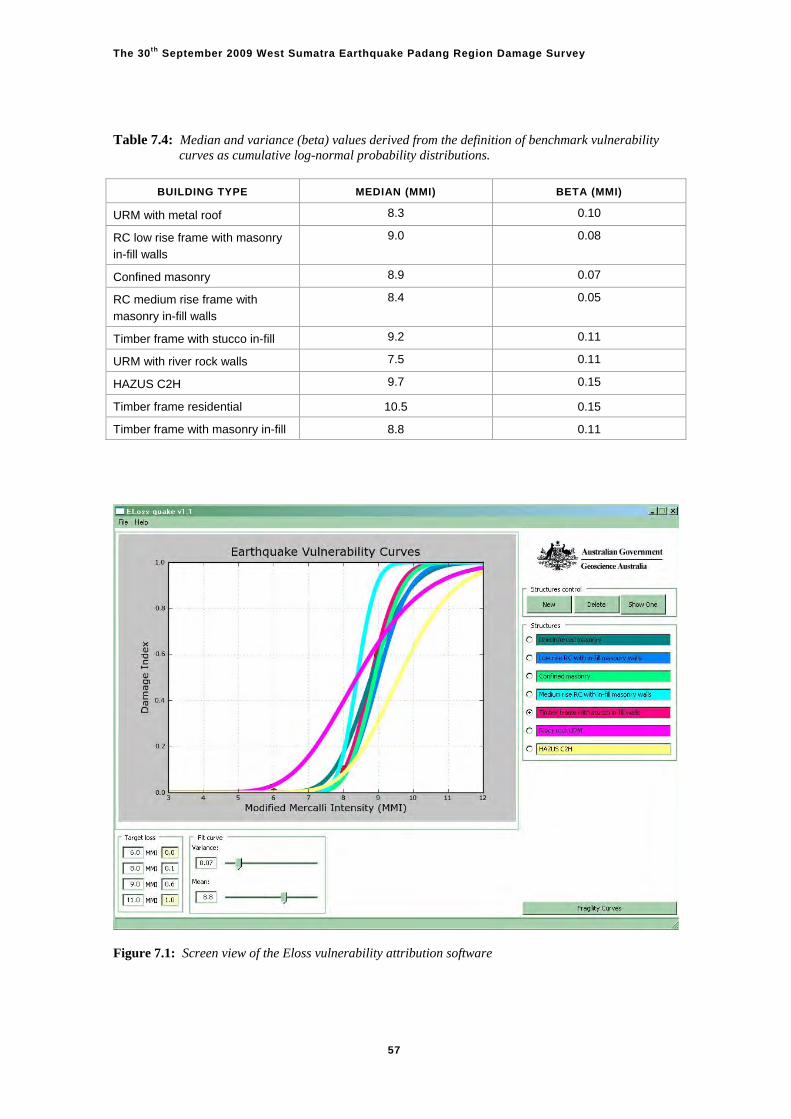
The 30th September 2009 West Sumatra Earthquake Padang Region Damage Survey
Table 7.4: Median and variance (beta) values derived from the definition of benchmark vulnerability curves as cumulative log-normal probability distributions.
BUILDING TYPE MEDIAN (MMI) BETA (MMI)
URM with metal roof 8.3 0.10
RC low rise frame with masonry in-fill walls
9.0 0.08
Confined masonry 8.9 0.07
RC medium rise frame with masonry in-fill walls
8.4 0.05
Timber frame with stucco in-fill 9.2 0.11
URM with river rock walls 7.5 0.11
HAZUS C2H 9.7 0.15
Timber frame residential 10.5 0.15
Timber frame with masonry in-fill 8.8 0.11
Figure 7.1: Screen view of the Eloss vulnerability attribution software
57
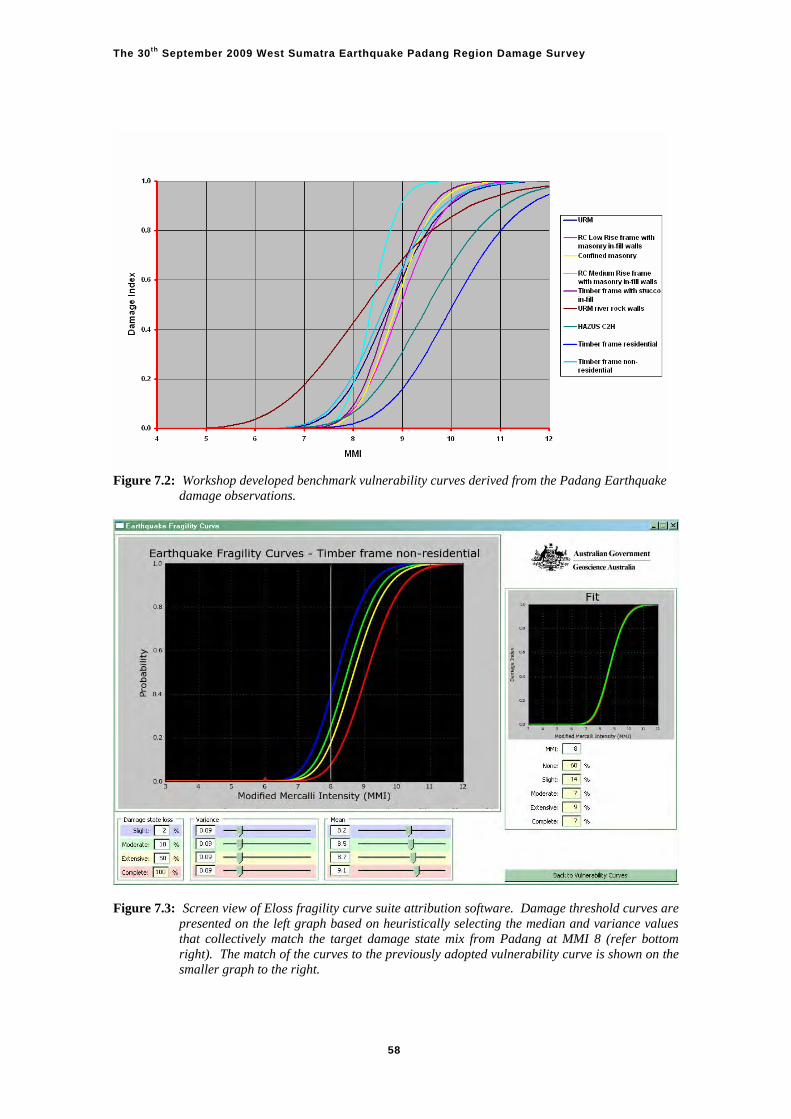
The 30th September 2009 West Sumatra Earthquake Padang Region Damage Survey
Figure 7.2: Workshop developed benchmark vulnerability curves derived from the Padang Earthquake
damage observations.
Figure 7.3: Screen view of Eloss fragility curve suite attribution software. Damage threshold curves are
presented on the left graph based on heuristically selecting the median and variance values that collectively match the target damage state mix from Padang at MMI 8 (refer bottom right). The match of the curves to the previously adopted vulnerability curve is shown on the smaller graph to the right.
58
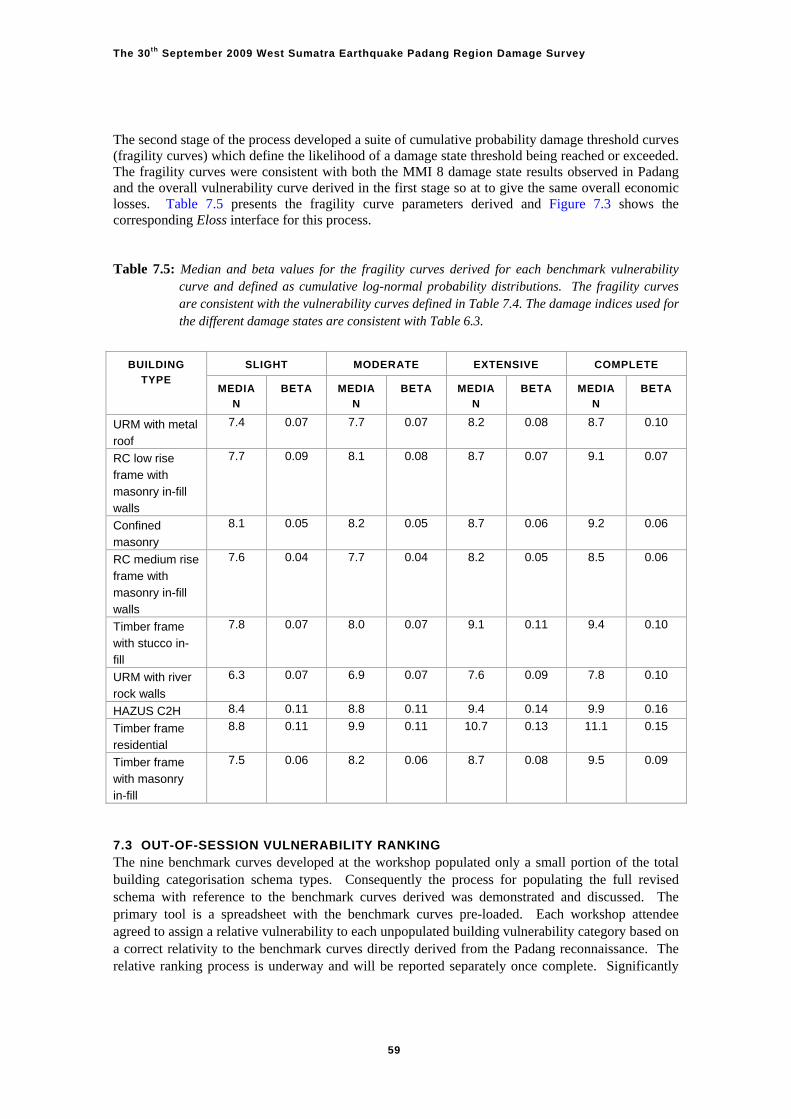
The 30th September 2009 West Sumatra Earthquake Padang Region Damage Survey
The second stage of the process developed a suite of cumulative probability damage threshold curves (fragility curves) which define the likelihood of a damage state threshold being reached or exceeded. The fragility curves were consistent with both the MMI 8 damage state results observed in Padang and the overall vulnerability curve derived in the first stage so at to give the same overall economic losses. Table 7.5 presents the fragility curve parameters derived and Figure 7.3 shows the corresponding Eloss interface for this process. Table 7.5: Median and beta values for the fragility curves derived for each benchmark vulnerability
curve and defined as cumulative log-normal probability distributions. The fragility curves are consistent with the vulnerability curves defined in Table 7.4. The damage indices used for the different damage states are consistent with Table 6.3.
SLIGHT MODERATE EXTENSIVE COMPLETE BUILDING
TYPE MEDIA
N
BETA MEDIA
N
BETA MEDIA
N
BETA MEDIA
N
BETA
URM with metal roof
7.4 0.07 7.7 0.07 8.2 0.08 8.7 0.10
RC low rise frame with masonry in-fill walls
7.7 0.09 8.1 0.08 8.7 0.07 9.1 0.07
Confined masonry
8.1 0.05 8.2 0.05 8.7 0.06 9.2 0.06
RC medium rise frame with masonry in-fill walls
7.6 0.04 7.7 0.04 8.2 0.05 8.5 0.06
Timber frame with stucco in-fill
7.8 0.07 8.0 0.07 9.1 0.11 9.4 0.10
URM with river rock walls
6.3 0.07 6.9 0.07 7.6 0.09 7.8 0.10
HAZUS C2H 8.4 0.11 8.8 0.11 9.4 0.14 9.9 0.16
Timber frame residential
8.8 0.11 9.9 0.11 10.7 0.13 11.1 0.15
Timber frame with masonry in-fill
7.5 0.06 8.2 0.06 8.7 0.08 9.5 0.09
7.3 OUT-OF-SESSION VULNERABILITY RANKING The nine benchmark curves developed at the workshop populated only a small portion of the total building categorisation schema types. Consequently the process for populating the full revised schema with reference to the benchmark curves derived was demonstrated and discussed. The primary tool is a spreadsheet with the benchmark curves pre-loaded. Each workshop attendee agreed to assign a relative vulnerability to each unpopulated building vulnerability category based on a correct relativity to the benchmark curves directly derived from the Padang reconnaissance. The relative ranking process is underway and will be reported separately once complete. Significantly
59
The 30th September 2009 West Sumatra Earthquake Padang Region Damage Survey
the process will enable an automated update of the national suite of vulnerability curves with improvements to the benchmark curves. 7.4 WORKSHOP RECOMMENDATIONS The workshop made the following recommendations:-
That the AIFDR facilitate a workshop to be convened in Indonesia to communicate the results of the Padang reconnaissance to the Indonesian engineering community;
That the AIFDR facilitate a workshop be held in Indonesia to train Indonesian engineers in post-earthquake survey techniques. The scarcity of trained staff was perceived as an impediment to efficient and productive future surveys;
It appears that there is a scarcity of earthquake resistant design expertise within the Indonesian engineering profession. For example, it is understood that earthquake design is only taught as an elective subject that many students do not take. This could be addressed by AIFDR sponsoring the promotion of earthquake engineering in schools of engineering and through their sponsorship of post-graduate courses in earthquake design;
That AIFDR consider sponsoring research covering the suggested topics noted under Earthquake Vulnerability Research Opportunities; and,
The ‘Build Back Better’ campaign must address the widespread construction deficiencies noted in the World Bank report.
60
The 30th September 2009 West Sumatra Earthquake Padang Region Damage Survey
8 Survey Findings 8.1 DETAILED SURVEY OF SCHOOLS AND MEDICAL FACILITIES The detailed survey activity resulted in a number of observations, findings and recommendations. Some were conveyed in the DALA reporting (ref. 6.1) and later expanded on in a separate report to the AIFDR contained in Appendix A2. The findings reported are summarised as follows. 8.1.1 Observations and findings Observed damage included collapsed buildings, many close to collapse and a larger number of buildings damaged but repairable. The building types that were inspected in large numbers included concrete frame with infill brick walls, load bearing brick with confining concrete columns and beams (confined masonry type), and timber framed buildings with infill masonry below the window sills. The survey team classed the weaknesses of the building stock as resulting from the following causation groupings:
Quality of Materials (e.g. soft bricks, mortar substituted for concrete, aggregates that were rounded and too large, low cement content in concrete)
Poor Overall Structural System Layout (e.g. ground floor of “soft storey” type, lack of shear walls, short columns above masonry infill)
Lack of Building Controls (e.g. large buildings built in areas prone to liquefaction, lack of compliance to design codes, lack of inspection/supervision)
Poor Detailing of Structures (e.g. poor connections between elements, short 90 degree tails in stirrups, gaps not provided between portions of buildings resulting in “pounding” of one structure against the other)
It was apparent that the hazard criteria in the Indonesian Building Code may need to be revised for West Sumatra due to the increased hazard posed by a large earthquake in the region. The latest National Seismic Building Code (SNI-03-1726-2002) increased the design seismic hazard (spectral value at T=1.0s) for the West Sumatra area in 2002 from 0.07g to 0.30g. The Indonesian expert members of the team indicated that the current understanding of hazard derived from recent modelling suggests the hazard for Padang might be as high as 0.4-0.5g (for 10% probability of exceedence in 50 years) for a spectral period of 1 sec. The 2002 Code change means that any design work carried out prior to 2002 is likely to have seriously underestimated the actual hazard to which the buildings are subjected. This emphasises the need to establish a seismic strengthening program in conjunction with reconstruction initiatives. The majority of buildings surveyed were single storey unreinforced masonry or with confining small-sized concrete members (confined masonry buildings). The confinement was typically in the form of reinforced concrete members of a standard type cast in place after the masonry walls are constructed. It was clear that most of the collapsed minor buildings involved failure of un-reinforced masonry. While in-plane failures were recorded in many buildings, out-of-plane failures were more numerous and more severe. The housing near Pariaman and Secincin that collapsed was mostly in rural areas and generally of unreinforced load-bearing masonry. The masonry was rendered standard brick or rounded river rocks or stones (approx. 150 mm – 300 mm in size) that were stacked and mortared in place. Many “river stone” walls were observed to have sustained damage with many fallen.
61
The 30th September 2009 West Sumatra Earthquake Padang Region Damage Survey
Where confined masonry was observed to be damaged (including collapse) there was a lack of the following reinforcement detailing:-
adequate reinforcing bars at joints;
anchorage of bars;
leg length of hooks;
spacing/diameter of ties and anchorage of ties.
Where the joints are poorly detailed, the confinement of the masonry walls would be ineffective, leading to poor performance during an earthquake. Plain round, mild steel bar (undeformed) was invariably observed (except in the most recent multistorey concrete structures) which further exacerbated concerns regarding reinforcement anchorage. For the larger concrete structures, the most common failures involved the development of concentrated flexural deformation (plastic hinges) at the tops and bottoms of ground floor columns. Reinforcement in most structures was observed to be plain round bar of mild steel. Only in some newer structures was deformed reinforcement bar observed. Invariably, multi-storey concrete structures had infill walls of unreinforced masonry throughout the building constructed hard up against the concrete structure (no seismic separation gaps). In most structures unreinforced masonry walls appeared to be the only lateral force resisting elements as no reinforced concrete shear walls were evident. Short columns had been created in many structures by the infill masonry not extending to the underside of the beams above and, therefore, not forming an effective shear wall. In some cases the infill unreinforced masonry saved the structure by acting as shear walls and absorbing most of the lateral deformation energy with resulting crushing and diagonal cracking of the infill. Poor material properties were often observed. The bricks used throughout the Padang building industry were of orange/red clay with the majority appearing to be incompletely fired. Typically bricks could be easily broken and the fired clay crumbled with the fingers. In other cases the centre of the bricks appeared un-fired with the centre able to be hollowed with the thumbnail. The hollow concrete blocks observed in a number of the school buildings were approximately 90mm thick and unsuitable for installing reinforcement and the pouring of grout. Finally, concrete quality was poor with rounded aggregate sometimes used, incomplete compaction of concrete evident and strengths so low that reinforcing steel was easily recovered after the earthquake from fallen structures by beating the concrete members by hand with hammers. Enquiries during the survey indicated that site investigations for large buildings are rarely carried out and that the deepest foundations for any building are unlikely to exceed a “standard” 5 m depth caisson. This type of site investigation and foundation design is considered unsuitable for the predominant ground conditions in the city of Padang, and much of the observed earthquake damage to both houses and to larger buildings was exacerbated by differential ground movements associated with liquefaction and lateral spreading. Liquefiable deposits need to be identified and the founding depth will need to be deeper than the zone of liquefaction for larger structures. To “build back better”, not only should the earthquake resistant design of structures and the quality of construction improve, there also should be greatly improved site investigations followed by a appropriate foundation design. 8.1.2 Recommendations To prepare Padang and other communities along the west coast of Sumatra for the expected large magnitude earthquake and tsunami, it is imperative that good engineering is supported by regulatory
62
The 30th September 2009 West Sumatra Earthquake Padang Region Damage Survey
quality assurance processes. The following recommendations are made which are considered fundamental for reducing community risk. 1. Improve the usage and enforcement of existing Building Codes by the following:-
training for all levels of the construction industry (government officials, design engineers, contractors, masons, etc)
preparation of geotechnical investigations prior to design inspection of buildings during construction quality control of building materials the utilisation of a Building Permit scheme to police non-compliance.
2. Prepare new documentation to improve the built environment including:-
preparation of ‘minimum standard’ guidance documents for non-engineered buildings (e.g. confined masonry housing),
new guidelines to ensure that designers of new buildings are cognisant of the tsunami hazard
review of West Sumatra hazard level with hazard maps and new guidelines for the design and construction of post-disaster recovery facilities such as schools and medical facilities.
3. Training of design engineers and contractors in specific engineering practices including:-
design of appropriate foundation systems or foundation treatments for sites underlain by soft soil and liquefiable deposits
detailing reinforcement for seismic actions, especially detailing of stirrups in beams and columns with 135 degree hooks and appropriate leg lengths,
use of shear walls and the provision of continuous structural ties throughout the structure, avoidance of poor building geometry such as the close proximity to adjoining buildings and
short columns. 4.. The implementation of the above recommendations in repair works, re-building as well as new
for future development by a “build back better” campaign. 8.2 POPULATION BASED SURVEY The population based survey consistently captured damage data outcomes for 16 building types well represented in Padang and Pariaman. The data captured permitted a statistically useful analysis of the most represented types which resulted in benchmark vulnerability and fragility functions for nine building types. The consistency of the data enables comparisons between building types. Notably the following observations were made:-
The changes to building regulations in 1983 and 2002 have had little measurable impact on the vulnerability of as-built engineered reinforced concrete buildings.
The confinement of masonry construction has markedly reduced earthquake vulnerability when compared to unreinforced masonry construction
Unreinforced masonry performed poorly for all types.
Framed residential construction (reinforced concrete and timber) resulted in lower vulnerability to earthquake.
Finally, the population based survey activity has highlighted issues with how damage is quantified in economic terms. The level of repair has a direct impact on cost as does the local construction costs.
63

The 30th September 2009 West Sumatra Earthquake Padang Region Damage Survey
While reparation to pre-earthquake standard has been the approach adopted for this research, other repair objectives may be more appropriate in the assessment and reduction of risk.
64
The 30th September 2009 West Sumatra Earthquake Padang Region Damage Survey
9 Recommendations and Future Work The following specific recommendations are made:-
1. Buildings damaged in the 30 September earthquake should be repaired and strengthened to a high standard to be capable of withstanding a future forecast earthquake and tsunami.
2. New buildings intended to provide vertical evacuation from a tsunami should be designed and built to a standard where they will be undamaged after a worst-case future mega-thrust earthquake.
3. Other new buildings should be designed and constructed in accordance with current standards. This particularly relates to the quality of construction materials that were observed to be very poor. Enforcement mechanisms may require review to ensure compliance.
4. New residential construction should utilise cost-effective systems that performed well in the Padang earthquake. In particular, confinement of masonry showed a marked improvement in seismic performance over ordinary unreinforced masonry.
5. Earthquake engineering principles should be promoted with building professionals through industry seminars where the learnings of the Padang earthquake can be shared and the role of the code regulations to preclude premature failure highlighted. The choice of earthquake engineering as an elective also needs to be promoted more strongly so new professionals will enter the industry with a greater awareness of the underpinning principles.
6. Post-disaster surveys in Indonesia should be continued to capture the variability in building vulnerability across the region and country. This should be all-hazards and encompass all the engineering and science contributions required to understand the nature of the events. The process would benefit greatly from deriving an expert consensus of the optimal approaches for each hazard type and the subsequent dissemination of the processes and methodologies to interested participants in Indonesia.
The following work is proposed for the Padang survey data analysis. Specific tasks include:-
1. The completion of the national first order suite of vulnerability curves.
2. The prediction by ITB of a broader range of spectral ground motion values for the event to enable an assessment of MMI levels using values from the constant velocity region of the spectrum. This may lead to a greater differentiation in ground motion severity and additional validation points.
3. The assessment of improved correlation between damage outcomes and other spectral values as a basis for more sophisticated vulnerability functions.
4. The back analysis of other well documented Indonesian earthquake events and post-disaster reconnaissance surveys.
Other future work may be pursuant to the recommendations made in this report but depend upon the approval of the AIFDR.
65
The 30th September 2009 West Sumatra Earthquake Padang Region Damage Survey
10 Summary of Outcomes The Padang Earthquake reconnaissance has represented a significant allocation of resources, both in the direct costs met by the AIFDR and in the time contributed by a large group engineers, academics, scientists, AIFDR staff and engineering students. It also constitutes what is understood to be the largest systematic population based study of an earthquake impact undertaken to date in the South East Asian and Pacific regions. While the investment has been considerable the outcomes have been commensurate with it. The two survey strategies used involved expert detailed study alongside comprehensive population based study. Consistency between the two has furnished both insights on the causes of poor performance as well as statistically meaningful information on the likelihood of the realisation of damage in an earthquake. The survey work, post-survey analysis and workshop engagement have provided an illuminating picture of the evolution of building regulations in Indonesia and tangible evidence on the effectiveness of their implementation in local design and construction. While the current regulations align with best-practice in other highly seismic countries, they are not fully benefiting the communities in the Padang region due to shortfalls in their uptake. The Western Sumatra Earthquake did not exceed the design level event implied in the code for Padang but caused widespread devastation to modern engineered structures and associated loss of life. Many schools and medical facilities also fared badly due to inadequate design and construction. The expert groups were able to identify a number of factors contributing to this outcome which included poor structural configuration, poor detailing of reinforcement, the use of very poor construction materials, inadequate site investigations and unsuitable foundation design for weak and liquefiable soils. The survey has also highlighted some more recently adopted construction practices that have significantly reduced the likelihood of building damage and casualties. Confined masonry construction in particular suffered lower damage levels than the unreinforced masonry equivalent. Promotion of cost-effective construction practices which reduce vulnerability and the development of other structural systems with these attributes is central to reducing earthquake risk. Other traditional forms of construction such as timber framed homes were also shown to have lower vulnerability consistent with experience in other countries. The activity has also resulted in a categorisation of the broad Indonesian building stock nationally and the commencement of a process that will furnish a full national suite of models that define their vulnerability to earthquake ground motion. Padang damage data was directly used in the workshop process to develop nine benchmark models that define both economic loss and the likelihood of physical damage. Further, consensus was reached on the process for ranking other building types in the schema against these benchmark behaviours with the utilisation of other Padang loss data. The process for delivering a national suite of earthquake vulnerability curves for Indonesia is presently underway. Finally, processes for capturing post-disaster information have been reviewed on the basis of the Padang reconnaissance and recommendations made for more effective and informative surveys in the future. The benefits of reaching a regional consensus on methodologies, survey templates and tools to cover a range of severe hazards have been highlighted and recommendations made for how these protocols could be transferred to Indonesian professionals and academics. In summary, the AIFDR response to the West Sumatra earthquake of the 30 September 2009 has furnished an understanding the vulnerability of typical Indonesian buildings to earthquake ground motion, has informed the development of better building codes and their effective implementation,
66

The 30th September 2009 West Sumatra Earthquake Padang Region Damage Survey
has enabled more realistic earthquake risk assessments for national and sub-national disaster risk management, and will locally inform improved contingency planning and earthquake safety education campaigns.
67
The 30th September 2009 West Sumatra Earthquake Padang Region Damage Survey
11 References
Abrahamson, N.A. (1998). “Non-stationary spectral matching program RSPMATCH”, Pacific Gas & Electric, Company Internal Report. AS 1170.4 (2007), “Structural design actions : Part 4: Earthquake actions in Australia”, Standards Australia. Atkinson, G.M. and Kaka, S. I. (2007) “Relationship between Felt Intensity and Instrumental Ground Motion in the Central united States and California”, Bulletin of the Seismological Society of America, Vol 97, No.2, pp. 497-510, April Bardet J.P., Tobita T., (2001), “NERA, A Computer Program for Nonlinear Earthquake Site Response Analyses of layered Soil Deposits”, University of Southern California DPMB (1983), “Peraturan Perencanaan Tahan Gempa Untuk Gedung”, The Indonesian Seismic Code for Building Design, Direktorat Penyelidikan Masalah Bangunan, Bandung, Indonesia EERI (1996) “Post-Earthquake Investigation Field Guide : Learning from Earthquake”, Earthquake Engineering Research Institute, Sept 1996. EERI (2009) “Learning from Earthquakes : The Mw 7.6 Western Sumatra Earthquake of September 30, 2009”, Earthquake Engineering Research Institute, Special Earthquake Report, Dec 2009. FEMA 306 (1998) “Earthquake Evaluation of Damaged Concrete and Masonry Buildings : Basic Procedures Manual”, Applied Technology Council, Redwood City, California FEMA 307 (1998) “Earthquake Evaluation of Damaged Concrete and Masonry Buildings : Technical Resources”, Applied Technology Council, Redwood City, California Giardini, (1999), “The GSHAP Global Seismic Hazard Map”, Annali Di Geofisica, Vol. 42, No.6, pp. 1225 – 1230. Goretti, A. and Di Pasquale, G. (2002) “An Overview of Post-Disaster Damage Assessment in Italy”, EERI Invitational Workshop : An Action Plan to develop Earthquake Damage and Loss Data Protocols, Sept 19th to 20th 2002, Pasadena, California. HAZUS (2003); “Multi-hazard Loss Estimation Methodology : Earthquake Model : HAZUS MH”, National Institute of Building Sciences, Washington D.C. , Federal Emergency Management Agency. IBC (2006), “2006 International Building Code”, International Code Council, Inc., Illinois, USA Natawidjaja, D. H.; K. Sieh, M. Chlieh, J. Galetzka, B. W. Suwargadi, H. Cheng, R. L. Edwards, J.-P. Avouac, and S. N. Ward (2006), "Source parameters of the great Sumatran megathrust earthquakes of 1797 and 1833 inferred from coral microatolls". Journal of Geophysical Research 111. B06403, doi:10.1029/2005JB004025, June 2006 Natawidjaja, D.H., (2002), Ph.D Thesis, California Institute of Technology.
68
The 30th September 2009 West Sumatra Earthquake Padang Region Damage Survey
NZS 1170.5 (2004), “Structural Design Actions Part 5 : Earthquake actions”, Standards New Zealand, Wellington, New Zealand PBI (1971), “Peraturan Beton Bertulang Indonesia”, The Indonesian Reinforced Concrete Code, Department of Publik Work, Bandung, Indonesia Risk Engineering, Inc, (2004), EZ-FRISK, Software for In-depth Seismic Hazard Analysis, Boulder, Colorado, USA. Sengara, IW., Hakam, A., Putra, H.G., Sudinda, T, and Sukamdo, P. (2009), “Seismic Hazard Zoning for West Sumatra and Microzonation of City of Padang”, Geo-Informatics and Zoning for Hazard Mapping (GIZ2009), Kyoto, Japan. Sieh, K., and Natawidjaja, D., (2000), “Neotectonics of the Sumatera Fault, Indonesia”, Journal of Geophysical Research, 105 (B12), pp. 28295 – 28326. SNI 03-2847-2002 (2002), “Tata Cara Perhitungan Struktur Beton untuk Bangunan Gedung”, The Indonesian Concrete Code, Department of Publik Work, Bandung, Indonesia. SNI 03-1726-1989-F (1989), “Pedoman Perencanaan Ketahanan Gempa Untuk Rumah dan Gedung”, Rules for Earthquake Resistant Design of Houses and Buildings, Department of Publik Work, Bandung, Indonesia. SNI 03-1726-2002 (2002) “Tata Cara Perencanaan Ketahanan Gempa untuk Gedung”, The Indonesian Seismic Resistant Design Standard for Building Structures, Department of Publik Work, Bandung, Indonesia. USGS, http://earthquake.usgs.gov/earthquakes/recenteqsww/ accessed 05 October, 2009 Youngs, R. R., Chiou, S. J., Silva, W. J., Humphrey, J. R., (1997), “Strong Ground Motion Attenuation Relationship for Subduction Zone Earthquake”, Bulletin of Seismological Society of America, Vol. 68, No. 1.
69

The 30th September 2009 West Sumatra Earthquake Padang Region Damage Survey
This Page Intentionally Blank
70

The 30th September 2009 West Sumatra Earthquake Padang Region Damage Survey
71
Appendices

The 30th September 2009 West Sumatra Earthquake Padang Region Damage Survey
This Page Intentionally Blank
72

The 30th September 2009 West Sumatra Earthquake Padang Region Damage Survey
Appendix A1 Modified Mercalli Intensity Scale and Irregularity Codes
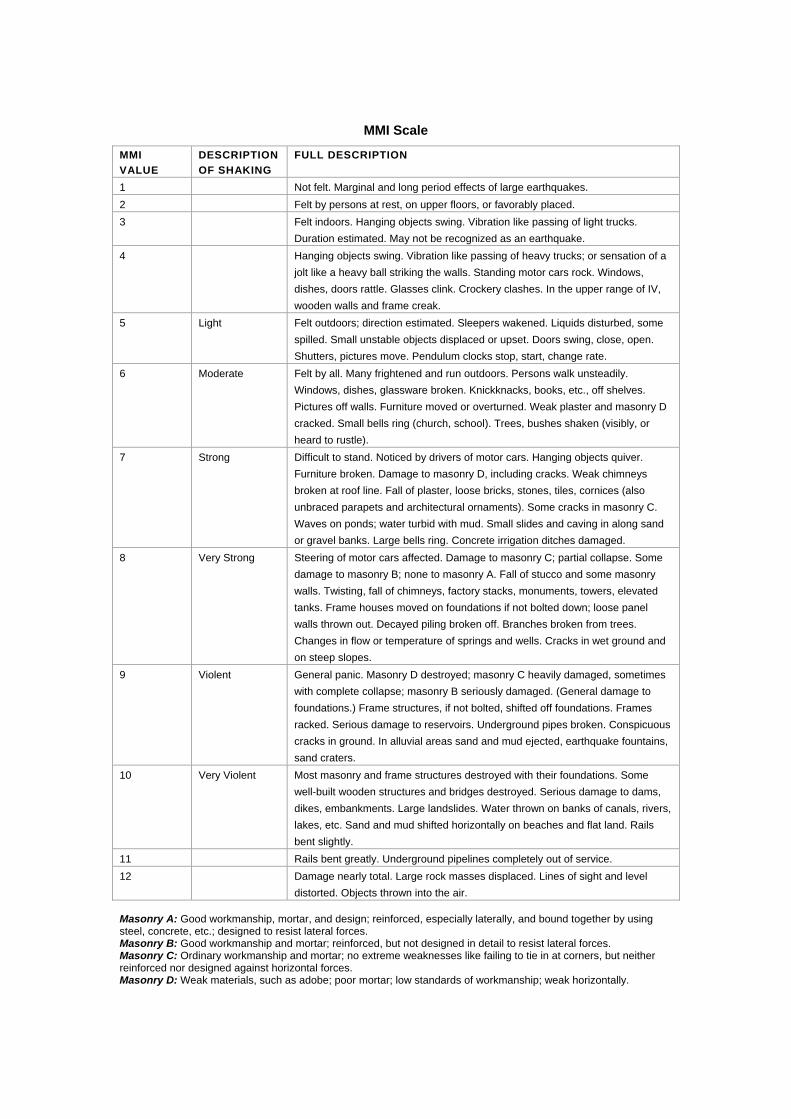
MMI Scale
MMI
VALUE
DESCRIPTION
OF SHAKING
FULL DESCRIPTION
1 Not felt. Marginal and long period effects of large earthquakes.
2 Felt by persons at rest, on upper floors, or favorably placed.
3 Felt indoors. Hanging objects swing. Vibration like passing of light trucks.
Duration estimated. May not be recognized as an earthquake.
4 Hanging objects swing. Vibration like passing of heavy trucks; or sensation of a
jolt like a heavy ball striking the walls. Standing motor cars rock. Windows,
dishes, doors rattle. Glasses clink. Crockery clashes. In the upper range of IV,
wooden walls and frame creak.
5 Light Felt outdoors; direction estimated. Sleepers wakened. Liquids disturbed, some
spilled. Small unstable objects displaced or upset. Doors swing, close, open.
Shutters, pictures move. Pendulum clocks stop, start, change rate.
6 Moderate Felt by all. Many frightened and run outdoors. Persons walk unsteadily.
Windows, dishes, glassware broken. Knickknacks, books, etc., off shelves.
Pictures off walls. Furniture moved or overturned. Weak plaster and masonry D
cracked. Small bells ring (church, school). Trees, bushes shaken (visibly, or
heard to rustle).
7 Strong Difficult to stand. Noticed by drivers of motor cars. Hanging objects quiver.
Furniture broken. Damage to masonry D, including cracks. Weak chimneys
broken at roof line. Fall of plaster, loose bricks, stones, tiles, cornices (also
unbraced parapets and architectural ornaments). Some cracks in masonry C.
Waves on ponds; water turbid with mud. Small slides and caving in along sand
or gravel banks. Large bells ring. Concrete irrigation ditches damaged.
8 Very Strong Steering of motor cars affected. Damage to masonry C; partial collapse. Some
damage to masonry B; none to masonry A. Fall of stucco and some masonry
walls. Twisting, fall of chimneys, factory stacks, monuments, towers, elevated
tanks. Frame houses moved on foundations if not bolted down; loose panel
walls thrown out. Decayed piling broken off. Branches broken from trees.
Changes in flow or temperature of springs and wells. Cracks in wet ground and
on steep slopes.
9 Violent General panic. Masonry D destroyed; masonry C heavily damaged, sometimes
with complete collapse; masonry B seriously damaged. (General damage to
foundations.) Frame structures, if not bolted, shifted off foundations. Frames
racked. Serious damage to reservoirs. Underground pipes broken. Conspicuous
cracks in ground. In alluvial areas sand and mud ejected, earthquake fountains,
sand craters.
10 Very Violent Most masonry and frame structures destroyed with their foundations. Some
well-built wooden structures and bridges destroyed. Serious damage to dams,
dikes, embankments. Large landslides. Water thrown on banks of canals, rivers,
lakes, etc. Sand and mud shifted horizontally on beaches and flat land. Rails
bent slightly.
11 Rails bent greatly. Underground pipelines completely out of service.
12 Damage nearly total. Large rock masses displaced. Lines of sight and level
distorted. Objects thrown into the air. Masonry A: Good workmanship, mortar, and design; reinforced, especially laterally, and bound together by using steel, concrete, etc.; designed to resist lateral forces. Masonry B: Good workmanship and mortar; reinforced, but not designed in detail to resist lateral forces. Masonry C: Ordinary workmanship and mortar; no extreme weaknesses like failing to tie in at corners, but neither reinforced nor designed against horizontal forces. Masonry D: Weak materials, such as adobe; poor mortar; low standards of workmanship; weak horizontally.
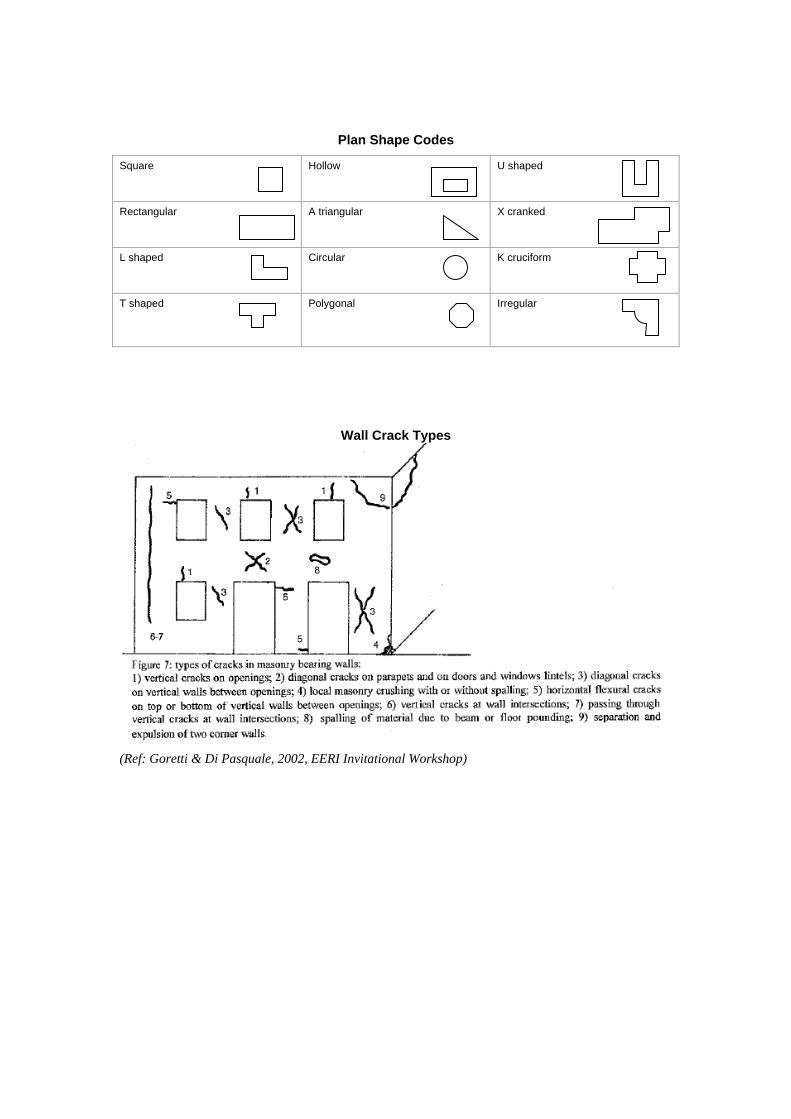
Plan Shape Codes
Square Hollow U shaped
Rectangular A triangular X cranked
L shaped Circular K cruciform
T shaped Polygonal Irregular
Wall Crack Types
(Ref: Goretti & Di Pasquale, 2002, EERI Invitational Workshop)
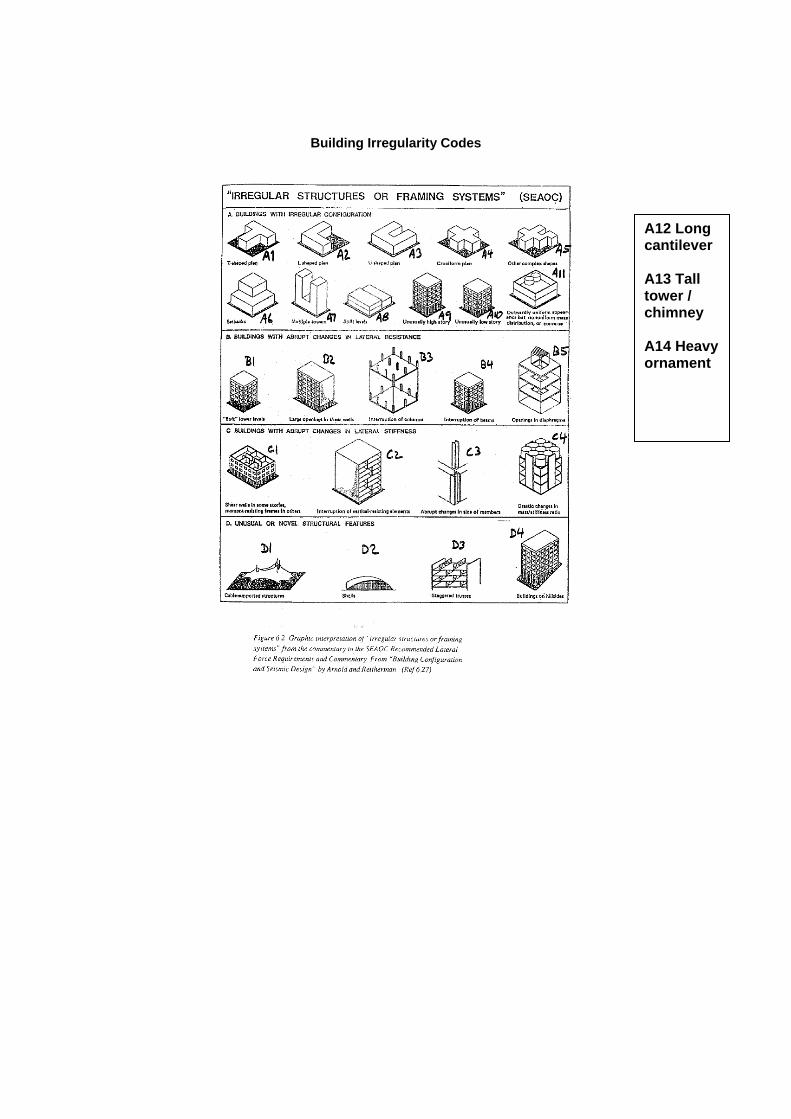
Building Irregularity Codes
A12 Long cantilever A13 Tall tower / chimney A14 Heavy ornament

The 30th September 2009 West Sumatra Earthquake Padang Region Damage Survey
Appendix A2 Expert Group Reporting
AUSTRALIA-INDONESIA FACILITY FOR DISASTER REDUCTION, EXPERT ENGINEERING
TEAM
Draft West Sumatra Building Recommendations
AIFDR/AusAid/GA
6 November 2009 Padang Survey - Oct 2009
1 06 November 2009
AUSTRALIA-INDONESIA FACILITY FOR DISASTER REDUCTION,
EXPERT ENGINEERING TEAM
DRAFT WEST SUMATRA BUILDING RECOMMENDATIONS EXECUTIVE SUMMARY
Following the earthquake of 30 Sept 2009, a team of experts from Indonesia, Australia, New Zealand and Singapore organized through the Australia-Indonesia Facility for Disaster Reduction (AIFDR) carried out a survey of buildings across Padang to investigate the level of earthquake damage and to collect information on the probable causes of the damage. This Report includes the preliminary recommendations of the Survey Team to support the re-construction and recovery process. Seismologists are expecting a magnitude 8.5 plate boundary earthquake in the coming decades that could be accompanied by a large tsunami. The high risk of significant impacts on Padang should be anticipated by “Building Back Better”. The survey found that damage to buildings resulted from:-
Poor Quality Materials (e.g. soft bricks, mortar substituted for concrete, aggregates rounded and too large, low cement content in concrete, etc)
Poor Overall Formation of the Structure (e.g. ground floor “soft storey”, lack of shear walls, short columns above masonry infill)
Lack of Building Controls (e.g. large buildings built in areas prone to liquefaction, lack of compliance to design codes, lack of inspection/supervision)
Poor Detailing of Structures (e.g. poor connections between elements, short 90 degree tails in stirrups, gaps not provided between portions of buildings resulting in “pounding” of one structure against the other)
The report includes discussion of the specific problems of typical building methods and materials and suggests many engineering and construction improvements. For example, buildings designed to the National Code prior to 2002 would have suffered extensive damage due to the very low specified earthquake hazard in the earlier code. Many engineer designed multi-storey buildings performed poorly compared to more traditional single storey construction. The recommendations are summarised under the following headings: Regulatory recommendations:
Review of Building Codes (design earthquake hazard may be increased) Building Back Better (new construction should be better than what went before) Post-disaster recovery facilities improved (e.g. medical) Tsunami hazard incorporated into planning and in design of recovery facilities Non-engineered buildings to have minimum standard design Hazard Based Spatial Planning Geotechnical investigation (building foundations) improved

2 06 November 2009
Enforcement: Non-compliance to be policed Re-construction and repair to be supervised (building permits) Improved design controls Training for all levels of construction industry Professional Engineer Licensing Inspection Materials
Specific Engineering Recommendations:
Reinforcement detailing to be improved Bracing of roof structure Tie the structure together with stronger joints Gable walls, parapets and balcony barriers to be light materials/laterally tied Pounding to be avoided by providing gaps Short columns to be adequately designed and detailed Deformed reinforcement to be used Shear walls (reinforced concrete) to be encouraged Shop fronts to have shear walls Column/beam concrete joint detailing to be improved Mis-match of floor levels to be avoided or gaps provided to allow separate movement Fixed stairs to be appropriately designed
It is clear from the level of damage observed during the survey and from the loss of life, that many buildings of West Sumatra will be damaged in the projected large earthquake expected to occur in coming decades. Current re-construction is an important opportunity to “Build Back Better”. To prepare for the expected large magnitude earthquake and tsunami, good engineering must be supported by regulatory quality assurance processes. The recommendations in this report are fundamental for reducing community risk and need to be swiftly integrated and implemented into the recovery and reconstruction process.
3 06 November 2009
AUSTRALIA-INDONESIA FACILITY FOR DISASTER
REDUCTION, EXPERT ENGINEERING TEAM
DRAFT WEST SUMATRA BUILDING RECOMMENDATIONS
Introduction Following the earthquake of 30 Sept 2009, a team of experts from Indonesia, Australia, New Zealand and Singapore organized through the Australia-Indonesia Facility for Disaster Reduction (AIFDR) arrived in Padang 23rd October 2009. They began a survey of buildings across Padang to investigate the level of earthquake damage and to collect information on the probable causes of the damage. The intention was to collect data to assist in predicting damage to buildings in future earthquakes and to provide general advice on the re-construction effort. This Report includes the preliminary recommendations of the Survey Team to support the re-construction and recovery process and thereby reduce the human, social and infrastructure losses in any future earthquake.
Background Risk of Future Earthquake A 7.6 magnitude earthquake occurred on 30 September 2009 on the subduction zone of the Indo-Australian and Euro-Asian plates. It was located 80 km below the surface along a rupture distance approximately 50 km long that extended below the coastline near Padang. It resulted in relatively high ground shaking in Padang and up the coast to the north with felt intensities of VII (MMI) and higher reported. Padang has been a focus of natural hazard scientists and disaster managers over the last five years. This is a result of increased evidence suggesting a high potential for an ~Mw 8.5 earthquake on the nearby subduction zone that could trigger a devastating tsunami. Significantly, the earthquake on the 30th September was not this ‘anticipated’ event. Hence a tsunamigenic earthquake still remains a significant threat to Padang and surrounding coastal areas. Recent assessment of earthquake risk along the plate boundary suggests it is possible that the earthquake on the 30th September has created additional stress on the subduction zone, increasing the probability of this tsunamigenic earthquake occurring in future decades. A magnitude 8.5 event could generate a higher peak acceleration compared to that specified in the current (and previous) Indonesian Building Codes. The possibility of a ~Mw 7.5 earthquake on the Sumatra Fault Zone also exists (see red line on Figure 1). The time-frame for these events is well within the expected design life of any re-construction. Should the ~Mw 8.5 earthquake occur, settlement of half a metre may occur along the coastline of West Sumatra (land behind the subduction zone). This should be included in
4 06 November 2009
any threat analysis from tsunami or ocean inundation flooding (e.g. risk from Sea Level Rise). The re-construction and long-term development of the City of Padang and generally in West Sumatra needs to be based on this increased seismic and tsunami hazard. This increase in the recognized hazard makes the need to “Build Back Better” even more important than usual. The current building stock will gradually be replaced as development continues, so “Building Back Better” is important to improving the resilience of the Sumatra community to future earthquakes.
Observations and findings Damage At the time of issue of this report, the Survey Group had spent a number of days in the field and inspected several hundred buildings in Padang. The damage seen includes many buildings collapsed, many close to collapse and a larger number damaged but repairable. Building types inspected in large numbers include concrete frame with infill brick walls, load bearing brick with confining concrete columns and beams (confined masonry type) and timber framed buildings with infill masonry below the window sills. The Survey Group classed the weaknesses of the building stock as resulting from causes that fall into the following groupings:
Poor Quality Materials (e.g. soft bricks, mortar substituted for concrete, aggregates rounded and too large, low cement content in concrete, etc)
Poor Overall Formation of the Structure (e.g. ground floor “soft storey”, lack of shear walls, short columns above masonry infill)
Lack of Building Controls (e.g. large buildings built in areas prone to liquefaction, lack of compliance to design codes, lack of inspection/supervision)
Poor Detailing of Structures (e.g. poor connections between elements, short 90 degree tails in stirrups, gaps not provided between portions of buildings resulting in “pounding” of one structure against the other)
It was apparent that the hazard criteria in the Indonesian Building Code may need to be revised for West Sumatra due to the increased hazard of a large earthquake in the region. Also, the stock of existing buildings includes many that would not be approved under current regulations due to their age or natural deterioration. It should be noted that the 2002 edition of the National Seismic Building Codes (SNI-03-1726-2002) increased the design hazard level from 0.07 to 0.3 (a factor of 4). Types of construction observed The survey team found that the building types fitted into a number of broad descriptions related to design and construction methods. The main types included:-
Confined masonry (load bearing brick masonry walls with a confining concrete beam and column frame cast directly against the brick);
5 06 November 2009
Concrete frame with masonry infill walls – this type included single storey buildings where the concrete frame serves to confine the brick masonry and major multi-storey buildings with a large column and beam structure; and
Traditional single storey construction using timber frame with infill of either masonry or cement daub on “K-wire” mesh.
Detailed engineering recommendations and standards should be produced for the single storey common types of construction. These common building types appear to be favoured due to the cheapness of the construction and the availability of the materials used in their construction. Simple improvements in their design and execution may lead to a significant increase in resilience to earthquake of the general population of buildings. Evidence of liquefaction was noted at widely varying locations within the City of Padang. Liquefaction has caused ground settlement (300mm noted at one location). This type of settlement triggered serious damage to building structures. It affected the larger heavier structures more than single storey buildings and was more prevalent on the loose to medium sands near the coastline and along the edges of rivers. It is considered to have triggered the collapse of some large buildings due to the magnitude of displacements to building frames resulting from non-uniform levels of settlement throughout the structure.
Recommendations To improve the safety of the West Sumatra community the following recommendations are made to maximise building performance, assist recovery and reduce the impact on populations during the next earthquake. The recommendations are grouped under regulations, enforcement and specific engineering issues. Regulatory recommendations: 1. Review of Building Codes—Collapse of many buildings and the high level of ground
shaking experienced indicate that the current National Seismic Building Codes, SNI-03-1726-2002 (and the previous Seismic Building Code SNI-1981) require review. In particular the hazard level for West Sumatra may need to be increased. This should be undertaken as soon as possible to provide for both reconstruction and long-term development of West Sumatra. Recent earthquake hazard analysis indicates a high potential for a major earthquake in the next few decades (~Mw8.5). This research should form the basis for revision of the Codes used in West Sumatra.
2. Building Back Better—Rapid establishment of up-dated earthquake design requirements and quality controls for West Sumatra is critical to reducing future earthquake disaster risk. This is the “build-back-better” philosophy.
3. Post-disaster recovery facilities—New post-disaster recovery facilities such as schools, hospitals, police stations, evacuation buildings, community centres, etc should be designed and constructed to the higher seismic hazard identified. Existing post-disaster recovery structures should be reviewed/inspected with regard to the common flaws identified in this report and strengthening to the increased seismic hazard should be considered.
4. Tsunami hazard—For buildings required for post-disaster recovery, design should include resistance to tsunami as well as design for earthquake. All buildings of 3 stories or more should be designed to survive the predicted tsunami event. For
6 06 November 2009
Padang, the provision of taller buildings (3 storeys or more) to provide for vertical evacuation should be considered in the construction of public facilities such as schools, hospitals, etc. Construction of specific tsunami evacuation structures should be considered for areas with few or no tall buildings. Evacuation buildings will need to survive the earthquake as well as the tsunami and so should be designed for a higher hazard than the “normal” buildings that they need to “out-survive”. Current performance of taller buildings in Padang was shown by the survey to be poor.
5. Non-engineered buildings—A minimum Standard should be prepared for non-engineered buildings (such as small business and housing). The standard drawings for confined masonry for schools could be used as a starting point for development of such a “standard” design with improvements relating to the provision of corner bars and appropriate laps and development lengths for bars. Existing structural design standards could be referenced for such information.
6. Hazard Based Spatial Planning—Seismic micro-zonation, liquefaction potential maps and tsunami hazard maps for the City of Padang should be developed as input to hazard based spatial planning.
7. Geotechnical investigation (Building Foundation)—All sites should be assessed for geotechnical conditions prior to design including site soil classification and any necessary ground improvement methods described. Proposals for new buildings should include assessment of the potential for liquefaction and any methods proposed to address the risk. The survey team saw little evidence of footing design and were informed that piling for tall structures was limited.
Enforcement:
8. Non-compliance—Non-compliance of construction with the current Design Codes or
with the construction drawings and the use of poor quality materials has caused the collapse of many buildings. Therefore, increased enforcement is required during the process of Building Permit review and during construction. The latest Building Codes and Standards need to be distributed to government officials and capacity building of local staff is required. Capacity building could be implemented in the form of training from experts and professionals. Particular focus should be made on multi-storey construction, schools, medical facilities, ambulance stations, bridges, major roads and other important post-disaster recovery and life-line structures.
9. Re-construction and repair—A Building Permit should be required for all new construction work or repair of existing buildings and should be supervised by a suitably qualified Professional Engineer. (It is understood that currently only new buildings require a Permit.)
10. Improved design controls—An Advisory Team of Professional Engineers and University level expertise should be formed to evaluate building designs prior to Building Permits being issued. This should include assessment of compliance with the new Building Code hazard level for West Sumatra and provision of advice to Mayoral Offices on individual building designs.
11. Training—Training should be provided as soon as possible (prior to the re-construction process) for local engineers, building consultants, inspectors, and contractors (including masons and local communities involved in building). Training should include why specific detailing requirements exist and what happens if they are not implemented (plenty of photographic evidence has been collected to assist in this
7 06 November 2009
process). Continuing Professional Development processes should be established for Engineers and other building professionals.
12. Professional Engineer Licensing— Licensing of Professional Engineers should be extended to all Provinces, particularly West Sumatra, to ensure on-going quality of design and construction.
13. Inspection—Many buildings were found to be poorly constructed or not in accordance with the design. An “Occupation Certificate” should be required establishing that the building has been constructed in accordance with the design prior to allowing occupation of the building. This would require compulsory inspection by suitably qualified Professional Engineers at the following stages during construction. 13.1. Foundations before design (e.g. Geotechnical investigation); 13.2. Footings prior to back-filling; 13.3. Concrete reinforcement prior to pouring; 13.4. Steelwork connections (welds/bolts); 13.5. Connections of walls; 13.6. Hold-down connections of roof; 13.7. Bracing of structure.
14. Materials—In many cases of collapse or heavy damage the use of poor quality materials contributed to the damage. Inspection during construction should include checking of supply of materials to ensure the strength of the building is as designed (e.g. checking of concrete quality at point of use, quality control of reinforcement).
Engineering of Buildings General Discussion The following comments are offered following a survey of approximately 1800 buildings in and around Padang including buildings surveyed to the north (around Pariaman and Secincin) where the damage was reported to be most severe. The latest National Seismic Building Code (SNI-03-1726-2002) increased the design seismic hazard for the West Sumatra area in 2002 from 0.07g to 0.3g. The Indonesian expert members of the team indicated that current understanding following recent modelling suggests the hazard for Padang might be as high as 0.4 to 0.5 (for 10% PE in 50 years and T= 1 sec (long period) spectral value). The 2002 Code change means that any design work carried out prior to 2002 is likely to have seriously underestimated the actual hazard to which the buildings are subjected. This emphasises the need to institute a seismic strengthening program in conjunction with reconstruction initiatives. Regardless of the low design hazard levels prior to 2002, the general practice of confining masonry walls with reinforced concrete has been followed for some time for single storey buildings. This appears to have developed in response to the tacit understanding that earthquake hazard did exist (even though it was not adequately quantified). It should be noted that some buildings tagged Red in the earthquake zone (as having significant damage) may still be repairable following a detailed structural assessment. Red tagged buildings should be subject to a detailed inspection by a suitably qualified Professional Engineer prior to being demolished.
8 06 November 2009
Failures in small buildings The majority of buildings surveyed were single storey of unreinforced masonry or with confining small sized concrete members (confined masonry buildings). The confinement is in the form of reinforced concrete members of a standard type cast after masonry is constructed. The style is defined as generally with tie beams top and bottom of all walls (approx. 150 x 150 reinforced with 4 x 8mm diameter round bars) with columns cast inside brick walls (generally approx. 150 x 200 with 4 x 6mm dia. round bar). Footings are approx. 800mm to 1200mm deep of a pyramid shape of mortared rounded river stones. It was clear that most of the collapsed minor buildings involved failure of un-reinforced masonry. While in-plain failures were recorded in many buildings, out-of-plane failures were more numerous and more severe. The housing near Periaman and Secincin that was collapsed was mostly in rural areas and amounted to approx. 2% – 3% of the buildings seen, while around 10% – 15% of the buildings remained standing with only some fallen walls. These houses were generally of unreinforced load-bearing masonry. The masonry was rendered standard brick or rounded river rocks or stones approx. 150 mm – 300 mm in size that were stacked and mortared in place. Many “river stone” walls were observed to have sustained damage with many fallen. Where confined masonry had been observed to have been damaged (including collapses) there was a lack of the following:-
adequate reinforcing bars at joints; anchorage of bars; leg length of hooks; spacing/diameter of ties and anchorage of ties.
With the joints poorly detailed, the confinement of the masonry walls would be ineffective, leading to poor performance in earthquake. Plain round bar (undeformed) was invariably observed (except in the most recent multistorey concrete structures) which further exacerbated concerns regarding reinforcement anchorage. Larger multi-storey structures For the larger concrete structures, the most common failures involved the development of plastic hinges at the tops and bottoms of ground floor columns. Reinforcement in most structures was observed to be plain round bar. Only in some newer structures was deformed reinforcement bar observed. Invariably, multi-storey concrete structures had infill walls of unreinforced masonry throughout the building constructed hard up against the concrete structure (no gaps). In some cases the infill unreinforced masonry saved the structure by acting as shear walls and absorbing most of the lateral deformation energy with resulting crushing and diagonal cracking of the infill. It was not clear whether many of the structures were specifically designed for lateral forces. This may be the result of the lower design requirements of the pre-2002 Building Code (Indonesian Seismic Building Code SNI-1981). Unreinforced masonry walls (rendered brick) appeared to be the only lateral force resistant elements in most structures. That is, no reinforced concrete shear walls were observed.

9 06 November 2009
Short columns had been created in many structures by the infill masonry not extending to the underside of the beams above and therefore not forming a proper shear wall. The columns in such locations would then form a ‘soft storey’, with concentration of most of the lateral deformation into the short column leading to failure in shear or by the formation of plastic hinges. In these locations, column ties would not be adequate for the shear deformation experienced. Shear failures were frequently observed in the potential plastic hinge zones at the tops of columns, indicating that the structure had little ductility capacity. Bricks The bricks used throughout the building industry around Padang are of orange/red clay with the majority appearing to be incompletely fired. Bricks were commonly able to be broken easily by stamping on them with the foot. In only one case out of a number of manual tests carried out on numerous sites, the brick could not be broken with the foot. The fired clay was often able to be crumbled with the fingers, and in some cases the centre of the bricks appeared un-fired with the centre able to be hollowed with the thumbnail. Hollow Concrete Blocks The hollow concrete blocks observed in a number of the school buildings inspected were approx. 90mm thick. They did not appear to be suitable for installing reinforcement and pouring of grout (the hollows being too small). In one location, a broken portion of one block was crumbled by hand indicating the blocks may be of low strength or of variable quality. Reinforced concrete block masonry was not observed in any buildings inspected during the survey. Concrete In many broken concrete members, the aggregate was observed to be of rounded river gravel of large size (ranging up to >40 mm). It was observed that reinforcing steel was being recovered from fallen structures by beating the concrete members with sledge hammers and hand hammers – suggesting that the concrete strength is low. Honeycombing of concrete members was also observed on many buildings due to incomplete compaction of concrete during pouring. Specific Engineering Recommendations:
15. Reinforcement detailing—Reinforcement must be adequately anchored at joints by
applying the following: Reinforcement must be adequately detailed, particularly at joints. The appropriate Structural Concrete Design Standard should be followed. Where a Structural Engineer is not involved in the design (e.g. for the standard confined masonry type construction) guidelines should be provided on development lengths and lap lengths for the range of bar sizes and types (plain round and deformed) commonly used. These should take into account the steel strength and concrete strength. Corner bars must be provided in all concrete joints to transfer forces from beams to columns.
10 06 November 2009
Ties must be adequately anchored with hooks that turn 135 degrees (with appropriate leg length) and be spaced appropriately (e.g. min 150mm centres).
16. Bracing of roof structure—In many cases the roof trusses were not braced to one another or to the shear walls below. Guides on bracing of buildings and roof framing should be prepared and made available to all levels of the building industry (including building owners).
17. Tie the structure together—Connections between all elements of the building are important to ensure that load paths continue to function during earthquake shaking. The links provided by the concrete elements in the traditional confined masonry type construction provide for the tying together of the walls and structure. It is when these ties do not hold together through poor joint detailing (e.g. lack of corner bars) that failures were seen. Provision of load paths through sound design of joints and provision of connections to walls should be ensured in all buildings.
18. Gable walls, parapets and balcony barriers—Design of parapets and gable walls should be restricted to light framed materials (masonry should be banned for these elements) and provided with ties to the building structure of sufficient strength and durability to resist the lateral seismic forces.
19. Pounding—Gaps should be provided between separate buildings to allow for deflections during earthquakes without the buildings colliding.
20. Short columns—Columns with adjacent masonry walls that are not the full height of the column will be subject to higher lateral deformation and should be designed accordingly. Preferably, such short column/soft storey structural formations should not be used.
21. Deformed reinforcement—The use of deformed reinforcement bar should be encouraged. This would improve the strength of concrete members, improve the anchorage of the bars and lead to the use of higher quality steels.
22. Shear walls—The use of evenly distributed shear walls should be encouraged. Properly designed shear walls tied into the structure are of great value in resisting lateral earthquake actions. For larger concrete framed buildings, concrete shear walls designed for the lateral earthquake forces would be a better solution than infill masonry walls. Care should be taken to ensure that any infill masonry that is not intended to act as a shear wall is provided with enough clearance around its edges to avoid it interfering in the lateral behaviour of the structure (example: the short columns unwittingly caused by masonry, see Item 20 above).
23. Shop Fronts—Many shop fronts have no shear resistance at the front of the building. This can cause a soft storey and/or torsional type failure. A number of such failures were seen. Some damaged buildings were still in use where the deformation was of a dangerous nature. Shop fronts should be provided with some form of lateral resistance (e.g. short shear walls).
24. Column/beam concrete joint detailing—Joints observed had poor detailing of the steelwork, with resultant shear failures and plastic hinges forming in the columns. More attention should be paid to joint detailing with particular attention to shear ties, lap lengths and column continuity through floors. The use of strong column/weak beam design philosophy should be encouraged.
11 06 November 2009
“The transverse reinforcement in columns was consistently observed to be too widely spaced and poorly detailed, which was particularly critical when column hinging occurred” – by transverse do you meant he reo in the beams or the ties?
25. Mis-match of floor levels—Where two buildings meet and the floor levels are different, loads from one building may be transferred into the mid-point of the next buildings columns leading to failure of the columns. This should be avoided by providing gaps to prevent transfer of loading (including pounding).
26. Fixed stairs—Concrete stairways create a stiff element in the building structure. This may result in damage to the stair or to the surrounding structure. Design should take these elements into consideration. These could be better utilised to resist lateral loads by incorporation of reinforced concrete shear walls and floor diaphragms.
Conclusion It is clear from the level of damage observed during the survey and from the loss of life, that many buildings of West Sumatra will be damaged in the projected large earthquake expected to occur in coming decades. The current re-construction being undertaken is an important opportunity to carry out improvements in building practice and to thus increase the resilience of buildings. To prepare Padang and other communities along the west coast of Sumatra for the expected large magnitude earthquake and tsunami, it is imperative that good engineering is supported by regulatory quality assurance processes. These recommendations are fundamental for reducing community risk and need to be swiftly integrated and implemented into the recovery and reconstruction process.
12 06 November 2009
Draft Advice provided to World Bank, Oct 2009. Initial Recommendations on West Sumatra Buildings A major West Sumatra earthquake with a magnitude up to 8.5 is likely in either our lifetime or our children’s lifetime. It will cause stronger shaking than the September 2009 earthquake and will possibly be followed by a major tsunami. It is possible to use the current re-construction process to prepare for the next inevitable event. West Sumatra can and must “build back better” and it is paramount that recovery and re-construction is supported by an appropriate engineering and regulatory framework. To improve the safety of the West Sumatra community the following recommendations are made to maximise building performance, assist recovery and reduce the impact on populations during the next earthquake. Regulatory recommendations: The current building code needs to be reconsidered in light of the expected event – higher
design requirements may be necessary for the general population of buildings and further increased seismic and tsunami criteria is required for post-disaster facilities (government buildings, schools, hospitals etc). Any review needs to be completed urgently in order to support building back better.
A major Tsunami would likely follow the ~Mw 8.5 earthquake (within 20 or 30 minutes). Post
disaster facilities should be designed for this hazard. Furthermore, any building of 3 storeys or more should have increased design measures to function as a tsunami refuge.
Key facilities that have survived 30 Sept event relatively undamaged would fail in large
numbers under the anticipated next event. They should be reviewed and strengthened as needed.
Other engineered and non-engineered construction (commercial, residential) similarly needs to
be reviewed for the expected event and strengthened as needed. Improved standards could be prepared for some typical construction types.
More detailed assessment of apparently heavily damaged buildings will be required as some
may only have limited structural damage and need not be demolished. Repair or strengthening may be required for the expected earthquake/tsunami
Housing suffered greatly in this event, due to common building methods (un-reinforced
masonry and reinforced concrete with masonry infill). At a minimum, confined masonry should be employed for all one story residential new construction. For two story and higher construction, more appropriate engineered design would be needed.
Detailed hazard mapping is needed (site amplification, liquefaction, landslide, etc.) for use in
local development planning by government. Enforcement recommendations: A building code is of no use if it is not applied. The overall building construction and quality
assurance process in West Sumatra needs to be assessed and modified to ensure buildings are designed and constructed to the required level. This will require education on appropriate construction techniques as well as a regime of building inspections during construction of engineered structures – both public and private.
13 06 November 2009
Building Permits should be required for all work to assist in quality control. An Advisory Team of Experts and Professionals would assist Provincial and Mayoral Offices to improve scrutiny of proposed designs.
In many cases of poor performance reinforcement was not installed correctly or concrete was
of poor quality. A mandated inspection regime is required to ensure buildings are constructed to the design.
Training in fundamentals of reinforced concrete construction and seismic detailing should be
provided throughout the professional and construction communities in West Sumatra (and Indonesia) to improve design and construction quality. Training of building workers and education of building owners will assist in the reform process.
Specific Engineering recommendations: Specific engineering design recommendations include amongst others:
o Use of confined masonry instead of un-reinforced masonry and use of reinforced concrete with masonry infill designed as shear walls;
o provision of gaps between buildings to reduce “pounding”; o inclusion of shear walls on ground floors to reduce “soft storeys”; o use of deformed reinforcement bars to maintain steel quality and improve reinforced
concrete performance; o improved reinforced concrete joint detailing; and o provide countermeasures for liquefaction and other foundation problems.
To prepare Padang and other communities along the west coast of Sumatra for the expected large magnitude earthquake and tsunami, it is imperative that good engineering is supported by regulatory quality assurance processes. These recommendations are fundamental for reducing community risk and need to be swiftly integrated and implemented into the recovery and reconstruction process.
<<< *** >>>

14 06 November 2009
Figure 1 Recent earthquake activity near Padang (image from a web document, source unknown)
Figure 2 (detail of image from www.defence.gov.au)
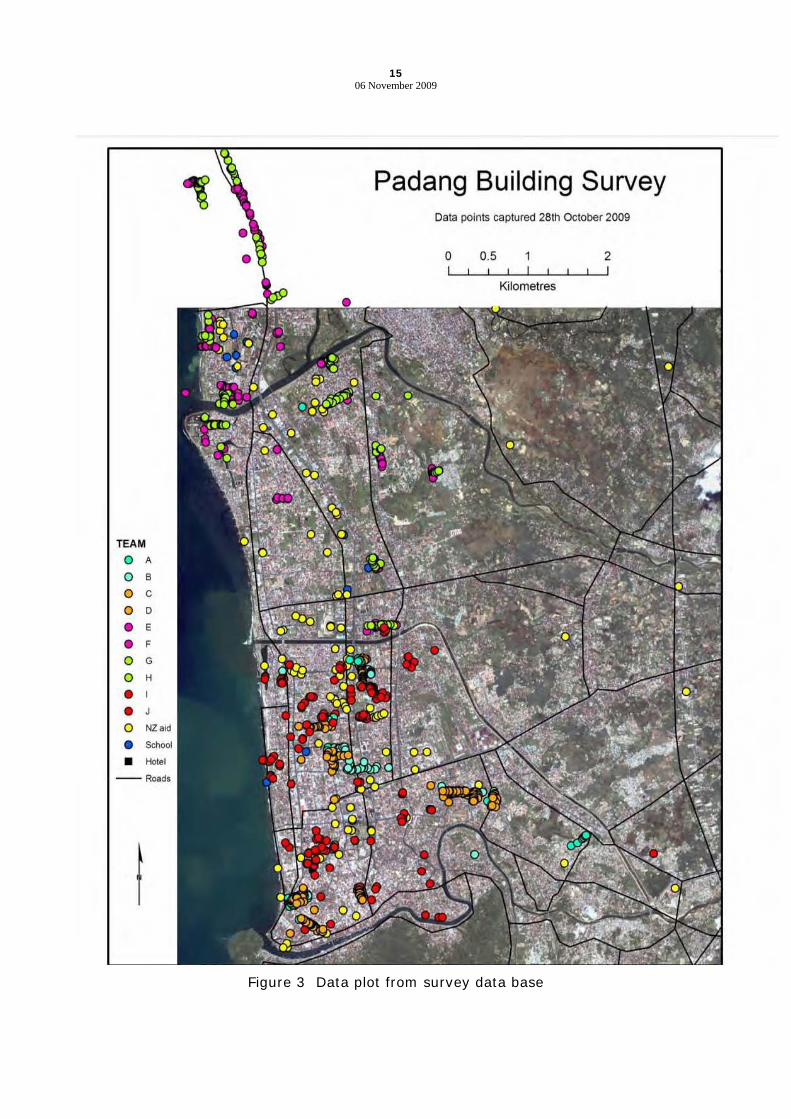
15 06 November 2009
Figure 3 Data plot from survey data base
Padang Building Survey Data points captured 28th October 2009
o 0.5 2
Kilometres
TEAM
o A
o B
o C
o 0
• E • F o G
o H
• I
• J o NZaid · ""'" • Hotel
-- RQlIds
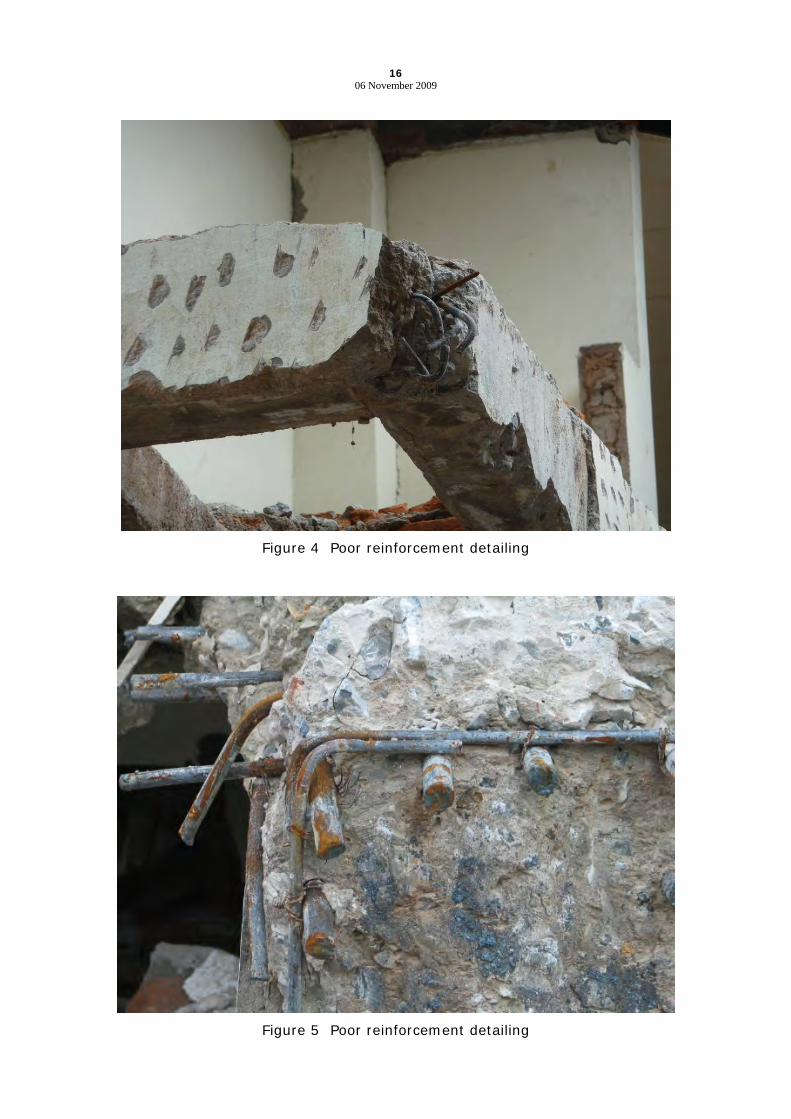
16 06 November 2009
Figure 4 Poor reinforcement detailing
Figure 5 Poor reinforcement detailing

17 06 November 2009
Figure 6 Soft bricks--Broken with fingers
Figure 7 Missing ties in column/joint

18 06 November 2009
Figure 8 Demolition methods—recycling steel bars
Figure 9 Failed Gable Wall
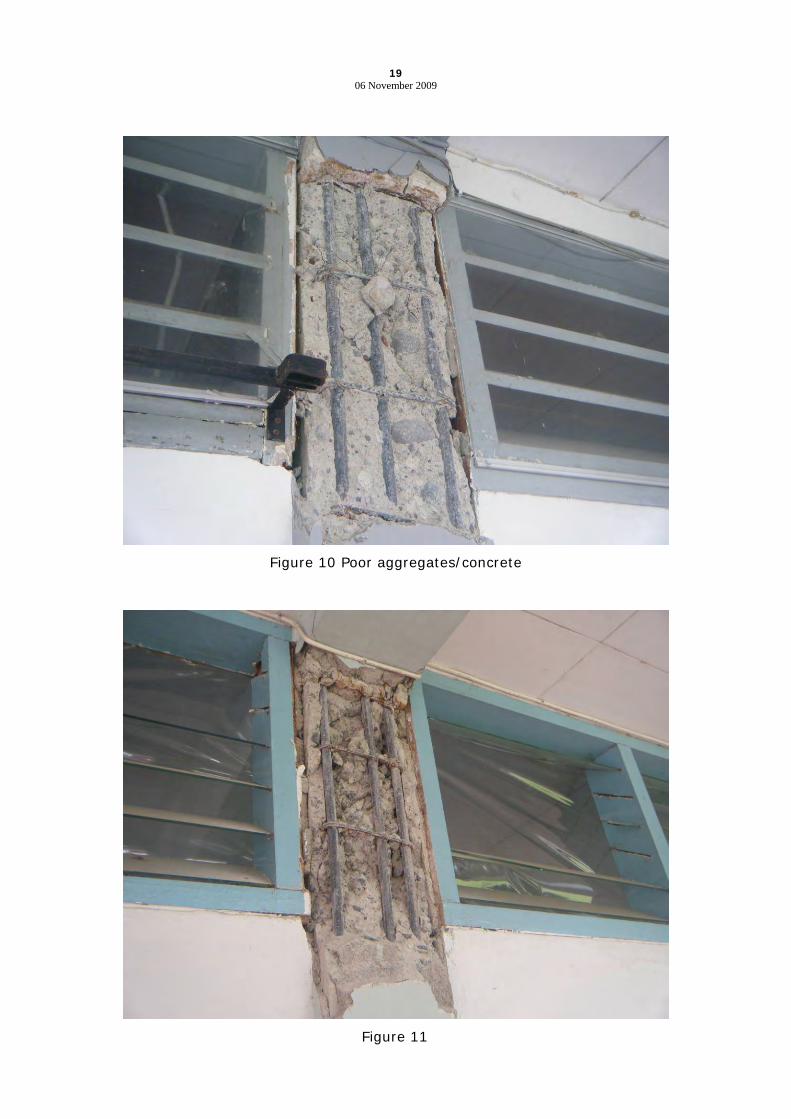
19 06 November 2009
Figure 10 Poor aggregates/concrete
Figure 11
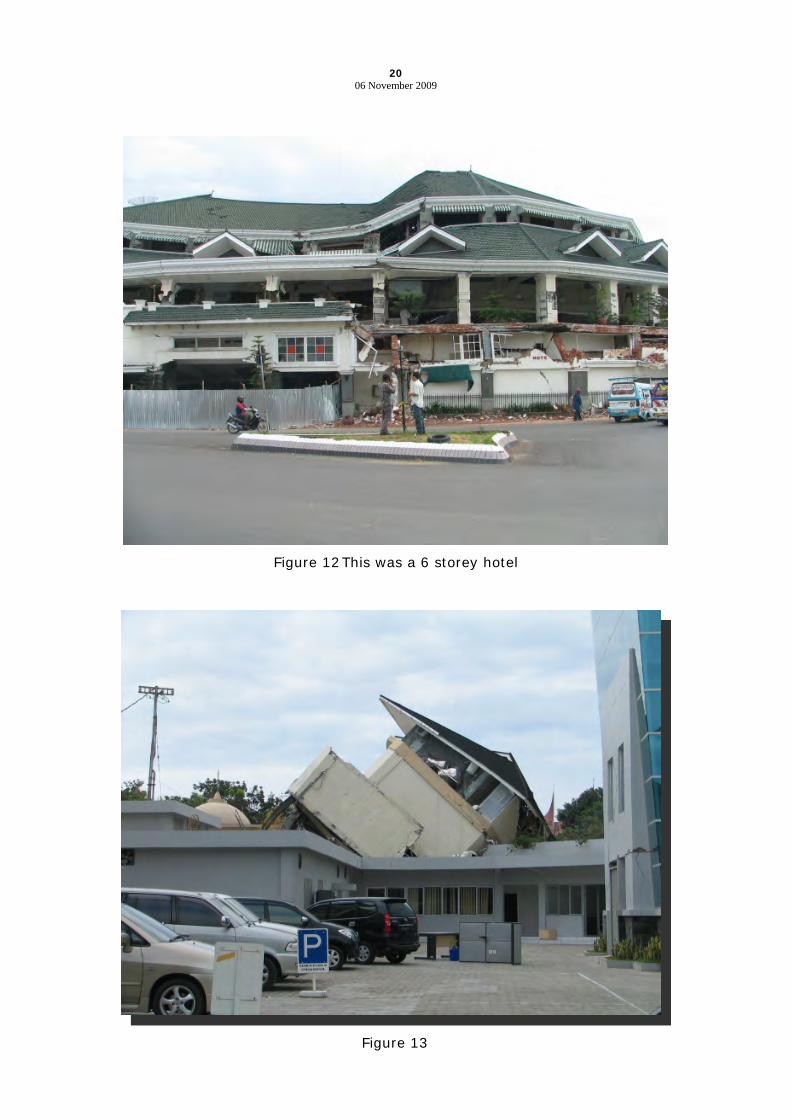
20 06 November 2009
Figure 12 This was a 6 storey hotel
Figure 13
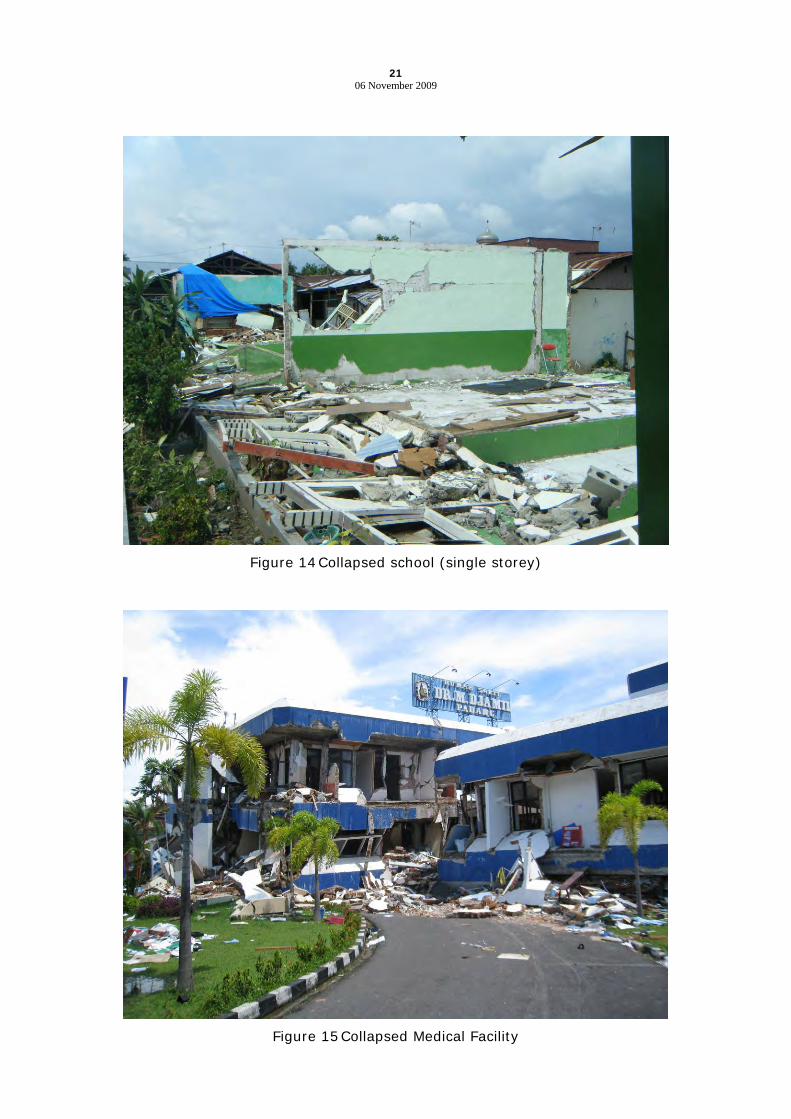
21 06 November 2009
Figure 14 Collapsed school (single storey)
Figure 15 Collapsed Medical Facility

22 06 November 2009
Figure 16 School abandoned
Figure 17 School very near collapse

23 06 November 2009
Figure 18
Figure 19 Soft Storey (commercial shop-front) Ground Floor Collapse
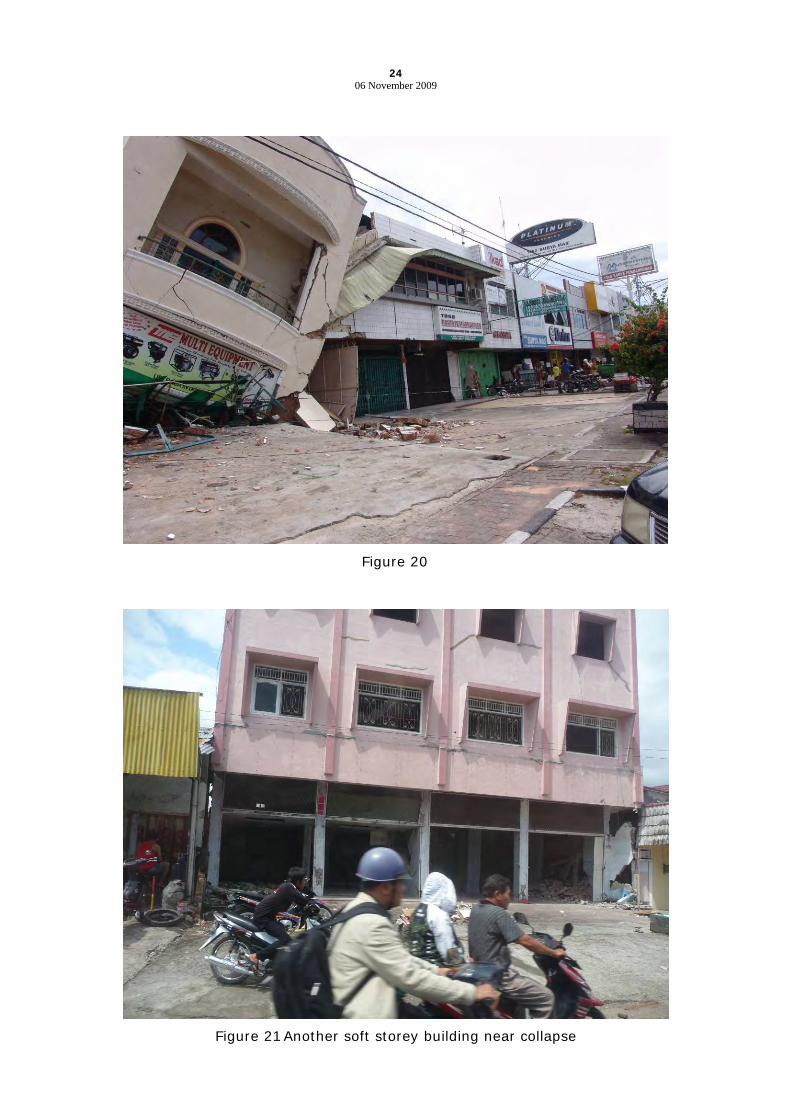
24 06 November 2009
Figure 20
Figure 21 Another soft storey building near collapse
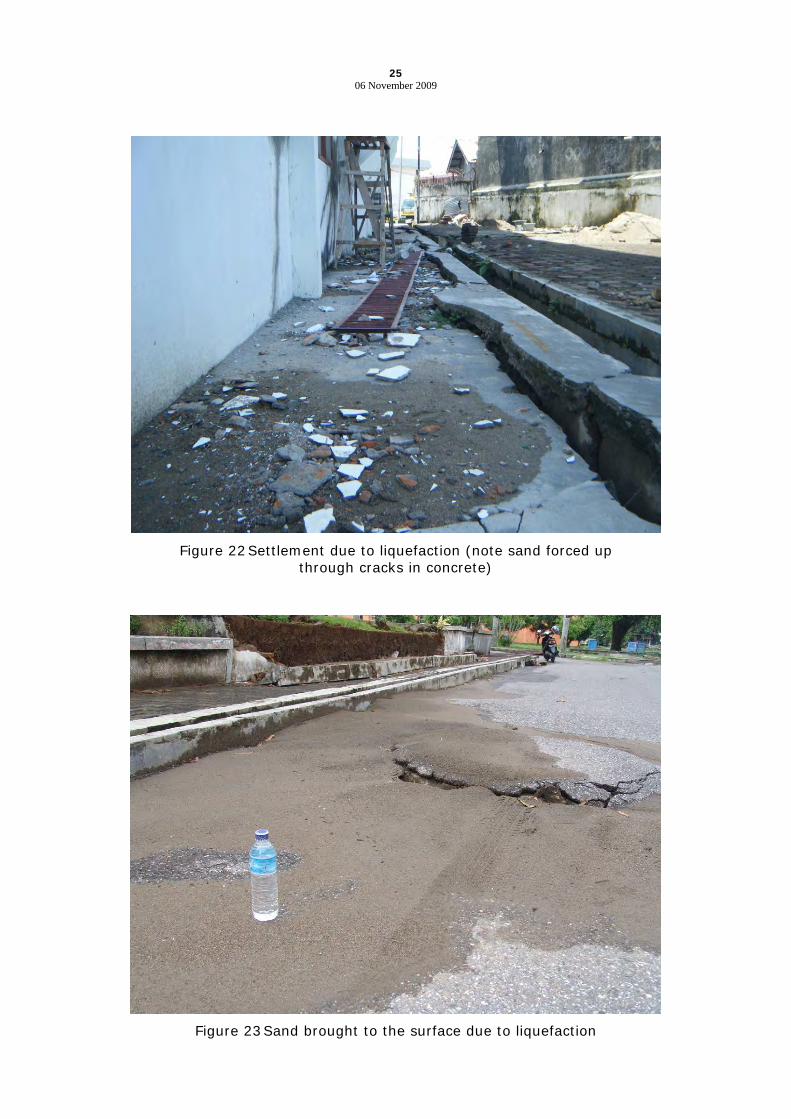
25 06 November 2009
Figure 22 Settlement due to liquefaction (note sand forced up through cracks in concrete)
Figure 23 Sand brought to the surface due to liquefaction

26 06 November 2009
Figure 24 Liquefaction caused heavier buildings to sink
Figure 25

The 30th September 2009 West Sumatra Earthquake Padang Region Damage Survey
Appendix A3 MASW Study
FINAL REPORT
An Enhanced Understanding of the Vulnerability of Buildings to Earthquake in Indonesia
Survey, data analysis and development of vulnerability models:
Peak Ground Acceleration Estimate based on MASW Survey and Existing
Geotechnical Data for City of Padang and Pariaman
Prepared for:
Australian – Indonesia Facility for Disaster Reduction
Prepared by:
CENTER FOR DISASTER MITIGATION
INSTITUT TEKNOLOGI BANDUNG
May 2010
FINAL REPORT
An Enhanced Understanding of the Vulnerability of Buildings to Earthquake in Indonesia
Survey, data analysis and development of vulnerability models:
Peak Ground Acceleration Estimate based on MASW Survey and Existing
Geotechnical Data for City of Padang and Pariaman
Prepared for:
Australian – Indonesia Facility for Disaster Reduction
Prepared by:
Dr. I Wayan Sengara Dr. Gunawan Handayani
Dr. Dedi Apriadi Ir. K.M. Abuhuroyroh
Ir. Hendri Gusti Putra, M.T. (Univ. Andalas)
CENTER FOR DISASTER MITIGATION
INSTITUT TEKNOLOGI BANDUNG
MAY 2010
Final Report Peak Ground Acceleration Estimate based on MASW Survey for City of Padang and Pariaman
LIST OF FIGURES
Figure 2.1. The location of SASW survey points for City of Padang (SASW 1 ~ SASW 30) .................................................................................................... 5
Figure 2.2. The location of SASW survey points for City of Padang Pariaman (SASW 1P ~ SASW 3P) .............................................................................. 6
Figure 2.3. Comparison between the surface wave method and the drilling methods....... 7
Figure 2.4. The overall procedure of Multi Channel Analysis of Surface Waves (MASW) ...................................................................................................... 9
Figure 2.5. The Acquisition data procedure in the field..................................................... 10
Figure 2.6. The seistronix RAS-24 recorder unit ............................................................... 11
Figure 2.7. The inversion process to produce shear wave velocity profile ........................ 11
Figure 2.8. Shear wave velocity as function of depth of the MASW survey at point 01-05 ............................................................................................................ 12
Figure 2.9. Shear wave velocity as function of depth of the MASW survey at point 06-10 ............................................................................................................ 13
Figure 2.10. Shear wave velocity as function of depth of the MASW survey at point 11-15 ............................................................................................................ 13
Figure 2.11. Shear wave velocity as function of depth of the MASW survey at point 16-20 ............................................................................................................ 14
Figure 2.12. Shear wave velocity as function of depth of the MASW survey at point 21-25 ............................................................................................................ 14
Figure 2.13. Shear wave velocity as function of depth of the MASW survey at point 26-30 ............................................................................................................ 15
Figure 2.14. Shear wave velocity as function of depth of the MASW survey at point 1P-3P............................................................................................................ 15
Figure 2.15. Site classification map for city of Padang based on the recent MASW’s average shear wave velocity ........................................................................ 24
Figure 2.16. Site classification map for city of Padang based on the previous geotechnical investigation............................................................................ 25
Figure 2.17. Combined Site classification map for city of Padang based on the recent MASW survey and previous geotechnical investigation............................. 26
Figure 2.18. Combined Site classification map for city of Pariaman based on the recent MASW survey and previous geotechnical investigation .................. 27
Figure 3.1. Epicenter and tomographical cross section of West Sumatra earthquake, September 30, 2009 ..................................................................................... 30
Figure 3.2. Deterministic baserock spectra result in Padang City developed using........... 31
ii
Final Report Peak Ground Acceleration Estimate based on MASW Survey for City of Padang and Pariaman
Figure 3.3. Attenuation curve of PBA of September 30, 2009 West Sumatra earthquake.................................................................................................... 31
Figure 3.4. Estimated PBA spatial distribution using Young’s Intraslab attenuation based on 30 September 2010 Padang Earthquake ....................................... 33
Figure 4.1. Spectral Matching, SASW23 (SE)................................................................... 36
Figure 4.2. Scaled Input motion in corresponding to Spectral Matching, SASW23 (SE) (EZ-FRISK 7.32 Strong Motion Database)......................................... 36
Figure 4.3. Spectral Matching, SASW26 (SD) .................................................................. 37
Figure 4.4. Scaled Input motion in corresponding to Spectral Matching, SASW26 (SD) (EZ-FRISK 7.32 Strong Motion Database) ........................................ 37
Figure 4.5. Spectral Matching, SASW28 (SC)................................................................... 38
Figure 4.6. Scaled Input motion in corresponding to Spectral Matching, SASW28 (SC) (EZ-FRISK 7.32 Strong Motion Database)......................................... 38
Figure 4.7. Variation of acceleration on the ground layer from base rock to the ground surface for the classification of soft and hard soil ........................... 39
Figure 4.8. Peak Ground Acceleration (PGA) map for the city of Padang ........................ 41
Figure 4.9. Peak Ground Acceleration (PGA) map for the city of Pariaman..................... 42
iii

Final Report Peak Ground Acceleration Estimate based on MASW Survey for City of Padang and Pariaman
iv
LIST OF TABLES
Tabel 2.1. MASW Padang measurement points coordinates ............................................. 3
Tabel 2.2. MASW Pariaman measurement points coordinates .......................................... 4
Tabel 3.1. List of PBA at major cities in West and North Sumatra which are experienced by West Sumatra earthquake, September 30, 2009 ................. 32
Final Report Peak Ground Acceleration Estimate based on MASW Survey for City of Padang and Pariaman
CONTENT 1. INTRODUCTION 1
1.1 Background 1 1.1.1 West Sumatra Earthquake 1 1.1.2 Importance of Ground Shaking in Vulnerability Information 1
1.2 Objectives 2 2 MULTI CHANNEL ANALYSIS OF SURFACE WAVES SURVEY 3
2.1 Introduction 3 2.2 Methodology 6 2.3 MASW Survey Data Analysis 12
3 ANALYSIS OF 30 SEPTEMBER 2009 PADANG EARTHQUAKE EVENT 28 3.1 Introduction 28 3.2 Tectonic Setting and Earthquake History 28 3.3 Seismic Source Modeling 29 3.4 Earthquake Event Analysis 30
4 SITE-RESPONSE ANALYSIS 34 4.1 Introduction 34 4.2 Seismic Wave Propagation Analysis 34
4.2.1 Input Motion 35 4.2.2 Analysis Results 39
APPENDICES Appendix 1 – REPORT OF MULTI CHANNEL ANALYSIS OF SURFACE WAVES FOR CITY OF
PADANG AND PARIAMAN Appendix 2 – MASW SURVEY DOCUMENTATION
v
Final Report Peak Ground Acceleration Estimate based on MASW Survey for City of Padang and Pariaman
CHAPTER 1 1. INTRODUCTION
BACKGROUND
West Sumatra Earthquake
On 30 September 2009 a magnitude 7.6 earthquake strucks offshore the southern coast of
West Sumatra. This event has had widespread impact and BNPB’s reports indicate there
were over 800 deaths and over 130,000 buildings totally destroyed or severely damaged in
the Padang and Padang Pariaman District.
A preliminary survey of damage has been conducted by the Center for Disaster Mitigation-
Institute of Technology Bandung (CDM-ITB) and found that there were a variety of
buildings types that experienced different levels structural damage. In addition, there is
indication that different sites could be subjected to different peak ground acceleration due
to local ground condition within the city of Padang. A more extensive survey is needed,
however, to acquire a statistical meaningful sample of how different building types
performed during the earthquake under different ground shaking. In addition, further
information is required to characterize site response and analysis of the earthquake source
properties, and also to estimate the ground motion these buildings are likely to have
experienced.
Importance of Ground Shaking in Vulnerability Information
Estimating how different types of buildings respond to different ground shaking is essential
in predicting how much building damage might occur from potential future event. This
information is needed for development of vulnerability model of different types of building
constructions. The vulnerability model will correlate damage index or damage ratio of a
particular building construction as a function to ground shaking. The ground shaking is
usually represented by Modified Mercally Intensity (MMI) or Peak Ground (surface)
Acceleration (PGA). Estimation of PGA due to the earthquake that caused corresponding
damages of buildings is of primary importance. This report presents results of seismic
1
Final Report Peak Ground Acceleration Estimate based on MASW Survey for City of Padang and Pariaman
survey and collection of geotechnical data in city of Padang and Pariaman to estimate
spatial distribution of PGA within the city due to 30 September 2009 earthquake.
OBJECTIVES
Objectives of this work are to conduct estimate spatial peak ground acceleration (PGA)
distribution due to 30 September 2009 earthquake. The spatial PGA distribution is
conducted to cover the post disaster surveyed buildings in city of Padang and city of
Pariaman, in the effort to provide PGA value associated with each surveyed building
damages for vulnerability model development. Specific objectives of the work are:
Conduct multi-channel analysis of surface wave (MASW) survey within the city of
Padang and Pariaman.
Conduct analysis of the 30 September 2009 earthquake source properties and
estimation through ground motion attenuation to estimate the level of peak ground
acceleration at reference baserock.
Conduct site-response analyses though wave propagation analysis from base-rock
to ground surface to estimate spatical PGA within the city of Padang and Pariaman.
Provide information for development of vulnerability model for different building
types.
2
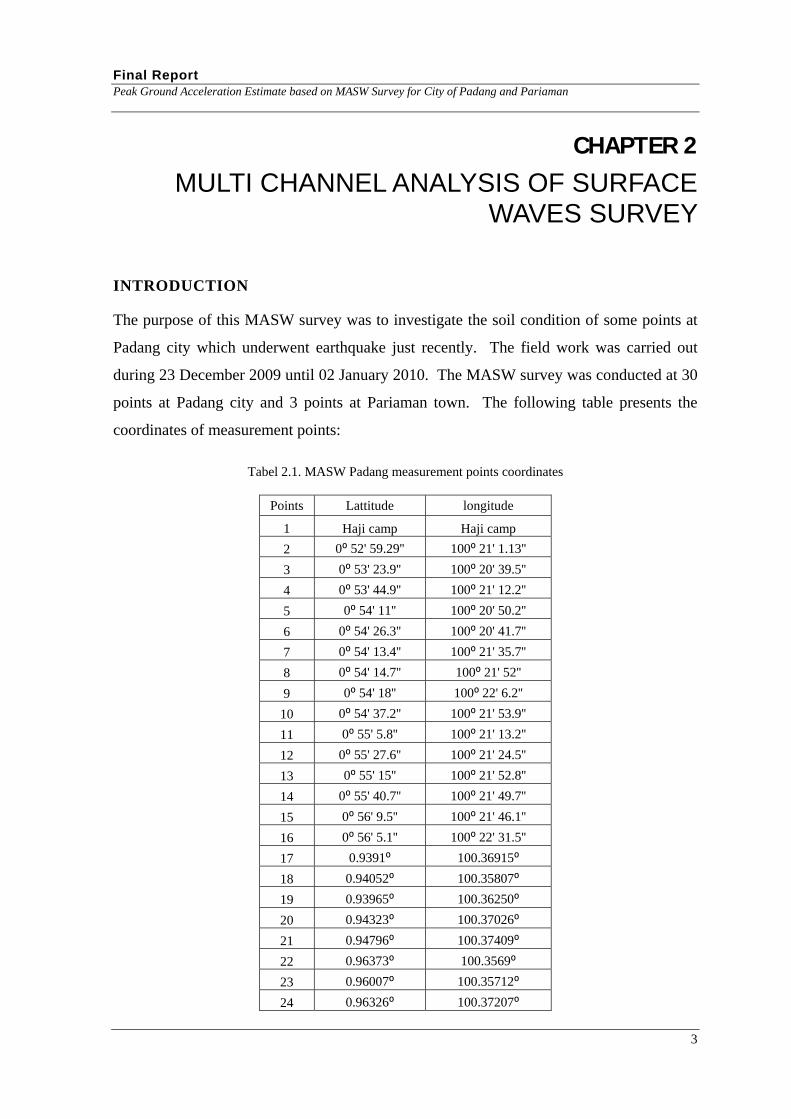
Final Report Peak Ground Acceleration Estimate based on MASW Survey for City of Padang and Pariaman
CHAPTER 2
MULTI CHANNEL ANALYSIS OF SURFACE WAVES SURVEY
INTRODUCTION
The purpose of this MASW survey was to investigate the soil condition of some points at
Padang city which underwent earthquake just recently. The field work was carried out
during 23 December 2009 until 02 January 2010. The MASW survey was conducted at 30
points at Padang city and 3 points at Pariaman town. The following table presents the
coordinates of measurement points:
Tabel 2.1. MASW Padang measurement points coordinates
Points Lattitude longitude
1 Haji camp Haji camp
2 0⁰ 52' 59.29'' 100⁰ 21' 1.13''
3 0⁰ 53' 23.9'' 100⁰ 20' 39.5''
4 0⁰ 53' 44.9'' 100⁰ 21' 12.2''
5 0⁰ 54' 11'' 100⁰ 20' 50.2''
6 0⁰ 54' 26.3'' 100⁰ 20' 41.7''
7 0⁰ 54' 13.4'' 100⁰ 21' 35.7''
8 0⁰ 54' 14.7'' 100⁰ 21' 52''
9 0⁰ 54' 18'' 100⁰ 22' 6.2''
10 0⁰ 54' 37.2'' 100⁰ 21' 53.9''
11 0⁰ 55' 5.8'' 100⁰ 21' 13.2''
12 0⁰ 55' 27.6'' 100⁰ 21' 24.5''
13 0⁰ 55' 15'' 100⁰ 21' 52.8''
14 0⁰ 55' 40.7'' 100⁰ 21' 49.7''
15 0⁰ 56' 9.5'' 100⁰ 21' 46.1''
16 0⁰ 56' 5.1'' 100⁰ 22' 31.5''
17 0.9391⁰ 100.36915⁰
18 0.94052⁰ 100.35807⁰
19 0.93965⁰ 100.36250⁰
20 0.94323⁰ 100.37026⁰
21 0.94796⁰ 100.37409⁰
22 0.96373⁰ 100.3569⁰
23 0.96007⁰ 100.35712⁰
24 0.96326⁰ 100.37207⁰
3

Final Report Peak Ground Acceleration Estimate based on MASW Survey for City of Padang and Pariaman
25 0.95859⁰ 100.36852⁰
26 0.95795⁰ 100.37979⁰
27 0.95492⁰ 100.38563⁰
28 0.94776⁰ 100.39307⁰
29 0.95496⁰ 100.39745⁰
30 0.97417⁰ 100.3826⁰
Tabel 2.2. MASW Pariaman measurement points coordinates
Points Lattitude longitude
1 0.62691⁰ 100.16331⁰
2 0.56650⁰ 100.27780⁰
3 0.59294⁰ 100.28265⁰
Figure 2.1 and Figure 2.2 show the location map of MASW survey points.
4
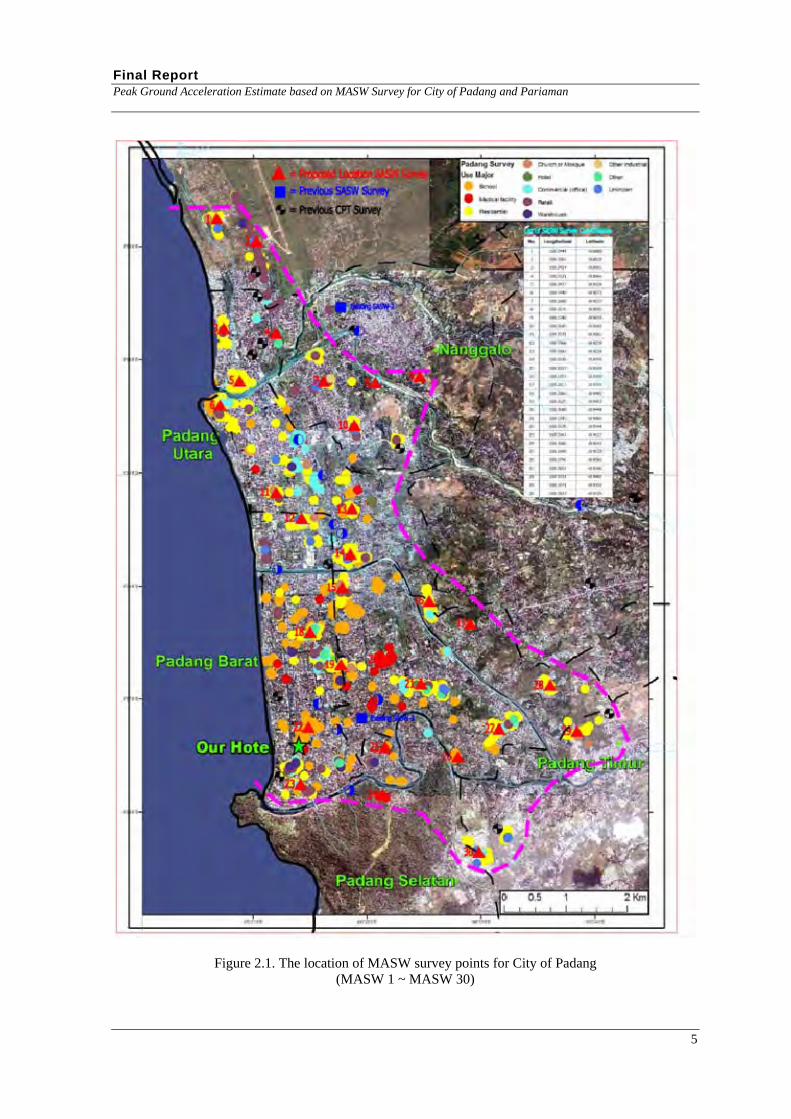
Final Report Peak Ground Acceleration Estimate based on MASW Survey for City of Padang and Pariaman
Figure 2.1. The location of MASW survey points for City of Padang (MASW 1 ~ MASW 30)
5
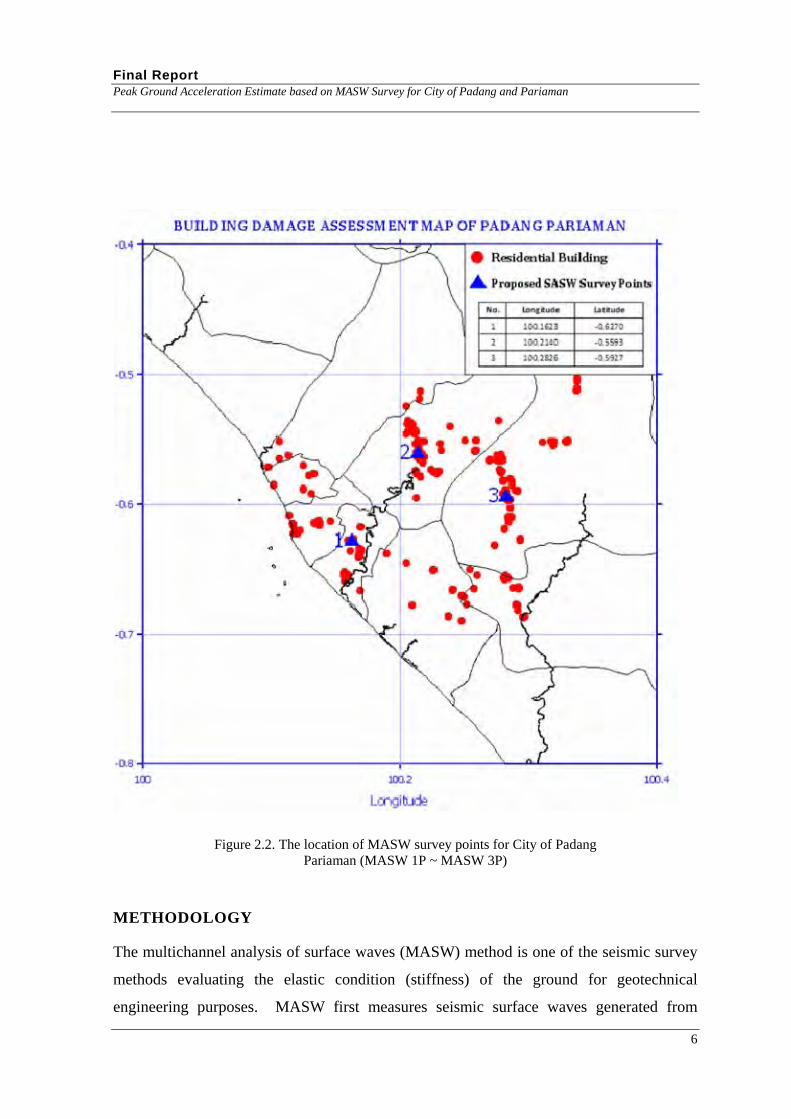
Final Report Peak Ground Acceleration Estimate based on MASW Survey for City of Padang and Pariaman
Figure 2.2. The location of MASW survey points for City of Padang Pariaman (MASW 1P ~ MASW 3P)
METHODOLOGY
The multichannel analysis of surface waves (MASW) method is one of the seismic survey
methods evaluating the elastic condition (stiffness) of the ground for geotechnical
engineering purposes. MASW first measures seismic surface waves generated from
6
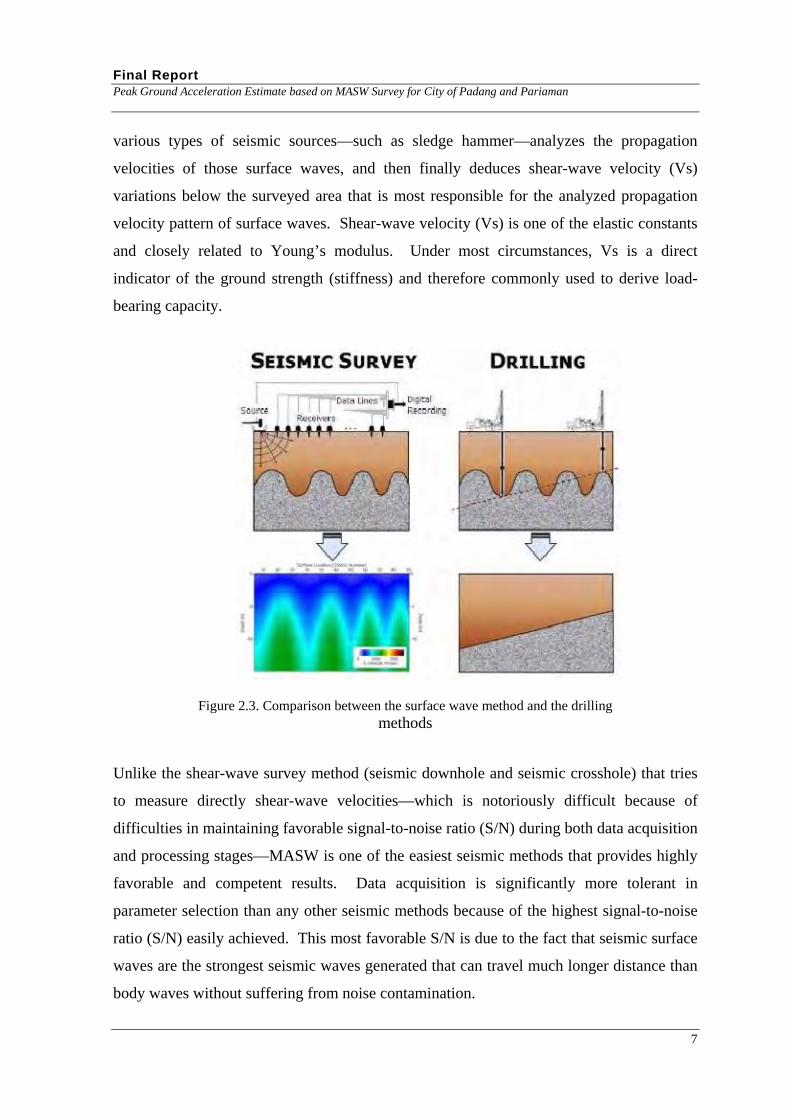
Final Report Peak Ground Acceleration Estimate based on MASW Survey for City of Padang and Pariaman
various types of seismic sources—such as sledge hammer—analyzes the propagation
velocities of those surface waves, and then finally deduces shear-wave velocity (Vs)
variations below the surveyed area that is most responsible for the analyzed propagation
velocity pattern of surface waves. Shear-wave velocity (Vs) is one of the elastic constants
and closely related to Young’s modulus. Under most circumstances, Vs is a direct
indicator of the ground strength (stiffness) and therefore commonly used to derive load-
bearing capacity.
Figure 2.3. Comparison between the surface wave method and the drilling methods
Unlike the shear-wave survey method (seismic downhole and seismic crosshole) that tries
to measure directly shear-wave velocities—which is notoriously difficult because of
difficulties in maintaining favorable signal-to-noise ratio (S/N) during both data acquisition
and processing stages—MASW is one of the easiest seismic methods that provides highly
favorable and competent results. Data acquisition is significantly more tolerant in
parameter selection than any other seismic methods because of the highest signal-to-noise
ratio (S/N) easily achieved. This most favorable S/N is due to the fact that seismic surface
waves are the strongest seismic waves generated that can travel much longer distance than
body waves without suffering from noise contamination.
7
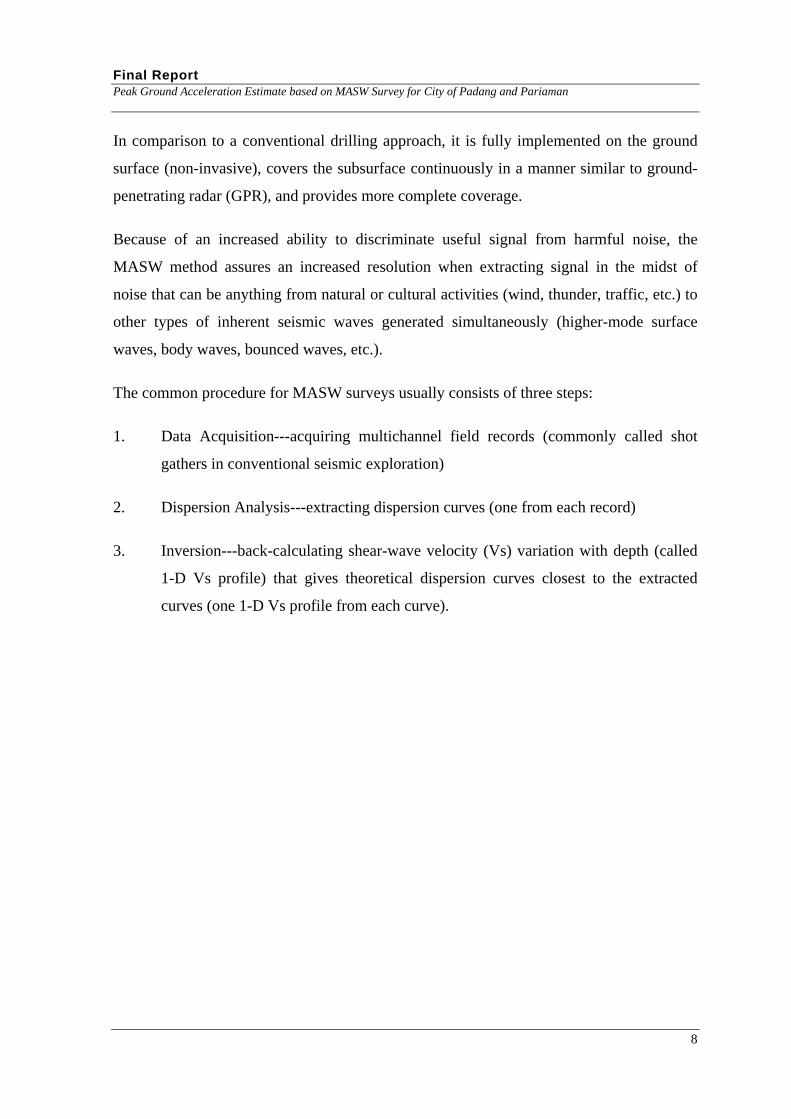
Final Report Peak Ground Acceleration Estimate based on MASW Survey for City of Padang and Pariaman
In comparison to a conventional drilling approach, it is fully implemented on the ground
surface (non-invasive), covers the subsurface continuously in a manner similar to ground-
penetrating radar (GPR), and provides more complete coverage.
Because of an increased ability to discriminate useful signal from harmful noise, the
MASW method assures an increased resolution when extracting signal in the midst of
noise that can be anything from natural or cultural activities (wind, thunder, traffic, etc.) to
other types of inherent seismic waves generated simultaneously (higher-mode surface
waves, body waves, bounced waves, etc.).
The common procedure for MASW surveys usually consists of three steps:
1. Data Acquisition---acquiring multichannel field records (commonly called shot
gathers in conventional seismic exploration)
2. Dispersion Analysis---extracting dispersion curves (one from each record)
3. Inversion---back-calculating shear-wave velocity (Vs) variation with depth (called
1-D Vs profile) that gives theoretical dispersion curves closest to the extracted
curves (one 1-D Vs profile from each curve).
8

Final Report Peak Ground Acceleration Estimate based on MASW Survey for City of Padang and Pariaman
Figure 2.4. The overall procedure of Multi Channel Analysis of Surface Waves (MASW)
9
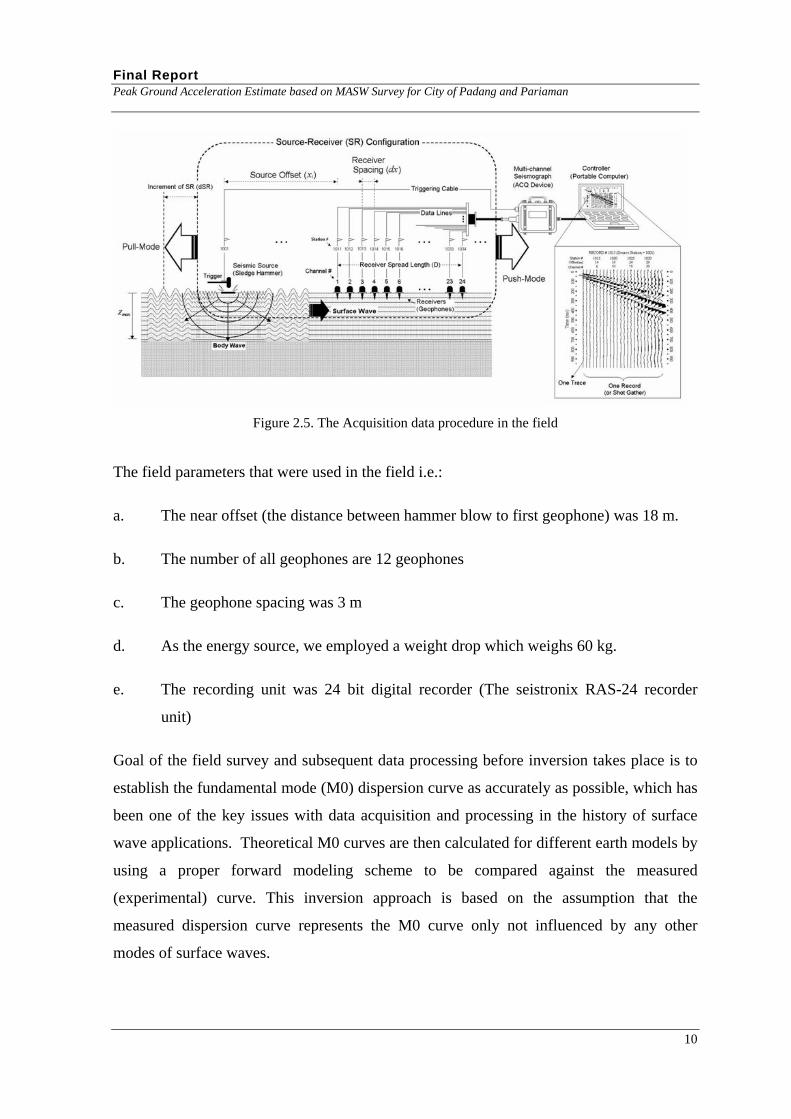
Final Report Peak Ground Acceleration Estimate based on MASW Survey for City of Padang and Pariaman
Figure 2.5. The Acquisition data procedure in the field
The field parameters that were used in the field i.e.:
a. The near offset (the distance between hammer blow to first geophone) was 18 m.
b. The number of all geophones are 12 geophones
c. The geophone spacing was 3 m
d. As the energy source, we employed a weight drop which weighs 60 kg.
e. The recording unit was 24 bit digital recorder (The seistronix RAS-24 recorder
unit)
Goal of the field survey and subsequent data processing before inversion takes place is to
establish the fundamental mode (M0) dispersion curve as accurately as possible, which has
been one of the key issues with data acquisition and processing in the history of surface
wave applications. Theoretical M0 curves are then calculated for different earth models by
using a proper forward modeling scheme to be compared against the measured
(experimental) curve. This inversion approach is based on the assumption that the
measured dispersion curve represents the M0 curve only not influenced by any other
modes of surface waves.
10
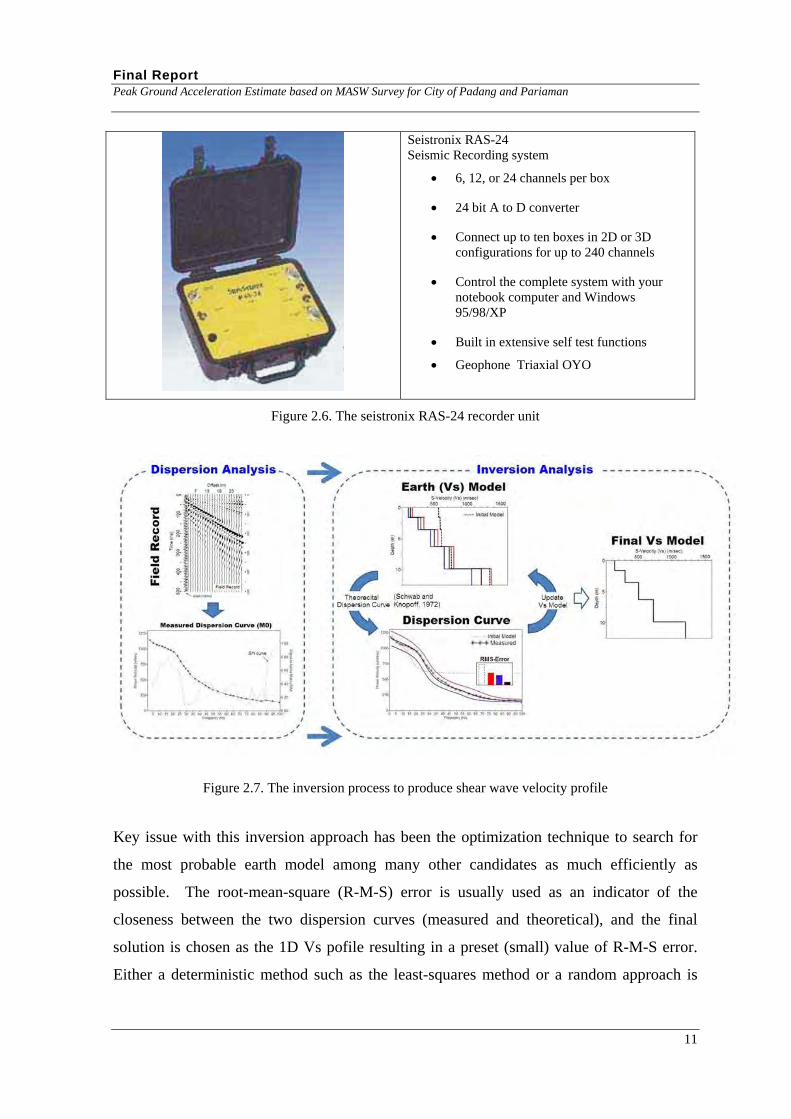
Final Report Peak Ground Acceleration Estimate based on MASW Survey for City of Padang and Pariaman
Seistronix RAS-24 Seismic Recording system
6, 12, or 24 channels per box
24 bit A to D converter
Connect up to ten boxes in 2D or 3D configurations for up to 240 channels
Control the complete system with your notebook computer and Windows 95/98/XP
Built in extensive self test functions
Geophone Triaxial OYO
Figure 2.6. The seistronix RAS-24 recorder unit
Figure 2.7. The inversion process to produce shear wave velocity profile
Key issue with this inversion approach has been the optimization technique to search for
the most probable earth model among many other candidates as much efficiently as
possible. The root-mean-square (R-M-S) error is usually used as an indicator of the
closeness between the two dispersion curves (measured and theoretical), and the final
solution is chosen as the 1D Vs pofile resulting in a preset (small) value of R-M-S error.
Either a deterministic method such as the least-squares method or a random approach is
11
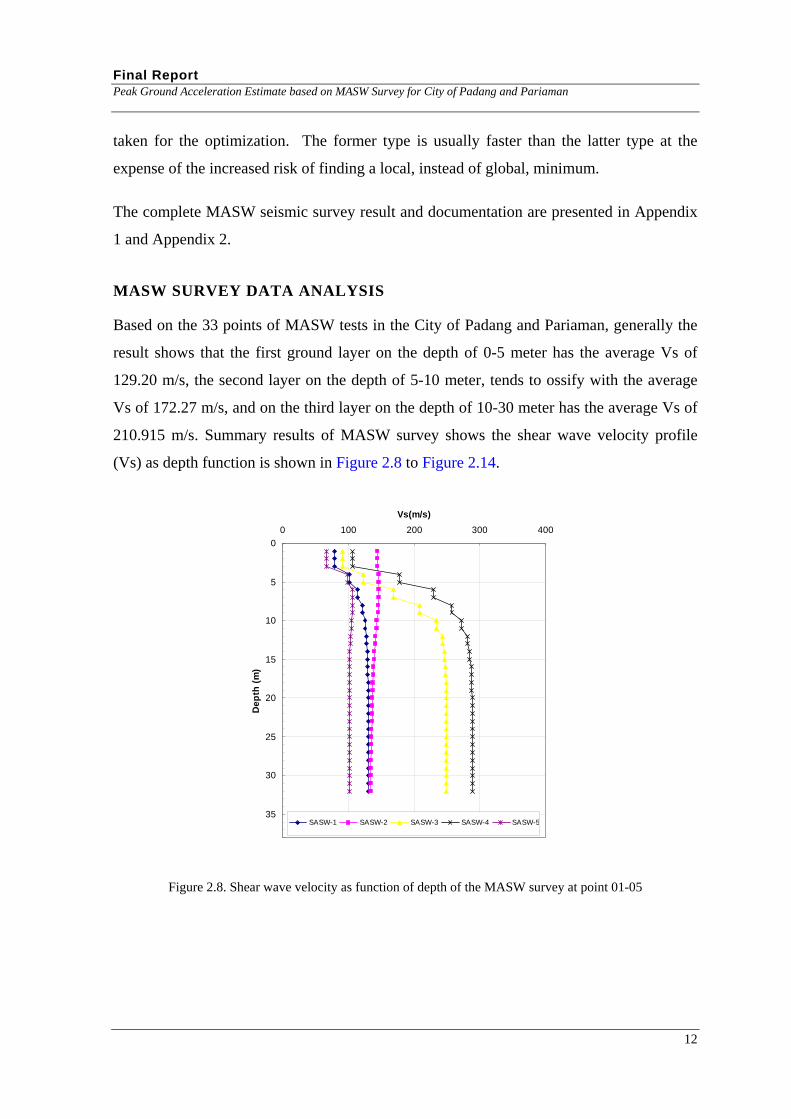
Final Report Peak Ground Acceleration Estimate based on MASW Survey for City of Padang and Pariaman
12
taken for the optimization. The former type is usually faster than the latter type at the
expense of the increased risk of finding a local, instead of global, minimum.
The complete MASW seismic survey result and documentation are presented in Appendix
1 and Appendix 2.
MASW SURVEY DATA ANALYSIS
Based on the 33 points of MASW tests in the City of Padang and Pariaman, generally the
result shows that the first ground layer on the depth of 0-5 meter has the average Vs of
129.20 m/s, the second layer on the depth of 5-10 meter, tends to ossify with the average
Vs of 172.27 m/s, and on the third layer on the depth of 10-30 meter has the average Vs of
210.915 m/s. Summary results of MASW survey shows the shear wave velocity profile
(Vs) as depth function is shown in Figure 2.8 to Figure 2.14.
0
5
10
15
20
25
30
35
0 100 200 300 400
Vs(m/s)
De
pth
(m
)
SASW-1 SASW-2 SASW-3 SASW-4 SASW-5
Figure 2.8. Shear wave velocity as function of depth of the MASW survey at point 01-05
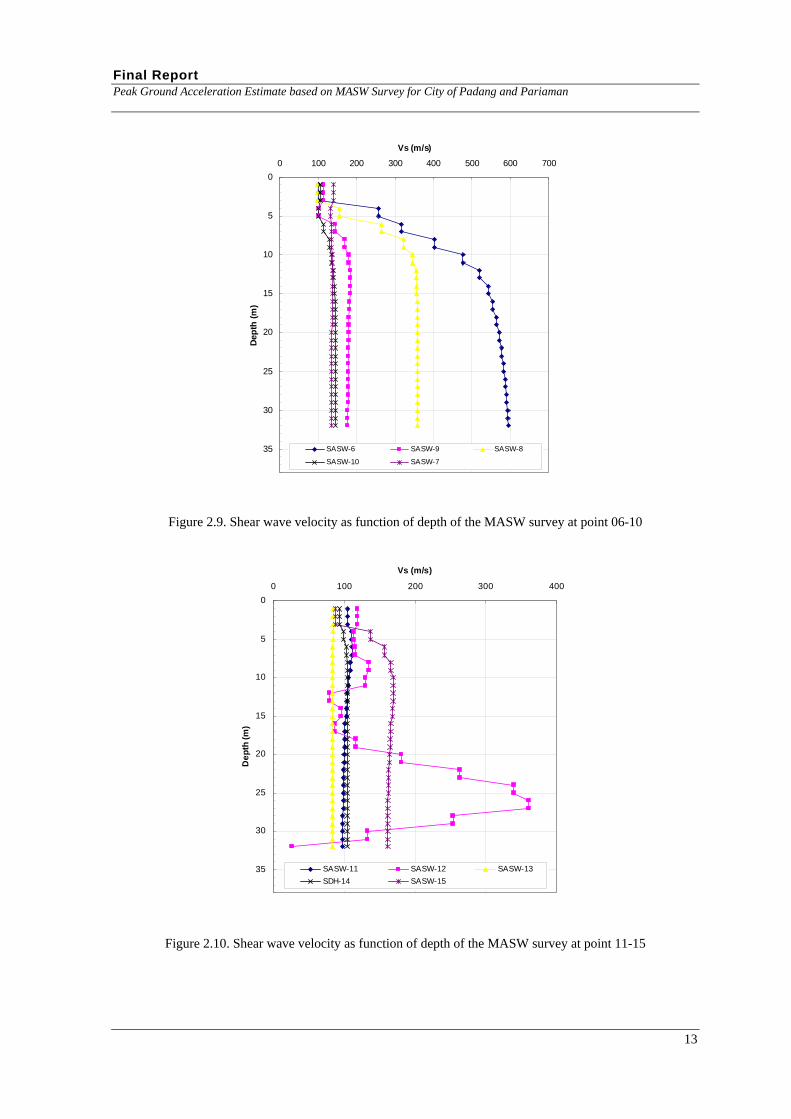
Final Report Peak Ground Acceleration Estimate based on MASW Survey for City of Padang and Pariaman
0
5
10
15
20
25
30
35
0 100 200 300 400 500 600 700
Vs (m/s)
Dep
th (
m)
SASW-6 SASW-9 SASW-8
SASW-10 SASW-7
Figure 2.9. Shear wave velocity as function of depth of the MASW survey at point 06-10
0
5
10
15
20
25
30
35
0 100 200 300 400
Vs (m/s)
De
pth
(m
)
SASW-11 SASW-12 SASW-13
SDH-14 SASW-15
Figure 2.10. Shear wave velocity as function of depth of the MASW survey at point 11-15
13
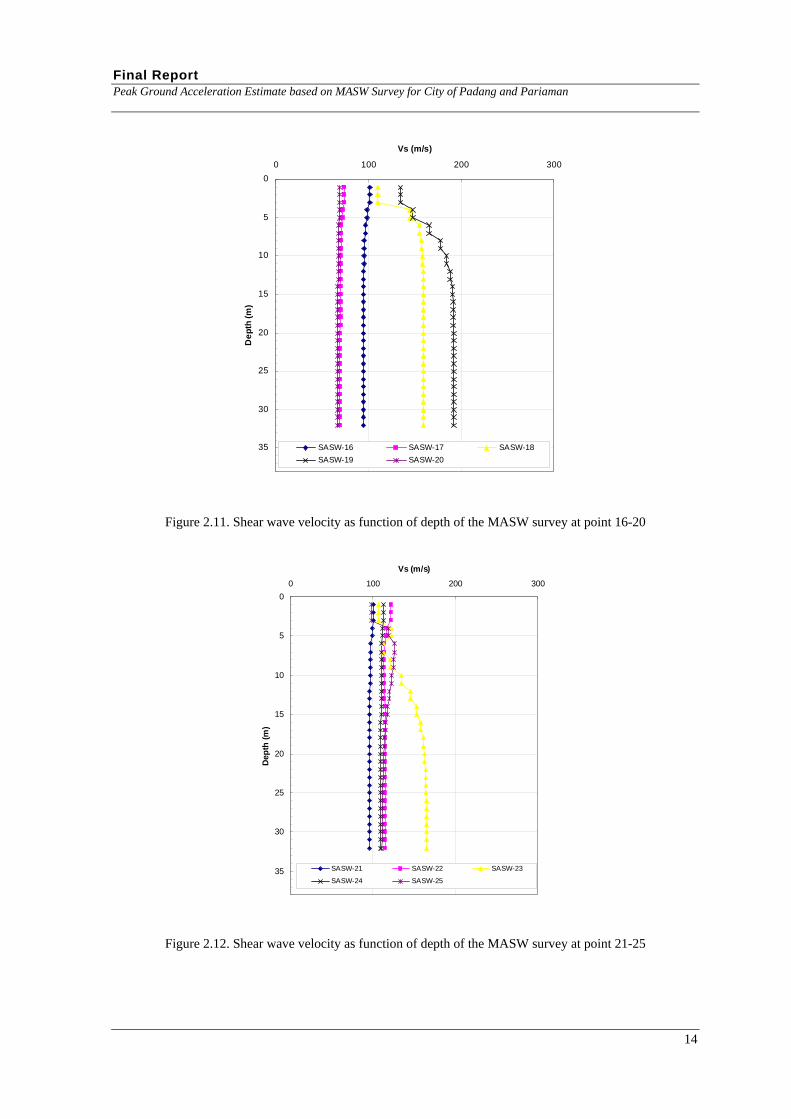
Final Report Peak Ground Acceleration Estimate based on MASW Survey for City of Padang and Pariaman
0
5
10
15
20
25
30
35
0 100 200 300
Vs (m/s)
De
pth
(m
)
SASW-16 SASW-17 SASW-18
SASW-19 SASW-20
Figure 2.11. Shear wave velocity as function of depth of the MASW survey at point 16-20
0
5
10
15
20
25
30
35
0 100 200 300
Vs (m/s)
Dep
th (
m)
SASW-21 SASW-22 SASW-23
SASW-24 SASW-25
Figure 2.12. Shear wave velocity as function of depth of the MASW survey at point 21-25
14
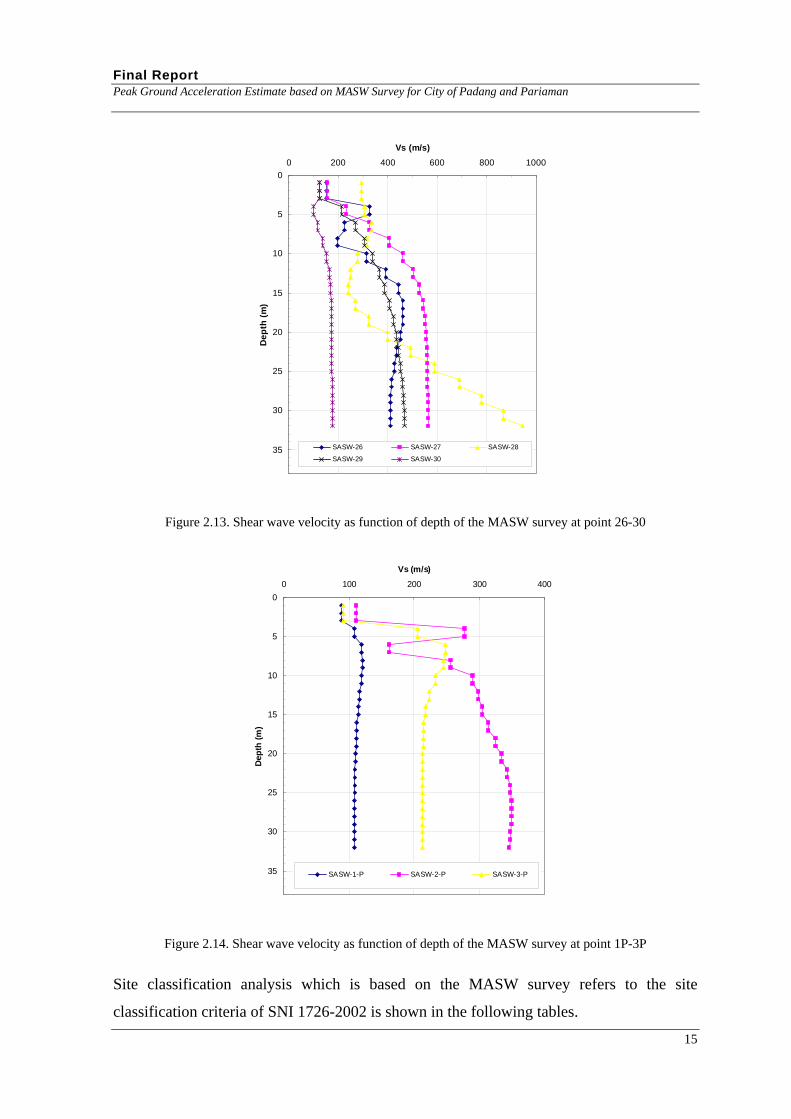
Final Report Peak Ground Acceleration Estimate based on MASW Survey for City of Padang and Pariaman
0
5
10
15
20
25
30
35
0 200 400 600 800 1000
Vs (m/s)
De
pth
(m
)
SASW-26 SASW-27 SASW-28
SASW-29 SASW-30
Figure 2.13. Shear wave velocity as function of depth of the MASW survey at point 26-30
0
5
10
15
20
25
30
35
0 100 200 300 400
Vs (m/s)
Dep
th (
m)
SASW-1-P SASW-2-P SASW-3-P
Figure 2.14. Shear wave velocity as function of depth of the MASW survey at point 1P-3P
Site classification analysis which is based on the MASW survey refers to the site
classification criteria of SNI 1726-2002 is shown in the following tables.
15

Final Report Peak Ground Acceleration Estimate based on MASW Survey for City of Padang and Pariaman
Depth SASW-1 di/Vsi SASW-2 di/Vsi SASW-3 di/Vsi SASW-4 di/Vsi1 79.444 0.01 144.11 0.01 91.538 0.01 105.99 0.012 79.444 0.01 144.11 0.01 91.538 0.01 105.99 0.013 79.444 0.01 144.11 0.01 91.538 0.01 105.99 0.014 100.89 0.01 146.63 0.01 121.85 0.01 177.95 0.015 100.89 0.01 146.63 0.01 121.85 0.01 177.95 0.016 114.01 0.01 146.66 0.01 168.06 0.01 229.68 0.007 114.01 0.01 146.66 0.01 168.06 0.01 229.68 0.008 121.49 0.01 145.14 0.01 208.31 0.00 257.77 0.009 121.49 0.01 145.14 0.01 208.31 0.00 257.77 0.0010 125.6 0.01 143.13 0.01 233.98 0.00 272.47 0.0011 125.6 0.01 143.13 0.01 233.98 0.00 272.47 0.0012 127.79 0.01 141.21 0.01 243.62 0.00 280.22 0.0013 127.79 0.01 141.21 0.01 243.62 0.00 280.22 0.0014 128.97 0.01 139.58 0.01 246.77 0.00 284.33 0.0015 128.97 0.01 139.58 0.01 246.77 0.00 284.33 0.0016 129.62 0.01 138.26 0.01 247.94 0.00 286.51 0.0017 129.62 0.01 138.26 0.01 247.94 0.00 286.51 0.0018 129.99 0.01 137.24 0.01 248.43 0.00 287.69 0.0019 129.99 0.01 137.24 0.01 248.43 0.00 287.69 0.0020 130.19 0.01 136.46 0.01 248.64 0.00 288.32 0.0021 130.19 0.01 136.46 0.01 248.64 0.00 288.32 0.0022 130.31 0.01 135.86 0.01 248.74 0.00 288.67 0.0023 130.31 0.01 135.86 0.01 248.74 0.00 288.67 0.0024 130.38 0.01 135.41 0.01 248.79 0.00 288.85 0.0025 130.38 0.01 135.41 0.01 248.79 0.00 288.85 0.0026 130.42 0.01 135.07 0.01 248.81 0.00 288.95 0.0027 130.42 0.01 135.07 0.01 248.81 0.00 288.95 0.0028 130.44 0.01 134.82 0.01 248.82 0.00 289.00 0.0029 130.44 0.01 134.82 0.01 248.82 0.00 289.00 0.0030 130.45 0.01 134.63 0.01 248.82 0.00 289.03 0.0031 130.45 0.01 134.63 0.01 248.82 0.00 289.03 0.0032 130.46 0.01 134.49 0.01 248.82 0.00 289.05 0.00
32/Σdi/VsiSoil Type SD
118.8697041SE
139.4591497SE SD
195.2126905 234.4927537
16

Final Report Peak Ground Acceleration Estimate based on MASW Survey for City of Padang and Pariaman
Depth SASW-5 di/Vsi SASW-6 di/Vsi SASW-7 di/Vsi SASW-8 di/Vsi1 66.004 0.02 102 0.01 140.53 0.01 98.328 0.012 66.004 0.02 102 0.01 140.53 0.01 98.328 0.013 66.004 0.02 102 0.01 140.53 0.01 98.328 0.014 98.602 0.01 257.65 0.00 133.22 0.01 155.61 0.015 98.602 0.01 257.65 0.00 133.22 0.01 155.61 0.016 106.21 0.01 315.78 0.00 134.07 0.01 264.61 0.007 106.21 0.01 315.78 0.00 134.07 0.01 264.61 0.008 106.03 0.01 403.9 0.00 136.69 0.01 323.48 0.009 106.03 0.01 403.9 0.00 136.69 0.01 323.48 0.0010 104.39 0.01 478.03 0.00 138.13 0.01 346.98 0.0011 104.39 0.01 478.03 0.00 138.13 0.01 346.98 0.0012 103.05 0.01 520.53 0.00 138.46 0.01 355.2 0.0013 103.05 0.01 520.53 0.00 138.46 0.01 355.2 0.0014 102.21 0.01 542.88 0.00 138.18 0.01 357.66 0.0015 102.21 0.01 542.88 0.00 138.18 0.01 357.66 0.0016 101.75 0.01 554.33 0.00 137.71 0.01 358.36 0.0017 101.75 0.01 554.33 0.00 137.71 0.01 358.36 0.0018 101.52 0.01 564.24 0.00 137.25 0.01 358.55 0.0019 101.52 0.01 564.24 0.00 137.25 0.01 358.55 0.0020 101.41 0.01 571.81 0.00 136.86 0.01 358.59 0.0021 101.41 0.01 571.81 0.00 136.86 0.01 358.59 0.0022 101.36 0.01 578.00 0.00 136.57 0.01 358.60 0.0023 101.36 0.01 578.00 0.00 136.57 0.01 358.60 0.0024 101.33 0.01 583.27 0.00 136.36 0.01 358.61 0.0025 101.33 0.01 583.27 0.00 136.36 0.01 358.61 0.0026 101.32 0.01 587.47 0.00 136.21 0.01 358.61 0.0027 101.32 0.01 587.47 0.00 136.21 0.01 358.61 0.0028 101.31 0.01 590.80 0.00 136.10 0.01 358.61 0.0029 101.31 0.01 590.80 0.00 136.10 0.01 358.61 0.0030 101.31 0.01 593.4 0.00 136.03 0.01 358.61 0.0031 101.31 0.01 593.4 0.00 136.03 0.01 358.61 0.0032 101.31 0.01 595.42 0.00 135.98 0.01 358.61 0.00
32/Σdi/VsiSoil Type SE SD SE SD
136.8910489 263.372461397.20427258 357.3480969
17

Final Report Peak Ground Acceleration Estimate based on MASW Survey for City of Padang and Pariaman
Depth SASW-9 di/Vsi SASW-10 di/Vsi SASW-11 di/Vsi SASW-12 di/Vsi1 115.05 0.01 107.38 0.01 105.73 0.01 118.55 0.012 115.05 0.01 107.38 0.01 105.73 0.01 118.55 0.013 115.05 0.01 107.38 0.01 105.73 0.01 118.55 0.014 102.99 0.01 101.49 0.01 110.86 0.01 113.23 0.015 102.99 0.01 101.49 0.01 110.86 0.01 113.23 0.016 145.33 0.01 115.63 0.01 111.38 0.01 116.27 0.017 145.33 0.01 115.63 0.01 111.38 0.01 116.27 0.018 170.51 0.01 128.24 0.01 109.39 0.01 135.16 0.019 170.51 0.01 128.24 0.01 109.39 0.01 135.16 0.0110 180.85 0.01 136.37 0.01 106.94 0.01 130.62 0.0111 180.85 0.01 136.37 0.01 106.94 0.01 130.62 0.0112 183.65 0.01 141.21 0.01 104.78 0.01 79.133 0.0113 183.65 0.01 141.21 0.01 104.78 0.01 79.133 0.0114 183.41 0.01 143.94 0.01 103.06 0.01 95.828 0.0115 183.41 0.01 143.94 0.01 103.06 0.01 95.828 0.0116 182.07 0.01 145.44 0.01 101.77 0.01 86.802 0.0117 182.07 0.01 145.44 0.01 101.77 0.01 86.802 0.0118 180.69 0.01 146.24 0.01 100.8 0.01 117.13 0.0119 180.69 0.01 146.24 0.01 100.8 0.01 117.13 0.0120 179.61 0.01 146.66 0.01 100.09 0.01 180.58 0.0121 179.61 0.01 146.66 0.01 100.09 0.01 180.58 0.0122 178.79 0.01 146.87 0.01 99.55 0.01 263.23 0.0023 178.79 0.01 146.87 0.01 99.55 0.01 263.23 0.0024 178.25 0.01 146.98 0.01 99.16 0.01 339.66 0.0025 178.25 0.01 146.98 0.01 99.16 0.01 339.66 0.0026 177.92 0.01 147.04 0.01 98.87 0.01 360.29 0.0027 177.92 0.01 147.04 0.01 98.87 0.01 360.29 0.0028 177.70 0.01 147.07 0.01 98.65 0.01 254.41 0.0029 177.70 0.01 147.07 0.01 98.65 0.01 254.41 0.0030 177.57 0.01 147.08 0.01 98.493 0.01 133.08 0.0131 177.57 0.01 147.08 0.01 98.493 0.01 133.08 0.0132 177.49 0.01 147.09 0.01 98.371 0.01 26.409 0.04
32/Σdi/VsiSoil Type SE SESE SE
103.0406469 119.6672357160.9427986 133.8086869
18
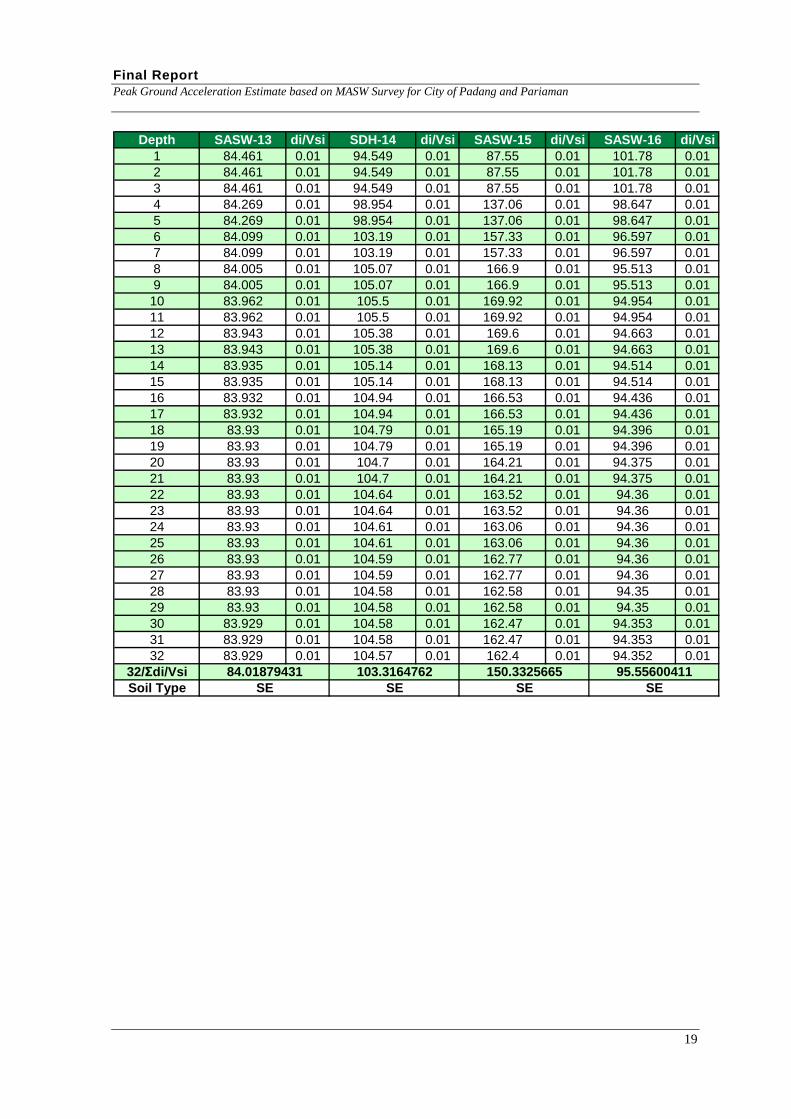
Final Report Peak Ground Acceleration Estimate based on MASW Survey for City of Padang and Pariaman
Depth SASW-13 di/Vsi SDH-14 di/Vsi SASW-15 di/Vsi SASW-16 di/Vsi1 84.461 0.01 94.549 0.01 87.55 0.01 101.78 0.012 84.461 0.01 94.549 0.01 87.55 0.01 101.78 0.013 84.461 0.01 94.549 0.01 87.55 0.01 101.78 0.014 84.269 0.01 98.954 0.01 137.06 0.01 98.647 0.015 84.269 0.01 98.954 0.01 137.06 0.01 98.647 0.016 84.099 0.01 103.19 0.01 157.33 0.01 96.597 0.017 84.099 0.01 103.19 0.01 157.33 0.01 96.597 0.018 84.005 0.01 105.07 0.01 166.9 0.01 95.513 0.019 84.005 0.01 105.07 0.01 166.9 0.01 95.513 0.0110 83.962 0.01 105.5 0.01 169.92 0.01 94.954 0.0111 83.962 0.01 105.5 0.01 169.92 0.01 94.954 0.0112 83.943 0.01 105.38 0.01 169.6 0.01 94.663 0.0113 83.943 0.01 105.38 0.01 169.6 0.01 94.663 0.0114 83.935 0.01 105.14 0.01 168.13 0.01 94.514 0.0115 83.935 0.01 105.14 0.01 168.13 0.01 94.514 0.0116 83.932 0.01 104.94 0.01 166.53 0.01 94.436 0.0117 83.932 0.01 104.94 0.01 166.53 0.01 94.436 0.0118 83.93 0.01 104.79 0.01 165.19 0.01 94.396 0.0119 83.93 0.01 104.79 0.01 165.19 0.01 94.396 0.0120 83.93 0.01 104.7 0.01 164.21 0.01 94.375 0.0121 83.93 0.01 104.7 0.01 164.21 0.01 94.375 0.0122 83.93 0.01 104.64 0.01 163.52 0.01 94.36 0.0123 83.93 0.01 104.64 0.01 163.52 0.01 94.36 0.0124 83.93 0.01 104.61 0.01 163.06 0.01 94.36 0.0125 83.93 0.01 104.61 0.01 163.06 0.01 94.36 0.0126 83.93 0.01 104.59 0.01 162.77 0.01 94.36 0.0127 83.93 0.01 104.59 0.01 162.77 0.01 94.36 0.0128 83.93 0.01 104.58 0.01 162.58 0.01 94.35 0.0129 83.93 0.01 104.58 0.01 162.58 0.01 94.35 0.0130 83.929 0.01 104.58 0.01 162.47 0.01 94.353 0.0131 83.929 0.01 104.58 0.01 162.47 0.01 94.353 0.0132 83.929 0.01 104.57 0.01 162.4 0.01 94.352 0.01
32/Σdi/VsiSoil Type SE SESE SE
150.3325665 95.5560041184.01879431 103.3164762
19
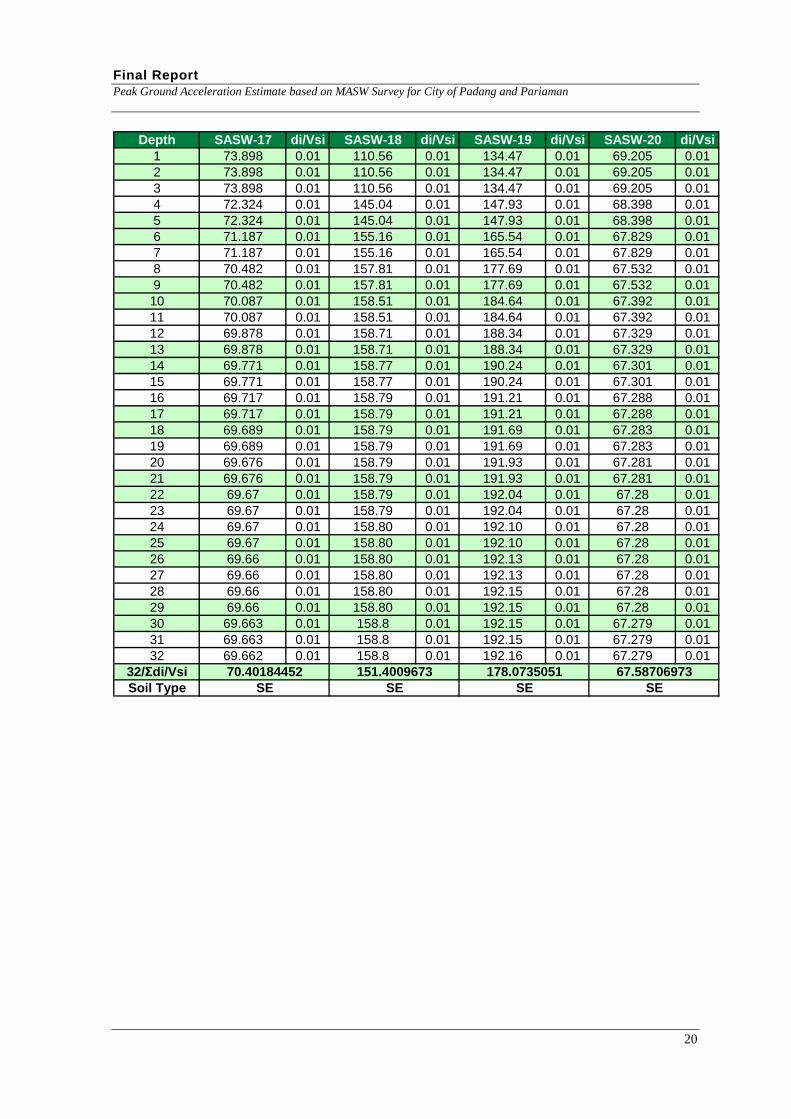
Final Report Peak Ground Acceleration Estimate based on MASW Survey for City of Padang and Pariaman
Depth SASW-17 di/Vsi SASW-18 di/Vsi SASW-19 di/Vsi SASW-20 di/Vsi1 73.898 0.01 110.56 0.01 134.47 0.01 69.205 0.012 73.898 0.01 110.56 0.01 134.47 0.01 69.205 0.013 73.898 0.01 110.56 0.01 134.47 0.01 69.205 0.014 72.324 0.01 145.04 0.01 147.93 0.01 68.398 0.015 72.324 0.01 145.04 0.01 147.93 0.01 68.398 0.016 71.187 0.01 155.16 0.01 165.54 0.01 67.829 0.017 71.187 0.01 155.16 0.01 165.54 0.01 67.829 0.018 70.482 0.01 157.81 0.01 177.69 0.01 67.532 0.019 70.482 0.01 157.81 0.01 177.69 0.01 67.532 0.0110 70.087 0.01 158.51 0.01 184.64 0.01 67.392 0.0111 70.087 0.01 158.51 0.01 184.64 0.01 67.392 0.0112 69.878 0.01 158.71 0.01 188.34 0.01 67.329 0.0113 69.878 0.01 158.71 0.01 188.34 0.01 67.329 0.0114 69.771 0.01 158.77 0.01 190.24 0.01 67.301 0.0115 69.771 0.01 158.77 0.01 190.24 0.01 67.301 0.0116 69.717 0.01 158.79 0.01 191.21 0.01 67.288 0.0117 69.717 0.01 158.79 0.01 191.21 0.01 67.288 0.0118 69.689 0.01 158.79 0.01 191.69 0.01 67.283 0.0119 69.689 0.01 158.79 0.01 191.69 0.01 67.283 0.0120 69.676 0.01 158.79 0.01 191.93 0.01 67.281 0.0121 69.676 0.01 158.79 0.01 191.93 0.01 67.281 0.0122 69.67 0.01 158.79 0.01 192.04 0.01 67.28 0.0123 69.67 0.01 158.79 0.01 192.04 0.01 67.28 0.0124 69.67 0.01 158.80 0.01 192.10 0.01 67.28 0.0125 69.67 0.01 158.80 0.01 192.10 0.01 67.28 0.0126 69.66 0.01 158.80 0.01 192.13 0.01 67.28 0.0127 69.66 0.01 158.80 0.01 192.13 0.01 67.28 0.0128 69.66 0.01 158.80 0.01 192.15 0.01 67.28 0.0129 69.66 0.01 158.80 0.01 192.15 0.01 67.28 0.0130 69.663 0.01 158.8 0.01 192.15 0.01 67.279 0.0131 69.663 0.01 158.8 0.01 192.15 0.01 67.279 0.0132 69.662 0.01 158.8 0.01 192.16 0.01 67.279 0.01
32/Σdi/VsiSoil Type SE SESE SE
178.0735051 67.5870697370.40184452 151.4009673
20
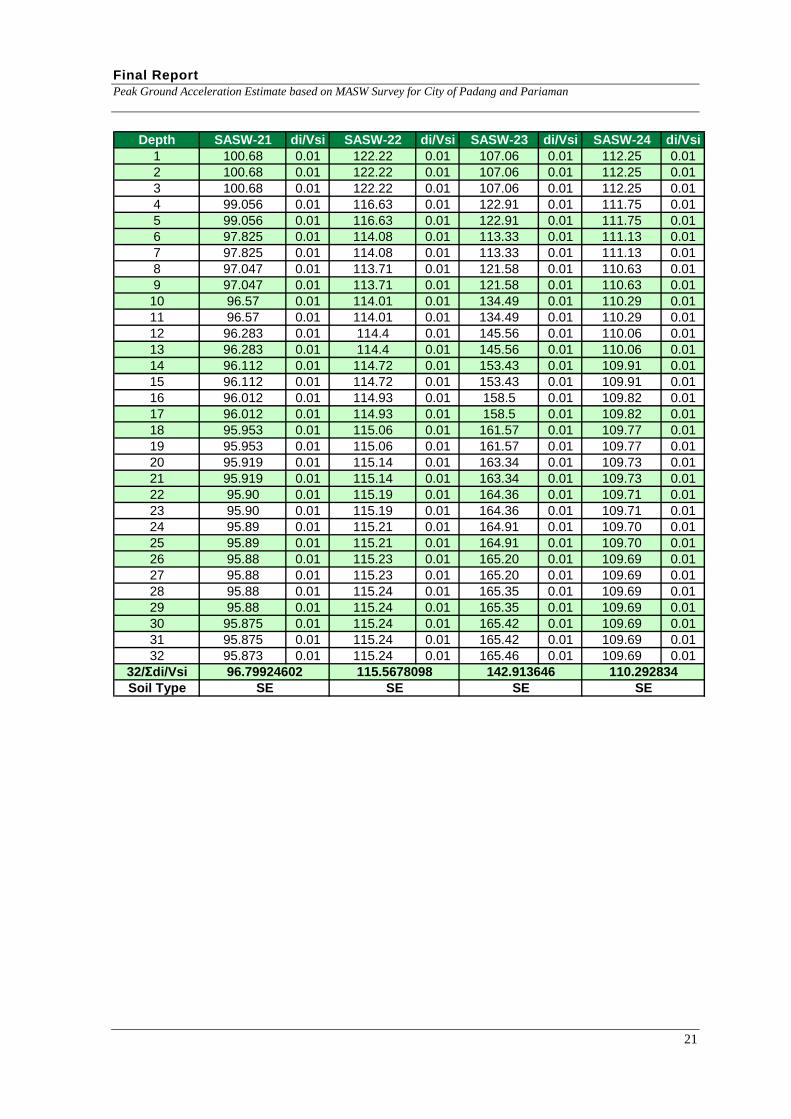
Final Report Peak Ground Acceleration Estimate based on MASW Survey for City of Padang and Pariaman
Depth SASW-21 di/Vsi SASW-22 di/Vsi SASW-23 di/Vsi SASW-24 di/Vsi1 100.68 0.01 122.22 0.01 107.06 0.01 112.25 0.012 100.68 0.01 122.22 0.01 107.06 0.01 112.25 0.013 100.68 0.01 122.22 0.01 107.06 0.01 112.25 0.014 99.056 0.01 116.63 0.01 122.91 0.01 111.75 0.015 99.056 0.01 116.63 0.01 122.91 0.01 111.75 0.016 97.825 0.01 114.08 0.01 113.33 0.01 111.13 0.017 97.825 0.01 114.08 0.01 113.33 0.01 111.13 0.018 97.047 0.01 113.71 0.01 121.58 0.01 110.63 0.019 97.047 0.01 113.71 0.01 121.58 0.01 110.63 0.0110 96.57 0.01 114.01 0.01 134.49 0.01 110.29 0.0111 96.57 0.01 114.01 0.01 134.49 0.01 110.29 0.0112 96.283 0.01 114.4 0.01 145.56 0.01 110.06 0.0113 96.283 0.01 114.4 0.01 145.56 0.01 110.06 0.0114 96.112 0.01 114.72 0.01 153.43 0.01 109.91 0.0115 96.112 0.01 114.72 0.01 153.43 0.01 109.91 0.0116 96.012 0.01 114.93 0.01 158.5 0.01 109.82 0.0117 96.012 0.01 114.93 0.01 158.5 0.01 109.82 0.0118 95.953 0.01 115.06 0.01 161.57 0.01 109.77 0.0119 95.953 0.01 115.06 0.01 161.57 0.01 109.77 0.0120 95.919 0.01 115.14 0.01 163.34 0.01 109.73 0.0121 95.919 0.01 115.14 0.01 163.34 0.01 109.73 0.0122 95.90 0.01 115.19 0.01 164.36 0.01 109.71 0.0123 95.90 0.01 115.19 0.01 164.36 0.01 109.71 0.0124 95.89 0.01 115.21 0.01 164.91 0.01 109.70 0.0125 95.89 0.01 115.21 0.01 164.91 0.01 109.70 0.0126 95.88 0.01 115.23 0.01 165.20 0.01 109.69 0.0127 95.88 0.01 115.23 0.01 165.20 0.01 109.69 0.0128 95.88 0.01 115.24 0.01 165.35 0.01 109.69 0.0129 95.88 0.01 115.24 0.01 165.35 0.01 109.69 0.0130 95.875 0.01 115.24 0.01 165.42 0.01 109.69 0.0131 95.875 0.01 115.24 0.01 165.42 0.01 109.69 0.0132 95.873 0.01 115.24 0.01 165.46 0.01 109.69 0.01
32/Σdi/VsiSoil Type SE SESE SE
142.913646 110.29283496.79924602 115.5678098
21

Final Report Peak Ground Acceleration Estimate based on MASW Survey for City of Padang and Pariaman
Depth SASW-25 di/Vsi SASW-26 di/Vsi SASW-27 di/Vsi SASW-28 di/Vsi1 98.437 0.01 152.47 0.01 154.5 0.01 292.79 0.002 98.437 0.01 152.47 0.01 154.5 0.01 292.79 0.003 98.437 0.01 152.47 0.01 154.5 0.01 292.79 0.004 119.1 0.01 327.14 0.00 231.46 0.00 307.23 0.005 119.1 0.01 327.14 0.00 231.46 0.00 307.23 0.006 125.86 0.01 224.54 0.00 327.61 0.00 333.62 0.007 125.86 0.01 224.54 0.00 327.61 0.00 333.62 0.008 125.43 0.01 196.02 0.01 405.02 0.00 316.06 0.009 125.43 0.01 196.02 0.01 405.02 0.00 316.06 0.0010 122.65 0.01 312.97 0.00 462.24 0.00 278.57 0.0011 122.65 0.01 312.97 0.00 462.24 0.00 278.57 0.0012 119.65 0.01 393.56 0.00 502.01 0.00 248.98 0.0013 119.65 0.01 393.56 0.00 502.01 0.00 248.98 0.0014 117.22 0.01 443.03 0.00 527.63 0.00 239.63 0.0015 117.22 0.01 443.03 0.00 527.63 0.00 239.63 0.0016 115.38 0.01 462.96 0.00 543.08 0.00 268.89 0.0017 115.38 0.01 462.96 0.00 543.08 0.00 268.89 0.0018 114.07 0.01 462.9 0.00 552.01 0.00 324.28 0.0019 114.07 0.01 462.9 0.00 552.01 0.00 324.28 0.0020 113.17 0.01 451.71 0.00 557.08 0.00 399.55 0.0021 113.17 0.01 451.71 0.00 557.08 0.00 399.55 0.0022 112.55 0.01 436.98 0.00 559.93 0.00 492.50 0.0023 112.55 0.01 436.98 0.00 559.93 0.00 492.50 0.0024 112.12 0.01 425.19 0.00 561.53 0.00 590.20 0.0025 112.12 0.01 425.19 0.00 561.53 0.00 590.20 0.0026 111.83 0.01 416.13 0.00 562.42 0.00 687.98 0.0027 111.83 0.01 416.13 0.00 562.42 0.00 687.98 0.0028 111.63 0.01 411.16 0.00 562.90 0.00 779.70 0.0029 111.63 0.01 411.16 0.00 562.90 0.00 779.70 0.0030 111.5 0.01 410.02 0.00 563.16 0.00 867.13 0.0031 111.5 0.01 410.02 0.00 563.16 0.00 867.13 0.0032 111.41 0.01 411.49 0.00 563.31 0.00 946.45 0.00
32/Σdi/VsiSoil Type SD SC SCSE
391.8320448 365.5755794114.2653306 319.3177203
22
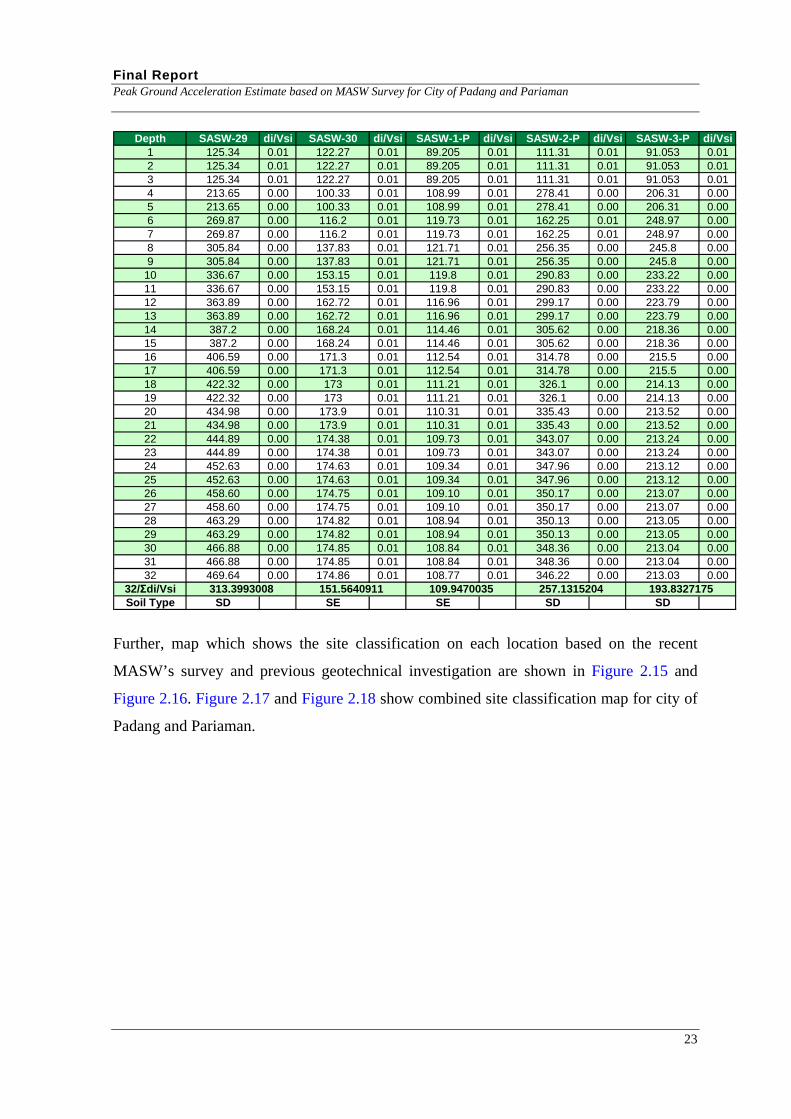
Final Report Peak Ground Acceleration Estimate based on MASW Survey for City of Padang and Pariaman
Depth SASW-29 di/Vsi SASW-30 di/Vsi SASW-1-P di/Vsi SASW-2-P di/Vsi SASW-3-P di/Vsi1 125.34 0.01 122.27 0.01 89.205 0.01 111.31 0.01 91.053 0.012 125.34 0.01 122.27 0.01 89.205 0.01 111.31 0.01 91.053 0.013 125.34 0.01 122.27 0.01 89.205 0.01 111.31 0.01 91.053 0.014 213.65 0.00 100.33 0.01 108.99 0.01 278.41 0.00 206.31 0.005 213.65 0.00 100.33 0.01 108.99 0.01 278.41 0.00 206.31 0.006 269.87 0.00 116.2 0.01 119.73 0.01 162.25 0.01 248.97 0.007 269.87 0.00 116.2 0.01 119.73 0.01 162.25 0.01 248.97 0.008 305.84 0.00 137.83 0.01 121.71 0.01 256.35 0.00 245.8 0.009 305.84 0.00 137.83 0.01 121.71 0.01 256.35 0.00 245.8 0.00
10 336.67 0.00 153.15 0.01 119.8 0.01 290.83 0.00 233.22 0.0011 336.67 0.00 153.15 0.01 119.8 0.01 290.83 0.00 233.22 0.0012 363.89 0.00 162.72 0.01 116.96 0.01 299.17 0.00 223.79 0.0013 363.89 0.00 162.72 0.01 116.96 0.01 299.17 0.00 223.79 0.0014 387.2 0.00 168.24 0.01 114.46 0.01 305.62 0.00 218.36 0.0015 387.2 0.00 168.24 0.01 114.46 0.01 305.62 0.00 218.36 0.0016 406.59 0.00 171.3 0.01 112.54 0.01 314.78 0.00 215.5 0.0017 406.59 0.00 171.3 0.01 112.54 0.01 314.78 0.00 215.5 0.0018 422.32 0.00 173 0.01 111.21 0.01 326.1 0.00 214.13 0.0019 422.32 0.00 173 0.01 111.21 0.01 326.1 0.00 214.13 0.0020 434.98 0.00 173.9 0.01 110.31 0.01 335.43 0.00 213.52 0.0021 434.98 0.00 173.9 0.01 110.31 0.01 335.43 0.00 213.52 0.0022 444.89 0.00 174.38 0.01 109.73 0.01 343.07 0.00 213.24 0.0023 444.89 0.00 174.38 0.01 109.73 0.01 343.07 0.00 213.24 0.0024 452.63 0.00 174.63 0.01 109.34 0.01 347.96 0.00 213.12 0.0025 452.63 0.00 174.63 0.01 109.34 0.01 347.96 0.00 213.12 0.0026 458.60 0.00 174.75 0.01 109.10 0.01 350.17 0.00 213.07 0.0027 458.60 0.00 174.75 0.01 109.10 0.01 350.17 0.00 213.07 0.0028 463.29 0.00 174.82 0.01 108.94 0.01 350.13 0.00 213.05 0.0029 463.29 0.00 174.82 0.01 108.94 0.01 350.13 0.00 213.05 0.0030 466.88 0.00 174.85 0.01 108.84 0.01 348.36 0.00 213.04 0.0031 466.88 0.00 174.85 0.01 108.84 0.01 348.36 0.00 213.04 0.0032 469.64 0.00 174.86 0.01 108.77 0.01 346.22 0.00 213.03 0.00
32/Σdi/VsiSoil Type SD SE SE SD SD
109.9470035 257.1315204 193.8327175313.3993008 151.5640911
Further, map which shows the site classification on each location based on the recent
MASW’s survey and previous geotechnical investigation are shown in Figure 2.15 and
Figure 2.16. Figure 2.17 and Figure 2.18 show combined site classification map for city of
Padang and Pariaman.
23
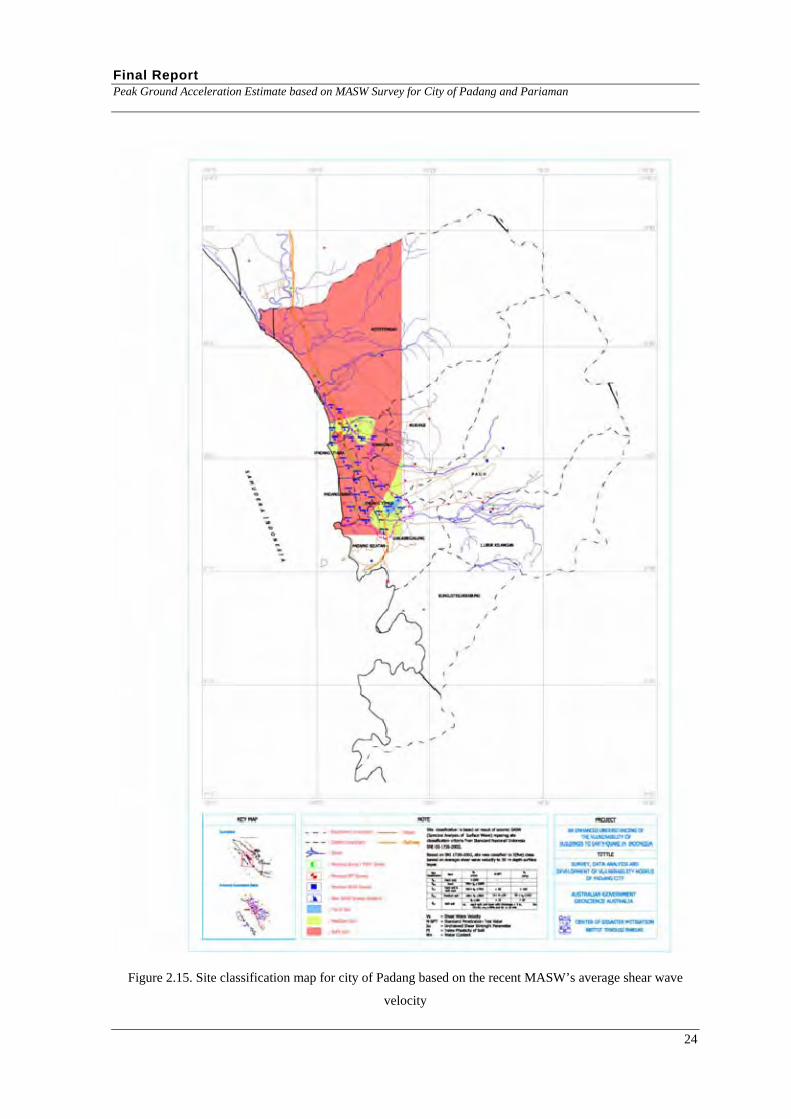
Final Report Peak Ground Acceleration Estimate based on MASW Survey for City of Padang and Pariaman
Figure 2.15. Site classification map for city of Padang based on the recent MASW’s average shear wave
velocity
24

Final Report Peak Ground Acceleration Estimate based on MASW Survey for City of Padang and Pariaman
Figure 2.16. Site classification map for city of Padang based on the previous geotechnical investigation
25
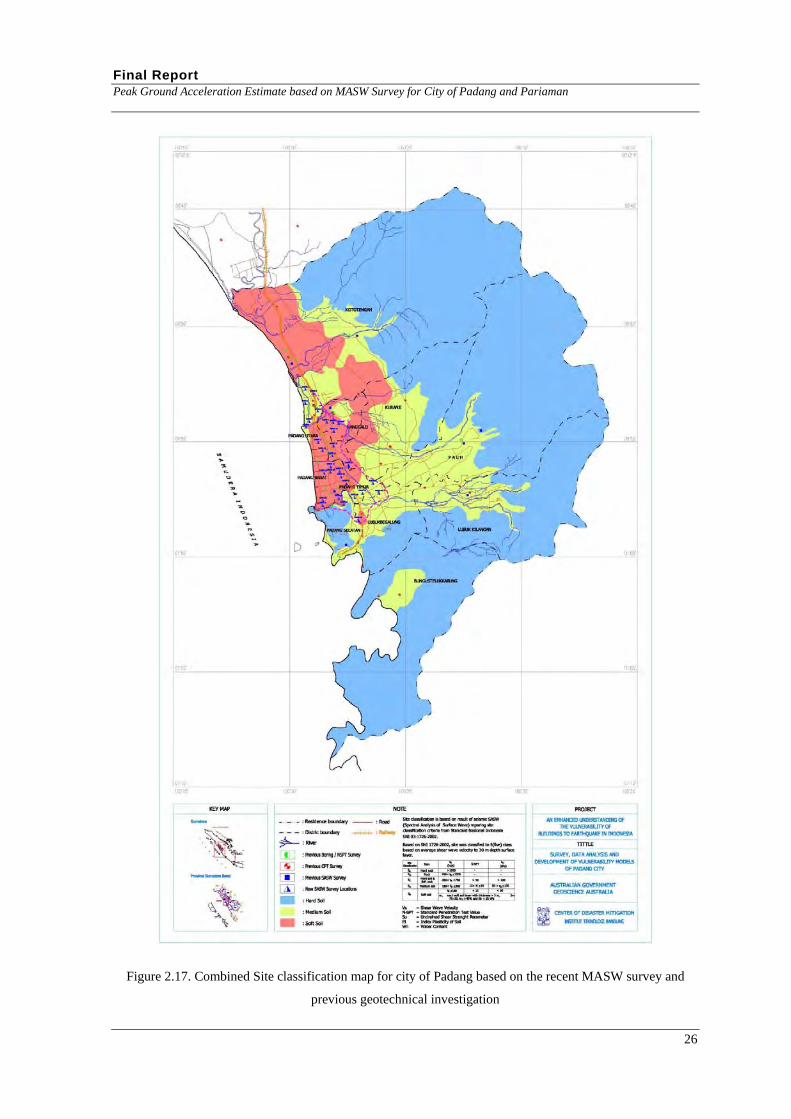
Final Report Peak Ground Acceleration Estimate based on MASW Survey for City of Padang and Pariaman
Figure 2.17. Combined Site classification map for city of Padang based on the recent MASW survey and
previous geotechnical investigation
26
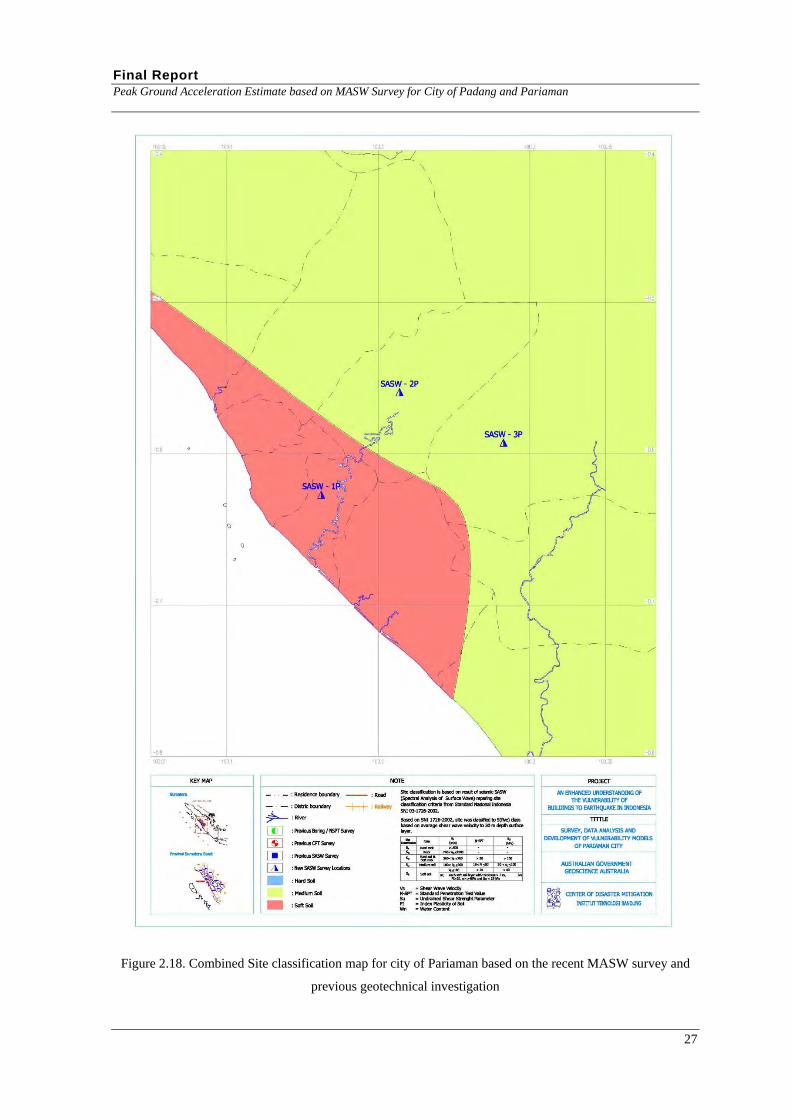
Final Report Peak Ground Acceleration Estimate based on MASW Survey for City of Padang and Pariaman
Figure 2.18. Combined Site classification map for city of Pariaman based on the recent MASW survey and
previous geotechnical investigation
27
Final Report Peak Ground Acceleration Estimate based on MASW Survey for City of Padang and Pariaman
CHAPTER 3
ANALYSIS OF 30 SEPTEMBER 2009 PADANG EARTHQUAKE EVENT
INTRODUCTION
Prior to peak ground acceleration (PGA) estimate at ground surface, earthquake event
analysis to estimate spatial distribution of PGA at reference baserock of West Sumatra
Province (including Padang and Pariaman cities) was conducted. The analysis was
conducted by performing attenuation of the 30 September 2009 earthquake. The analysis
has been carried out by identifying the earthquake source characteristics.
The attenuation analysis was conducted to recommend level of peak ground acceleration
(PGA) at reference base-rock using 3-D earthquake sources model with EZ-FRISK 7.32
Build 001 software. Attenuation functions by Young’s Intraslab (1997) has been adopted
to represent the subduction intra-slab earthquake source.
TECTONIC SETTING AND EARTHQUAKE HISTORY
The city of Padang and Pariaman are located in Province region of West Sumatra, which is
part of Eurasian plate that moves slowly relative towards south-east with a slip-rate around
0.4cm/year. Relative movement in west part of this Province, where there is an interaction
between Eurasin Plate and Hindia Oceanic Plate with relative northwards movement of
approximately 7 cm/year (Minster and Jordan, 1978 in Yeats et al., 1997). This interaction
creates subduction angle (oblique) and it had been estimated since lime period and still
take place up to now. Besides subduction, second interaction of this plate also creates
principal structures of Sumatra Fault, known as Sumatra Fault Zone (SFZ) and Mentawai
Fault Zone. West region of Sumatra island is one of area which is located in an active plate
boundary (active plate margin) in the world, and it could be expressed with height
frequency of earthquakes in this region. Earthquakes spread in this region are not only
come from the activity of Subduction Zone, but also from active fault system along side
Sumatra Island.
28
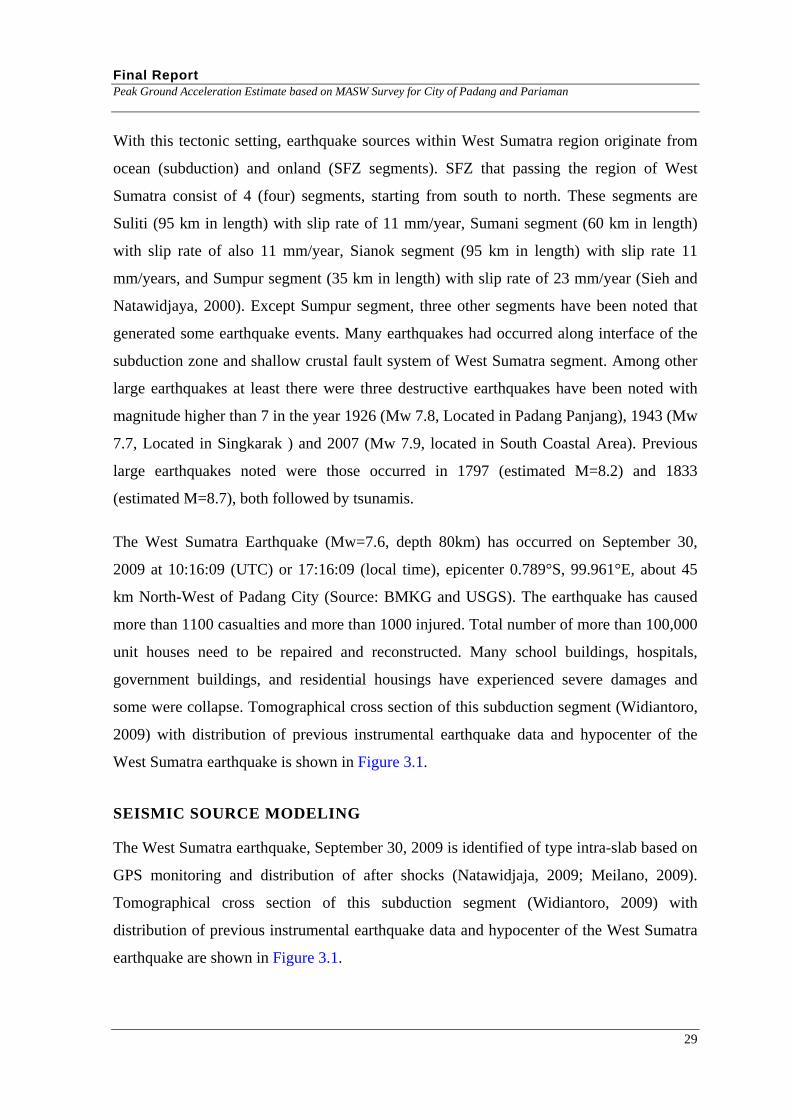
Final Report Peak Ground Acceleration Estimate based on MASW Survey for City of Padang and Pariaman
With this tectonic setting, earthquake sources within West Sumatra region originate from
ocean (subduction) and onland (SFZ segments). SFZ that passing the region of West
Sumatra consist of 4 (four) segments, starting from south to north. These segments are
Suliti (95 km in length) with slip rate of 11 mm/year, Sumani segment (60 km in length)
with slip rate of also 11 mm/year, Sianok segment (95 km in length) with slip rate 11
mm/years, and Sumpur segment (35 km in length) with slip rate of 23 mm/year (Sieh and
Natawidjaya, 2000). Except Sumpur segment, three other segments have been noted that
generated some earthquake events. Many earthquakes had occurred along interface of the
subduction zone and shallow crustal fault system of West Sumatra segment. Among other
large earthquakes at least there were three destructive earthquakes have been noted with
magnitude higher than 7 in the year 1926 (Mw 7.8, Located in Padang Panjang), 1943 (Mw
7.7, Located in Singkarak ) and 2007 (Mw 7.9, located in South Coastal Area). Previous
large earthquakes noted were those occurred in 1797 (estimated M=8.2) and 1833
(estimated M=8.7), both followed by tsunamis.
The West Sumatra Earthquake (Mw=7.6, depth 80km) has occurred on September 30,
2009 at 10:16:09 (UTC) or 17:16:09 (local time), epicenter 0.789°S, 99.961°E, about 45
km North-West of Padang City (Source: BMKG and USGS). The earthquake has caused
more than 1100 casualties and more than 1000 injured. Total number of more than 100,000
unit houses need to be repaired and reconstructed. Many school buildings, hospitals,
government buildings, and residential housings have experienced severe damages and
some were collapse. Tomographical cross section of this subduction segment (Widiantoro,
2009) with distribution of previous instrumental earthquake data and hypocenter of the
West Sumatra earthquake is shown in Figure 3.1.
SEISMIC SOURCE MODELING
The West Sumatra earthquake, September 30, 2009 is identified of type intra-slab based on
GPS monitoring and distribution of after shocks (Natawidjaja, 2009; Meilano, 2009).
Tomographical cross section of this subduction segment (Widiantoro, 2009) with
distribution of previous instrumental earthquake data and hypocenter of the West Sumatra
earthquake are shown in Figure 3.1.
29
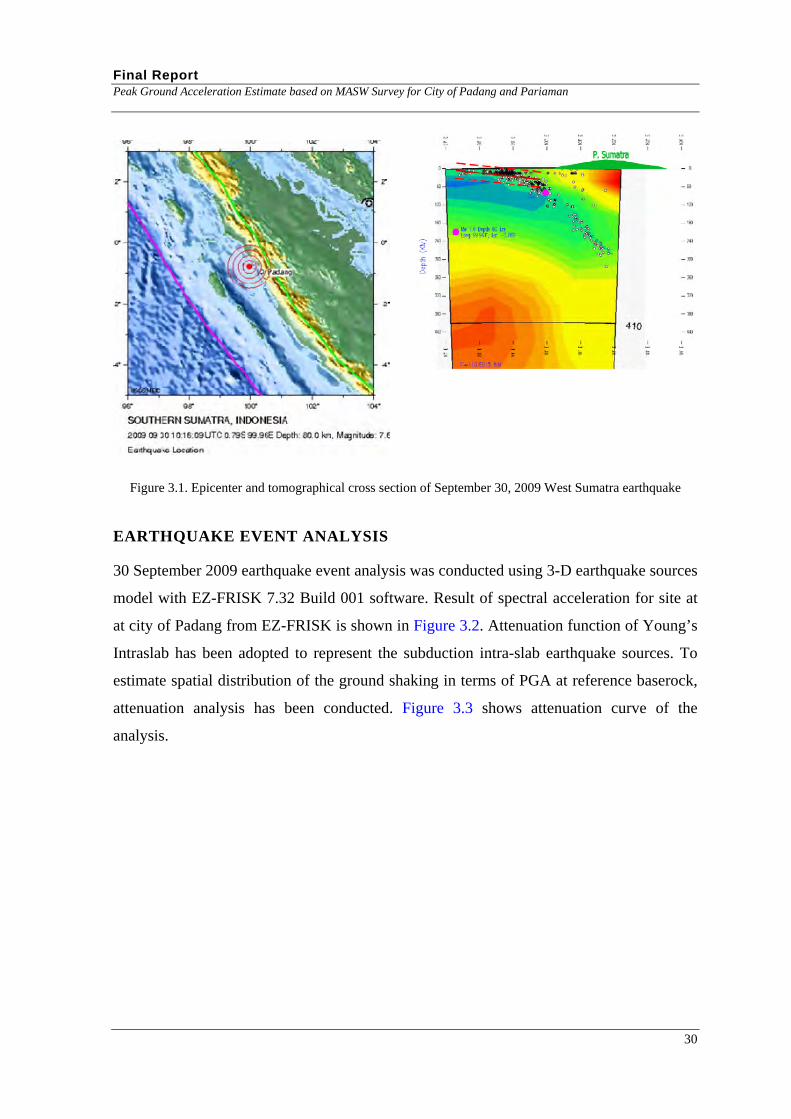
Final Report Peak Ground Acceleration Estimate based on MASW Survey for City of Padang and Pariaman
Figure 3.1. Epicenter and tomographical cross section of September 30, 2009 West Sumatra earthquake
EARTHQUAKE EVENT ANALYSIS
30 September 2009 earthquake event analysis was conducted using 3-D earthquake sources
model with EZ-FRISK 7.32 Build 001 software. Result of spectral acceleration for site at
at city of Padang from EZ-FRISK is shown in Figure 3.2. Attenuation function of Young’s
Intraslab has been adopted to represent the subduction intra-slab earthquake sources. To
estimate spatial distribution of the ground shaking in terms of PGA at reference baserock,
attenuation analysis has been conducted. Figure 3.3 shows attenuation curve of the
analysis.
30
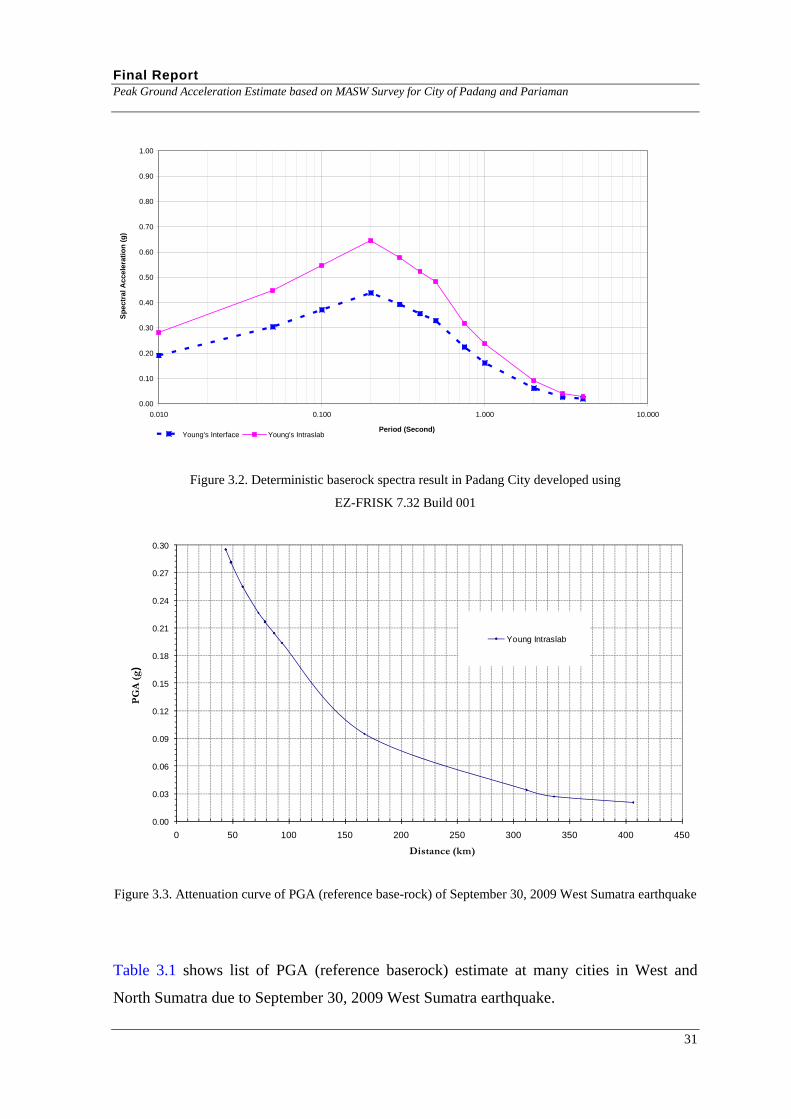
Final Report Peak Ground Acceleration Estimate based on MASW Survey for City of Padang and Pariaman
0.00
0.10
0.20
0.30
0.40
0.50
0.60
0.70
0.80
0.90
1.00
0.010 0.100 1.000 10.000
Period (Second)
Sp
ectr
al A
ccel
erat
ion
(g
)
Young's Interface Young's Intraslab
Figure 3.2. Deterministic baserock spectra result in Padang City developed using
EZ-FRISK 7.32 Build 001
0.00
0.03
0.06
0.09
0.12
0.15
0.18
0.21
0.24
0.27
0.30
0 50 100 150 200 250 300 350 400 450
PG
A (
g)
Distance (km)
Young Intraslab
Figure 3.3. Attenuation curve of PGA (reference base-rock) of September 30, 2009 West Sumatra earthquake
Table 3.1 shows list of PGA (reference baserock) estimate at many cities in West and
North Sumatra due to September 30, 2009 West Sumatra earthquake.
31
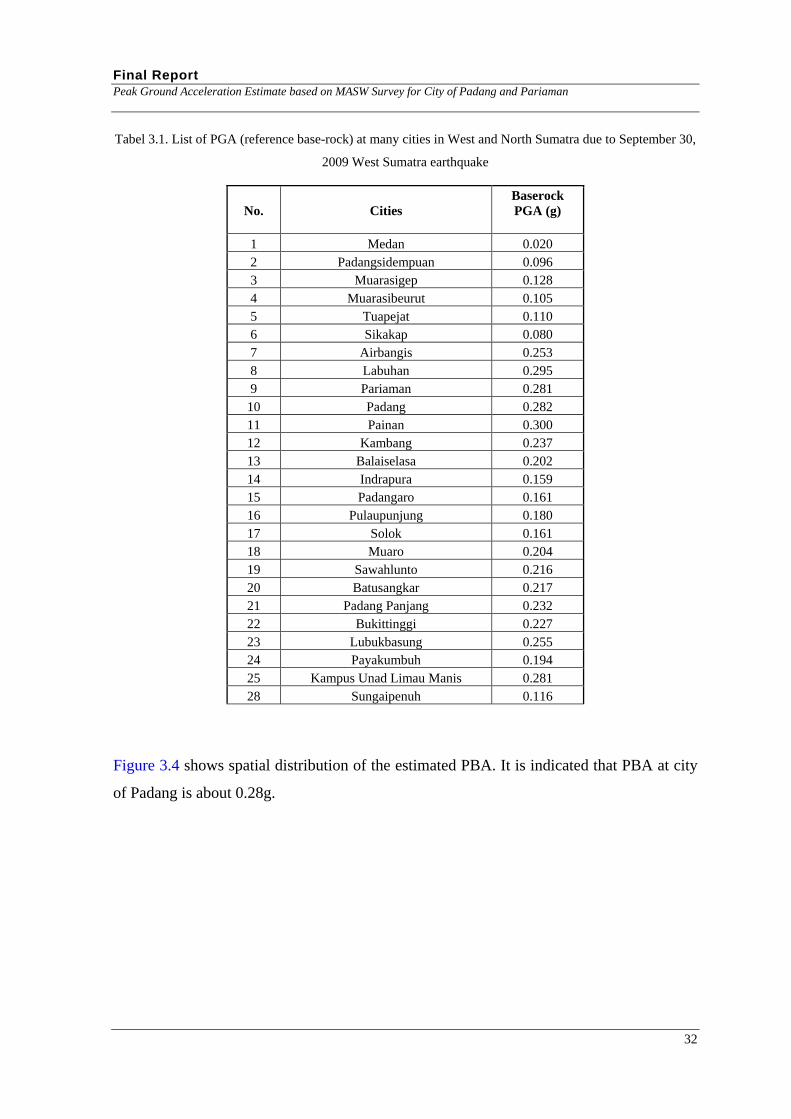
Final Report Peak Ground Acceleration Estimate based on MASW Survey for City of Padang and Pariaman
Tabel 3.1. List of PGA (reference base-rock) at many cities in West and North Sumatra due to September 30,
2009 West Sumatra earthquake
No.
Cities
Baserock PGA (g)
1 Medan 0.020 2 Padangsidempuan 0.096 3 Muarasigep 0.128 4 Muarasibeurut 0.105 5 Tuapejat 0.110 6 Sikakap 0.080 7 Airbangis 0.253 8 Labuhan 0.295 9 Pariaman 0.281
10 Padang 0.282 11 Painan 0.300 12 Kambang 0.237 13 Balaiselasa 0.202 14 Indrapura 0.159 15 Padangaro 0.161 16 Pulaupunjung 0.180 17 Solok 0.161 18 Muaro 0.204 19 Sawahlunto 0.216 20 Batusangkar 0.217 21 Padang Panjang 0.232 22 Bukittinggi 0.227 23 Lubukbasung 0.255 24 Payakumbuh 0.194 25 Kampus Unad Limau Manis 0.281 28 Sungaipenuh 0.116
Figure 3.4 shows spatial distribution of the estimated PBA. It is indicated that PBA at city
of Padang is about 0.28g.
32

Final Report Peak Ground Acceleration Estimate based on MASW Survey for City of Padang and Pariaman
Figure 3.4 Estimated PGA (reference base-rock) spatial distribution using Young’s Intraslab attenuation due
to 30 September 2009 West Sumatra Earthquake
33
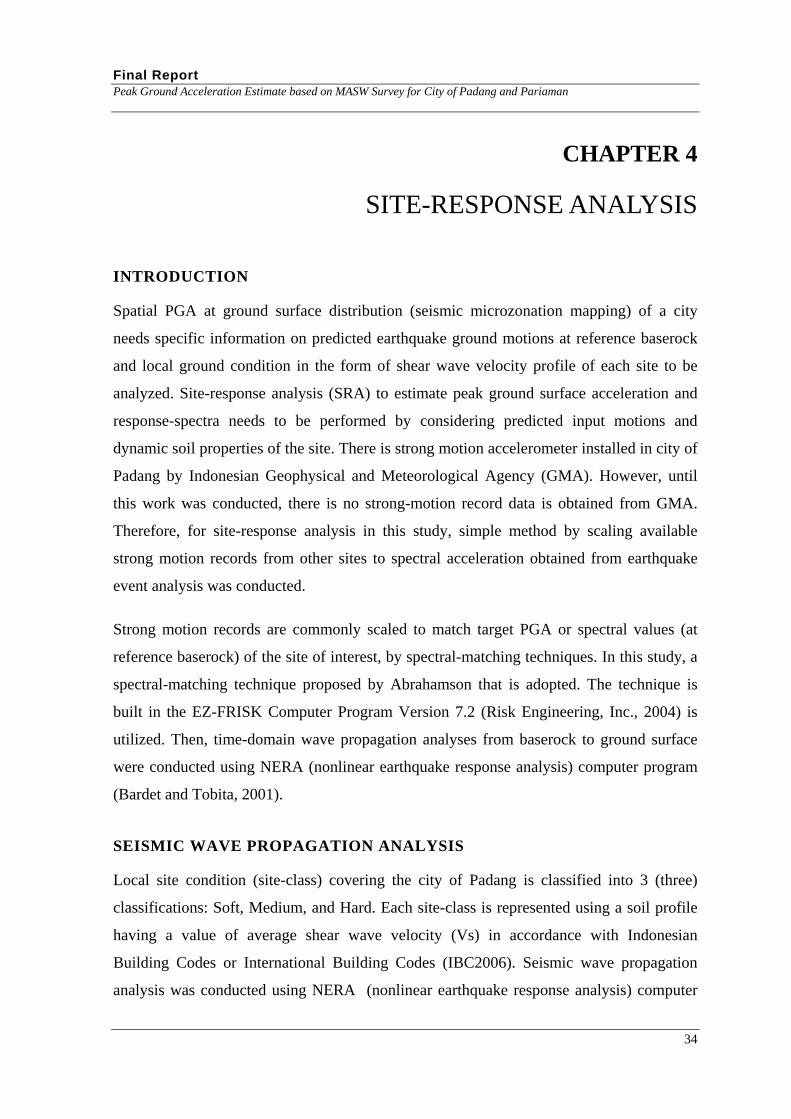
Final Report Peak Ground Acceleration Estimate based on MASW Survey for City of Padang and Pariaman
CHAPTER 4
SITE-RESPONSE ANALYSIS
INTRODUCTION
Spatial PGA at ground surface distribution (seismic microzonation mapping) of a city
needs specific information on predicted earthquake ground motions at reference baserock
and local ground condition in the form of shear wave velocity profile of each site to be
analyzed. Site-response analysis (SRA) to estimate peak ground surface acceleration and
response-spectra needs to be performed by considering predicted input motions and
dynamic soil properties of the site. There is strong motion accelerometer installed in city of
Padang by Indonesian Geophysical and Meteorological Agency (GMA). However, until
this work was conducted, there is no strong-motion record data is obtained from GMA.
Therefore, for site-response analysis in this study, simple method by scaling available
strong motion records from other sites to spectral acceleration obtained from earthquake
event analysis was conducted.
Strong motion records are commonly scaled to match target PGA or spectral values (at
reference baserock) of the site of interest, by spectral-matching techniques. In this study, a
spectral-matching technique proposed by Abrahamson that is adopted. The technique is
built in the EZ-FRISK Computer Program Version 7.2 (Risk Engineering, Inc., 2004) is
utilized. Then, time-domain wave propagation analyses from baserock to ground surface
were conducted using NERA (nonlinear earthquake response analysis) computer program
(Bardet and Tobita, 2001).
SEISMIC WAVE PROPAGATION ANALYSIS
Local site condition (site-class) covering the city of Padang is classified into 3 (three)
classifications: Soft, Medium, and Hard. Each site-class is represented using a soil profile
having a value of average shear wave velocity (Vs) in accordance with Indonesian
Building Codes or International Building Codes (IBC2006). Seismic wave propagation
analysis was conducted using NERA (nonlinear earthquake response analysis) computer
34
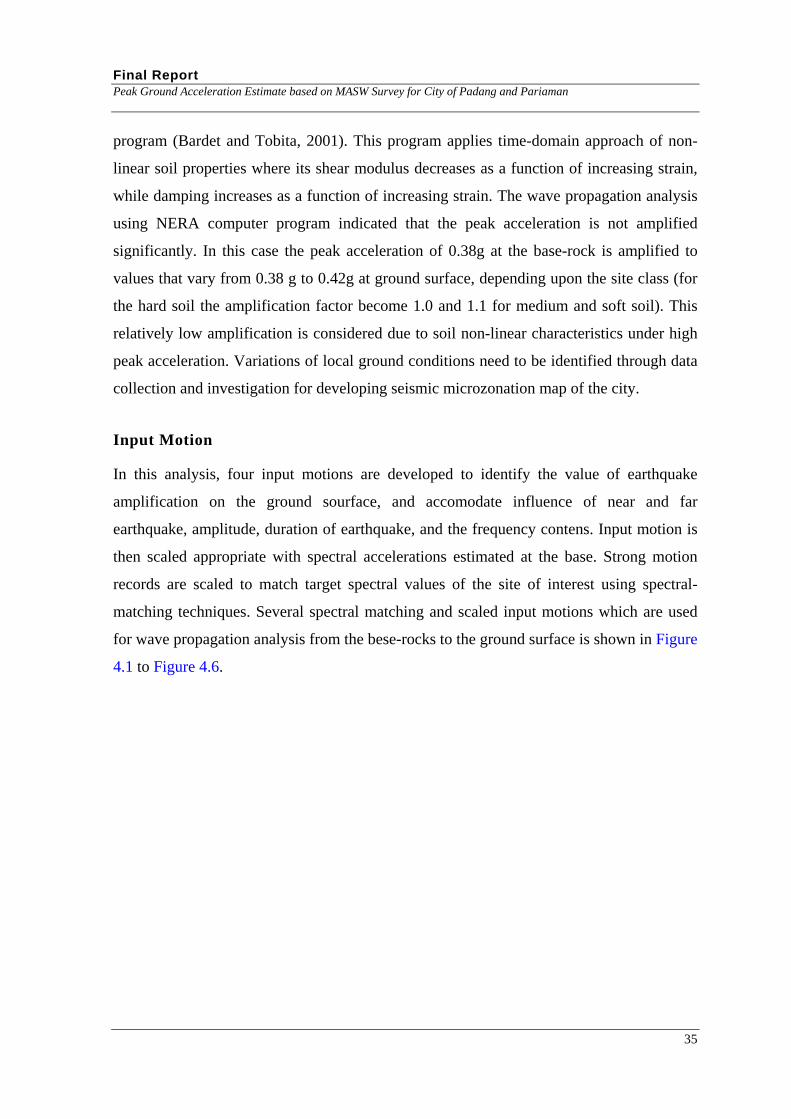
Final Report Peak Ground Acceleration Estimate based on MASW Survey for City of Padang and Pariaman
program (Bardet and Tobita, 2001). This program applies time-domain approach of non-
linear soil properties where its shear modulus decreases as a function of increasing strain,
while damping increases as a function of increasing strain. The wave propagation analysis
using NERA computer program indicated that the peak acceleration is not amplified
significantly. In this case the peak acceleration of 0.38g at the base-rock is amplified to
values that vary from 0.38 g to 0.42g at ground surface, depending upon the site class (for
the hard soil the amplification factor become 1.0 and 1.1 for medium and soft soil). This
relatively low amplification is considered due to soil non-linear characteristics under high
peak acceleration. Variations of local ground conditions need to be identified through data
collection and investigation for developing seismic microzonation map of the city.
Input Motion
In this analysis, four input motions are developed to identify the value of earthquake
amplification on the ground sourface, and accomodate influence of near and far
earthquake, amplitude, duration of earthquake, and the frequency contens. Input motion is
then scaled appropriate with spectral accelerations estimated at the base. Strong motion
records are scaled to match target spectral values of the site of interest using spectral-
matching techniques. Several spectral matching and scaled input motions which are used
for wave propagation analysis from the bese-rocks to the ground surface is shown in Figure
4.1 to Figure 4.6.
35
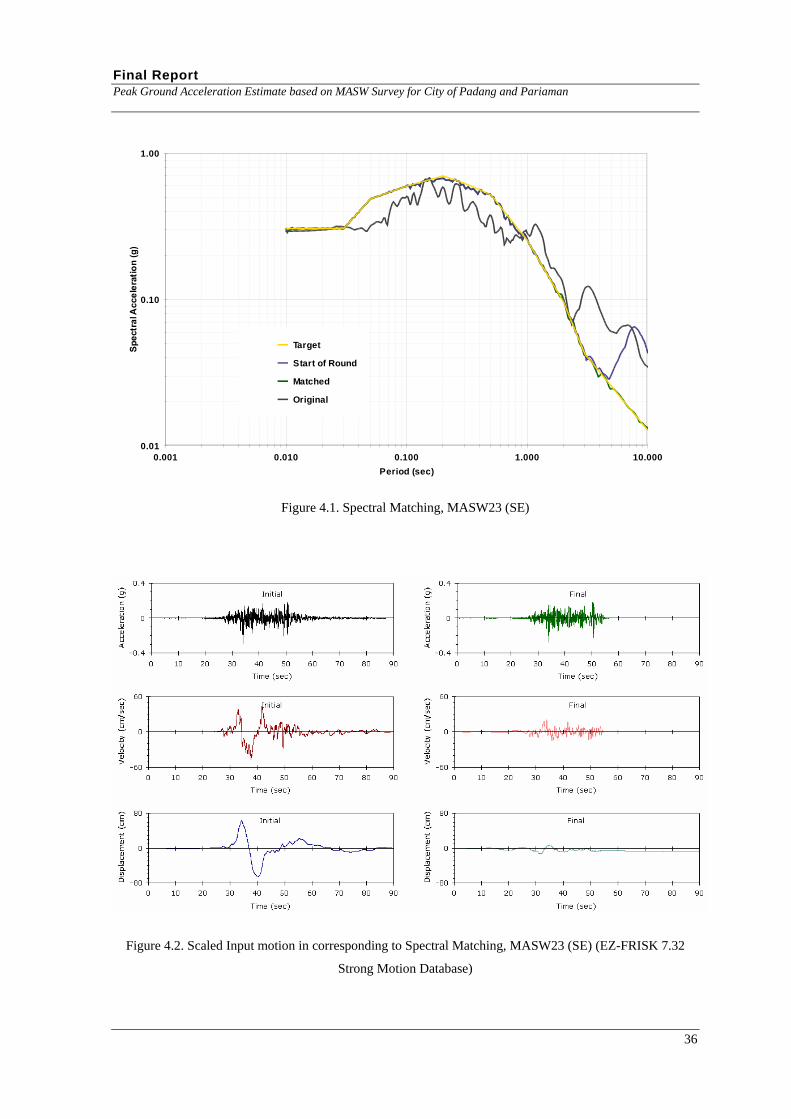
Final Report Peak Ground Acceleration Estimate based on MASW Survey for City of Padang and Pariaman
36
Figure 4.1. Spectral Matching, MASW23 (SE)
Figure 4.2. Scaled Input motion in corresponding to Spectral Matching, MASW23 (SE) (EZ-FRISK 7.32
Strong Motion Database)
0.01
0.10
1.00
0.001 0.010 0.100 1.000 10.000
Period (sec)
Target
Start of Round
Matched
Original
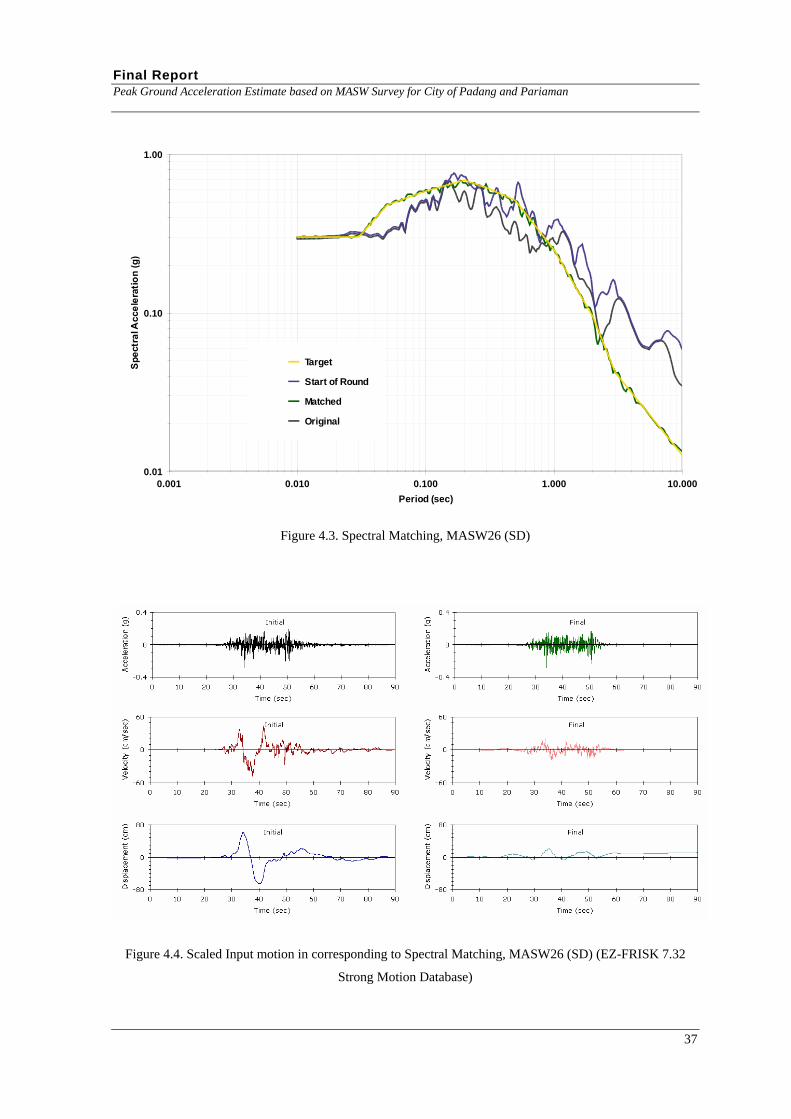
Final Report Peak Ground Acceleration Estimate based on MASW Survey for City of Padang and Pariaman
37
Figure 4.3. Spectral Matching, MASW26 (SD)
Figure 4.4. Scaled Input motion in corresponding to Spectral Matching, MASW26 (SD) (EZ-FRISK 7.32
Strong Motion Database)
0.01
0.10
1.00
0.001 0.010 0.100 1.000 10.000
Period (sec)
Target
Start of Round
Matched
Original
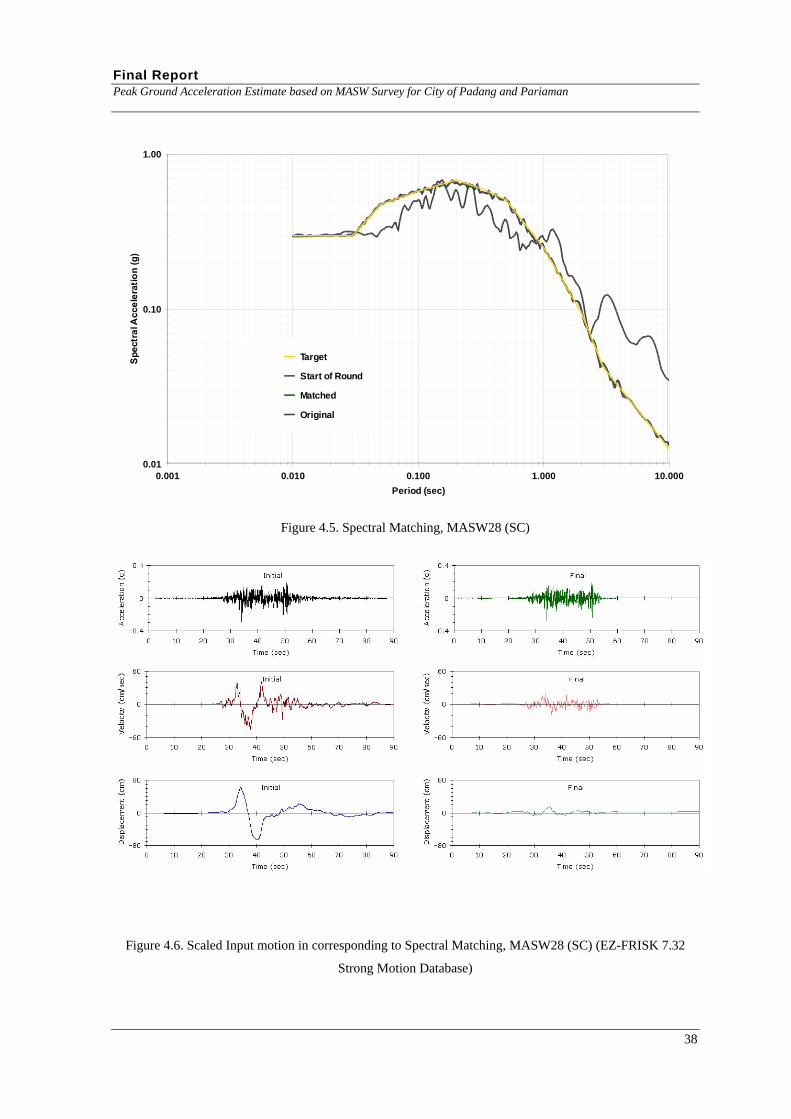
Final Report Peak Ground Acceleration Estimate based on MASW Survey for City of Padang and Pariaman
38
Figure 4.5. Spectral Matching, MASW28 (SC)
Figure 4.6. Scaled Input motion in corresponding to Spectral Matching, MASW28 (SC) (EZ-FRISK 7.32
Strong Motion Database)
0.01
0.10
1.00
0.001 0.010 0.100 1.000 10.000
Period (sec)
Target
Start of Round
Matched
Original
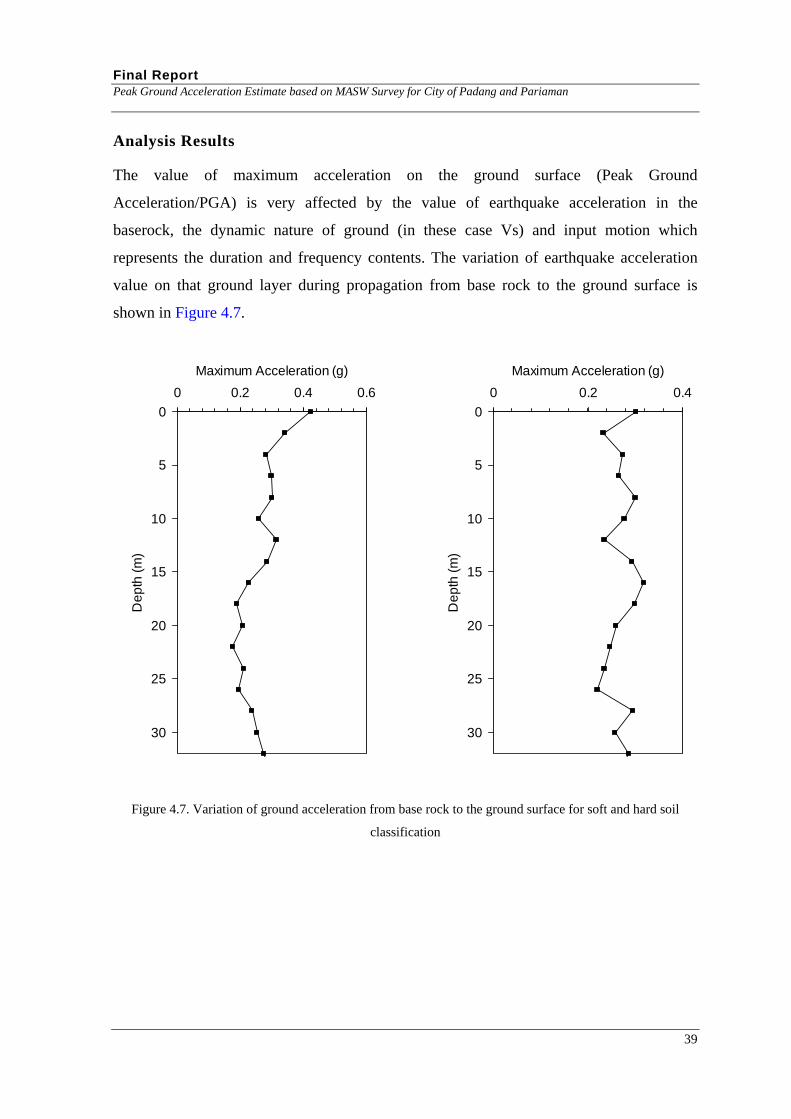
Final Report Peak Ground Acceleration Estimate based on MASW Survey for City of Padang and Pariaman
Analysis Results
The value of maximum acceleration on the ground surface (Peak Ground
Acceleration/PGA) is very affected by the value of earthquake acceleration in the
baserock, the dynamic nature of ground (in these case Vs) and input motion which
represents the duration and frequency contents. The variation of earthquake acceleration
value on that ground layer during propagation from base rock to the ground surface is
shown in Figure 4.7.
0
5
10
15
20
25
30
0 0.2 0.4 0.6
Maximum Acceleration (g)
De
pth
(m
)
0
5
10
15
20
25
30
0 0.2
Maximum Acceleration (g)
De
pth
(m
)
0.4
Figure 4.7. Variation of ground acceleration from base rock to the ground surface for soft and hard soil
classification
39

Final Report Peak Ground Acceleration Estimate based on MASW Survey for City of Padang and Pariaman
40
Based on the result of seismic wave propagation analysis, which was carried out by
considering the field condition on each locations in the sub district and the earthquake
acceleration on the base rock, a microzonation map city of Padang and Pariaman are
then developed which shows that the maximum value of seismic acceleration on the
ground surface or Peak Ground Acceleration (PGA) as shown on Figure 4.8 and Figure
4.9.
For further development of vulnerability model of different building types, then a
maximum value of seismic acceleration (PGA) at all the buildings surveyed is
developed as shown in Appendix 3.
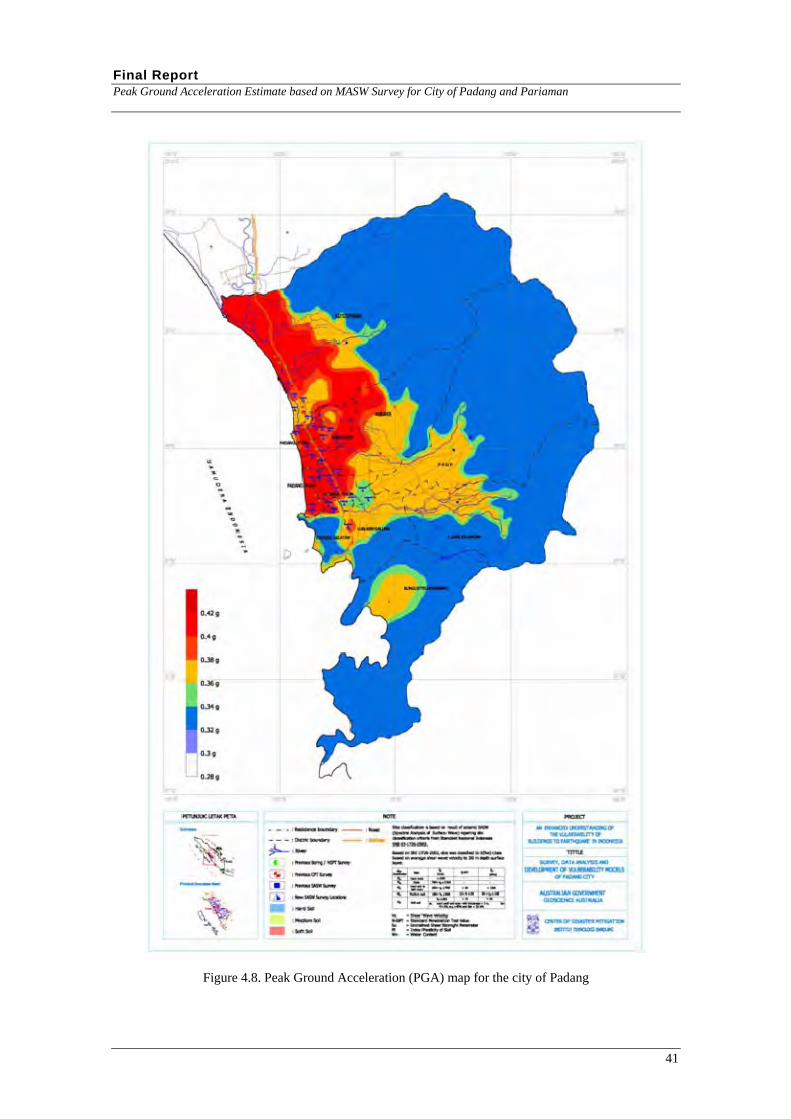
Final Report Peak Ground Acceleration Estimate based on MASW Survey for City of Padang and Pariaman
Figure 4.8. Peak Ground Acceleration (PGA) map for the city of Padang
41
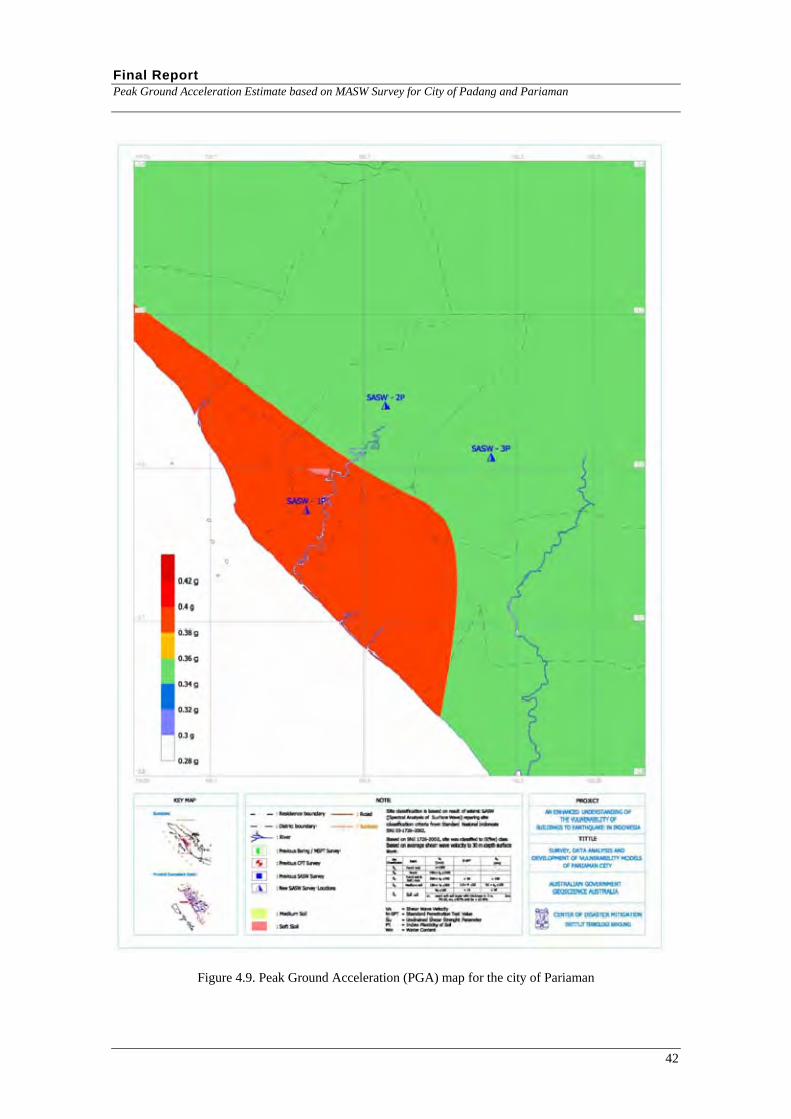
Final Report Peak Ground Acceleration Estimate based on MASW Survey for City of Padang and Pariaman
Figure 4.9. Peak Ground Acceleration (PGA) map for the city of Pariaman
42
Final Report Peak Ground Acceleration Estimate based on MASW Survey for City of Padang and Pariaman
REFERENCES Bardet J.P., Tobita T., (2001), “NERA, A Computer Program for Nonlinear Earthquake Site
Response Analyses of layered Soil Deposits”, University of Southern California
BMKG, earthquake information.
Indonesian Seismic Building Codes, SNI-1726, 2002, Department of Public Work.
Meilano, I., (2009), Personal Communication
Natawidjaja, D.H., (2002), Ph.D Thesis, California Institute of Technology.
Natawidjaja, D.N. (2009), Personal Communication.
Risk Engineering, Inc, (2004), EZ-FRISK, Software for In-depth Seismic Hazard Analysis, Boulder, Colorado, USA.
Sengara, IW., Hakam, A., Putra, H.G., Sudinda, T, and Sukamdo, P. (2009), “Seismic Hazard Zoning for West Sumatra and Microzonation of City of Padang”, Geo-Informatics and Zoning for Hazard Mapping (GIZ2009), Kyoto, Japan.
Sengara, I.W., Munaf, Y., Aswandi, and Susila, IG.M., (2000), “Seismic Hazard and Site Response Analysis for City of Bandung-Indonesia”, Proceeding of Geotechnical Earthquake Engineering Conference, San Diego, March, 2001.
Sieh, K., and Natawidjaja, D., 2000, “Neotectonics of the Sumatera Fault, Indonesia”, Journal of Geophysical Research, 105 (B12), pp. 28295 – 28326.
USGS, earthquake information.
Youngs, R. R., Chiou, S. J., Silva, W. J., Humphrey, J. R., (1997), “Strong Ground Motion Attenuation Relationship for Subduction Zone Earthquake”, Bulletin of Seismological Society of America Vol. 68, No. 1.
APPENDICES [Not included]
43

The 30th September 2009 West Sumatra Earthquake Padang Region Damage Survey
Appendix A4 Workshop Proceedings

Padang Earthquake Reconnaissance Workshop 28th and 29th April 2010 GEOSCIENCE AUSTRALIA
Padang Earthquake Reconnaissance Workshop
Contents
1 Summary .....................................................................................................................1 2 Introduction.................................................................................................................1 3 Aims.............................................................................................................................1 4 Program.......................................................................................................................2 5 Attendees ....................................................................................................................6 6 Session Reporting......................................................................................................7
6.1 Indonesian Seismicity and Regulation Development .........................................................7 6.1.1 Indonesian Seismicity and the Padang Region ..........................................................7 6.1.2 Indonesian Building Regulation Development and Construction Practice................7 6.1.3 Historical Performance of Structures in Indonesia ....................................................8
6.2 Padang Earthquake and Survey Activity ............................................................................9 6.2.1 The 30 September 2009 Western Sumatran Earthquake ...........................................9 6.2.2 Overall Survey Objectives and Approach .................................................................9 6.2.3 Detailed Survey .......................................................................................................10 6.2.4 Population Based Survey.........................................................................................11
6.3 MASW Survey and PGA Estimate...................................................................................11 6.3.1 Objectives ................................................................................................................11 6.3.2 Teams ......................................................................................................................12 6.3.3 PGA Estimate ..........................................................................................................12 6.3.4 Results of Spatial PGA Distribution........................................................................12
6.4 Post Survey Analysis ........................................................................................................13 6.4.1 Data cleaning ...........................................................................................................13 6.4.2 Review of the population survey form ....................................................................14 6.4.3 Reparation costing ...................................................................................................14 6.4.4 Vulnerability assessment .........................................................................................14 6.4.5 Results from social questions ..................................................................................16
6.5 Building Stock Categorisation..........................................................................................17 6.6 Preliminary Vulnerability Models ....................................................................................17
6.6.1 Damage Threshold for Indonesian Structures .........................................................17 6.6.2 Earthquake Vulnerability Research Opportunities ..................................................17 6.6.3 Future Utilisation of Padang Data ...........................................................................18
6.7 Post Disaster Survey Activity ...........................................................................................18 6.7.1 Methodologies .........................................................................................................18 6.7.2 Future Indonesian Post Disaster Survey Activity ....................................................19
6.8 Next Steps.........................................................................................................................19 7 Vulnerability Model Development ........................................................................... 19
7.1 Heuristic in-session process for benchmark curves ..........................................................19 7.2 Revised schema through out-of-session process 7.3 Heuristic out-of-session process for national suite ...........................................................23
8 Issues & Recommendations.................................................................................... 23 9 Acknowledgements.................................................................................................. 23
ii
Padang Earthquake Reconnaissance Workshop
Summary An AIFDR sponsored workshop was held at Geoscience Australia on the 28th and 29th April, 2010 to bring together many of the participants of the Padang Earthquake Reconnaissance Survey Team. The workshop reviewed Indonesian seismicity, the development of building regulations, historical building performance, the survey methodology, the survey outcomes, and the results of post survey analyses. It further considered the next steps for utilising the information to refine vulnerability knowledge and for disseminating the lessons learnt.
Introduction On the 30th September 2009 a magnitude 7.6 earthquake struck West Sumatra in Indonesia. It caused widespread damage to buildings and the loss of an estimated 1,000 lives in the Padang and Padang Pariaman Districts. The Australia-Indonesia Facility for Disaster Reduction supported a team of Indonesian and international engineers and scientists to collect and analyse damage information needed for future disaster risk reduction in West Sumatra and for Indonesia more broadly. The activity was jointly led by the Centre for Disaster Mitigation at the Institute of Technology Bandung and Geoscience Australia in Canberra. The survey activity was successfully completed and the data sourced has been cleaned, processed and valuable vulnerability information has been derived. The workshop brought together many of the key participants in the survey activity. It was an opportunity to put the damage observations made in the context of the nature of the local building stock and the regulations and building practices that have influenced their performance. The outcomes provide a valuable opportunity to refine a schema for categorising Indonesian buildings and to attribute an initial assessment of earthquake vulnerability to each building type.
Aims The workshop aims were as follows:- to review the seismicity of Indonesia and the Padang region; to examine the evolution of building regulations in Indonesia and their application/enforcement
regionally and with time; to review the historical performance of Indonesian structures subjected to strong earthquake
ground motion; to review the nature of the Western Sumatran Earthquake and the post disaster survey activity
that followed; to review the outcomes of this survey work, both from detailed building studies and as derived
from population based surveys; to consider the post survey work aimed at determining the nature of local regolith and the
severity of ground motion: to review the building stock categorisation schema developed for the survey and to augment this
for future vulnerability model assignment and risk assessments; to develop a benchmark suite of earthquake vulnerability relationships to agree on the out-of-session process for populating the full building stock schema to discuss research opportunities for the development of improved earthquake vulnerability
models for Indonesian buildings; and, to review the opportunities for carrying out more effective post-disaster surveys in Indonesia for
all hazards based on the Padang survey experience.
1

Padang Earthquake Reconnaissance Workshop
Program The workshop was held at Geoscience Australia on the 28th and 29th April, 2010. It consisted of four sessions over the two days with the following agenda.
Session One Wednesday 9:00 am to 12:30 pm
(Chair:- Ken Dale) PRELIMINARIES (Chair) 5mins OFFICIAL WELCOME (Dr David Jepsen, Acting GL, Earth Monitoring Group) 5mins INTRODUCTIONS (Chair) 10mins INTRODUCTION AND WORKSHOP AIMS (Mark Edwards) 10mins
Indonesian Seismicity and Regulation Development INDONESIAN SEISMICITY AND THE PADANG REGION (Wayan Sengara) 30mins Tectonic context Bedrock hazard nationally and in the Padang region Local regolith effects Associated tsunami hazard General discussion facilitated by session chair INDONESIAN BUILDING REGULATION DEVELOPMENT AND CONSTRUCTION PRACTICE (Made Suarjana) 30mins Evolution of standards (loadings and material) Implications for base shear resistance Typical construction practices Level of enforcement regionally and how this has changed with time General discussion facilitated by session chair HISTORICAL PERFORMANCE OF STRUCTURES IN INDONESIA (Made Suarjana) 30mins Review of severe historical earthquake events and their impacts. Learnings on earthquake vulnerability in the context of survey building stock schema General discussion facilitated by session chair
Padang Earthquake and Survey Activity THE 30 SEPT 2009 WESTERN SUMATRAN EARTHQUAKE (Dick Beetham) 20mins Event Rarity General footprint of severe ground motion
2
Padang Earthquake Reconnaissance Workshop
General discussion facilitated by session chair OVERALL SURVEY OBJECTIVES AND APPROACH (Martin Wehner) 30mins Objectives Methodology Building stock categorisation General discussion facilitated by session chair DETAILED SURVEY (Richard Weller / Jason Ingham) 50mins Methodology Activity Outcomes Observations General discussion facilitated by session chair
Session Two Wednesday 1:30 pm to 5:00 pm
(Chair:- Jason Ingham)
POPULATION BASED SURVEY (Gerhard Horoschun) 30mins Methodology Activity Outcomes Observations General discussion facilitated by session chair
Post Survey Analysis INITIAL INTENSITY ASSESSMENT (Dick Beetham) 20mins Issues with survey attribution Cleaning of field assignments of MMI Intensity assignment approach Isoseismal map General discussion facilitated by session chair DETAILED GROUND MOTION STUDY (Wayan Sengara) 60mins Methodology MASW analysis to classify regolith Bedrock Local on regolith General discussion facilitated by session chair RESULTS FROM POPULATION BASED SURVEY (Martin Wehner / Dick Beetham) 50mins Damage data cleaning
3

Padang Earthquake Reconnaissance Workshop
Reattribution of MMI intensities Reparation costing variability Nature of vulnerability relationships Validation data derived Results from social questions General discussion facilitated by session chair LEARNINGS ON SURVEY METHODOLOGIES USED IN PADANG (Chair) 30mins General discussion facilitated by session chair
Session Three Thursday 9:00 am to 12:30 pm
(Chair:- Richard Weller)
Building Stock Categorisation REVIEW OF IMPACT ASSESSMENT PROCESS AND BUILDING SCHEMA (Mark Edwards) 30mins Earthquake impact and risk assessment process Feedback on applicability of building schema for multiple hazards Discussion on local hazard variation implications on vulnerability level. Review of industrial buildings coverage adequacy General discussion facilitated by session chair
Preliminary Vulnerability Models DAMAGE THRESHOLD FOR INDONESIAN STRUCTURES (Made Suarjana / Wayan Sengara) 30mins Identification of relative vulnerability of key building types. Assessment of damage thresholds as MMI intensity for building types Assessment (if possible) of more severe damage outcomes at high levels of shaking intensity. General discussion facilitated by session chair BENCHMARK EARTHQUAKE VULNERABILITY CURVE DEVELOPMENT (Mark Edwards) 100mins Identification of 8 building types selected from schema categories Review of vulnerability knowledge for each derived from Padang Earthquake and results for
similar structures in other earthquake events Consensus on vulnerability curve Heuristic process with audience input and facilitated by session chair HEURISTIC OUT OF SESSION PROCESS (Mark Edwards) 30mins Discussion of process Review of tools
4

Padang Earthquake Reconnaissance Workshop
General discussion facilitated by session chair
Session Four Thursday 1:30 pm to 5:00 pm
(Chair:- Wayan Sengara) EARTHQUAKE VULNERABILITY RESEARCH OPPORTUNITIES (Made Suarjana / Wayan Sengara) 60mins Overview of structural vulnerability research in Indonesia Overview of ground motion modelling developments in Indonesia Selection of schema structure types for fundamental research Outline of research proposals to be developed out of session General discussion facilitated by session chair FUTURE USE OF PADANG DATA (Chair) 40mins Additional ground motion analysis Utilisation of other spectral values for damage association Publications General discussion facilitated by session chair
Post Disaster Survey Activity METHODOLOGIES (Neil Corby) 20mins Tools Strengths and weaknesses Appropriate methodologies General discussion facilitated by session chair FUTURE INDONESIAN POST DISASTER SURVEY ACTIVITY (Chair) 40mins Issues and challenges identifies from Padang activity Regional consensus on approach and data fields Training of participating academics and professionals Expansion to multi-hazard General discussion facilitated by session chair
Next Steps WORKSHOP SUMMARY AND NEXT STEPS (Chair) 50mins Summary of outcomes Out of session ranking processes Integration of respondent rankings to produce vulnerability model suite. Methodologies for post-disaster surveys Research opportunities Reporting of workshop outcomes Future workshop activity General discussion facilitated by session chair
5

Padang Earthquake Reconnaissance Workshop
Workshop Close Attendees Assoc. Prof Wayan Sengara Institute of Technology, Bandung, Indonesia Dr Made Suarjana Institute of Technology, Bandung, Indonesia Assoc. Prof Jason Ingham University of Auckland, NZ Dick Beetham GNS, NZ Richard Weller Cardno Consulting Engineers Gerhard Horoschun Australian Defence Force Academy, Canberra Ken Dale Geoscience Australia Martin Wehner Geoscience Australia Neil Corby Geoscience Australia Mark Edwards Geoscience Australia Roger Charng Geoscience Australia Phil Cummins Geoscience Australia (Day 1)
6
Padang Earthquake Reconnaissance Workshop
Session Reporting The workshop discussion on the themes covered in the agenda was “seeded” by a targeted presentation. Presented in this section under the key subject areas is the essence of the lead presentation and the subsequent discussion. INDONESIAN SEISMICITY AND REGULATION DEVELOPMENT Indonesian Seismicity and the Padang Region Padang lies in the second most severe seismic zone as defined by SNI-03-1726-2002. The standard defines response spectra for four site classifications ranging from hard rock to soft soil. Note that it is currently proposed that IBC-2006 be adopted for Indonesian New Building Codes. Current research involving Probabilistic Seismic Hazard Assessments (PSHA) and mapping has proposed a rezonation of Indonesia’s seismic zones. There is a significant tsunami risk in Padang from a future subduction type earthquake. The 2009 Western Sumatra earthquake produced approximately 0.25-0.3g in Padang at bedrock level. Soil amplification resulted in some spatial variation at foundation level across the region The PSHA corresponding to 10% probability of exceedance (PE) in 50 years indicated that peak ground acceleration (PGA) of approximately 0.37g has potential to occur along coastal area of West Sumatra, while PGA for areas along the Sumatran Fault Zone (SFZ) could reach 0.5g-0.7g. This PGA is higher compared to the current Indonesian Building Codes of 2002. De-aggregation analysis shows that the predicted PGA for the city of Padang is dominated by earthquakes originating from the Mentawai segment of the Subduction Megatrust, whereas for areas close to the SFZ, the predicted PGA will be dominated by shaking originated from SFZ earthquakes. A new Indonesian seismic zonation map is proposed to be either based on 10% PE in 50 years or 0.67 times (2% PE in 50 years) and two spectral values (at short and long period) will be adopted from PSHA outcomes. Indonesian Building Regulation Development and Construction Practice The history of Indonesian Seismic and Concrete Codes is summarised in Table 1. There is no formal Indonesian standard for masonry construction. However, there is a document named “Technical Guidelines for Seismic Resistant Homes and Buildings (2006)” The requirements for a building permit vary from region to region. In many regions, the required documentation consists only of the structural drawings, and in other regions only the architectural drawings. In Jakarta, a design report covering the geotechnical, substructure and superstructure parts of the building is required in addition to the drawings. The design must be prepared by a licensed engineer and, for buildings over five storeys, it is reviewed by an expert panel. In Indonesia it is usual during the structural design of a building to ignore the effect of in-fill masonry walls and not to design non-structural elements. Typical construction material strengths are as follows:- Concrete compressive strength: 15 – 20 MPa (concrete for high-rise buildings in Jakarta would
be stronger); Clay brick compressive strength: 4 MPa; Mortar compressive strength: 8 MPa; Reinforcing steel yield strength: 240 MPa (plain bar) and 400 MPa (deformed bar).
7
Padang Earthquake Reconnaissance Workshop
Table 1: History of development of Indonesian Seismic and Concrete Codes
PERIOD SEISMIC LOADINGS CODE CONCRETE CODE
Pre 1970 PBI 19551 The Indonesian Reinforced Concrete Code (Peraturan Beton Bertulang Indonesia)
1970-1990 NI 18-19706 The Indonesian Loading Code
PBI 19712 The Indonesian Reinforced Concrete Code (Peraturan Beton Bertulang Indonesia)
1990-2000 PPTGIUG 19837 The Indonesian Seismic Code for Building Design (Peraturan Perencanaan Tahan Gempa Untuk Gedung)
SNI 1991 (Concrete)3 The Indonesian Concrete Code (Tata Cara Perhitungan Struktur Beton untuk Bangunan Gedung SNI 03-2847-2002)
After 2000 SNI 2002 (Seismic)8 The Indonesian Seismic Resistant design Standard for Building Structures (Tata Cara Perencanaan Ketahanan Gempa untuk Gedung – SNI-1726-2002) Technical Guidelines for Seismic Resistant Home and Building (2006)5 (Pedoman Teknis Rumah dan Bangunan Gedung Tahan Gempa)
SNI 2002 (Concrete)4 The Indonesian Concrete Code (Tata Cara Perhitungan Struktur beton untuk Bangunan Gedung SNI 03-2847-2002)
1. Very limited application and only applied to projects managed by the Public Works Department.
2. Based on FIP-CEB and ACI 318-70 codes. No detailing requirements for ductility. 3. Based on ACI 318-86 including modern seismic design concepts such as ductility. 4. Based on ACI 318M-99. 5. Provides drawings of minimum construction requirements. 6. Lateral load is specified as a function of building height. Structural analysis is linear elastic
and structural design is based on allowable stress principals. 7. Included modern seismic design concepts such as structural ductility, collapse mechanisms
and capacity design. 8. Based on “NEHRP Recommended Provisions for Seismic Regulations for New Buildings
and Other Structures” February 1998, UBC-97. Historical Performance of Structures in Indonesia Damage similar to that observed in Padang has been observed in previous earthquakes in Indonesia such as Tasikmalaya (2009), Yogyakarta (2006) and Aceh (2004). Types of damage often observed include: Poor performance of unreinforced masonry (URM) houses; Soft storey collapses; Torsion collapse due to building mass / building stiffness off-sets; Short column failures; Pounding between buildings; Collapse of masonry walls such as gable walls, infill walls in frames, internal partitions and walls
damaged due to their greater relative stiffness attracting the bracing loads from surrounding concrete frames;
Damage induced by poor reinforcement detailing;
8
Padang Earthquake Reconnaissance Workshop
Stairs damaged by attracting bracing loads due to a lack of separation to primary structural frames;
Damage to non-structural elements such as ceilings that were not constructed to resist earthquake actions;
Damage to primary structure due to irregular structural layout such as columns off-set from beams; and,
Failure of inadequately detailed beam – column joints; There is a need for the damage observed during post-earthquake surveys to be related to the intensity of shaking so that building performance can be evaluated and compared between earthquakes. PADANG EARTHQUAKE AND SURVEY ACTIVITY The 30 September 2009 Western Sumatran Earthquake A 7.6 magnitude earthquake occurred on 30 September 2009 within the subduction zone of the Indo-Australian and Euro-Asian plates. It was located 50 km west-northwest of Padang and at a depth 80 km below the surface. It resulted in relatively high ground shaking in Padang and up the coast to the north with felt intensities of VII (MMI) and higher reported. The earthquake caused lateral spreading, landslides and liquefaction. Padang has been a focus of natural hazard scientists and disaster managers over the last five years. This is a result of increased evidence suggesting a high likelihood of an ~Mw 8.5 earthquake on the nearby subduction zone that could trigger a devastating tsunami. Significantly, the earthquake on the 30th September was not this ‘anticipated’ event. The locked nature of the locally subducting plate means that a tsunamigenic earthquake still remains a significant threat to Padang and surrounding coastal areas. Recent assessment of earthquake risk along the plate boundary suggests it is possible that the earthquake on the 30th September has created additional stress on the subduction zone, increasing the probability of this tsunamigenic earthquake occurring in future decades. The anticipated magnitude 8.5 event could generate a higher peak acceleration compared to that specified in the current (and previous) Indonesian Building Codes. The possibility of a ~Mw 7.5 earthquake on the Sumatra Fault Zone also exists. The time-frame for these events is well within the expected design life of any re-construction. Should the ~Mw 8.5 earthquake occur, settlement of half a metre may occur along the coastline of West Sumatra (land behind the subduction zone). This should be included in any threat analysis from tsunami or ocean inundation flooding (e.g. risk from Sea Level Rise). Overall Survey Objectives and Approach The disaster survey had two objectives: Undertake a detailed survey of damage to public buildings such as schools and medical facilities
that could inform recommendations regarding improvements that could be made to design and construction practices so that a repeat of the types of damage observed in Padang might be avoided.
Undertake a population survey whereby damage to numerous buildings of all types and all damage levels was recorded to inform knowledge of the vulnerability of different types of buildings in the Padang region.
9
Padang Earthquake Reconnaissance Workshop
The survey was undertaken by ten field teams supported by a team of support staff. The detailed survey was undertaken by two teams consisting of experienced scientists and engineers from Indonesia, Australia, New Zealand and Singapore. The detailed survey teams surveyed approximately 400 buildings (300 schools and 100 medical facilities) which formed a subset of the approximately 4000 buildings surveyed for the population survey over a three week period. After the first week of surveying a draft report of recommendations was submitted to the World Bank and AIFDR. The population survey was undertaken by eight teams consisting of a mix of three or four Indonesian undergraduate engineering students, postgraduate students and professional engineers together with experienced scientists and engineers from Indonesia, Australia, New Zealand and Singapore. The teams were supported by Indonesian translators and drivers. The support staff provided liaison, logistical support and GIS services. They also recorded the survey information electronically on a daily basis. Detailed Survey The detailed survey teams conducted inspections of school and medical facility buildings. About 1 hour was spent surveying each building. Although the teams completed the population survey form at each building, their requirement to record a greater level of detail information regarding the earthquake damage led to the development of the detailed survey form. This form was targeted at the particular types of building structures used in Padang for school and medical facility buildings; commonly reinforced concrete frames with masonry infill and, to a lesser extent, confined masonry. The detailed survey teams were assisted by the provision of maps showing the location of the target buildings together with their GPS coordinates. The following lessons were learnt during the detailed survey on the survey process itself:- The colour maps with locations of target buildings were very useful. It would be useful if the cameras could record the lat/long coordinates onto the photos. It is essential to record the building orientation. Supplied compasses were not very useful for this
due to long stabilisation times. Integration of the two detail survey groups was difficult due to necessity of doing it by
international mobile phones. Radios or local mobile phones would have been better. Photos were not taken as well as they may have been. The groups needed a dedicated person to liaise with school staff and pupils while the surveyors
undertook the survey thus minimising the delay experienced by the survey group. Safety: uptake of PPE was not universal and tended to be discarded after a while. Problem with
people entering damaged buildings without notifying a person on the outside where they were. There is a need for an identified communication route to a local authority for when the survey
group notes buildings that are dangerously damaged and still in use. It was found that a single survey form is required across survey groups. It was further noted that
the production of a universal survey form is understood to be within GEM’s remit. Difficulty in distinguishing between confined masonry and RC frame with infill masonry. Variety within URM and confined masonry categories needs to be captured on survey forms, e.g.
river stone URM with pyramid URM footings is different to brick URM. Having the building irregularity codes on a separate sheet was difficult to use and the types
identified were not tailored to Indonesian building types. The following characteristics were noted during the detail survey as frequently contributing to earthquake damage:- Concrete appeared to be of very poor quality. Reinforcing steel appeared to be soft compared to NZ and Australian steels.
10

Padang Earthquake Reconnaissance Workshop
Reinforcement detailing was universally poor. Repair work that was observed was not ‘building back better’. There was an absence of shear walls. Retrofit of such walls would go a long way towards
improving performance in the next earthquake. Masonry gable walls often failed in face loading due to a lack of lateral restraint. Bricks were poorly fired. Brick masonry often had very thick mortar joints. Population Based Survey The eight detailed survey teams operated in two groups of four teams. The survey area within Padang was split into nine sectors that were divided between the two groups. Typically each group would spend two days surveying a sector in which representative streets would be chosen and every building on those streets would be surveyed by the teams. Towards the end of the survey period the detailed survey teams ventured outside the city area to survey buildings further afield to the east and south. This yielded data over a wider geographic range and terrain types. The detailed survey utilised a standard paper form consisting of both sides of a single sheet of A4 paper. The design of the form was a difficult balance of capturing the maximum level of detail of information and the space available on the paper sheet. Position of surveyed buildings was recorded by means of a GPS device with the latitude and longitude manually recorded onto the paper form. Photos were taken with digital camera. Each team surveyed approximately 20 buildings during a day. Each day the support team transcribed the information from the paper forms into an electronic database and attached the photos to each record. Feedback from the support team was useful in detecting systematic errors that may have been creeping into recording of survey data. Data regarding the inhabitants and their experiences during the earthquake were captured by interview where possible. The interview was also used to assign a MMI value to the building being surveyed. The following lessons were learnt during the population survey:- It was noted that a good interpreter made a big difference to the performance of the groups. Access to many cars with drivers is essential for efficient surveying. The supplied GPS units were very slow in providing coordinates. Most groups relied on personal
units or local university provided units after the first few days. It was noted that the first photo at a site should be of the front of the building and the second of
an identifying address if there is one. MASW SURVEY AND PGA ESTIMATE Objectives The objectives of this work are to estimate the spatial variation of peak ground acceleration (PGA) across the region due to 30 September 2009 earthquake. The spatial extent of the PGA attribution was to cover the post disaster surveyed buildings in city of Padang and city of Pariaman. Specific objectives of the work were:- Conduct a multi-channel analysis of surface wave (MASW) survey within the city of Padang and
Pariaman. Conduct an analysis of the 30 September 2009 earthquake source properties and estimation
through ground motion attenuation to estimate the level of peak ground acceleration at reference baserock.
Conduct site-response analyses though wave propagation analysis from base-rock to ground surface to estimate spatial variation of PGA across the city of Padang and the town of Pariaman.
11

Padang Earthquake Reconnaissance Workshop
Teams The earthquake ground motion analysis and MASW survey to estimate a spatial PGA for City of Padang and Pariaman has been conducted by the Center for Disaster Mitigation-Institute of Technology Bandung (CDM-ITB) team, with support from Universit of Andalas-Padang. PGA Estimate Firstly, a seismic attenuation analysis of the 30 September earthquake event was conducted. The analysis had been conducted by identifying the earthquake source characteristics and distance to sites of interest. In this process, deterministic seismic hazard analysis (DSHA) was conducted to estimate the spatial distribution of peak ground acceleration (PGA) at base-rock. The analysis was conducted using EZ-FRISK 7.32 software. Attenuation functions by Young’s Intraslab (1997) has been adopted to represent the subduction earthquake sources. Secondly, a site-response analysis (SRA) was carried out to estimate peak ground surface acceleration and response-spectra by considering predicted input motions and dynamic soil properties of the site. In the case of city of Padang and Pariaman, there is no strong motion data available yet, therefore the simplest and conventional method to generate input motions is performed by scaling available strong motion records from other sites. Strong motion records are commonly scaled to match target PBA of the site of interest spectral-matching techniques. In this study, spectral-matching techniques proposed by Abrahamson that is adopted and built in the EZ-FRISK Computer Program Version 7.2 is utilized. Then, time-domain wave propagation analyses from baserock to ground surface were conducted using the NERA (Non-linear Earthquake Response Analysis) computer program (Bardet and Tobita, 2001). Results of Spatial PGA Distribution Based on result of seismic wave propagation analysis, which was carried out by considering the Vs30 data for each location in the sub district and the estimated earthquake PGA at the base rock, a spatial PGA distribution map at the ground surface of city of Padang and Pariaman have been developed. The map for Padang is presented in Figure 1.
12
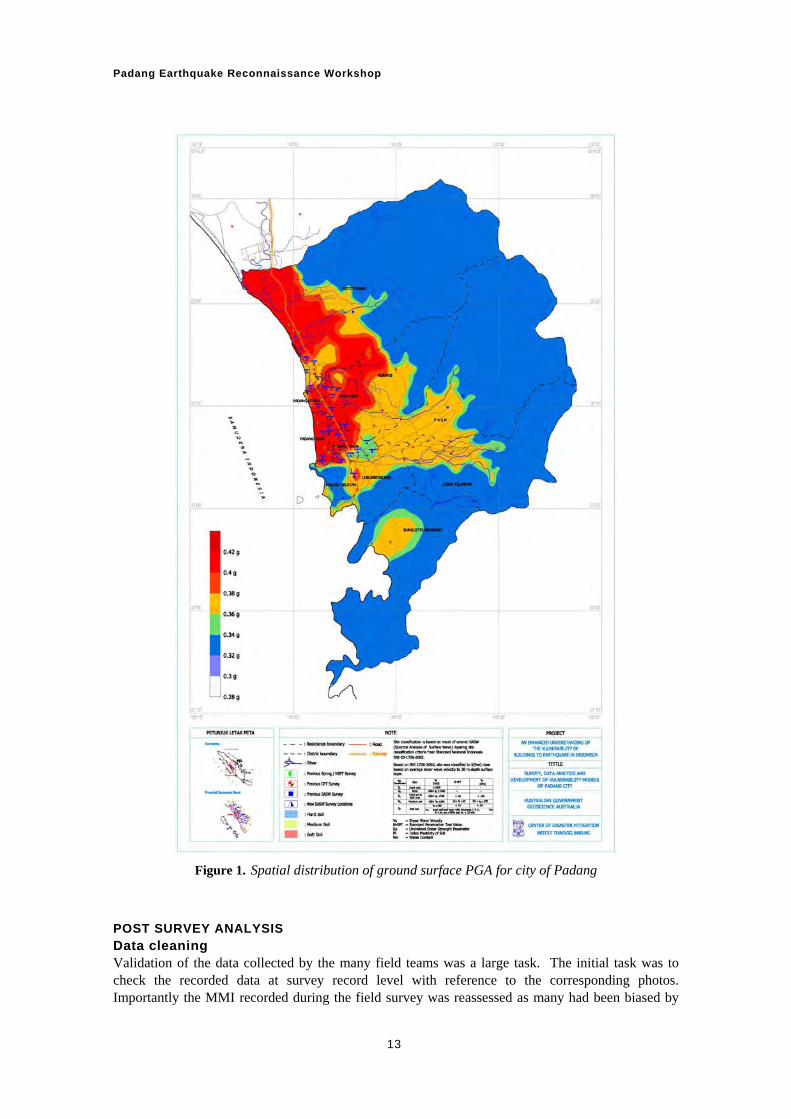
Padang Earthquake Reconnaissance Workshop
Figure 1. Spatial distribution of ground surface PGA for city of Padang
POST SURVEY ANALYSIS Data cleaning Validation of the data collected by the many field teams was a large task. The initial task was to check the recorded data at survey record level with reference to the corresponding photos. Importantly the MMI recorded during the field survey was reassessed as many had been biased by
13

Padang Earthquake Reconnaissance Workshop
the damage to the surveyed building rather than looking more broadly at the neighbourhood outcomes. Additional survey entries were also obtained by translating approximately 400 survey records made by a New Zealand team, who were in Padang prior to the AIFDR sponsored survey, into the format of the population survey form. Review of the population survey form The workshop noted the following problems with the survey form used in Padang: Survey form did not address multi-use buildings well. Survey form did not address buildings with multiple structural systems (eg recording where a RC
frame has a soft storey). Age could be difficult to determine and was often provided by interview. Pressed metal roof tiles may have been misclassified as heavy clay roof tiles. The MMI descriptions could be improved and be provided in Indonesian. There is a need for descriptions of different masonry types and of different levels of damage to
masonry to aid surveyors. These could be provided by a data dictionary of example photos. Reparation costing More rigour was needed to the associate the damage index (defined as repair cost / replacement cost) to damage state number assigned in the field during the population survey. To provide this a quantity surveyor style costing of repairs to damaged buildings was undertaken for two types of buildings: a 3 storey reinforced concrete frame office building and a generic single storey confined masonry building. Detailed measurements were taken in the field of a representative 3-storey office building and representative dimensions were assigned for a single storey confined masonry building. Detailed descriptions of physical damage to each building were assigned to each element of the building fabric for each damage state together with the required work to effect repairs to a standard similar to that observed in Padang. The repairs for each damage state were costed using Padang repair rates supplied by the Institut Teknologi Bandung (ITB). Note that some elements (e.g. deep foundations for the concrete framed building) were not costed for replacement resulting in the calculated damage index never reaching 1.0. For the residential buildings the damage index could exceed 1.0 because the demolition costs made up a significant component of full repair whereas the foundations were relatively cheaper. A smooth curve was fitted to the plotted values of damage index versus damage state number. Vulnerability assessment Vulnerability represents the average damage to a population of buildings of a given type as a function of hazard exposure magnitude. It is normally provided as a Damage Index for a population of structurally similar buildings. The hazard measure adopted was Modified Mercalli Intensity (MMI) which is a measure of the locally felt intensity of ground shaking. At the outset of the survey it was anticipated that a variation in MMI would be observed across the survey area. However, following refinement of the MMI intensities with reference to regolith, very little variation in MMI was observed with nearly all locations assessed as MMI 8 with a small portion (9%) assessed as MMI 7. The MMI intensities were further adjusted based on the PGA estimates derived form the MASW analysis. All local PGA values fell in the MMI range. Hence all surveyed points were grouped into a single set of results and vulnerability calculated for a single hazard magnitude that may be taken as MMI 8. The vulnerability results are given in Table 2. Fragility represents the probability of a given building sustaining a predetermined level of damage for a given hazard magnitude. Fragilities were calculated for well represented building categories in the building schema. The fragility results are given in Table 3.
14
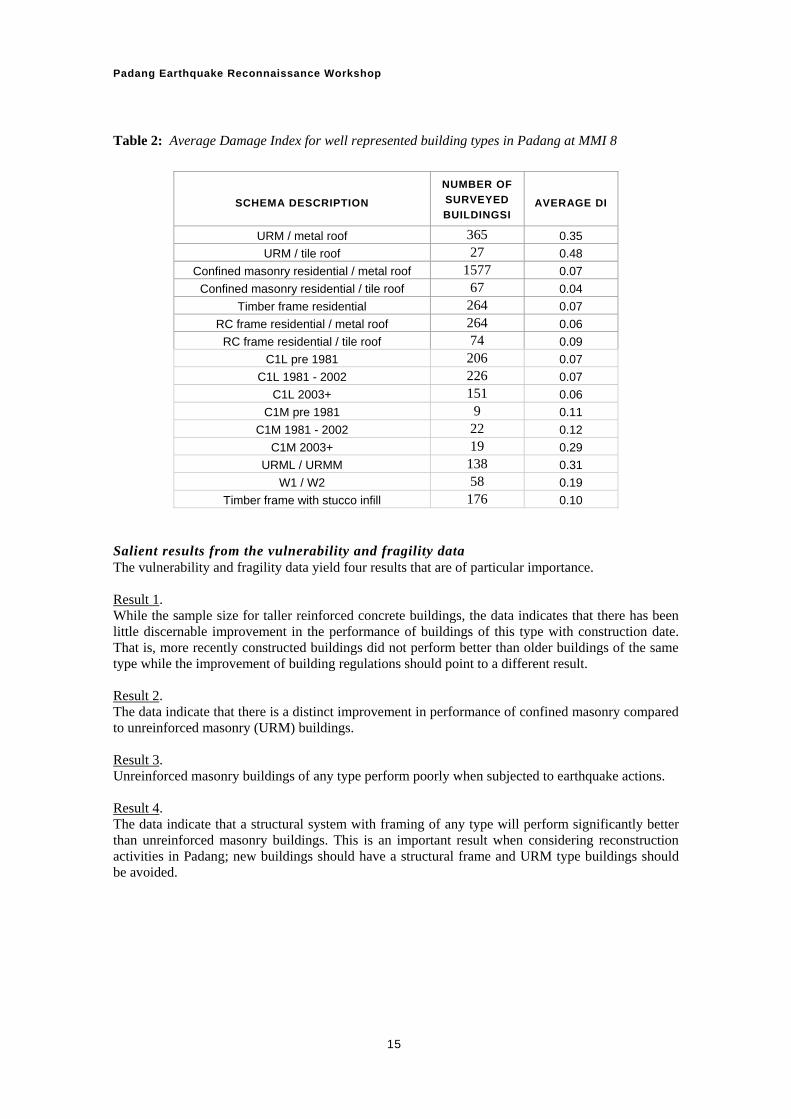
Padang Earthquake Reconnaissance Workshop
Table 2: Average Damage Index for well represented building types in Padang at MMI 8
SCHEMA DESCRIPTION
NUMBER OF
SURVEYED
BUILDINGSI AVERAGE DI
URM / metal roof 365 0.35
URM / tile roof 27 0.48
Confined masonry residential / metal roof 1577 0.07
Confined masonry residential / tile roof 67 0.04
Timber frame residential 264 0.07
RC frame residential / metal roof 264 0.06
RC frame residential / tile roof 74 0.09
C1L pre 1981 206 0.07
C1L 1981 - 2002 226 0.07
C1L 2003+ 151 0.06
C1M pre 1981 9 0.11
C1M 1981 - 2002 22 0.12
C1M 2003+ 19 0.29
URML / URMM 138 0.31
W1 / W2 58 0.19
Timber frame with stucco infill 176 0.10
Salient results from the vulnerability and fragility data The vulnerability and fragility data yield four results that are of particular importance. Result 1. While the sample size for taller reinforced concrete buildings, the data indicates that there has been little discernable improvement in the performance of buildings of this type with construction date. That is, more recently constructed buildings did not perform better than older buildings of the same type while the improvement of building regulations should point to a different result. Result 2. The data indicate that there is a distinct improvement in performance of confined masonry compared to unreinforced masonry (URM) buildings. Result 3. Unreinforced masonry buildings of any type perform poorly when subjected to earthquake actions. Result 4. The data indicate that a structural system with framing of any type will perform significantly better than unreinforced masonry buildings. This is an important result when considering reconstruction activities in Padang; new buildings should have a structural frame and URM type buildings should be avoided.
15
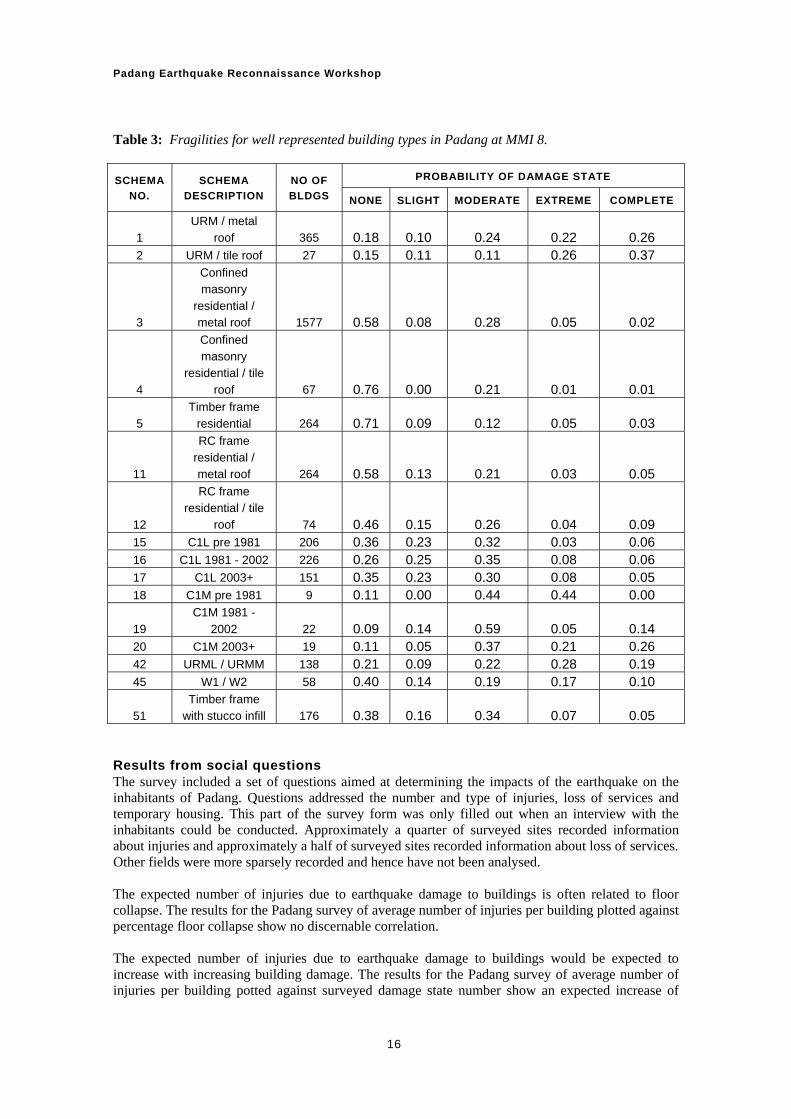
Padang Earthquake Reconnaissance Workshop
Table 3: Fragilities for well represented building types in Padang at MMI 8.
PROBABILITY OF DAMAGE STATE SCHEMA
NO.
SCHEMA
DESCRIPTION
NO OF
BLDGS NONE SLIGHT MODERATE EXTREME COMPLETE
1 URM / metal
roof 365 0.18 0.10 0.24 0.22 0.26 2 URM / tile roof 27 0.15 0.11 0.11 0.26 0.37
3
Confined masonry
residential / metal roof 1577 0.58 0.08 0.28 0.05 0.02
4
Confined masonry
residential / tile roof 67 0.76 0.00 0.21 0.01 0.01
5 Timber frame
residential 264 0.71 0.09 0.12 0.05 0.03
11
RC frame residential / metal roof 264 0.58 0.13 0.21 0.03 0.05
12
RC frame residential / tile
roof 74 0.46 0.15 0.26 0.04 0.09 15 C1L pre 1981 206 0.36 0.23 0.32 0.03 0.06 16 C1L 1981 - 2002 226 0.26 0.25 0.35 0.08 0.06 17 C1L 2003+ 151 0.35 0.23 0.30 0.08 0.05 18 C1M pre 1981 9 0.11 0.00 0.44 0.44 0.00
19 C1M 1981 -
2002 22 0.09 0.14 0.59 0.05 0.14 20 C1M 2003+ 19 0.11 0.05 0.37 0.21 0.26 42 URML / URMM 138 0.21 0.09 0.22 0.28 0.19 45 W1 / W2 58 0.40 0.14 0.19 0.17 0.10
51 Timber frame
with stucco infill 176 0.38 0.16 0.34 0.07 0.05 Results from social questions The survey included a set of questions aimed at determining the impacts of the earthquake on the inhabitants of Padang. Questions addressed the number and type of injuries, loss of services and temporary housing. This part of the survey form was only filled out when an interview with the inhabitants could be conducted. Approximately a quarter of surveyed sites recorded information about injuries and approximately a half of surveyed sites recorded information about loss of services. Other fields were more sparsely recorded and hence have not been analysed. The expected number of injuries due to earthquake damage to buildings is often related to floor collapse. The results for the Padang survey of average number of injuries per building plotted against percentage floor collapse show no discernable correlation. The expected number of injuries due to earthquake damage to buildings would be expected to increase with increasing building damage. The results for the Padang survey of average number of injuries per building potted against surveyed damage state number show an expected increase of
16
Padang Earthquake Reconnaissance Workshop
injuries versus damage state except for the ‘complete collapse’ damage state. The unexpected result for Damage State 9 (complete collapse) may be due to a lack of inhabitants to interview at sites of completely collapsed buildings. The survey results for loss of services displayed no correlation to type of building, building usage or severity of damage. These results imply that loss of services is due to failures within the supply chain rather than building specific factors. BUILDING STOCK CATEGORISATION The workshop discussed the Building Schema that had been used during the Padang survey. The specific observations were: Noted that the building schema needs more granularity to cover building types such as:
Different wall thickness URM, thick multiple leaf URM versus thin single or double leaf URM;
Different masonry types: brick versus river rock URM versus mud brick / mortar; Different extents of masonry infill to concrete frame buildings; Reorder the schema with URM at the top of both parts.
Noted that it would be better to have the schema divided on the basis of height (rather than residential / non-residential usage) as single storey buildings have distinct construction types compared to taller buildings.
Consider the possibility of using a tree structure to classify building types. Noted that there are no age related changes in house construction qualities or types. Noted that some building usages may have design requirements imposed on them, e.g. the
department of education has specific requirements for school buildings. Noted that the schema appears to be suitable for multi-hazard work. Based on the above comments the building stock schema was to be revised with out-of-session consultation with the workshop participants. PRELIMINARY VULNERABILITY MODELS Damage Threshold for Indonesian Structures To utilise the available damage data from earlier Indonesian earthquakes in the development of vulnerability knowledge, it is necessary that such observations be related to the intensity of shaking felt. There is little data immediately available as previous survey reports were not compiled with the development of vulnerability knowledge as an objective. It is known that after the Yogyakarta earthquake a distinct difference in vulnerability of confined masonry structures was observed that corresponded to a difference in the quality of reinforcing to the confining concrete elements. Earthquake Vulnerability Research Opportunities The workshop discussed a wide range of potential future research that would advance the knowledge of the vulnerability of Indonesian building types to earthquake damage. Future experimental work should be designed to address design and construction deficiencies observed in the field and gaps in hazard knowledge. The topics discussed are summarised below:- Indonesian specific attenuation models development. Examination of the survey data from previous Indonesian earthquakes and compared to the data
from the Padang survey. Utilisation of the opportunity to conduct full scale testing of damaged buildings in Padang prior
to demolition. Research could be undertaken into retrofit options for existing building types (as opposed to new-
build). This could be focussed on a particular building type, e.g. schools. This would involve:
17
Padang Earthquake Reconnaissance Workshop
Identification of typical construction types and details Assessment (theoretical and experimental) of strength and ductility Design of remedial details.
Research on confinement strategies for existing URM. Acquisition of knowledge of the engineering properties of materials as constructed in Padang. Investigation of retrofit details for masonry gable walls and other face loaded masonry walls (e.g.
internal partitions). Production of a design standard for masonry structures. The design guidelines could be tailored
for different seismic zones. Investigate what can be done to introduce reinforced concrete block to construction in Indonesia. Numerical analysis of non-ductile RC frames to identify deficiencies followed by an
experimental program to establish the magnitude of the deficiencies. May be able to utilise work done in other areas of the world with similar construction to understand legacy buildings, e.g. Turkey.
It was noted form the above that a strong research program will tend to cultivate a greater level of expertise in Indonesia as more engineers get exposed to the consequences of poor design and construction. Future Utilisation of Padang Data The workshop discussed future work that could be done using the survey data from Padang. The items suggested are listed below. Consider the use of ground motion measures other than base rock pga as indicators for MMI. Examine the effect of building orientation (remembering that vulnerability models are omni-
directional). Examine different E/W and N/S ground motions. Examine the relevance of Padang vulnerability data to other areas of Indonesia. This may require
surveys of building types in other areas to identify regional building peculiarities, e.g. the prevalence of metal roof tiles in Padang.
De-aggregate URM categories. Record building specific damage from 30 September earthquake so that comparison can be made
to damage to the same buildings from future earthquakes. Publish a combined journal paper. Run a workshop in Indonesia to present the results of the survey. Noted that this would need to
be in Indonesian. POST DISASTER SURVEY ACTIVITY Methodologies The workshop reviewed the data capture methodology used in Padang and noted what worked well and what didn’t. The following worked well: The forms were physically easy to fill out; The forms and other equipment continued to function in wet weather; Using a paper form was a reliable method that didn’t rely on power supply or software; The equipment was inexpensive to purchase and could be obtained quickly during the short
mobilisation period prior to the survey; The paper form was easy to alter in the field. The following weaknesses were noted: Transcription of the data from the paper forms to an electronic database was heavy handed and
introduced errors; Hand writing of GPS coordinates from an electronic device introduced another source of error; There was a communication barrier at times with too few bilingual staff;
18
Padang Earthquake Reconnaissance Workshop
19
• The rotation of tasks within groups led to variability in the quality of recorded data; • Charging sufficient batteries overnight between days of surveying was problematical. The workshop discussed alternate technologies that could be used in the future including the Geoscience developed RICS system for rapidly capturing building inventory data. In particular is was observed that the local participants, including the students, showed a high level of information technical competency indicating that the utilisation of hand-held computer technology with pre-programmed survey templates would be a practical substitution for paper media. Future Indonesian Post Disaster Survey Activity A major problem encountered during the Padang survey was insufficient time for adequate training of survey staff in Padang. To overcome this for future surveys it is recommended that a workshop is held in Indonesia to train prospective surveyors so that future surveys will benefit from a pool of locally trained surveyors. NEXT STEPS The next phases of work after the workshop include undertaking the out-of-session heuristic ranking exercise to develop heuristic vulnerability curves for the revised Indonesian Building Schema, prepare the Reconnaissance Report for AIFDR, forward research proposals to AIFDR, forward recommendations for future workshops in Indonesia to AIFDR.
Vulnerability Model Development HEURISTIC IN-SESSION PROCESS FOR BENCHMARK CURVES The workshop attendees developed heuristic vulnerability curves for nine Indonesian building types. The curves are described by specifying four sets of MMI / Damage Index coordinates through which a vulnerability curve, expressed as a cumulative log normal distribution curve was fitted. The target values adopted are given in Table 4 with the MMI 8 value taken directly form the outcomes of the Padang earthquake survey data analysis. Curves were fitted to the target data using the GA developed Eloss software. The curves are defined as cumulative log-normal probability distribution curves defined by values for their median and beta as given in Table 5. Fragility curves were also derived from the vulnerability curves as cumulative log-normal probability distribution curves defined by values for their median and beta as given in Table 6.
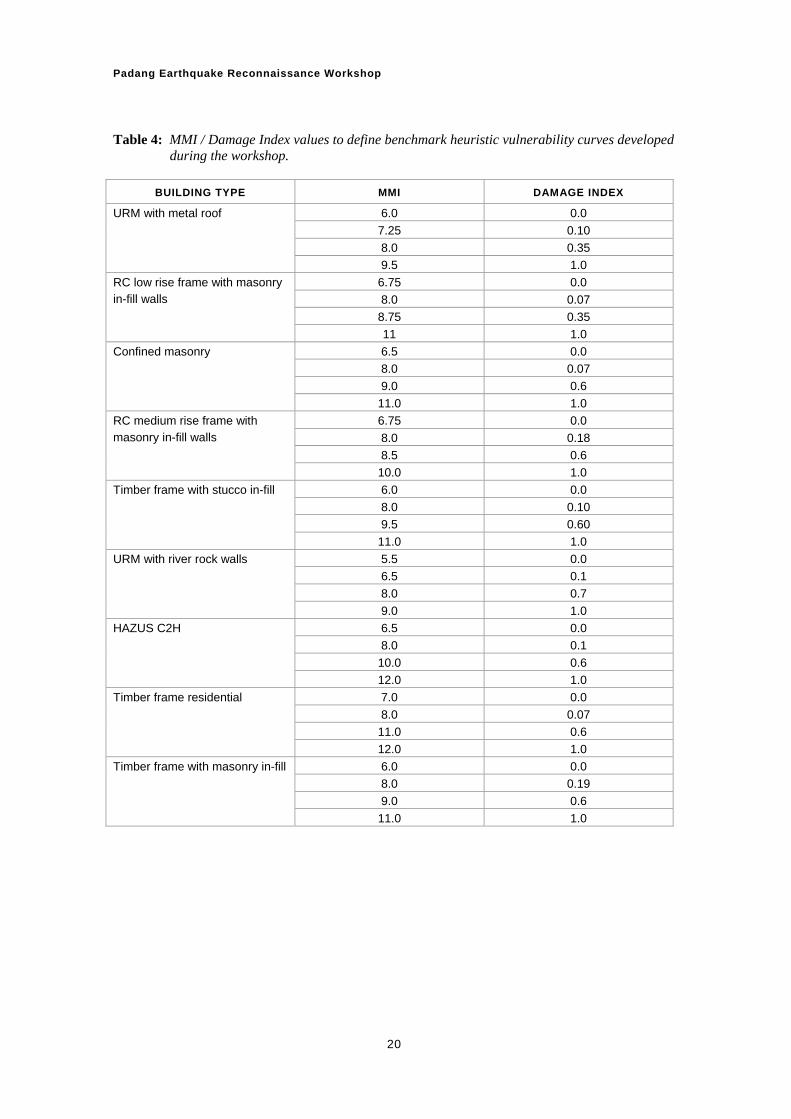
Padang Earthquake Reconnaissance Workshop
Table 4: MMI / Damage Index values to define benchmark heuristic vulnerability curves developed during the workshop.
BUILDING TYPE MMI DAMAGE INDEX
6.0 0.0
7.25 0.10
8.0 0.35
URM with metal roof
9.5 1.0
6.75 0.0
8.0 0.07
8.75 0.35
RC low rise frame with masonry in-fill walls
11 1.0
6.5 0.0
8.0 0.07
9.0 0.6
Confined masonry
11.0 1.0
6.75 0.0
8.0 0.18
8.5 0.6
RC medium rise frame with masonry in-fill walls
10.0 1.0
6.0 0.0
8.0 0.10
9.5 0.60
Timber frame with stucco in-fill
11.0 1.0
5.5 0.0
6.5 0.1
8.0 0.7
URM with river rock walls
9.0 1.0
6.5 0.0
8.0 0.1
10.0 0.6
HAZUS C2H
12.0 1.0
7.0 0.0
8.0 0.07
11.0 0.6
Timber frame residential
12.0 1.0
6.0 0.0
8.0 0.19
9.0 0.6
Timber frame with masonry in-fill
11.0 1.0
20
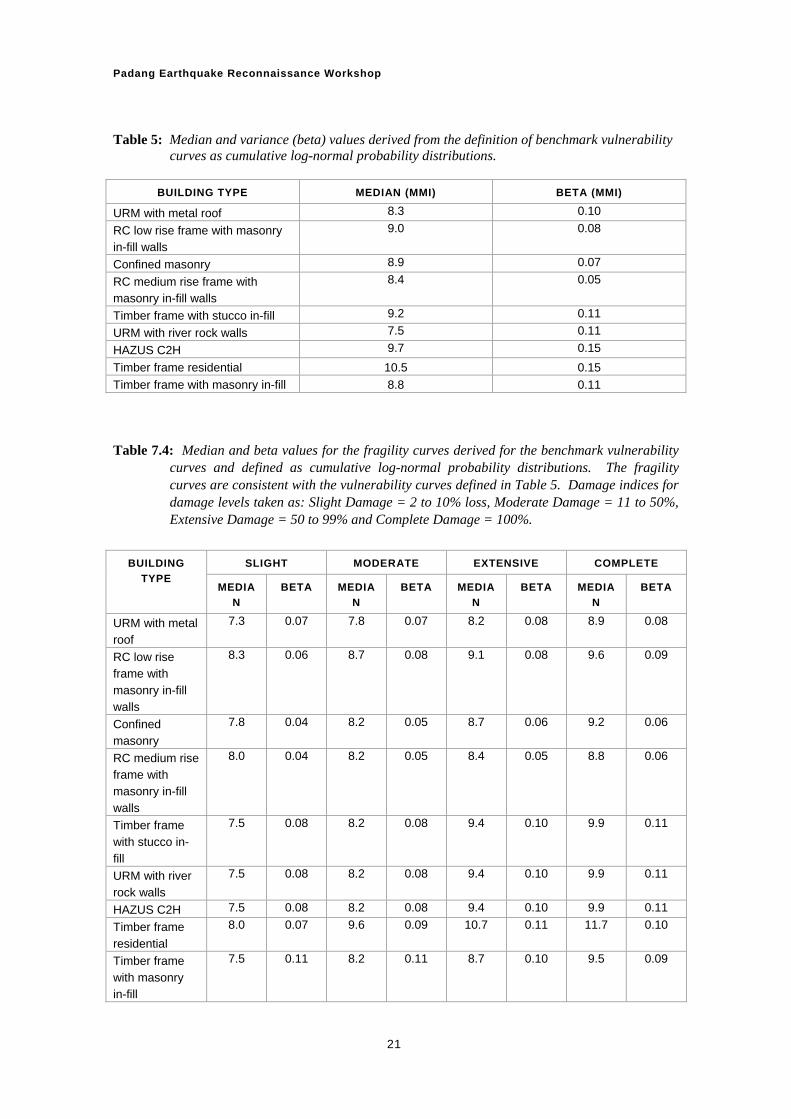
Padang Earthquake Reconnaissance Workshop
Table 5: Median and variance (beta) values derived from the definition of benchmark vulnerability curves as cumulative log-normal probability distributions.
BUILDING TYPE MEDIAN (MMI) BETA (MMI)
URM with metal roof 8.3 0.10
RC low rise frame with masonry in-fill walls
9.0 0.08
Confined masonry 8.9 0.07
RC medium rise frame with masonry in-fill walls
8.4 0.05
Timber frame with stucco in-fill 9.2 0.11
URM with river rock walls 7.5 0.11
HAZUS C2H 9.7 0.15
Timber frame residential 10.5 0.15
Timber frame with masonry in-fill 8.8 0.11
Table 7.4: Median and beta values for the fragility curves derived for the benchmark vulnerability
curves and defined as cumulative log-normal probability distributions. The fragility curves are consistent with the vulnerability curves defined in Table 5. Damage indices for damage levels taken as: Slight Damage = 2 to 10% loss, Moderate Damage = 11 to 50%, Extensive Damage = 50 to 99% and Complete Damage = 100%.
SLIGHT MODERATE EXTENSIVE COMPLETE BUILDING
TYPE MEDIA
N
BETA MEDIA
N
BETA MEDIA
N
BETA MEDIA
N
BETA
URM with metal roof
7.3 0.07 7.8 0.07 8.2 0.08 8.9 0.08
RC low rise frame with masonry in-fill walls
8.3 0.06 8.7 0.08 9.1 0.08 9.6 0.09
Confined masonry
7.8 0.04 8.2 0.05 8.7 0.06 9.2 0.06
RC medium rise frame with masonry in-fill walls
8.0 0.04 8.2 0.05 8.4 0.05 8.8 0.06
Timber frame with stucco in-fill
7.5 0.08 8.2 0.08 9.4 0.10 9.9 0.11
URM with river rock walls
7.5 0.08 8.2 0.08 9.4 0.10 9.9 0.11
HAZUS C2H 7.5 0.08 8.2 0.08 9.4 0.10 9.9 0.11
Timber frame residential
8.0 0.07 9.6 0.09 10.7 0.11 11.7 0.10
Timber frame with masonry in-fill
7.5 0.11 8.2 0.11 8.7 0.10 9.5 0.09
21
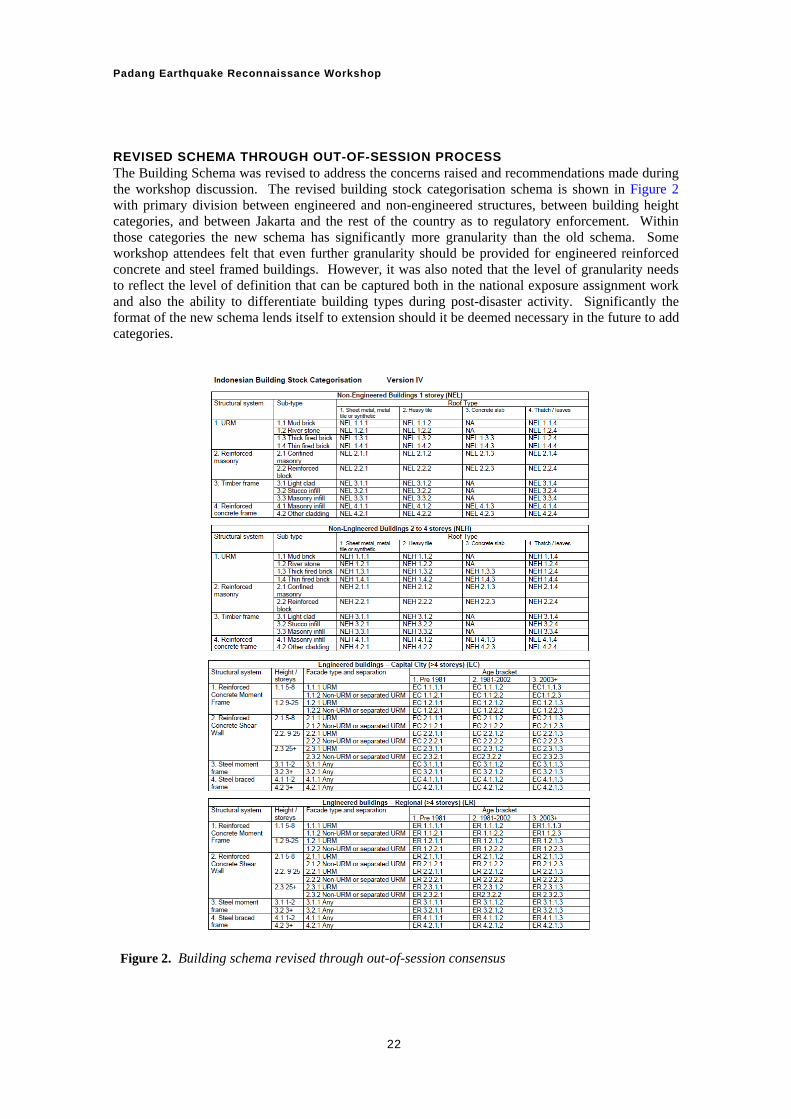
Padang Earthquake Reconnaissance Workshop
REVISED SCHEMA THROUGH OUT-OF-SESSION PROCESS The Building Schema was revised to address the concerns raised and recommendations made during the workshop discussion. The revised building stock categorisation schema is shown in Figure 2 with primary division between engineered and non-engineered structures, between building height categories, and between Jakarta and the rest of the country as to regulatory enforcement. Within those categories the new schema has significantly more granularity than the old schema. Some workshop attendees felt that even further granularity should be provided for engineered reinforced concrete and steel framed buildings. However, it was also noted that the level of granularity needs to reflect the level of definition that can be captured both in the national exposure assignment work and also the ability to differentiate building types during post-disaster activity. Significantly the format of the new schema lends itself to extension should it be deemed necessary in the future to add categories.
Figure 2. Building schema revised through out-of-session consensus
22
Padang Earthquake Reconnaissance Workshop
HEURISTIC OUT-OF-SESSION PROCESS FOR NATIONAL SUITE The benchmark curves populate only a small portion of the total building categorisation schema. Consequently the process for populating the full revised schema with reference to the benchmark curves derived was demonstrated and discussed. The primary tool is an Excel spreadsheet with the benchmark curves pre-loaded. Each workshop attendee agreed to assign a median and beta value to each of the other categories which would place the building type vulnerability in the correct relative position on the vulnerability curve graph. Once all workshop attendees had returned their assignment then each of the respondent assessments would be weighted and combined to produce a fully populated national suite of earthquake vulnerability curves. With the finalisation of the revised building stock schema this out of session process was underway at the time of reporting. As the benchmark curves are refined the national suite will be adjusted in a relative fashion.
Issues & Recommendations The workshop made the following recommendations:-
That the AIFDR facilitate a workshop to be convened in Indonesia to communicate the results of the Padang reconnaissance to the Indonesian engineering community;
That the AIFDR facilitate a workshop be held in Indonesia to train Indonesian engineers in post-earthquake survey techniques. The scarcity of trained staff was perceived as an impediment to efficient and productive future surveys;
It appears that there is a scarcity of earthquake resistant design expertise within the Indonesian engineering profession. For example, it is understood that earthquake design is only taught as an elective subject that many students do not take. This could be addressed by AIFDR sponsoring the promotion of earthquake engineering in schools of engineering and through their sponsorship of post-graduate courses in earthquake design.
That AIFDR consider sponsoring research covering the suggested topics noted under Earthquake Vulnerability Research Opportunities; and,
The ‘Build Back Better’ campaign must address the widespread construction deficiencies noted in the World Bank report.
Acknowledgements The post-disaster reconnaissance in Padang was funded by the AIFDR facility in Jakarta.
23

The 30th September 2009 West Sumatra Earthquake Padang Region Damage Survey
Appendix A5 Survey Information Metadata
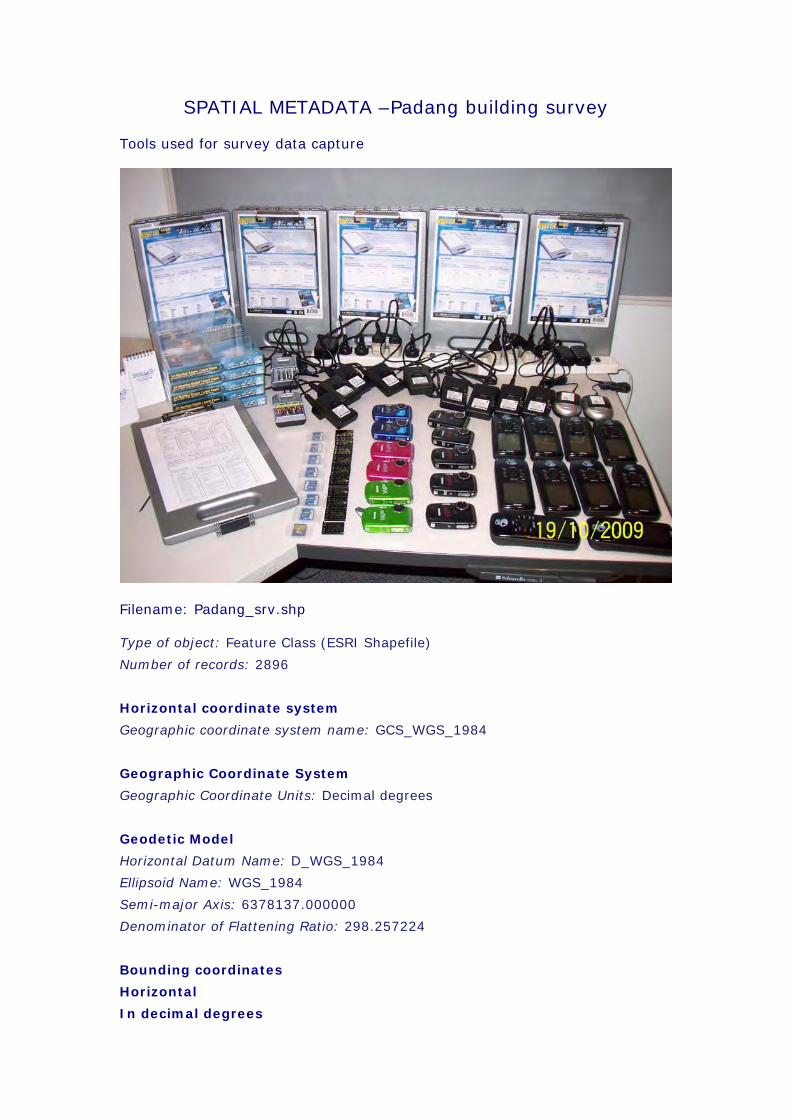
SPATIAL METADATA –Padang building survey Tools used for survey data capture
Filename: Padang_srv.shp Type of object: Feature Class (ESRI Shapefile)
Number of records: 2896
Horizontal coordinate system
Geographic coordinate system name: GCS_WGS_1984
Geographic Coordinate System
Geographic Coordinate Units: Decimal degrees
Geodetic Model
Horizontal Datum Name: D_WGS_1984
Ellipsoid Name: WGS_1984
Semi-major Axis: 6378137.000000
Denominator of Flattening Ratio: 298.257224
Bounding coordinates
Horizontal
In decimal degrees
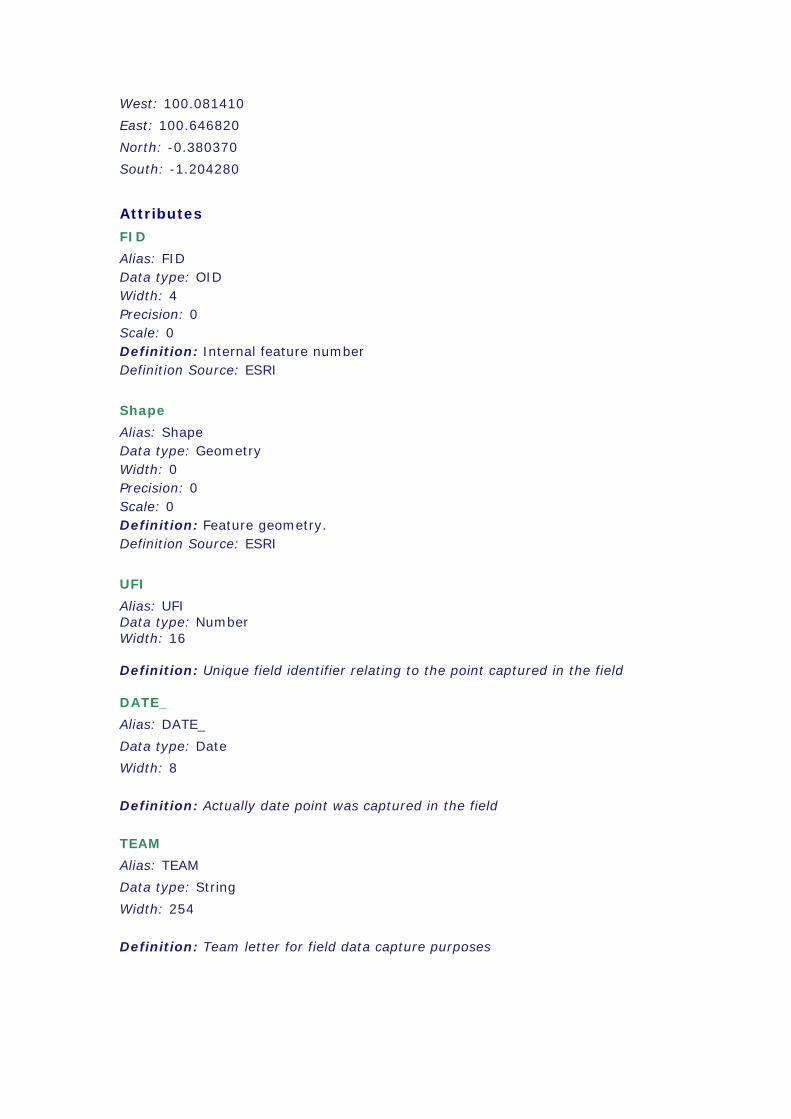
West: 100.081410
East: 100.646820
North: -0.380370
South: -1.204280
Attributes
FID
Alias: FID Data type: OID Width: 4 Precision: 0 Scale: 0 Definition: Internal feature number Definition Source: ESRI
Shape
Alias: Shape Data type: Geometry Width: 0 Precision: 0 Scale: 0 Definition: Feature geometry. Definition Source: ESRI
UFI
Alias: UFI Data type: Number Width: 16
Definition: Unique field identifier relating to the point captured in the field
DATE_
Alias: DATE_
Data type: Date
Width: 8
Definition: Actually date point was captured in the field
TEAM
Alias: TEAM
Data type: String
Width: 254
Definition: Team letter for field data capture purposes
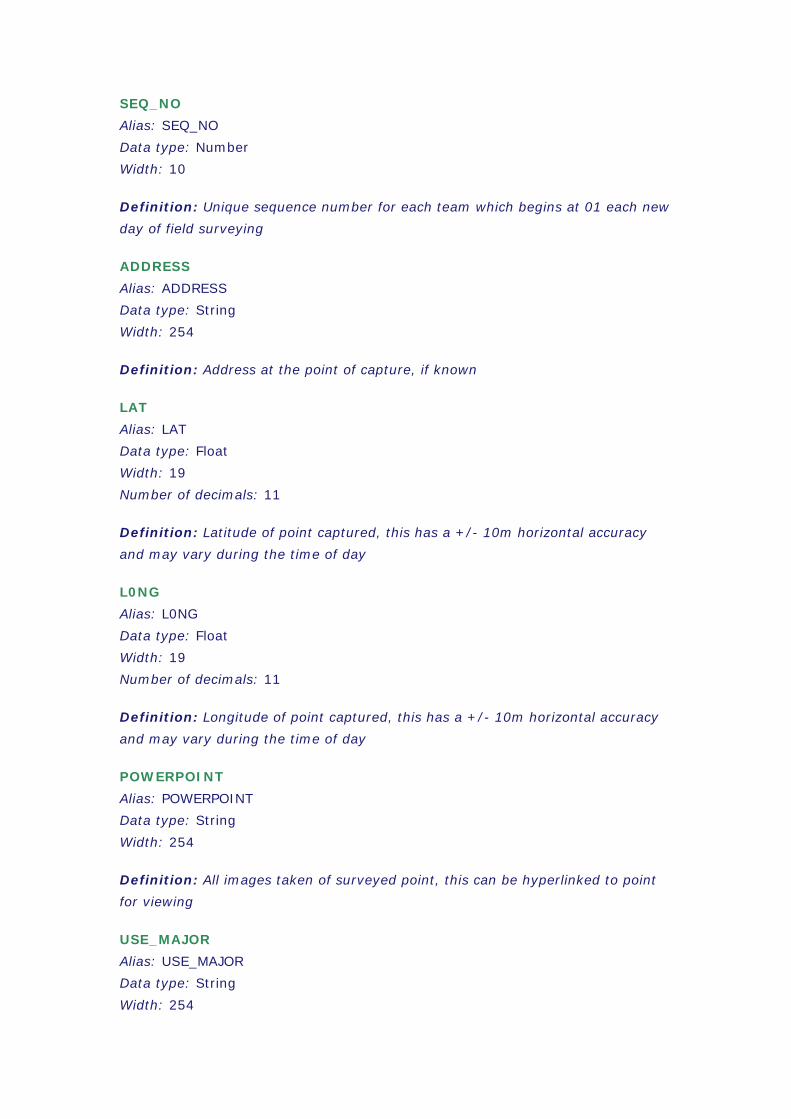
SEQ_NO
Alias: SEQ_NO
Data type: Number
Width: 10
Definition: Unique sequence number for each team which begins at 01 each new
day of field surveying
ADDRESS
Alias: ADDRESS
Data type: String
Width: 254
Definition: Address at the point of capture, if known
LAT
Alias: LAT
Data type: Float
Width: 19
Number of decimals: 11
Definition: Latitude of point captured, this has a +/- 10m horizontal accuracy
and may vary during the time of day
L0NG
Alias: L0NG
Data type: Float
Width: 19
Number of decimals: 11
Definition: Longitude of point captured, this has a +/- 10m horizontal accuracy
and may vary during the time of day
POWERPOINT
Alias: POWERPOINT
Data type: String
Width: 254
Definition: All images taken of surveyed point, this can be hyperlinked to point
for viewing
USE_MAJOR
Alias: USE_MAJOR
Data type: String
Width: 254

Definition: Main building usage
USE_MINOR
Alias: USE_MINOR
Data type: String
Width: 254
Definition: Secondary building usage
STRUCTURE
Alias: STRUCTURE
Data type: String
Width: 254
Definition: Structural information of the building surveyed
WALL_TYPE
Alias: WALL_TYPE
Data type: String
Width: 254
Definition: Wall type/material of building
ROOF_TYPE
Alias: ROOF_TYPE
Data type: String
Width: 254
Definition: Roof material of surveyed building – see attached documentation for
more detail
FLOOR
Alias: FLOOR
Data type: String
Width: 254
Definition: Floor type of surveyed building
STOREY
Alias: STOREY
Data type: Number
Width: 10
Definition: Number of storeys of surveyed building
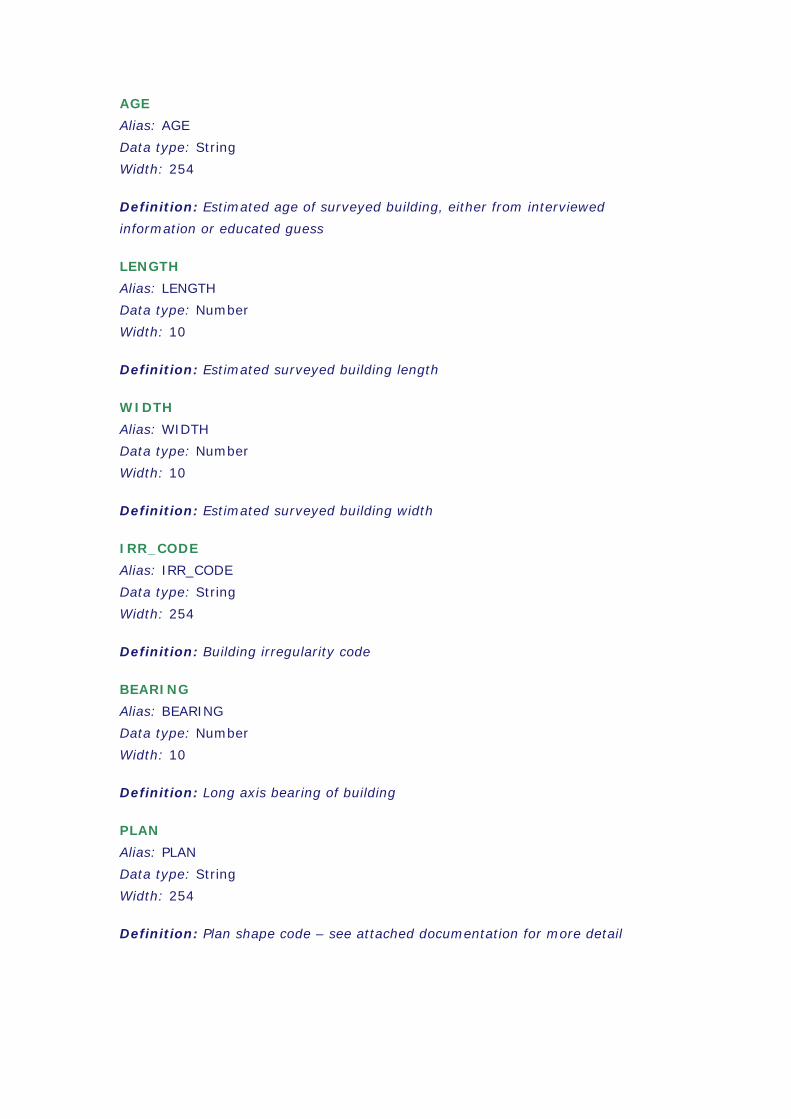
AGE
Alias: AGE
Data type: String
Width: 254
Definition: Estimated age of surveyed building, either from interviewed
information or educated guess
LENGTH
Alias: LENGTH
Data type: Number
Width: 10
Definition: Estimated surveyed building length
WIDTH
Alias: WIDTH
Data type: Number
Width: 10
Definition: Estimated surveyed building width
IRR_CODE
Alias: IRR_CODE
Data type: String
Width: 254
Definition: Building irregularity code
BEARING
Alias: BEARING
Data type: Number
Width: 10
Definition: Long axis bearing of building
PLAN
Alias: PLAN
Data type: String
Width: 254
Definition: Plan shape code – see attached documentation for more detail
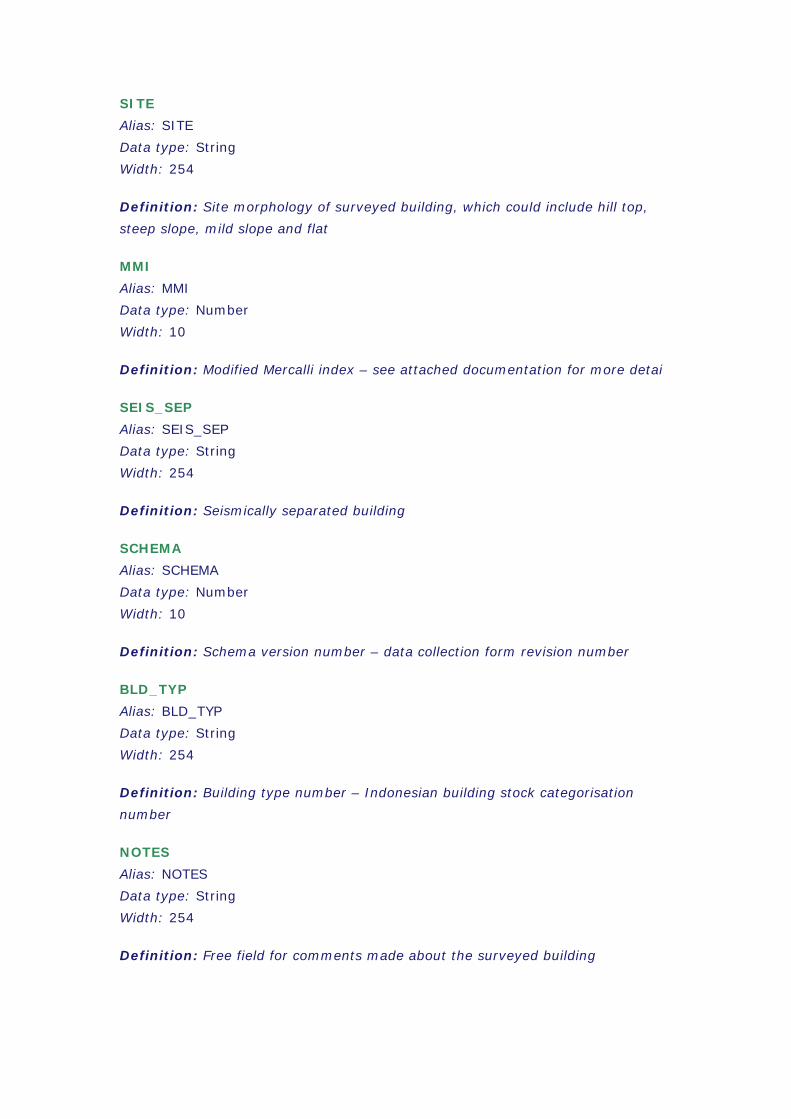
SITE
Alias: SITE
Data type: String
Width: 254
Definition: Site morphology of surveyed building, which could include hill top,
steep slope, mild slope and flat
MMI
Alias: MMI
Data type: Number
Width: 10
Definition: Modified Mercalli index – see attached documentation for more detai
SEIS_SEP
Alias: SEIS_SEP
Data type: String
Width: 254
Definition: Seismically separated building
SCHEMA
Alias: SCHEMA
Data type: Number
Width: 10
Definition: Schema version number – data collection form revision number
BLD_TYP
Alias: BLD_TYP
Data type: String
Width: 254
Definition: Building type number – Indonesian building stock categorisation
number
NOTES
Alias: NOTES
Data type: String
Width: 254
Definition: Free field for comments made about the surveyed building

INSPECT
Alias: INSPECT
Data type: String
Width: 254
Definition: Inspection accuracy; outside, partial or complete
URM
Alias: URM
Data type: String
Width: 254
Definition: Unreinforced masonry damage index; number ranging from 0
(negligible) to 9 (destruction)
CONF_MAS
Alias: CONF_MAS
Data type: Number
Width: 10
Definition: Confined masonry damage index; number ranging from 0 (negligible)
to 9 (destruction)
BAMB_TIMB
Alias: BAMB_TIMB
Data type: String
Width: 254
Definition: Bamboo or Timber damage index; number ranging from 0
(negligible) to 9 (destruction)
RC_FRAME
Alias: RC_FRAME
Data type: String
Width: 254
Definition: Reinforced concrete frame damage index; number ranging from 0
(negligible) to 9 (destruction)
STEEL_FR
Alias: STEEL_FR
Data type: String
Width: 254
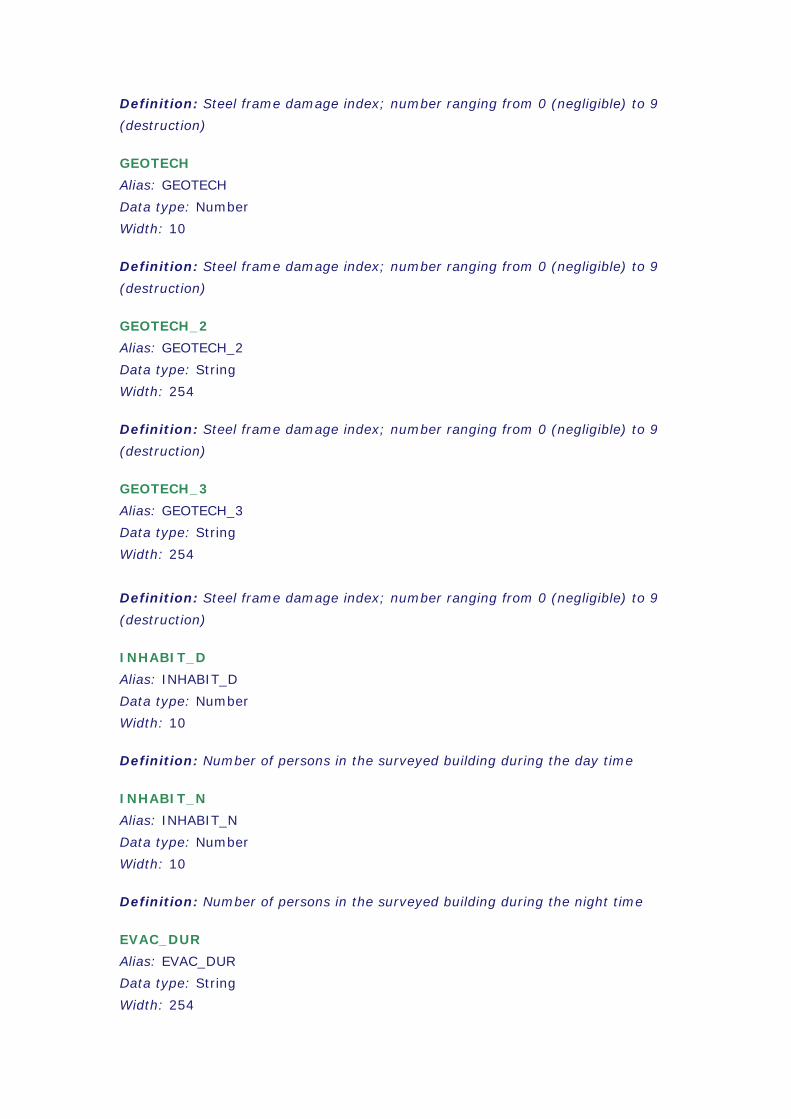
Definition: Steel frame damage index; number ranging from 0 (negligible) to 9
(destruction)
GEOTECH
Alias: GEOTECH
Data type: Number
Width: 10
Definition: Steel frame damage index; number ranging from 0 (negligible) to 9
(destruction)
GEOTECH_2
Alias: GEOTECH_2
Data type: String
Width: 254
Definition: Steel frame damage index; number ranging from 0 (negligible) to 9
(destruction)
GEOTECH_3
Alias: GEOTECH_3
Data type: String
Width: 254
Definition: Steel frame damage index; number ranging from 0 (negligible) to 9
(destruction)
INHABIT_D
Alias: INHABIT_D
Data type: Number
Width: 10
Definition: Number of persons in the surveyed building during the day time
INHABIT_N
Alias: INHABIT_N
Data type: Number
Width: 10
Definition: Number of persons in the surveyed building during the night time
EVAC_DUR
Alias: EVAC_DUR
Data type: String
Width: 254
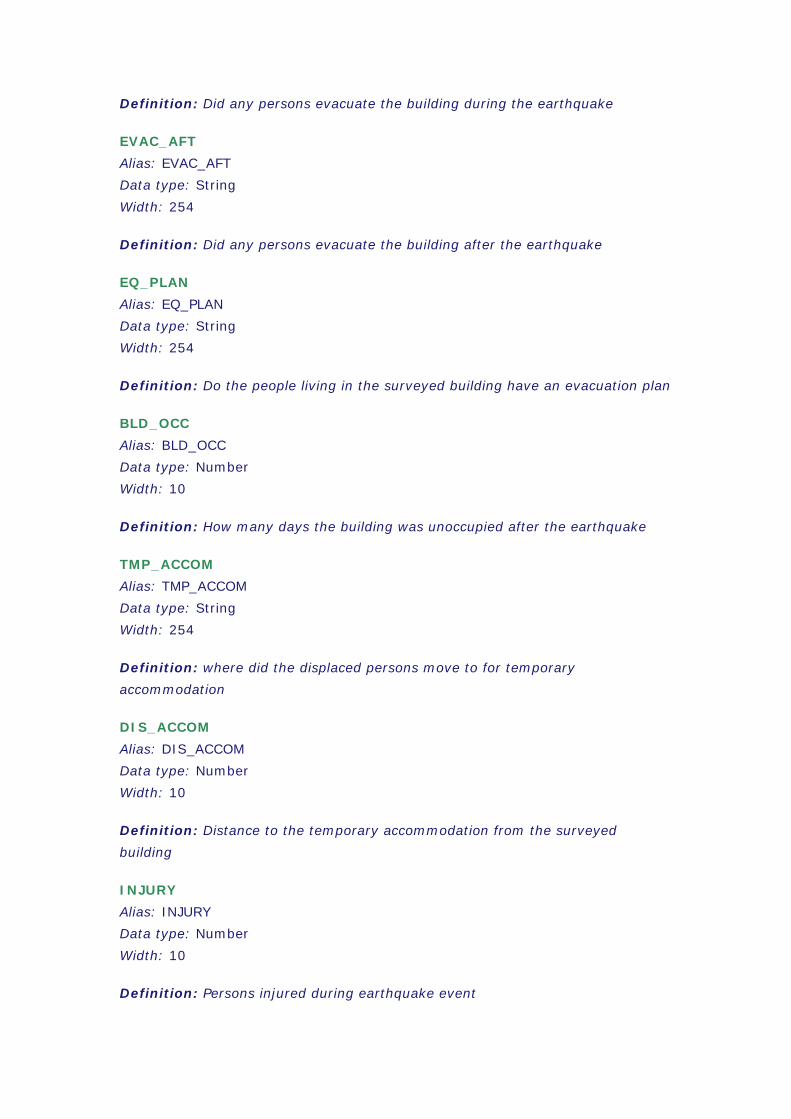
Definition: Did any persons evacuate the building during the earthquake
EVAC_AFT
Alias: EVAC_AFT
Data type: String
Width: 254
Definition: Did any persons evacuate the building after the earthquake
EQ_PLAN
Alias: EQ_PLAN
Data type: String
Width: 254
Definition: Do the people living in the surveyed building have an evacuation plan
BLD_OCC
Alias: BLD_OCC
Data type: Number
Width: 10
Definition: How many days the building was unoccupied after the earthquake
TMP_ACCOM
Alias: TMP_ACCOM
Data type: String
Width: 254
Definition: where did the displaced persons move to for temporary
accommodation
DIS_ACCOM
Alias: DIS_ACCOM
Data type: Number
Width: 10
Definition: Distance to the temporary accommodation from the surveyed
building
INJURY
Alias: INJURY
Data type: Number
Width: 10
Definition: Persons injured during earthquake event

INJUR_TYP
Alias: INJUR_TYP
Data type: String
Width: 254
Definition: Type of injury sustained during the earthqauke
FLR_COLL
Alias: FLR_COLL
Data type: Number
Width: 10
Definition: Percentage of floor collapse
UT_WATER
Alias: UT_WATER
Data type: Number
Width: 10
Definition: Number of days water was unavailable after the event
UT_POWER
Alias: UT_POWER
Data type: Number
Width: 10
Definition: Number of days power was unavailable after the event
UT_GAS
Alias: UT_GAS
Data type: String
Width: 254
Definition: Number of days gas was unavailable after the event
UT_TELECO
Alias: UT_TELECO
Data type: String
Width: 254
Definition: Number of days telephone service was unavailable after the event

This Page Intentionally Blank

The 30th September 2009 West Sumatra Earthquake Padang Region Damage Survey
Appendix A6 Earthquake Damage State Descriptors
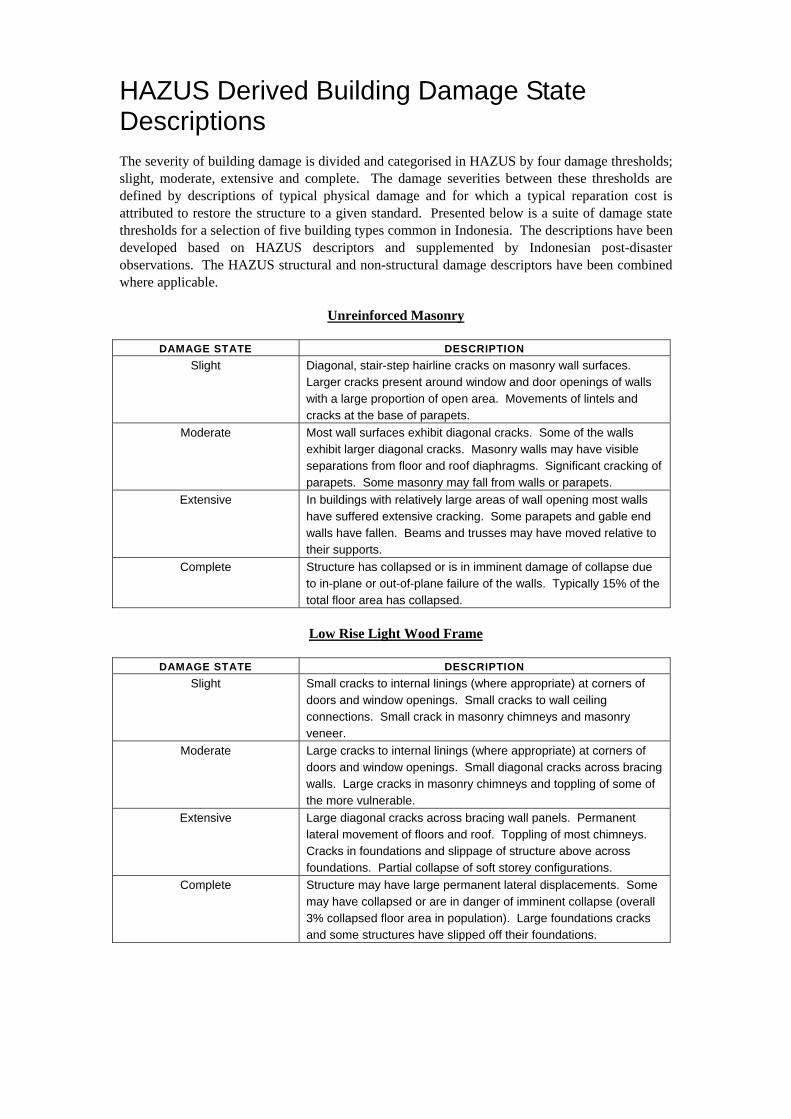
HAZUS Derived Building Damage State Descriptions The severity of building damage is divided and categorised in HAZUS by four damage thresholds; slight, moderate, extensive and complete. The damage severities between these thresholds are defined by descriptions of typical physical damage and for which a typical reparation cost is attributed to restore the structure to a given standard. Presented below is a suite of damage state thresholds for a selection of five building types common in Indonesia. The descriptions have been developed based on HAZUS descriptors and supplemented by Indonesian post-disaster observations. The HAZUS structural and non-structural damage descriptors have been combined where applicable.
Unreinforced Masonry
DAMAGE STATE DESCRIPTION
Slight Diagonal, stair-step hairline cracks on masonry wall surfaces. Larger cracks present around window and door openings of walls with a large proportion of open area. Movements of lintels and cracks at the base of parapets.
Moderate Most wall surfaces exhibit diagonal cracks. Some of the walls exhibit larger diagonal cracks. Masonry walls may have visible separations from floor and roof diaphragms. Significant cracking of parapets. Some masonry may fall from walls or parapets.
Extensive In buildings with relatively large areas of wall opening most walls have suffered extensive cracking. Some parapets and gable end walls have fallen. Beams and trusses may have moved relative to their supports.
Complete Structure has collapsed or is in imminent damage of collapse due to in-plane or out-of-plane failure of the walls. Typically 15% of the total floor area has collapsed.
Low Rise Light Wood Frame
DAMAGE STATE DESCRIPTION
Slight Small cracks to internal linings (where appropriate) at corners of doors and window openings. Small cracks to wall ceiling connections. Small crack in masonry chimneys and masonry veneer.
Moderate Large cracks to internal linings (where appropriate) at corners of doors and window openings. Small diagonal cracks across bracing walls. Large cracks in masonry chimneys and toppling of some of the more vulnerable.
Extensive Large diagonal cracks across bracing wall panels. Permanent lateral movement of floors and roof. Toppling of most chimneys. Cracks in foundations and slippage of structure above across foundations. Partial collapse of soft storey configurations.
Complete Structure may have large permanent lateral displacements. Some may have collapsed or are in danger of imminent collapse (overall 3% collapsed floor area in population). Large foundations cracks and some structures have slipped off their foundations.
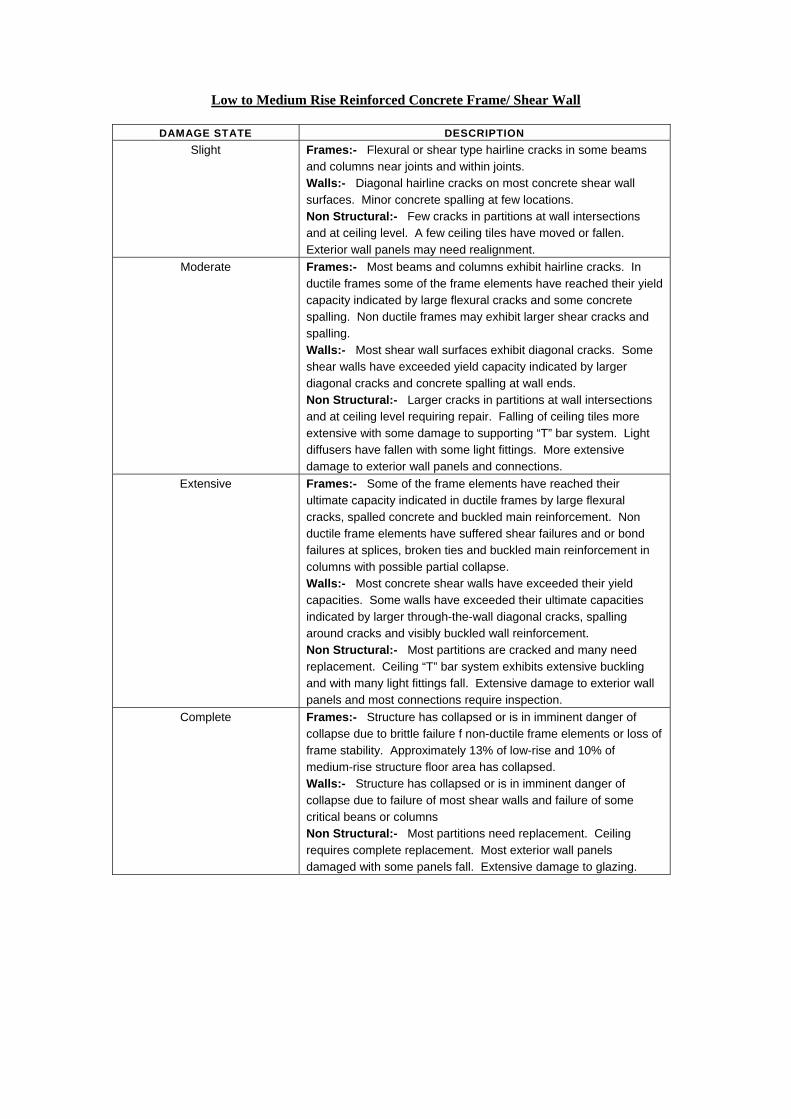
Low to Medium Rise Reinforced Concrete Frame/ Shear Wall
DAMAGE STATE DESCRIPTION
Slight Frames:- Flexural or shear type hairline cracks in some beams and columns near joints and within joints. Walls:- Diagonal hairline cracks on most concrete shear wall surfaces. Minor concrete spalling at few locations. Non Structural:- Few cracks in partitions at wall intersections and at ceiling level. A few ceiling tiles have moved or fallen. Exterior wall panels may need realignment.
Moderate Frames:- Most beams and columns exhibit hairline cracks. In ductile frames some of the frame elements have reached their yield capacity indicated by large flexural cracks and some concrete spalling. Non ductile frames may exhibit larger shear cracks and spalling. Walls:- Most shear wall surfaces exhibit diagonal cracks. Some shear walls have exceeded yield capacity indicated by larger diagonal cracks and concrete spalling at wall ends. Non Structural:- Larger cracks in partitions at wall intersections and at ceiling level requiring repair. Falling of ceiling tiles more extensive with some damage to supporting “T” bar system. Light diffusers have fallen with some light fittings. More extensive damage to exterior wall panels and connections.
Extensive Frames:- Some of the frame elements have reached their ultimate capacity indicated in ductile frames by large flexural cracks, spalled concrete and buckled main reinforcement. Non ductile frame elements have suffered shear failures and or bond failures at splices, broken ties and buckled main reinforcement in columns with possible partial collapse. Walls:- Most concrete shear walls have exceeded their yield capacities. Some walls have exceeded their ultimate capacities indicated by larger through-the-wall diagonal cracks, spalling around cracks and visibly buckled wall reinforcement. Non Structural:- Most partitions are cracked and many need replacement. Ceiling “T” bar system exhibits extensive buckling and with many light fittings fall. Extensive damage to exterior wall panels and most connections require inspection.
Complete Frames:- Structure has collapsed or is in imminent danger of collapse due to brittle failure f non-ductile frame elements or loss of frame stability. Approximately 13% of low-rise and 10% of medium-rise structure floor area has collapsed. Walls:- Structure has collapsed or is in imminent danger of collapse due to failure of most shear walls and failure of some critical beans or columns Non Structural:- Most partitions need replacement. Ceiling requires complete replacement. Most exterior wall panels damaged with some panels fall. Extensive damage to glazing.
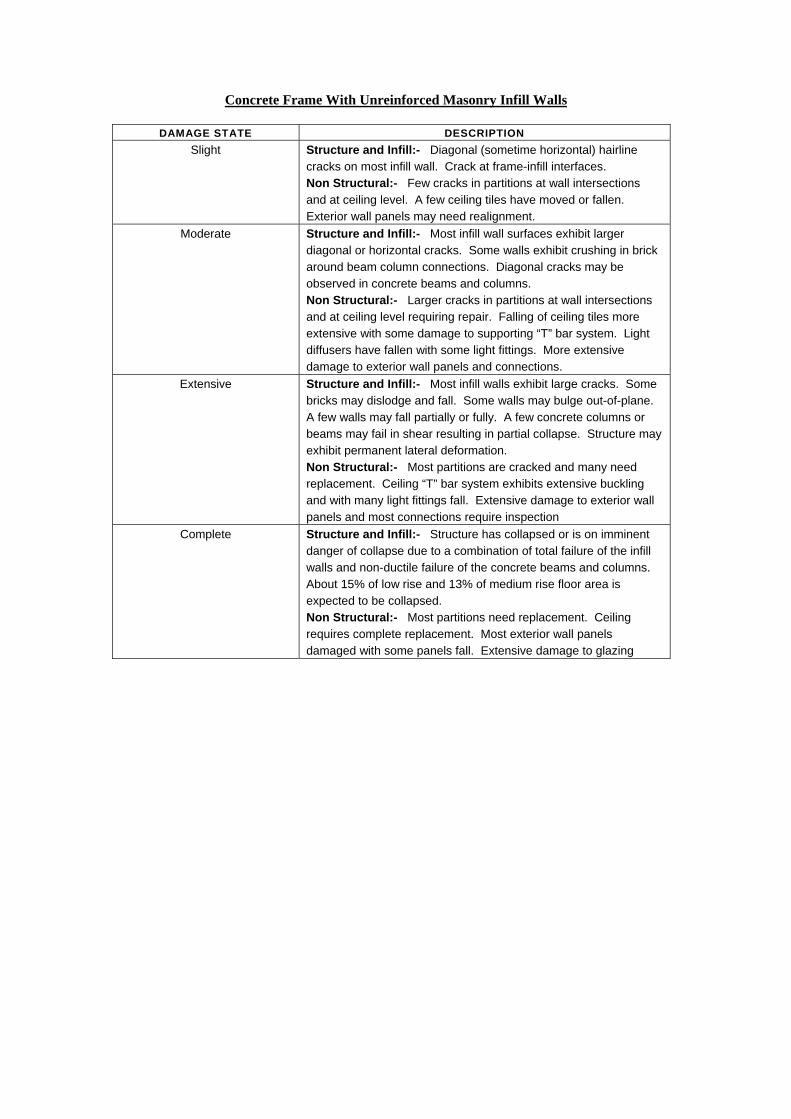
Concrete Frame With Unreinforced Masonry Infill Walls
DAMAGE STATE DESCRIPTION
Slight Structure and Infill:- Diagonal (sometime horizontal) hairline cracks on most infill wall. Crack at frame-infill interfaces. Non Structural:- Few cracks in partitions at wall intersections and at ceiling level. A few ceiling tiles have moved or fallen. Exterior wall panels may need realignment.
Moderate Structure and Infill:- Most infill wall surfaces exhibit larger diagonal or horizontal cracks. Some walls exhibit crushing in brick around beam column connections. Diagonal cracks may be observed in concrete beams and columns. Non Structural:- Larger cracks in partitions at wall intersections and at ceiling level requiring repair. Falling of ceiling tiles more extensive with some damage to supporting “T” bar system. Light diffusers have fallen with some light fittings. More extensive damage to exterior wall panels and connections.
Extensive Structure and Infill:- Most infill walls exhibit large cracks. Some bricks may dislodge and fall. Some walls may bulge out-of-plane. A few walls may fall partially or fully. A few concrete columns or beams may fail in shear resulting in partial collapse. Structure may exhibit permanent lateral deformation. Non Structural:- Most partitions are cracked and many need replacement. Ceiling “T” bar system exhibits extensive buckling and with many light fittings fall. Extensive damage to exterior wall panels and most connections require inspection
Complete Structure and Infill:- Structure has collapsed or is on imminent danger of collapse due to a combination of total failure of the infill walls and non-ductile failure of the concrete beams and columns. About 15% of low rise and 13% of medium rise floor area is expected to be collapsed. Non Structural:- Most partitions need replacement. Ceiling requires complete replacement. Most exterior wall panels damaged with some panels fall. Extensive damage to glazing
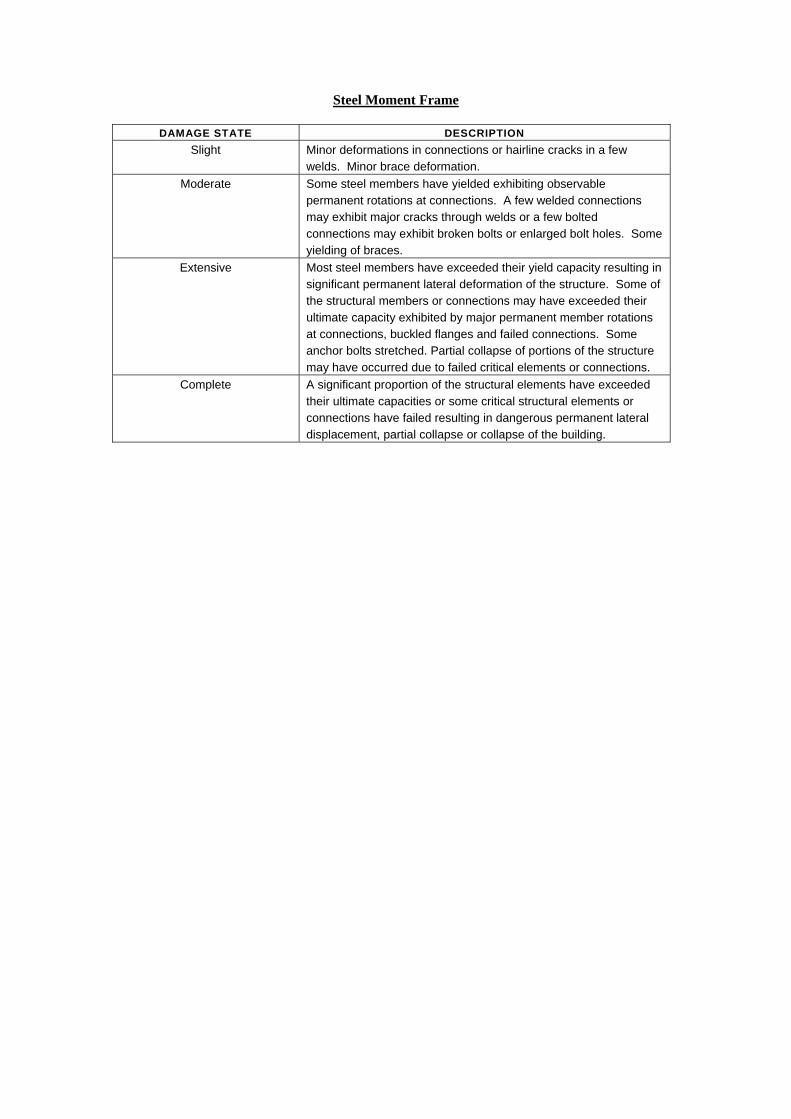
Steel Moment Frame
DAMAGE STATE DESCRIPTION
Slight Minor deformations in connections or hairline cracks in a few welds. Minor brace deformation.
Moderate Some steel members have yielded exhibiting observable permanent rotations at connections. A few welded connections may exhibit major cracks through welds or a few bolted connections may exhibit broken bolts or enlarged bolt holes. Some yielding of braces.
Extensive Most steel members have exceeded their yield capacity resulting in significant permanent lateral deformation of the structure. Some of the structural members or connections may have exceeded their ultimate capacity exhibited by major permanent member rotations at connections, buckled flanges and failed connections. Some anchor bolts stretched. Partial collapse of portions of the structure may have occurred due to failed critical elements or connections.
Complete A significant proportion of the structural elements have exceeded their ultimate capacities or some critical structural elements or connections have failed resulting in dangerous permanent lateral displacement, partial collapse or collapse of the building.