the 31 deg2 release of the stripe 82 x-ray survey: … · ezequiel treister20, and marco viero21,22...
TRANSCRIPT

THE 31 DEG2 RELEASE OF THE STRIPE 82 X-RAY SURVEY: THE POINT SOURCE CATALOG
Stephanie M. LaMassa1,2,3
, C. Megan Urry1,2, Nico Cappelluti
4, Hans Böhringer
5, Andrea Comastri
4, Eilat Glikman
6,
Gordon Richards7, Tonima Ananna
1,2, Marcella Brusa
4,8, Carie Cardamone
9, Gayoung Chon
5, Francesca Civano
1,10,
Duncan Farrah11, Marat Gilfanov
12,13, Paul Green
10, S. Komossa
14, Paulina Lira
15, Martin Makler
16,
Stefano Marchesi1,4,10
, Robert Pecoraro1,2, Piero Ranalli
4,17, Mara Salvato
5, Kevin Schawinski
18, Daniel Stern
19,
Ezequiel Treister20, and Marco Viero
21,22
1 Yale Center for Astronomy & Astrophysics, Physics Department, P.O. Box 208120, New Haven, CT 06520, USA2 Department of Physics, Yale University, P.O. Box 208121, New Haven, CT 06520, USA
3 Now at NASA Goddard Space Flight Center, Greenbelt, MD 20771, USA4 INAF-Osservatorio Astronomico di Bologna, via Ranzani 1, I-40127 Bologna, Italy
5 Max-Planck-Institut für extraterrestrische Physik, D-85748 Garching, Germany6 Department of Physics, Middlebury College, Middlebury, VT 05753, USA
7 Department of Physics, Drexel University, 3141 Chestnut Street, Philadelphia, PA 19104, USA8 DIFADipartimento di Fisica e Astronomia, Universita’ di Bologna, viale Berti Pichat 6/2, I-40127 Bologna, Italy
9 Department of Math & Science, Wheelock College, 200 Riverway, Boston, MA 02215, USA10 Smithsonian Astrophysical Observatory, 60 Garden Street, Cambridge, MA 02138, USA
11 Department of Physics MC 0435, Virginia Polytechnic Institute and State University, 850 West Campus Drive, Blacksburg, VA 24061, USA12 Max-Planck Institut für Astrophysik, Karl-Schwarzschild-Str. 1, Postfach 1317, D-85741 Garching, Germany13 Space Research Institute of Russian Academy of Sciences, Profsoyuznaya 84/32, 117997 Moscow, Russia
14 Max-Planck-Institut für Radioastronomie, Auf dem Hügel 69, D-53121 Bonn, Germany15 Departamento de Astronomia, Universidad de Chile, Camino del Observatorio 1515, Santiago, Chile
16 Centro Brasileiro de Pesquisas Fisicas, Rua Dr Xavier Sigaud 150, Rio de Janeiro, RJ 22290-180, Brazil17 Institute for Astronomy, Astrophysics, Space Applications and Remote Sensing (IAASARS), National Observatory of Athens, 15236 Penteli, Greece
18 Institute for Astronomy, Department of Physics, ETH Zurich, Wolfgang-Pauli Strasse 27, CH-8093 Zurich, Switzerland19 Jet Propulsion Laboratory, California Institute of Technology, Pasadena, CA 91109, USA
20 Department of Astronomy, University of Concepcion, Concepcion, Chile21 Kavli Institute for Particle Astrophysics and Cosmology, Stanford University, 382 Via Pueblo Mall, Stanford, CA 94305, USA
22 California Institute of Technology, 1200 E. California Boulevard, Pasadena, CA 91125, USAReceived 2015 September 29; accepted 2015 November 28; published 2016 February 1
ABSTRACT
We release the next installment of the Stripe 82 X-ray survey point-source catalog, which currently covers31.3 deg2 of the Sloan Digital Sky Survey (SDSS) Stripe 82 Legacy field. In total, 6181 unique X-ray sources aresignificantly detected with XMM-Newton (>5σ) and Chandra (>4.5σ). This catalog release includes data fromXMM-Newton cycle AO 13, which approximately doubled the Stripe 82X survey area. The flux limits of the Stripe82X survey are 8.7×10⁻¹⁶ erg s−1 cm−2, 4.7×10⁻¹⁵ erg s−1 cm−2, and 2.1×10⁻¹⁵ erg s−1 cm−2 in the soft(0.5–2 keV), hard (2–10 keV), and full bands (0.5–10 keV), respectively, with approximate half-area survey fluxlimits of 5.4×10⁻¹⁵ erg s−1 cm−2, 2.9×10⁻¹⁴ erg s−1 cm−2, and 1.7×10⁻¹⁴ erg s−1 cm−2. We matched theX-ray source lists to available multi-wavelength catalogs, including updated matches to the previous release of theStripe 82X survey; 88% of the sample is matched to a multi-wavelength counterpart. Due to the wide area of Stripe82X and rich ancillary multi-wavelength data, including coadded SDSS photometry, mid-infrared WISE coverage,near-infrared coverage from UKIDSS and VISTA Hemisphere Survey, ultraviolet coverage from GALEX, radiocoverage from FIRST, and far-infrared coverage from Herschel, as well as existing ∼30% optical spectroscopiccompleteness, we are beginning to uncover rare objects, such as obscured high-luminosity active galactic nuclei athigh-redshift. The Stripe 82X point source catalog is a valuable data set for constraining how this population growsand evolves, as well as for studying how they interact with the galaxies in which they live.
Key words: catalogs – galaxies: active – quasars: general – surveys – X-rays: general
Supporting material: FITS files
1. INTRODUCTION
Active galactic nuclei (AGNs) signal the growth of super-massive black holes at galactic centers. Studying AGNs over arange of redshift allows us to discover how supermassive blackholes evolve over cosmic time to the present day. As AGNsemit energy over a range of wavelengths, they can be identifiedby various signatures, including optical and ultraviolet lightfrom the accretion disk feeding the black hole (Koratkar &Blaes 1999), optical emission from gas ionized by accretiondisk photons (Baldwin et al. 1981; Veilleux & Osterbrock 1987;Vanden Berk et al. 2001), X-ray emission from the AGNcorona (Haardt & Maraschi 1991; Brandt & Alexander 2015),
mid-infrared emission from AGN heated circumnuclear dust(Spinoglio & Malkan 1989; Lacy et al. 2004; Stern et al. 2005;Donley et al. 2012; Stern et al. 2012; Assef et al. 2013), andfine-structure emission lines (Farrah et al. 2007; Weaver et al.2010; Meléndez et al. 2014), and radio emission from jetslaunched by the accretion disk (Kellermann et al. 1989; Hooperet al. 1995). These different selection criteria favor differentparts of the AGN population, and by combining these methods,a comprehensive view of black hole growth is revealed.Multi-wavelength surveys are then the key for unlocking the
secrets of AGN evolution and how they relate to the galaxiesthey inhabit. Complementary survey strategies select different
The Astrophysical Journal, 817:172 (21pp), 2016 February 1 doi:10.3847/0004-637X/817/2/172© 2016. The American Astronomical Society. All rights reserved.
1

populations in the redshift-luminosity plane. Deep, pencil-beam surveys uncover the faintest objects in the universe whilewide-area surveys are required to discover a representativesampling of rare objects that have a low space density. Suchrare sources include high-luminosity AGNs at high-redshift(e.g., Lx>1045 erg s−1 at z>2), which, according to currenttheories, are the phases when most of the mass locked up incurrent black holes was accreted (e.g., Hopkins & Hern-quist 2009; Treister et al. 2012).
Wide-area surveys have existed for years at optical, infrared,and radio wavelengths, but have only recently been underwayin X-rays at energies above 2 keV and at depths capable ofpushing to cosmological distances. While the deep, small areaChandra Deep Field South Survey (0.13 deg2; Giacconiet al. 2001; Xue et al. 2011) has uncovered the faintest AGNsand has entered the flux regime where the number density ofnon-active galaxies surpasses that of active systems (Lehmeret al. 2012), and medium-area surveys like XMM-Newton andChandra-COSMOS (2.2 deg2; Cappelluti et al. 2007; Hasingeret al. 2007; Elvis et al. 2009; Brusa et al. 2010; Civanoet al. 2012, 2015; Marchesi et al. 2015) have identified nearly2,000 moderate-luminosity AGNs (1043 erg s−1<Lx<1044 erg s−1), the Lx>1045 erg s−1 population has been amissing tier in our hard X-ray census of supermassive blackhole growth. This population began to be revealed with largerarea (∼10 deg2) surveys, such as XBoötes (9 deg2; Kenter et al.2005; Murray et al. 2005) and the Chandra Multi-wavelengthProject (ChaMP, 10 deg2; Kim et al. 2007), as well as the morerecent XMM-Newton survey in the Herschel ATLAS field(7.1 deg2; Ranalli et al. 2015). The advent of the widest-areasurveys (>15 deg2), including the “Stripe 82X” survey(LaMassa et al. 2013a, 2013b), which, as we discuss below,now reaches ∼31.3 deg2, as well as the 50 deg2XMM-XXL(PI: Pierre) and the ∼877 deg2XMM-Serendipitous (Rosenet al. 2015) surveys, provides a chance to study the evolution ofthe most luminous AGN in unprecedented detail. However,though the XMM-Serendipitous survey covers an order ofmagnitude more area than the dedicated large-area XMM-Newton surveys, an important component is missing: support-ing multi-wavelength data which allows the X-ray photons tobe identified with discrete sources and the properties of theseobjects to be characterized. A field which contains suchsupporting information, such as the Sloan Digital Sky Survey(SDSS; York et al. 2000) Stripe 82 region, is therefore an ideallocation to execute an X-ray survey with maximal efficiencyfor returning comprehensive results.
Stripe 82 is a 300 deg2 equatorial region imaged between 80and 120 times as part of a supernova survey with SDSS(Frieman et al. 2008). The coadded photometry reaches 1.2–2.2magnitudes deeper than any single SDSS scan (r∼24.6 versusr∼22.2; Annis et al. 2014; Jiang et al. 2014), and the full fieldhas existing optical spectroscopy from SDSS and SDSS BOSS(Data Releases 9 and 10; Ahn et al. 2012, 2014), 2 SLAQ(Croom et al. 2009), and WiggleZ (Drinkwater et al. 2010),with partial coverage from DEEP2 (Newman et al. 2013),PRIMUS (Coil et al. 2011), 6dF (Jones et al. 2004, 2009), theVIMOS VLT Deep Survey (VVDS Garilli et al. 2008), a deepspectroscopic survey of faint quasars from Jiang et al. (2006),and a pre-BOSS pilot survey using Hectospec on MMT (Rosset al. 2012). Existing multi-wavelength data in Stripe 82include near-infrared observations from UKIDSS (Hewettet al. 2006; Casali et al. 2007; Lawrence et al. 2007) and the
VISTA Hemisphere Survey (VHS; McMahon et al. 2013); far-infrared coverage from Herschel over 79 deg2 (Vieroet al. 2014); ultraviolet coverage with GALEX (Morrisseyet al. 2007); radio observations at 1.4 GHz with Faint Images ofthe Radio Sky at Twenty centimeters (FIRST) (Beckeret al. 1995; White et al. 1997; Becker et al. 2012; Helfandet al. 2015), with deeper VLA coverage over 80 deg2 (Hodgeet al. 2011); and millimeter observations with the AtacamaCosmology Telescope (ACT; Fowler et al. 2007; Swetzet al. 2011). Additionally, there is Spitzer coverage in the fieldfrom the Spitzer-HETDEX Exploratory Large Area survey over28 deg2 (SHELA; PI: C. Papovich) and the Spitzer IRACEquatorial Survey over 110 deg2 (SpIES; PI: G. Richards;J. Timlin et al. 2015, in preparation), deeper near-infrared J andK band coverage, to limits of 22 mag (AB), from the VISTA-CFHT Stripe 82 Survey over 140 deg2 (VICS82, PIs: Geach,Lin, Makler; J. Geach et al. 2015, in preparation), and mid-infrared coverage from the all-sky WISE mission (Wrightet al. 2010).To take advantage of this rich multi-wavelength coverage,
we designed the wide-area Stripe 82X survey (LaMassaet al. 2013a, 2013b) to uncover a representative population ofrare, high-luminosity AGNs at high redshift. Here we releasethe next installment of the Stripe 82X point-source catalog,which includes data awarded to our team in response to XMM-Newton Announcement Opportunity 13 (“AO13”), represent-ing ∼980 ks of observing time (PI: C. M. Urry; ProposalID 074283). We also publish updated catalogs from ourprevious Stripe 82X data releases from archival Chandraand XMM-Newton observations in Stripe 82 (LaMassaet al. 2013a, 2013b) and a pilot XMM-Newton program grantedto our team in AO10 (PI: C. M. Urry; LaMassa et al. 2013a).The positions of the X-ray pointings used in Stripe 82X areshown in Figure 1.In Section 2, we discuss the data analysis for XMM-Newton
AO13, which we then combine with the previously releasedChandra and XMM-Newton data in Section 3 to characterizethe Stripe 82 X-ray survey to date, currently spanning∼31.3 deg2 of non-overlapping area. In Section 4, we matchthe X-ray source lists to publicly available catalogs fromSDSS, WISE, UKIDSS, VHS, GALEX, FIRST, and Herschel.Throughout, we adopt a cosmology of H0=70 km s−1 Mpc−1,ΩM=0.27, and Λ=0.73.
Figure 1. Distribution of archival Chandra observations (black diamonds),archival XMM-Newton observations (blue squares), XMM-Newton AO10observations (blue diamonds), and XMM-Newton AO13 observations (redcircles) for the full Stripe 82 region (top) and the XMM-Newton AO13 area(bottom). The symbol size is to scale with the field of view for the AO13pointings in the bottom panel only.
2
The Astrophysical Journal, 817:172 (21pp), 2016 February 1 LaMassa et al.

2. XMM-Newton AO13 OBSERVATIONS AND DATAANALYSIS
Our XMM-Newton AO13 program was executed between2014 July and 2015 January in a series of seven observations,as summarized in Table 1. Each observation consists of 22individual pointings, or pseudo-exposures, which were carriedout in “mosaic mode.” This observing mode efficiently surveysa large area with individual pointings that have relatively shortexposure times. To reduce overhead, the EPIC offset tables areonly uploaded (for the MOS detectors) and calculated (for thePN detector) for the first pointing in the series. In our AO13program, each pseudo-exposure is separated by a half field ofview (~ ¢15 ) to enable a greater depth to be achieved in theoverlapping regions. The median exposure time for individualpointings before filtering is ∼5.2 ks for MOS1 and MOS2 and∼4.7 ks for PN, while the coadded depth in the overlappingobservations reaches ∼6–8 ks after filtering and correcting forvignetting (i.e., the energy-dependent decrease in effective areawith off-axis distance).
The observational data files (ODF) were generated using theScience Analysis System (SAS) tasks (HEASOFT v. 6.16)emproc and epproc to create the MOS1, MOS2, PN, and PNout-of-time (OoT) events files. The OoT events occur fromphotons that are detected during CCD readout and recorded atrandom positions along the readout column. This effect is mostsignificant for the PN detector and affects ∼6.3% of theobserving time. The PN images can be statistically correctedfor this effect using the PN OoT files.
The mosaicked observations were separated into individualpseudo-exposures using the SAS package emosaic_prep. Eachpseudo-exposure was then filtered as described below.
2.1. Flare Filtering
Episodes of high levels of background radiation cause flaringin the XMM-Newton events files, hampering signal detectionamidst the noise. To create good time intervals (GTIs), i.e.,selecting events from observation periods where flaring isminimal, we started with a statistical approach. We createdhistograms of the count rate at high energies, 10–12 keV for theMOS detectors and 10–14 keV for the PN detector, in time binsof 100 s, extracted from single events (PATTERN==0). Wecreated GTIs by excluding periods where the count rate was s3 above the mean and applied this filtering to the events file.From this events file, we searched for periods of low-energy(0.3–10 keV) flares, created GTIs from time bins where thecount rate was below 3σ of the mean, and applied this GTI fileto the original events file.
While this method produced cleaned events files for most ofthe pseudo-exposures, it did a poor job in instances of intenseflaring: a 3σ-clipping was inadequate since the count ratedistributions have an extended tail within the 3σ tolerancelevel. For these pointings, we inspected the count ratedistributions by eye to determine a cut-off value to removethe tail of this distribution, visually inspecting both sets of GTI-filtered events files to assess which filtering best removed thebackground to enhance signal from the sources.Finally, we note that some pseudo-exposures were badly
hampered by flaring such that no GTI filtering could recoveruseful signal. In Table 1, we note which pseudo-exposureswere subsequently discarded from our analysis, and whetherthis affected just the PN detector or all three detectors. We alsoindicate the effective area covered by each observation afterremoving flared pointings.
2.2. Generating Products for Source Detection
We extracted images from the GTI-filtered events files, usingall valid events (PATTERN 0 to 12) for MOS1 and MOS2 andsingle to double events (PATTERN 0 to 4) for PN. Weexcluded the energy range from 1.45 to 1.54 keV to avoid theAl Kα line (1.48 keV) from the detector background. The PNdetector also has background emission lines from Cu at ∼7.4and ∼8.0 keV, so we excluded the energy ranges from 7.2 to7.6 keV and 7.8 to 8.2 keV when extracting PN images. Tocorrect for the OoT events, the PN OoT images were scaled by0.063 and subtracted from the PN images. We then extractedMOS and PN images in the standard soft (0.5–2 keV), hard(2–10 keV), and full (0.5–10 keV) energy ranges and coaddedthe images among the detectors.Exposure maps, which quantify the effective exposure time
at each pixel in the detector, accounting for vignetting, weregenerated with the SAS task eexpmap for each detector andenergy range. Since vignetting is a strong function of energy,we spectrally weighted the exposure maps such that the meaneffective energy inputted into eexpmap is determined byassuming a power-law model where Γ=2.0 in the soft bandand Γ=1.7 for the hard and full bands (see Cappellutiet al. 2007). This spectral model was also used to calculateenergy conversion factors (ECFs) to convert from count rates toflux, as summarized in Table 2 (for a discussion of howdifferent assumptions for Γ affect the derived ECF, see Loaringet al. 2005; Cappelluti et al. 2007; Ranalli et al. 2013). Theexposure maps were coadded among the detectors, weighted bytheir ECFs.As described in detail by LaMassa et al. (2013a), we used the
algorithm presented in Cappelluti et al. (2007) to createbackground maps. In brief, a simple source detection was run
Table 1XMM-Newton AO13 Observation Summary
ObsID Observation Date Center R.A. Center decl. Discarded Pseudo-exposures Area (deg2)
0742830101 2014 Jul 00:57:23.99 −00:22:30.0 K 2.330747390101 2014 Jul 01:05:23.99 −00:22:30.0 22 (PN, M1, M2) 2.220747400101 2014 Jul 01:13:24.00 −00:22:30.0 K 2.330747410101 2015 Jan 01:21:24.00 −00:22:30.0 6 (PN), 8 (PN), 13 (PN) 2.320747420101 2015 Jan 01:29:23.99 −00:22:30.0 16 (PN, M1, M2), 18 (PN, M1, M2) 1.95
20 (PN, M1, M2), 21 (PN, M1, M2)0747430101 2014 Jul 01:37:23.99 −00:22:30.0 22 (PN, M1, M2) 2.220747440101 2014 Aug 01:45:23.99 −00:22:30.0 22 (PN, M1, M2) 2.22
3
The Astrophysical Journal, 817:172 (21pp), 2016 February 1 LaMassa et al.

on each detector image in each energy band using the SAS taskeboxdetect with a low detection probability (likemin=4). Thepositions of these sources were masked out. The remainingemission results from unresolved cosmic X-ray sources andlocal particle and detector background. These components weremodeled and fit as discussed in Cappelluti et al. (2007) andLaMassa et al. (2013a) to produce a background map for eachdetector and energy range. The resulting background mapswere then coadded among the detectors.
Before importing these products into the source detectionsoftware, we updated the header keywords “RA_NOM,”“DEC_NOM,” “EXP_ID,” and “INSTRUME” to commonvalues among the pseudo-exposures for each observation: theSAS source detection software, when running on these filessimultaneously, will fail if the pseudo-exposures do not havecommon WCS, exposure ID, and instrument values. However,the “RA_PNT” and “DEC_PNT” header keywords weremanually updated to reflect the central coordinates of eachpseudo-exposure so that the point spread function (PSF) iscorrectly calculated during source detection. Detector maskswere created using the SAS program emask, which uses theexposure map as input to determine which pixels are active forsource detection.
2.3. Source Detection
We produced a preliminary list of sources by running theSAS task eboxdetect in “map” mode. This is a sliding-boxalgorithm that is run on the coadded images, background maps,exposure maps, and detector masks, where source counts aredetected in a 5×5 pixel box with a low-probability threshold(likemin=4). This list is then used as an input into emldetect,which performs a maximum likelihood PSF fit to theeboxdetect sources. We used a minimum likelihood threshold(det_ml) of 6, where det_ml=−lnPrandom, where Prandom is thePoissonian probability that a detection is due to randomfluctuations. We also included a fit to mildly extended sources,where emldetect convolves the PSF with a β model profile. Weconsider a source extended if the output ext_flag exceeds 0.Finally, the ECFs reported in Table 2 were summed among thedetectors included in the coadded pseudo-exposures (i.e., if thePN image was discarded due to flaring, the ECF sum is fromthe MOS detectors, while the PN ECF is included in the sumwhen all detectors are useable), such that emldetect reports theflux in physical units, as well as the count rates, for eachdetected source.
We ran the source detection algorithm separately for eachobservation. Due to the limited memory capabilities of the SASsource detection software, not all pseudo-exposures within an
observation could be fit simultaneously. We therefore executedthe source detection in batches, where adjacent columns in R.A. were fit simultaneously. To achieve the greatest coaddeddepth in the overlapping pointings, each column, other than theeastern and western edges of the mosaic, was included in twosource detection runs. We note that the deepest overlap regionsare fitted with this source-detection method. The sourcedetection was also run separately for the different energybands: soft (0.5–2 keV), hard (2–10 keV), and full(0.5–10 keV).
2.4. Source List Generation
From the above procedure, we have six source lists perenergy band per observation. Each list contains duplicatedetections of some sources due to the overlapping regionscovered in consecutive source detection runs. To produce aclean X-ray source list for each observation, we removed theseduplicate detections. Following the algorithm used by theXMM-Newton Serendipitous Source Catalog (Watsonet al. 2009) to flag duplicate observations, we consider objectsfrom source lists covering overlapping areas to be the same ifthe distance between them is less than dcutoff, wheredcutoff=min (0.9×dnn1, 0.9×dnn2, 15″,3×( +ra_dec_err sys_err1
2 2 + +ra_dec_err sys_err22 2 )),
where dnn1 (dnn2) is the distance between the source and itsnearest neighbor in the first (second) source list, ra_dec_err isthe X-ray positional error reported by emldetect, and sys_err isa systematic positional error, taken to be 1″, to account for thesources not having an external astrometric correction applied.A maximum search radius of 15″ was chosen as the maximumcut-off distance based on simulations discussed in LaMassaet al. (2013a), where we found that this radius maximizesidentification of output to input sources while minimizingspurious associations of distinct sources; due to the shallownature of our observations, source confusion from a highdensity of unresolved sources is not a concern (see Section 3for estimated source confusion rate). For duplicate detections ofthe same source, we retain the coordinates, flux, and countinformation for the object that has the highest detectionprobability, or det_ml. We perform this routine separately foreach energy band, producing one clean source list per band.We then merge these X-ray source lists for each energy band
of an observation using the search criterion defined above tofind matches among lists generated in the separate energybands. If no match is found, the source is consideredundetected in that band and its flux, flux error, counts, anddet_ml are set to null while we retain this information for theband(s) where it is detected. While we have discarded sourcesthat are extended in all bands in which they are detected,because the identification of clusters among the extendedsources is in progress and will be reported later, we haveflagged the sources that are point-like in one band and areextended in another band. The “ext_flag” is non-zero for theseobjects and is defined as follows: 1—extended in the soft band,2—extended in the full band, 3—extended in the hard band, 4—extended in the soft and full bands, 5—extended in the softand hard bands, 6—extended in the hard and full bands.To produce the final catalog, the coordinates are averaged
among the coordinates from the individual energy bandcatalogs and their positional errors are added in quadrature;we note that the significance of the detection is not taken intoaccount when averaging the coordinates, but the uncertainty in
Table 2Energy Conversion Factors (ECFs)a
Band PN MOS
Soft (0.5–2 keV) 7.45 2.00Hard (2–10 keV) 1.22 0.45Full (0.5–10 keV) 3.26 0.97
Note.a ECFs in units of counts s−1/10−11 erg cm−2 s−1. These are based on aspectral model where NH=3×1020 cm−2 and Γ=2.0 in the soft band andΓ=1.7 in the hard and full bands. The PN ECF takes into account energyranges that were masked out due to detector background line emission.
4
The Astrophysical Journal, 817:172 (21pp), 2016 February 1 LaMassa et al.

the astrometric precision is included by adding the positionalerrors in quadrature. We then retain only objects where det_mlexceeds 15 (i.e., >5σ) in at least one energy band (see Loaringet al. 2005; Mateos et al. 2008, for a discussion of det_ml limitsand their effects on Eddington bias in the derived Log N–Log Srelation).
We caution that care must be taken when determining thereliability of the reported fluxes, as the catalog includes theemldetect reported fluxes for every band where the source wasdetected (i.e., det ml_ 6). Though the X-ray source can beconsidered a significant detection, as det_ml has to exceed 15 inat least one energy band for the source to be included in thecatalog, the det_ml value for each band ought to be used todetermine whether the reported flux is at an acceptablesignificance level. For reference, we use only fluxes in thesubsequent analysis when det ml_ 15 in that band.
Finally, we assign each X-ray source a unique record number(“rec_no”), ranging from 2359 to 5220, since the previousXMM-Newton Stripe 82X catalog release terminated at“rec_no” 2358. We also include columns “in_chandra” and“in_xmm” to note whether a source was detected in the archivalChandra or XMM-Newton Stripe 82X catalogs, respectively, aswell as the corresponding identification number of the matchedsource; for the one XMM-Newton source that has two possibleChandra counterparts within the search radius (rec_no 3473),due to Chandraʼs superior spatial resolution, we list both of theChandra matches. Details about each column are summarizedin the Appendix.
3. STRIPE 82X SURVEY SENSITIVITY ANDLOG N–LOG S
Similar to our previous Stripe 82X release, we gauge surveysensitivity for our XMM-Newton AO13 program via MonteCarlo simulations. For each observation, we generated a list offluxes that follow published Log N–Log S relations from XMM-COSMOS (Cappelluti et al. 2009) for the soft and hard bandsand from ChaMP (Kim et al. 2007) for the full band. Theminimum flux was set to 0.5 dex below the lowest detected fluxin the source list for that observation and the maximum fluxwas set to 10−11 erg s−1 cm−2. An input source list is thengenerated by pulling random fluxes from this distributionwhich are then given random positions among the pseudo-exposures making up the observation. We then use part of thesimulator written for the XMM-Newton survey of CDFS(Ranalli et al. 2013) to convolve the input source list withthe XMM-Newton PSF to create mock events files from whichimages were extracted. The observed background is then addedto the simulated images. Since the exposure maps from theobservations were used when generating the simulated eventsfiles and the observed background was added to the mockimage, the simulations allow us to accurately gauge how wellwe can recover input sources given our observing conditions.Finally, we add Poissonian noise to the images and run theseproducts through the source detection algorithm detailed above,using ancillary products (i.e., background maps, exposuremaps, and detector masks) from the observations. We ran asuite of 20 simulations for each mosaicked observation.
Since we have both the input source list and the list ofdetected objects, we can estimate the spurious detection rate forour sample. We assume that any source detected above ourdet_ml threshold of 15 that does not have an input sourcewithin 15″ is a spurious detection. We find our spurious
detection rate for the XMM-Newton AO13 data to be 1.0%,0.67%, and 0.33% in the soft, hard, and full bands,respectively. Furthermore, we can estimate the confusionfraction, which is when input sources are unresolved in thesource detection and observed as one object. As we did inLaMassa et al. (2013a), we followed the prescription inCappelluti et al. (2007) to test for source confusion, using thecriterion Sout/( s+S 3in out) >1.5, where Sout is the output flux,Sin is the input flux, and σout is the emldetect-reported fluxerror. According to this metric, the source confusion rate is0.15%, 0.10%, and 0.16% percent in the soft, hard, and fullbands, respectively.To determine survey sensitivity, we generate histograms of
all input fluxes and output fluxes for the det ml_ 15 sources,and divide the latter by the former. We truncate this ratio whereit reaches unity. By multiplying this sensitivity curve, which isa function of flux, by the survey area, we derive the area-fluxcurves shown in red in Figure 2. For comparison, we also plotthe area-flux curves for the other components of the Stripe 82Xsurvey in Figure 2: archival Chandra (green), archival XMM-Newton (dark blue), and XMM-Newton AO10 (cyan). Theblack curve shows the total Stripe 82X area-flux relation afterremoving overlapping observations between the Chandra andXMM-Newton surveys and between the XMM-Newton archivaland AO13 surveys. To convert the observed 2–7 keV and0.5–7 keV Chandra bands to the XMM-Newton-defined hardand full bands of 2–10 keV and 0.5–10 keV, we used theassumed power-law model of Γ=1.7 (see LaMassa et al.2013a) to extrapolate the Chandra flux to the broader energyranges (i.e., the hard and full fluxes were multiplied by factorsof 1.36 and 1.21, respectively).In Table 3, we summarize the number of X-ray sources
detected at a significant level for each Stripe 82X surveycomponent. For the XMM-Newton surveys, a source is deemedsignificant if det_ml exceeds 15 in the specific energy bandwhile for the Chandra survey, significance is determined bycomparing the source flux at the pixel where it was detectedwith the 4.5σ sensitivity map value at that pixel (see LaMassaet al. 2013b, for details). The “Total” row in Table 3 removesduplicate observations of the same source in overlappingpointings among the survey components. In the current31.3 deg2 Stripe 82X survey, 6181 distinct sources aresignificantly detected between XMM-Newton and Chandra.We present the Log N–Log S distribution, or number source
density as a function of flux, of the current 31.3 deg2 Stripe82X survey in Figure 3. To be consistent with the area-fluxcurves, we combined the X-ray source lists from the archivalChandra, archival and AO10 XMM-Newton, and AO13 XMM-Newton catalogs, removing all sources from observations thatwere discarded from the area-flux relation due to overlappingarea. Targeted objects from archival observations were alsoremoved as discussed in LaMassa et al. (2013a, 2013b). Wealso note that while the Chandra Log N–Log S relation wepublished in LaMassa et al. (2013b) had the cluster fieldsremoved a priori, we have made no such cut here since, as wementioned in that work, we found that including or excludingsuch fields made no noticeable difference in the source densitycalculation. The Chandra hard and full band fluxes from thesource list were converted from the 2–7 keV and 0.5–7 keVranges to 2–10 keV and 0.5–10 keV bands as described above.For reference, we also plot the Log N–Log S for a range ofsurvey areas and depths: the deep, pencil-beam E-CDFS in the
5
The Astrophysical Journal, 817:172 (21pp), 2016 February 1 LaMassa et al.

soft band (0.3 deg2; Lehmer et al. 2005) and the XMM-Newtonsurvey of CDFS in the hard band (∼0.25 deg2; Ranalli et al.2013); the moderate-area, moderate-depth Chandra COSMOS-Legacy Survey (2.2 deg2; Civano et al. 2015; Marchesi et al.
2015) in all three bands; and the wide-area 2XMMiSerendipitous Survey in the soft and hard bands (132 deg2;Mateos et al. 2008). The Stripe 82X Log N–Log S agrees withthe reported trends from other surveys in the soft-band, thehigh-flux end in the hard and full bands, and with CDFS at thelow-flux end (< ´ -2 10 14 erg s−1) in the hard band; discre-pancies in these bands at lower fluxes (and between CDFS andCOSMOS-Legacy and 2XMMi in the hard band at low fluxes)may be due to different methods for estimating surveysensitivity when generating area-flux curves and differentassumed values for the power-law slope (Γ) when convertingcount rate to flux, and are not necessarily atypical whencomparing number counts from different surveys.
4. MULTI-WAVELENGTH CATALOG MATCHING
We searched for counterparts to the XMM-Newton AO13sources in publicly available multi-wavelength databases: SDSS,WISE (Wright et al. 2010), UKIDSS (Hewett et al. 2006; Casaliet al. 2007; Lawrence et al. 2007), VHS (McMahon et al. 2013),GALEX (Morrissey et al. 2007), FIRST, and the HerschelSurvey of Stripe 82 (HerS; Viero et al. 2014). To determinewhether a multi-wavelength association to an X-ray sourcerepresents the true astrophysical counterpart rather than a chancecoincidence, we use the maximum likelihood estimator method(MLE; Sutherland & Saunders 1992) to match between theX-ray source lists and the ancillary catalogs. MLE takes intoaccount the distance between an X-ray source and ancillaryobjects within the search radius, the astrometric errors of theX-ray and ancillary sources, and the magnitude distribution ofancillary sources in the background to determine whether apotential multi-wavelength counterpart is more likely to be abackground source or a true match. This method has beenimplemented in many X-ray surveys to identify reliablecounterparts (e.g., Brusa et al. 2007, 2010; Cardamone et al.2008; Laird et al. 2009; Luo et al. 2010; Civano et al. 2012;LaMassa et al. 2013a; Marchesi et al. 2015).Ancillary objects within the search radius (rsearch), which is
set at 7″ for the XMM-Newton AO13 sources (see Brusaet al. 2010; LaMassa et al. 2013a), are assigned a likelihoodratio (LR), which is the probability that the correct counterpart
Figure 2. Area-flux curves for Stripe 82X in the soft (top), hard (middle), andfull bands (bottom). While the colored curves show the full area for theindividual data sets as indicated in the legends, the black curve illustrates thetotal area after removing observations from the archival Chandra and archivalXMM-Newton surveys that overlap pointings from the XMM-Newton AO10and/or AO13 surveys, and, in the case of the archival Chandra observations,archival XMM-Newton surveys; here, we have given preference to the wider-area coverage from XMM-Newton in overlapping pointings. Hence, deeperfluxes accessible by Chandra are consequently removed from the total Stripe82X area-flux relation. The kink in the total area-flux curve in the hard and fullbands comes from discontinuties induced by combining the individual area-flux curves from the archival pointings at lower flux limits.
Table 3X-ray Source Summarya
Survey Soft Hardb Fullc Total
Archival Chandra (7.4 deg2) 969 248 1137 1146Archival XMM-Newton (6.0 deg2) 1438 432 1411 1607XMM-Newton AO10 (4.6 deg2) 635 175 668 751XMM-Newton AO13 (15.6 deg2) 2440 715 2597 2862
Total (31.3 deg2)d 5150 1520 5628 6181
Notes.a The numbers correspond to the significant detections in each band. ForChandra, this is a 4.5σ level based on comparing the flux with the sensitivitymap (see LaMassa et al. 2013b, for details) and for the XMM-Newton surveys,the det_ml has to exceed 15.b The hard band spans 2–10 keV for the XMM-Newton surveys butcorresponds to 2–7 keV for the Chandra survey.c The broad band is 0.5–10 keV for the XMM-Newton surveys but ranges from0.5–7 keV for the Chandra survey.d Duplicate observations of the same source and overlapping observationsbetween surveys removed in total numbers.
6
The Astrophysical Journal, 817:172 (21pp), 2016 February 1 LaMassa et al.

is found within rsearch divided by the probability that abackground ancillary source is there by chance:
=LRq m f r
n m. 1
( ) ( )( )
( )
Here, q(m) is the expected normalized magnitude distributionof counterparts within rsearch which is estimated by subtractingthe histogram of sources found within the search radius fromthe histogram of background objects, where each histogram isnormalized by the relevant search areas; f(r) is the probabilitydistribution of the astrometric errors23; and n(m) is thenormalized magnitude distribution of sources in the back-ground. The background sources are taken as the objects foundin an annulus around each X-ray source with an inner radius of10″ and an outer radius of 45″; thus, sources that are potentialcounterparts, i.e., within rsearch, are removed from the back-ground estimation (Brusa et al. 2007). We note that thepositional error for the X-ray sources includes a 1″ systematicerror added in quadrature to the emldetect reported positionalerror to account for the lack of an external astrometriccorrection. This systematic astrometric error was not includedin the previous release of the Stripe 82X catalog, and wesubsequently found that bright X-ray sources tended to have
their positional errors underestimated by emldetect, such thatcounterparts were missed by the matching algorithm eventhough visual inspection of the X-ray sources and ancillaryobjects revealed bright multi-wavelength objects that are likelytrue matches (see also Brusa et al. 2010). Adding the 1″systematic error recovered these associations. Accordingly, thearchival XMM-Newton and AO10 catalogs published pre-viously have been updated here.From LR, a reliability value is then calculated for every
source:
=S + -
RLR
LR Q1, 2
i i ( )( )( )
where Q is the ratio of the number of X-ray sources that haveancillary objects within the search radius divided by the totalnumber of X-ray sources; the LR sum is over every potentialcounterpart within the search radius of the X-ray source. Thiscalculation is performed independently for every waveband towhich we match the X-ray source list. We use R as a way todistinguish between true counterparts and chance associations.For X-ray sources that have more than one possible associationwithin rsearch, we retain the potential counterpart with thehighest reliability. To determine the critical reliability thresholdabove which we consider an association the true counterpart(Rcrit), we followed the methodology in LaMassa et al. (2013a):
Figure 3. Cumulative Log N–Log S relationship for the Stripe 82X survey (black circles) in the soft (top left), hard (top right) , and full (bottom) bands. For reference,we also plot the source number density for other surveys, spanning the gamut from deep, pencil-beam surveys (i.e., the 0.3 deg2 ECDF-S and ∼0.25 deg2 CDFS;Lehmer et al. 2005; Ranalli et al. 2013, respectively), to a moderate-area, moderate depth survey (the 2.2 deg2 Chandra COSMOS-Legacy; Civano et al. 2015;Marchesi et al. 2015), and a wide-area survey (the 132 deg2 2XMMi Serendipitous Survey; Mateos et al. 2008).
23 f(r) is modeled as a two-dimensional Gaussian distribution where the X-rayand ancillary positional errors are added in quadrature.
7
The Astrophysical Journal, 817:172 (21pp), 2016 February 1 LaMassa et al.

we produced a catalog where we shifted the X-ray positions byrandom amounts and matched the multi-wavelength catalogs tothese randomized positions. The resulting reliability distribu-tion then gives us an estimate of the number of contaminatingspurious associations above Rcrit. We pick our Rcrit threshold byexamining the reliability histograms of the “true” matches, i.e.,the original X-ray catalog, and the “spurious” matches, i.e., thecatalog with randomized positions, in bins of 0.05 to determinewhere the fraction of spurious matches is ∼10%. That bin thenbecomes our threshold Rcrit value.
As always, matching the X-ray source lists to ancillarycatalogs is a balancing act between minimizing contaminationfrom unassociated sources and maximizing counterpart identi-fication. It is unavoidable that some true counterparts will bemissed and that spurious associations will be promoted as realmatches. In Sections 4.2–4.7 below, we note the number ofspurious matches, i.e., the number of X-ray sources withrandomized positions meeting the Rcrit threshold, to the numberof total matches from the original X-ray catalog above Rcrit toprovide an estimate of the counterpart contamination. We alsoshow in Figures 4–10 the cumulative distribution of counterpartand spurious association fraction as a function of rsep, thedistance between the X-ray and counterpart coordinates, forobjects exceeding Rcrit. We remind the reader, however, that inaddition to the separation between the sources, the astrometricerror on both the X-ray and counterpart coordinates, themagnitude of the potential counterpart, and magnitudedistribution of background sources all contribute to thecalculated reliability value reported in the published catalogs.
As the X-ray sources represent a menagerie of astronomicalobjects (stars, galaxies, obscured AGNs, and unobscuredAGNs) they will have a range of spectral energy distributionsand thus not have the same relative strength among all thewave-bands in each ancillary catalog. For example, heavilyobscured AGNs are much brighter in the redder optical andinfrared bands, and would have optical magnitudes in the bluerbands more consistent with background sources, or perhapseven be dropouts in these bands, while the converse is true forunobscured AGNs. We therefore match the X-ray source listseparately to each band in the multi-wavelength catalogs,determine Rcrit independently for each passband, and thenmerge the individual lists where we report the maximum Rcrit
values among the matches for that catalog. The only exceptionto this procedure for the MLE matching is WISE since the W1band is the most sensitive filter; all WISE sources in Stripe 82have detections in the W1 band so we do not miss any objectsby matching to W1 only. A high level summary of the multi-wavelength matches to the XMM-Newton AO 13 data ispresented in the fifth column of Table 4.
4.1. Cross-matches between X-Ray Catalogs
For the X-ray sources that are repeated among the individualcatalogs (archival Chandra, archival and AO10 XMM-Newton,and AO13 XMM-Newton catalogs), we checked their multi-wavelength counterpart matches against each other. In mostcases, these are consistent, but in some instances, a counterpartis not found for an X-ray source in one catalog yet is in another.This situation can arise due to differences in X-ray positionsand positional errors between the individual sources lists, aswell as the differences in the magnitude distribution ofbackground sources. If a counterpart is found in one X-ray
catalog and not another, we promote that counterpart as amatch in the latter catalog. To keep track of such promotedmatches, we have included the following flags: “ch_cp_flag,”“xmm_archive_cp_flag,” and “xmm_ao13_cp_flag” to indicatewhich counterparts were promoted into that catalog based onMLE matching from the archival Chandra catalog, archivaland AO10 XMM-Newton catalog, and AO13 XMM-Newtoncatalog, respectively. If these fields are empty, then theindependent MLE matching to the individual catalogs gaveconsistent results. Otherwise, the following numbers indicatewhich multi-wavelength counterpart is the promoted match: 1—SDSS counterpart found but photometry rejected for failingquality control checks; 2—SDSS; 3—redshift; 4—WISEcounterpart found but rejected for failing quality controlchecks; 5—WISE; 6—UKIDSS; 7—VHS; 8—GALEX.24
Figure 4. Cumulative distribution of the fraction of X-ray sources with an r-band counterpart above Rcrit as a function of distance between the X-ray andSDSS positions (r ;sep red solid line) and between the randomized X-raypositions and SDSS sources (blue dashed line). The top panels are for thematches from single-epoch imaging (1852 X-ray/SDSS counterparts and 41random matches) while the bottom panels show the matches to the coaddedJiang et al. (2014) catalog (1652 X-ray/coadded counterparts with 61 spuriousassociations). The number of spurious matches occurs at rsep distances similarto that as the un-shifted X-ray catalog, indicating that MLE helps to mitigateunassociated sources compared to nearest neighbor matching by usingmagnitude and astrometric precision information in the calculation.
24 None of the UKIDSS or VHS matches were rejected for compromisedphotometry.
8
The Astrophysical Journal, 817:172 (21pp), 2016 February 1 LaMassa et al.

Figure 5. Similar to Figure 4, but for the X-ray/WISE matches to the W1 band,where 2087 counterparts (seven spurious associations) are found (beforediscarding those failing quality control checks) above Rcrit.
Figure 6. Similar to Figure 4, but for the X-ray/UKIDSS matches to the Kband, where 1314 counterparts and 17 matches to randomized positions arefound above Rcrit.
Figure 7. Similar to Figure 4, but for the X-ray/VHS matches to the K band,where 1763 counterparts and 41 spurious associations are above Rcrit.
Figure 8. Similar to Figure 4, but for the X-ray/GALEX matches to the NUVband, where 572 counterpartsand 12 matches to randomized positions lie aboveRcrit.
Figure 9. Similar to Figure 4, but for the X-ray and FIRST nearest-neighbormatches, with 116 counterparts and eight randomized matches found withinrsearch=7″. Here, many of the spurious associations are found at higherseparation distances due to the low number density of radio and X-ray sources.
Figure 10. Similar to Figure 4, but for the X-ray and Herschel nearest-neighbormatches, with 121 counterparts and 8 spurious associations within rsearch=5″.Just as Figure 9 shows, the matching between the X-ray source list and FIRST,most of the spurious matches occurs at higher values of rsep.
9
The Astrophysical Journal, 817:172 (21pp), 2016 February 1 LaMassa et al.

While the number of matches quoted in the text below referto the sources above Rcrit in each catalog, the tally in theTable 4 include the promoted counterparts found from cross-matching the catalogs. The remainder of this section pertains tothe multi-wavelength catalog matching to the XMM-NewtonAO13 source list, while updates to the previous released Stripe82X catalogs are discussed in the Appendix.
4.2. SDSS
We matched the X-ray sources to the separate u, g, r, i, and zbands in the single-epoch SDSS photometry from Data Release9 (Ahn et al. 2012, DR9), where a uniform 0 1 error wasassumed for the SDSS astrometry (Rots & Budavári 2011). Weimposed the following Rcrit values for the individual SDSSbands: u—0.75, g—0.80, r—0.85, i—0.85, z—0.80, with theestimated number of spurious association rate being 36/1989,43/2006, 41/1852, 21/1819, and 51/1926, respectively.Figure 4 (top) shows the cumulative distribution of counter-parts and spurious associations above the r-band Rcrit value as afunction of distance between the X-ray and SDSS source.
We removed from these individual band source lists anySDSS object that did not exceed the Rcrit threshold, and thenchecked by eye the instances where more than one SDSSsource is matched to an X-ray source to determine whichoptical source is the most likely counterpart. The preferredmatch is usually the SDSS source with the greatest number ofmatches among the individual bands and/or the brightestobject. From our band-merged list, we then perform aphotometric quality control to check for saturation, blending,or photometry that is not well measured.25 Objects that do not
meet these requirements are flagged in the “SDSS_rej” columnas “yes” in the catalog, though we retain the SDSS coordinatesand ObjID to note that these sources are optically detected evenif the photometry is compromised. Finally, we check theremaining images by eye to remove optical artifacts, such asdiffraction spikes and noise due to emission from nearby brightobjects.We then matched the full X-ray catalog to the coadded SDSS
source lists presented in Jiang et al. (2014), which are 1.9–2.2mag deeper than the single-epoch SDSS imaging, with 5σmagnitude limits of 23.9, 25.1, 24.6, 24.1, and 22.8 (AB) in theu, g, r, i, and z bands. Here, we utilize the mag_auto fieldsreturned by SExtractor (Bertin & Arnouts 1996) for the MLEalgorithm. Jiang et al. (2014) performed the image coadditionby separating each of the 12 SDSS parallel scans that coverStripe 82 into 401 individual regions, extracting aperturemagnitudes separately for each of the five bands. They thenprovide 24,060 individual catalogs, where each band, region,and scan line are independent catalogs, which can includeduplicate observations of the same source among these catalogsthat cover adjacent area. Thus, we first produced “cleaned”SDSS coadded catalogs by only retaining objects within 45″ ofthe XMM-Newton AO13 sources, since these are the data weneed to estimate the background and find counterparts. We thensearch for duplicate observations within each band bysearching for matches within 0 5, retaining the coordinatesand photometry for the object that has the highest signal-to-noise. We match the X-ray sources to each of these cleanedcoadded catalogs. Here, the astrometric errors in the coaddedimages are similar to those of the single-epoch images due tothe method used when generating the coadds (Jianget al. 2014). However, we conservatively used a value of 0 2based on observed positional offsets between SDSS coaddedsources and FIRST objects (I. McGreer 2015, privatecommunication). We find the following Rcrit cut-offs: u—0.85, g—0.9, r—0.9, i—0.9, z—0.85, with the spuriousassociation rate being 20/1799, 41/1751, 61/1652, 40/1530,and 37/1816, respectively; the cumulative fraction of matchesas a function of rsearch above Rcrit for both the X-ray source listand randomized positions is shown in the bottom panel ofFigure 4. We note that the lower number of sources herecompared with the single-epoch imaging data is due to thehigher reliability thresholds we impose for the coadded catalog.However, the number of spurious associations in the lowerreliability bins becomes a much higher fraction of the totalnumber of true X-ray sources in those bins, so we have erred onthe side of caution to minimize the number of randomassociations in our sample.From these counterparts found from matching to the coadded
images, we keep only the sources that do not have a counterpartin the single-epoch imaging. Since Jiang et al. (2014) do notprovide a band-matched catalog or cross-identify the samesource among the multiple-bands, we consider an opticalsource to be the same object if it is within ∼0 6 with no otherobject found in that band within 1″; if no match in another bandis found meeting these requirements, the source is assumed tobe a drop-out in that band. The reported SDSS coordinates arethe average of the coordinates in the individual band catalogswhere the source is detected. The objects found from thecoadded catalog are marked in the “SDSS_coadd” columnas “yes.”
Table 4Multi-wavelength Counterpart Summarya
Survey ChandraXMM-Newton
XMM-Newton
XMM-Newton Totalb
Archival Archival AO10 AO13
SDSSc 874 (118) 1258 (190) 614 (66) 2438(178)
5009(530)
WISE 686 948 531 2033 4006UKIDSS 568 923 503 1784 3643VHS 610 995 518 2119 4093GALEX 166 254 82 607 1080FIRST 42 55 27 116 232Herschel 9 9 K 121 133Redshifts 339 465 292 828 1842
Notes.a The counterpart numbers quoted in the text refer to associations found frommatching the individual X-ray catalogs with the multi-wavelength source lists.Here, we include the final numbers that include “promoted” matches, foundfrom cross-correlating the counterparts among the X-ray catalogs (seeSections 4.1 and A.7 for details).b Duplicate sources among surveys removed from total numbers.c Includes matches to the single-epoch and coadded catalogs. The number ofsources found in the coadded catalog that do not have matches in the single-epoch data are quoted in parentheses.
25 We report the photometry for objects that meet the follow requirements:(NOT_SATUR) OR (SATUR AND (NOT SATUR_CENTER)), (NOTBLENDED) OR (NOT NODEBLEND), (NOT BRIGHT) AND (NOTDEBLEND_TOO_MANY_PEAKS) AND (NOT PEAKCENTER) AND(NOT NOTCHECKED) AND (NOT NOPROFILE). An object that failedany of these quality control checks has the photometry set to -999 in thecatalog.
10
The Astrophysical Journal, 817:172 (21pp), 2016 February 1 LaMassa et al.

In total, we find SDSS counterparts for 2438 X-ray sources(85% of the sample), 178 of which are not found in the single-epoch SDSS imaging but are detected in the coadded catalog,and as expected are generally fainter. We list the informationfor the SDSS counterparts found from the single-epoch catalog,where available, to allow the user to easily query the mainSDSS database to fetch relevant information using the uniqueSDSS ObjID or SDSS coordinates; similar data, such asaperture magnitudes and errors, from the coadded Jiang et al.(2014) catalog would involve querying 24,060 individualcatalogs, while such data are linked in the main SDSS database.
4.2.1. Optical Spectra
We mined the following public spectroscopic catalogs tofind redshifts, and where possible, optical classifications of theX-ray sources with SDSS counterparts: SDSS Data Release 12(DR12; Alam et al. 2015), 2SLAQ (Croom et al. 2009), pre-BOSS pilot survey using Hectospec on MMT (Ross et al.2012), and 6dF (Jones et al. 2004, 2009). We checked by eyethe 41 spectra that had the zwarning flag set by the SDSSpipeline. While we were able to verify some of these redshifts,we were not able to find a reliable redshift solution for 26 ofthese objects, and consequently set their redshifts to zero in thecatalog. We also obtained spectra for 12 and 6 sources in 2014September and 2015 January, respectively, through ourdedicated follow-up program with WIYN HYDRA; the spectrawere reduced with the IRAF task dohydra where we identifiedredshifts based on emission and/or absorption features, orclassified stars on the basis of their rest-frame absorption andemission lines. About 29% of the X-ray sources (828 objects)have secure redshifts. The calculation of photometric redshiftsfor the remainder of the sources is underway (T. Ananna et al.2015, in preparation).
The databases we mined provide an automatic classificationof sources based on their optical spectra, where “QSO”s or“AGNs” are objects that have at least one broad emission linein their spectra (generally a full-width half max exceeding2000 km s−1). Sources lacking broad emission lines areclassified as “galaxies,” where this type includes objects withnarrow emission lines (Type 2 and elusive AGNs, i.e. thoseobjects with emission line ratios consistent with star-forminggalaxies; Baldwin et al. 1981; Maiolino et al. 2003), absorptionlines only, and even blazars with featureless optical spectra thatare not flagged as active galaxies by optical spectroscopicpipelines. We have followed this methodology when classify-ing sources from our spectroscopic follow-up campaign, wherewe reserve the class QSO to refer to broad-line objects andgalaxies for sources lacking broad-lines. Stars are identified byemission and absorption transitions in their optical spectra.
4.3. WISE
Since publishing our initial Stripe 82X multi-wavelengthmatched catalogs in LaMassa et al. (2013a), the AllWISESource Catalog was released, combining data from thecryogenic and NEOWISE missions (Wright et al. 2010; Main-zer et al. 2011). As this catalog has enhanced sensitivity andastrometric precision, we match the XMM-Newton AO13 X-raysource list to this release, and update the archival Chandra andXMM-Newton and XMM-Newton AO10 matches to AllWISE,as detailed in the appendix.
When doing the MLE matching to the W1 band, using the“w1mpro” magnitude measured via profile-fitting photometry,we use a Rcrit of 0.9, with seven spurious associations out of2087 matches (see Figure 5). We then impose photometrycontrol checks on the WISE sources, following our prescriptionin LaMassa et al. (2013a). We null out the magnitude in anyband that was saturated (i.e., the fraction of saturated pixels,“wnsat” exceeds 0.05, where n refers to the band number); islikely a spurious detection associated with artifacts such asdiffraction spikes, persistence, scattered light from nearbybright sources (i.e., if the “cc_flag” is non-zero); or moon levelcontamination (i.e., if “moon_lev” 5, where “moon_lev” isthe ratio of frames affected by scattered moonlight to the totalnumber of frames and spans from 0 to 9). We also isolateextended sources, as their “wnmpro” magnitudes would beunreliable. These sources have the “ext_flag” set to non-zero.For these objects, we downloaded their elliptical photometrymagnitudes (“wngmag”) and discarded their photometry if theirextended photometry magnitude flags were non-null. If amatched WISE source has photometry that fails the point-likeor extended photometry quality checks in all bands, then the“wise_rej” flag is set to “yes” in the catalog and the associatedphotometry and coordinates are not reported.Of the 2087 matched sources, 2031 (71% of the XMM-
Newton AO13 sources) passed the quality assurance testsabove. All the rejected sources were extended. Ten extendedsources had non-flagged elliptical magnitude measurementsand are marked with the “wise_ext” flag set to “yes” in thecatalog.
4.4. Near-infrared
The XMM-Newton AO13 source list was matched indepen-dently to the near-infrared (NIR) catalogs from the UKIDSSLarge Area Survey (LAS; Hewett et al. 2006; Casali et al.2007; Lawrence et al. 2007; Warren et al. 2007) and VHS(McMahon et al. 2013). From both catalogs, we chose primaryobjects from the database26 and eliminated objects that wereconsistent with noise, i.e., “mergedclass” set to zero and“pnoise”27 >0.05. The magnitudes presented in the catalog arethe “apermag3” values from the UKIDSS LAS and VHSdatabases, which are aperture-corrected magnitudes, with a 2″diameter aperture.We matched the XMM-Newton AO13 source list to Data
Release 8 of the UKIDSS LAS survey. Matching separately tothe Y (0.97–10.07 μm), J (1.17–1.33 μm), H (1.49–1.78 μm),and K (2.03–2.37 μm) bands, we find Rcrit values of 0.75, 0.85,0.75, 0.75, respectively, with a spurious association rate of21/1375, 15/1070, 18/1335, and 17/1314, respectively (seeFigure 6). When merging the separate lists together, we find atotal of 1784 near-infrared counterparts, or 62% of the X-raysample. We performed quality control checks on the photo-metry as explained in LaMassa et al. (2013a) to check forsaturation, but no objects were flagged as being possiblysaturated.We used Data Release 3 of the VHS survey to match to the
XMM-Newton AO13 catalog, where we adopt an astrometricuncertainty of 0 14 for the VHS sources. VHS has coverageover Stripe 82 in the J, H, and K bands, where we impose Rcrit
values of 0.75 in each band, with a spurious counterpart rate of
26 priOrSec=0 OR priOrSec=frameSetId.27
“Pnoise” is the probability that the detection is noise.
11
The Astrophysical Journal, 817:172 (21pp), 2016 February 1 LaMassa et al.

20/1856, 39/1783, and 41/1763, respectively (see Figure 7).In total, 2117 XMM-Newton AO13 sources (74% of thesample) have NIR counterparts from the VHS survey. We alsocheck the “mergedClass” flag to test if a source is saturated(“mergedClass”=−9), but none of the matches are soafflicted.
Between UKIDSS and VHS, we find NIR counterparts for2257 X-ray sources, or 79% of the sample. Of the NIR sources,140 are found in UKIDSS, but not VHS. Of these, 34 werenon-detections in VHS (i.e., no match between VHS andUKIDSS within a 2″ search radius), while the remaining 106were found in VHS but fell below our reliability thresholds forthis catalog; we note that 77 of these VHS sources belowthe reliability cut had UKIDSS Y-band reliabilities above ourY-band critical threshold, while VHS is lacking this coverage.By presenting matches to both UKIDSS and VHS, thevariability of the 1678 X-ray selected, NIR objects (1644objects in common between UKIDSS and VHS and the 34VHS dropouts) can be studied by the community.
4.5. GALEX
Similar to the UKIDSS matching, we used the cleanedGALEX catalog described in LaMassa et al. (2013a) to findcounterparts to the XMM-Newton AO13 sources, matching tothe near-ultraviolet (NUV) and far-ultraviolet (FUV) bandsindependently. This catalog represents data from the medium-imaging survey (MIS) in GALEX Release 7 (Morrisseyet al. 2007). With a Rcrit value of 0.75 for both bands, wefind 572 and 407 counterparts, with 12 and 5 spuriousassociations, in the NUV and FUV bands, respectively (seeFigure 8). In total, 607 X-ray sources have ultravioletcounterparts, corresponding to 21% of the XMM-NewtonAO13 sample.
4.6. FIRST
Due to the relatively low space density of the radio sourcesdetected in the FIRST (Becker et al. 1995; White et al. 1997)survey, we used a nearest neighbor match to find counterpartsto the X-ray sources, using the same search radius of 7″ asemployed in the MLE matching above. Similar to our previousStripe 82X catalog release, we used the FIRST catalogpublished in 2012 which includes all sources detected between1993 and 2011, which has a 0.75 mJy flux limit over the XMM-Newton AO13 region (Becker et al. 2012). Since our previouspaper, the final FIRST catalog has been published (Helfandet al. 2015) but we do not gain any additional sources whenmatching to this final catalog, both with the XMM-NewtonAO13 data and archival Chandra and archival and AO10XMM-Newton catalogs. Of the X-ray sample, 116 FIRSTsources (4% of the X-ray sample) are found within 7″ of theXMM-Newton AO13 sources. When matching the FIRSTcatalog to the randomly shifted X-ray positions, eight spuriousassociations were found (see Figure 9).
4.7. Herschel
The Herschel Stripe 82 Survey (HerS) covers 79 deg2 at 250,350, and 500 μm to an average depth of 13.0, 12.9, and14.8 mJy beam−1 at >3σ, surveyed with the Spectral andPhotometric Imaging Receiver (SPIRE) instrument (Vieroet al. 2014). The far-infrared emission from Herschel providesa clean tracer of host galaxy star-formation (Pier &
Krolik 1992), making these data of particular importance tostudy the host galaxies of AGNs (Pier & Krolik 1992;Efstathiou & Rowan-Robinson 1995; Lutz et al. 2004; Fritzet al. 2006; Schweitzer et al. 2006; Netzer et al. 2007;Schartmann et al. 2008; Shao et al. 2010; Mullaney et al. 2011;Rosario et al. 2012; Magdis et al. 2013; Delvecchioet al. 2014). Indeed, the XMM-Newton AO13 survey wasspecifically designed to overlap existing Herschel coverage,since similar far-infrared data will not be available in theforeseeable future.Similar to the matching to the FIRST catalog, we employed a
nearest neighbor approach to find associations between the far-infrared Herschel sources and the X-ray objects. However, weshortened rsearch to 5″ since our exercise of matching theHerschel catalog to the random X-ray positions reveals thatmost spurious associations occurred at distances between 5″and 7″. We found 121 Herschel sources within 5″ of the XMM-Newton sources, corresponding to 4% of the sample, and 8spurious associations when matching to the randomized X-raypositions (see Figure 10).
4.8. XMM-Newton AO13 Multiwavelength Match Summary
In total, we find counterparts to 93% of the XMM-NewtonAO13 sources. However, we emphasize that we matched theX-ray source list independently to each of the multi-wavelengthcatalogs and did not cross-correlate the counterparts. In a vastmajority of the cases, these counterparts among the catalogs arethe same source, though discrepancies exist. For guidance, weinclude a “cp_coord_flag” to note which sources havecounterparts with consistent coordinates and which do not,using a search radius of 2″ for SDSS, UKIDSS, VHS, andFIRST and 3″ for WISE, GALEX, and Herschel due to thelarger PSF and higher astrometric uncertainties in these lattercatalogs compared with the former. When the coordinates areinconsistent within these search radii, the “cp_coord_flag” isset to one; otherwise it is set to null. For 89% of the X-raysources with counterparts, their coordinates are consistent. Wenote, however, that above these search radii, consistentcounterparts may exist and below these radii, there can stillbe discrepencies.Finally, we highlight that the multi-wavelength magnitudes
in the Stripe 82X catalogs may not be the most appropriatemagnitude for every source and it is up to the user to determinewhether different aperture photometry should be downloadedfrom the original catalog, using the identifying informationpresented in our catalogs to isolate the correct source, for theintended science goals.A summary of the multi-wavelength columns and flags is
presented in the appendix, as well as a discussion of updatesmade to the previously released Stripe 82X catalogs.
5. DISCUSSION
When considering the full Stripe 82X survey to date,including archival Chandra, archival XMM-Newton, XMM-Newton AO10, and XMM-Newton AO13 data, we find multi-wavelength counterparts to 88% of the X-ray sources. Weare able to identify ∼30% of the Stripe 82X sample withspectroscopic objects. Of the sample, 67 objects are classifiedas stars while the remaining 1775 objects are extragalactic. Weplot the r-band magnitude as a function of soft X-ray flux forall objects with optical counterparts in Figure 11, where we
12
The Astrophysical Journal, 817:172 (21pp), 2016 February 1 LaMassa et al.

note which objects are stars, X-ray AGNs, X-ray galaxies, andcurrently unidentified (i.e., they lack redshifts). Stars areclassified on the basis of their optical spectra while here we usethe observed, full-band X-ray luminosity to differentiatebetween X-ray AGNs ( >-L 100.5 10 keV
42 erg s−1) and X-raygalaxies ( <-L 100.5 10 keV
42 erg s−1), independent of theiroptical spectroscopic classification. For reference, we alsoinclude lines to mark typical AGNs X/O values (e.g., Brandt &Hasinger 2005):
= = + + ´/ f f f C mX O Log log 0.4 , 3x xopt r( ) ( ) ( )
where C is a constant based on the optical filter, which for theSDSS r-band, is 5.67 (see Green et al. 2004). Previous studieshave found that AGNs generally fall within the X/0=0±1locus (e.g., Schmidt et al. 1998; Alexander et al. 2001; Greenet al. 2004; Brusa et al. 2007; Xue et al. 2011; Civanoet al. 2012), as indicated by the dashed lines in Figure 11. Wefind the same trend here, and note that extragalactic objects donot separate out from Galactic objects within this color space.
5.1. Stars
In Figure 12, we show how most X-ray emitting stars can becleanly identified on the basis of their optical and infraredproperties by comparing their -r K and -r W1 colors, aspresented in LaMassa et al. (2015b). Here, we focus on theX-ray sources with SDSS, UKIDSS, and WISE counterpartsthat have K-band detections,W1 detections (W1 SNR >2), andan r-band magnitude under 22.2 (the 95% completeness limitfor the single-epoch SDSS imaging catalog) to avoid artificiallyinflating the colors to redder values. Additionally, we onlyretain the sources where the SDSS and UKIDSS coordinatesare consistent within 2″ and the SDSS and WISE coordinatesagree within 3″ to minimize spurious associations. In total,1891 objects are shown in Figure 12, compared with the 4133sources shown in the previous plot, which are sources detectedin the r and soft X-ray bands. Most of the stars follow a well-defined track in -r K versus -r W1 color space, aiding in theseparation of Galactic and extragalactic candidates detected in
X-ray surveys in the absence of supporting spectroscopicinformation.
5.2. Extragalactic Objects
In Figure 13 (left), we show the redshift distribution of the1775 extragalactic sources with optical spectra: about half(875) are at z>1, with 301 at redshifts above 2. We furtherbreak down the redshift distribution by classification, based onoptical spectroscopy (see Section 4.2.1) and X-ray luminosity.In Figure 13, “broad-line” AGNs are sources opticallyclassified as quasars due to broad emission lines in theirspectra, “obscured AGNs” are sources optically classified asgalaxies whose full-band observed X-ray luminosities exceed1042 erg s−1, and “galaxies” are objects lacking broad-lines intheir optical spectra whose X-ray luminosities are below1042 erg s−1; we note, however, that this “galaxy” class caninclude Compton-thick AGNs ( > ´N 1.25 10H
24 cm−2) withvery weak observed X-ray emission due to heavy attenuation.Of the 1775 extragalactic sources in our sample, 19 are notclassified in the spectroscopic databases we utilized andanother 30 do not have significant detections in the fullX-ray band.The left-hand panel of Figure 13 demonstrates that nearly all
the sources we have identified thus far at high redshifts (i.e.,z>1) are broad-line AGNs, in part because unobscuredquasars were preferentially selected as spectroscopic targets inthe SDSS surveys. Most of the obscured AGNs live within theintermediate universe (z∼0.5) while galaxies reside in thelocal universe (z<0.25). We expect the percentage ofobscured AGNs, i.e., those lacking broad emission lines, toincrease as more objects are identified via spectroscopic andphotometric redshifts.In the right-hand panel of Figure 13, we show the observed
full-band luminosity distribution of the X-ray AGNs, 1603sources in total. The distribution peaks at relatively highluminosities (∼44.5 dex) due to the wide-area and shallowdesign of the survey. Most of the high luminosity AGNs arebroad-line sources, though a handful of obscured AGNs do
Figure 11. SDSS r-band magnitude as a function of observed X-ray flux in the0.5–2 keV band. The solid line defines the typical X-ray-to-optical flux ratio ofAGNs (Brandt & Hasinger 2005), while the dashed lines show the X/O=±1locus within which most AGNs lie (see Equation (3)). Stars are identified bytheir optical spectra while AGNs and galaxies are classified based on theirobserved 0.5–10 keV luminosity, with 1042 erg s−1 being the dividing line.
Figure 12. -r W1 (AB) color as a function of r − K (AB) color for the 1891X-ray sources with SDSS, UKIDSS, and WISE counterparts that have K-bandandW1 detections and UKIDSS (WISE) coordinates within 2″ (3) of the SDSSposition. Many of the stars can be identified by the distinct track they occupy inthis color space (LaMassa et al. 2015b).
13
The Astrophysical Journal, 817:172 (21pp), 2016 February 1 LaMassa et al.

reach moderately high X-ray luminosities (Log ( -L0.5 10 keV/ergs−1) > 43.75 dex).
5.3. The L – z Plane Probed by Stripe 82X
To put the Stripe 82X sample in context with other surveys,we compare the luminosity-redshift plane with the small-area,deep CDFS survey (0.13 deg2; Xue et al. 2011) and themoderate-area, moderate-depth COSMOS-Legacy survey(2.2 deg2; Civano et al. 2015; Marchesi et al. 2015). Here,we use soft-band (0.5–2 keV) luminosities that have been k-corrected to the rest-frame, using Γ=1.4 for CDFS andCOSMOS, while no k-correction was needed for Stripe 82X asthe soft-band flux was estimated using Γ=2 and the k-correction scales as + G-z1 2( )( ). As Figure 14 (left) shows, assurvey area increases and the effective flux limits of the surveys
become shallower, the detected sources are preferentially athigher luminosity at every redshift. This is further illustrated inFigure 14 (right), which compares the normalized luminositydistribution of Stripe 82X with COSMOS and CDFS, high-lighting the complementarity of the different survey strategiesin preferentially identifying sources within different luminosityranges (see, e.g., Hsu et al. 2014). Wide-area surveys whichexplore a large volume of the universe, like Stripe 82X, arenecessary to discover rare objects that have a low spacedensity, including the highest luminosity quasars.One important caveat in Figure 14 is that we limit our
comparison to sources with measured redshifts. For Stripe 82X,this represents the 30% of the sample that has spectroscopicredshifts while COSMOS and CDFS have spectroscopic andphotometric redshifts, effectively identifying ∼96% and ∼91%
Figure 13. Left: spectroscopic redshift distribution of the 1775 extragalactic Stripe 82X sources, with different classes of objects highlighted. Half the sample is abovea redshift of one, and contains predominantly broad-line AGNs at these distances. Nearly all obscured AGNs (i.e., sources optically classified as galaxies with but withfull band X-ray luminosities above 1042 erg s−1) are at a redshift below 1, while the optical and X-ray galaxies are at z<0.25 (Compton-thick AGNs that have lowobserved X-ray flux due to heavy obscuration can be included in the “galaxy” bin). Right: observed full-band luminosity distribution for the 1603 spectroscopicallyconfirmed X-ray AGNs (i.e., >-L 100.5 10 keV
42 erg s−1), where the distribution peaks at high-luminosities (44.25 dex < Log( -L0.5 10 keV erg s−1) < 45.25 dex). High-luminosity AGNs are predominantly broad-line sources while the lower-luminosity AGNs are mostly obscured. We note that these trends are for the ∼30% of theparent Stripe 82X sample that have spectroscopic redshifts and that with increased completeness and more sources identified via photometric redshifts, we expect toconfirm more AGNs at all luminosities and redshifts, including at z>2 and >-L 100.5 10 keV
45 erg s−1, and a higher percentage of obscured AGN.
Figure 14. Left: K-corrected (rest-frame) soft-band (0.5–2 keV) luminosities as a function of redshift for the Stripe 82X (red diamonds), COSMOS-Legacy (blueasterisks; Civano et al. 2015; Marchesi et al. 2015), and CDFS (black crosses) sources. At every redshift, an increase in survey area preferentially identifies higher-luminosity sources. Right: normalized distribution of k-corrected soft-band luminosities for Stripe 82X compared with COSMOS and CDFS: the wide-area coverageof Stripe 82X which probes a large effective volume of the universe, enables the rare, highest luminosity quasars to be uncovered, complementing the parameter spaceexplored by small- to moderate-area surveys. In both plots, only the sources identified with redshifts are plotted, representing 30% of the Stripe 82X sample (whichcurrently has only spectroscopic redshifts) and 91% and 96% of the CDFS and COSMOS-Legacy sample, respectively, where both spectroscopic and photometricredshifts are available.
14
The Astrophysical Journal, 817:172 (21pp), 2016 February 1 LaMassa et al.
of the parent samples, respectively. The photometric redshiftcatalog for Stripe 82X will be published in the coming months(T. Ananna et al 2015, in preparation), allowing us to identifythe majority of the X-ray sources, increasing the number ofsources at every redshift and luminosity.
6. CONCLUSION
We have presented the results from the most recentinstallment of the Stripe 82 X-ray survey, utilizing dataawarded to our team in XMM-Newton cycle AO13. Thisprogram, amounting to ∼980 ks of exposure time and spanning15.6 deg2, approximately doubled the previous X-ray coveragein the SDSS Stripe 82 Legacy field, with 2862 X-ray sourcesdetected at >5σ level. The approximate flux limits of the AO13portion of the Stripe 82X survey are 2.2×10⁻¹⁵ erg s−1 cm−2,1.3×10−14 erg s−1 cm−2, and 6.7×10⁻¹⁵ erg s−1 cm−2, inthe soft (0.5–2 keV), hard (2–10 keV), and full (0.5–10 keV)bands. From matching the X-ray source list to available multi-wavelength catalogs, including SDSS (Ahn et al. 2012; Jianget al. 2014), WISE (Wright et al. 2010; Mainzer et al. 2011),UKIDSS (Hewett et al. 2006; Casali et al. 2007; Lawrenceet al. 2007; Warren et al. 2007), VHS (McMahon et al. 2013),GALEX (Morrissey et al. 2007), FIRST (Becker et al. 2012;Helfand et al. 2015), and Herschel (Viero et al. 2014), weidentified reliable counterparts for 93% of the sample. About29% of the X-ray sources are classified via spectroscopicredshifts.
Merging this data set with our previous releases of the Stripe82X catalogs (LaMassa et al. 2013a, 2013b), the X-ray surveyarea in Stripe 82 covers ∼31.3 deg2, with 6181 unique X-raysources detected at s4.5 and >5σ, for the Chandra andXMM-Newton components of the survey, respectively. We alsoupdated the multi-wavelength matched X-ray catalogs for theseearlier segments of the survey. In total, we find reliable multi-wavelength counterparts for 88% of the full Stripe 82X surveyto date, with a spectroscopic completeness of 30%. Weemphasize that we matched the X-ray source list to eachmulti-wavelength catalog independently and have not cross-correlated the counterparts. However the counterparts largelyagree among the catalogs, as discussed in the main text. Caremust also be taken when studying the colors or spectral energydistributions of the X-ray sources using the magnitudes wepresent in these catalogs: it is up to the user to decide whetherthe aperture photometry in these catalogs is most suitable for agiven source or if different aperture magnitudes should beretrieved from the main multi-wavelength catalogs, using theidentifying information in the Stripe 82X catalog to selectspecific sources.
The large volume of the universe explored by the Stripe 82Xsurvey enables the discovery of high-luminosity, high-redshiftAGNs, a missing tier in the current X-ray census ofsupermassive black hole growth. We have several upcomingdedicated spectroscopic follow-up programs to increase thecompleteness of Stripe 82X, which in tandem with thephotometric redshift catalog (T. Ananna et al. 2015, inpreparation), will allow us to constrain how the most luminousX-ray AGNs evolve over cosmic time. Furthermore, we aretargeting obscured AGN candidates which have optical andinfrared clues that they may be the transitional link in themerger-induced black hole growth/galaxy evolution paradigm(see, e.g., Glikman et al. 2013; Brusa et al. 2015); a handful ofsuch luminous obscured AGNs at z>1 have already been
discovered (S. M. LaMassa et al. 2015, in preparation), withmany more candidates yet to be explored in this data set.Additionally, Stripe 82X will provide insight into AGN hostgalaxies via spectral energy distribution analysis, AGNvariability, the dark matter halos hosting high-luminosityquasars at high-redshift via clustering analysis, the X-rayproperties of galaxy clusters, and the opportunity to discoverexotic sources. For instance, in the previous release of theStripe 82X catalog, we discovered the first “changing-look”quasar (LaMassa et al. 2015a), an AGN which transitionedfrom a broad-line (Type 1) object to a mostly narrow-line(Type 1.9) object within a 10 year period (see also Merloniet al. 2015). We expect that Stripe 82X will have applicationsbeyond those listed here, and can be particularly helpful ininforming best-effort practices for AGN identification andfollow-up in upcoming wide-area surveys, including eROSITAwhich will be launched in 2017 (Merloni et al. 2012; Predehlet al. 2014). Finally, we note that increasing the X-ray area to100 deg2 will open a new window into black hole growth atz>3 and luminosities greater than 1045 erg s−1, which is onlybeginning to be explored from an X-ray perspective (e.g.,Georgakakis et al. 2015). The existing ancillary data will allowthese objects to be readily characterized, allowing thispopulation to be fully understood.
We thank the anonymous referee for feedback that helpedimprove the manuscript. S.M.L. acknowledges support fromgrant number NNX15AJ40G. C.M.U. gratefully acknowledgessupport from Yale University. C.M.U. and S.K. would like tothank the Kavli Institute for Theoretical Physics (SantaBarbara) for their hospitality and support; the KITP issupported by NSF grant No. NSF PHY11-25915. M.B.acknowledges support from the FPY Career Integration Grant“eEASY” (CIG 321913). Support for the work of E.T. wasprovided by the Center of Excellence in Astrophysics andAssociated Technologies (PFB 06), by the FONDECYT grant1120061 and the Anillo project ACT1101. K.S. gratefullyacknowledges support from Swiss National Science Founda-tion Grant PP00P2_138979/1.Funding for the SDSS and SDSS-II has been provided by the
Alfred P. Sloan Foundation, the Participating Institutions, theNational Science Foundation, the U.S. Department of Energy,the National Aeronautics and Space Administration, theJapanese Monbukagakusho, the Max Planck Society, and theHigher Education Funding Council for England. The SDSSWeb Site ishttp://www.sdss.org/.The SDSS is managed by the Astrophysical Research
Consortium for the Participating Institutions. The ParticipatingInstitutions are the American Museum of Natural History,Astrophysical Institute Potsdam, University of Basel, Uni-versity of Cambridge, Case Western Reserve University,University of Chicago, Drexel University, Fermilab, theInstitute for Advanced Study, the Japan Participation Group,Johns Hopkins University, the Joint Institute for NuclearAstrophysics, the Kavli Institute for Particle Astrophysics andCosmology, the Korean Scientist Group, the Chinese Academyof Sciences (LAMOST), Los Alamos National Laboratory, theMax-Planck-Institute for Astronomy (MPIA), the Max-Planck-Institute for Astrophysics (MPA), New Mexico State Uni-versity, Ohio State University, University of Pittsburgh,University of Portsmouth, Princeton University, the UnitedStates Naval Observatory, and the University of Washington.
15
The Astrophysical Journal, 817:172 (21pp), 2016 February 1 LaMassa et al.
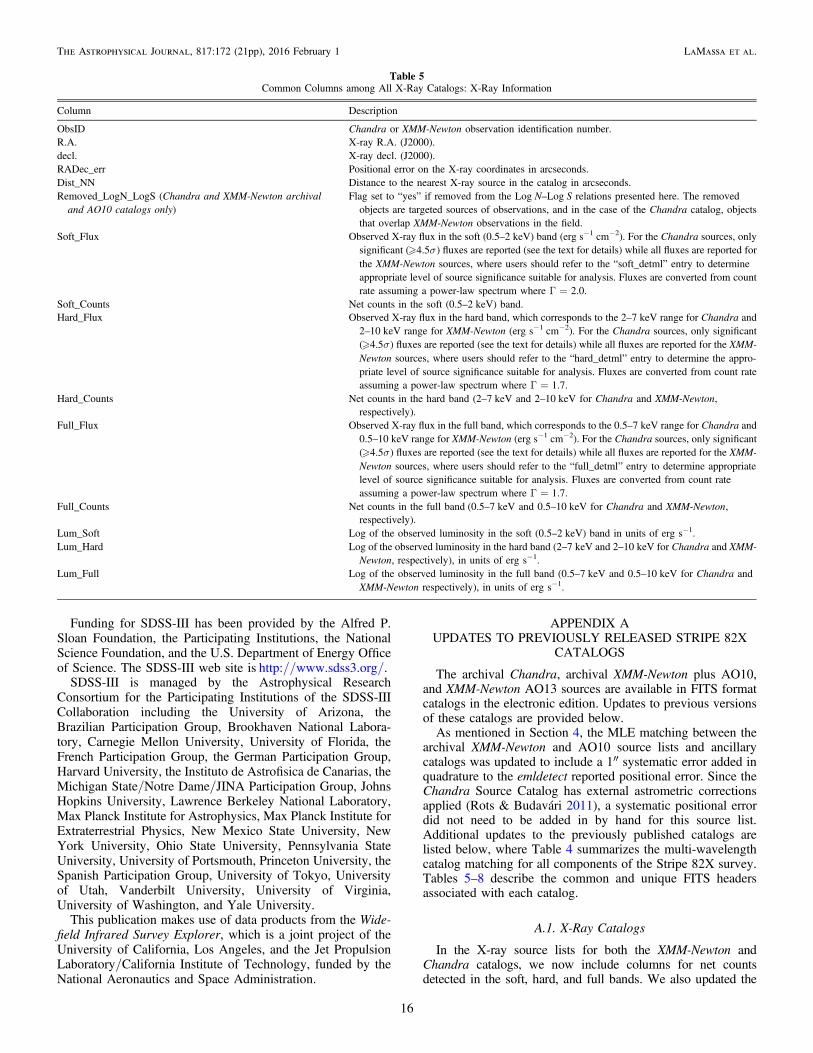
Funding for SDSS-III has been provided by the Alfred P.Sloan Foundation, the Participating Institutions, the NationalScience Foundation, and the U.S. Department of Energy Officeof Science. The SDSS-III web site is http://www.sdss3.org/.
SDSS-III is managed by the Astrophysical ResearchConsortium for the Participating Institutions of the SDSS-IIICollaboration including the University of Arizona, theBrazilian Participation Group, Brookhaven National Labora-tory, Carnegie Mellon University, University of Florida, theFrench Participation Group, the German Participation Group,Harvard University, the Instituto de Astrofisica de Canarias, theMichigan State/Notre Dame/JINA Participation Group, JohnsHopkins University, Lawrence Berkeley National Laboratory,Max Planck Institute for Astrophysics, Max Planck Institute forExtraterrestrial Physics, New Mexico State University, NewYork University, Ohio State University, Pennsylvania StateUniversity, University of Portsmouth, Princeton University, theSpanish Participation Group, University of Tokyo, Universityof Utah, Vanderbilt University, University of Virginia,University of Washington, and Yale University.
This publication makes use of data products from the Wide-field Infrared Survey Explorer, which is a joint project of theUniversity of California, Los Angeles, and the Jet PropulsionLaboratory/California Institute of Technology, funded by theNational Aeronautics and Space Administration.
APPENDIX AUPDATES TO PREVIOUSLY RELEASED STRIPE 82X
CATALOGS
The archival Chandra, archival XMM-Newton plus AO10,and XMM-Newton AO13 sources are available in FITS formatcatalogs in the electronic edition. Updates to previous versionsof these catalogs are provided below.As mentioned in Section 4, the MLE matching between the
archival XMM-Newton and AO10 source lists and ancillarycatalogs was updated to include a 1″ systematic error added inquadrature to the emldetect reported positional error. Since theChandra Source Catalog has external astrometric correctionsapplied (Rots & Budavári 2011), a systematic positional errordid not need to be added in by hand for this source list.Additional updates to the previously published catalogs arelisted below, where Table 4 summarizes the multi-wavelengthcatalog matching for all components of the Stripe 82X survey.Tables 5–8 describe the common and unique FITS headersassociated with each catalog.
A.1. X-Ray Catalogs
In the X-ray source lists for both the XMM-Newton andChandra catalogs, we now include columns for net countsdetected in the soft, hard, and full bands. We also updated the
Table 5Common Columns among All X-Ray Catalogs: X-Ray Information
Column Description
ObsID Chandra or XMM-Newton observation identification number.R.A. X-ray R.A. (J2000).decl. X-ray decl. (J2000).RADec_err Positional error on the X-ray coordinates in arcseconds.Dist_NN Distance to the nearest X-ray source in the catalog in arcseconds.Removed_LogN_LogS (Chandra and XMM-Newton archival
and AO10 catalogs only)Flag set to “yes” if removed from the Log N–Log S relations presented here. The removed
objects are targeted sources of observations, and in the case of the Chandra catalog, objectsthat overlap XMM-Newton observations in the field.
Soft_Flux Observed X-ray flux in the soft (0.5–2 keV) band (erg s−1 cm−2). For the Chandra sources, onlysignificant ( s4.5 ) fluxes are reported (see the text for details) while all fluxes are reported forthe XMM-Newton sources, where users should refer to the “soft_detml” entry to determineappropriate level of source significance suitable for analysis. Fluxes are converted from countrate assuming a power-law spectrum where Γ=2.0.
Soft_Counts Net counts in the soft (0.5–2 keV) band.Hard_Flux Observed X-ray flux in the hard band, which corresponds to the 2–7 keV range for Chandra and
2–10 keV range for XMM-Newton (erg s−1 cm−2). For the Chandra sources, only significant( s4.5 ) fluxes are reported (see the text for details) while all fluxes are reported for the XMM-Newton sources, where users should refer to the “hard_detml” entry to determine the appro-priate level of source significance suitable for analysis. Fluxes are converted from count rateassuming a power-law spectrum where Γ=1.7.
Hard_Counts Net counts in the hard band (2–7 keV and 2–10 keV for Chandra and XMM-Newton,respectively).
Full_Flux Observed X-ray flux in the full band, which corresponds to the 0.5–7 keV range for Chandra and0.5–10 keV range for XMM-Newton (erg s−1 cm−2). For the Chandra sources, only significant( s4.5 ) fluxes are reported (see the text for details) while all fluxes are reported for the XMM-Newton sources, where users should refer to the “full_detml” entry to determine appropriatelevel of source significance suitable for analysis. Fluxes are converted from count rateassuming a power-law spectrum where Γ=1.7.
Full_Counts Net counts in the full band (0.5–7 keV and 0.5–10 keV for Chandra and XMM-Newton,respectively).
Lum_Soft Log of the observed luminosity in the soft (0.5–2 keV) band in units of erg s−1.Lum_Hard Log of the observed luminosity in the hard band (2–7 keV and 2–10 keV for Chandra and XMM-
Newton, respectively), in units of erg s−1.Lum_Full Log of the observed luminosity in the full band (0.5–7 keV and 0.5–10 keV for Chandra and
XMM-Newton respectively), in units of erg s−1.
16
The Astrophysical Journal, 817:172 (21pp), 2016 February 1 LaMassa et al.

Table 6Common Columns Among all Catalogs: Multi-wavelength Information
Column Description
SDSS_rej Flag set to “yes” if SDSS counterpart is found which exceeds the reliability threshold, but the photometry was rejected for failing quality controlchecks.
SDSS_OBJID SDSS object identification number of SDSS counterpart to X-ray source.SDSS_RA SDSS R.A. of counterpart (J2000).SDSS_Dec SDSS decl. of counterpart (J2000).SDSS_Rel MLE reliability value of SDSS counterpart; highest of the u, g, r, i, and z reliability values.SDSS_Dist Distance between X-ray source and SDSS counterpart in arcseconds.SDSS_Coadd Flag set to “yes” if SDSS counterpart is found from the Jiang et al. (2014) coadded catalog. Otherwise, the SDSS counterpart was identified in the
single-epoch DR9 imaging catalog.u_mag SDSS u-band magnitude. For the single-epoch matches, this value represents the SDSS pipeline reported ModelMag, while the sources from the
coadded SDSS catalog have Mag_Auto values calculated via SExtractor (Bertin & Arnouts 1996) as reported in the Jiang et al. (2014) catalogs.u_err SDSS u-band magnitude error. For the single-epoch matches, this value represents the SDSS pipeline reported ModelMagErr, while the sources
from the coadded SDSS catalog have MagErr_Auto values calculated via SExtractor (Bertin & Arnouts 1996) as reported in the Jiang et al.(2014) catalogs.
g_mag SDSS g-band magnitude. See u_mag for details.g_err SDSS g-band magnitude error. See u_err for details.r_mag SDSS r-band magnitude. See u_mag for details.r_err SDSS r-band magnitude error. See u_err for details.i_mag SDSS i-band magnitude. See u_mag for details.i_err SDSS i-band magnitude error. See u_err for details.z_mag SDSS z-band magnitude. See u_mag for details.z_err SDSS z-band magnitude error. See u_err for details.Specobjid SDSS spectroscopic identification number.Class Optical spectroscopic class as indicated by pipeline processing (for spectra downloaded from existing databases) or determined by us through
visual inspection for sources targeted in our follow-up campaigns. QSO—broad emission lines in spectra; GALAXY—narrow emission linesand/or absorption lines only; STAR—stellar spectrum.
Redshift Spectroscopic redshift.z_src Source of spectroscopic redshift: 0—SDSS DR9 (Ahn et al. 2012); 1—2SLAQ (Croom et al. 2009); 2—WiggleZ (Drinkwater et al. 2010); 3—
DEEP2 (Newman et al. 2013); 4—sources with “ZWARNING” flag set in SDSS pipeline which were visually inspected by us where theredshift was confirmed, updated, or nulled out if no solution could be found; 5—SDSS DR10 (Ahn et al. 2014); 6—the spectroscopic survey offaint quasars in Stripe 82 from Jiang et al. (2006); 7—WIYN HYDRA follow-up observations on 2012 Dec; 8—PRIMUS (Coil et al. 2011); 9—VLT ISAAC follow-up observation on 2013 Aug; 10—Keck NIRSPEC follow-up observations on 2013 Sep; 11—SDSS DR12 (Alamet al. 2015); 12—WIYN HYDRA follow-up observations on 2013 Aug—Sep; 13—WIYN HYDRA follow-up observations on 2014 Jan; 14—WIYN HYDRA follow-up observations on 2014 Jun; 15—WIYN HYDRA follow-up observations on 2014 Jul; 16—WIYN HYDRA follow-up observations on 2014 Sep; 17—WIYN HYDRA follow-up observations on 2015 Jan; 18—Palomar DoubleSpec observations on 2014 Jul;19—pre-BOSS pilot survey using Hectospec on MMT (Ross et al. 2012); 20—Palomar DoubleSpec follow-up observations on 2014 Dec; 22—6dF (Jones et al. 2004, 2009); 23—VVDS (Le Fèvre et al. 2003, 2005; Garilli et al. 2008; Le Fèvre et al. 2013).
WISE_Name WISE name.WISE_RA R.A. of WISE counterpart (J2000).WISE_Dec decl. of WISE counterpart (J2000).WISE_sigra Uncertainty of WISE R.A. (arcsecond).WISE_sigdec Uncertainty of WISE decl. (arcsecond).WISE_Rel MLE reliability value of WISE counterpart.WISE_Dist Distance between WISE counterpart and X-ray source (arcsecond).W1 W1 magnitude (Vega).W1sig W1 error.W1SNR W1 signal-to-noise ratio. Magnitudes with SNR < 2 are upper limits.W2 W2 magnitude (Vega).W2sig W2 error.W2SNR W2 signal-to-noise ratio. Magnitudes with SNR < 2 are upper limits.W3 W3 magnitude (Vega).W3sig W3 error.W3SNR W3 signal-to-noise ratio. Magnitudes with SNR < 2 are upper limits.W4 W4 magnitude (Vega).W4sig W4 error.W4SNR W4 signal-to-noise ratio. Magnitudes with SNR < 2 are upper limits.WISE_ext Flag set to “yes” if the WISE source is extended.WISE_rej Flag set to “yes” if WISE counterpart is identified via MLE matching but the source is rejected due to failing photometry control checks in every
WISE band.UKIDSS_ID Identification number of UKIDSS counterpart.UKIDSS_RA R.A. of UKIDSS counterpart (J2000).UKIDSS_Dec decl. of UKIDSS counterpart (J2000).UKIDSS_Rel MLE reliability value of UKIDSS counterpart; highest of the Y, J, H, and K reliability values.
17
The Astrophysical Journal, 817:172 (21pp), 2016 February 1 LaMassa et al.

XMM-Newton catalog to include an “ext_flag” whereas theprevious version had the fluxes in the band that were fit asextended by emldetect set to zero; these fluxes now reflect thevalues reported by emldetect. Additionally, in the previousXMM-Newton catalog, we set to null any flux that was notdetected at the det_ml 15 level. Here, we report thefluxes along with their corresponding det_ml value for the userto decide which flux significance is most appropriate for theirpurposes. For fluxes from the Chandra source list, wedetermined the 4.5σ significance by comparing the catalogwith the sensitivity maps (see LaMassa et al. 2013b), nulling outany fluxes which were below this significance threshold; werefer the user to the Chandra Source Catalog (Evans et al. 2010)for flux measurements at lower significance.
The “removed_logn_logs” flags have been updated in bothcatalogs to indicate which sources were excluded from theLog N–Log S generation in this work. These discarded sourcesrepresent those that are in overlapping observations that wereexcluded from the area-flux curve or that were targeted sourcesin archival observations.Finally, in the previous catalog releases, we noted whether a
Chandra source was found in the XMM-Newton catalog andvice versa, using the matching algorithm discussed in the maintext to find matches between the XMM-Newton source listsgenerated via emldetect. We added a column to note whether asource is also detected in the XMM-Newton AO13 catalog, aswell as the unique identifying information for the matchedsource (i.e., the Chandra MSID if the “in_chandra” flag is set
Table 6(Continued)
Column Description
UKIDSS_Dist Distance between UKIDSS counterpart and X-ray source (arcsecond).UKIDSS_Ymag UKIDSS Y magnitude (Vega).UKIDSS_Ysig UKIDSS Y magnitude error (Vega).UKIDSS_Jmag UKIDSS J magnitude (Vega).UKIDSS_Jsig UKIDSS J magnitude error (Vega).UKIDSS_Hmag UKIDSS H magnitude (Vega).UKIDSS_Hsig UKIDSS H magnitude error (Vega).UKIDSS_Kmag UKIDSS K magnitude (Vega).UKIDSS_Ksig UKIDSS K magnitude error (Vega).UKIDSS_rej flag set to “yes” if UKIDSS counterpart is found via MLE matching but source is rejected due to failing quality control checks.VHS_ID Identification number of VHS counterpart.VHS_RA R.A. of VHS counterpart (J2000).VHS_Dec decl. of VHS counterpart (J2000).VHS_Rel MLE reliability value of VHS counterpart; highest of the J, H, and K reliability values.VHS_Dist Distance between VHS counterpart and X-ray source (arcsecond).VHS_Jmag VHS J magnitude (Vega).VHS_Jsig VHS J magnitude error (Vega).VHS_Hmag VHS H magnitude (Vega).VHS_Hsig VHS H magnitude error (Vega).VHS_Kmag VHS K magnitude (Vega).VHS_Ksig VHS K magnitude error (Vega).VHS_rej flag set to “yes” if VHS counterpart is found via MLE matching but source is rejected due to failing quality control checks.GALEX_RA R.A. of GALEX counterpart (J2000).GALEC_Dec decl. of GALEX counterpart (J2000).NUV_poserr Positional error on the NUV GALEX position (arcsecond).FUV_poserr Positional error on the FUV GALEX position (arcsecond).GALEX_Rel MLE reliability value of the GALEX counterpart; higher of the FUV and NUV reliability values.GALEX_Dist Distance between GALEX counterpart and X-ray source (arcsecond).NUV_Mag NUV magnitude (AB).NUV_MagErr Error on NUV magnitude.FUV_Mag FUV magnitude (AB).FUV_MagErr Error on FUV magnitude.FIRST_Name Name of FIRST counterpart.FIRST_RA R.A. of FIRST counterpart (J2000).FIRST_Dec decl. of FIRST counterpart (J2000).FIRST_Flux Integrated flux density at 1.4 GHz (mJy).FIRST_Err Error on the flux density, calculated by multiplying the integrated flux density by the ratio of the RMS to the peak flux (mJy).HERS_RA R.A. of Herschel counterpart from HeRS survey (J2000; Viero et al. 2014).HERS_Dec decl. of Herschel counterpart from HeRS survey (J2000; Viero et al. 2014).F250 Flux density at 250 μm (mJy).F250_Err 1σ flux density error at 250 μm (mJy).F350 Flux density at 350 μm (mJy).F350_Err 1σ flux density error at 350 μm (mJy).F500 Flux density at 500 μm (mJy).F500_err 1σ flux error at 500 μm (mJy).cp_coord_flag Set to 0 if multi-wavelength counterpart coordinates are consistent within 2″ (SDSS, UKIDSS, VHS, FIRST) or 3″ (WISE, GALEX, Herschel);
otherwise flag is set to 1.
18
The Astrophysical Journal, 817:172 (21pp), 2016 February 1 LaMassa et al.

to “yes” and the XMM-Newton record number if the “in_xmm”
or “in_xmm_ao13” flag is set to “yes”).
A.2. Coadded SDSS Catalog
We followed the same procedure detailed above whenmatching the previously released X-ray catalogs to the coaddedSDSS source list. Again, rsearch is 5″ and 7″ for Chandra andXMM-Newton, respectively (Brusa et al. 2010; Civano et al.
2012; LaMassa et al. 2013a). The Rcrit values when matching tothe Chandra source list are as follows: u—0.7, g—0.9, r—0.85, i—0.85, and z—0.8, with the fraction of random to truematches above this threshold being 14/572, 16/543, 19/601,18/601, and 13/816, respectively. For XMM-Newton, weimpose Rcrit values of 0.85, 0.9, 0.9, 0.9, 0.85 in the u, g, r, i,and z bands, respectively, with spurious fractions of 29/1290,39/1326, 60/1283, 54/1228, and 49/1420. We retain thecoadded match if there is not a counterpart found in the single-
Table 7Additional Columns in Chandra Catalog
Column Description
MSID Chandra Source Catalog unique identification number.Soft_Flux_Error_High Higher bound on 0.5–2 keV flux (erg s−1 cm−2). If soft flux is zero, this represents the upper limit.Soft_Flux_Error_Low Lower bound on 0.5–2 keV flux (erg s−1 cm−2).Hard_Flux_Error_High Higher bound on 2–7 keV flux (erg s−1 cm−2). If hard flux is zero, this represents the upper limit.Hard_Flux_Error_Low Lower bound on 2–7 keV flux (erg s−1 cm−2).Full_Flux_Error_High Higher bound on 0.5–7 keV flux (erg s−1 cm−2). If full flux is zero, this represents the upper limit.Full_Flux_Error_Low Lower bound on 0.5–7 keV flux (erg s−1 cm−2).In_XMM Flag set to “yes” if source is detected in the archival and AO10 XMM-Newton catalog. The rec_no of this associated XMM-Newton source
is also given.In_XMM_AO13 Flag set to “yes” if source is detected in the AO13 XMM-Newton catalog. The rec_no of this associated XMM-Newton source is also given.XMM_archive_cp_flag Flag to indicate that a multi-wavelength counterpart is promoted into this catalog: the multi-wavelength association did not meet the MLE
reliability threshold when matching to the Chandra catalog, but did meet this requirement for the same X-ray source in the XMM-Newton archival catalog. The number indicates from which catalog the promoted match is found: 1—SDSS counterpart found butphotometry rejected for failing quality control checks; 2—SDSS; 3—redshift; 4—WISE counterpart found but rejected for failing qualitycontrol checks; 5—WISE; 6—UKIDSS; 7—VHS; 8—GALEX.
XMM_ao13_cp_flag Similar to the “XMM_archive_cp_flag,” but for matches from the archival XMM-Newton AO13 catalog. See “XMM_archive_cp_flag” formore information.
Table 8Additional Columns in XMM-Newton Catalog
Column Description
Rec_No Unique identifying number for X-ray source.Ext_Flag Flag to indicate whether source was extended in one or more bands while being point-like in another band: 1—
extended in the soft band, 2—extended in the full band, 3—extended in the hard band, 4—extended in thesoft and full bands, 5— extended in the soft and hard bands, 6—extended in the hard and full bands. If 0,then the source is point-like in all bands.
In_XMM (in AO13 catalog) Flag set to “yes” if source is detected in the archival and AO10 XMM-Newton catalog. The rec_no of thisassociated XMM-Newton source is also given.
In_XMM_AO13 (in archival and AO10 catalog) Flag set to “yes” if source is detected in the XMM-Newton AO13 catalog. The rec_no of this associated XMM-Newton source is also given.
In_Chandra Flag set to “yes” if source is detected in the Chandra catalog. The MSID of this associated Chandra source isalso given.
Soft_Flux_Err Error on the 0.5–2 keV flux (erg s−1 cm−2).Soft_detml Significance of the detection in the 0.5–2 keV band, where det_ml=−lnPrandom. Users are cautioned to
determine the flux significance necessary for their science goals before utilizing the reported flux. Forreference, we only include objects where det ml_ 15 in the Log N–Log S relationship, and only report theluminosities for objects above this threshold.
Hard_Flux_Err Error on the 2–10 keV flux (erg s−1 cm−2).Hard_detml Significance of the detection in the 2–10 keV band. See “soft_detml” for more information.Full_Flux_Err Error on the 0.5–10 keV flux (erg s−1 cm−2).Full_detml Significance of the detection in the 0.5–10 keV band. See “soft_detml” for more information.XMM_ao13_cp_flag (in archival and AO10
catalog)Flag to indicate that a multi-wavelength counterpart is promoted into this catalog: the multi-wavelength
association did not meet the MLE reliability threshold when matching to the AO13 catalog, but did meet thisrequirement for the same X-ray source in the XMM-Newton archival catalog. The number indicates fromwhich catalog the promoted match is found: 1—SDSS counterpart found but photometry rejected for failingquality control checks;2—SDSS; 3—redshift; 4—WISE counterpart found but rejected for failing qualitycontrol checks; 5—WISE; 6—UKIDSS; 7—VHS; 8—GALEX.
XMM_archive_cp_flag (in AO13 catalog) Same as the “XMM_ao13_cp_flag,” but for promoted matches into the AO13 catalog from the archival andAO10 catalog.
Ch_cp_flag Similar to the “XMM_ao13_cp_flag,” but for matches from the archival Chandra catalog. See “XMM_arch-ive_cp_flag” for more information.
19
The Astrophysical Journal, 817:172 (21pp), 2016 February 1 LaMassa et al.

epoch imaging. By matching to the coadded catalog, we gainadditional optical counterparts to 139 of the Chandra sourcesand 250 of the XMM-Newton sources.
A.3. Optical Spectroscopy
Since publishing the previous release of the Stripe 82Xcatalog, we have mined these additional databases for spectro-scopic redshifts: PRIMUS (Coil et al. 2011), the Ross et al.(2012) pre-BOSS pilot survey with Hectospec, 6dF (Joneset al. 2004, 2009), and VVDS (Garilli et al. 2008). We alsohave an ongoing ground-based follow-up campaign to targetX-ray sources and have redshifts from WIYN HYDRA fromobserving runs in 2012 December, 2013 August–September,2014 January, June, July, September, and 2015 January; fromISAAC on VLT from 2013 August; from NIRSPEC on Keck2013 September; and from Palomar DoubleSpec from 2014July and December. We now have redshifts, and whereavailable, optical classifications for 335 of the Chandra sourcesand 760 of the XMM-Newton sources; 142 of these redshifts arefrom our follow-up observing program, where the WIYNHYDRA spectra were reduced with the IRAF routine dohydra,the ISAAC spectrum was reduced with the VLT providedesorex pipeline, the NIRSPEC data were reduced with theIRAF task wmkonspec, and the Palomar DoubleSpec spectrawere extracted using the conventional single-slit extractionroutines in IRAF. Stars and extragalactic objects were classifiedon the basis of their emission and/or absorption features.
A.4. AllWISE Catalog
We now match the archival Chandra, archival XMM-Newton, and AO10 XMM-Newton source lists to the AllWISErather than AllSky Catalog, superseding the matches publishedin LaMassa et al. (2013a). We impose a Rcrit cut of 0.7 for theChandra/AllWISE matching, finding five spurious associa-tions out of 700. In total, 667 WISE sources survived thequality control cuts, where all 33 rejected sources wereextended with either null or flagged extended photometry;two extended sources had acceptable elliptical aperturephotometry measurements in at least one band. For the archivaland AO10 XMM-Newton matching, our Rcrit value is 0.85, witha spurious fraction of 20/1516. We were left with 1465 WISEsources that passed the quality control checks, of which fourwere extended. Forty-eight extended sources were rejected, aswere three point sources. For reference, matching to the AllSkyWISE catalog garnered 595 and 1398 Chandra and XMM-Newton sources, respectively, so we increase the percentage ofX-ray sources with WISE counterparts from 52% to 58% and59% to 62%, respectively. We note that the archival X-ray datahave deeper pointings, causing the association rate to be lowerthan for the XMM-Newton AO13 source list which is at arelatively shallow depth.
A.5. VHS
Similar to the XMM-Newton AO13 catalog, we includecolumns for matching the archival Chandra, archival XMM-Newton, and AO10 XMM-Newton source lists to the VHScatalog. We find critical Rcrit values of 0.85 for J and 0.8 for Hand K when matching to the Chandra source list, with anestimated 5/530, 6/500, and 8/544 contamination rate in the J,H, and K bands, respectively. In total, 577 VHS counterpartsare found for the Chandra sources (50% of the sample), with
none rejected for being saturated. Between UKIDSS and VHS,there are NIR counterparts for 689 Chandra sources, or 60% ofthe source list. Of the 112 X-ray/UKIDSS objects without aVHS counterpart, 41 are undetected in the VHS survey; theremaining were below the Rcrit threshold.When matching the archival and AO10 XMM-Newton
catalog the VHS source list, we used a Rcrit threshold of 0.75in the J and H bands and 0.8 in the K band, with spuriousassociation rates of 30/1250, 27/1200, and 38/1280, respec-tively. We find 1504 VHS counterparts to the XMM-Newtonsources (64% of the sample), while 1670 X-ray objects (71%)have NIR matches in either UKIDSS or VHS. Of the 166X-ray/UKIDSS sources without a VHS match, 45 wereundetected in the VHS survey.
A.6. Herschel
Several of the archival Chandra and XMM-Newton observa-tions overlap the HerS survey area (Viero et al. 2014), so weuse a nearest neighbor match to find counterparts to these X-raysources. Again, the XMM-Newton search radius is 5″. InLaMassa et al. (2013a), we used a 5″ search radius to findcounterparts to Chandra sources, though here we lower thissearch radius to 3″ when matching to Herschel since ourexercise of matching the randomized X-ray source positions tothe Herschel catalog found false matches only at radii above 3″.For both the Chandra and XMM-Newton matches to Herschel,no associations were found between the randomized X-raypositions and the Herschel source list.
A.7. Catalog Cross-matches
The previously released versions of the Stripe 82X multi-wavelength matched catalogs did not include promotedmatches found from cross-correlating the individual catalogsas discussed above. In the current versions of the catalogs, thepromoted matches are included as well as flags to indicatewhich multi-wavelength counterparts are added into the catalogin this manner.Additionally, we also have included a “cp_coord_flag,” as
described in the main text. The coordinates among the multi-wavelength counterparts are consistent for 96% of the Chandrasources and for 92% of the XMM-Newton sources.
REFERENCES
Ahn, C. P., Alexandroff, R., Allende Prieto, C., et al. 2012, ApJS, 203, 21Ahn, C. P., Alexandroff, R., Allende Prieto, C., et al. 2014, ApJS, 211, 17Alam, S., Albareti, F. D., Allende Prieto, C., et al. 2015, arXiv:1501.00963Alexander, D. M., Brandt, W. N., Hornschemeier, A. E., et al. 2001, AJ,
122, 2156Annis, J., Soares-Santos, M., Strauss, M. A., et al. 2014, ApJ, 794, 120Assef, R. J., Stern, D., Kochanek, C. S., et al. 2013, ApJ, 772, 26Baldwin, J. A., Phillips, M. M., & Terlevich, R. 1981, PASP, 93, 5Becker, R. H., Helfand, D. J., White, R. L., Gregg, M. D., &
Laurent-Muehlheisen, S. A. 2012, yCat, 8090, 0Becker, R. H., White, R. L., & Helfand, D. J. 1995, ApJ, 450, 559Bertin, E., & Arnouts, S. 1996, A&AS, 117, 393Brandt, W. N., & Alexander, D. M. 2015, A&ARv, 23, 1Brandt, W. N., & Hasinger, G. 2005, ARA&A, 43, 827Brusa, M., Bongiorno, A., Cresci, G., et al. 2015, MNRAS, 446, 2394Brusa, M., Civano, F., Comastri, A., et al. 2010, ApJ, 716, 348Brusa, M., Zamorani, G., Comastri, A., et al. 2007, ApJS, 172, 353Cappelluti, N., Brusa, M., Hasinger, G., et al. 2009, A&A, 497, 635Cappelluti, N., Hasinger, G., Brusa, M., et al. 2007, ApJS, 172, 341Cardamone, C. N., Urry, C. M., Damen, M., et al. 2008, ApJ, 680, 130Casali, M., Adamson, A., Alves de Oliveira, C., et al. 2007, A&A, 467, 777Civano, F., Marchesi, S., Comastri, A., et al. 2015, ApJ, in press
20
The Astrophysical Journal, 817:172 (21pp), 2016 February 1 LaMassa et al.

Civano, F., Elvis, M., Brusa, M., et al. 2012, ApJS, 201, 30Coil, A. L., Blanton, M. R., Burles, S. M., et al. 2011, ApJ, 741, 8Croom, S. M., Richards, G. T., Shanks, T., et al. 2009, MNRAS, 392, 19Delvecchio, I., Gruppioni, C., Pozzi, F., et al. 2014, MNRAS, 439, 2736Donley, J. L., Koekemoer, A. M., Brusa, M., et al. 2012, ApJ, 748, 142Drinkwater, M. J., Jurek, R. J., Blake, C., et al. 2010, MNRAS, 401, 1429Efstathiou, A., & Rowan-Robinson, M. 1995, MNRAS, 273, 649Elvis, M., Civano, F., Vignali, C., et al. 2009, ApJS, 184, 158Evans, I. N., Primini, F. A., Glotfelty, K. J., et al. 2010, ApJS, 189, 37Farrah, D., Bernard-Salas, J., Spoon, H. W. W., et al. 2007, ApJ, 667, 149Fowler, J. W., Niemack, M. D., Dicker, S. R., et al. 2007, ApOpt, 46, 3444Frieman, J. A., Bassett, B., Becker, A., et al. 2008, AJ, 135, 338Fritz, J., Franceschini, A., & Hatziminaoglou, E. 2006, MNRAS, 366, 767Garilli, B., Le Fèvre, O., Guzzo, L., et al. 2008, A&A, 486, 683Georgakakis, A., Aird, J., Buchner, J., et al. 2015, arXiv:1507.07558Giacconi, R., Rosati, P., Tozzi, P., et al. 2001, ApJ, 551, 624Glikman, E., Urrutia, T., Lacy, M., et al. 2013, ApJ, 778, 127Green, P. J., Silverman, J. D., Cameron, R. A., et al. 2004, ApJS, 150, 43Haardt, F., & Maraschi, L. 1991, ApJL, 380, L51Hasinger, G., Cappelluti, N., Brunner, H., et al. 2007, ApJS, 172, 29Helfand, D. J., White, R. L., & Becker, R. H. 2015, ApJ, 801, 26Hewett, P. C., Warren, S. J., Leggett, S. K., & Hodgkin, S. T. 2006, MNRAS,
367, 454Hodge, J. A., Becker, R. H., White, R. L., Richards, G. T., & Zeimann, G. R.
2011, AJ, 142, 3Hooper, E. J., Impey, C. D., Foltz, C. B., & Hewett, P. C. 1995, ApJ, 445, 62Hopkins, P. F., & Hernquist, L. 2009, ApJ, 694, 599Hsu, L.-T., Salvato, M., Nandra, K., et al. 2014, ApJ, 796, 60Jiang, L., Fan, X., Bian, F., et al. 2014, ApJS, 213, 12Jiang, L., Fan, X., Cool, R. J., et al. 2006, AJ, 131, 2788Jones, D. H., Read, M. A., Saunders, W., et al. 2009, MNRAS, 399, 683Jones, D. H., Saunders, W., Colless, M., et al. 2004, MNRAS, 355, 747Kellermann, K. I., Sramek, R., Schmidt, M., Shaffer, D. B., & Green, R. 1989,
AJ, 98, 1195Kenter, A., Murray, S. S., Forman, W. R., et al. 2005, ApJS, 161, 9Kim, M., Kim, D.-W., Wilkes, B. J., et al. 2007, ApJS, 169, 401Koratkar, A., & Blaes, O. 1999, PASP, 111, 1Lacy, M., Storrie-Lombardi, L. J., Sajina, A., et al. 2004, ApJS, 154, 166Laird, E. S., Nandra, K., Georgakakis, A., et al. 2009, ApJS, 180, 102LaMassa, S. M., Cales, S., Moran, E. C., et al. 2015a, ApJ, 800, 144LaMassa, S. M., Civano, F., Brusa, M., et al. 2015b, arXiv:1511.02883LaMassa, S. M., Urry, C. M., Cappelluti, N., et al. 2013a, MNRAS, 436, 3581LaMassa, S. M., Urry, C. M., Glikman, E., et al. 2013b, MNRAS, 432, 1351Lawrence, A., Warren, S. J., Almaini, O., et al. 2007, MNRAS, 379, 1599Le Fèvre, O., Cassata, P., Cucciati, O., et al. 2013, A&A, 559, A14Le Fèvre, O., Saisse, M., Mancini, D., et al. 2003, Proc. SPIE, 4841, 1670Le Fèvre, O., Vettolani, G., Garilli, B., et al. 2005, A&A, 439, 845Lehmer, B. D., Brandt, W. N., Alexander, D. M., et al. 2005, ApJS, 161, 21Lehmer, B. D., Xue, Y. Q., Brandt, W. N., et al. 2012, ApJ, 752, 46Loaring, N. S., Dwelly, T., Page, M. J., et al. 2005, MNRAS, 362, 1371
Luo, B., Brandt, W. N., Xue, Y. Q., et al. 2010, ApJS, 187, 560Lutz, D., Maiolino, R., Spoon, H. W. W., & Moorwood, A. F. M. 2004, A&A,
418, 465Magdis, G. E., Rigopoulou, D., Helou, G., et al. 2013, A&A, 558, A136Mainzer, A., Bauer, J., Grav, T., et al. 2011, ApJ, 731, 53Maiolino, R., Comastri, A., Gilli, R., et al. 2003, MNRAS, 344, L59Marchesi, S., Civano, F., Elvis, M., et al. 2015, arXiv:1512.01105Mateos, S., Warwick, R. S., Carrera, F. J., et al. 2008, A&A, 492, 51McMahon, R. G., Banerji, M., Gonzalez, E., et al. 2013, Msngr, 154, 35Meléndez, M., Heckman, T. M., Martínez-Paredes, M., Kraemer, S. B., &
Mendoza, C. 2014, MNRAS, 443, 1358Merloni, A., Dwelly, T., Salvato, M., et al. 2015, MNRAS, 452, 69Merloni, A., Predehl, P., Becker, W., et al. 2012, arXiv:1209.3114Morrissey, P., Conrow, T., Barlow, T. A., et al. 2007, ApJS, 173, 682Mullaney, J. R., Alexander, D. M., Goulding, A. D., & Hickox, R. C. 2011,
MNRAS, 414, 1082Murray, S. S., Kenter, A., Forman, W. R., et al. 2005, ApJS, 161, 1Netzer, H., Lutz, D., Schweitzer, M., et al. 2007, ApJ, 666, 806Newman, J. A., Cooper, M. C., Davis, M., et al. 2013, ApJS, 208, 5Pier, E. A., & Krolik, J. H. 1992, ApJ, 401, 99Predehl, P., Andritschke, R., Becker, W., et al. 2014, Proc. SPIE, 9144, 91441TRanalli, P., Comastri, A., Vignali, C., et al. 2013, A&A, 555, A42Ranalli, P., Georgantopoulos, I., Corral, A., et al. 2015, A&A, 577, A121Rosario, D. J., Santini, P., Lutz, D., et al. 2012, A&A, 545, A45Rosen, S. R., Webb, N. A., Watson, M. G., et al. 2015, arXiv:1504.07051Ross, N. P., Myers, A. D., Sheldon, E. S., et al. 2012, ApJS, 199, 3Rots, A. H., & Budavári, T. 2011, ApJS, 192, 8Schartmann, M., Meisenheimer, K., Camenzind, M., et al. 2008, A&A, 482, 67Schmidt, M., Hasinger, G., Gunn, J., et al. 1998, A&A, 329, 495Schweitzer, M., Lutz, D., Sturm, E., et al. 2006, ApJ, 649, 79Shao, L., Lutz, D., Nordon, R., et al. 2010, A&A, 518, L26Spinoglio, L., & Malkan, M. A. 1989, ApJ, 342, 83Stern, D., Assef, R. J., Benford, D. J., et al. 2012, ApJ, 753, 30Stern, D., Eisenhardt, P., Gorjian, V., et al. 2005, ApJ, 631, 163Sutherland, W., & Saunders, W. 1992, MNRAS, 259, 413Swetz, D. S., Ade, P. A. R., Amiri, M., et al. 2011, ApJS, 194, 41Treister, E., Schawinski, K., Urry, C. M., & Simmons, B. D. 2012, ApJL,
758, L39Vanden Berk, D. E., Richards, G. T., Bauer, A., et al. 2001, AJ, 122, 549Veilleux, S., & Osterbrock, D. E. 1987, ApJS, 63, 295Viero, M. P., Asboth, V., Roseboom, I. G., et al. 2014, ApJS, 210, 22Warren, S. J., Hambly, N. C., Dye, S., et al. 2007, MNRAS, 375, 213Watson, M. G., Schröder, A. C., Fyfe, D., et al. 2009, A&A, 493, 339Weaver, K. A., Meléndez, M., Mushotzky, R. F., et al. 2010, ApJ, 716, 1151White, R. L., Becker, R. H., Helfand, D. J., & Gregg, M. D. 1997, ApJ,
475, 479Wright, E. L., Eisenhardt, P. R. M., Mainzer, A. K., et al. 2010, AJ, 140,
1868Xue, Y. Q., Luo, B., Brandt, W. N., et al. 2011, ApJS, 195, 10York, D. G., Adelman, J., Anderson, J. E., Jr., et al. 2000, AJ, 120, 1579
21
The Astrophysical Journal, 817:172 (21pp), 2016 February 1 LaMassa et al.