the 5 hour pulse period and broadband spectrum of the
TRANSCRIPT

The 5 hour pulse period and broadband spectrum of the Symbiotic X-ray Binary 3A 1954+319
Diana M. Marcu 1,2, Felix Furst3 , Katja Pottschmidt l ,2, Victoria Grinberg3, Sebstian Muller3, Jom Wilms3, Konstantin A. Postnov4, Robin H. D. Corbet5,2, Craig B, Markwardt5, and Marion
Cadolle Bel6
ABSTRACT
We present an analysis of the highly variable accreting X-ray pulsar 3A 1954+319 using 2005-2009 monitoring data obtained with INTEGRAL and Swift. This considerably extends the pulse period history and covers flaring episodes in 2005 and 2008. In 2006 the source was identified as one of only a few known symbiotic X-ray binaries, Le" systems composed of a neutron star accreting from the inhomogeneous medium around an M-giant star. The extremely long pulse period of ~5.3 h is directly visible in the 2008 INTEGRAL-ISGRI outburst light curve. The pulse profile is double peaked and not significantly energy dependent. During the outburst a strong spin-up of -1.8 x 10⁻⁴ h h- I occurred. Between 2005 and 2008 a long term spin-down trend of 2.1 x 10⁻⁵ h h -I was observed for the first time for this source. The 3-80 ke V pulse peak spectrum of 3A 1954+319 during the 2008 flare could be well described by a thermal Comptonization model. We interpret the results within the framework of a recently developed quasi-spherical accrection model for symbiotic X-ray binaries.
Subject headings: binaries: symbiotic - stars: individual (3A 1954+319) - stars: neutron - X-rays: binaries
1 NASA Goddard Space Flight Center, Astrophysics Science Division, Code 661, Greenbelt, MD 20771, USA
2CRESST & University of Maryland Baltimore County, 1000 Hilltop Circle, Baltimore, MD 21250, USA
3 Dr, Karl Remeis-Observatory & ECAP, University of Erlangen-Nuremberg, Sternwartstr, 7, 96049 Bamberg, Germany
4Sternberg Astronomical Institute, 119992, Moscow, Russia
5NASA Goddard Space Flight Center, Astrophysics Science Division, Code 662, Greenbelt, MD 20771, USA
6European Space Agency, European Space Astronomy Centre P.O, Box 78, 28691, Villanueva de la Canada, 28692, Madrid, Spain

-2-
1. Introduction
The X-ray source 3A 1954+319 was detected in the Cygnus region in surveys by Uhuru, Ariel V, EXOSAT, and ROSAT (Forman et a1. 1978; Warwick et a1. 1981, 1988; Voges et a1. 1999). Pointed observations with EXOSAT (Cook et a1. 1985) and Ginga (Tweedy et a1. 1989) showed a hard X-ray spectrum as well as intensity variations by an order of magnitude on timescales of minutes. This led to the suggestion that the system might be a High Mass X-ray Binary (HMXB). Only when Masetti et a1. (2006) identified the companion as an M4-M5 III star at a distance of :S 1.7 kpc and Corbet et a1. (2006) discovered a ~5 h pulse period in early Swift-BAT data, did it become clear that 3A 1954+319 is a Symbiotic X-ray Binary (SyXB). SyXBs constitute a small group! of persistent Low Mass X-ray Binaries (LMXBs) in which a neutron star is orbiting in the inhomogeneous medium around an M-type giant star2.
SyXBs typically have wide orbits, e.g., the prototype OX 1 +4 has an orbital period of ~ 1161 d (Hinkle et a1. 2006). Their X-ray emission is therefore due to wind accretion, a process not well investigated for late type donors. Two broadband spectral studies support the SyXB interpretation for 3A 1954+319: Mattana et a1. (2006) modeled the non-simultaneous BeppoSAX and INTEGRAL spectrum with a highly absorbed (NH ~ 1023 cm-2) cutoff power law with a photon index of 1.1 and a folding energy of 15 ke V and a weak Fe Ka line. These authors also confirmed the detection of the ~5 h period in BAT and ISORI data. In a study of archival data spanning absorbed 2-10 ke V luminosities from 3.4 x 1034 erg s-! to 1.8 X 1035 erg S-I Masetti et a1. (2007) confirmed
the empirical spectral description for the> 2 ke V spectrum and determined a best fit using thermal Comptonization, modified by complex absorption (ionized plus partially covering neutral absorption). In addition they modeled a <2keV soft excess with a ~50eV hot plasma and interpreted it, together with the two-zone absorption, as being due to a diffuse, partly ionized cloud of material around the neutron star.
The ~5 h period is the only period known for this system. As Corbet et a1. (2006, 2008) argued (i) the period value itself is inconsistent with being the orbital period of an M-giant, (ii) the large period decline of (2.6 ± 0.2) x 10-5 h h- 1 observed over the first year of BAT data cannot be due to
orbital Doppler modulation, and (iii) the period change is also too large to be supported by a white dwarf accretor. Interpreting the ~5 h period as a neutron star spin period makes 3A 1954+319 the
lIn addition to 3A 1954+319 a recent list ofSyXB given by Nespoli et al. (2010) consists of: OX 1 +4, 4U 1700+24, Scutum X-I, IORJ16194-281O, lRXSJI80431.1-273932, lOR Jl6358-4726, and IORJI6393-4643. Note that the X-ray mass function of lOR J16393-4643 argues against a LMXB classification, though (Pearlman et al. 2011).
2The classification is related to but not identical to that of "Symbiotic Binaries", systems consisting of a white dwarf and a red giant. The latter were named after their optical spectra which show contributions from both binary components, different from SyXBs where the neutron star is not visible at optical wavelengths.
-3-
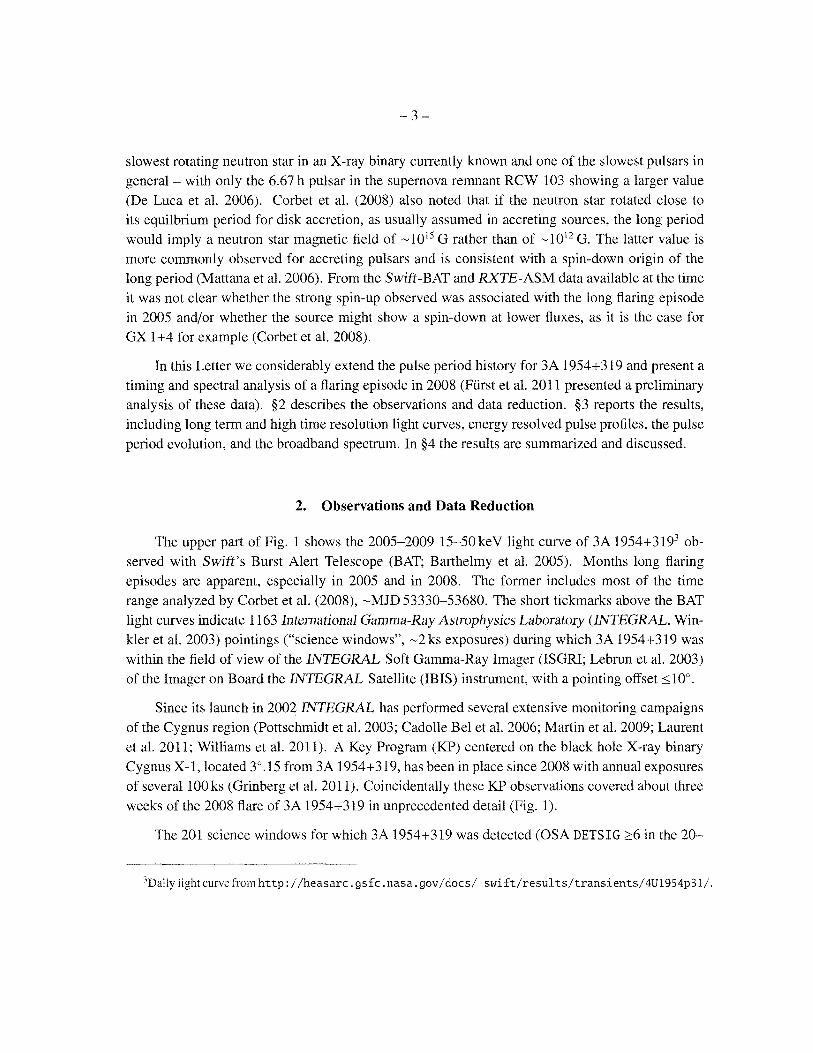
slowest rotating neutron star in an X-ray binary currently known and one of the slowest pulsars in general- with only the 6.67 h pulsar in the supernova remnant RCW 103 showing a larger value (De Luca et al. 2006). Corbet et al. (2008) also noted that if the neutron star rotated close to its equilbrium period for disk accretion, as usually assumed in accreting sources, the long period would imply a neutron star magnetic field of ~ 1 015 G rather than of ~ 1 012 G. The latter value is more commonly observed for accreting pulsars and is consistent with a spin-down origin of the long period (Mattana et al. 2006). From the Swift-BAT and RXTE-ASM data available at the time it was not clear whether the strong spin-up observed was associated with the long flaring episode in 2005 and/or whether the source might show a spin-down at lower fluxes, as it is the case for GX 1 +4 for example (Corbet et al. 2008).
In this Letter we considerably extend the pulse period history for 3A 1954+319 and present a timing and spectral analysis of a flaring episode in 2008 (Flirst et al. 2011 presented a preliminary analysis of these data). §2 describes the observations and data reduction. §3 reports the results, including long term and high time resolution light curves, energy resolved pulse profiles, the pulse period evolution, and the broadband spectrum. In §4 the results are summarized and discussed.
2. Observations and Data Reduction
The upper part of Fig. 1 shows the 2005-2009 15-50keV light curve of 3A 1954+3193 observed with Swift's Burst Alert Telescope (BAT; Barthelmy et al. 2005). Months long flaring episodes are apparent, especially in 2005 and in 2008. The former includes most of the time range analyzed by Corbet et al. (2008), ~MJD 53330-53680. The short tickmarks above the BAT light curves indicate 1163 International Gamma-Ray Astrophysics Laboratory (INTEGRAL, Winkler et al. 2003) pointings ("science windows", ~2ks exposures) during which 3A 1954+319 was within the field of view of the INTEGRAL Soft Gamma-Ray Imager (ISGRI; Lebrun et al. 2003) of the Imager on Board the INTEGRAL Satellite (IBIS) instrument, with a pointing offset::; 10° .
Since its launch in 2002 INTEGRAL has performed several extensive monitoring campaigns of the Cygnus region (Pottschmidt et al. 2003; Cadolle Bel et al. 2006; Martin et al. 2009; Laurent et al. 2011; Williams et al. 2011). A Key Program (KP) centered on the black hole X-ray binary Cygnus X-I, located 3°.15 from 3A 1954+319, has been in place since 2008 with annual exposures of several 100 ks (Grinberg et al. 2011). Coincidentally these KP observations covered about three weeks of the 2008 flare of 3A 1954+319 in unprecedented detail (Fig. 1).
The 201 science windows for which 3A 1954+319 was detected (OSA DETSIG:::::6 in the 20-
3Daily light curve from http://heasarc . gsfc .nasa. gov/docs/ swift/results/transients/4U1954p31/.

6 5 .4 "'0 o ..... @ 5.3
0..
5.2
5.1
-4-
+ <+j
53500 54000 54500 Time [MJD]
" C,) I 4 ..... S
('j u ... ... 2~
I :n rJ]
< .;.> u
O~ '" I 0 ~
\ • +
55000
Fig. 1.- From top to bottom: INTEGRAL observations of 3A 1954+319 with an offset angle :::;10° and INTEGRAL-ISGRI detections (blue and brown tickmarks, respectively). The long term light curve shown was obtained by Swift-BAT in the 15-50keV range and has been rebinned to a resolution of 5 d. The lower part of the figure shows the pulse period evolution as determined by BAT (black) and ISGRI (red). See the electronic edition of the Journal for color versions of this and all other figures.

-5-
100 ke V science window images) are indicated by long tickmarks in Fig. 1. For these pointings the iLlight tool in version 7 of the Offline Scientific Analysis (OSA 7)4 was applied to produce ISGRI light curves of 3A 1954+319 with a time resolution of 100 s in the energy bands 20-40 ke V, 40-100 ke V, and 20-100 ke V. Together with the BAT long term light curve the 20-100 ke V ISGRI
light curves were used to determine the pulse period evolution (§ 3.3).
In addition, a more detailed analysis was performed for the flare in 2008. This dataset included
science windows from satellite revolutions 739, 741-746, 756, and 758 (one revolution takes about three days). Pulse profiles in the three energy bands were created (§3.2). In order to maximize the
signal to noise ratio (SIN), all science windows in the phase range of 0.45-0.85, i.e., associated with the main pulse peak, were selected. OSA 9 was used to extract average ISGRI and Joint European X-ray Monitor (JEM-X; Lund et al. 2003) spectra, for source offset angles ::;10° and ::;3°,
respectively. The ISGRI spectrum had an exposure of 85 ks, was created by averaging spectra from individual science windows, and was modeled in the 20-80 keY range. The JEM-X spectrum had an exposure of 9.8 ks, was extracted from mosaic images using mosaicspec and was modeled in the 3-30keV range (§3.4). Response and auxilliary response files were selected or created
following the respective analysis documentation5 .
3. Results
3.1. Light Curves
The long term BAT light curve shown in Fig. 1 demonstrates the irregular flaring of 3A 1954+ 319 on timescales of months, with the 2008 November flare having been one of the brightest since the
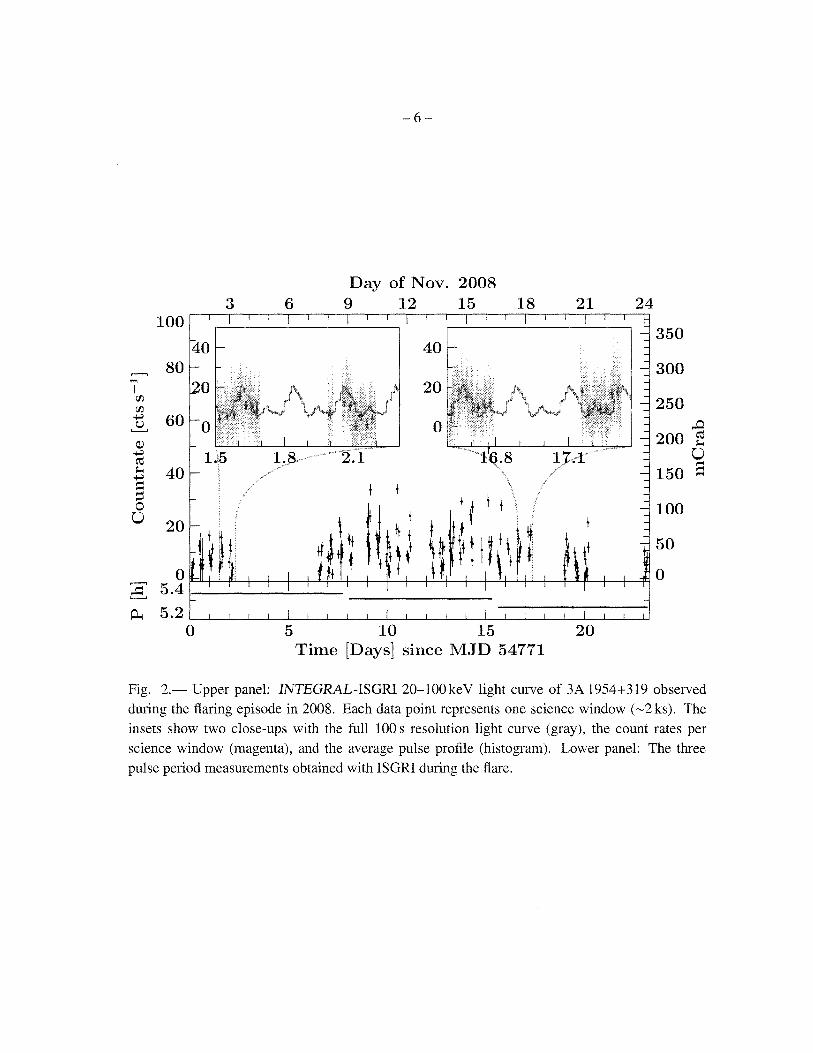
start of the BAT monitoring. The INTEGRAL observations cover the second half of the flaring episode. The resulting 20-100 ke V ISGRI light curve is shown in the upper panel of Fig. 2. The 20-100keV flux during the outburst varied by a factor of ~20 with an average of ~40mCrab and
a peak value of ~ 130 mCrab.
The insets of Fig. 2 show close-ups of two randomly selected parts of the ISGRI outburst light curve with a resolution of 100 s. They allow us to see the pulsation of this source directly
in the light curve for the first time. Also shown are repetitions of the P-corrected average pulse profile obtained by folding the high resolution light curve on the pulse ephemeris determined from the outburst data (§3.3). Comparing the profiles with the high time resolution light curve and
4The iLlight tool was not present in OSA 8 and at the time of writing was still undergoing evaluation for OSA 9.
5 See http://www.isdc.unige.ch/integral/ anal ysis#Documentation
-6-
Day of Nov. 2008 3 6 9 12 15 18 21 24
100 350
40 ~
80 300 .... 20 I
r/J r/J 250 ~ 60 ~ 0 Q.l ~
ro $-0 40 ~
..0 200 e
U 150 S
=: ::I 0
U 20 100
50
0 0 ~ 5.4
0.. 5.2 0 5 10 15 20
Time [Days] since MJD 54771
Fig. 2.- Upper panel: INTEGRAL-ISGRI 20-100keV light curve of 3A 1954+319 observed during the flaring episode in 2008. Each data point represents one science window (~2 ks). The insets show two close-ups with the full 100 s resolution light curve (gray), the count rates per science window (magenta), and the average pulse profile (histogram). Lower panel: The three pulse period measurements obtained with ISGRI during the flare.

-7-
the average science window count rates demonstrates general consistency but allows for moderate pulse-to-pulse variations which are common in accreting X-ray pulsars (Klochkov et al. 2011).
3.2. Pulse Profiles
Pulse profiles in the energy ranges of 20-40 ke V and 40-100 ke V were obtained by folding the energy resolved high time resolution ISGRI outburst light curves on the pulse ephemeris determined from the 2008 outburst data (§3.3), see upper panel of Fig. 3. These are the highest quality pulse profiles available for the source to date. They clearly show a double peaked structure, in contrast to the single peaked pulse profile displayed by the prototype Sy XB GX 1 +4 (Ferrigno et al. 2007). While the possible presence of the secondary peak for 3A 1954+319 was indicated in the <50 ke V BAT profiles presented by Corbet et al. (2008), it could not be detected in the 50-100 ke V band, possibly due to the comparatively smaller SIN. The lower panel of Fig. 3 shows the hardness ratio between the profiles in the two energy bands. No significant energy dependence was detected.
3.3. Pulse Period Evolution
Using the epoch folding technique (Schwarzenberg-Czemy 1989) pulse period values were determined for three equally long parts of the 2008 outburst observations with ISGRI. The results are shown in the lower panel of Fig. 2. Uncertainties were calculated according to the Monte Carlo method described by Davies (1990): for every segment 104 light curves with the same sampling and variance as seen in the observational data were simulated, based on the segment's average pulse profile modified by Gaussian noise. A period search was performed for every simulated light curve and the widths of the emerging distributions were used as uncertainties of the pulse period measurements. The three ISGRI pulse period values for the flare evolved from 5.336 ± 0.003 h over 5.308 ± 0.003 h to 5.264 ± 0.006 h, i.e., a strong spin-up became apparent. With the caveat of not knowing the orbital effect the pulse ephemeris over the 2008 flare was determinded to To = MJD54782.6897, P(To) = 5.3060 ± 0.0007h, and F(To) = (-1.81 ± 0.17) x 1O-4 hh- 1
•
In order to put the ISGRI period values into perspective, the pulse period history from the long term BAT light curve was updated by performing local period determinations for 20 d long segments. The lower part of Fig. 1 contains all successful BAT period measurements, the three ISGRI flare measurements, as well as three additional ISGRI measurements that could typically be obtained during times of denser sampling and/or elevated count rates. The long term results are the following: (i) the spin-up phase during the flaring activity in 2005, analyzed by Corbet et al. (2008) and Mattana et al. (2006), was reproduced, (ii) it was followed by a long spin-down trend

,----, 20 .-I
I 00 00 ..... 15 ~ <l) ..... C'ii ~
10 ..... = :l 0
0 = 5 C'ii <l)
~ 0
0.4 ~ ::t: 0.2
-8-
O~~~~ __ ~~~~ __ ~~~~ __ ~~~~ __ ~~~~~ o 0.5 1
Phase ¢ 1.5 2
Fig. 3.- Upper Panel: ISGRI pulse profiles for the flaring episode in 2008, in the energy ranges of 20-40 ke V (black) and 40-100 ke V (red, multiplied by 3 for better visibility). Lower Panel: Hardness Ratio.

-9-
between 2005 and 2008, characterized by P ~ 2.1 X 10⁻⁵ h h- 1, (iii) the BAT and ISGRI pulse period values are in excellent agreement, especially during the strong spin-up in 2008, (iv) the spin-down trend resumed in 2009, possibly slowed down by continued moderate flaring. Note that while the possibility of a beginning spin-down at the end of 2005 was mentiond by Corbet et al. (2008), a spin-down has now been clearly observed for the first time for this source. Also note that the spin-up in 2008 was an order of magnitude larger than the one in 2005.
3.4. Broadband Spectrum
As described above the 3-80keV spectrum of 3A 1954+319 was determined for the phase range associated with the peak of the main pulse. This approach was chosen because the source is close to the detection limit during dimmer pulse phases. The spectrum could be well described by an absorbed thermal Comptonizaton model (Fig. 4), resulting in X;ed = 1.3 for 32 degrees of freedom. The best fit parameters obtained were NH = 3.9~~:; x 1022 cm-2
, kTo = 0.9~~:~ keV, T = 4.2 ± 0.7, and kTe = 7.5~g:~keV. A flux cross calibration factor of 0.84~g:ii was applied to model the JEM-X data. The residuals mainly reflect known ISGRI calibration uncertainties (Grinberg et al. 2011), all uncertainties from spectral fits are at the 90% level for one interesting parameter. A broken power law fit provided a slightly better description but the improvement is due to masking cross-calibration issues 0:2 ~ 1.2). A cutoff power law model as applied by Mattana et al. (2006) resulted in a worse fit 0:2 ~ 1.9).
The absorbed 2-10keV and 10-100keV fluxes were 6.1 and 12.1 x 1O-1O ergcm-2 s-1, respectively (ISGRI normalization). The unabsorbed fluxes were 7.6 and 12.2 x 10⁻¹⁰ erg cm-2 S-1,
corresponding to (pulse peak) luminosities of 2.2 and 3.5 x 1035 erg S-1 for a distance of 1.7 kpc. These values are comparable to the highest luminosities reported by Masetti et al. (2007).
4. Discussion
A possible scenario for the development of pulse periods longer than a few hundred seconds has been proposed for persistently bright HMXBs by Ikhsanov (2007), where accretion proceeds spherically and a strong spin-down happened in a previous accretion epoch (subsonic propeller regime). The author argues that the 2.7 h pulse period of the HMXB 2S 0114+650 (Farrell et al. 2008) can thus be explained without the need for an unusually high (1015 G) magnetic field.
For the LMXB 3A 1954+319 the long pulse period is more easily reconcilable with the system's life time (Mattana et al. 2006). Shakura et al. (2011) recently developed an accretion model for SyXBs that can not only account for long spin periods but also provides a mechanism allowing

.-I
I
:> 1 ~ .-I
I en en ..... U
'"Ci 0.1 (l) N ..... -C'd S ~ Z 0.01
2
~ 0 -2
-10-
3 5 10 20 30 80 Energy [ke V]
Fig. 4.- Upper panel: JEM-X (3-30keV, brown) and ISGRI (20-80keV, blue) counts spectra for the flaring episode in 2008. In order to obtain a better SjN only data from the main pulse, i.e., phases 0.45-0.85, were included. The best fit description consisted of an absorbed thermal Comptonization model and is also displayed. Lower panel: Best fit residuals.

-11-
for quasi-spherical accretion. In this model a subsonic settling regime occurs for X-ray luminosities below ~ 3 x 1036 erg S-l , i.e., for luminosities consistent with those observed for 3A 1954+319. A shell of hot material forms around the magnetosphere which mediates the transfer of angular momentum to/from the neutron star by advection and viscous stress. The accretion rate is determined by the ability of the plasma to enter the magnetosphere. The equilibrium pulse period in this case is:
(1)
where P orbit is the binary period and Vwind is the stellar wind velocity with respect to the neutron star. Reporting on population synthesis simulations for SyXBs based on this model, Postnov et al. (2011) showed that the 5.3 h pulse period of 3A 1954+319 can be well reproduced.
3A 1954+ 319 seems to show long spin-down episodes between major flares (p ~ 2.1 X
10-5 hh- 1) which are reminiscent of the spin-down displayed by GX 1+4 since the early 1980s
(p ~ 1O-7 hh-1, Gonzalez-Galan et al. 2011). Several models beyond equilibrium disk accretion
have been proposed to explain the spin-down of GX 1 +4 without invoking unusually high magnetic fields, for example the presence of a counterrotating disk (Nelson et al. 1997) or accretion of fallback material expelled during the propeller phase (Perna et al. 2006). Only the quasi-spherical accretion model, however, reproduces the correct sign and magnitude of the negative correlation between spin frequency change v and X-ray flux Fx observed during spin-down in this source (-v lX F~7, Gonzalez-Galan et al. 2011). For 3A 1954+319 such a detailed study of the v-Fx
relationship is difficult, especially during spin-down since the low flux allowed for only a few v measurements (Fig. 1). It is beyond the scope of this Letter.
On longer time scales we observe torque reversals and a positive v-F x-correlation exists comparing low (spin-down) and high flux (spin-up) episodes (Fig. 1). This is consistent with the behavior predicted by the quasi-spherical accretion model for higher accretion rates within the settling regime (see Fig. 1 of Shakura et al. 2011).
The strong spin-up in 2008 translates to PiP = -0.9 X 10⁻⁸ S-l. While still high, the absolute value is of the same order of magnitude as the spin-down related p/ P of 3.1 x 10⁻⁸ S-l observed for the SyXB IGR J16358-4724 (Patel et al. 2007). The X-ray luminosity required to sustain such a spin-up in 3A 1954+319 in the equilibrium disk accretion case would be ~5 x 1036 erg S-l (Joss & Rappaport 1984), whereas we measured a pulse peak value of ~5.7 x 1035 erg S-l, again arguing against disk accretion.
The best fit to the broadband spectrum of the 2008 flare describes an optically thick Compton plasma (T = 4.2 ± 0.7, kTe = 7.5~g:1 keY) with parameters qualitatively consistent with the results of Masetti et al. (2007). As these authors state the parameters are similar to those commonly seen in LMXBs with an accreting neutron star companion. Most of those sources do not show

-12-
pulsations, however, and their accretion geometry is most likely different from that of pulsars. Other SyXBs show similar spectra, especially GX 1+4 (r = 6.80 ± 0.15, kTe = 13.1 ± 0.2keV, Ferrigno et al. 2007). Furthermore, optically thick Comptonization has also been used to describe the emission from the accretion columns of accreting pulsars in HMXBs, e.g., for the cyclotron line soure 1A 1118-61 (Suchy et al. 2011). We tentatively propose a similar origin close to the neutron star surface for the broadband X-ray emission of 3A 1954+319.
DMM and KP acknowledge NASA grants NNX08AE84G, NNX08AY24G, and NNX09AT28G.
FF acknowledges support from the DAAD and thanks the NASA-GSFC for its hospitality. The work by KAP is partially supported through RFBR grant 10-02-00599. This research has been partly funded by the European Commission under contract ITN215212 "Black Hole Universe"
and by the Bundesministerium fur Wirtschaft and Technologie under DLR grants 500R0808 and
500R1007. It is based on observations with INTEGRAL, an ESA project with instruments and
science data centre funded by ESA member states (especially the PI countries: Denmark, France, Germany, Italy, Switzerland, Spain), Czech Republic and Poland, and with the participation of
Russia and the USA We thank the INTEGRAL mission planners for careful scheduling of the Cygnus region Key Program. We also thank Hans Krimm and the Swift-BAT team for making the
Swift-BAT light curves available.
Facilities: INTEGRAL, Swift.
REFERENCES
Barthelmy, S. D., Barbier, L. M., Cummings, J. R., et al. 2005, Space Sci. Rev., 120, 143
Cadolle Bel, M., Sizun, P., Goldwurm, A, et al. 2006, A&A, 446, 591
Cook, M. c., Warwick, R. S., & Watson, M. G. 1985, in X-ray Astronomy '84, ed. M. Oda & R. Giacconi, (Komaba: Inst. Space Astronaut. Sci.), 225
Corbet, R., Barbier, L., Barthelmy, S., et al. 2006, ATel, 797
Corbet, R. H. D., Sokoloski, J. L., Mukai, K., Markwardt, C. B., & Tueller, J. 2008, ApJ, 675, 1424
Davies, S. R. 1990, MNRAS, 244, 93
De Luca, A, Caraveo, P. A, Mereghetti, S., Tiengo, A., & Bignami, G. F. 2006, Science, 313, 814
Farrell, S. A, Sood, R. K., O'Neill, P. M., & Dieters, S. 2008, MNRAS, 389, 608

- 13-
Ferrigno, c., Segreto, A., Santangelo, A., et al. 2007, A&A, 462, 995
Forman, W., Jones, C., Cominsky, L., et al. 1978, ApJS, 38, 357
Furst, F., Marcu, D. M., Pottschmidt, K, et al. 2011, in 8th INTEGRAL Workshop "The Restless Gamma-ray Universe", POS (INTEGRAL2010), 17
Gonzalez-Gah'in, A., Kuulkers, E., Kretschmar, P., et al. 2011, in 8th INTEGRAL Workshop "The Restless Gamma-ray Universe", POS (INTEGRAL2010), 16
Grinberg, v., Marcu, D. M., Pottschmidt, K, et al. 2011, in 8th INTEGRAL Workshop "The Restless Gamma-ray Universe", POS (INTEGRAL201O, 133
Hinkle, K H., Feke!, F. c., Joyce, R. R., et al. 2006, ApJ, 641,479
Ikhsanov, N. R., 2007, MNRAS, 375, 698
Joss, P. c., & Rappaport, S. A. 1984, ARA&A, 22, 537
Klochkov, D., Santangelo, A., Staubert, R., & Rothschild, R. E. 2011, in 8th INTEGRAL Workshop "The Restless Gamma-ray Universe", POS (INTEGRAL2010), 61
Laurent, P., Rodriguez, J., Wilms, J., et al. 2011, Science, 332, 438
Lebrun, F., Leray, J. P., Lavocat, P., et al. 2003, A&A, 411, L141
Lund, N., BUdtz-Jorgensen, c., Westergaard, N. J., et al. 2003, A&A, 411, L231
Martin, P., Knodlseder, J., Diehl, R., & Meynet, G. 2009, A&A, 506, 703
Masetti, N., Orlandini, M., Palazzi, E., Amati, L., & Frontera, F. 2006, A&A, 453, 295
Masetti, N., Rigon, E., Maiorano, E., et al. 2007, A&A, 464,277
Mattana, F., Gotz, D., Falanga, M., et al. 2006, A&A, 460, L1
Nelson, R. W., Bildsten, L., Chakrabarty, D., et al. 1997, ApJ, 488, LI17
Nespoli, E., Fabregat, J., & Mennickent, R. E. 2010, A&A, 516, 94
Patel, S. K, Zurita, J., Del Santo, M., et al. 2007, ApJ, 657, 994
Pearlman, A. B., Corbet, R. H. D., Pottschmidt, K, & Skinner, G. K 2011, ApJ, in prep.
Perna, R., Bozzo, E., & Stella, L. 2006, ApJ, 639, 363

-14-
Postnov, K, Shakura, N., Gonza1ez-Gahin, A, et al. 2011, in 8th INTEGRAL Workshop "The Restless Gamma-ray Universe", POS (INTEGRAL201O), 15
Pottschmidt, K, Wilms, J., Chernyakova, M., et al. 2003, A&A, 411, L383
Schwarzenberg-Czerny, A., 1989, MNRAS, 241, 153
Shakura, N., Postnov, K, Kochetkova, A., & Hja1marsdotter, L. 2011, MNRAS, submitted
Suchy, S., Pottschmidt, K, Rothschild, R. E., et al. 2011, ApJ, 733, 15
Tweedy, R. W., Warwick, R. S., & Remillard, R. 1989, in Two Topics in X-Ray Astronomy, ed.
J. Hunt & B. Battrick, ESA SP-296, (Noordwijk: ESA Publications Department), 661
Voges, W., Aschenbach, B., Boller, T., et al. 1999, A&A, 349, 389
Warwick, R. S., Marshall, N., Fraser, G. W., et al. 1981, MNRAS, 197,865
Warwick, R. S., Norton, A J., Turner, M. J. L., Watson, M. G., & Willingale, R. 1988, MNRAS, 232,551
Williams, P. KG., Tomsick, J. A, Bodaghee, A., et al. 2011, ApJ, 733, L20
Winkler, c., Courvoisier, T. J.-L., Di Cocco, G., et al. 2003, A&A, 411, L1
This preprint was prepared with the AAS LXf}3X macros vS.2.