the 53rd annual report
TRANSCRIPT
The 53rd Annual Report
(Jan 1, 2014 – Dec 31, 2014)
Ssangyong Motor Company
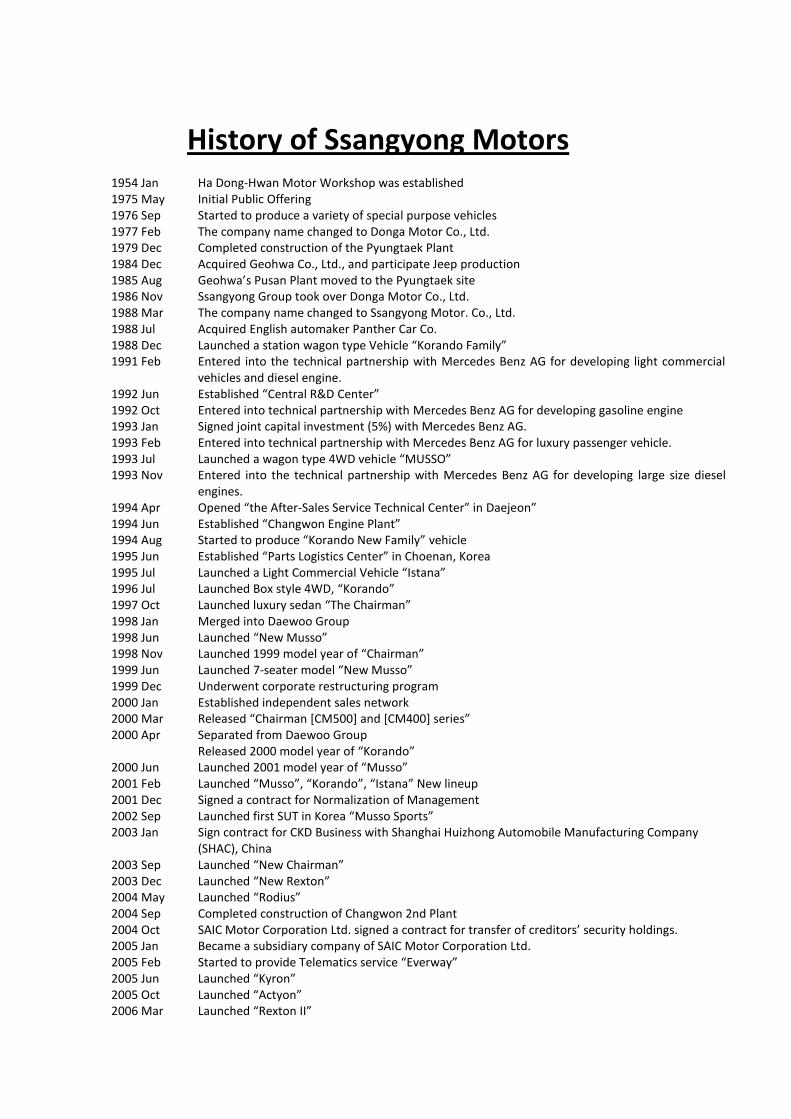
History of Ssangyong Motors
1954 Jan Ha Dong-Hwan Motor Workshop was established 1975 May Initial Public Offering 1976 Sep Started to produce a variety of special purpose vehicles 1977 Feb The company name changed to Donga Motor Co., Ltd. 1979 Dec Completed construction of the Pyungtaek Plant 1984 Dec Acquired Geohwa Co., Ltd., and participate Jeep production 1985 Aug Geohwa’s Pusan Plant moved to the Pyungtaek site 1986 Nov Ssangyong Group took over Donga Motor Co., Ltd. 1988 Mar The company name changed to Ssangyong Motor. Co., Ltd. 1988 Jul Acquired English automaker Panther Car Co. 1988 Dec Launched a station wagon type Vehicle “Korando Family” 1991 Feb Entered into the technical partnership with Mercedes Benz AG for developing light commercial
vehicles and diesel engine. 1992 Jun Established “Central R&D Center” 1992 Oct Entered into technical partnership with Mercedes Benz AG for developing gasoline engine 1993 Jan Signed joint capital investment (5%) with Mercedes Benz AG. 1993 Feb Entered into technical partnership with Mercedes Benz AG for luxury passenger vehicle. 1993 Jul Launched a wagon type 4WD vehicle “MUSSO” 1993 Nov Entered into the technical partnership with Mercedes Benz AG for developing large size diesel
engines. 1994 Apr Opened “the After-Sales Service Technical Center” in Daejeon” 1994 Jun Established “Changwon Engine Plant” 1994 Aug Started to produce “Korando New Family” vehicle 1995 Jun Established “Parts Logistics Center” in Choenan, Korea 1995 Jul Launched a Light Commercial Vehicle “Istana” 1996 Jul Launched Box style 4WD, “Korando” 1997 Oct Launched luxury sedan “The Chairman” 1998 Jan Merged into Daewoo Group 1998 Jun Launched “New Musso” 1998 Nov Launched 1999 model year of “Chairman” 1999 Jun Launched 7-seater model “New Musso” 1999 Dec Underwent corporate restructuring program 2000 Jan Established independent sales network 2000 Mar Released “Chairman [CM500] and [CM400] series” 2000 Apr Separated from Daewoo Group Released 2000 model year of “Korando” 2000 Jun Launched 2001 model year of “Musso” 2001 Feb Launched “Musso”, “Korando”, “Istana” New lineup 2001 Dec Signed a contract for Normalization of Management 2002 Sep Launched first SUT in Korea “Musso Sports” 2003 Jan Sign contract for CKD Business with Shanghai Huizhong Automobile Manufacturing Company
(SHAC), China 2003 Sep Launched “New Chairman” 2003 Dec Launched “New Rexton” 2004 May Launched “Rodius” 2004 Sep Completed construction of Changwon 2nd Plant 2004 Oct SAIC Motor Corporation Ltd. signed a contract for transfer of creditors’ security holdings. 2005 Jan Became a subsidiary company of SAIC Motor Corporation Ltd. 2005 Feb Started to provide Telematics service “Everway” 2005 Jun Launched “Kyron” 2005 Oct Launched “Actyon” 2006 Mar Launched “Rexton II”
3
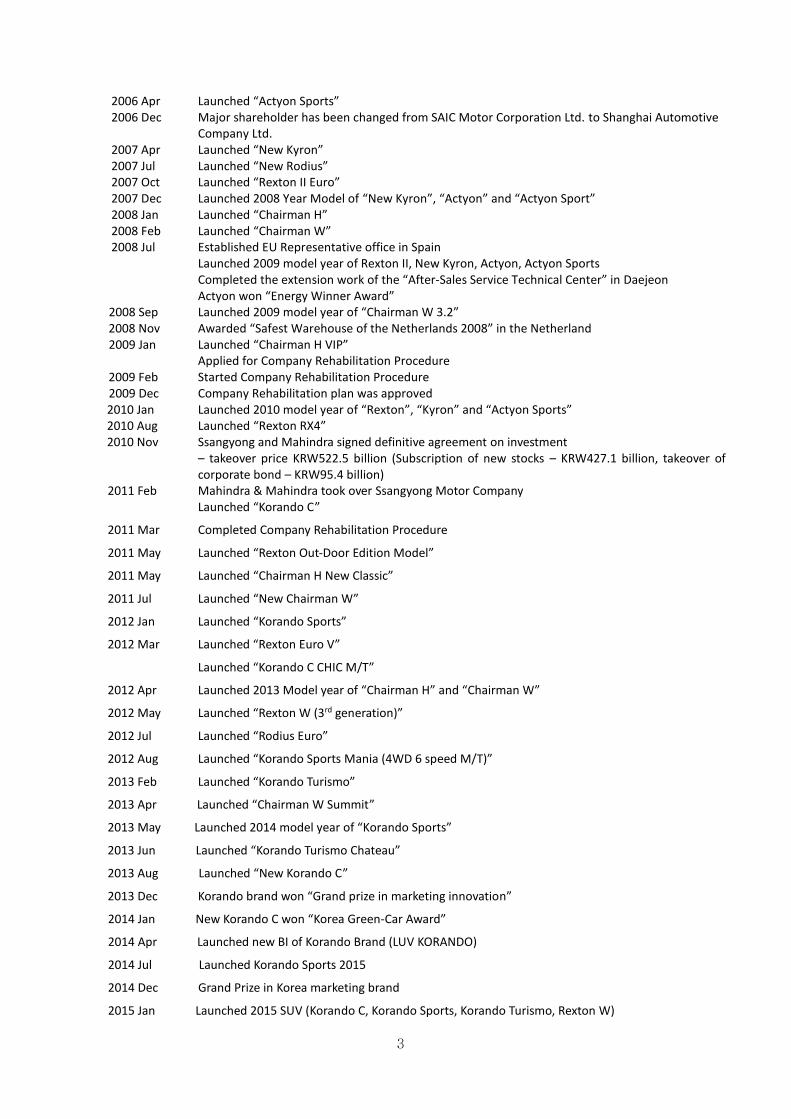
2006 Apr Launched “Actyon Sports” 2006 Dec Major shareholder has been changed from SAIC Motor Corporation Ltd. to Shanghai Automotive
Company Ltd. 2007 Apr Launched “New Kyron” 2007 Jul Launched “New Rodius” 2007 Oct Launched “Rexton II Euro” 2007 Dec Launched 2008 Year Model of “New Kyron”, “Actyon” and “Actyon Sport” 2008 Jan Launched “Chairman H” 2008 Feb Launched “Chairman W” 2008 Jul Established EU Representative office in Spain Launched 2009 model year of Rexton II, New Kyron, Actyon, Actyon Sports Completed the extension work of the “After-Sales Service Technical Center” in Daejeon
Actyon won “Energy Winner Award” 2008 Sep Launched 2009 model year of “Chairman W 3.2”
2008 Nov Awarded “Safest Warehouse of the Netherlands 2008” in the Netherland 2009 Jan Launched “Chairman H VIP” Applied for Company Rehabilitation Procedure
2009 Feb Started Company Rehabilitation Procedure 2009 Dec Company Rehabilitation plan was approved 2010 Jan Launched 2010 model year of “Rexton”, “Kyron” and “Actyon Sports” 2010 Aug Launched “Rexton RX4” 2010 Nov Ssangyong and Mahindra signed definitive agreement on investment – takeover price KRW522.5 billion (Subscription of new stocks – KRW427.1 billion, takeover of
corporate bond – KRW95.4 billion) 2011 Feb Mahindra & Mahindra took over Ssangyong Motor Company
Launched “Korando C”
2011 Mar Completed Company Rehabilitation Procedure
2011 May Launched “Rexton Out-Door Edition Model”
2011 May Launched “Chairman H New Classic”
2011 Jul Launched “New Chairman W”
2012 Jan Launched “Korando Sports”
2012 Mar Launched “Rexton Euro V”
Launched “Korando C CHIC M/T”
2012 Apr Launched 2013 Model year of “Chairman H” and “Chairman W”
2012 May Launched “Rexton W (3rd generation)”
2012 Jul Launched “Rodius Euro”
2012 Aug Launched “Korando Sports Mania (4WD 6 speed M/T)”
2013 Feb Launched “Korando Turismo”
2013 Apr Launched “Chairman W Summit”
2013 May Launched 2014 model year of “Korando Sports”
2013 Jun Launched “Korando Turismo Chateau”
2013 Aug Launched “New Korando C”
2013 Dec Korando brand won “Grand prize in marketing innovation”
2014 Jan New Korando C won “Korea Green-Car Award”
2014 Apr Launched new BI of Korando Brand (LUV KORANDO)
2014 Jul Launched Korando Sports 2015
2014 Dec Grand Prize in Korea marketing brand
2015 Jan Launched 2015 SUV (Korando C, Korando Sports, Korando Turismo, Rexton W)
4
2015 Jan Launched Tivoli gasoline model
2015 Jan Tivoli won “Korea Green-Car Award”
5
[53rd Annual Shareholders’ Meeting]
Opening Remarks
Honorable Shareholders,
I would like to express my deepest appreciation to all of you for attending the 53rd Annual
Shareholders Meeting, despite your busy schedule.
Last year, Ssangyong Motor has successfully regained the customers’ trust and proved our
growth potential by introducing globally attractable lineup based on the stable and amicable
labor and management relations despite lots of unfavorable business conditions.
Notwithstanding various unsolved labor issues, SYMC has built mutually beneficial labor
and management partnership without labor strike for 5 consecutive years, which is very
meaningful.
Above all, sales of SYMC has increased in the domestic market for 5 years in a row,
recording sales of more than 140,000 units for 2years only with the facelift model.
SYMC has tried to continuously release new face-lift model which satisfies customer needs
and market trend, and to establish brand identity focusing on SUV utilizing the amicable
labor and management relations.
Although losses was slightly expanded due to the deteriorated internal and external
conditions such as plummeted value of Russian rouble, and expanded application of ordinary
wage, we firmly believe that the profits of the company will grow thanks to the sales increase
of new car model.
Regaining of customers’ trust and the business normalization were largely attributable to the
support and interests of all shareholders.
6
Respected Shareholders!
Ssangyong Motor will put more focus on regaining our reputation as the SUV leader based on
the achievement we have made.
And despite the sluggish demand for automobile, the global sales growth in the SUV market
will become the great opportunity for SYMC.
SYMC will make the most of this SUV booming this year, and plans to increase sales of SUV
by more than 10%.
As the first step towards this goal, Ssangyong Motor launched our strategic model ‘Tivoli’
targeting the global market in January. ‘Tivoli’ is the fruit of our 40-months efforts.
As the representative and first B-segment ‘Best-selling vehicle’ of our company, ‘Tivoli’ will
give us opportunities to make turn-around and to achieve mid- long-term goal, recording
sales of more than 100,000 units per year.
In particular, ‘Tivoli’ will be the growth engine enabling us to make solid ground as the SUV
expert both in name and reality, and to jump again.
Since its debut, ‘Tivoli’ gasoline model is getting positive response in the compact SUV
market. We hope that ‘Tivoli’ becomes the winner in the compact SUV market competition
driving the future sales increase.
Starting with gasoline version, ‘Tivoli’ will introduce its various lineup including diesel
version and the long-body.
As such, Ssangyong Motor will expand our global sales by aggressively responding to the
demands in the SUV market both at home and abroad with ‘Tivoli’.
Moreover, in line with the quantitative growth, improvement in the management system and
the profitability will be our priority.
Respected Shareholders!
7
Ssangyong Motor hits the road in the new journey with the launch of ‘Tivoli’.
New starts means new opportunity for prosperity of SYMC.
SYMC plans to introduce more than one new model every year to strengthen our product
competitiveness and to heighten capacity usage rate to 100% within 3 to 4 years, and ‘Tivoli’
is the start.
SYMC will try to enhance customer trust by providing high quality customer service, and
like this, we will not stop our development.
Your encouragement and support are indispensable for Ssangyong Motor Company to
become the ‘Most Innovative and Respected Korean Automotive Company’.
Once again, I would like to ask for your continued support and encouragement and wish
health and happiness to you and your families.
Thank you very much!
March 24, 2015
C.E.O Yoo-Il, Lee
Ssangyong Motor Company
8
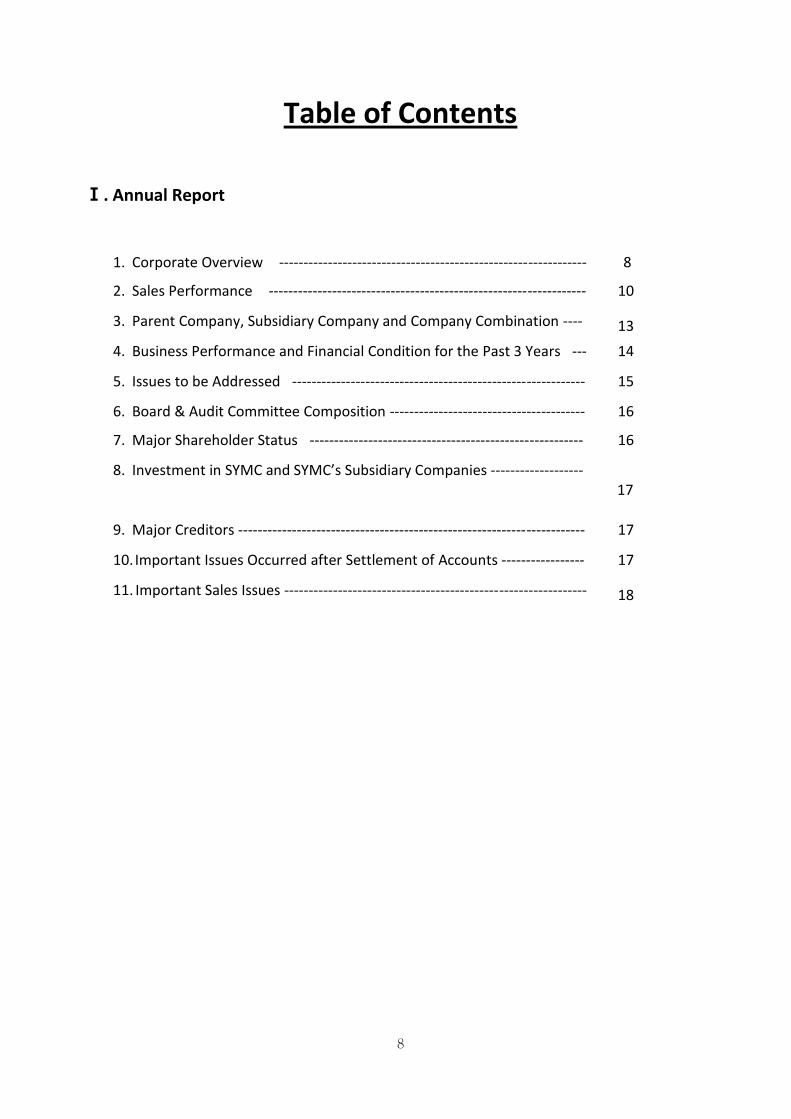
Table of Contents
Ⅰ. Annual Report
1. Corporate Overview --------------------------------------------------------------- 8
2. Sales Performance ----------------------------------------------------------------- 10
3. Parent Company, Subsidiary Company and Company Combination ---- 13
4. Business Performance and Financial Condition for the Past 3 Years --- 14
5. Issues to be Addressed ------------------------------------------------------------ 15
6. Board & Audit Committee Composition ---------------------------------------- 16
7. Major Shareholder Status -------------------------------------------------------- 16
8. Investment in SYMC and SYMC’s Subsidiary Companies ------------------- 17
9. Major Creditors ----------------------------------------------------------------------- 17
10. Important Issues Occurred after Settlement of Accounts ----------------- 17
11. Important Sales Issues -------------------------------------------------------------- 18
9
Ⅰ. Annual Report
1. Corporate Overview
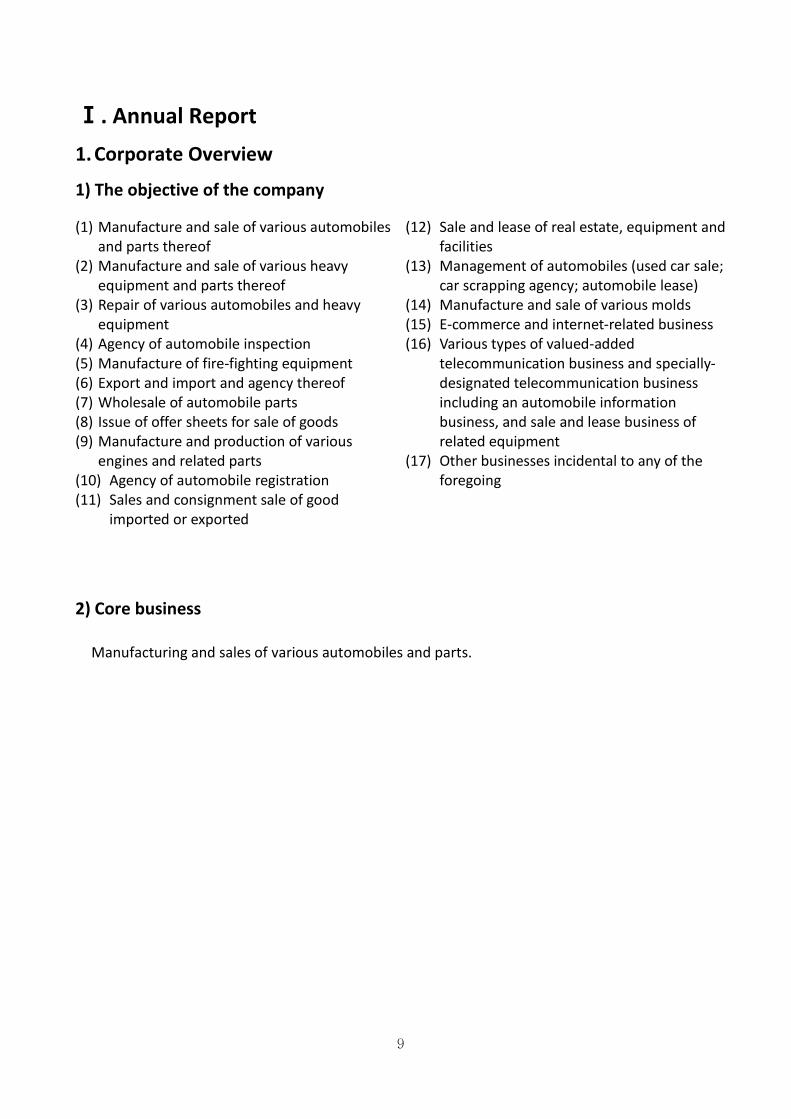
1) The objective of the company
(1) Manufacture and sale of various automobiles and parts thereof
(2) Manufacture and sale of various heavy equipment and parts thereof
(3) Repair of various automobiles and heavy equipment
(4) Agency of automobile inspection (5) Manufacture of fire-fighting equipment (6) Export and import and agency thereof (7) Wholesale of automobile parts (8) Issue of offer sheets for sale of goods (9) Manufacture and production of various
engines and related parts (10) Agency of automobile registration (11) Sales and consignment sale of good
imported or exported
(12) Sale and lease of real estate, equipment and facilities
(13) Management of automobiles (used car sale; car scrapping agency; automobile lease)
(14) Manufacture and sale of various molds (15) E-commerce and internet-related business (16) Various types of valued-added
telecommunication business and specially-designated telecommunication business including an automobile information business, and sale and lease business of related equipment
(17) Other businesses incidental to any of the foregoing
2) Core business
Manufacturing and sales of various automobiles and parts.
10
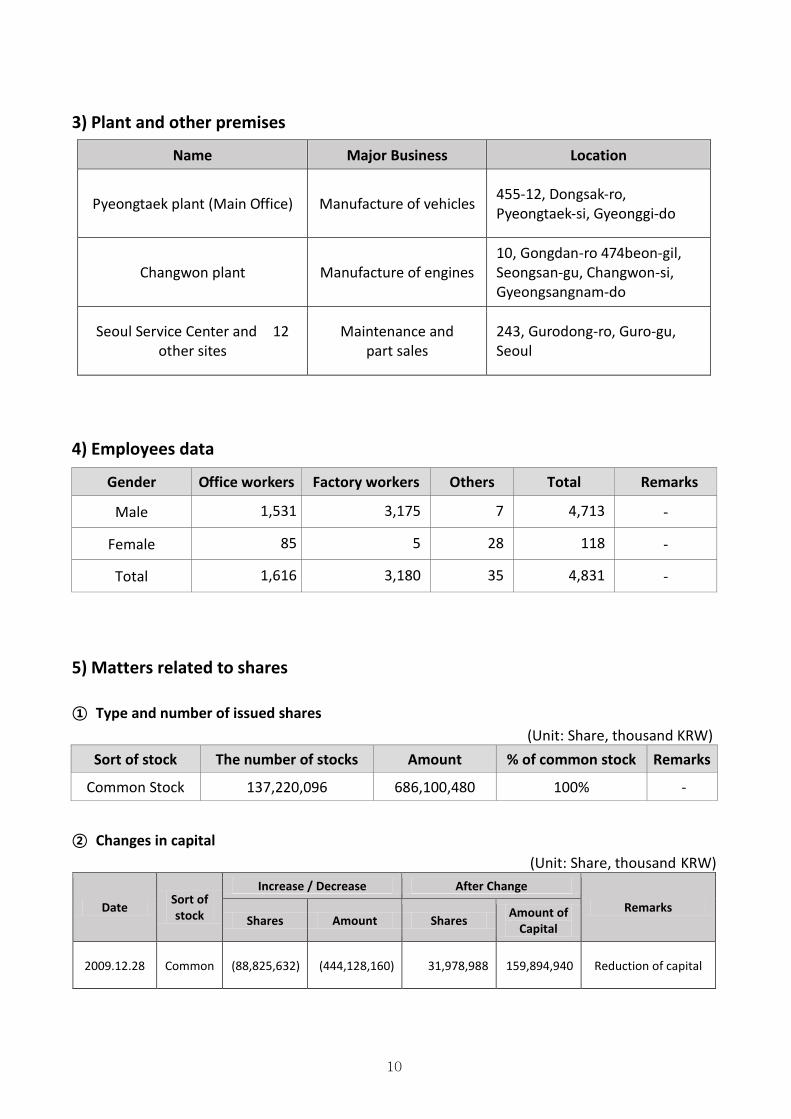
3) Plant and other premises
Name Major Business Location
Pyeongtaek plant (Main Office) Manufacture of vehicles 455-12, Dongsak-ro, Pyeongtaek-si, Gyeonggi-do
Changwon plant Manufacture of engines 10, Gongdan-ro 474beon-gil, Seongsan-gu, Changwon-si, Gyeongsangnam-do
Seoul Service Center and 12 other sites
Maintenance and part sales
243, Gurodong-ro, Guro-gu, Seoul
4) Employees data
Gender Office workers Factory workers Others Total Remarks
Male 1,531 3,175 7 4,713 -
Female 85 5 28 118 -
Total 1,616 3,180 35 4,831 -
5) Matters related to shares
① Type and number of issued shares
(Unit: Share, thousand KRW) Sort of stock The number of stocks Amount % of common stock Remarks
Common Stock 137,220,096 686,100,480 100% -
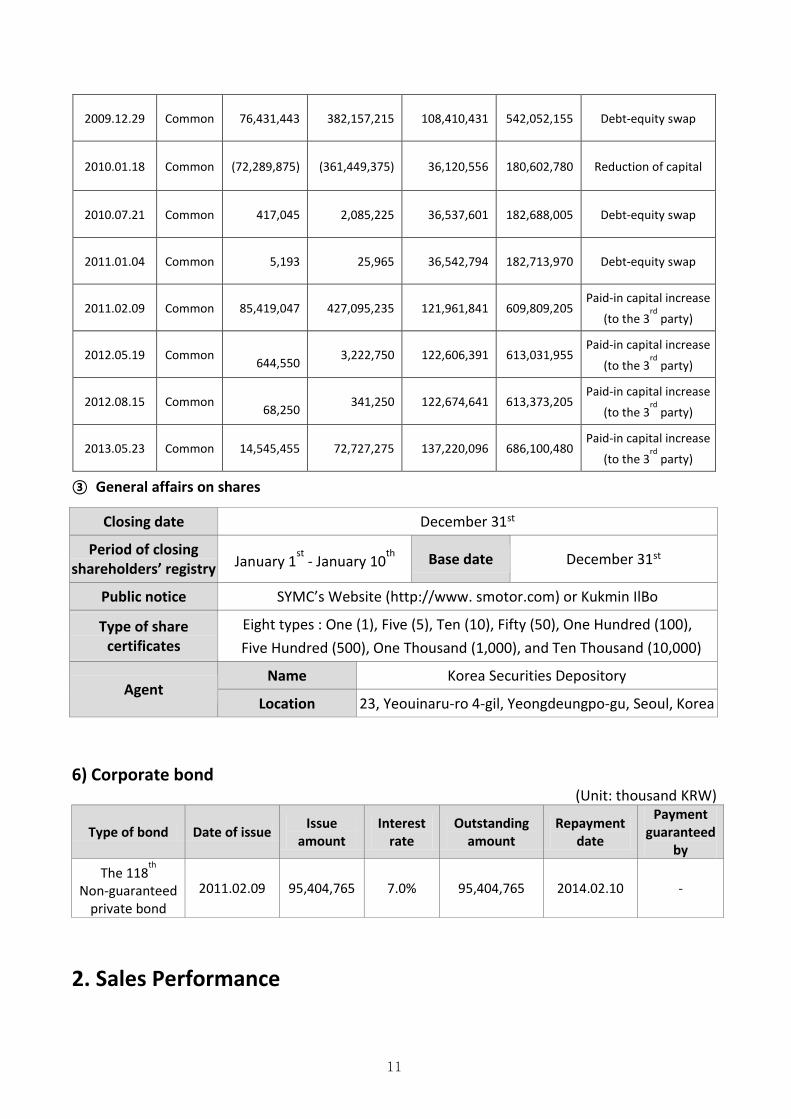
② Changes in capital
(Unit: Share, thousand KRW)
Date Sort of stock
Increase / Decrease After Change
Remarks Shares Amount Shares
Amount of Capital
2009.12.28 Common (88,825,632) (444,128,160) 31,978,988 159,894,940 Reduction of capital
11
2009.12.29 Common 76,431,443 382,157,215 108,410,431 542,052,155 Debt-equity swap
2010.01.18 Common (72,289,875) (361,449,375) 36,120,556 180,602,780 Reduction of capital
2010.07.21 Common 417,045 2,085,225 36,537,601 182,688,005 Debt-equity swap
2011.01.04 Common 5,193 25,965 36,542,794 182,713,970 Debt-equity swap
2011.02.09 Common 85,419,047 427,095,235 121,961,841 609,809,205 Paid-in capital increase
(to the 3rd
party)
2012.05.19 Common
644,550 3,222,750 122,606,391 613,031,955
Paid-in capital increase
(to the 3rd
party)
2012.08.15 Common
68,250 341,250 122,674,641 613,373,205
Paid-in capital increase
(to the 3rd
party)
2013.05.23 Common 14,545,455 72,727,275 137,220,096 686,100,480 Paid-in capital increase
(to the 3rd
party)
③ General affairs on shares
Closing date December 31st
Period of closing shareholders’ registry January 1
st - January 10
th Base date December 31st
Public notice SYMC’s Website (http://www. smotor.com) or Kukmin IlBo
Type of share certificates
Eight types : One (1), Five (5), Ten (10), Fifty (50), One Hundred (100),
Five Hundred (500), One Thousand (1,000), and Ten Thousand (10,000)
Agent Name Korea Securities Depository
Location 23, Yeouinaru-ro 4-gil, Yeongdeungpo-gu, Seoul, Korea
6) Corporate bond
(Unit: thousand KRW)
Type of bond Date of issue Issue
amount Interest
rate
Outstanding
amount
Repayment date
Payment guaranteed
by
The 118th
Non-guaranteed
private bond
2011.02.09 95,404,765 7.0% 95,404,765 2014.02.10 -
2. Sales Performance
12
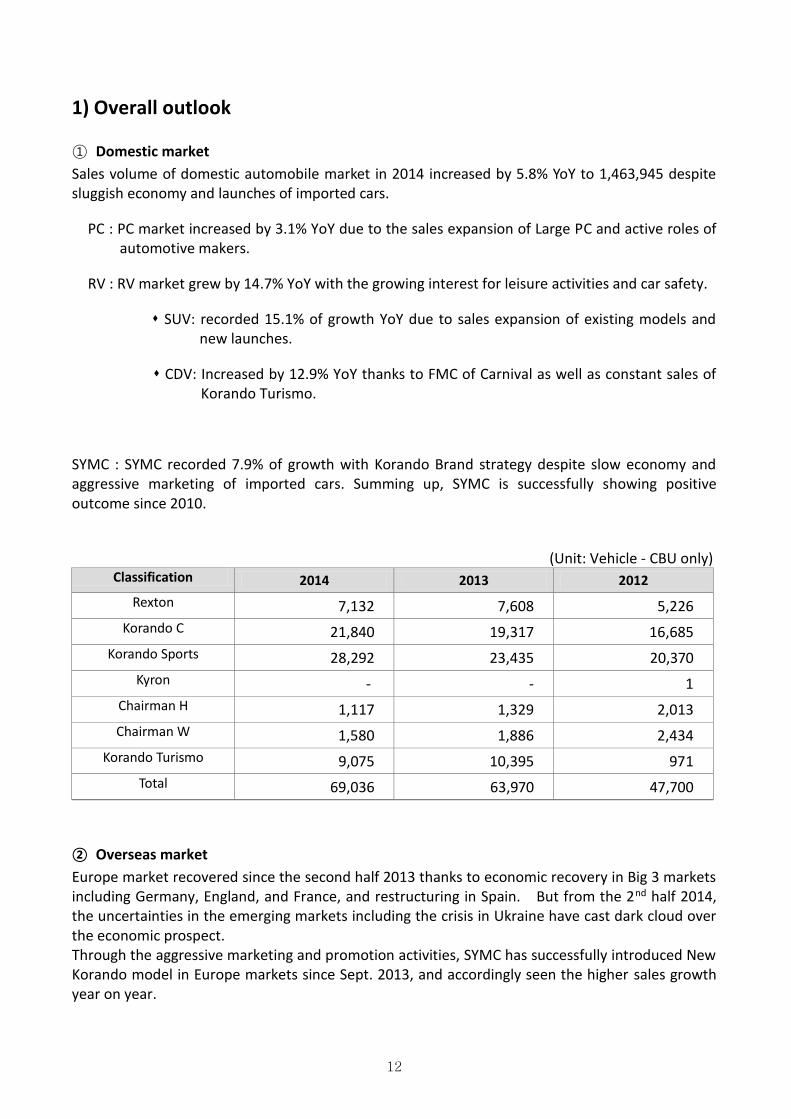
1) Overall outlook
① Domestic market
Sales volume of domestic automobile market in 2014 increased by 5.8% YoY to 1,463,945 despite sluggish economy and launches of imported cars.
PC : PC market increased by 3.1% YoY due to the sales expansion of Large PC and active roles of automotive makers.
RV : RV market grew by 14.7% YoY with the growing interest for leisure activities and car safety.
SUV: recorded 15.1% of growth YoY due to sales expansion of existing models and new launches.
CDV: Increased by 12.9% YoY thanks to FMC of Carnival as well as constant sales of Korando Turismo.
SYMC : SYMC recorded 7.9% of growth with Korando Brand strategy despite slow economy and aggressive marketing of imported cars. Summing up, SYMC is successfully showing positive outcome since 2010.
(Unit: Vehicle - CBU only)
Classification 2014 2013 2012 Rexton 7,132 7,608 5,226
Korando C 21,840 19,317 16,685 Korando Sports 28,292 23,435 20,370
Kyron - - 1 Chairman H 1,117 1,329 2,013 Chairman W 1,580 1,886 2,434
Korando Turismo 9,075 10,395 971 Total 69,036 63,970 47,700
② Overseas market
Europe market recovered since the second half 2013 thanks to economic recovery in Big 3 markets including Germany, England, and France, and restructuring in Spain. But from the 2nd half 2014, the uncertainties in the emerging markets including the crisis in Ukraine have cast dark cloud over the economic prospect. Through the aggressive marketing and promotion activities, SYMC has successfully introduced New Korando model in Europe markets since Sept. 2013, and accordingly seen the higher sales growth year on year.
13
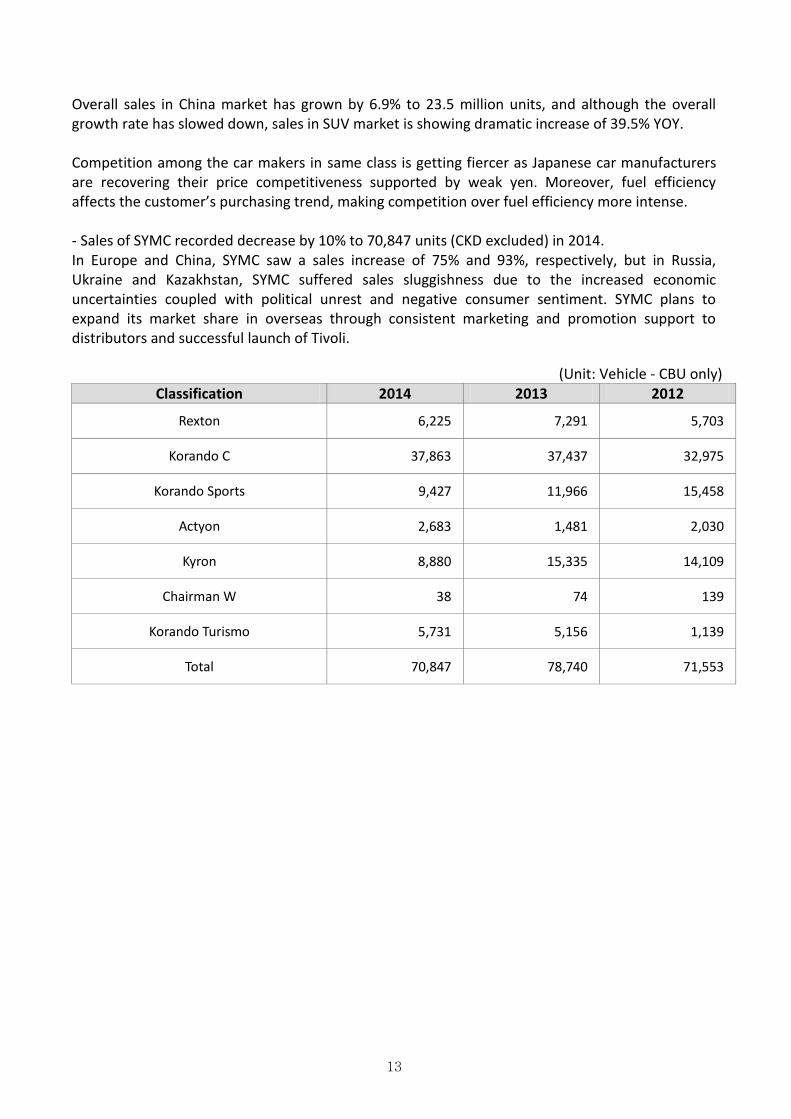
Overall sales in China market has grown by 6.9% to 23.5 million units, and although the overall growth rate has slowed down, sales in SUV market is showing dramatic increase of 39.5% YOY. Competition among the car makers in same class is getting fiercer as Japanese car manufacturers are recovering their price competitiveness supported by weak yen. Moreover, fuel efficiency affects the customer’s purchasing trend, making competition over fuel efficiency more intense. - Sales of SYMC recorded decrease by 10% to 70,847 units (CKD excluded) in 2014. In Europe and China, SYMC saw a sales increase of 75% and 93%, respectively, but in Russia, Ukraine and Kazakhstan, SYMC suffered sales sluggishness due to the increased economic uncertainties coupled with political unrest and negative consumer sentiment. SYMC plans to expand its market share in overseas through consistent marketing and promotion support to distributors and successful launch of Tivoli.
(Unit: Vehicle - CBU only) Classification 2014 2013 2012
Rexton 6,225 7,291 5,703
Korando C 37,863 37,437 32,975
Korando Sports 9,427 11,966 15,458
Actyon 2,683 1,481 2,030
Kyron 8,880 15,335 14,109
Chairman W 38 74 139
Korando Turismo 5,731 5,156 1,139
Total 70,847 78,740 71,553
14
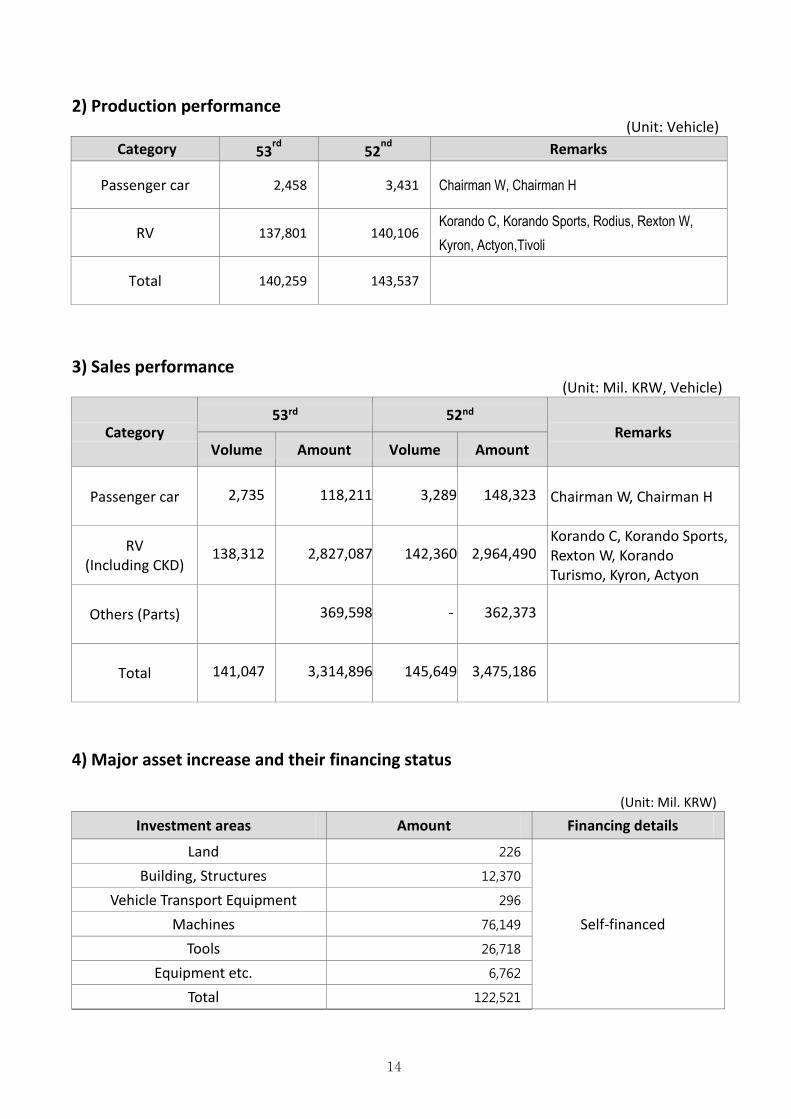
2) Production performance (Unit: Vehicle)
Category 53rd 52
nd Remarks
Passenger car 2,458 3,431 Chairman W, Chairman H
RV 137,801 140,106 Korando C, Korando Sports, Rodius, Rexton W,
Kyron, Actyon,Tivoli
Total 140,259 143,537
3) Sales performance
(Unit: Mil. KRW, Vehicle)
Category 53rd 52nd
Remarks Volume Amount Volume Amount
Passenger car 2,735 118,211 3,289 148,323 Chairman W, Chairman H
RV (Including CKD)
138,312 2,827,087 142,360 2,964,490 Korando C, Korando Sports, Rexton W, Korando Turismo, Kyron, Actyon
Others (Parts) 369,598 - 362,373
Total 141,047 3,314,896 145,649 3,475,186
4) Major asset increase and their financing status
(Unit: Mil. KRW)
Investment areas Amount Financing details
Land 226
Self-financed
Building, Structures 12,370
Vehicle Transport Equipment 296
Machines 76,149
Tools 26,718
Equipment etc. 6,762
Total 122,521
15
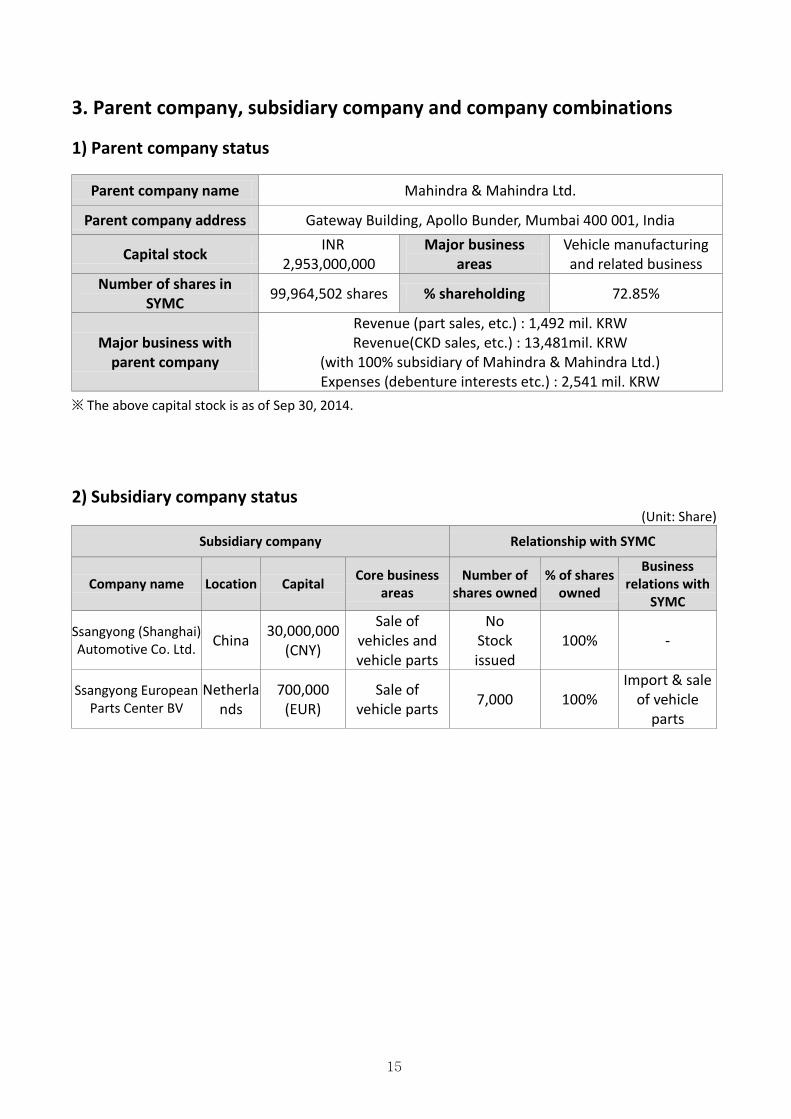
3. Parent company, subsidiary company and company combinations
1) Parent company status
Parent company name Mahindra & Mahindra Ltd.
Parent company address Gateway Building, Apollo Bunder, Mumbai 400 001, India
Capital stock INR 2,953,000,000
Major business areas
Vehicle manufacturing and related business
Number of shares in SYMC
99,964,502 shares % shareholding 72.85%
Major business with parent company
Revenue (part sales, etc.) : 1,492 mil. KRW Revenue(CKD sales, etc.) : 13,481mil. KRW
(with 100% subsidiary of Mahindra & Mahindra Ltd.) Expenses (debenture interests etc.) : 2,541 mil. KRW
※ The above capital stock is as of Sep 30, 2014. 2) Subsidiary company status
(Unit: Share)
Subsidiary company Relationship with SYMC
Company name Location Capital Core business
areas Number of
shares owned % of shares
owned
Business relations with
SYMC
Ssangyong (Shanghai) Automotive Co. Ltd.
China 30,000,000
(CNY)
Sale of vehicles and vehicle parts
No Stock issued
100% -
Ssangyong European Parts Center BV
Netherlands
700,000 (EUR)
Sale of vehicle parts
7,000 100% Import & sale
of vehicle parts
16
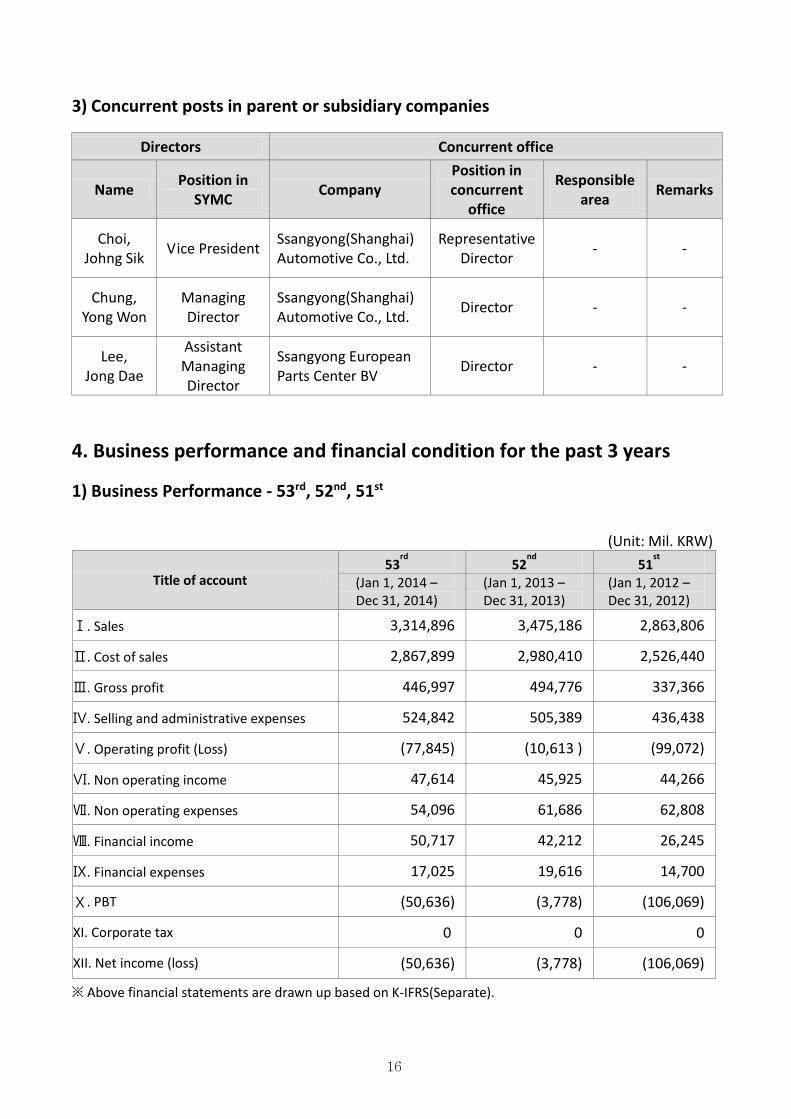
3) Concurrent posts in parent or subsidiary companies
Directors Concurrent office
Name Position in
SYMC Company
Position in concurrent
office
Responsible area
Remarks
Choi, Johng Sik
Vice President Ssangyong(Shanghai) Automotive Co., Ltd.
Representative Director
- -
Chung, Yong Won
Managing Director
Ssangyong(Shanghai) Automotive Co., Ltd.
Director - -
Lee, Jong Dae
Assistant Managing Director
Ssangyong European Parts Center BV
Director - -
4. Business performance and financial condition for the past 3 years
1) Business Performance - 53rd, 52nd, 51st
(Unit: Mil. KRW)
Title of account 53
rd 52
nd 51
st
(Jan 1, 2014 –
Dec 31, 2014) (Jan 1, 2013 –
Dec 31, 2013) (Jan 1, 2012 –
Dec 31, 2012)
Ⅰ. Sales 3,314,896 3,475,186 2,863,806
Ⅱ. Cost of sales 2,867,899 2,980,410 2,526,440
Ⅲ. Gross profit 446,997 494,776 337,366
Ⅳ. Selling and administrative expenses 524,842 505,389 436,438
Ⅴ. Operating profit (Loss) (77,845) (10,613 ) (99,072)
Ⅵ. Non operating income 47,614 45,925 44,266
Ⅶ. Non operating expenses 54,096 61,686 62,808
Ⅷ. Financial income 50,717 42,212 26,245
Ⅸ. Financial expenses 17,025 19,616 14,700
Ⅹ. PBT (50,636) (3,778) (106,069) XI. Corporate tax 0 0 0 XII. Net income (loss) (50,636) (3,778) (106,069) ※ Above financial statements are drawn up based on K-IFRS(Separate).
17
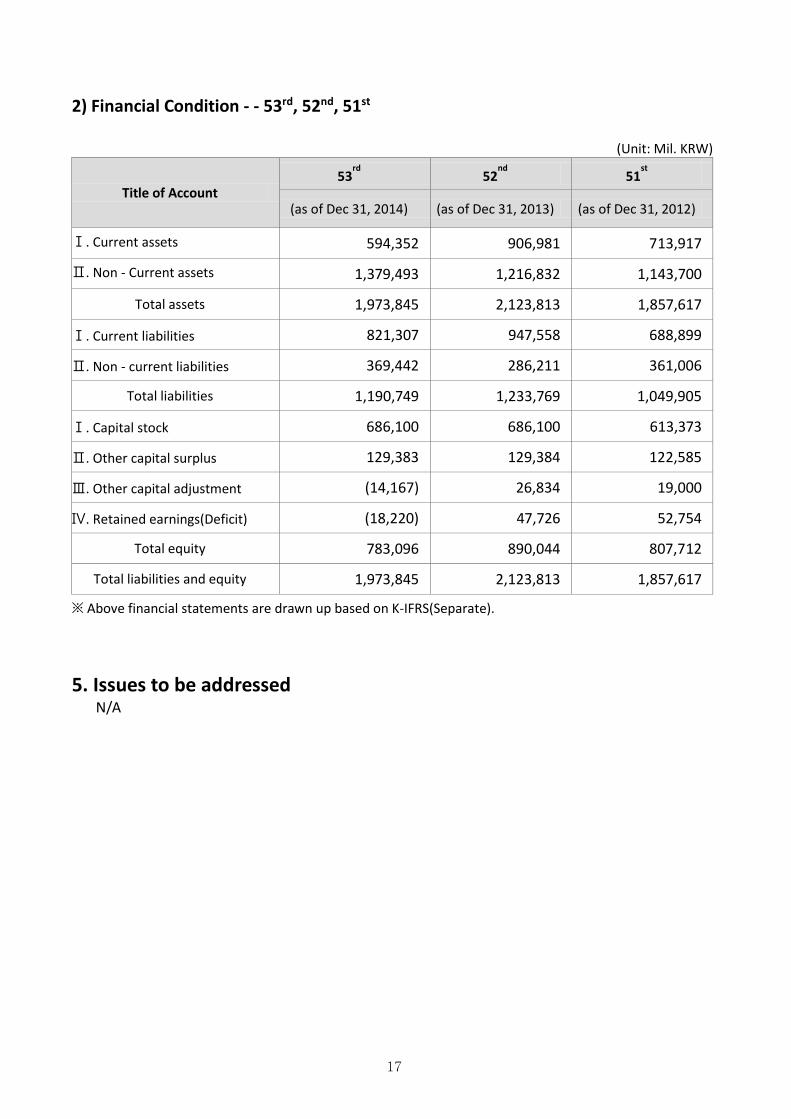
2) Financial Condition - - 53rd, 52nd, 51st
(Unit: Mil. KRW)
Title of Account 53
rd 52
nd 51
st
(as of Dec 31, 2014) (as of Dec 31, 2013) (as of Dec 31, 2012)
Ⅰ. Current assets 594,352 906,981 713,917 Ⅱ. Non - Current assets 1,379,493 1,216,832 1,143,700
Total assets 1,973,845 2,123,813 1,857,617
Ⅰ. Current liabilities 821,307 947,558 688,899
Ⅱ. Non - current liabilities 369,442 286,211 361,006 Total liabilities 1,190,749 1,233,769 1,049,905
Ⅰ. Capital stock 686,100 686,100 613,373
Ⅱ. Other capital surplus 129,383 129,384 122,585
Ⅲ. Other capital adjustment (14,167) 26,834 19,000
Ⅳ. Retained earnings(Deficit) (18,220) 47,726 52,754 Total equity 783,096 890,044 807,712
Total liabilities and equity 1,973,845 2,123,813 1,857,617 ※ Above financial statements are drawn up based on K-IFRS(Separate).
5. Issues to be addressed
N/A
18
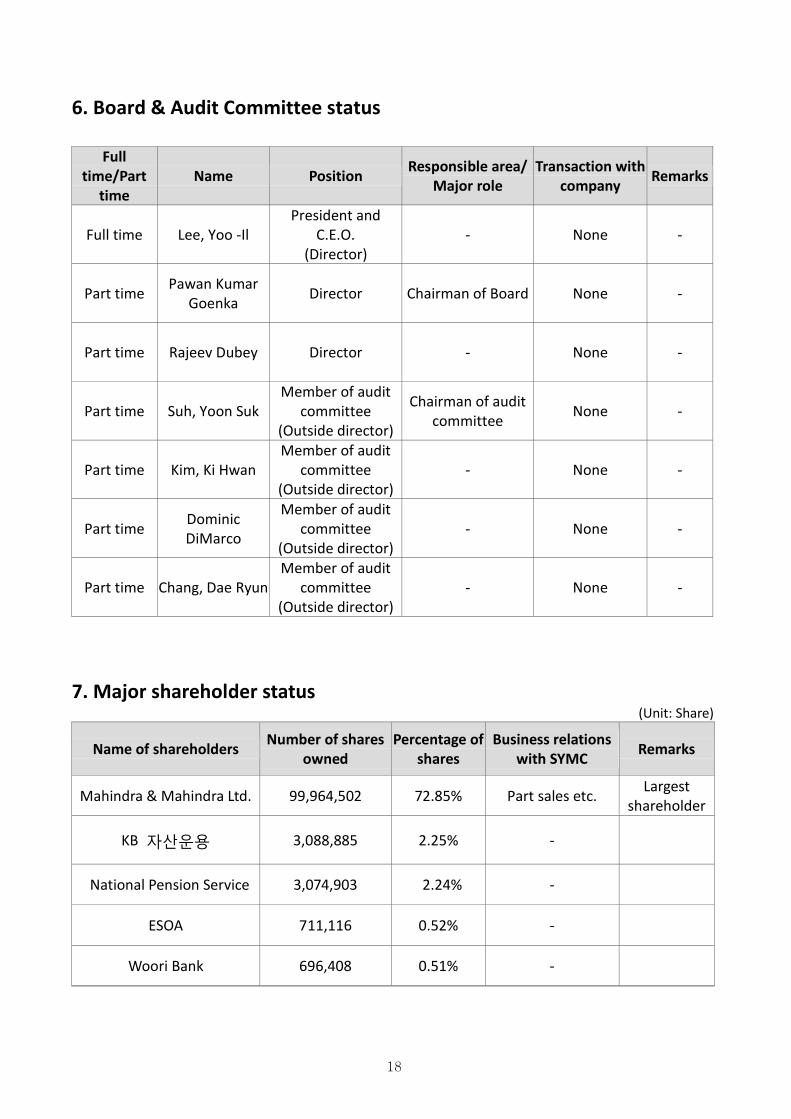
6. Board & Audit Committee status
Full time/Part
time Name Position Responsible area/
Major role Transaction with
company Remarks
Full time Lee, Yoo -Il President and
C.E.O. (Director)
- None -
Part time Pawan Kumar Goenka Director Chairman of Board None -
Part time Rajeev Dubey Director - None -
Part time Suh, Yoon Suk Member of audit
committee (Outside director)
Chairman of audit committee None -
Part time Kim, Ki Hwan Member of audit
committee (Outside director)
- None -
Part time Dominic DiMarco
Member of audit committee
(Outside director) - None -
Part time Chang, Dae Ryun Member of audit
committee (Outside director)
- None -
7. Major shareholder status (Unit: Share)
Name of shareholders Number of shares
owned Percentage of
shares Business relations
with SYMC Remarks
Mahindra & Mahindra Ltd. 99,964,502 72.85% Part sales etc. Largest
shareholder
KB 자산운용 3,088,885 2.25% -
National Pension Service 3,074,903 2.24% -
ESOA 711,116 0.52% -
Woori Bank 696,408 0.51% -
19
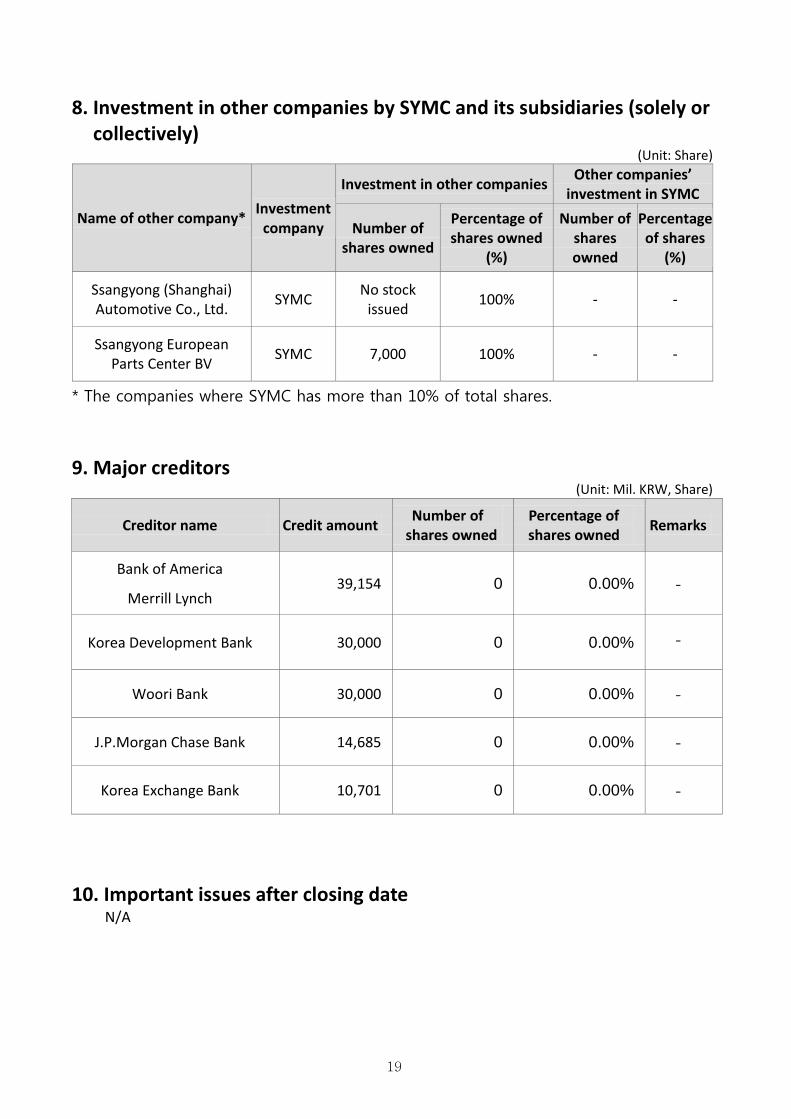
8. Investment in other companies by SYMC and its subsidiaries (solely or collectively)
(Unit: Share)
Name of other company* Investment
company
Investment in other companies Other companies’
investment in SYMC
Number of shares owned
Percentage of shares owned
(%)
Number of shares owned
Percentage of shares
(%)
Ssangyong (Shanghai) Automotive Co., Ltd.
SYMC No stock
issued 100% - -
Ssangyong European Parts Center BV
SYMC 7,000 100% - -
* The companies where SYMC has more than 10% of total shares.
9. Major creditors (Unit: Mil. KRW, Share)
Creditor name Credit amount Number of
shares owned Percentage of shares owned
Remarks
Bank of America
Merrill Lynch 39,154 0 0.00% -
Korea Development Bank 30,000 0 0.00% -
Woori Bank 30,000 0 0.00% -
J.P.Morgan Chase Bank 14,685 0 0.00% -
Korea Exchange Bank 10,701 0 0.00% -
10. Important issues after closing date N/A
20
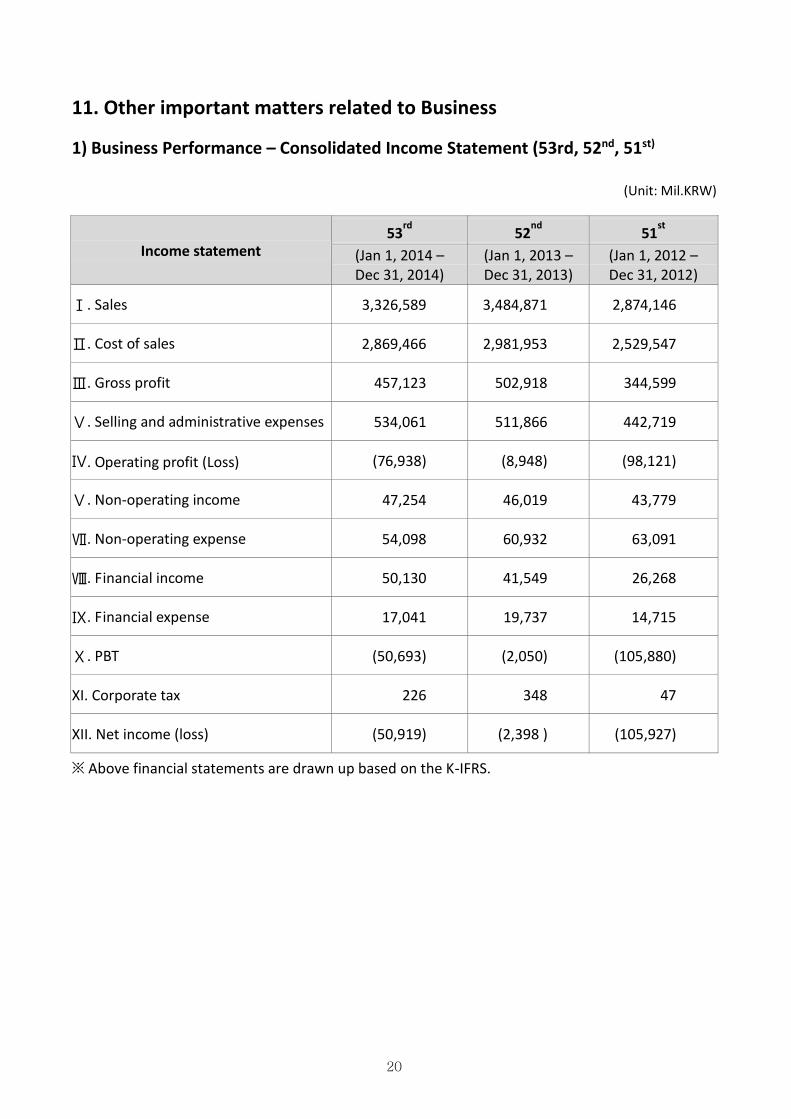
11. Other important matters related to Business
1) Business Performance – Consolidated Income Statement (53rd, 52nd, 51st)
(Unit: Mil.KRW)
Income statement 53
rd 52
nd 51
st
(Jan 1, 2014 – Dec 31, 2014)
(Jan 1, 2013 – Dec 31, 2013)
(Jan 1, 2012 – Dec 31, 2012)
Ⅰ. Sales 3,326,589 3,484,871 2,874,146
Ⅱ. Cost of sales 2,869,466 2,981,953 2,529,547
Ⅲ. Gross profit 457,123 502,918 344,599
Ⅴ. Selling and administrative expenses 534,061 511,866 442,719
Ⅳ. Operating profit (Loss) (76,938) (8,948) (98,121)
Ⅴ. Non-operating income 47,254 46,019 43,779
Ⅶ. Non-operating expense 54,098 60,932 63,091
Ⅷ. Financial income 50,130 41,549 26,268
Ⅸ. Financial expense 17,041 19,737 14,715
Ⅹ. PBT (50,693) (2,050) (105,880)
XI. Corporate tax 226 348 47
XII. Net income (loss) (50,919) (2,398 ) (105,927)
※ Above financial statements are drawn up based on the K-IFRS.
21
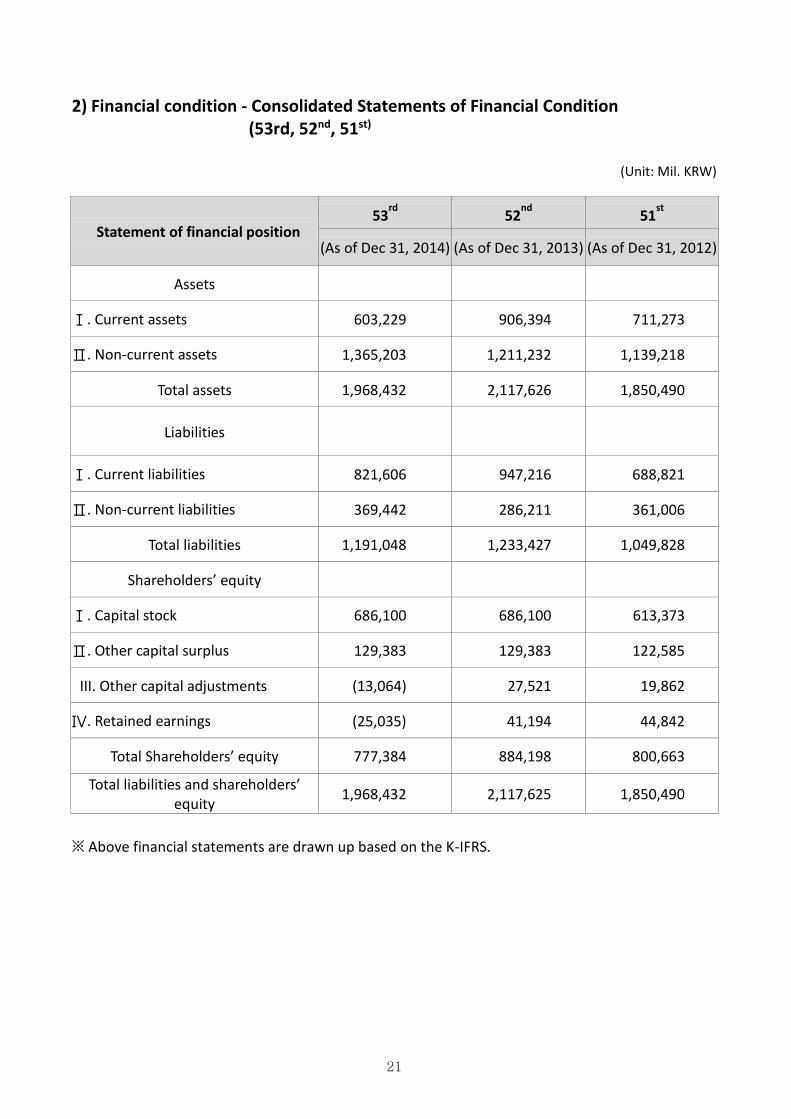
2) Financial condition - Consolidated Statements of Financial Condition (53rd, 52nd, 51st)
(Unit: Mil. KRW)
Statement of financial position 53
rd 52
nd 51
st
(As of Dec 31, 2014) (As of Dec 31, 2013) (As of Dec 31, 2012)
Assets
Ⅰ. Current assets 603,229 906,394 711,273
Ⅱ. Non-current assets 1,365,203 1,211,232 1,139,218
Total assets 1,968,432 2,117,626 1,850,490
Liabilities
Ⅰ. Current liabilities 821,606 947,216 688,821
Ⅱ. Non-current liabilities 369,442 286,211 361,006
Total liabilities 1,191,048 1,233,427 1,049,828
Shareholders’ equity
Ⅰ. Capital stock 686,100 686,100 613,373
Ⅱ. Other capital surplus 129,383 129,383 122,585
III. Other capital adjustments (13,064) 27,521 19,862
Ⅳ. Retained earnings (25,035) 41,194 44,842
Total Shareholders’ equity 777,384 884,198 800,663 Total liabilities and shareholders’
equity 1,968,432 2,117,625 1,850,490
※ Above financial statements are drawn up based on the K-IFRS.
22
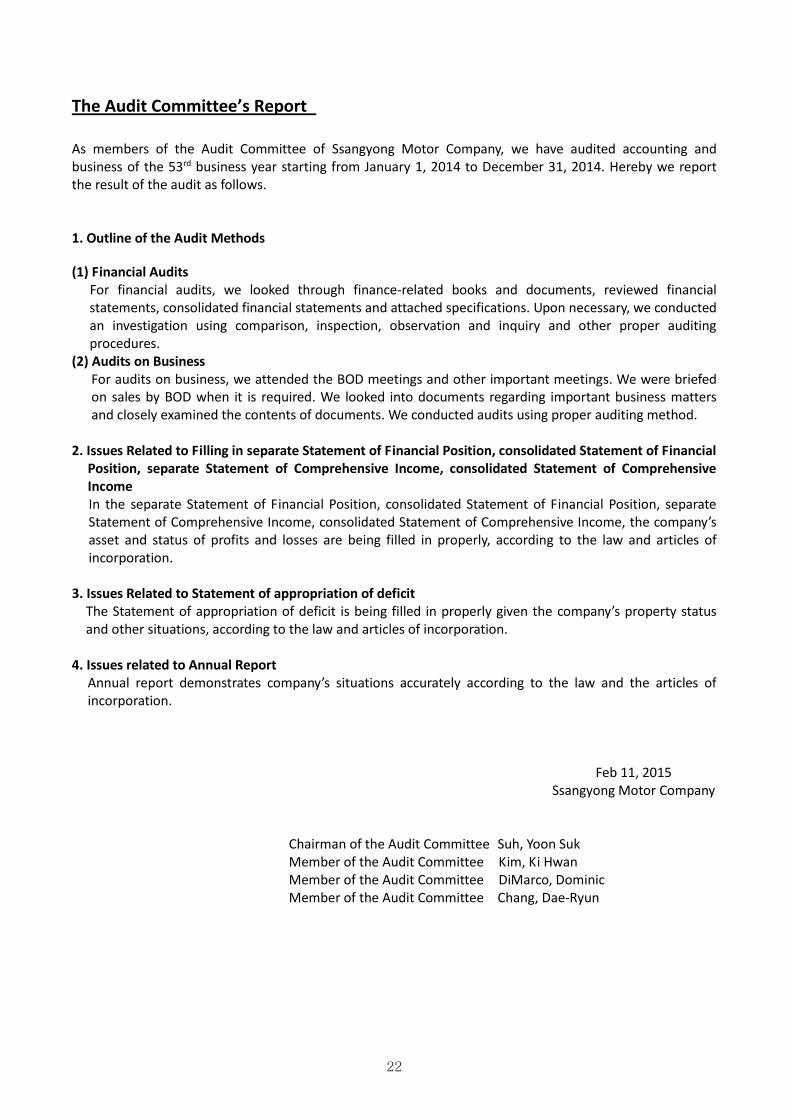
The Audit Committee’s Report
As members of the Audit Committee of Ssangyong Motor Company, we have audited accounting and business of the 53rd business year starting from January 1, 2014 to December 31, 2014. Hereby we report the result of the audit as follows. 1. Outline of the Audit Methods
(1) Financial Audits For financial audits, we looked through finance-related books and documents, reviewed financial statements, consolidated financial statements and attached specifications. Upon necessary, we conducted an investigation using comparison, inspection, observation and inquiry and other proper auditing procedures.
(2) Audits on Business For audits on business, we attended the BOD meetings and other important meetings. We were briefed on sales by BOD when it is required. We looked into documents regarding important business matters and closely examined the contents of documents. We conducted audits using proper auditing method.
2. Issues Related to Filling in separate Statement of Financial Position, consolidated Statement of Financial Position, separate Statement of Comprehensive Income, consolidated Statement of Comprehensive Income In the separate Statement of Financial Position, consolidated Statement of Financial Position, separate Statement of Comprehensive Income, consolidated Statement of Comprehensive Income, the company’s asset and status of profits and losses are being filled in properly, according to the law and articles of incorporation.
3. Issues Related to Statement of appropriation of deficit
The Statement of appropriation of deficit is being filled in properly given the company’s property status and other situations, according to the law and articles of incorporation.
4. Issues related to Annual Report
Annual report demonstrates company’s situations accurately according to the law and the articles of incorporation.
Feb 11, 2015 Ssangyong Motor Company
Chairman of the Audit Committee Suh, Yoon Suk Member of the Audit Committee Kim, Ki Hwan Member of the Audit Committee DiMarco, Dominic Member of the Audit Committee Chang, Dae-Ryun
23
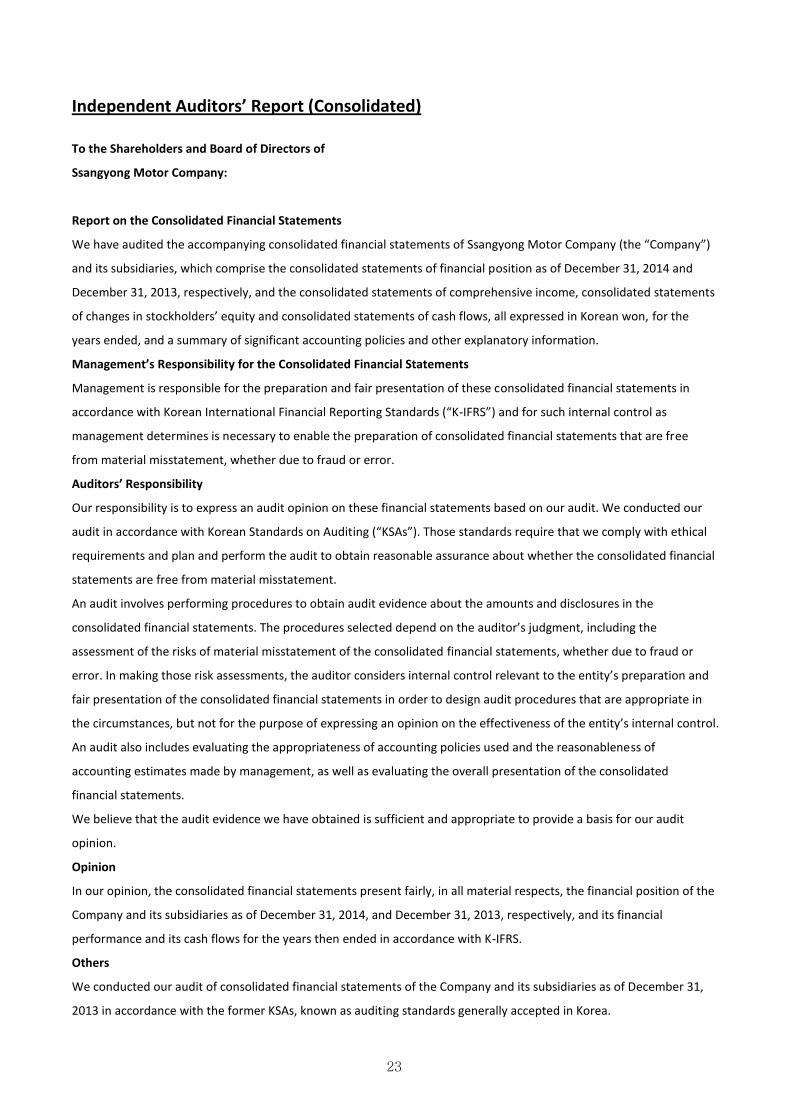
Independent Auditors’ Report (Consolidated)
To the Shareholders and Board of Directors of
Ssangyong Motor Company:
Report on the Consolidated Financial Statements
We have audited the accompanying consolidated financial statements of Ssangyong Motor Company (the “Company”)
and its subsidiaries, which comprise the consolidated statements of financial position as of December 31, 2014 and
December 31, 2013, respectively, and the consolidated statements of comprehensive income, consolidated statements
of changes in stockholders’ equity and consolidated statements of cash flows, all expressed in Korean won, for the
years ended, and a summary of significant accounting policies and other explanatory information.
Management’s Responsibility for the Consolidated Financial Statements
Management is responsible for the preparation and fair presentation of these consolidated financial statements in
accordance with Korean International Financial Reporting Standards (“K-IFRS”) and for such internal control as
management determines is necessary to enable the preparation of consolidated financial statements that are free
from material misstatement, whether due to fraud or error.
Auditors’ Responsibility
Our responsibility is to express an audit opinion on these financial statements based on our audit. We conducted our
audit in accordance with Korean Standards on Auditing (“KSAs”). Those standards require that we comply with ethical
requirements and plan and perform the audit to obtain reasonable assurance about whether the consolidated financial
statements are free from material misstatement.
An audit involves performing procedures to obtain audit evidence about the amounts and disclosures in the
consolidated financial statements. The procedures selected depend on the auditor’s judgment, including the
assessment of the risks of material misstatement of the consolidated financial statements, whether due to fraud or
error. In making those risk assessments, the auditor considers internal control relevant to the entity’s preparation and
fair presentation of the consolidated financial statements in order to design audit procedures that are appropriate in
the circumstances, but not for the purpose of expressing an opinion on the effectiveness of the entity’s internal control.
An audit also includes evaluating the appropriateness of accounting policies used and the reasonableness of
accounting estimates made by management, as well as evaluating the overall presentation of the consolidated
financial statements.
We believe that the audit evidence we have obtained is sufficient and appropriate to provide a basis for our audit
opinion.
Opinion
In our opinion, the consolidated financial statements present fairly, in all material respects, the financial position of the
Company and its subsidiaries as of December 31, 2014, and December 31, 2013, respectively, and its financial
performance and its cash flows for the years then ended in accordance with K-IFRS.
Others
We conducted our audit of consolidated financial statements of the Company and its subsidiaries as of December 31,
2013 in accordance with the former KSAs, known as auditing standards generally accepted in Korea.
24
Our audit also comprehended the translation of Korean Won amounts into Indian rupee amounts and, in our opinion,
such translation has been made in conformity with the basis in Note 2. Such Indian rupee amounts are presented
solely for the convenience of readers.
March 9, 2015 Jong-Ho Ham
Deloitte Anjin LLC 10, Gukjegeumyung-ro, Yeongdeungpo-gu, Seoul
25
Independent Auditors’ Report (Separate)
To the Shareholders and Board of Directors of
Ssangyong Motor Company:
Report on the Financial Statements
We have audited the accompanying separate financial statements of Ssangyong Motor Company (the
“Company”), which comprise the separate statements of financial position as of December 31, 2014 and
December 31, 2013, respectively, and the separate statements of comprehensive income, separate
statements of changes in stockholders’ equity and separate statements of cash flows, for the years ended,
and a summary of significant accounting policies and other explanatory information.
Management’s Responsibility for the Separate Financial Statements
Management is responsible for the preparation and fair presentation of these separate financial statements
in accordance with Korean International Financial Reporting Standards (“K-IFRS”) and for such internal
control as management determines is necessary to enable the preparation of separate financial statements
that are free from material misstatement, whether due to fraud or error.
Auditors’ Responsibility
Our responsibility is to express an audit opinion on these financial statements based on our audit. We
conducted our audit in accordance with Korean Standards on Auditing (“KSAs”). Those standards require
that we comply with ethical requirements and plan and perform the audit to obtain reasonable assurance
about whether the financial statements are free from material misstatement.
An audit involves performing procedures to obtain audit evidence about the amounts and disclosures in the
financial statements. The procedures selected depend on the auditor’s judgment, including the assessment
of the risks of material misstatement of the financial statements, whether due to fraud or error. In making
those risk assessments, the auditor considers internal control relevant to the entity’s preparation and fair
presentation of the financial statements in order to design audit procedures that are appropriate in the
circumstances, but not for the purpose of expressing an opinion on the effectiveness of the entity’s internal
control. An audit also includes evaluating the appropriateness of accounting policies used and the
reasonableness of accounting estimates made by management, as well as evaluating the overall
presentation of the financial statements.
We believe that the audit evidence we have obtained is sufficient and appropriate to provide a basis for our
audit opinion.
Opinion
In our opinion, the separate financial statements present fairly, in all material respects, the financial
position of the Company as of December 31, 2014, and December 31, 2013, respectively and its financial
performance and its cash flows for the years then ended in accordance with K-IFRS.
Others
We conducted our audit of separate financial statements of the Company as of December 31, 2013 in
accordance with the former KSAs, known as auditing standards generally accepted in Korea.
26
Our audit also comprehended the translation of Korean Won amounts into Indian rupee amounts and, in our opinion, such translation has been made in conformity with the basis in Note 2. Such Indian rupee amounts are presented solely for the convenience of readers
March 9, 2015 Jong-Ho Ham
Deloitte Anjin LLC 10, Gukjegeumyung-ro, Yeongdeungpo-gu, Seoul
27
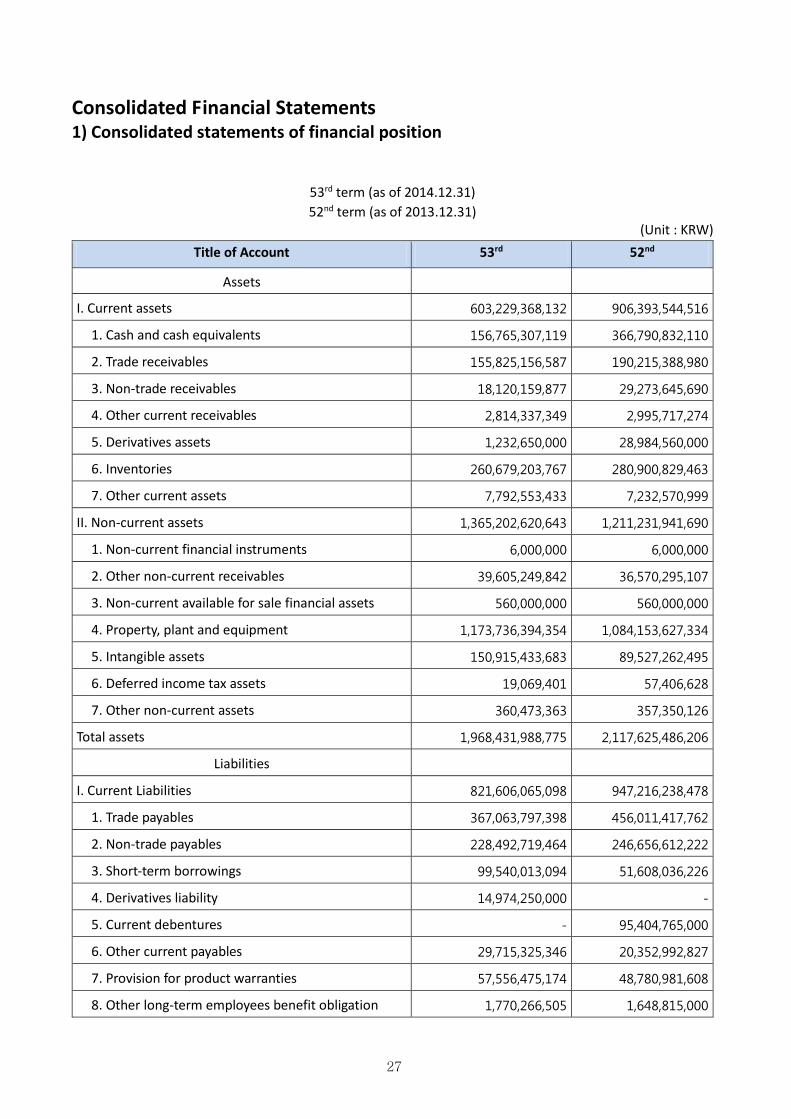
Consolidated Financial Statements 1) Consolidated statements of financial position
53rd term (as of 2014.12.31)
52nd term (as of 2013.12.31) (Unit : KRW)
Title of Account 53rd 52nd
Assets
I. Current assets 603,229,368,132 906,393,544,516
1. Cash and cash equivalents 156,765,307,119 366,790,832,110
2. Trade receivables 155,825,156,587 190,215,388,980
3. Non-trade receivables 18,120,159,877 29,273,645,690
4. Other current receivables 2,814,337,349 2,995,717,274
5. Derivatives assets 1,232,650,000 28,984,560,000
6. Inventories 260,679,203,767 280,900,829,463
7. Other current assets 7,792,553,433 7,232,570,999
II. Non-current assets 1,365,202,620,643 1,211,231,941,690
1. Non-current financial instruments 6,000,000 6,000,000
2. Other non-current receivables 39,605,249,842 36,570,295,107
3. Non-current available for sale financial assets 560,000,000 560,000,000
4. Property, plant and equipment 1,173,736,394,354 1,084,153,627,334
5. Intangible assets 150,915,433,683 89,527,262,495
6. Deferred income tax assets 19,069,401 57,406,628
7. Other non-current assets 360,473,363 357,350,126
Total assets 1,968,431,988,775 2,117,625,486,206
Liabilities
I. Current Liabilities 821,606,065,098 947,216,238,478
1. Trade payables 367,063,797,398 456,011,417,762
2. Non-trade payables 228,492,719,464 246,656,612,222
3. Short-term borrowings 99,540,013,094 51,608,036,226
4. Derivatives liability 14,974,250,000 -
5. Current debentures - 95,404,765,000
6. Other current payables 29,715,325,346 20,352,992,827
7. Provision for product warranties 57,556,475,174 48,780,981,608
8. Other long-term employees benefit obligation 1,770,266,505 1,648,815,000
28
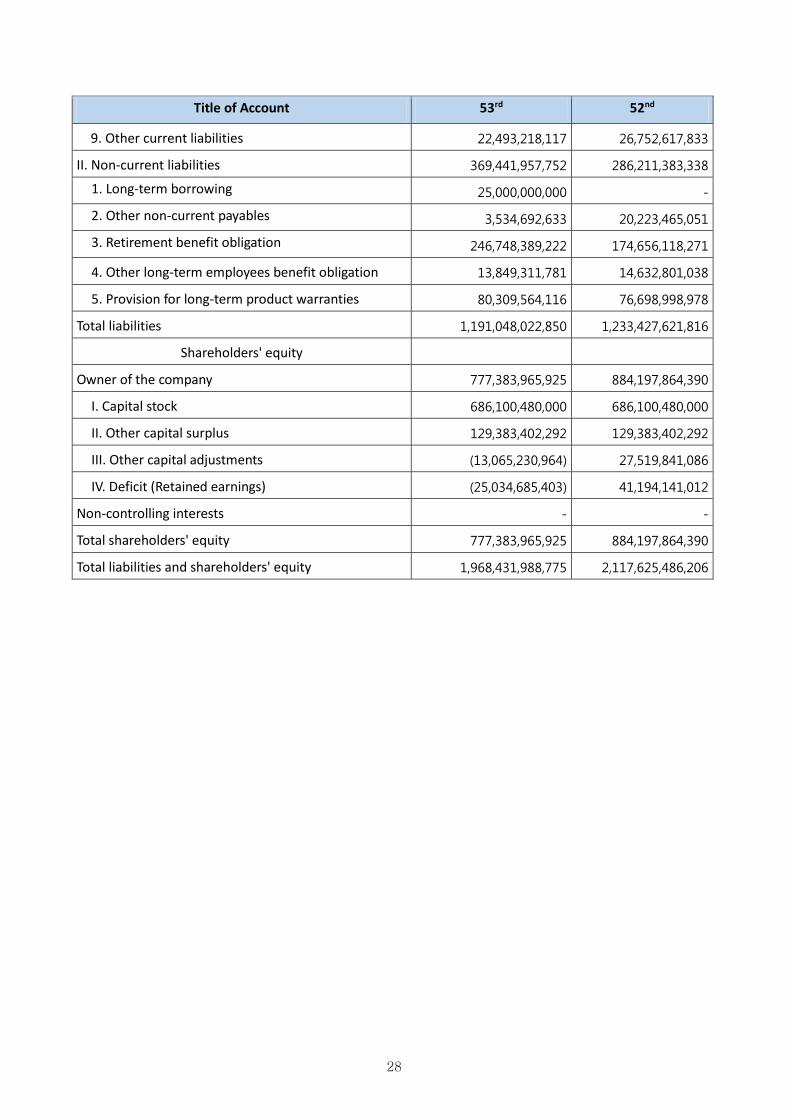
Title of Account 53rd 52nd
9. Other current liabilities 22,493,218,117 26,752,617,833
II. Non-current liabilities 369,441,957,752 286,211,383,338
1. Long-term borrowing 25,000,000,000 -
2. Other non-current payables 3,534,692,633 20,223,465,051
3. Retirement benefit obligation 246,748,389,222 174,656,118,271
4. Other long-term employees benefit obligation 13,849,311,781 14,632,801,038
5. Provision for long-term product warranties 80,309,564,116 76,698,998,978
Total liabilities 1,191,048,022,850 1,233,427,621,816
Shareholders' equity
Owner of the company 777,383,965,925 884,197,864,390
I. Capital stock 686,100,480,000 686,100,480,000
II. Other capital surplus 129,383,402,292 129,383,402,292
III. Other capital adjustments (13,065,230,964) 27,519,841,086
IV. Deficit (Retained earnings) (25,034,685,403) 41,194,141,012
Non-controlling interests - -
Total shareholders' equity 777,383,965,925 884,197,864,390
Total liabilities and shareholders' equity 1,968,431,988,775 2,117,625,486,206
29
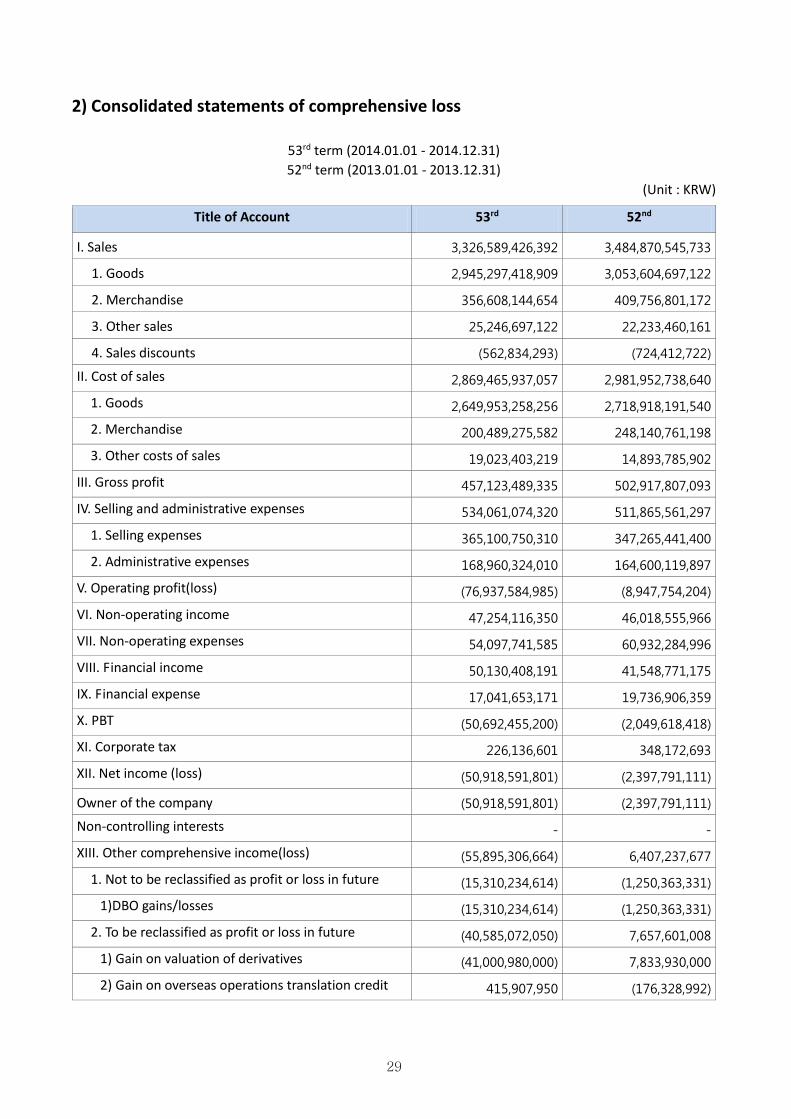
2) Consolidated statements of comprehensive loss
53rd term (2014.01.01 - 2014.12.31)
52nd term (2013.01.01 - 2013.12.31)
(Unit : KRW)
Title of Account 53rd 52nd
I. Sales 3,326,589,426,392 3,484,870,545,733
1. Goods 2,945,297,418,909 3,053,604,697,122
2. Merchandise 356,608,144,654 409,756,801,172
3. Other sales 25,246,697,122 22,233,460,161
4. Sales discounts (562,834,293) (724,412,722)
II. Cost of sales 2,869,465,937,057 2,981,952,738,640
1. Goods 2,649,953,258,256 2,718,918,191,540
2. Merchandise 200,489,275,582 248,140,761,198
3. Other costs of sales 19,023,403,219 14,893,785,902
III. Gross profit 457,123,489,335 502,917,807,093
IV. Selling and administrative expenses 534,061,074,320 511,865,561,297
1. Selling expenses 365,100,750,310 347,265,441,400
2. Administrative expenses 168,960,324,010 164,600,119,897
V. Operating profit(loss) (76,937,584,985) (8,947,754,204)
VI. Non-operating income 47,254,116,350 46,018,555,966
VII. Non-operating expenses 54,097,741,585 60,932,284,996
VIII. Financial income 50,130,408,191 41,548,771,175
IX. Financial expense 17,041,653,171 19,736,906,359
X. PBT (50,692,455,200) (2,049,618,418)
XI. Corporate tax 226,136,601 348,172,693
XII. Net income (loss) (50,918,591,801) (2,397,791,111)
Owner of the company (50,918,591,801) (2,397,791,111)
Non-controlling interests - -
XIII. Other comprehensive income(loss) (55,895,306,664) 6,407,237,677
1. Not to be reclassified as profit or loss in future (15,310,234,614) (1,250,363,331)
1)DBO gains/losses (15,310,234,614) (1,250,363,331)
2. To be reclassified as profit or loss in future (40,585,072,050) 7,657,601,008
1) Gain on valuation of derivatives (41,000,980,000) 7,833,930,000
2) Gain on overseas operations translation credit 415,907,950 (176,328,992)
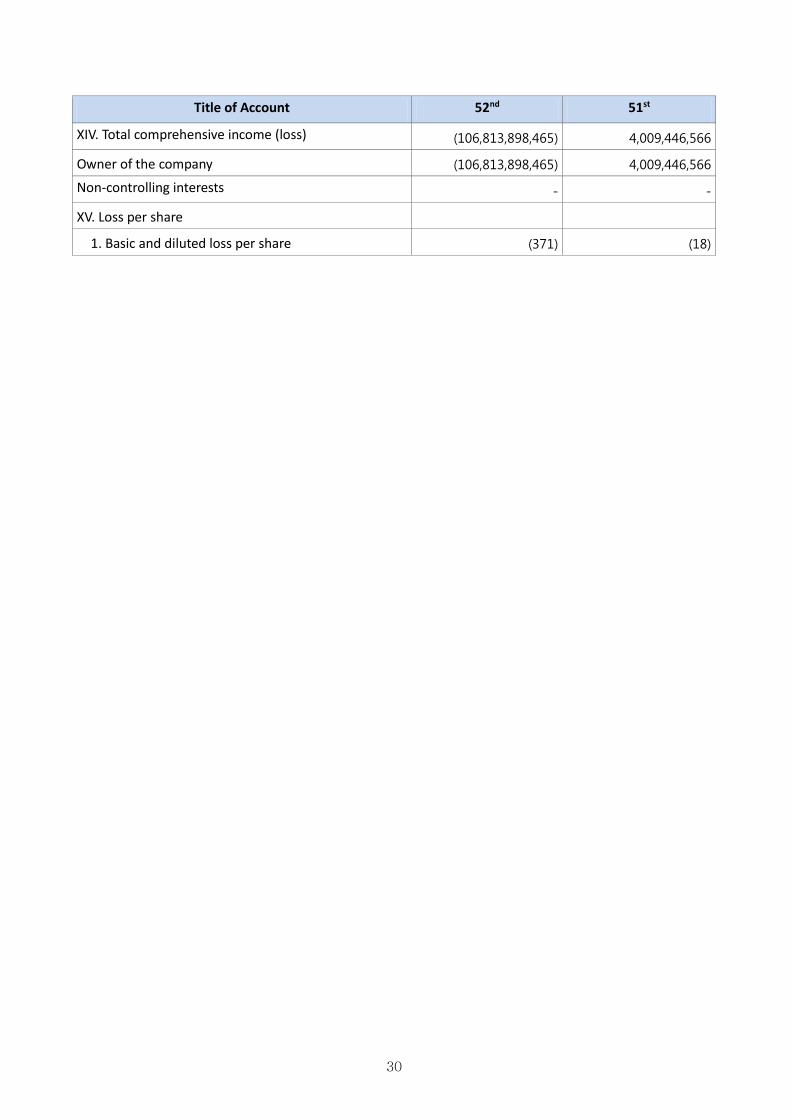
30
Title of Account 52nd 51st
XIV. Total comprehensive income (loss) (106,813,898,465) 4,009,446,566
Owner of the company (106,813,898,465) 4,009,446,566
Non-controlling interests - -
XV. Loss per share
1. Basic and diluted loss per share (371) (18)
31
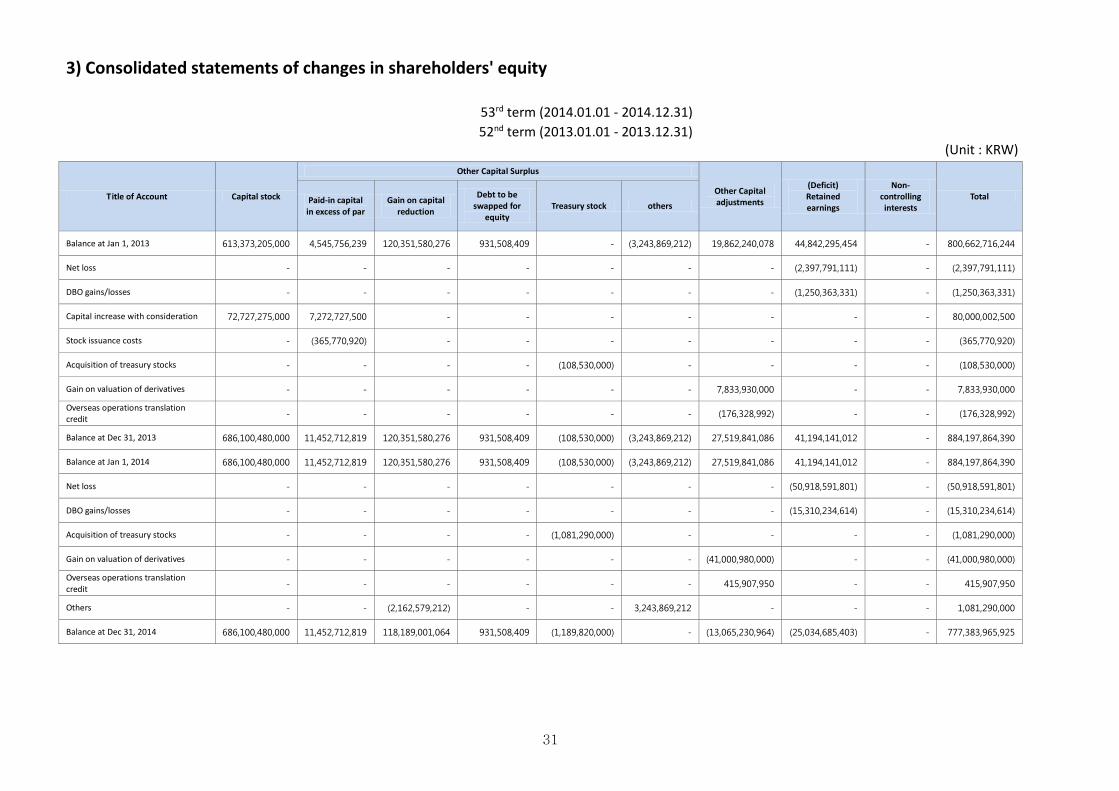
3) Consolidated statements of changes in shareholders' equity
53rd term (2014.01.01 - 2014.12.31)
52nd term (2013.01.01 - 2013.12.31) (Unit : KRW)
Title of Account Capital stock
Other Capital Surplus
Other Capital adjustments
(Deficit) Retained earnings
Non-controlling interests
Total Paid-in capital in excess of par
Gain on capital reduction
Debt to be swapped for
equity Treasury stock others
Balance at Jan 1, 2013 613,373,205,000 4,545,756,239 120,351,580,276 931,508,409 - (3,243,869,212) 19,862,240,078 44,842,295,454 - 800,662,716,244
Net loss - - - - - - - (2,397,791,111) - (2,397,791,111)
DBO gains/losses - - - - - - - (1,250,363,331) - (1,250,363,331)
Capital increase with consideration 72,727,275,000 7,272,727,500 - - - - - - - 80,000,002,500
Stock issuance costs - (365,770,920) - - - - - - - (365,770,920)
Acquisition of treasury stocks - - - - (108,530,000) - - - - (108,530,000)
Gain on valuation of derivatives - - - - - - 7,833,930,000 - - 7,833,930,000
Overseas operations translation credit
- - - - - - (176,328,992) - - (176,328,992)
Balance at Dec 31, 2013 686,100,480,000 11,452,712,819 120,351,580,276 931,508,409 (108,530,000) (3,243,869,212) 27,519,841,086 41,194,141,012 - 884,197,864,390
Balance at Jan 1, 2014 686,100,480,000 11,452,712,819 120,351,580,276 931,508,409 (108,530,000) (3,243,869,212) 27,519,841,086 41,194,141,012 - 884,197,864,390
Net loss - - - - - - - (50,918,591,801) - (50,918,591,801)
DBO gains/losses - - - - - - - (15,310,234,614) - (15,310,234,614)
Acquisition of treasury stocks - - - - (1,081,290,000) - - - - (1,081,290,000)
Gain on valuation of derivatives - - - - - - (41,000,980,000) - - (41,000,980,000)
Overseas operations translation credit
- - - - - - 415,907,950 - - 415,907,950
Others - - (2,162,579,212) - - 3,243,869,212 - - - 1,081,290,000
Balance at Dec 31, 2014 686,100,480,000 11,452,712,819 118,189,001,064 931,508,409 (1,189,820,000) - (13,065,230,964) (25,034,685,403) - 777,383,965,925
32
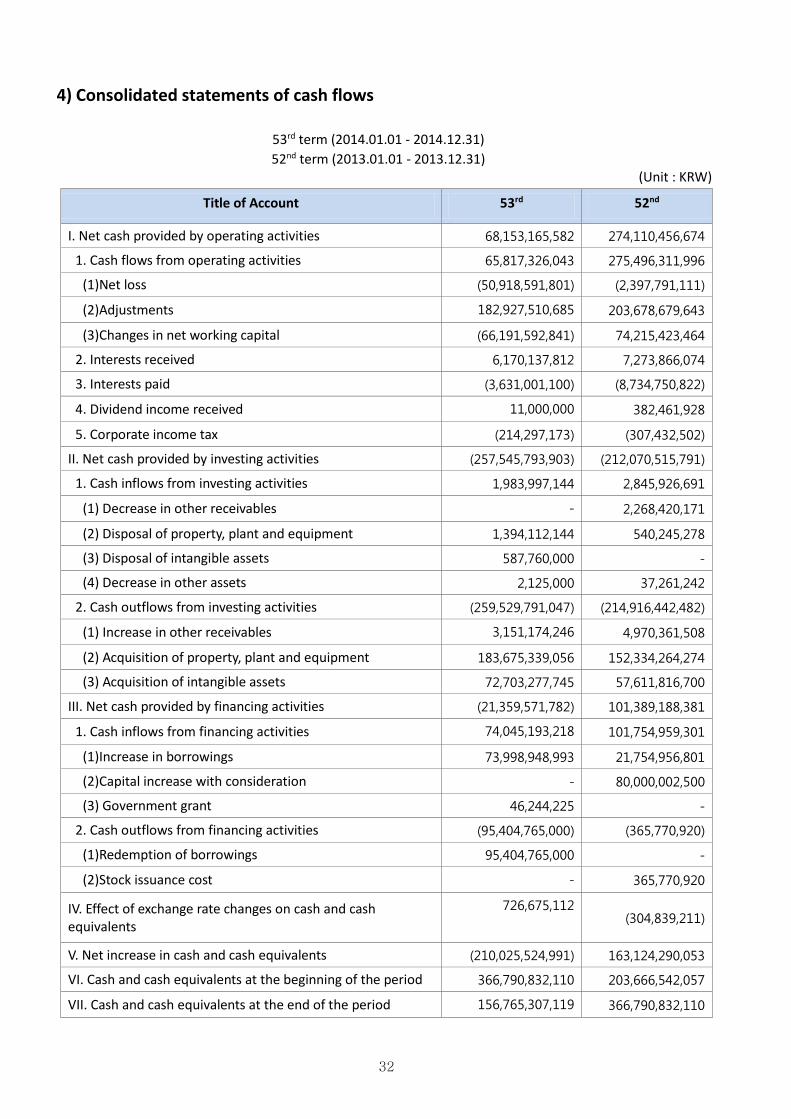
4) Consolidated statements of cash flows
53rd term (2014.01.01 - 2014.12.31)
52nd term (2013.01.01 - 2013.12.31) (Unit : KRW)
Title of Account 53rd 52nd
I. Net cash provided by operating activities 68,153,165,582 274,110,456,674
1. Cash flows from operating activities 65,817,326,043 275,496,311,996
(1)Net loss (50,918,591,801) (2,397,791,111)
(2)Adjustments 182,927,510,685 203,678,679,643
(3)Changes in net working capital (66,191,592,841) 74,215,423,464
2. Interests received 6,170,137,812 7,273,866,074
3. Interests paid (3,631,001,100) (8,734,750,822)
4. Dividend income received 11,000,000 382,461,928
5. Corporate income tax (214,297,173) (307,432,502)
II. Net cash provided by investing activities (257,545,793,903) (212,070,515,791)
1. Cash inflows from investing activities 1,983,997,144 2,845,926,691
(1) Decrease in other receivables - 2,268,420,171
(2) Disposal of property, plant and equipment 1,394,112,144 540,245,278
(3) Disposal of intangible assets 587,760,000 -
(4) Decrease in other assets 2,125,000 37,261,242
2. Cash outflows from investing activities (259,529,791,047) (214,916,442,482)
(1) Increase in other receivables 3,151,174,246 4,970,361,508
(2) Acquisition of property, plant and equipment 183,675,339,056 152,334,264,274
(3) Acquisition of intangible assets 72,703,277,745 57,611,816,700
III. Net cash provided by financing activities (21,359,571,782) 101,389,188,381
1. Cash inflows from financing activities 74,045,193,218 101,754,959,301
(1)Increase in borrowings 73,998,948,993 21,754,956,801
(2)Capital increase with consideration - 80,000,002,500
(3) Government grant 46,244,225 -
2. Cash outflows from financing activities (95,404,765,000) (365,770,920)
(1)Redemption of borrowings 95,404,765,000 -
(2)Stock issuance cost - 365,770,920
IV. Effect of exchange rate changes on cash and cash equivalents
726,675,112 (304,839,211)
V. Net increase in cash and cash equivalents (210,025,524,991) 163,124,290,053
VI. Cash and cash equivalents at the beginning of the period 366,790,832,110 203,666,542,057
VII. Cash and cash equivalents at the end of the period 156,765,307,119 366,790,832,110
33
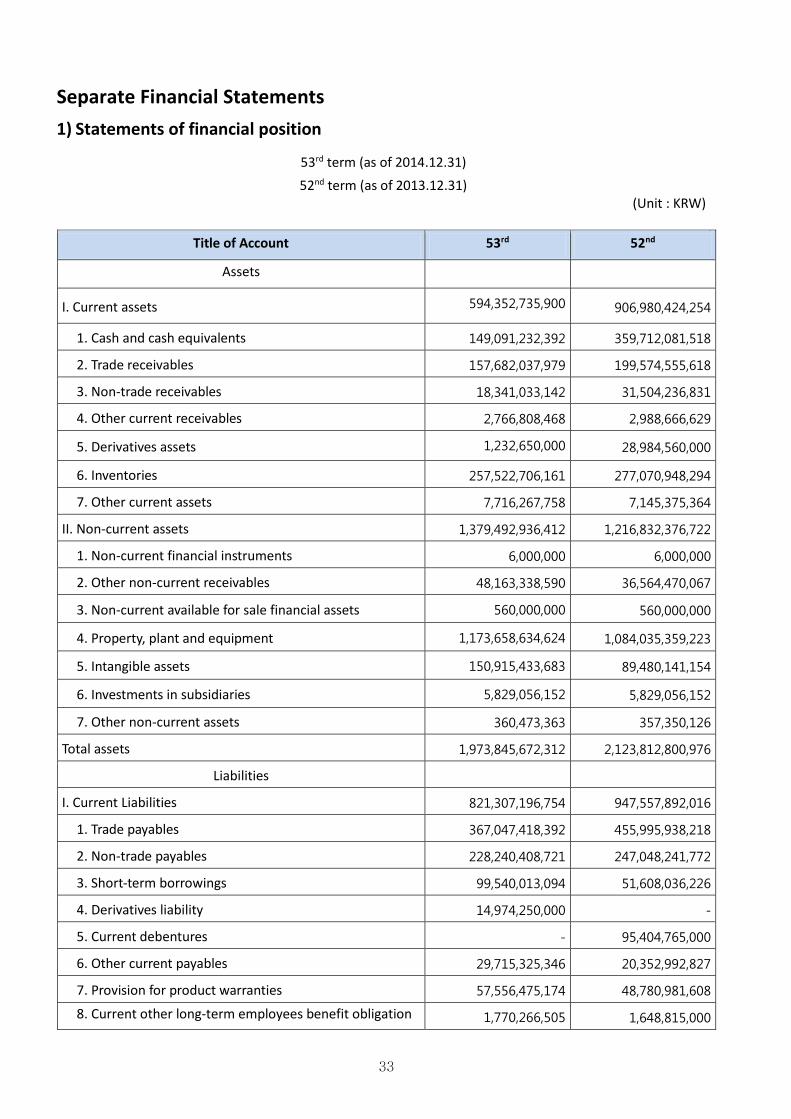
Separate Financial Statements
1) Statements of financial position
53rd term (as of 2014.12.31)
52nd term (as of 2013.12.31) (Unit : KRW)
Title of Account 53rd 52nd
Assets
I. Current assets 594,352,735,900 906,980,424,254
1. Cash and cash equivalents 149,091,232,392 359,712,081,518
2. Trade receivables 157,682,037,979 199,574,555,618
3. Non-trade receivables 18,341,033,142 31,504,236,831
4. Other current receivables 2,766,808,468 2,988,666,629
5. Derivatives assets 1,232,650,000 28,984,560,000
6. Inventories 257,522,706,161 277,070,948,294
7. Other current assets 7,716,267,758 7,145,375,364
II. Non-current assets 1,379,492,936,412 1,216,832,376,722
1. Non-current financial instruments 6,000,000 6,000,000
2. Other non-current receivables 48,163,338,590 36,564,470,067
3. Non-current available for sale financial assets 560,000,000 560,000,000
4. Property, plant and equipment 1,173,658,634,624 1,084,035,359,223
5. Intangible assets 150,915,433,683 89,480,141,154
6. Investments in subsidiaries 5,829,056,152 5,829,056,152
7. Other non-current assets 360,473,363 357,350,126
Total assets 1,973,845,672,312 2,123,812,800,976
Liabilities
I. Current Liabilities 821,307,196,754 947,557,892,016
1. Trade payables 367,047,418,392 455,995,938,218
2. Non-trade payables 228,240,408,721 247,048,241,772
3. Short-term borrowings 99,540,013,094 51,608,036,226
4. Derivatives liability 14,974,250,000 -
5. Current debentures - 95,404,765,000
6. Other current payables 29,715,325,346 20,352,992,827
7. Provision for product warranties 57,556,475,174 48,780,981,608
8. Current other long-term employees benefit obligation 1,770,266,505 1,648,815,000
34
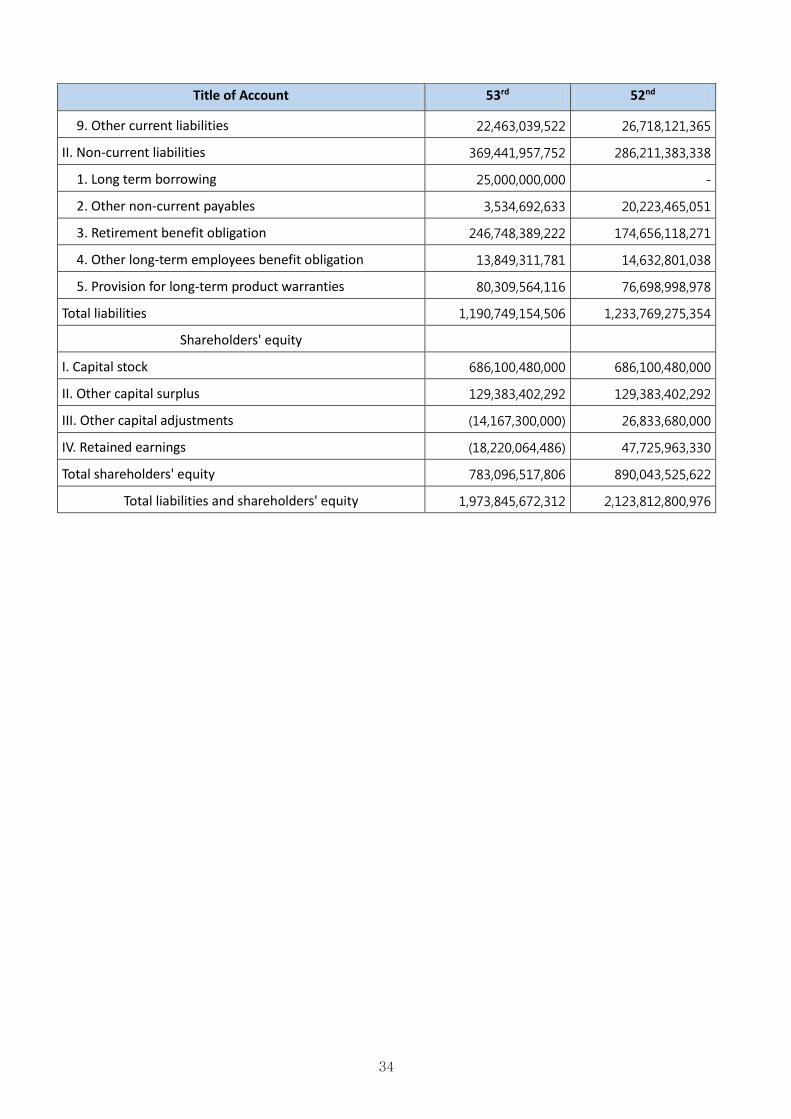
Title of Account 53rd 52nd
9. Other current liabilities 22,463,039,522 26,718,121,365
II. Non-current liabilities 369,441,957,752 286,211,383,338
1. Long term borrowing 25,000,000,000 -
2. Other non-current payables 3,534,692,633 20,223,465,051
3. Retirement benefit obligation 246,748,389,222 174,656,118,271
4. Other long-term employees benefit obligation 13,849,311,781 14,632,801,038
5. Provision for long-term product warranties 80,309,564,116 76,698,998,978
Total liabilities 1,190,749,154,506 1,233,769,275,354
Shareholders' equity
I. Capital stock 686,100,480,000 686,100,480,000
II. Other capital surplus 129,383,402,292 129,383,402,292
III. Other capital adjustments (14,167,300,000) 26,833,680,000
IV. Retained earnings (18,220,064,486) 47,725,963,330
Total shareholders' equity 783,096,517,806 890,043,525,622
Total liabilities and shareholders' equity 1,973,845,672,312 2,123,812,800,976
35
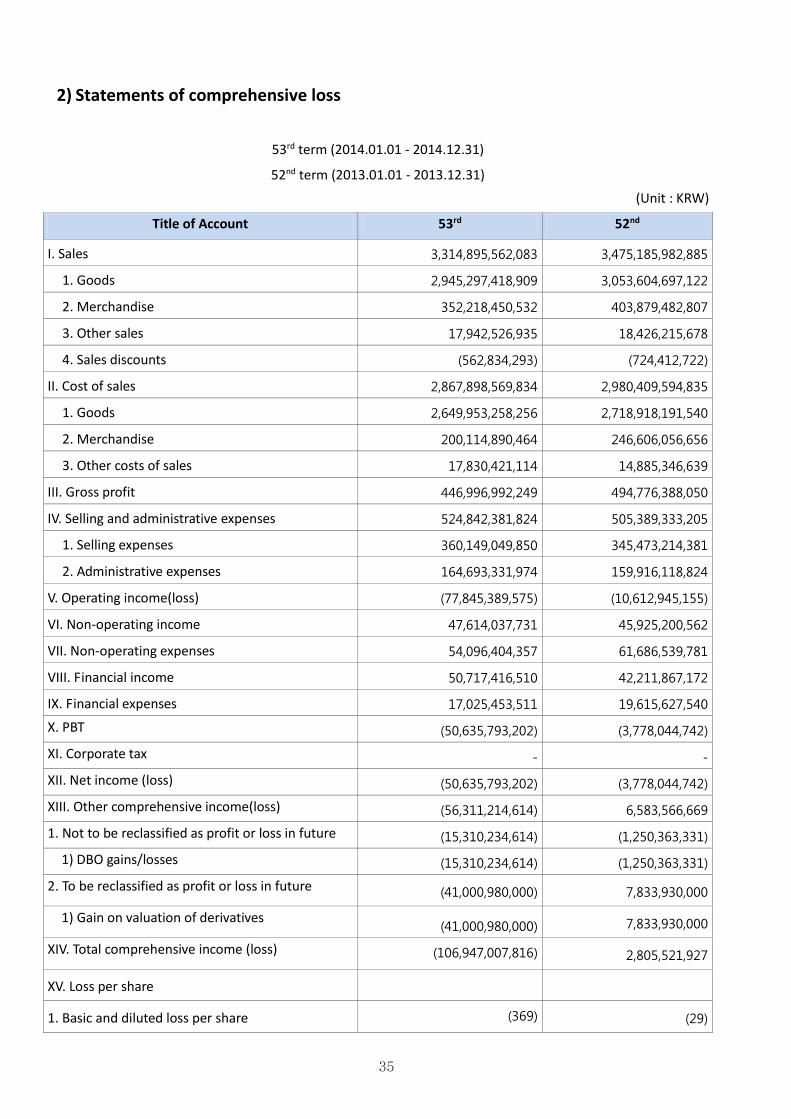
2) Statements of comprehensive loss
53rd term (2014.01.01 - 2014.12.31)
52nd term (2013.01.01 - 2013.12.31)
(Unit : KRW)
Title of Account 53rd 52nd
I. Sales 3,314,895,562,083 3,475,185,982,885
1. Goods 2,945,297,418,909 3,053,604,697,122
2. Merchandise 352,218,450,532 403,879,482,807
3. Other sales 17,942,526,935 18,426,215,678
4. Sales discounts (562,834,293) (724,412,722)
II. Cost of sales 2,867,898,569,834 2,980,409,594,835
1. Goods 2,649,953,258,256 2,718,918,191,540
2. Merchandise 200,114,890,464 246,606,056,656
3. Other costs of sales 17,830,421,114 14,885,346,639
III. Gross profit 446,996,992,249 494,776,388,050
IV. Selling and administrative expenses 524,842,381,824 505,389,333,205
1. Selling expenses 360,149,049,850 345,473,214,381
2. Administrative expenses 164,693,331,974 159,916,118,824
V. Operating income(loss) (77,845,389,575) (10,612,945,155)
VI. Non-operating income 47,614,037,731 45,925,200,562
VII. Non-operating expenses 54,096,404,357 61,686,539,781
VIII. Financial income 50,717,416,510 42,211,867,172
IX. Financial expenses 17,025,453,511 19,615,627,540
X. PBT (50,635,793,202) (3,778,044,742)
XI. Corporate tax - -
XII. Net income (loss) (50,635,793,202) (3,778,044,742)
XIII. Other comprehensive income(loss) (56,311,214,614) 6,583,566,669
1. Not to be reclassified as profit or loss in future (15,310,234,614) (1,250,363,331)
1) DBO gains/losses (15,310,234,614) (1,250,363,331)
2. To be reclassified as profit or loss in future (41,000,980,000) 7,833,930,000
1) Gain on valuation of derivatives (41,000,980,000) 7,833,930,000
XIV. Total comprehensive income (loss) (106,947,007,816) 2,805,521,927
XV. Loss per share
1. Basic and diluted loss per share (369) (29)
36
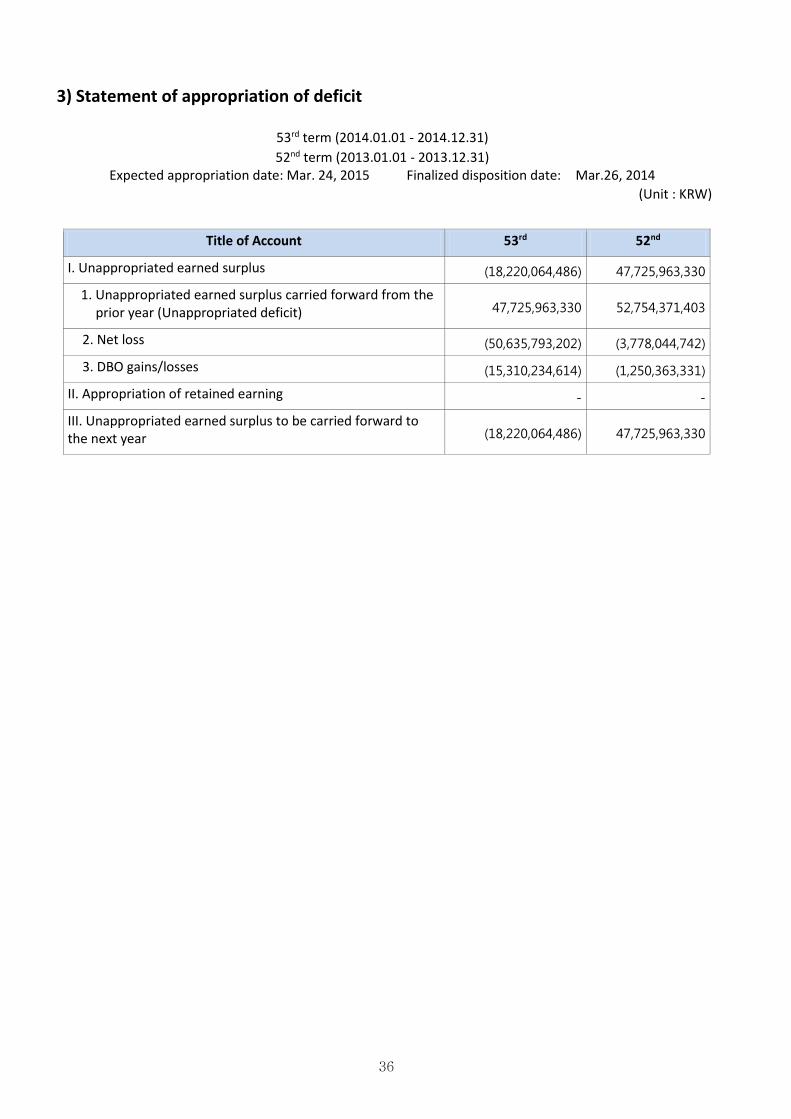
3) Statement of appropriation of deficit
53rd term (2014.01.01 - 2014.12.31)
52nd term (2013.01.01 - 2013.12.31) Expected appropriation date: Mar. 24, 2015 Finalized disposition date: Mar.26, 2014
(Unit : KRW)
Title of Account 53rd 52nd
I. Unappropriated earned surplus (18,220,064,486) 47,725,963,330
1. Unappropriated earned surplus carried forward from the prior year (Unappropriated deficit) 47,725,963,330 52,754,371,403
2. Net loss (50,635,793,202) (3,778,044,742)
3. DBO gains/losses (15,310,234,614) (1,250,363,331)
II. Appropriation of retained earning - -
III. Unappropriated earned surplus to be carried forward to the next year (18,220,064,486) 47,725,963,330
37
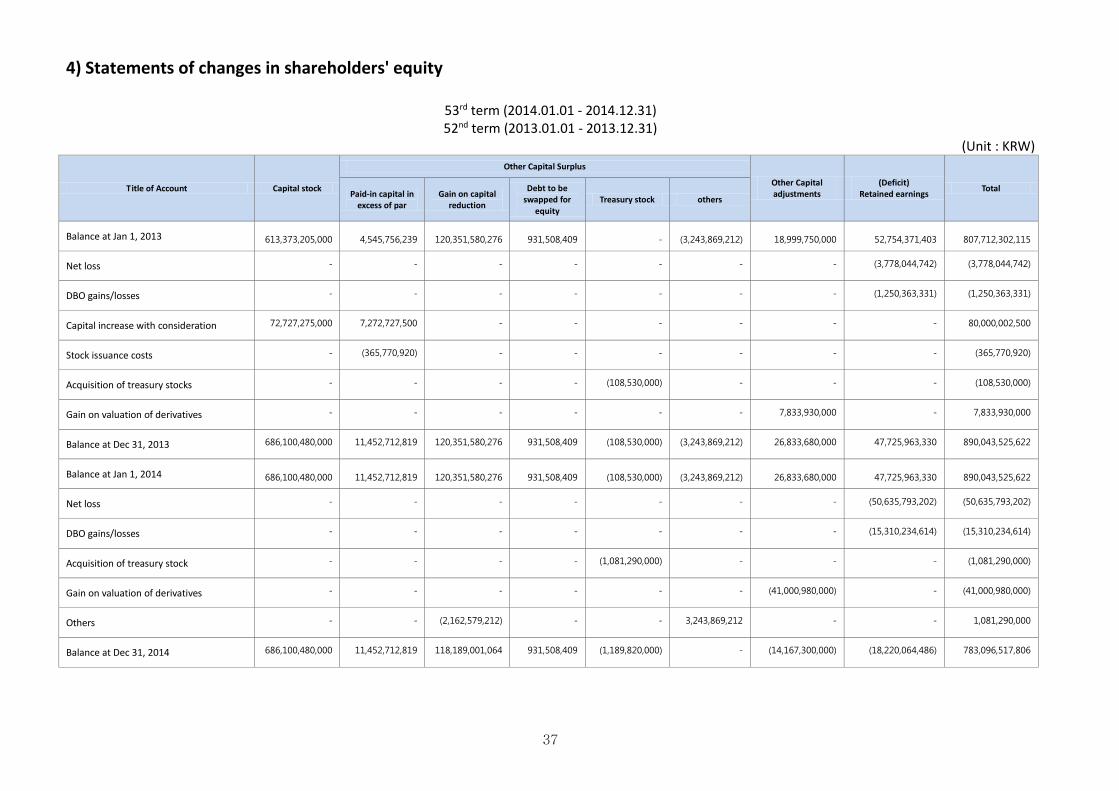
4) Statements of changes in shareholders' equity
53rd term (2014.01.01 - 2014.12.31) 52nd term (2013.01.01 - 2013.12.31)
(Unit : KRW)
Title of Account Capital stock
Other Capital Surplus
Other Capital adjustments
(Deficit) Retained earnings
Total Paid-in capital in
excess of par Gain on capital
reduction
Debt to be swapped for
equity Treasury stock others
Balance at Jan 1, 2013 613,373,205,000 4,545,756,239 120,351,580,276 931,508,409 - (3,243,869,212) 18,999,750,000 52,754,371,403 807,712,302,115 Net loss - - - - - - - (3,778,044,742) (3,778,044,742)
DBO gains/losses - - - - - - - (1,250,363,331) (1,250,363,331)
Capital increase with consideration 72,727,275,000 7,272,727,500 - - - - - - 80,000,002,500
Stock issuance costs - (365,770,920) - - - - - - (365,770,920)
Acquisition of treasury stocks - - - - (108,530,000) - - - (108,530,000)
Gain on valuation of derivatives - - - - - - 7,833,930,000 - 7,833,930,000
Balance at Dec 31, 2013 686,100,480,000 11,452,712,819 120,351,580,276 931,508,409 (108,530,000) (3,243,869,212) 26,833,680,000 47,725,963,330 890,043,525,622
Balance at Jan 1, 2014 686,100,480,000 11,452,712,819 120,351,580,276 931,508,409 (108,530,000) (3,243,869,212) 26,833,680,000 47,725,963,330 890,043,525,622 Net loss - - - - - - - (50,635,793,202) (50,635,793,202)
DBO gains/losses - - - - - - - (15,310,234,614) (15,310,234,614)
Acquisition of treasury stock - - - - (1,081,290,000) - - - (1,081,290,000)
Gain on valuation of derivatives - - - - - - (41,000,980,000) - (41,000,980,000)
Others - - (2,162,579,212) - - 3,243,869,212 - - 1,081,290,000
Balance at Dec 31, 2014 686,100,480,000 11,452,712,819 118,189,001,064 931,508,409 (1,189,820,000) - (14,167,300,000) (18,220,064,486) 783,096,517,806
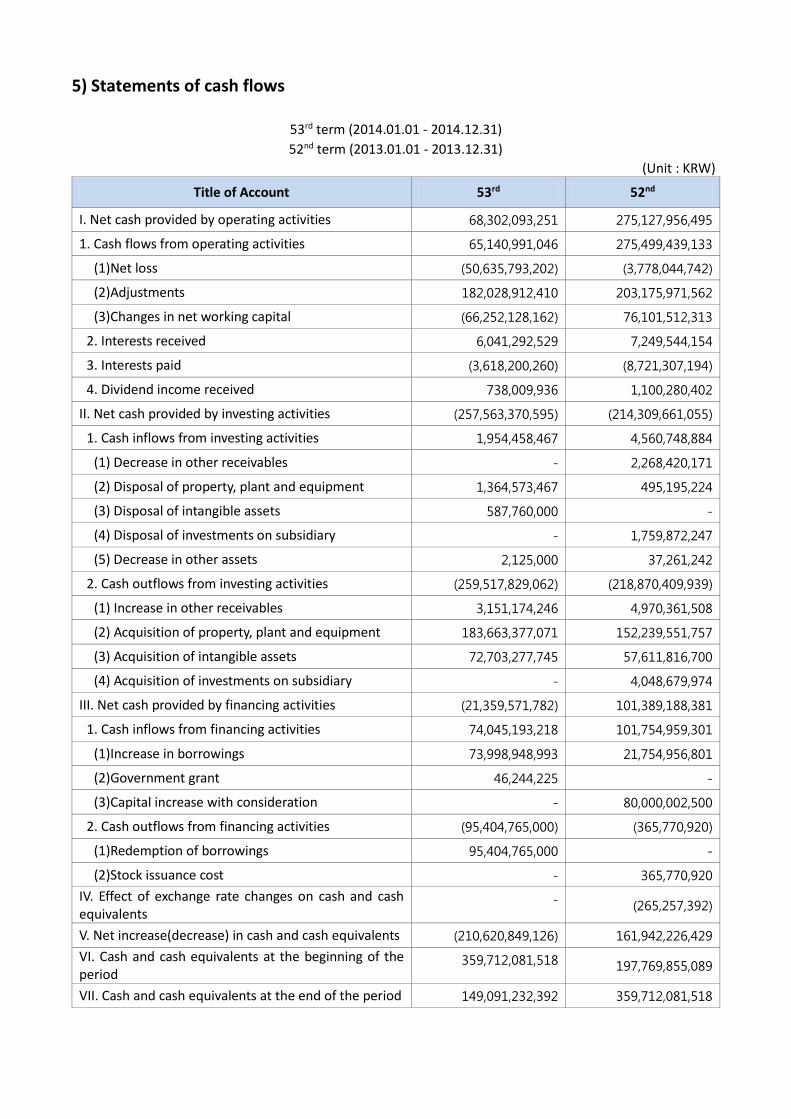
5) Statements of cash flows
53rd term (2014.01.01 - 2014.12.31)
52nd term (2013.01.01 - 2013.12.31)
(Unit : KRW)
Title of Account 53rd 52nd
I. Net cash provided by operating activities 68,302,093,251 275,127,956,495
1. Cash flows from operating activities 65,140,991,046 275,499,439,133
(1)Net loss (50,635,793,202) (3,778,044,742)
(2)Adjustments 182,028,912,410 203,175,971,562
(3)Changes in net working capital (66,252,128,162) 76,101,512,313
2. Interests received 6,041,292,529 7,249,544,154
3. Interests paid (3,618,200,260) (8,721,307,194)
4. Dividend income received 738,009,936 1,100,280,402
II. Net cash provided by investing activities (257,563,370,595) (214,309,661,055)
1. Cash inflows from investing activities 1,954,458,467 4,560,748,884
(1) Decrease in other receivables - 2,268,420,171
(2) Disposal of property, plant and equipment 1,364,573,467 495,195,224
(3) Disposal of intangible assets 587,760,000 -
(4) Disposal of investments on subsidiary - 1,759,872,247
(5) Decrease in other assets 2,125,000 37,261,242
2. Cash outflows from investing activities (259,517,829,062) (218,870,409,939)
(1) Increase in other receivables 3,151,174,246 4,970,361,508
(2) Acquisition of property, plant and equipment 183,663,377,071 152,239,551,757
(3) Acquisition of intangible assets 72,703,277,745 57,611,816,700
(4) Acquisition of investments on subsidiary - 4,048,679,974
III. Net cash provided by financing activities (21,359,571,782) 101,389,188,381
1. Cash inflows from financing activities 74,045,193,218 101,754,959,301
(1)Increase in borrowings 73,998,948,993 21,754,956,801
(2)Government grant 46,244,225 -
(3)Capital increase with consideration - 80,000,002,500
2. Cash outflows from financing activities (95,404,765,000) (365,770,920)
(1)Redemption of borrowings 95,404,765,000 -
(2)Stock issuance cost - 365,770,920
IV. Effect of exchange rate changes on cash and cash equivalents
- (265,257,392)
V. Net increase(decrease) in cash and cash equivalents (210,620,849,126) 161,942,226,429
VI. Cash and cash equivalents at the beginning of the period
359,712,081,518 197,769,855,089
VII. Cash and cash equivalents at the end of the period 149,091,232,392 359,712,081,518