the a2 milk company (a2m) - bell direct · 7 june 2016 the a2 milk company (a2m) easy to stomach...
TRANSCRIPT

7 June 2016
The a2 Milk company (A2M)
Easy to stomach
Recommendation
Buy (Initiation) Price
A$1.38 Target (12 months)
A$1.81 (Initiation)
Analyst
Jonathan Snape 613 9235 1601
Authorisation
Sam Haddad 612 8224 2819
Expected Return
Capital growth 31.9%
Dividend yield 0.0%
Total expected return 31.9%
Company Data & Ratios
Enterprise value A$943.7m
Market cap A$978.0m
Issued capital 711.3m
Free float 100%
Avg. daily val. (52wk) $11.6m
12 month price range $0.46-2.36
GICS sector
Food Beverage and Tobacco
Price Performance
BELL POTTER SECURITIES LIMITED ACN 25 006 390 7721 AFSL 243480
DISCLAIMER AND DISCLOSURES THIS REPORT MUST BE READ WITH THE DISCLAIMER AND DISCLOSURES ON PAGE 23 THAT FORM PART OF IT.
Page 1
(1m) (3m) (12m)
Price (A$) 1.64 1.64 0.47
Absolute (%) -16.16 -15.90 192.55
Rel market (%) -16.36 -24.88 197.15
Background and investment view
The a2 Milk Company (A2M) is in the business of producing, marketing and selling
branded dairy and infant milk formula (IMF) products in Australia, New Zealand, China,
US and UK. A2M branded milk contains only A2 Protein rather than both A1 and A2
proteins which are found in Regular Cows’ Milk. The business model of A2M is to
focus on consumer facing products with a target on the functional food markets where
a premium can be generated. We initiate on A2M with a Buy rating and a $1.81ps
price target. Our favourable view on A2M is supported by: (1) a favourable margin shift
as sales evolve in IMF; (2) exposure to growing demand for imported IMF products in
China; (3) transition of the US and UK businesses from losses to profits; (4) a change
in the NZ business model post 2017 to the advantage of A2M; (5) the potential
expansion of the product portfolio into new products across all regions; and (6)
undemanding valuation metrics relative to other FMCG companies with functional
properties or leverage to infant nutrition markets.
Offshore growth options
In the last three years A2M has entered the fast growing Chinese IMF market,
restructured its UK operations and re-entered the US market. The size of these market
opportunities is large with; (1) the Chinese IMF market worth US$17.8Bn in 2014 (vs.
Australia at A$780m) and growing (+18% pa FY14-19e); and (2) the UK and US fresh
milk markets worth US$48Bn with a premium segment worth $4Bn annually, rivalling
the size of the entire Australian market (worth ~A$4.6Bn). The earnings upside to A2M
from gaining relatively modest market share in these markets is material in our view.
Investment view: Initiate coverage with a Buy rating
A2M looks a business operating within its competitive advantage period, benefiting
from being a first mover in a new functional food category with a degree of IP and
brand protection. In our view A2M is at the infancy of its earnings growth profile,
generating an exception ROIC (44% in FY16e) and strong operating cashflows (from
FY17e) and we initiate coverage on A2M with a Buy rating and a $1.81ps target price.
Absolute Price Earnings Forecast
Year end June 2015 2016e 2017e 2018e
Sales (NZ$m) 155.1 343.0 457.4 526.1
EBITDA (NZ$m) 4.8 47.1 82.8 102.7
NPAT (adjusted) (NZ$m) (0.4) 29.6 55.6 70.0
NPAT (reported) (NZ$m) (2.1) 27.6 55.6 70.0
EPS (adjusted) (NZ cps) (0.1) 4.2 7.5 9.4
EPS growth (%) n.a. n.a. 78.0 26.0
PER (x) n.a. 34.7 19.5 15.5
FCF Yield (%) -1.2 -2.0 3.4 5.7
EV/EBITDA (x) 208.5 21.2 12.1 9.7
Dividend (NZ Cps) 0.0 0.0 0.0 0.0
Franking (%) 0.0 0.0 0.0 0.0
Yield (%) 0.0 0.0 0.0 0.0
ROE (%) 5.4 44.1 65.4 73.7
SOURCE: IRESS SOURCE: BELL POTTER SECURITIES ESTIMATES
$0.0
$0.5
$1.0
$1.5
$2.0
$2.5
Mar 15 Sep 15 Mar 16
A2M S&P 300 Rebased

Page 2
The a2 Milk company (A2M) 7 June 2016
Contents
Background and Investment view ................................................ 3
What is a2 Milk and what’s the difference? ................................. 7
Supply Chain .................................................................................. 8
Patent Protection ......................................................................... 10
Regional and divisional overview ............................................... 11
Financials ..................................................................................... 15
Board and management .............................................................. 18
Major shareholders ...................................................................... 20
Risks ............................................................................................. 21

Page 3
The a2 Milk company (A2M) 7 June 2016
Background and Investment view
COMPANY BACKGROUND
The a2 Milk Company (A2M) was established in NZ in 2000 by Corran McLachlan and is in
the business of producing, marketing and selling branded dairy and infant formula products
in Australia, New Zealand, China, US and UK. A2M branded milk contains only A2 Protein
rather than both A1 Protein and A2 Protein which are found in Regular Cows’ Milk, with a
body of research purporting to support claims that A2 protein is easier to digest and
reduces discomfort of consumers. The A2M business model is to focus on consumer
facing products which tend to be higher margin with a target on the functional foods market
where a premium can be generated. A2M is a pioneer in its field and there are a number of
patents protecting herd testing and branding. A brief divisional overview of A2M is
summarised below.
Figure 1 - A2M operational overview
SOURCE: COMPANY DATA AND BELL POTTER SECURITIES ESTIMATES
Figure 2 - FY16e revenue by region Figure 3 - Revenue growth by product segment
SOURCE: COMPANY DATA AND BELL POTTER SECURITIES ESTIMATES SOURCE: COMPANY DATA AND BELL POTTER SECURITIES ESTIMATES
INVESTMENT THESIS
A2M looks a business still within its competitive advantage period, with the advantage of
being a first mover in a new functional food category and still holding IP and brand
protection. This creates a unique set of circumstances with a company achieving
significant growth in revenues and earnings, while sustaining a ROIC (~45% in FY16e) well
in excess of its cost capital and an exceptionally high level of operating cash generation. In
our view A2M is still in the infancy of its growth profile and as such we initiate coverage on
A2M with a Buy rating and a $1.81ps target price. Our favourable view on A2M is
predicated on:
1.0 Favourable margin shift as sales evolve in IMF: Infant formula sales have grown
from 7% of revenues in FY14 to an estimated 59% in FY16e. We estimate that infant
formula will make up in excess of 60% of revenue in FY17-18e despite growth in the US &
UK milk revenue base and in doing so result in a favourable gross margin shift in the
Australian and Asian businesses where we estimate gross margins can be 30-40% higher
than those generated in fresh milk sales.
1H16 1H16 Market Market size 10yr CAGR Estimated 2015
Sales EBITDA Entry Volume Value Market share
Fresh dairyFresh & long life milk, cream & yoghurt
(under licence to jalna)
~2,500mL ~A$4.6Bn
~NZ$1.4Bn+2.0% 2.2%
IMF Infant and follow on formulas ~25,000t ~A$750m +5.0% pa 11.4%
China 8.40 1.10 IMF Infant and follow on formulas 2013 ~800,000t ~US$19.9Bn +24.0%pa >0.1%
UK Fresh dairy Fresh and long life milk 2012 ~5,500mL GBP3.1Bn +2.5% >0.1%
US Fresh dairy Fresh and long life milk 2015 ~50,000mL US$44.0Bn (0.7%) pa n.a.
2003
Division Category Product
2.90 (8.10)
127.90 34.50Australia & NZ
0%
20%
40%
60%
80%
100%
120%
140%
0.0
100.0
200.0
300.0
400.0
500.0
600.0
700.0
2011 2012 2013 2014 2015 2016 2017 2018 2019
Infant forumla sales ($m) - LHS Fresh dairy sales ($m) - LHS
Revenue growth (%) - RHS

Page 4
The a2 Milk company (A2M) 7 June 2016
2.0 China market opportunity: The Chinese IMF market was worth US$17.8Bn in 2014
and had been growing at +24% pa in the five years preceding this. This growth is expected
to continue with compound growth in demand forecast at +18% pa through to 2019e and
A2M is leveraged to this thematic. A2M already operates aa profitable business on a
modest sales base ($8.6m in 1H16) and even achieving modest market share (in a market
where 30% of product is imported) offers a sizeable opportunity for A2M.
3.0 Evolution of the US and UK businesses: The UK business is expected to be EBIT
cash breakeven status in 4Q16 while the investment in expanding the US market presence
has been accelerated due to the increasing cash generation of the Australian and China
businesses. Combined, these two markets have annual milk sales volumes of 55.6BnL
worth an estimated US$48Bn in turnover and developed premium market segments with
annual turnover of US$4Bn or a figure broadly comparable to the size of the entire
Australian market. Even achieving modest market shares of 1.5% would imply a $20-25m
EBITDA opportunity, a figure we project by FY21e.
4.0 Changing NZ business model: The NZ license with Frescha Valley runs until May
2017 and it is intended that this structure will be collapsed and a similar operating model to
that of Australia be adopted. Sales of a2 branded milk in NZ are the equivalent of 1-2% of
those achieved in Australia and it could be argued that the opportunity for A2M could be
material if the success in Australia could be replicated. The NZ fresh milk market is worth
~NZ$1.4Bn annually and capturing 4-5% market share would translate to sales of NZ$55-
70m and EBITDA of $6.5-11.0m assuming similar margins to those achieved in Australia.
5.0 Expansion of the product portfolio: The portfolio offering of A2M is currently rather
narrow though expanding in the Australian business. In the future we see the potential for
A2M to expand into the $850m sports nutrition market or adult dairy supplements market.
In addition to the scope for new product lines in the Australian business we see the scope
for the existing product range (infant formula, UHT milk, yoghurt and ice cream) to be
expanded into new territories as the core fresh milk market product reaches scale and
brand awareness is achieved.
6.0 Favourable valuation relative to peers: At the headline A2M is trading on a FY17e
EV/EBITDA multiple of 12.1x though excluding the losses generated in the US the multiple
falls to 9.9x. This compares to an average multiple for dairy processors of 10.5x and the
average for FMCG business with organic or functional properties and infant formula
capability of closer to 14.3x. In effect we see the market as capitalising losses in a
business that to our mind is essentially development capex, with the US business EBIT
positive with the exception of the investment currently being made to expand brand
awareness.
TARGET PRICE DETERMINATION
It is rare to find a business generating the level of returns, earnings growth and cash
generation of a stock like A2M. The business is still very much in a competitive advantage
period where earnings growth and returns expansion are strong and as such we see the
stock as still having material earnings growth ahead. In deriving our $1.81ps target price
we have utilised a single stage ROIC model, which looks to capitalise returns twelve
months forward. Major assumptions in this model are:
WACC Drivers: We have assumed an asset beta of 0.75x in line with what we employ in
other listed and dairy processors and consistent with the average for listed FMCG
exposures. Incorporating this with an MRP of 5.5% and risk free rate of 5.0% (with a
borrowing margin of 2.5%) derives a pre-tax WACC of 9.1%.
Growth rate: Our long range earnings forecasts project A2M is capable of generating
compound EBITDA growth of 10% pa for the next 10 years. This is predicated on A2M
achieving market share of 0.2% in the China IMF market, 1.5% market share in the UK
fresh milk market and 1.5% market share in the Californian fresh milk market. Given the

Page 5
The a2 Milk company (A2M) 7 June 2016
above sector medium term growth rate we have adopted a long-term growth forecast of
3.5% in deriving our EV/EBITDA multiple. This exceeds the traditional 3.0% we use for
dairy stocks, which we see as appropriate given we are utilising a single stage growth
model in determining our target price.
Share base and net debt: We have adjusted both our projected FY17e net cash balance
and share capital base to reflect the dilutionary impact of partly paid shares on issue.
A summary of our target price model is summarised below, highlighting a derived target
price of NZ$1.92ps based on FY17e forecasts, or A$1.81ps when translated at the spot
AUDNZD cross rate of 1.06.
Figure 4 - A2M price target derivation
SOURCE: COMPANY DATA AND BELL POTTER SECURITIES ESTIMATES
As a cross check we have also looked at A2M relative to its peer group. While we note the
Australian agricultural and FMCG sector is trading at 9.8x FY17e EBITDA, we note global
dairy stocks are trading at 10.4x and global infant nutrition and function food exposures are
trading at an average of 14.3x.
Figure 5 - A2M peer group comparison
SOURCE: BELL POTTER SECURITIES, BLOOMBERG AND IBESS
Risk Free Rate 5.00% Equity Beta 0.75 Current Share Price 1.38$
Borrowing Margin 2.50% Terminal Growth Rate 3.5% Equity (MV $m) 1022.5
Mkt Risk Premium 5.50% Cost of Debt 7.5% 1H16 net debt (cash) ($m) (6.1)
Asset Beta 0.75 Cost Of Equity 9.1% Shares On Issue 743.6
1H16 Net debt/(net debt+equity) -0.60% WACC 9.1%
ROIC based methodolgy 2015 2016 2017 2018 2019
EBIT 2.9 44.3 80.0 99.9 134.6
Invested Capital 52.5 100.6 122.2 135.5 147.2
ROIC (%) 5.4% 44.1% 65.4% 73.7% 91.4%
long-term growth rate 3.0% 3.5% 3.5% 3.5% 3.5%
Pre-tax WACC (%) 9.1% 9.1% 9.1% 9.1% 9.1%
Depreciation 1.9 2.8 2.8 2.8 2.8
EBITDA 4.8 47.1 82.8 102.7 137.3
Derived EV/EBITDA 4.35 15.44 16.30 16.52 16.79
Implied Enterprise Value 20.9 727.5 1349.1 1695.7 2306.6
Net cash (debt) 27.2 61.2 117.9 202.0
Cash due from options & PPS 20.4 20.4 20.4 20.4
Implied market value 775.1 1430.6 1834.0 2529.0
Adjusted shares on issue 743.6 743.6 743.6 743.6
Valuation per share (A$ps) 1.04 1.92 2.47 3.40
AUDNZD 1.06 1.06 1.06 1.06
Target price (A$ps) 0.98 1.81 2.33 3.21
Stock
Code 2016 2017 2018 2016 2017 2018
Bellamy's Australia Ltd BAL.AU 10.97 97 1,060 (38) 1,023 52 90 119 19.7 11.3 8.6
Bega Cheese BGA.AU 6 153 916 75 990 64 79 87 15.4 12.5 11.4
Capilano Honey CZZ.AU 21.1 9 200 16 216 18 21 23 12.2 10.5 9.5
Freedom Foods FNP.AU 3.86 181 697 (12) 685 24 35 47 29.1 19.4 14.6
Fonterra Shareholders Fund FSF.AU 5.3 1,599 8,475 6,119 14,595 1,944 1,954 2,106 7.5 7.5 6.9
Huon Acquaculture HUO.AU 3.2 87 279 76 356 18 51 65 20.1 7.0 5.5
MG Unit Trust MGC.AU 1.00 555 555 392 947 143.4 156.3 166.3 6.6 6.1 5.7
Ridley Corporation RIC AU 1.37 308 422 59 480 56 63 66 8.6 7.7 7.2
Select Harvests SHV.AU 7.28 73 531 52 583 57.2 55.1 58.5 10.2 10.6 10.0
Synlait SML NZ 3.05 146 446 268 714 80 91 98 9.0 7.9 7.3
Tassal Group TGR.AU 4.21 147 620 128 748 87.5 96.7 106.3 8.5 7.7 7.0
Austrlian & NZ FMCG and agri-processors 13.4 9.8 8.5
Abbott Laboratories ABT US 39.18 1,469 57,561 3,099 60,661 5,229 5,627 6,077 11.6 10.8 10.0
Bega Cheese BGA AU 6 153 916 60 976 67 79 89 14.5 12.4 11.0
Beingmate Baby & Child Food Co 002570 CH 13.16 1,023 13,456 (444) 13,012 380 432 708 34.3 30.1 18.4
Bellamy's Australia BAL AU 10.97 97 1,060 (38) 1,023 52 90 119 19.7 11.3 8.6
Biostime International Holdings 1112 HK 24.75 630 15,600 4,370 19,970 1,648 1,772 1,936 12.1 11.3 10.3
China Mengnui Dairy Co 2319 HK 13.32 3,919 52,205 886 53,090 4,391 4,848 5,351 12.1 11.0 9.9
Danone SA BN FP 62.87 656 41,236 7,028 48,264 3,863 4,120 4,385 12.5 11.7 11.0
Mead Johnson Nutrition Co MJN US 83.21 187 15,532 1,501 17,033 1,061 1,126 1,193 16.1 15.1 14.3
Nestle SA NESN VX 73.35 3,188 233,869 13,954 247,823 17,391 18,347 19,319 14.2 13.5 12.8
Yashili International Holdings 1230 HK 1.71 4,746 8,115 (2,476) 5,639 315.9 456.2 577.4 17.9 12.4 9.8
Global Infant nutrition exposures 16.5 13.9 11.6
Bellamy's Australia Ltd BAL AU 10.97 97 1,060 (38) 1,023 52 90.5 119.0 19.7 11.3 8.6
Freedom Foods FNP AU 3.86 181 697 (12) 685 24 35.4 46.8 29.1 19.4 14.6
Mead Johnson Nutrition Co MJN US 83.21 187 15,532 1,501 17,033 1,061 1,126.2 1,193.0 16.1 15.1 14.3
WhiteWave Foods Co WWAV US 45.87 177 8,115 2,015 10,130 581 658.8 746.7 17.4 15.4 13.6
Global functional Food exposures 20.6 15.3 12.8
Austrlian & NZ FMCG and agri-processors 13.4 9.8 8.5
Global Dairy 12.1 10.5 9.7
Global Infant nutrition exposures 17.7 14.3 11.9
Enterprise
Value ($m)
EV/EBITDA (x)EBITDA ($m)Share Price
($ps)
Shares Out
(m)
Market Cap
($m)
Net
Debt/(Cash)
Page 6
The a2 Milk company (A2M) 7 June 2016
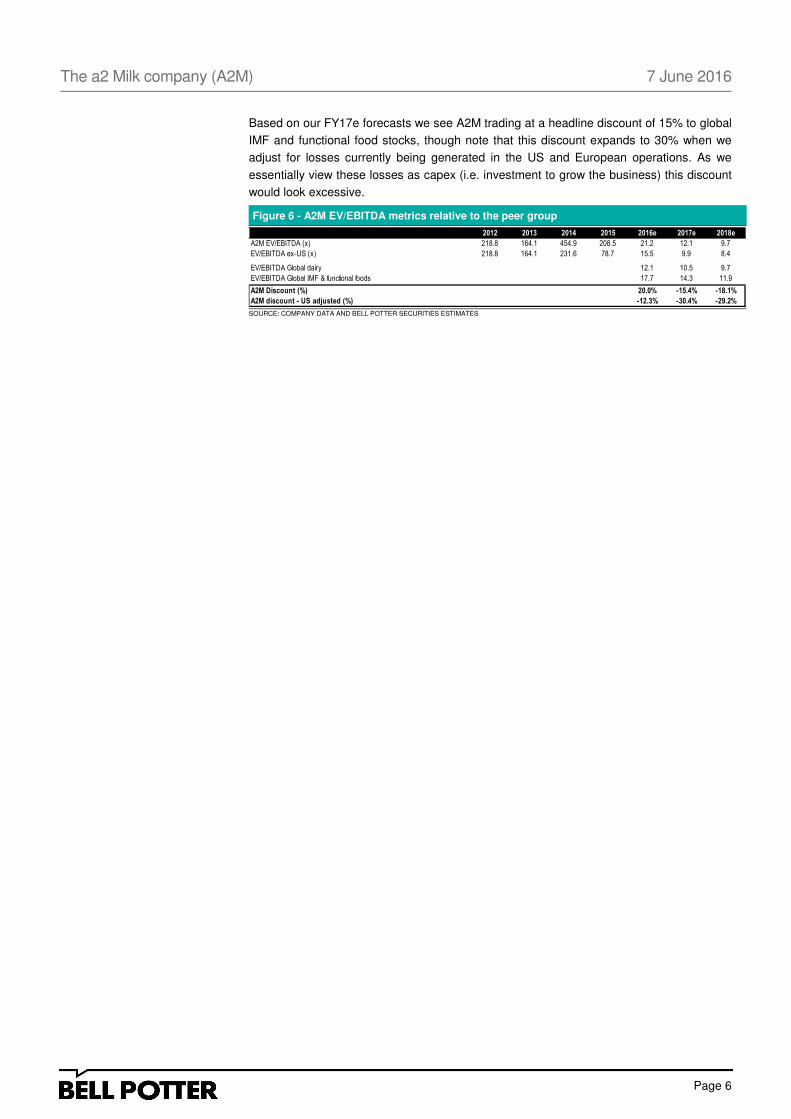
Based on our FY17e forecasts we see A2M trading at a headline discount of 15% to global
IMF and functional food stocks, though note that this discount expands to 30% when we
adjust for losses currently being generated in the US and European operations. As we
essentially view these losses as capex (i.e. investment to grow the business) this discount
would look excessive.
Figure 6 - A2M EV/EBITDA metrics relative to the peer group
SOURCE: COMPANY DATA AND BELL POTTER SECURITIES ESTIMATES
2012 2013 2014 2015 2016e 2017e 2018e
A2M EV/EBITDA (x) 218.8 164.1 454.9 208.5 21.2 12.1 9.7
EV/EBITDA ex-US (x) 218.8 164.1 231.6 78.7 15.5 9.9 8.4
EV/EBITDA Global dairy 12.1 10.5 9.7
EV/EBITDA Global IMF & functional foods 17.7 14.3 11.9
A2M Discount (%) 20.0% -15.4% -18.1%
A2M discount - US adjusted (%) -12.3% -30.4% -29.2%

Page 7
The a2 Milk company (A2M) 7 June 2016
What is a2 Milk and what’s the difference?
Regular cows milk contains two main types of beta-casein proteins (~30% of the total
protein content of milk), A2 Protein and A1 Protein. A2 branded milk is comparable to
generic milk in all regards with the exception that it contains only A2 Protein.
Figure 7 - a2 Milk vs. generic white milk
SOURCE: COMPANY DATA
Research has shown that A1 and A2 proteins digest differently, with studies showing that a
seven-amino peptide (beta-casomorphin-7 or BCM-7) can be cut away from the A1 protein
by digestive enzymes. There have been several studies attempting to link BCM-7 with a
number of illnesses such as: Type 1 diabetes, heart disease, SIDS and autism, though
none have proved conclusive. However, there is growing evidence that A1 protein may
effect digestive function and cause digestive discomfort.
In 2014 Curtin University conducted the first human digestion clinical trial testing the A1
and A2 proteins. The Nature Publishing Group published the research in the Journal of
Clinical Nutrition. The results showed people who consumed the A2 protein were less
susceptible to bloating and other stomach aches than those who consumed the A1 protein
and this would look consistent with the marketing claim of a2 Milk.

Page 8
The a2 Milk company (A2M) 7 June 2016
Supply Chain
A2M products are produced through a scalable supply chain model, which commences
with milk supply. The supply chain model has been developed in Australia for fresh milk
and in New Zealand for infant formula and is the template which will be rolled out globally.
A2M has focused its investment in sales, marketing and brand development and typically
looks to outsource the processing aspect of the supply chain, unless there is a strategic
rational for the investment (ie. the Smeaton Grange facility in NSW).
Figure 8 - a2 Milk supply chain in Australian fresh milk
SOURCE: COMPANY DATA
Australia & NZ Supply chain model: A2M sources milk for the Australian market from
certified local dairy farms. The cows are tested by an A2M certified genetic testing
laboratory and only those animals that test positive to naturally producing milk containing
A2 Protein and not A1 Protein are isolated to form a herd. The cows’ genotyping result is
recorded and monitored through an A2M implemented cow tracking system which follows
their movements in and out of the herd. Testing of the milk from the farm is conducted to
validate that it is A1 Protein Free prior to a2MC certifying that the herd is fit for production.
Milk is transported by contractors to either A2M’s processing facility, Smeaton Grange, or
one of A2M’s third party contracted processing facilities.
The Smeaton Grange facility commenced operation in February 2012 and was designed
as a purpose built liquid fresh milk facility. In addition, A2M uses a number of independent
milk processors who process and pack a proportion of A2M’s total Australian requirements
under formal contract packing agreements. a2 Platinum infant formula is processed and
packaged by Synlait in New Zealand. It is then distributed by contractors to retailer
warehouses and pharmacy wholesalers for distribution to individual stores.
China supply chain model: a2 Platinum infant formula is processed and packaged by
Synlait under a formal manufacturing agreement that utilises milk sourced from A2M
certified dairy farms in New Zealand. Synlait operates a facility in Canterbury (New
1. Milk Supply
Milk sourced from segregated dairy herds.
• Farm selection procedures• Assist selected farmers to
implement breeding and herd formation / maintenence procedures
• Require Farmers to implement breeding and herd maintenence procedure to maintan milk supply integrity.
• Require milk to be validated as A1 Protein Free prior to being accepted into the supply pool
2. Processing
Milk processed as a2MC facilities or contracted third
party facilities
• Milk transported in segregated tankers
• Milk stored in isolated vats to meet product quality tests
• a2MC has a processing facility in NSW, Australia
• Addtional capacity at contracted third party processors who meet strict a2MC quality control standards
4. Retail/consumer
Products sold in supermarkets, petrol staions and convenience stores, cafes and pharmacies
• a2MC contracts with major supermarket chains and retail outlets
• Education initiatives target healthcare professionals and consumers
• a2MC invest in brand and trade mark portfolio to build consumer awareness
3. Distribution
Contractors distribute products from processing
facilities to outlets / wholesalers
• a2MC contracts with third party prov iders, distributors (incl. warehousing) and wholesalers
• a2MC maintains quality control standards for product storage and delivery
The a2 Milk Company value creation
a2MC advanced testing and record keepinga2MC maintains control of the testing and record keeping processes• Cow tracking systems• Record cows' genotypeing result and monitor their movements in / out of a herd• Strategic relations with third party laboratories to identify cows who produce A1 Protein Free milk

Page 9
The a2 Milk company (A2M) 7 June 2016
Zealand) that allows full manufacturing and packaging control from sourcing and collection
of certified A1 Protein Free milk through to manufacturing and packaging of a2 Platinum
infant formula. In 2012, A2M appointed China State Farm (CSF) as the exclusive
distributor of a2 Platinum for China. In November 2014, this relationship was amended so
that CSF became the exclusive import agent for a2 Platinum into mainland China. A2M
does not operate a trading subsidiary in China and receives payment for products imported
into China in USD or NZD.
UK Supply chain: A2M sources its supply of A1 Protein Free milk from certified farms in
the UK. A2m has achieved a growing distribution network throughout the UK with a2MC
branded milk being sold in leading supermarkets including Tesco, Waitrose, Morrisons,
Ocado (online supermarket) and more recently J Sainsbury. Products will also commence
being sold in Wholefoods and with an additional wholesaler and distributor, Marigold, from
early 2015. The Company is currently selling solely fresh milk in the UK

Page 10
The a2 Milk company (A2M) 7 June 2016
Patent Protection
A2M’s intellectual property portfolio consists of a numbers of rights in trademarks, patents,
proprietary processes and know-how which together interlock and provide protection to a2
branded products and processes. A2M has brand and trademark registrations or
applications across 57 territories (as at Dec’15). In addition A2M has 14 families of patents
which cover a number of activities including herd testing, herd formation, beneficial uses
and physical properties associated with A2 products. The table below details all publically
disclosed patents by A2M, though we note there are ~5 new families of patent applications
lodged since this list was provided where details have not been released. Our
understanding is these patents are largely focused around the benefits of A1 protein free
products.
Figure 9 - a2 Milk supply chain in Australian fresh milk
SOURCE: COMPANY DATA
In Nov’15 arguably one of the more important elements of the patent protection expired in
New Zealand, which was the method for testing milk for the presence of A1 Protein, this
patent will remain in place in the US until 2017. In practice the patent was co-owned with
Fonterra and the fact that Fonterra had never pursued an A1 protein free product range
suggests that there is more protection in place for the a2 range than simply one patent. We
suspect the more important element of the protection is likely around the herd testing and
selection protections, with one of these patents lasting through to 2023.
Patent title Expiry Territories
Method of Selecting Non-Diabetogenic Milk or Milk
Products and Milk or Milk Products so Selected3 November 2015 Australia, Canada, Finland, Ireland, Netherlands, New Zealand, Norway, UK, USA
Food Product and Process, Bovine Genotype Testing
for Beta-Caseins Breeding and Milking Cows for Milk
Free of Beta-Casein A1
9 May 2016Australia, Austria, Belgium, Canada, Denmark, Finland, France, Germany, Ireland,
Italy, Netherlands, New Zealand, Sweden, Switzerland, UK, USA
Prophylactic Dietary Supplement Based on Milk 29 June 2020 Australia, China, New Zealand
Animal Genotyping Method 23 May 2023Australia, Canada, China, Hong Kong, India, Japan, New Zealand, Singapore,
South Korea, USA, Vietnam
Method for Altering Fatty Acid Composition of Milk 3 July 2023Australia, Canada, China, Hong Kong, India, Japan, New Zealand, Singapore,
South Korea, USA, Vietnam
Therapeutic Uses of Beta-Casein A2 and Dietary
Supplement Containing Beta-Casein A2
A Composition Comprising Beta-Casein
3 October 2023
Canada, China, Czech Republic, Denmark, Finland, France, Germany, Hong
Kong, India, Ireland, Italy, Japan, the Netherlands, New Zealand, Singapore, South
Korea, Spain, Sweden, Switzerland, UK, Vietnam
Beta-Casein A2 and Prevention of Inflammation of the
Bowel20 May 2034 International (PCT) Application – Territories to be nominated
Beta-Casein A2 and Reducing or Preventing Symptoms
of Lactose Intolerance10 July 2034 International (PCT) Application – Territories to be nominated
Beta-Casein A2 and Blood Glucose Levels 22 August 2034 International (PCT) Application – Territories to be nominated

Page 11
The a2 Milk company (A2M) 7 June 2016
Regional and divisional overview
AUSTRALIA AND NEW ZEALAND
Australia and New Zealand represents ~90% of group revenues with the majority of this
derived in the Australian market, with the A2M’s NZ presence hamstrung by a licensing
agreement with Fresha Valley that remains in place until May’17 (and generates less than
$200k in annual royalties for the group). The Australian operations were established in
2003, initially via license distribution agreements (with Freedom Foods in 2007 and Jalna
for yoghurt products in 2009) before A2M commissioned its own production facility in
Sydney in 2012. In 2013 A2M launched infant nutrition products under the ‘a2 Platinum
brand’ with an extension into cream shortly after in 2014. The products have been
incredibly successful in Australia with A2M now accounting for 9.3% of the fresh milk
market (supermarket sales) and 16.7% of the infant nutrition market (supermarket and
pharmacy sales).
Australian Fresh milk: The milk market in Australia is estimated to be worth ~$4.6Bn
annually and been experiencing compound growth of +2%pa over the last decade (in
volume terms). The majority of milk is sold via supermarkets (~53% of sales) with private
label products making up ~28% of the market (in volume terms). Since its inception we
estimate that A2M has managed to capture ~2.2% of the market by volume and ~4.5% by
value. A2M products typically attracting ~5% premium to other branded products on shelf
and ~145% to private label and are targeted at a market quite distinct from generic milk
buyers. After early success, market share growth has slowed to 10-20bp annually over the
last three years. In essence A2M branded products are exceeding system growth and we
expect that to remain a feature in the near term.
Figure 10 - Drinking milk sales volumes by category (mL) Figure 11 - a2 branded milk sales
SOURCE: DAIRY AUSTRALIA SOURCE: COMPANY DATA AND BELL POTTER SECURITIES ESTIMATES
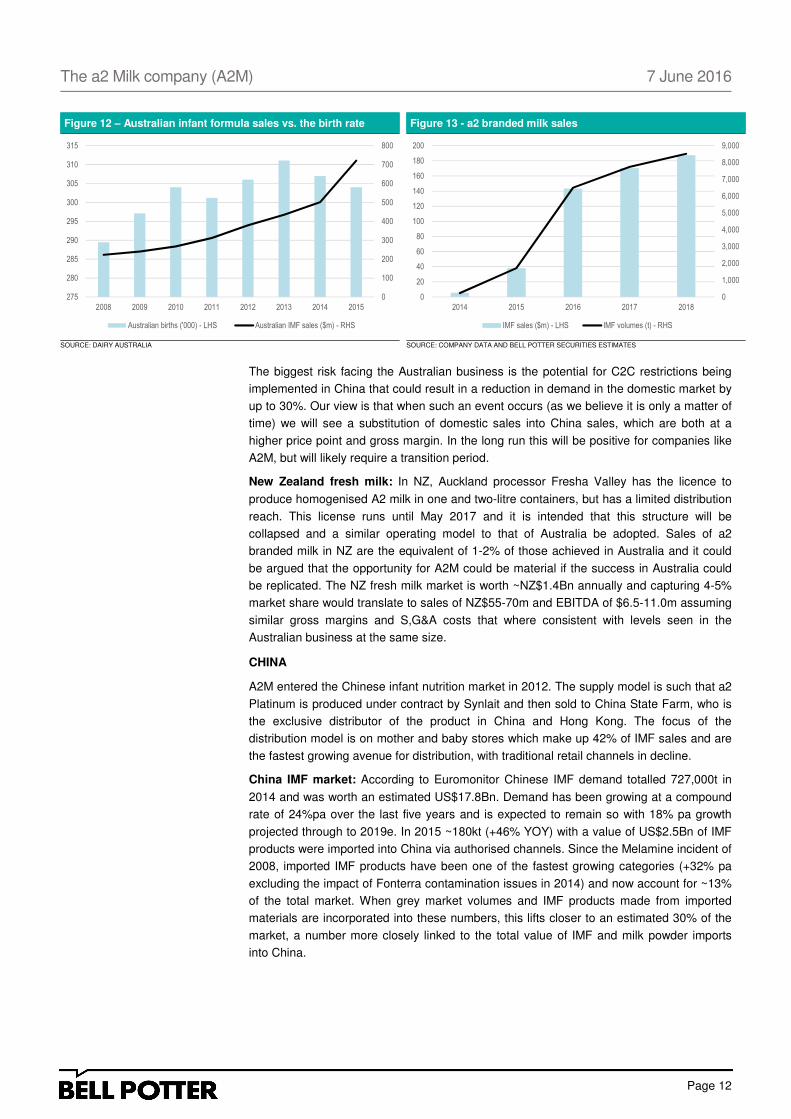
Infant Nutrition: The Australian infant nutrition (IMF) market is estimated to be worth
~$780m in retail sales value annually and has been growing at a compound rate of
+17.5%pa since 2008. This growth rate is well in excess of what we would consider the
underlying growth rate in demand as dictated by the combination of: the birth rate (+0.7%
pa); inflation (+2.5% pa) and declining breast feeding rates (~6% decline between the
2008-10 breastfeeding surveys). The emergence of C2C trading in China has facilitated a
grey market in IMF products which we estimate now makes up just under 30% of demand
at ~A$200m annually and looked to grow almost four fold in 2015.
From a standing start in 2013 A2M has grown to ~16.7% market share in the supermarket
and pharmacy channels, with estimated annualised sales of $150m in 1H16 (and a Dec’15
annualised rate of ~$240m). Moving forward we expect the rate of growth to slow from
current rates, resulting in more modest revenue gains for the business.
0
500
1000
1500
2000
2500
3000
2000 2002 2004 2006 2008 2010 2012 2014
Fresh Flavoured UHT
FY00-15 CAGR: +2.0% p.a.5YR CAGR: +1.9% p.a.
0
10
20
30
40
50
60
70
80
0
20
40
60
80
100
120
140
160
2011 2012 2013 2014 2015 2016 2017 2018
Fresh milk sales ($m) - LHS Estaimted milk volume sales (mL) - RHS
Page 12
The a2 Milk company (A2M) 7 June 2016
Figure 12 – Australian infant formula sales vs. the birth rate Figure 13 - a2 branded milk sales
SOURCE: DAIRY AUSTRALIA SOURCE: COMPANY DATA AND BELL POTTER SECURITIES ESTIMATES
The biggest risk facing the Australian business is the potential for C2C restrictions being
implemented in China that could result in a reduction in demand in the domestic market by
up to 30%. Our view is that when such an event occurs (as we believe it is only a matter of
time) we will see a substitution of domestic sales into China sales, which are both at a
higher price point and gross margin. In the long run this will be positive for companies like
A2M, but will likely require a transition period.
New Zealand fresh milk: In NZ, Auckland processor Fresha Valley has the licence to
produce homogenised A2 milk in one and two-litre containers, but has a limited distribution
reach. This license runs until May 2017 and it is intended that this structure will be
collapsed and a similar operating model to that of Australia be adopted. Sales of a2
branded milk in NZ are the equivalent of 1-2% of those achieved in Australia and it could
be argued that the opportunity for A2M could be material if the success in Australia could
be replicated. The NZ fresh milk market is worth ~NZ$1.4Bn annually and capturing 4-5%
market share would translate to sales of NZ$55-70m and EBITDA of $6.5-11.0m assuming
similar gross margins and S,G&A costs that where consistent with levels seen in the
Australian business at the same size.
CHINA
A2M entered the Chinese infant nutrition market in 2012. The supply model is such that a2
Platinum is produced under contract by Synlait and then sold to China State Farm, who is
the exclusive distributor of the product in China and Hong Kong. The focus of the
distribution model is on mother and baby stores which make up 42% of IMF sales and are
the fastest growing avenue for distribution, with traditional retail channels in decline.
China IMF market: According to Euromonitor Chinese IMF demand totalled 727,000t in
2014 and was worth an estimated US$17.8Bn. Demand has been growing at a compound
rate of 24%pa over the last five years and is expected to remain so with 18% pa growth
projected through to 2019e. In 2015 ~180kt (+46% YOY) with a value of US$2.5Bn of IMF
products were imported into China via authorised channels. Since the Melamine incident of
2008, imported IMF products have been one of the fastest growing categories (+32% pa
excluding the impact of Fonterra contamination issues in 2014) and now account for ~13%
of the total market. When grey market volumes and IMF products made from imported
materials are incorporated into these numbers, this lifts closer to an estimated 30% of the
market, a number more closely linked to the total value of IMF and milk powder imports
into China.
0
100
200
300
400
500
600
700
800
275
280
285
290
295
300
305
310
315
2008 2009 2010 2011 2012 2013 2014 2015
Australian births ('000) - LHS Australian IMF sales ($m) - RHS
0
1,000
2,000
3,000
4,000
5,000
6,000
7,000
8,000
9,000
0
20
40
60
80
100
120
140
160
180
200
2014 2015 2016 2017 2018
IMF sales ($m) - LHS IMF volumes (t) - RHS

Page 13
The a2 Milk company (A2M) 7 June 2016
Figure 14 – China IMF shares - 2014 Figure 15 – China demand growth in IMF
SOURCE: NIELSON SOURCE: EUROMONITOR
There has been a period of consolidation among Chinese and multi-national producers
which now sees the top four producers accounting for 48% of the market (2014) and the
top 10 accounting for 80%. Distribution of IMF product is by three main sources with baby
stores and e-commerce the fastest growing source of product (at the expense of traditional
retailers). A2M has initially targeted baby stores for distribution and this market tends to
have a higher exposure to premium priced (>RMB250 per 800 gram tin) IMF products
relative to traditional retailers.
Figure 16 – China IMF sales by distribution channel Figure 17 – Sales mix through baby stores
SOURCE: NIELSON SOURCE: SYNUTRA
The evolution of the A2M business is in its infancy, yet the business is already profitable at
what could be considered a modest level of sales (1H16 sales of $8.6m). Gross margins in
china tend to be higher than those generated in the Australian business on the back of
higher average price points. In the future A2M plans on marketing milk products from
Australia into the China market, with UHT and fresh milk recently launched in the China
market.
UK AND US
The UK and US markets represent growth potential for A2M with the operations in both
markets commenced in the last five years and only consolidated to 100% company
ownership in the last two years. Combined these two markets have annual milk sales
volumes of 55.6BnL worth an estimated US$48Bn in turnover. The market positioning of
A2M is in the premium end of the markets, a sector worth in excess of US$4Bn annually or
comparable to the size of the Australian market in its entirety. At the commencement of its
strategy there is in our view a very real chance to double the size of the company.
UK fresh milk market: A2M entered the UK market in 2011, through a JV with Robert
Wiseman Dairies (RWD). Following the sale of the RWD in 2012 and a slower than
0.0
5.0
10.0
15.0
20.0
25.0
30.0
35.0
40.0
45.0
2009 2010 2011 2012 2013 2014 2015e 2016e 2017e 2018e 2019e
Stage 1 Stage 2 Stage 3 Stage 4
Baby stores42%
e-commerce24%
Traditional retail34%
Super premium18%
Premium21%
Upper-mid51%
Mid-Low10%

Page 14
The a2 Milk company (A2M) 7 June 2016
expected market acceptance of the product the agreement was restructured with A2M
acquiring the 50% of the UK business it didn’t already own. Since that time A2M has
entered an agreement with RWD for the processing and distribution of A2M branded
products with marketing and promotional activity directly taken on by A2M. In FY14 A2M
generated revenue of GBP1.0m and an EBITDA loss of GBP2.2m. Management is
targeting a breakeven EBITDA monthly run rate by end FY16e, with a positive earnings
contribution from FY17e.
The UK fresh milk market is worth ~GBP3.0Bn annually with ~5.5BnL of milk consumed.
Demand growth has been effectively static for the last deade. Since acquiring the
operations from RWD A2M has repositioned the brand from conventional dairy to the
premium segment of the market, which we estimates is ~13% of the market and worth an
estimated GBP390m in annual turnover. Our current forecasts have A2M capturing ~5% of
the specialty milk market by FY18 and generating ~A$6m EBITDA at this level. If A2M can
capture a similar share to that generated in Australia then this would lift towards a A$30m
EBITDA contributor, which would require the business to effectively supplant ~20% of the
filtered market segment.
US fresh milk market: Following a false start in 2003, A2M entered the fresh milk market
in the US in 2014 via a 100% owned subsidiary. The business entered the west coast, via
California, in 2015 and is currently investing to expand the business. The US fresh milk
market is a 50.1BnL market, worth an estimated US$44Bn. The Californian market in its
own right is a 22BnL market, worth an estimated US$19Bn, with the latter the market that
A2M has initially entered. The opportunity in the US market is significant with an approach
anywhere near Australian market share levels implying a material uplift in A2M earnings.

Page 15
The a2 Milk company (A2M) 7 June 2016
Financials
PROFIT AND LOSS
We are projecting a material acceleration in revenues and earnings over the next three
years on the back of: a transition in the Australian business towards higher margin IMF
products; an acceleration in revenue growth in an already profitable China IMF business;
and as losses are reduced in the US & UK businesses (as revenues growth accelerates
and overheads are absorbed). In aggregate we are projecting compound revenue growth
of +49% pa over FY15-19e, fuelling compound growth in EBITDA of +165% pa and
material lift in NPAT from losses. A large portion of this growth is achieved in FY16e with
current guidance for revenues of NZ$335-350m and operating EBITDA of NZ$45-49m.
Figure 18 - A2M summary profit and loss (NZ$m unless stated otherwise)
SOURCE: COMPANY DATA AND BELL POTTER SECURITIES ESTIMATES
Material assumptions in deriving our earnings forecasts are detailed below:
1. Transition to higher margin IMF products in Australia and China: We estimate
gross margins in the Australian & China IMF business are ~30-35% higher than those
generated in the fresh milk business. As growth in the IMF business units outpaces growth
rates in the ANZ fresh milk business we expect to see a favourable shift in EBITDA
margins. This transition in gross margin is now clearly on display with the 1H16 gross
margin of 41% well in excess of FY15 levels of 35% and in our view entirely reflective of
the change in earnings composition from fresh milk to IMF.
Figure 19 – Changing revenue contribution of A2M Figure 20 – IMF gross margins B2C
SOURCE: COMPANY DATA AND BELL POTTER SECURITIES ESTIMATES SOURCE: COMPANY DATA AND BELL POTTER SECURITIES ESTIMATES
2011 2012 2013 2014 2015 2016e 2017e 2018e
Australia/NZ 42.4 64.0 94.7 106.9 149.1 314.3 403.3 430.3
China 2.7 4.0 19.8 32.7 45.4
US & UK 1.1 1.9 8.9 21.3 50.4
Corporate and other 0.1 0.0 0.0 0.0 0.0
Revenue 42.2 64.0 94.7 110.8 155.1 343.0 457.4 526.1
...Growth (%) 51.7% 47.8% 17.1% 39.9% 121.1% 33.3% 15.0%
Australia/NZ 2.6 5.2 10.3 18.7 30.0 81.0 110.2 122.7
China 0.0 0.0 0.0 (3.3) (3.1) 4.0 8.2 12.5
US & UK 0.0 0.0 (0.2) (4.3) (12.1) (19.8) (17.4) (14.1)
Corporate & Other 0.1 0.1 (0.2) (7.5) (10.0) (18.0) (18.2) (18.4)
Associates 0.1 (0.7) (3.7) (1.4) 0.0 0.0 0.0 0.0
EBITDA 2.8 4.6 6.1 2.2 4.8 47.1 82.8 102.7
…EBITDA Margin (%) 6.7% 7.1% 6.4% 2.0% 3.1% 13.7% 18.1% 19.5%
Depreciation & Amortisation (0.1) (0.4) (1.1) (1.9) (1.9) (2.8) (2.8) (2.8)
EBIT 2.8 4.1 5.0 0.3 2.9 44.3 80.0 99.9
...EBIT Mrgain (% ) 6.6% 6.5% 5.3% 0.3% 1.8% 12.9% 17.5% 19.0%
Net Interest Income 0.1 (0.0) 0.2 0.4 0.1 (0.2) 0.4 1.3
Pre-tax profit 2.9 4.1 5.2 0.7 3.0 44.2 80.3 101.2
Tax (0.7) 0.3 (1.0) (0.7) (3.4) (14.6) (24.8) (31.1)
Minorities 0.0 0.0 0.0 0.0 0.0 0.0 0.0 0.0
Underlying NPAT 2.1 4.4 4.1 0.0 (0.4) 29.6 55.6 70.0
Non-recurring items (post-tax) 0.4 (0.2) (2.3) 0.0 (1.7) (2.0) 0.0 0.0
Reported NPAT 2.5 4.2 1.8 0.0 (2.1) 27.6 55.6 70.0
0%
20%
40%
60%
80%
100%
120%
140%
0.0
100.0
200.0
300.0
400.0
500.0
600.0
700.0
2011 2012 2013 2014 2015 2016 2017 2018 2019
Infant forumla sales ($m) - LHS Fresh dairy sales ($m) - LHS
Revenue growth (%) - RHS
0%
10%
20%
30%
40%
50%
60%
70%
Bellamy's Synutra Beingmate MeadJohnson
Yashilli Biostime Abbott Ind.

Page 16
The a2 Milk company (A2M) 7 June 2016
At this stage we are projecting no material change in China C2C regulations. If any
material change to C2C trading were enacted, it would likely have a detrimental impact on
the level of sales in the Australian IMF business. However, following a transition period (as
sales migrate from Australia to China direct) lost sales in Australia would more than likely
be mitigated by faster growth in the China business where gross margins are higher. As
such while we are cognisant that a change in Chinese C2C trading regulations can impact
near term earnings, we don’t necessarily view this as detrimental to A2M’s longer-term
growth trajectory.
2. Underlying revenue growth above system: In our forecasts we have assumed
continued growth in market share of +40bp in the Australian fresh milk business in FY16-
17e (in a market growing +2% pa) before reaching terminal market share levels. In the
Australian IMF business, we assume A2M grows at double the system growth rate of 5%
pa (well below recent growth rates) through to FY18e before normalising to system growth.
In China we assume market share growth through to FY19e when critical mass is reached
at 0.15%share, with a market growth rate assumed at 10% pa (again an assumption well
below recent growth rates and projected growth rates of 18% pa through to FY18e).
3. Execution in the UK: Our UK forecasts assume that A2M reaches profitability in FY17e
with market share growth towards 1.5% by FY21e. We assume no material growth in
market volumes or average price points, which we have assumed at GBP1.00/litre a 75%
premium to the average generic price in the UK.
4. Execution in the US: Our forecasts assume market share gains through to 1.5% of the
Californian market by FY21e. Market share gains are non-linear with an assumption of an
acceleration from FY18-21e as the brand gains traction. Gross margins are assumed to be
at a level below both Australia and the UK (~500bp lower), as we see this as a more
competitive market. We assume the US business contributes positively to EBITDA in
FY19e as marketing spending is brought down to levels more consistent with other
markets. While current sales are modest, the US makes a positive gross margin
contribution to the group before the inclusion of start-up marketing costs.
5. Sales and Marketing: we have assumed that sales and marketing costs in Australia
grow at 5% pa reflecting that market awareness has now been achieved. In the UK we
assume S,G&A spend continues to be 20-30% of sales in the near term and in the US we
continue to assume that marketing exceeds sales revenue through to FY19e. In China we
assume a high level of investment in S,G&A through to achieving critical mass.
BALANCE SHEET AND CASHFLOW
A2M has sustained a relatively conservative balance sheet position with a net cash
position sustained over its listed life, though this has largely been the result of new equity
funding with $71.8m in equity raised over FY12-16e. A2M runs a reasonably low
production asset base, preferring to utilise contract manufacturing partnership so A2M can
focus on brand development, for this reason we note a material deviation historically
between operating cashflows and underlying cash NPAT, with a cumulative investment in
working capital of $45m over FY12-1H16. Looking forward we anticipate a material uplift in
operating cashflows as the business moves into a breakeven position in the UK and
expands profitability in the Australian and China operations. This cash generation should
also take a material step-up in FY19e once the US is EBITDA breakeven.
Figure 21 - A2M Balance sheet and cashflow summary (NZ$m unless stated otherwise)
SOURCE: COMPANY DATA AND BELL POTTER SECURITIES ESTIMATES
2011 2012 2013 2014 2015 2016e 2017e 2018e
Operating cashflow ($m) 0.1 3.6 0.4 (8.1) (16.7) 37.7 60.5
Operating cash realisation (%) 2% 70% 23% -528% -52% 65% 83%
Free cashflow ($m) (12.3) (2.2) (7.2) (11.7) (20.5) 33.9 56.7
Free cash realisation (%) -280% -53% n.a. n.a. -69% 61% 81%
Net Debt/(Cash) ($m) (2.2) (20.2) (16.0) (6.1) (27.2) (61.2) (117.9)
New equity raised ($m) 7.7 20.5 0.0 2.0 41.6 0.0 0.0

Page 17
The a2 Milk company (A2M) 7 June 2016
The primary investment of A2M in developing the business is in marketing and working
capital. Net working capital to sales has averaged 17.2% over FY14-15, however, we
expect this to lift to 22.5% over FY16-18e reflecting the change in business mix to IMF
where inventory positions are built up in advance of sales. It is worth noting at this level net
working capital represents 17-20% of one year forward sales.

Page 18
The a2 Milk company (A2M) 7 June 2016
Board and management
BOARD OF DIRECTORS
David Hearn: Chairman & Executive Director
David has been Chairman of The a2 Milk Company Limited since 30 March 2015. David is
also a member of the Nomination and Remuneration Committees. David has experience
and skills in executive management, sales and marketing and strategy development in
FMCG in international markets. He has held senior executive roles including Chief
Executive Officer or Managing Director roles for FMCG companies including Goodman
Fielder Limited, UB Snack Foods Europe/Asia, Del Monte UK and Smith’s Crisps and for
the marketing services group, Cordiant Communications Group. In addition to his a2MC
directorship, David is also a Director of Lovat Partners Limited, Robin Partington &
Partners Limited, and Committed Capital Limited. David resides in the United Kingdom
Julia Hoare: Deputy Chairman & Non-Executive Director
Julia has been Deputy Chairman of the Company since 30 March 2015. Julia is also
Chairman of both the Nomination Committee and the Audit and Risk Management
Committee. Prior to joining the Board, Julia had extensive chartered accounting experience
in Australia, the UK and New Zealand and was a partner with PwC New Zealand for 20
years. In addition to her Company directorship, Julia is a Director of New Zealand Post
Limited, Watercare Services Limited, AWF Group Limited and Port of Tauranga Limited
(appointed 20 August 2015). Julia is also a member of the New Zealand External
Reporting Advisory Panel (XRAP), a body designed to support the standard setting
process of the New Zealand External Reporting Board (XRB), and the New Zealand
Institute of Directors National Council. Julia resides in New Zealand.
Geoffrey Babidge: Managing Director & Chief Executive Officer (CEO)
Geoffrey has over 25 years senior management experience working in the Australian
FMCG industry. Prior to his appointment as CEO of the Company in 2010, Geoffrey held
senior executive roles with a number of companies in Australia including Freedom Foods
Group Limited, Bunge Defiance and National Foods. Prior to these roles he was a
practicing chartered accountant and Partner at Price Waterhouse. Geoffrey resides in
Australia.
Richard Le Grice: Non-Executive Director
Richard has experience in management of, and as a shareholder in, a number of private
companies. He brings considerable international experience with these companies
operating in a number of countries including Australia. In addition to his Company
directorship, Richard is also a Director of several other companies including Energi
Advertising Limited, Thode Knife & Saw Limited and The Gravitas Group Limited. Richard
is Chairman of the Remuneration Committee and a member of both the Audit and Risk
Management Committee and the Nomination Committee. Richard resides in New Zealand.
Melvyn Miles: Non-Executive Director
Melvyn has over 30 years Australian and international senior executive experience in the
FMCG industry, and has held Vice President roles in Carlton & United Breweries and
Foster’s Group and General Manager roles in Visy Industries and Amcor. Melvyn is a
member of both the Audit and Risk Management Committee and the Remuneration
Committee. Melvyn resides in Australia.

Page 19
The a2 Milk company (A2M) 7 June 2016
Peter Hinton: Non-executive Director
Mr Hinton is a partner at law firm Simpson Grierson in New Zealand with experience in NZ
and international markets. Mr Hinton has provided legal advice to the Company over many
years.
SENIOR MANAGEMENT
Craig Louttit: Chief Financial Officer & Company Secretary
Craig joined the Group in April 2014 from ASX listed public company UGL Limited where,
since 2007, he had held senior finance roles including as General Manager Finance,
Transport and Technology Systems, and Group Financial Controller. Prior to this he held
senior finance roles with EMI Group PLC from 1999 in London, UK. Craig is a member of
the Institute of Chartered Accountants in Australia.
Susan Massasso: Chief Marketing Officer
Susan has over 18 years’ experience in the FMCG industry. She joined the Group in
September 2013 as Chief Marketing Officer with oversight of marketing and brand
development across all markets. Susan has held several senior leadership positions
across the Campbell Arnott’s business including most recently Asia Pacific Regional
Marketing Director. Prior to this she held a number of commercial roles including Marketing
Director Arnott’s ANZ, Marketing Director Campbell’s ANZ and General Manager
Campbell’s ANZ. Prior to this Susan spent a number of years at Unilever where she held a
number of marketing, consumer insight and logistics roles. Susan attended the University
of Sydney under scholarship from accounting firm Price Waterhouse where she also
gained undergraduate employment throughout her degree.
Andrew Clarke: Chief Scientific Officer
Andrew joined the Group in 2003. Andrew has over 15 years’ experience in private sector
pharmaceutical research and agricultural biotechnology. He received a PhD in
Biochemistry and Molecular Biology from the University of Auckland. In his role as Chief
Scientific Officer, Andrew oversees all aspects of the Group's science-based activities
including research and development, scientific communications and the expansion of
intellectual property.
Simon Hennessy: General Manager and International Development
Simon joined the Group in 2007 as the Business Unit Manager for the Australian joint
venture with Freedom Foods. In 2010 Simon took on the responsibilities for Group
operations and development of new markets. Simon has over 25 years’ experience in
manufacturing operations, sales and marketing, after an early career in research and
development and quality management.
Shareef Khan: General Manager Operations
Shareef joined the Group in June 2012. He has over 13 years’ senior management
experience as a qualified supply chain professional. He is experienced across a number of
industries, some of which include FMCG, infant nutrition, office products and construction
Peter Nathan: Chief Executive Australia & New Zealand
Peter joined the Group in 2008 and in 2010 took on the role of Chief Executive of the
Australia and New Zealand region. During his time with the Company, Peter has led the
successful re-launch of a2MC branded milk in the Australian market. He has over 20 years’
experience working the FMCG industry, as evidenced by his previous senior marketing and
sales roles for Gillette and Colgate Palmolive in Australia and Asia as well as his
involvement with Freedom Foods Group Limited as General Manager.

Page 20
The a2 Milk company (A2M) 7 June 2016
Major shareholders
A2M has a dual listing, listed on both the Australiana and New Zealand stock exchange.
Approximately 65% of shares are domiciled in Australia, 33% in New Zealand and the
remainder elsewhere. There are two substantial shareholders in A2M holding a combined
11.6% of the company between them.
Figure 22 - A2M substantial shareholders
SOURCE: COMPANY DATA AND BELL POTTER SECURITIES ESTIMATES
In addition to the 711.3m ordinary shares on issue there are 20m options with a $0.63ps
exercise price, 12m partly paid shares with an average $0.63ps conversion price and 1.6m
performance rights. As such the current diluted capital base of A2M sits at 743.6m, with
notional cash due of $20.4m if all stock were converted to fully paid ordinary shares. In all
valuation work we have assumed both options and partly paid shares are converted given
they are deeply in the money.
Shareholder Holding (m Shares) Holding (%)
Greencape 45.3 6.4%
Regal funds management 37.1 5.2%

Page 21
The a2 Milk company (A2M) 7 June 2016
Risks
ASM is a high growth FMCG business with exposures to an agricultural supply chain. Risks associated in an investment in
A2M include but are not isolated to:
China regulatory risk: At this stage we are projecting no material change in China C2C law changes which would likely have
a detrimental impact on the level of sales in the Australian IMF business, but following a transition would be more than
mitigated by faster growth in the China business where gross margins are higher than those achieved in Australia. As such
while we are cognisant that a change in Chinese C2C trading regulations can impact near term earnings, we don’t necessarily
view this as detrimental to the company’s longer-term growth trajectory.
Scientific risk: The A2M brand proposition is built primarily on the potential digestive well-being benefits of A1 Protein Free
milk products compared to Regular Cows’ Milk products which contain both A1 Protein and A2 Protein. There is the risk of
research or information being published that diminishes or rejects the scientific arguments or consumers’ experiences as to the
benefits of the consumption of A1 Protein Free dairy products. As a result, the A2M brand may lose its differentiated position
and it may become difficult for A2M to continue to position its products as premium products sold at a premium price.
Intellectual Property: A2M’s business relies in part on its intellectual property portfolio, including brands and trademarks,
patents, proprietary processes and know-how. Some forms of registered intellectual property, including patents, are of fixed
duration and will expire over time. As any of A2M’s registered intellectual property expires, or if it is invalidated or removed
from intellectual property registers, this will adversely impact on A2M’s ability to claim and enforce exclusive rights in such
intellectual property. Because of the importance of its intellectual property, A2M may also need to defend its intellectual
property or take action against third parties that infringe or claim rights in its intellectual property. Such action may include
litigation, which may be protracted and expensive, and which may result in negative publicity.
Emergence of new competition: A2M’s business model relies on A2M branded products being differentiated from other dairy
products in each market in which it operates because they consist of, or are made using, A1 Protein Free milk. There is a risk
that a competitor or competitors may launch A1 Protein Free milk products, and this risk may increase over time as A2M
patents expire. There is also a risk that competitors may develop branding that creates confusion between a2MC branded
products and Regular Cows’ Milk products or otherwise reduces the perception of A2M branded products as differentiated A1
Protein Free milk products
Supply chain disruption: A2M’s business model and supply chain are dependent on contractual arrangements with third
parties which provide essential processing, production or distribution functions for A2M branded products globally. There is the
risk that the operations of one or more third parties change in a material and adverse way or that one or more third parties
could reduce their support for the A2M brand. This could reduce A2M’s ability to maintain supply to its customers in the short
to medium term and reduce its ability to maintain its position in existing markets or enter new markets. This may also
necessitate the need for A2M to invest in manufacturing capacity that would likely be returns dilutionary.
Brand risk: In common with many other food companies, there is a risk that raw materials may deteriorate or that products
may become contaminated, tampered with, adulterated or otherwise unsafe or unfit for sale or consumption within the supply
chain due to various factors, including human error and equipment failure. Potential adverse consequences for A2M include
regulatory penalties, termination of distribution arrangements, liability associated with adverse health effects on consumers,
product recall and disposal costs, loss of stock, delay in supply and financial costs.
Regulatory risk: A2M and its strategic suppliers and contractors require certain licences, approvals and consents in order to
conduct their businesses. There is a risk that any such licences, approvals or consents that are material to a2MC in operating
its business will not be renewed or will be renewed on more restrictive or onerous terms, or in limited circumstances, revoked.
Key personnel risk: A2M’s performance is dependent on the ability of its senior executives and key personnel to manage and
grow its business. Continuity and retention of senior executives and key personnel are important for the ongoing
implementation of A2M’s strategy.

Page 22
The a2 Milk company (A2M) 7 June 2016
The a2 Milk company as at 7 June 2016
Recommendation Buy
Price A$1.38
Target (12 months) A$1.81
Table 1 - Financial summary
SOURCE: BELL POTTER SECURITIES ESTIMATES
Year end June 2012 2013 2014 2015 2016e 2017e 2018e Rating Buy
Profit & Loss (NZ$m) Share price (A$ps) $1.38
Sales revenue 64.0 94.7 110.8 155.1 343.0 457.4 526.1 Target price (A$ps) $1.81
. . . Change 47.8% 17.1% 39.9% 121.1% 33.3% 15.0% Shares on issue (m) 711.3
EBITDA 4.6 6.1 2.2 4.8 47.1 82.8 102.7 Market cap (A$m) 978.0
Deprec. & amort. (0.4) (1.1) (1.9) (1.9) (2.8) (2.8) (2.8) Enterprise Value (A$m) 943.7
EBIT 4.1 5.0 0.3 2.9 44.3 80.0 99.9
Interest expense (0.0) 0.2 0.4 0.1 (0.2) 0.4 1.3 Year end June 2012 2013 2014 2015 2016e 2017e 2018e
Pre-tax profit 4.1 5.2 0.7 3.0 44.2 80.3 101.2 Valuation Ratios
Tax expense 0.3 (1.0) (0.7) (3.4) (14.6) (24.8) (31.1) Adjusted EPS (¢ps) 1.35 0.67 0.00 (0.06) 4.20 7.47 9.42
. . . tax rate -7% 20% 99% 114% 33% 31% 31% Change (% ) n.a. n.a. n.a. n.a. 78.0% 26.0%
Minorities 0.0 0.0 0.0 0.0 0.0 0.0 0.0 Adjusted PE (x) n.a. n.a. n.a. n.a. 34.7 19.5 15.5
Net Profit 4.4 4.1 0.0 (0.4) 29.6 55.6 70.0 EV/EBITDA (x) 218.8 164.1 454.9 208.5 21.2 12.1 9.7
Abs. & extras. (0.2) (2.3) 0.0 (1.7) (2.0) 0.0 0.0 EV/EBIT (x) 241.7 200.6 3,335.9 351.0 22.6 12.5 10.0
Reported Profit 4.2 1.8 0.0 (2.1) 27.6 55.6 70.0 EV/EBITDA ex-US (x) 218.8 164.1 231.6 78.7 15.5 9.9 8.4
Cashflow (NZ$m) NTA ($ps) 0.05 0.08 0.08 0.08 0.16 0.23 0.34
EBITDA 4.6 6.1 2.2 4.8 47.1 82.8 102.7 P/NTA (x) 26.6 17.5 18.7 19.2 9.1 6.3 4.3
Net Interest Expense (0.0) 0.2 0.4 0.1 (0.2) 0.4 1.3 Book Value ($ps) 0.07 0.10 0.09 0.09 0.18 0.26 0.36
Tax Paid (0.8) (0.6) (0.9) (2.5) (14.0) (19.7) (28.0) Price/Book (x) 21.8 15.0 15.7 15.8 8.1 5.7 4.1
Change in Wkg Capital (4.7) (2.4) (5.4) (9.1) (49.7) (25.7) (15.5) DPS (¢) 0.0 0.0 0.0 0.0 0.0 0.0 0.0
Other 1.0 0.3 4.2 (1.3) 0.0 0.0 0.0 Payout (%) 0.0% 0.0% 0.0% 0.0% 0.0% 0.0% 0.0%
Operating Cash Flow 0.1 3.6 0.4 (8.1) (16.7) 37.7 60.5 Yield (% ) 0.0% 0.0% 0.0% 0.0% 0.0% 0.0% 0.0%
Capex (12.4) (5.8) (7.7) (3.6) (3.8) (3.8) (3.8)
Div Paid (gross of DRP) 0.0 0.0 0.0 0.0 0.0 0.0 0.0 Performance Ratios
Free Cash Flow (12.3) (2.2) (7.2) (11.7) (20.5) 33.9 56.7 EBITDA/sales (% ) 7.1% 6.4% 2.0% 3.1% 13.7% 18.1% 19.5%
Acquisitions 0.0 0.0 0.0 0.0 0.0 0.0 0.0 EBIT/sales (% ) 6.5% 5.3% 0.3% 1.8% 12.9% 17.5% 19.0%
Disposals 0.0 0.0 0.0 0.0 0.0 0.0 0.0 OCF Realisation (%) 2% 70% 23% -528% -52% 65% 83%
Share issues 7.7 20.5 0.0 2.0 41.6 0.0 0.0 FCF Realisation (%) -280% -53% -144640% 2784% -69% 61% 81%
Other (0.0) (0.3) 3.0 (0.2) 0.0 0.0 0.0 ROE (% ) 11.8% 6.9% 0.0% -0.7% 23.1% 30.3% 27.6%
(Inc.) /dec. in net debt (4.7) 18.0 (4.2) (9.9) 21.1 33.9 56.7 ROIC (%) 11.8% 12.6% 0.7% 5.4% 44.1% 65.4% 73.7%
Asset turn (years) 10.56 5.51 1.16 2.46 16.89 29.66 36.79
Balance Sheet (NZ$m) Capex/Depn (x) 28.71 5.27 4.04 1.86 1.36 1.36 1.36
Cash & near cash 6.6 20.2 16.0 6.1 27.2 61.2 117.9 Interest cover (x) 188.18 (28.68) (0.72) (28.23) 265.68 (208.37) (77.39)
Receivables 17.2 24.4 27.4 39.9 85.8 114.3 131.5 Net Debt/EBITDA (x) (0.47) (3.31) (7.26) (1.27) (0.58) (0.74) (1.15)
Inventories 0.7 0.7 5.6 4.8 18.9 25.2 28.9 Net debt/equity (%) -6% -34% -27% -10% -21% -33% -47%
Other 0.5 2.4 2.2 9.7 32.6 43.4 50.0
Current assets 24.9 47.7 51.1 60.5 164.4 244.1 328.3 Segmentals
Fixed assets 10.3 11.0 9.2 9.3 9.3 9.3 9.3 Australia/NZ 64.0 94.7 106.9 149.1 314.3 403.3 430.3
Intangibles 12.4 11.1 14.8 17.2 18.2 19.2 20.2 China 0.0 0.0 2.7 4.0 19.8 32.7 45.4
Other 2.1 2.6 1.6 1.8 1.8 1.8 1.8 US & UK 0.0 0.0 1.1 1.9 8.9 21.3 50.4
Non current assets 24.8 24.7 25.5 28.3 29.3 30.3 31.3 Corporate and other 0.0 0.0 0.1 0.0 0.0 0.0 0.0
Total assets 49.7 72.4 76.6 88.9 193.8 274.4 359.7 Revenue 64.0 94.7 110.8 155.1 343.0 457.4 526.1
Creditors 7.2 12.1 16.7 26.9 60.0 80.0 92.1
Borrowings 4.4 0.0 0.0 0.0 0.0 0.0 0.0 Australia/NZ 5.2 10.3 18.7 30.0 81.0 110.2 122.7
Other 0.6 0.3 1.2 2.0 4.6 9.7 12.9 China 0.0 0.0 (3.3) (3.1) 4.0 8.2 12.5
Current liabilities 12.3 12.4 17.9 29.0 64.7 89.8 105.0 US & UK 0.0 (0.2) (4.3) (12.1) (19.8) (17.4) (14.1)
Borrowings 0.0 0.0 0.0 0.0 0.0 0.0 0.0 Corporate & Other 0.1 (0.2) (7.5) (10.0) (18.0) (18.2) (18.4)
Other 0.0 0.1 0.1 1.3 1.3 1.3 1.3 Associates (0.7) (3.7) (1.4) 0.0 0.0 0.0 0.0
Non current liabilities 0.0 0.1 0.1 1.3 1.3 1.3 1.3 EBITDA 4.6 6.1 2.2 4.8 47.1 82.8 102.7
Total liabilities 12.3 12.5 18.0 30.2 65.9 91.0 106.3
Net assets 37.3 59.9 58.6 58.6 127.8 183.4 253.4
Share capital 63.8 84.3 86.3 86.3 127.9 127.9 127.9
Reserves 1.7 (0.3) (3.6) (1.6) (1.6) (1.6) (1.6)
Retained earnings (28.1) (24.0) (24.0) (26.1) 1.5 57.1 127.1
Outside equity Interests 0.0 0.0 0.0 0.0 0.0 0.0 0.0
S/holders' funds 37.3 59.9 58.6 58.6 127.8 183.4 253.4
Net Debt (Cash) (2.2) (20.2) (16.0) (6.1) (27.2) (61.2) (117.9)

Page 23
The a2 Milk company (A2M) 7 June 2016
Bell Potter Securities Limited ACN 25 006 390 7721
Level 38, Aurora Place 88 Phillip Street, Sydney 2000
Telephone +61 2 9255 7200 www.bellpotter.com.au
Recommendation structure
Buy: Expect >15% total return on a
12 month view. For stocks regarded
as ‘Speculative’ a return of >30% is
expected.
Hold: Expect total return between -5%
and 15% on a 12 month view
Sell: Expect <-5% total return on a
12 month view
Speculative Investments are either start-up
enterprises with nil or only prospective
operations or recently commenced
operations with only forecast cash flows, or
companies that have commenced
operations or have been in operation for
some time but have only forecast cash
flows and/or a stressed balance sheet.
Such investments may carry an
exceptionally high level of capital risk and
volatility of returns.
Research Team
Staff Member
TS Lim
Industrials
Sam Haddad
John O’Shea
Chris Savage
Jonathan Snape
Sam Byrnes
John Hester
Tanushree Jain
Financials
TS Lim
Lafitani Sotiriou
Resources
Peter Arden
David Coates
Associates
Hamish Murray
Tim Piper
Title/Sector
Head of Research
Industrials
Industrials
Industrials
Industrials
Industrials
Healthcare
Healthcare/Biotech
Banks/Regionals
Diversified
Resources
Resources
Associate Analyst
Associate Analyst
Phone
612 8224 2810
612 8224 2819
613 9235 1633
612 8224 2835
613 9235 1601
612 8224 2886
612 8224 2871
612 8224 2849
612 8224 2810
613 9235 1668
613 9235 1833
612 8224 2887
613 9256 8761
612 8224 2825
@bellpotter.com.au
tslim
shaddad
joshea
csavage
jsnape
sbyrnes
jhester
tnjain
tslim
lsotiriou
parden
dcoates
hmurray
tpiper
The following may affect your legal rights. Important Disclaimer:
This document is a private communication to clients and is not intended for public circulation or for the use of any third party, without the prior approval of Bell Potter Securities Limited. In the USA and the UK this research is only for institutional investors. It is not for release, publication or distribution in whole or in part to any persons in the two specified countries. In Hong Kong this research is being distributed by Bell Potter Securities (HK) Limited which is licensed and regulated by the Securities and Futures Commission, Hong Kong. This is general investment advice only and does not constitute personal advice to any person. Because this document has been prepared without consideration of any specific client’s financial situation, particular needs and investment objectives (‘relevant personal circumstances’), a Bell Potter Securities Limited investment adviser (or the financial services licensee, or the representative of such licensee, who has provided you with this report by arraignment with Bell Potter Securities Limited) should be made aware of your relevant personal circumstances and consulted before any investment decision is made on the basis of this document.
While this document is based on information from sources which are considered reliable, Bell Potter Securities Limited has not verified independently the information contained in the document and Bell Potter Securities Limited and its directors, employees and consultants do not represent, warrant or guarantee, expressly or impliedly, that the information contained in this document is complete or accurate. Nor does Bell Potter Securities Limited accept any responsibility for updating any advice, views opinions, or recommendations contained in this document or for correcting any error or omission which may become apparent after the document has been issued.
Except insofar as liability under any statute cannot be excluded. Bell Potter Limited and its directors, employees and consultants do not accept any liability (whether arising in contract, in tort or negligence or otherwise) for any error or omission in this document or for any resulting loss or damage (whether direct, indirect, consequential or otherwise) suffered by the recipient of this document or any other person.
Disclosure of interest:
Bell Potter Securities Limited, its employees, consultants and its associates within the meaning of Chapter 7 of the Corporations Law may receive commissions, underwriting and management fees from transactions involving securities referred to in this document (which its representatives may directly share) and may from time to time hold interests in the securities referred to in this document.
Jonathan Snape owns 22,500 shares in A2M.
ANALYST CERTIFICATION Each research analyst primarily responsible for the content of this research report, in whole or in part, certifies that with respect to each security or issuer that the analyst covered in this report: (1) all of the views expressed accurately reflect his or her personal views about those securities or issuers and were prepared in an independent manner and (2) no part of his or her compensation was, is, or will be, directly or indirectly, related to the specific recommendations or views expressed by that research analyst in the research report.