the act college and career readiness system measuring student progress toward readiness improving...
TRANSCRIPT
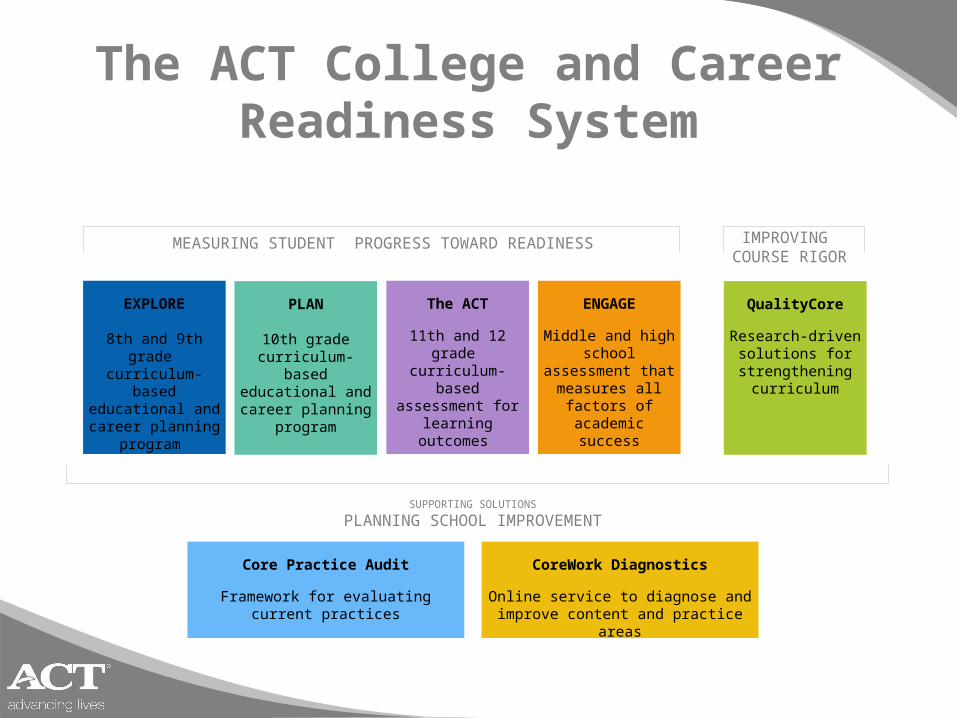
The ACT College and Career Readiness System
MEASURING STUDENT PROGRESS TOWARD READINESS IMPROVING COURSE RIGOR
SUPPORTING SOLUTIONS
PLANNING SCHOOL IMPROVEMENT
EXPLORE
8th and 9th grade curriculum-based educational and career planning
program
PLAN
10th grade curriculum-based educational and career planning
program
The ACT
11th and 12 grade curriculum-based assessment for
learning outcomes
ENGAGE
Middle and high school assessment that measures all
factors of academic success
QualityCore
Research-driven solutions for
strengthening curriculum
CoreWork Diagnostics
Online service to diagnose and improve content and practice areas
Core Practice Audit
Framework for evaluating current practices
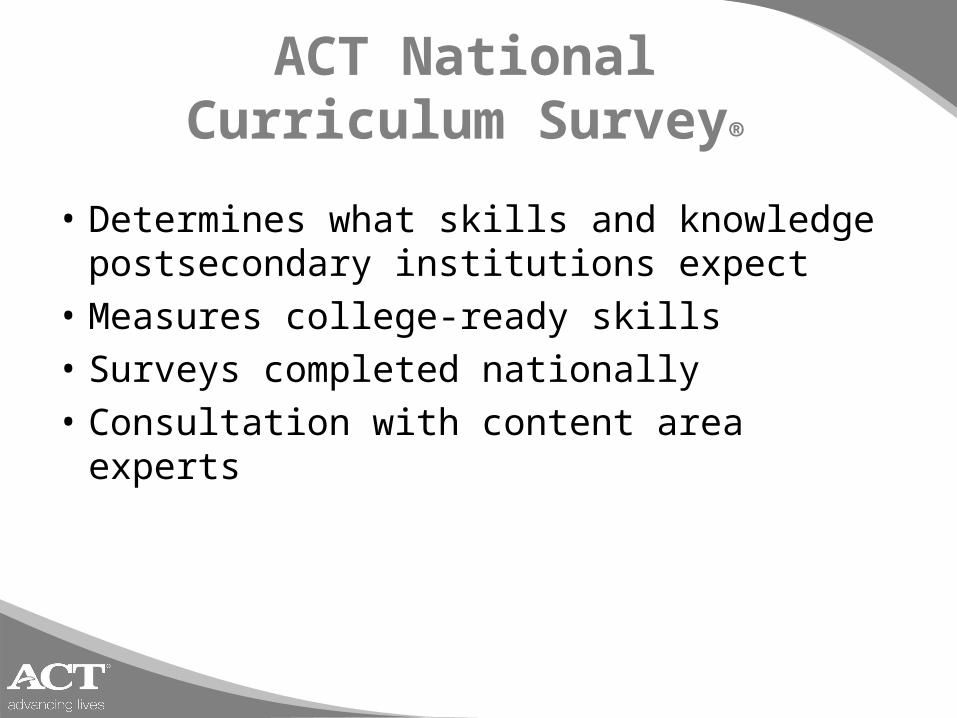
ACT National Curriculum Survey®
• Determines what skills and knowledge postsecondary institutions expect
• Measures college-ready skills
• Surveys completed nationally
• Consultation with content area experts
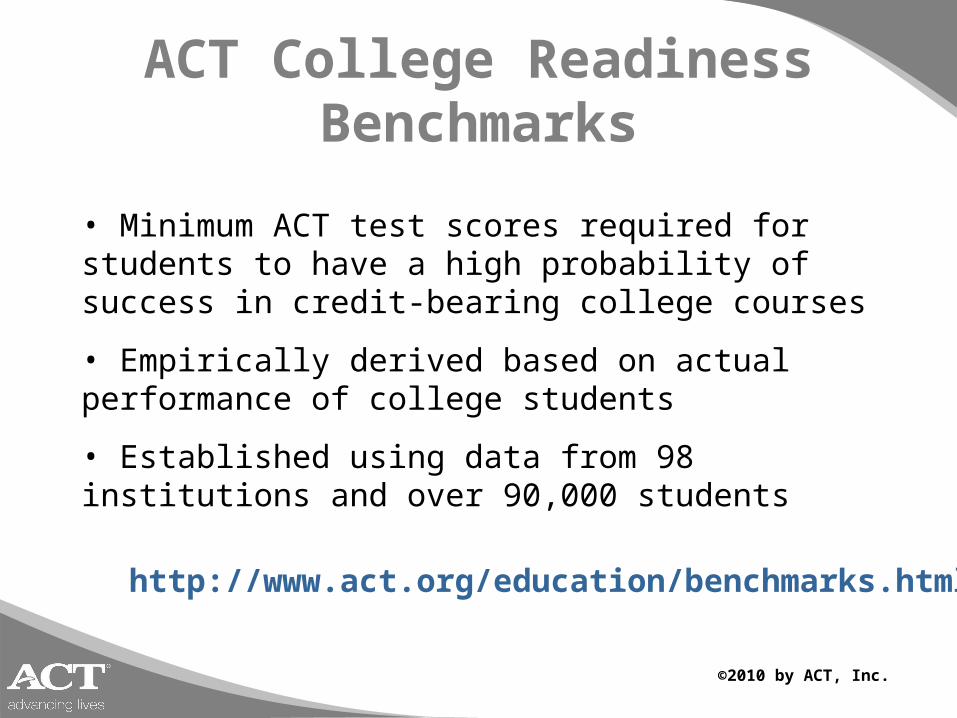
• Minimum ACT test scores required for students to have a high probability of success in credit-bearing college courses
• Empirically derived based on actual performance of college students
• Established using data from 98 institutions and over 90,000 students
©2010 by ACT, Inc.
ACT College Readiness Benchmarks
http://www.act.org/education/benchmarks.html
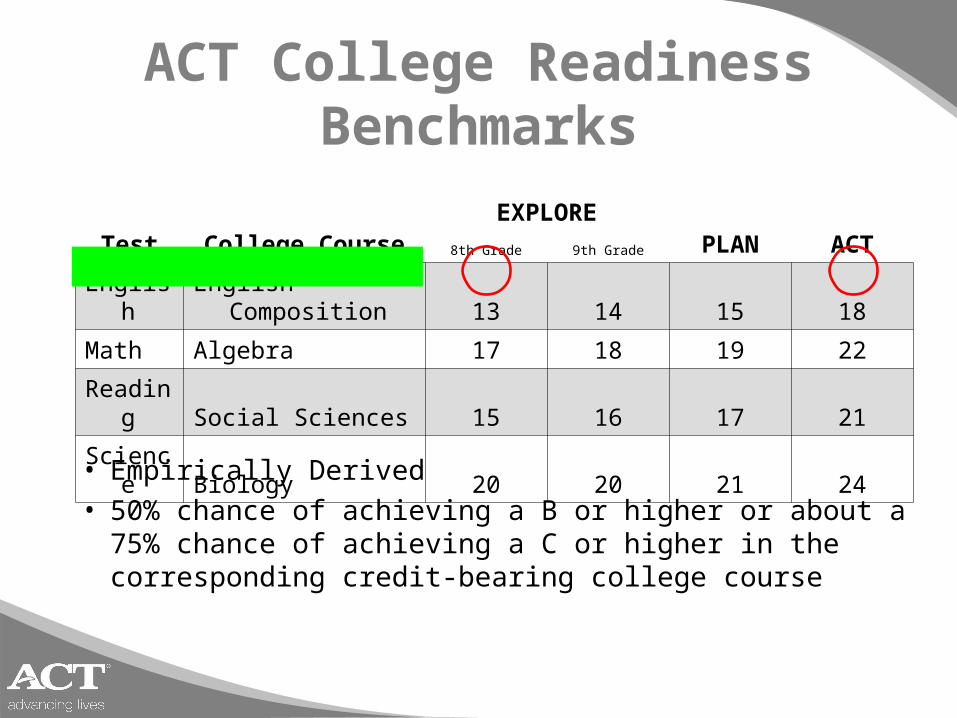
• Empirically Derived• 50% chance of achieving a B or higher or about a
75% chance of achieving a C or higher in the corresponding credit-bearing college course
Test College Course PLAN ACT8th Grade 9th Grade
English English Composition 13 14 15 18
Math Algebra 17 18 19 22
Reading Social Sciences 15 16 17 21
Science Biology 20 20 21 24
EXPLORE
ACT College Readiness Benchmarks
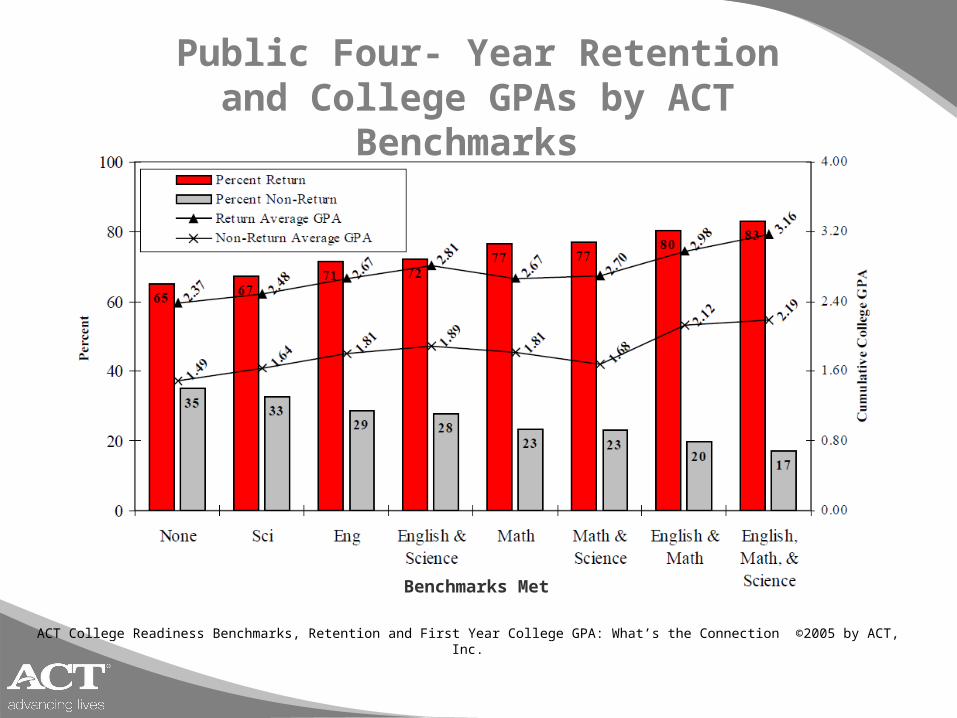
Public Four- Year Retention and College GPAs by ACT Benchmarks
ACT College Readiness Benchmarks, Retention and First Year College GPA: What’s the Connection ©2005 by ACT, Inc.
Benchmarks Met
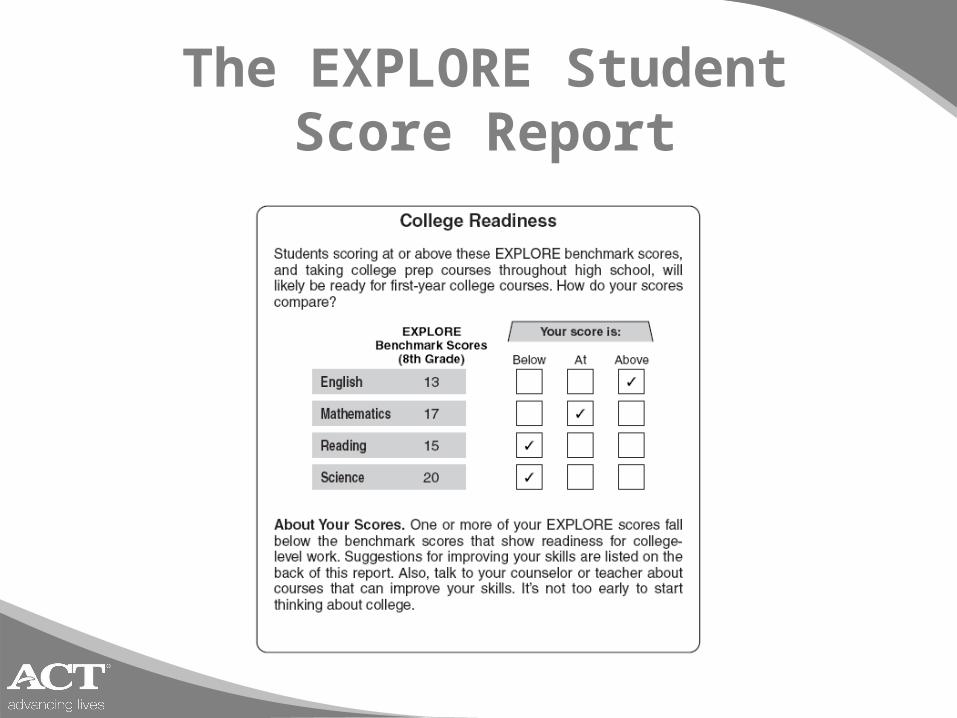
The EXPLORE Student Score Report
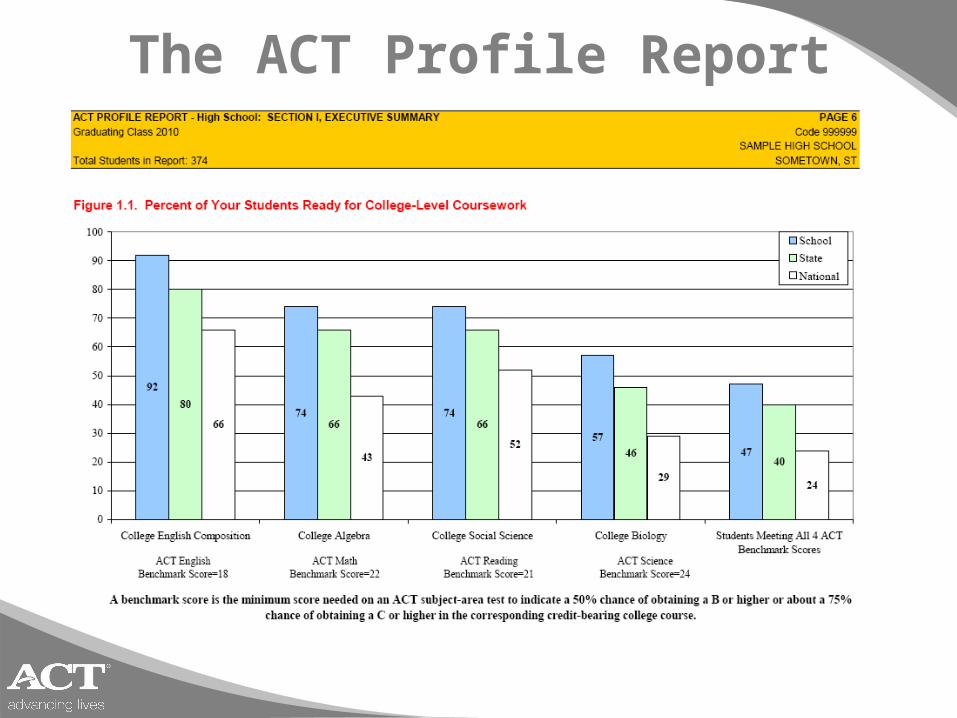
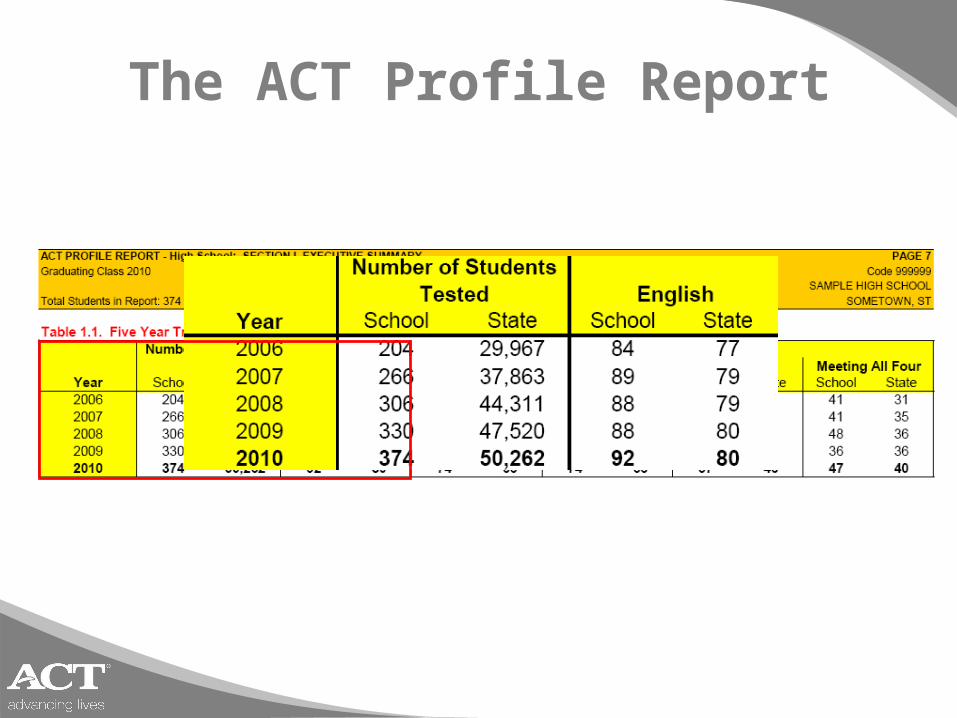
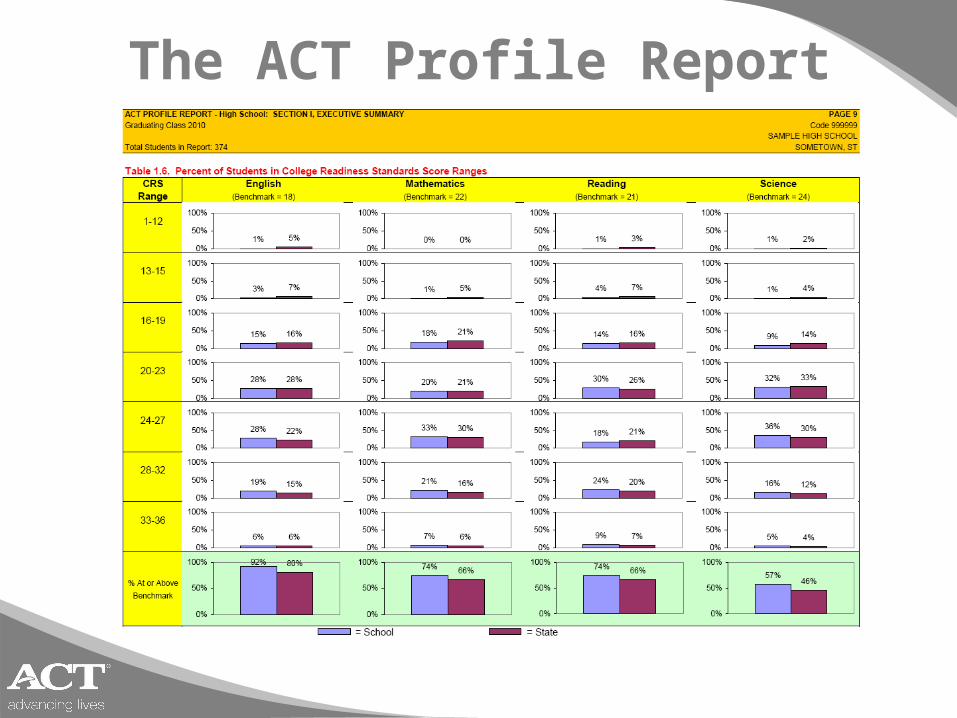
The ACT Profile Report
The ACT Profile Report
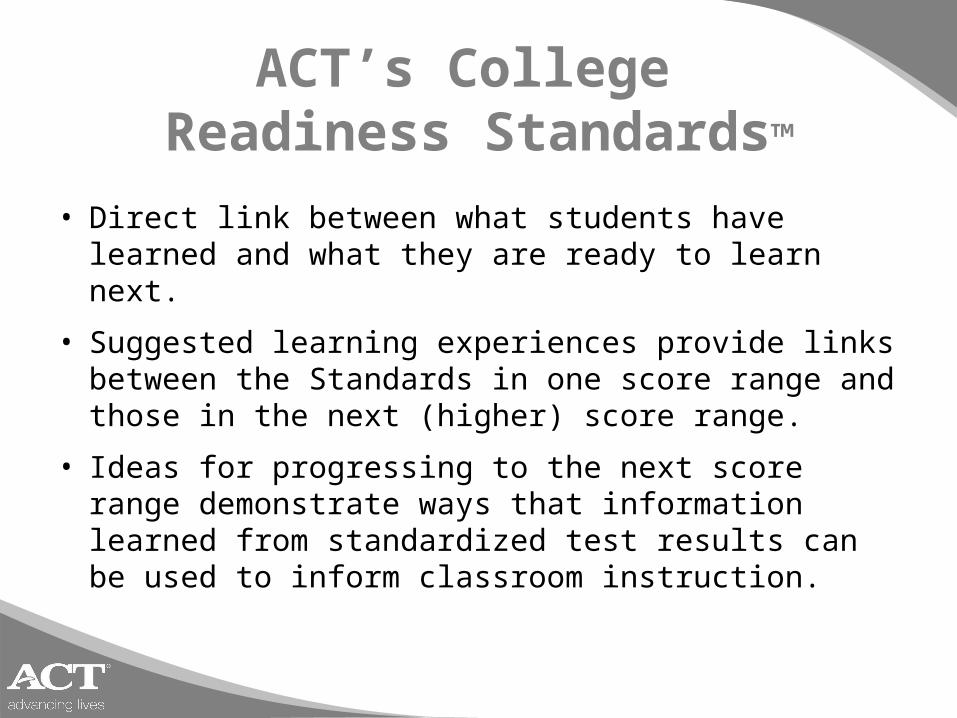
• Direct link between what students have learned and what they are ready to learn next.
• Suggested learning experiences provide links between the Standards in one score range and those in the next (higher) score range.
• Ideas for progressing to the next score range demonstrate ways that information learned from standardized test results can be used to inform classroom instruction.
ACT’s College Readiness Standards™
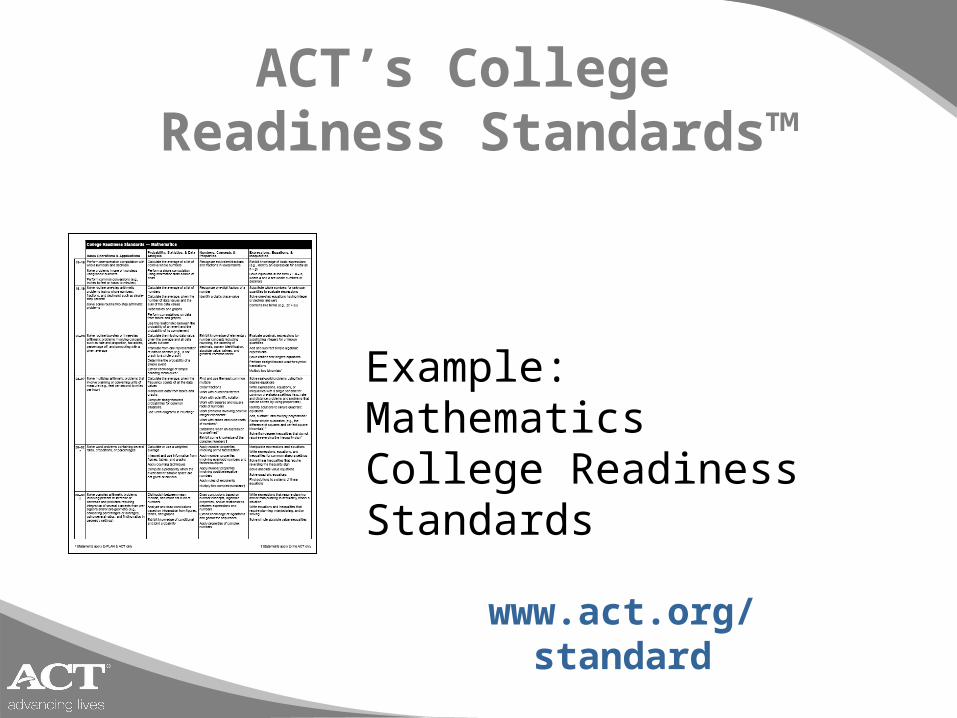
Example: Mathematics College Readiness Standards
www.act.org/standard
ACT’s College Readiness Standards™
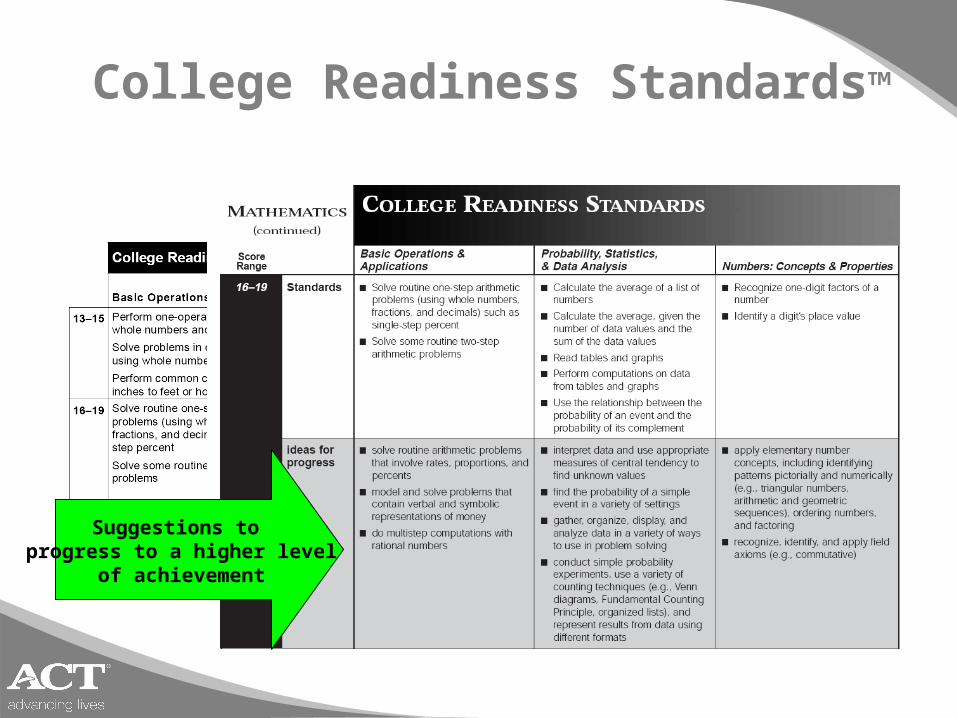
College Readiness Standards™
Suggestions to progress to a higher level
of achievement
The ACT Profile Report
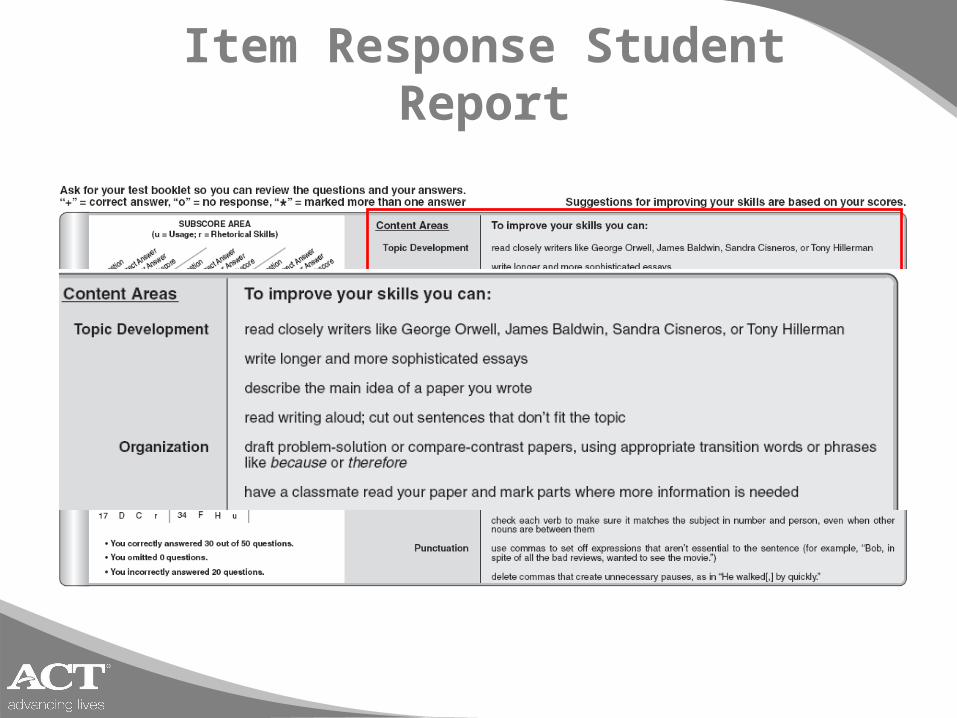
Item Response Student Report
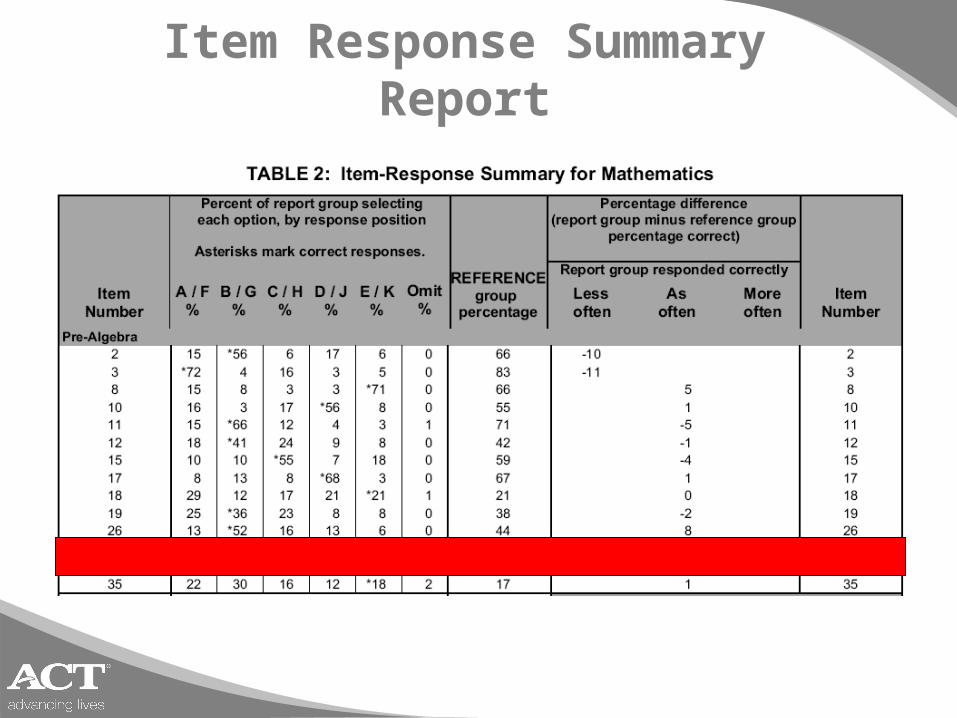
Item Response Summary Report
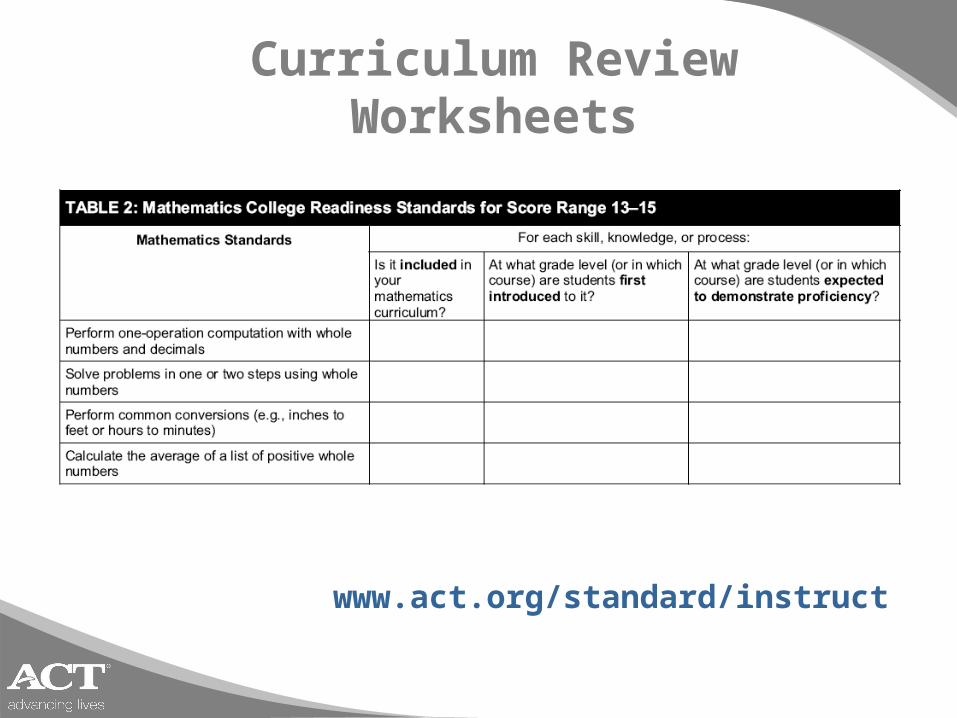
Curriculum Review Worksheets
www.act.org/standard/instruct
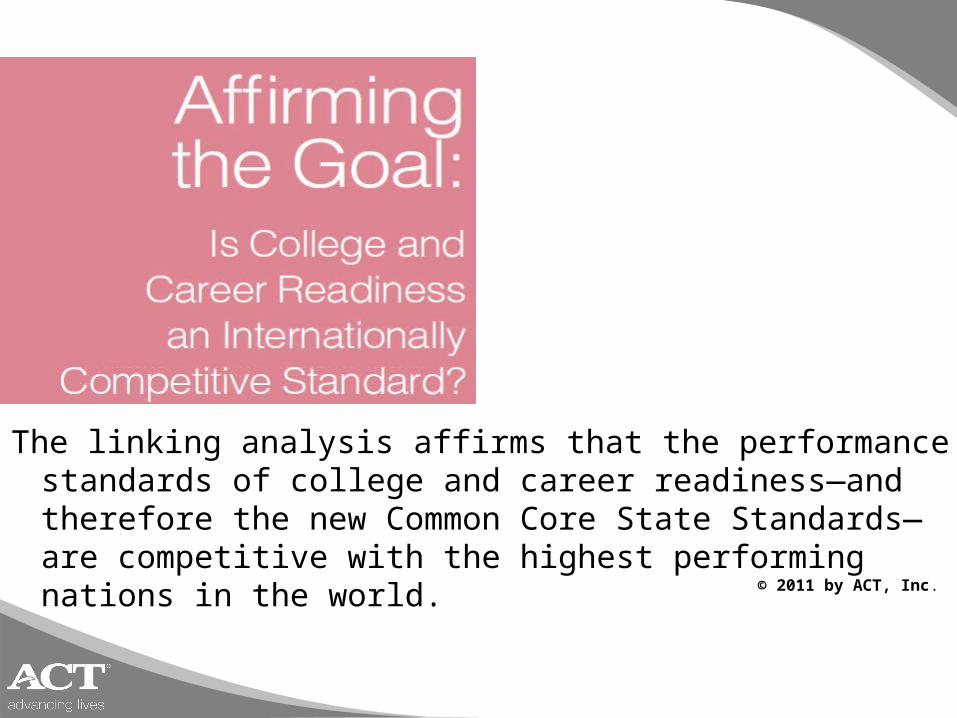
© 2011 by ACT, Inc.
The linking analysis affirms that the performance standards of college and career readiness—and therefore the new Common Core State Standards—are competitive with the highest performing nations in the world.
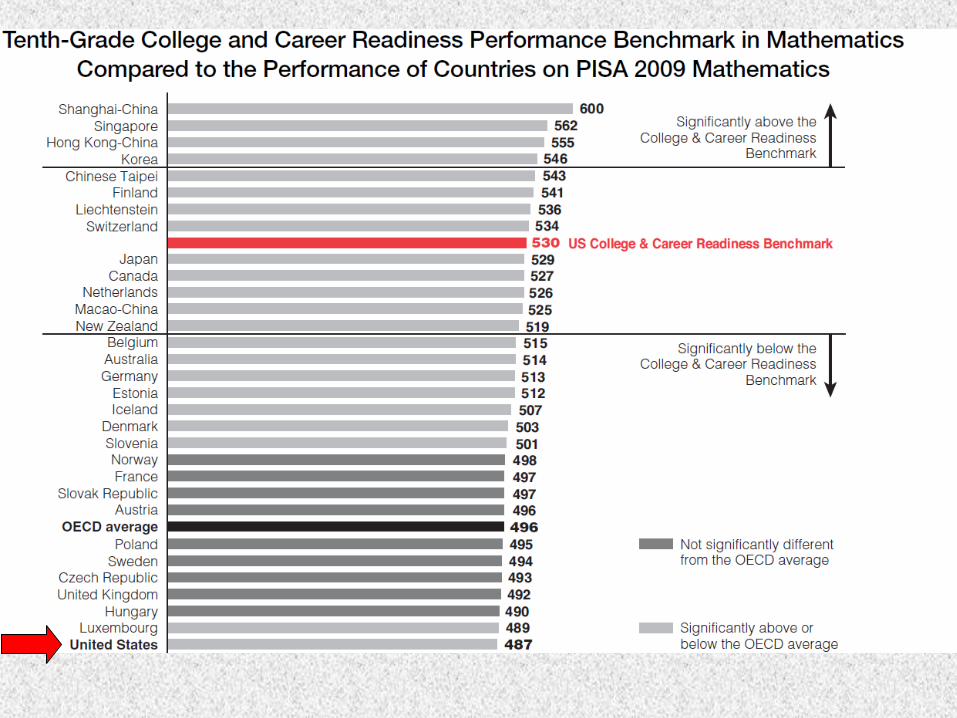
US College and Career Readiness Benchmark
United States
Mind the Gaps
College Readiness Benchmarks and
Achievement Gaps
© 2010 by ACT, Inc.
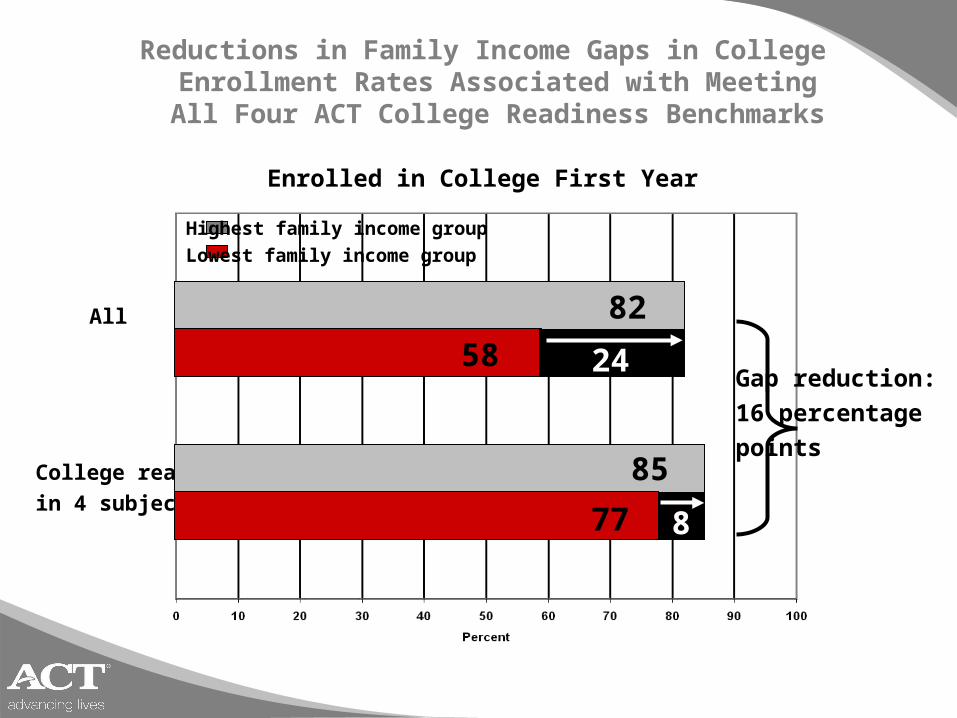
All
College ready
in 4 subjects
Reductions in Family Income Gaps in College Enrollment Rates Associated with Meeting All Four
ACT College Readiness Benchmarks
Enrolled in College First Year
Gap reduction:
16 percentage
points
Highest family income group
Lowest family income group
82
58
85
77
24
8
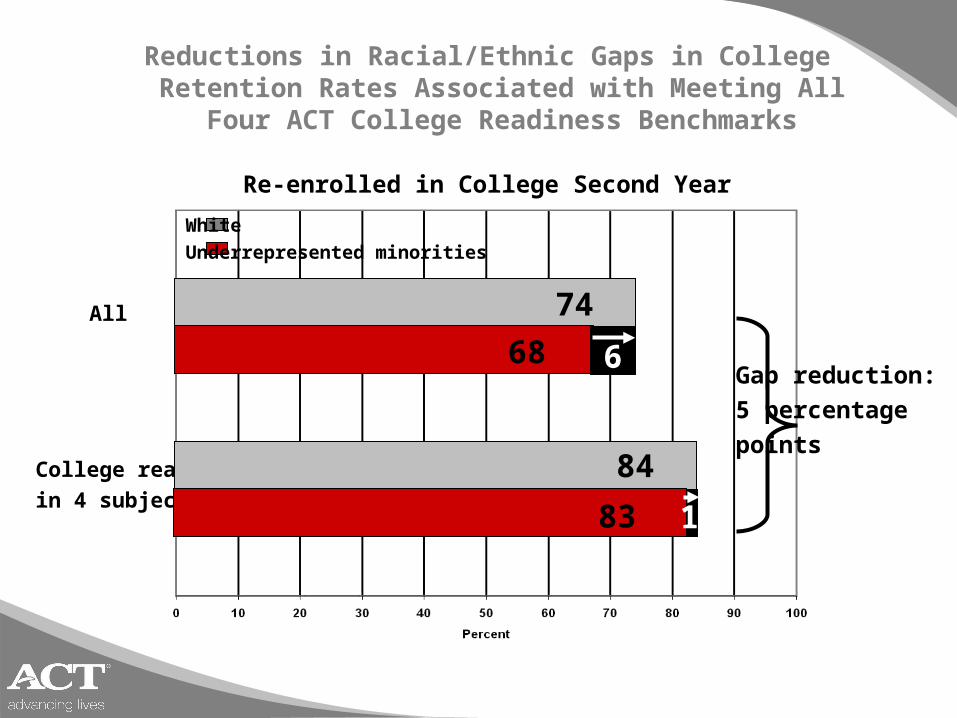
All
College ready
in 4 subjects
Reductions in Racial/Ethnic Gaps in College Retention Rates Associated with Meeting All Four ACT College
Readiness Benchmarks
Re-enrolled in College Second Year
Gap reduction:
5 percentage
points
White
Underrepresented minorities
74
68
84
83
6
1
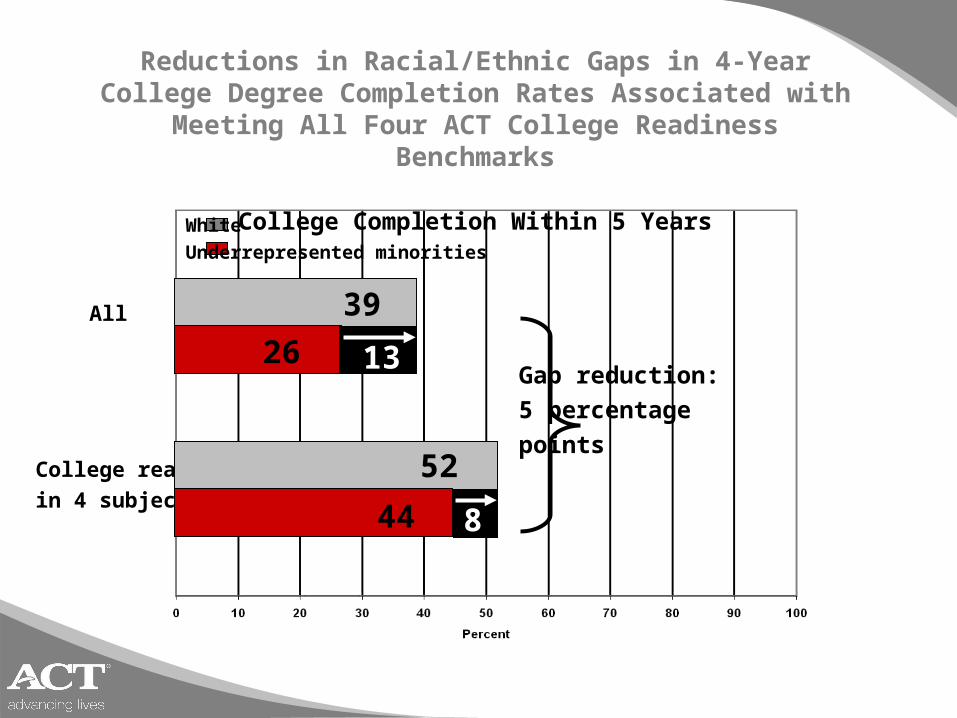
All
College ready
in 4 subjects
Reductions in Racial/Ethnic Gaps in 4-Year College Degree Completion Rates Associated with Meeting All Four ACT
College Readiness Benchmarks
College Completion Within 5 Years
Gap reduction:
5 percentage
points
White
Underrepresented minorities
39
26 13
52
44 8