the acute effects of thermogenic fitness drink formulas
TRANSCRIPT
RESEARCH ARTICLE Open Access
The acute effects of thermogenic fitnessdrink formulas containing 140mg and 100mg of caffeine on energy expenditure andfat metabolism at rest and during exerciseNicolas W. Clark1, Adam J. Wells1, Nicholas A. Coker1, Erica R. Goldstein1, Chad H. Herring1,Tristan M. Starling-Smith1, Alyssa N. Varanoske1, Valeria L. G. Panissa2, Jeffrey R. Stout1 and David H. Fukuda1*
Abstract
Background: Thermogenic fitness drink formulas (TFD) have been shown to increase energy expenditure andmarkers of lipid metabolism. The purpose of the current study was to compare TFD formulas containing differentcaffeine concentrations versus a placebo drink on energy expenditure and lipid metabolism at rest and duringexercise.
Methods: Thirty-two recreationally active participants (22.9 ± 0.7 y, 167.1 ± 1.4 cm, 68.8 ± 2.0 kg, 24.0 ± 1.2% fat) whowere regular caffeine consumers, participated in this randomized, double-blind, crossover design study. Participantsreported to the laboratory on three occasions, each of which required consumption of either a TFD containing 140mg or 100 mg of caffeine or a placebo. Baseline measurements of resting energy expenditure (REE) and resting fatoxidation (RFO) were assessed using indirect calorimetry as well as measurements of serum glycerol concentration.Measurements were repeated at 30, 60, 90 min post-ingestion. Following resting measures, participants completeda graded exercise test to determine maximal oxygen uptake (V̇O2max), maximal fat oxidation (MFO) and the exerciseintensity that elicits MFO (Fatmax), and total energy expenditure (EE).
Results: A significant interaction was shown for REE (p < 0.01) and RFO (p < 0.01). Area under the curve analysisshowed an increased REE for the 140 mg compared to the 100 mg formula (p = 0.02) and placebo (p < 0.01) and anincreased REE for the 100 mg formula compared to placebo (p = 0.02). RFO significantly decreased for caffeinatedformulas at 30 min post ingestion compared to placebo and baseline (p < 0.01) and significantly increased for the140 mg formula at 60 min post-ingestion (p = 0.03). A main effect was shown for serum glycerol concentrationsover time (p < 0.01). No significant differences were shown for V̇O2max (p = 0.12), Fatmax (p = 0.22), and MFO (p = 0.05),and EE (p = 0.08) across drinks.
Conclusions: Our results suggest that TFD formulas containing 100 and 140mg of caffeine are effective in increasing REEand that a 40mg of caffeine difference between the tested formulas may impact REE and RFO in healthy individualswithin 60min of ingestion.
Keywords: Caffeine, Energy drinks, Caloric expenditure, Fat oxidation, Exercise
© The Author(s). 2020 Open Access This article is distributed under the terms of the Creative Commons Attribution 4.0International License (http://creativecommons.org/licenses/by/4.0/), which permits unrestricted use, distribution, andreproduction in any medium, provided you give appropriate credit to the original author(s) and the source, provide a link tothe Creative Commons license, and indicate if changes were made. The Creative Commons Public Domain Dedication waiver(http://creativecommons.org/publicdomain/zero/1.0/) applies to the data made available in this article, unless otherwise stated.
* Correspondence: [email protected] of Kinesiology and Physical Therapy, Institute of Exercise Physiologyand Rehabilitation Science, University of Central Florida, Orlando, Florida, USAFull list of author information is available at the end of the article
Clark et al. Journal of the International Society of Sports Nutrition (2020) 17:10 https://doi.org/10.1186/s12970-020-0341-4

BackgroundCaffeine (1, 3, 7-trimethylxanthine) is a natural substanceoccurring in the seeds, leaves, and fruits of over 60 plantsand is the most widely consumed psychostimulant in theworld [1–3]. According to Fulgoni et al. [1], nearly 89% ofthe adult population in the United States consumes caf-feine in the form of food, beverages, medication, and diet-ary supplements. Among caffeinated beverages, energydrinks are estimated to represent a small share of 3–10%of all age consumers [4–8]. The energy drink market,however, has grown 240% between the years of 2004–2009, which makes it one of the fastest growing nutritionmarkets in the United States [3, 6, 8–10].Energy drinks may contain caffeine from a wide variety
of sources, in addition to other bioactive ingredients(e.g., catechin polyphenols) that are purportedly addedto increase physical stamina and promote mental alert-ness [11]. Among some of the different formulations ofenergy drinks, thermogenic fitness drinks (TFD) typicallycontain blends of caffeine-containing substances such asgreen tea and guarana extracts that are marketed withthe intent to support weight loss. For example, a blendof these components has been shown to be effective inincreasing daily energy expenditure by 8% when con-sumed before a meal three times per day, as comparedto placebo [12]. Caffeine is a stimulant of the centralnervous system [13]. Sympathoadrenal system activationresulting in increased epinephrine concentration, has thepotential to increase lipid mobilization and consequentlylipolysis [14]. Previous research with TFD containing200 mg of caffeine have shown increased resting energyexpenditure, circulating glycerol, and free fatty acids[15]. In addition to an increased thermogenic effect dur-ing rest [16], caffeine has been shown to potentially in-crease the rate of fat oxidation, while separatelyenhancing exercise performance [17, 18]; although, lessis known about the metabolic response to a TFD duringexercise [19].The amount of caffeine occurring naturally in both
coffee and tea is highly variable (e.g. roast, product, tealeaf, etc.). Energy drinks, energy shots, and—under thesame category—TFDs contain lower variability in theamount of caffeine as part of the formulas (approxi-mately 15%) [20]. Recently, Benson et al. [4] reportedthat the overall national average for caffeine consump-tion was 195 mg/day, which is above the 50th percentile(143 mg/day) reported in the NHANES 2013–2016 data.Caffeine may have anxiogenic effects in some individualsand previous studies have shown that overall consump-tion is moderated by caffeine concentration per drink,with fewer drinks consumed with greater amounts ofcaffeine per beverage [5, 21, 22]. A concern exists withinthe literature regarding risk for severe medical eventswith caffeine consumption above 400 mg, which is the
Food and Drug Administration’s (FDA) maximum rec-ommended daily amount of caffeine [23, 24].Studies that have examined caffeine consumption on
an hourly basis have demonstrated that beverages withhigher caffeine concentrations, such as coffee, are dis-proportionately consumed in the morning with relativelyless caffeinated products ingested throughout the re-mainder of the day [4, 25]. It is plausible that the avail-ability of lower absolute doses of caffeine in TFD couldbe useful in allowing consumers to selectively moderateboth intake and timing, while lowering risk for adverseside effects due to unintentional excessive consumption,especially if a minimal threshold (or range of caffeine)could be identified that produces thermogenic and ergo-genic effects like highly caffeinated products.The present study examined the acute effects of two
different commercially available TFD formulas contain-ing 140 mg and 100 mg and a placebo drink on metabol-ism during rest and exercise. We hypothesized that bothcaffeinated formulas would display an increase in energyexpenditure as measured by indirect calorimetry andserum concentration of glycerol at rest compared to pla-cebo, but no differences would be noted among caffein-ated formulas. We also hypothesized that caffeinatedformulas would increase maximal oxygen uptake, max-imal fat oxidation and the exercise intensity that elicitsmaximal fat oxidation, and energy expenditure (EE)across drinks when compared to a placebo, as measuredby indirect calorimetry, during a graded exercise test.
MethodsExperimental protocolThree testing visits separated by a minimum of 48 hwere completed within a two-week period. The timelinefor each testing visit is outlined in Fig. 1. Participantswere asked to maintain a consistent diet and track theirfood and beverage intake for the entire day prior to eachof the three testing visits. Each testing visit was sched-uled in the morning between 8 am, and 9 am, followingan 8-h fast with no caffeine consumption and a 24-hperiod of no exercise or alcohol consumption. Baselinehydration status was evaluated upon arrival to the la-boratory. After assessing height, body mass, and bodycomposition, participants were led to a calm and quietenvironment for baseline measurements consisting of abaseline blood draw for determining serum glycerol con-centration followed by analysis of resting metabolic rate.A randomized, double-blind, crossover design wasemployed where participants were assigned to completethree trials, each of which required consumption of oneof the following beverages:
(a) 140 mg formula (10 kcal drink containing a total of140 mg of caffeine from a proprietary blend of
Clark et al. Journal of the International Society of Sports Nutrition (2020) 17:10 Page 2 of 9

caffeine, guarana, ginger, and green tea extractcontaining EGCG),
(b) 100 mg formula (10 kcal drink containing a total of100 mg of caffeine from a proprietary blend ofcaffeine, guarana, ginger, and green tea extractcontaining EGCG),
(c) Placebo (artificially sweetened non-caloric/non-caf-feinated drink).
Assessments were repeated at 30, 60, and 90min fol-lowing consumption of each beverage. Immediately fol-lowing the last resting measurements, a graded exercisetest was conducted to determine metabolic responsesand performance outcomes.
ParticipantsThirty-two recreationally active men (n = 15) andwomen (n = 17) between the ages of 18 and 35 years oldwho were regular caffeine consumers of no more than250 mg per day were recruited to participate in this re-search investigation (Table 1). After participants signedthe informed consent they completed the Physical Activ-ity Readiness Questionnaire (PARQ+), medical and ac-tivity history questionnaire (MHQ), and a caffeineconsumption questionnaire adapted from Landrum [26].This study was approved by the university’s InstitutionalReview Board. Participants were excluded if they had
any physical limitations, metabolic diseases, were caf-feine naïve or consumed more than 250 mg of caffeineper day according to the caffeine consumption question-naire, and/or did not meet the ACSM recommendationof at least 150 min of exercise per week for the past 6months [27].
Nutrient intake and dietary recallParticipants were required to complete a 24-h dietary re-call. Dietary intake data for 24-h recalls were collectedand analyzed using the Automated Self-Administered24-h (ASA24) dietary assessment tool (version 2018, Na-tional Cancer Institute, Bethesda, MD) [28]. The ASA24dietary recall assessment was utilized to estimate meantotal energy intake (TEI) in kilocalories (Kcal) beforeeach testing day. Participants were provided with a loginand a password and detailed tutorial on how to accessand complete the ASA24. The dietary recall was com-pleted the night before each testing visit and after thelast food item or drink consumed. During the recall, par-ticipants received automated prompts that would assistthem in quantifying portion sizes, actual volume of foodconsumed at each meal or snack, and commonly forgot-ten items (condiments, supplements, sugar-sweetenedbeverages). A total of 27 participants complied with thedietary recall instructions and were included in the dataanalysis.
Hydration status, anthropometrics, and body compositionParticipants were asked to refrain from food or drinkconsumption—except water—for 8 h prior to testing andto be euhydrated. Urine samples were analyzed for hy-dration status using the refractometry method (HumanUrine Refractometer, MISCO Refractometer, Cleveland,OH, USA). Participants could not initiate testing untilproper hydration was confirmed, and specific gravity ofthe urine was less than or equal to 1.020. Following hy-dration testing, height was assessed using a stadiometer
Fig. 1 Experimental design of the study; = hydration test, = anthropometrics and body composition, = blood draw, RMR= resting
metabolic rate, = thermogenic fitness drink formula, =graded exercise test
Table 1 Participant demographics
Age (years) 22.9 ± 0.7
Height (centimeters) 167.1 ± 1.4
Weight (kilograms)a 68.8 ± 2.0
Body fat (%)a 24.0 ± 1.2
Total energy intake (kcal)a 1918 ± 127.6
Caffeine intake (g/week) 832 ± 69
Data [(n = 32 except for Total Energy Intake (n = 27)] are expressed as means ± SEaaverage across testing visits
Clark et al. Journal of the International Society of Sports Nutrition (2020) 17:10 Page 3 of 9

(500KL Health O Meter, Alsip, IL, USA). Body fat per-centage (%BF) was estimated using a multi-frequencybioelectrical impedance analysis device (InBody 770,InBody, Seoul, Korea) and body mass (BM) was mea-sured with a built-in scale. Participants were testedwearing minimal clothing and barefoot without socks.
Resting metabolic rate testingResting metabolic rate (RMR) was measured using anautomated metabolic gas analysis system (TrueOne2400, Parvo Medics, Sandy, Utah, USA) to examinechanges in whole-body metabolism after drink ingestion.After hydration status and body composition measure-ments were obtained, participants were led to a calm,quiet, mild-light, temperature (21–24 °C) controlled en-vironment. Participants were instructed to lie in a supineposition while enclosed in a clear hard plastic canopy,which was attached to the metabolic cart and dilutionpump via a breathing tube. Oxygen uptake (V̇O2) andcarbon dioxide production (V̇CO2) were measured for30 min at baseline and for 20 min at the 30-, 60-, and90-min time points post-ingestion. Respiratory gasvalues were averaged over one-minute intervals and pos-teriorly averaged for the last 10 min of each time pointto estimate resting energy expenditure (REE). Total REEwas also estimated by conducting area under the curveanalyses over the 90-min procedure. As recommendedby the manufacturer, a non-protein stoichiometric equa-tion was used to estimate resting fat oxidation rate(RFO) (1.695 · V̇O2–1.701 · V̇CO2) [29].
Blood venous sampling and glycerol analysisVenous blood was obtained during rest from the antecu-bital area of the arm using a Teflon cannula with athree-way stopcock with a male luer lock adapter. Thecannula was maintained patent using a non-heparinizedisotonic saline solution for the duration of the trial. Atotal of four blood draws occurred for each trial (base-line, 30, 60, and 90min post-ingestion) collected in two10mL serum Vacutainer® tubes. Following a given blooddraw, the tube was allowed to clot for 30 min followedby centrifugation at 4000 x g for 15 min. Serum sampleswere placed into separate 1.8-mL microcentrifuge tubesand stored at -80°C in the Exercise Biochemistry Lab forlater analysis. Serum glycerol was determined via directenzymatic analysis using a commercially available assay(Clinical Glycerol II Reagent Kit GMRD-177; Analox In-struments Ltd., Stourbridge, UK). All samples for eachassay were thawed once and analyzed in duplicate by thesame technician to reduce potential inter-assay variance(CV:7.3%). Due to technical issues, glycerol concentra-tion analyses were not completed for three participants.
Graded exercise test, indirect calorimetry, andcalculationsParticipants performed a graded exercise test to exhaus-tion (GXT) on an electromagnetically-braked cycle erg-ometer (Corival, Lode B.V., Groningen, Netherlands).The GXT protocol consisted of a 10-min warm-up at 50watts for male participants and 30 watts for female par-ticipants. Work rate was increased by 35 watts for malesand 25 watts for females every 3 min until volitional fa-tigue. Breath-by-breath gas exchange data were collectedusing a metabolic gas analyzer (K-5 CPET, Cosmed,Rome, Italy) and used to determine maximal oxygen up-take (V̇O2max) and total energy expenditure during exer-cise (EE). The rating of perceived exertion from Borg’s10-point scale was recorded during each stage of theGXT and immediately upon completion to confirmmaximal exertion [30]. Average values for V̇O2 andV̇CO2 for the last minute of each stage were calculatedusing stoichiometric equations and used to determinefat oxidation, while assuming negligible protein oxida-tion [31]. Maximal fat oxidation (MFO) and the exerciseintensity at which MFO occurred (Fatmax) were then de-termined using a third order polynomial function foreach participant [32]. Two participants did not completethe GXT due to technical issues and Fatmax could not beobtained for an additional two participants; therefore, atotal of 28 participants were included in the finalanalysis.
Statistical analysisAll analyses were conducted with an open-source statis-tical analysis software program (JASP; version 0.9).Alpha level was set a priori at p < 0.05. Data wereassessed for sphericity and in case the assumption wasviolated, Greenhouse-Geisser correction was applied.Total energy intake, BM, %BF, REE, as well as V̇O2 max,EE, Fatmax, and MFO were compared using separateone-way repeated analysis of variance (ANOVA). Restingenergy expenditure, RFO, and blood glycerol were evalu-ated using a two-way (trial × time) repeated measuresanalysis of variance. If a significant difference (p < 0.05)was observed, Holm post hoc analyses were conducted,and effect sizes were calculated as Cohen’s d values.Follow-up one-way repeated measure ANOVAs wereused to reveal differences across trials and time pointswhen necessary.
ResultsNutritional intake, anthropometrics, and bodycompositionNo significant differences were found for TEI (p = 0.27),BM (p = 0.77), and %BF (p = 0.32) across visits. Partici-pant demographics are provided in Table 1.
Clark et al. Journal of the International Society of Sports Nutrition (2020) 17:10 Page 4 of 9

Resting metabolic rateA significant trial × time interaction was found for REE(p < 0.01). Follow-up repeated measure ANOVAs re-vealed differences across trials and time points (Fig. 2).There were no significant differences at baseline acrosstrials between the 140mg formula, 100 mg formula, andplacebo trials (p = 0.76). However, REE was significantlyhigher at 30 min post-ingestion, for the 140 mg formulatrial as compared to the 100 mg formula (p = 0.02; d =0.490) and placebo (p < 0.01; d = 0.830) trials, which didnot significantly differ between each other (p = 0.06). At60 min post-ingestion, REE values were significantlygreater for the 140 mg formula compared to 100 mgformula (p = 0.02; d = 0.439) and placebo (p < 0.01; d =0.925). A significant difference for REE was also found at60 min post-ingestion between the 100 mg formula andplacebo (p = 0.01; d = 0.508). REE for both of the caffein-ated formulas was significantly greater at 90 min post-ingestion compared to placebo (140 mg: p < 0.01; d =0.788; 100 mg: p = 0.03; d = 0.468), but not different be-tween each other (p = 0.39). Across time, the 140 mgformula and the 100 mg formula both significantly in-creased REE at 30 (p = 0.01, d = − 0.756; p = 0.03, d =0.546, respectively), 60 (p = 0.01, d = − 0.749; p = 0.03,d = − 0.518, respectively), and 90 min post-ingestion(p = 0.02, d = − 0.524; p = 0.03, d = − 0.526) compared tobaseline. No significant differences over time wereshown for REE during the placebo trial (p = 0.11).Total REE estimated from area under the curve analysis
demonstrated significant differences between all trials (p <0.01; 140mg = 101.0 ± 14.7 kcal; 100mg = 99.1 ± 15.2 kcal;placebo = 97.3 ± 15.2 kcal). Post hoc revealed that 140mgformula demonstrated the greatest caloric expenditurecompared to 100mg formula (p = 0.02; d = 0.462) and
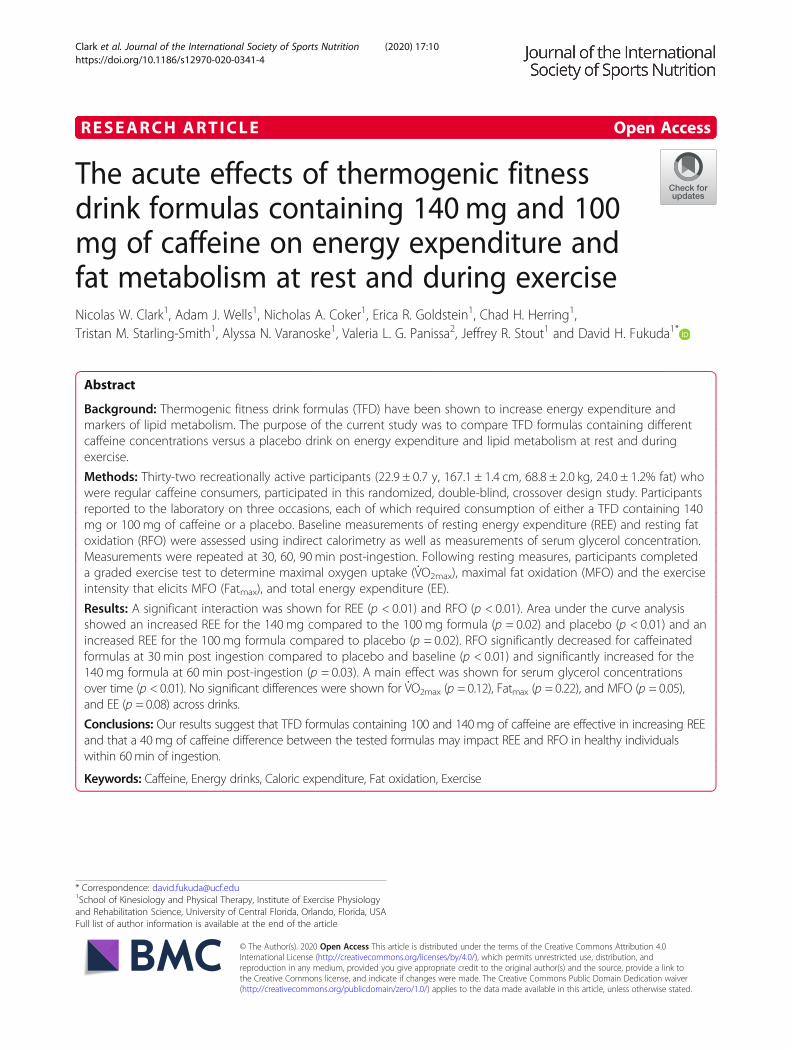
placebo (p = < 0.01; d = 0.911) and that 100mg formulawas significantly greater than placebo (p = 0.02; d = 0.449).A significant trial × time interaction was found for RFO
(p < 0.01; Fig. 3). Follow-up repeated measure ANOVAs re-vealed differences across trials and time points. At baseline,no significant differences were noted between the 140mgformula, 100mg formula, and placebo trials (p = 0.92).However, at 30min post-ingestion, a significantly lowerRFO was noted in the 100mg (p < 0.01, d = − 0.702) and140mg (p < 0.01; d = − 0.841) formulas compared to pla-cebo, while no significant differences were noted betweenthe 140mg and 100mg formulas (p = 0.56; d = − 0.104). At60min post-ingestion, RFO values changed and were sig-nificantly higher for the 140mg formula compared to pla-cebo (p = 0.02; d = 0.504) but were not different from the100mg formula (p = 0.28; d = 0.269). Moreover, 100mgwas not significantly different than placebo (p = 0.28; d =0.199). Results were similar at 90min post-ingestion withRFO being significantly higher for the 140mg formulacompared to placebo (p = 0.03; d = 0.486), while no differ-ences were shown between the 100mg formula and the140mg formula (p = 0.16; d = 0.321) or 100mg formulaand placebo (p = 0.22; d = 0.220). Compared to baseline,RFO decreased significantly at 30min post-ingestion duringthe 140mg formula trial (p < 0.01; d = 1.030) and increasedsignificantly at 60min post-ingestion (p = 0.03; d = − 0.485).No significant difference was noted between baseline and90min post-ingestion (p = 0.08; d = − 0.377). For the 140mg formula, RFO values at 30min were significantly lowerthan 60 (p < 0.01; d = − 2.159) and 90min post-ingestion(p < 0.01; d = − 2.118). The 100mg formula displayed simi-lar results with significantly lower RFO at 30min post-ingestion compared to baseline (p < 0.01; d = 1.042); how-ever, no significant differences were shown at 60 (p = 1.00;
Fig. 2 Resting energy expenditure (kcal/day); data (n = 32) are expressed as mean ± SE. # different than baseline; * different than placebo (p < 0.05).30p =measurement average at 30min post drink ingestion; 60p =measurement average at 60min post drink ingestion; 90p =measurement averageat 90min post drink ingestion
Clark et al. Journal of the International Society of Sports Nutrition (2020) 17:10 Page 5 of 9
d = − 0.088) and 90min post-ingestion (p = 1.00; d = 0.025)compared to baseline. Significantly higher RFO valueswere shown at 60 (p < 0.01; d = − 1.166) and 90 min(p < 0.01; d = − 1.274) compared to 30 min post-ingestion for the 100 mg formula, while values at 60were not significantly different than 90 min post-ingestion (p = 0.64; d = 0.225). Placebo did not signifi-cantly change across time (p = 0.11).
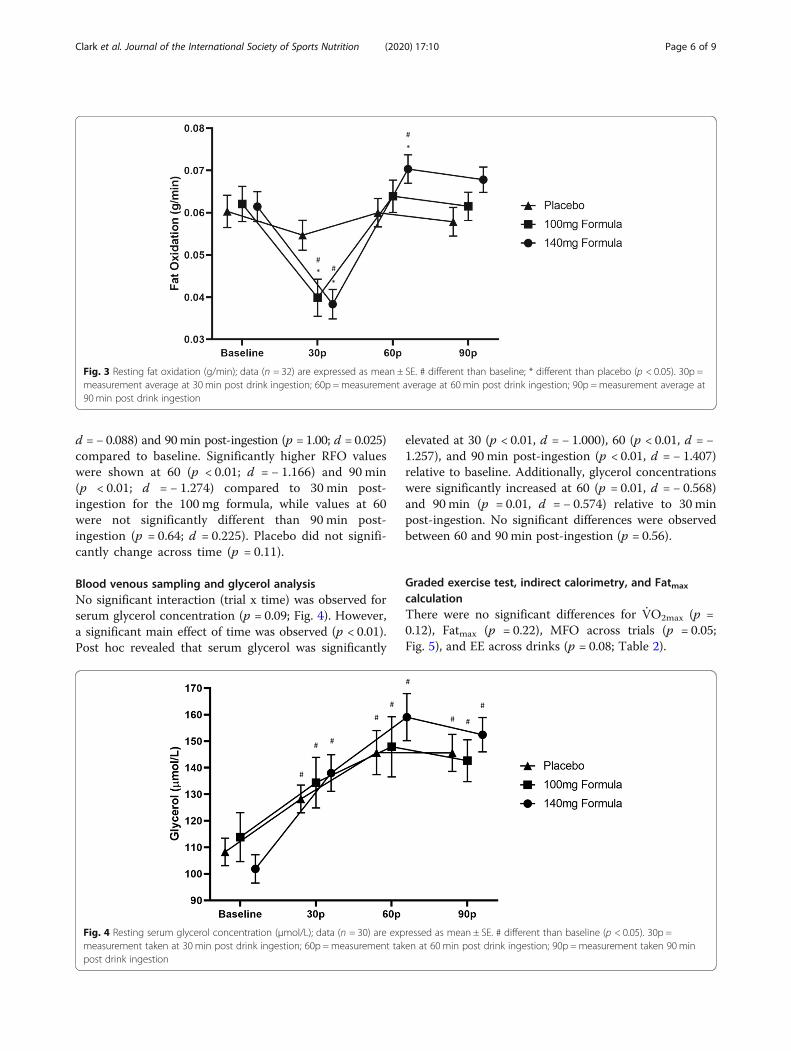
Blood venous sampling and glycerol analysisNo significant interaction (trial x time) was observed forserum glycerol concentration (p = 0.09; Fig. 4). However,a significant main effect of time was observed (p < 0.01).Post hoc revealed that serum glycerol was significantly
elevated at 30 (p < 0.01, d = − 1.000), 60 (p < 0.01, d = −1.257), and 90 min post-ingestion (p < 0.01, d = − 1.407)relative to baseline. Additionally, glycerol concentrationswere significantly increased at 60 (p = 0.01, d = − 0.568)and 90 min (p = 0.01, d = − 0.574) relative to 30 minpost-ingestion. No significant differences were observedbetween 60 and 90 min post-ingestion (p = 0.56).
Graded exercise test, indirect calorimetry, and Fatmax
calculationThere were no significant differences for V̇O2max (p =0.12), Fatmax (p = 0.22), MFO across trials (p = 0.05;Fig. 5), and EE across drinks (p = 0.08; Table 2).
Fig. 3 Resting fat oxidation (g/min); data (n = 32) are expressed as mean ± SE. # different than baseline; * different than placebo (p < 0.05). 30p =measurement average at 30 min post drink ingestion; 60p =measurement average at 60min post drink ingestion; 90p =measurement average at90min post drink ingestion
Fig. 4 Resting serum glycerol concentration (μmol/L); data (n = 30) are expressed as mean ± SE. # different than baseline (p < 0.05). 30p =measurement taken at 30 min post drink ingestion; 60p =measurement taken at 60 min post drink ingestion; 90p =measurement taken 90 minpost drink ingestion
Clark et al. Journal of the International Society of Sports Nutrition (2020) 17:10 Page 6 of 9

DiscussionThe main finding of this study was that a decrease from140mg to 100 mg of caffeine within the examinedthermogenic fitness drink (TFD) formulas appear to pro-mote changes in energy expenditure (REE) and fat me-tabolism (RFO) at rest in healthy individuals. Resultsshowed a significant increase in total REE over the 90-min trial for the 140 mg formula, as compared to the100 mg formula (+ 2%) and placebo (+ 4%). Our resultsare similar to the findings of Mendel and Hofheins [33],who compared the metabolic effects of a similar TFD(200 mg of caffeine) to a caffeine containing diet softdrink (45 mg) 3-h post-ingestion. Their results indicateda significant increase in resting V̇O2 in L/min for theTFD at all time points, as compared to no significantchange when consuming the diet soft drink [33]. In thepresent study, our formulas displayed a 5.8% increase for140 mg formula and a 3.9% increase for the 100 mg for-mula at 60 min post-ingestion; whereas Mendel and
Hofheins [33] reported an increase of 13.8% for the 200mg TFD at the same time point.Conversely, Gonzalez et al. [34] administered regular
and time release caffeine containing supplements with194 mg of caffeine and did not find any significant differ-ence for REE or glycerol over the course of 8 h; however,it must be noted that participants were habitual caffeineconsumers with a reported daily average intake greaterthan 200 mg. In agreement with this study [34] andDalbo et al. [15], we also found no significant differencesfor changes in glycerol between TFDs and placebo, al-though a significant increase over time was displayedpossibly due to fat cycling provoked by the fasted condi-tions (10 kcal for caffeinated formulas and 0 kcal for pla-cebo) [35]. Alternatively, both Graham et al. [36] andAstrup et al. [16] showed a significantly greater serumconcentration of glycerol during rest following the inges-tion of higher caffeine doses (6 mg/kg and 200 mg of caf-feine, respectively). However, these comparisons weremade with placebo formulas containing dextrose andlactose, respectively, which could have possibly increasedblood glucose and insulin concentrations and conse-quently reduced lipolysis for the placebo trials. Providedthat participants in this study ingested a much lowerrelative amount of caffeine per body mass (1.5 ± 0.3 mg/kg for 100 mg formula and 2.1 ± 0.4 mg/kg for 140 mgformula) and that some evidence suggests that serumglycerol rise is not always a sensitive measure of lipidmobilization, we also estimated RFO by the use of indir-ect calorimetry and stoichiometric equations [14].Interestingly, results from these estimates presented
oscillatory effect for substrate utilization throughout the90min of rest. Initially, at 30 min after ingestion, RFOdecreased for both caffeinated formulas suggestinggreater carbohydrate utilization during this time period.A similar response has been reported for a differentnoncaloric energy drink formula containing 114 mg ofcaffeine, taurine, vitamins and, aspartame and acesul-fame K with the hypothesis given that the artificialsweeteners typically present in most of these formulasmay have an impact on the respiratory quotient via sen-sorial stimulation and possibly insulin secretion [37].Nonetheless, the present study found that RFO was sig-nificantly increased for the 140 mg formula, but not for100 mg formula at 60 min post-ingestion. This findingsuggests that a dosage between 100mg and 140 mg ofcaffeine may represent a minimum threshold for thetested formula to impact fat metabolism at rest for theparticipants in this study.The effects of caffeine on energy expenditure (EE) and
the maximal fat oxidation (MFO) during exercise wererecently studied by Gutiérrez-Hellín and Del Coso [18]who reported an increase in MFO rates (between 30 and70% V̇O2max) following consumption of 3 mg/kg of p-
Fig. 5 Maximal fat oxidation during exercise (g/min); data (n = 28)are expressed as mean ± SE
Table 2 GXT variables
Variable Placebo 100mg Formula 140 mg Formula
V̇O2max (mL/kg·min) 36.5 ± 1.3 37.5 ± 1.3 38.2 ± 1.5
Fatmax (W) 60.3 ± 3.4 64.5 ± 3.3 65.6 ± 3.7
MFO (g/min) 0.33 ± 0.03 0.33 ± 0.2 0.38 ± 0.03
EE (kcal) 168.7 ± 9.2 172.9 ± 9.4 182.7 ± 10.3
Data is expressed as mean ± SE. MFO=maximal fat oxidation; EE = total energyexpenditure during exercise
Clark et al. Journal of the International Society of Sports Nutrition (2020) 17:10 Page 7 of 9

synephrine and caffeine, but no difference for Fatmax
(the power output reached at MFO) or EE. As a stimu-lant of the central nervous system, caffeine was shownto influence metabolism, which may have affected beta-adrenoreceptors and fat oxidation during exercise.Nonetheless, no significant differences were reported forEE, Fatmax, and MFO in this study. Thus, higheramounts of caffeine or a shorter amount of time be-tween ingestion and exercise (< 2 h) may be required tosubstantially affect MFO during incremental exercise.Most notably, this is the first study to our knowledge
to show significant differences in REE and RFO betweenabsolute amounts of 100 mg and 140 mg of caffeine aspart of a TFD formula in physically active men andwomen and to have a repeated measures design to doso. Our results suggest a minimum threshold that islikely to be above 100 mg of caffeine and that a smalldecrement in the caffeine content of a commerciallyavailable TFD may influence thermogenesis and fat me-tabolism at rest in the current cohort of participants. Itis important to note that weight loss and/or fat loss can-not be directly inferred from the current results, and itis unknown whether increased REE at rest in a chronicenergy deficit would ultimately result in fat loss. There-fore, we propose that future work evaluate the acute andchronic differences of different formulas with varyingdoses of caffeine on energy expenditure and fat metabol-ism at rest and during exercise.
ConclusionsAcute ingestion of a TFD containing either 140 mg or100 mg of caffeine significantly increased resting meta-bolic rate in the current cohort of participants, while theTFD containing 140 mg of caffeine appears to have alsoincreased resting fat oxidation. However, no significantdifferences were shown for GXT variables suggestingthat higher dosages of caffeine or a shorter duration be-tween ingestion and subsequent physical activity may berequired to influence energy expenditure and fat metab-olism during exercise.
AcknowledgmentsWe would like to thank participants for their time and collaboration duringthe study as well as Dr. Michael J. Redd who assisted in data collection. Wewould also like to thank the student members of the Institute of ExercisePhysiology and Rehabilitation Science David Boffey, Idan Harat, JustineRenziehausen, Paola Rivera, and Bri-Ana Johnson, for their support andcollaboration during data collection. Valeria Leme Gonçalvez Panissa wassupported by the São Paulo Research Foundation (2015/11302-3).
Authors’ contributionsNWC: primary author, recruitment, data analysis, statistical analysis, andmanuscript preparation. AJW: study co-investigator, manuscript preparation,data/specimen analysis. NAC: secondary author, manuscript preparation,data/specimen analysis. ERG: secondary author, manuscript preparation, dataanalysis. CHH: secondary author, recruitment, manuscript preparation, dataanalysis. TMS: secondary author, data analysis. ANV: secondary author, data/specimen analysis. VLGP: secondary author, data analysis. JRS: co-investigator,
manuscript preparation, helped obtain grant funds for the project. DHF:principal investigator of the study who obtained grant funds for the project,supervised data collection and analysis, supervised statistical analyses, andco-authored paper. All authors have read and approved the final manuscript.
FundingCelsius Holding, Incorporated (Boca Raton, FL) provided funding for thisproject through the University of Central Florida. All researchers involvedindependently collected, analyzed, and interpreted the results of this studyand have no financial interests concerning the outcome of this investigation.
Availability of data and materialsThe datasets used and/or analysed during the current study are availablefrom the corresponding author on reasonable request.
Ethics approval and consent to participateParticipants read and signed the informed consent before enrolling in thisresearch study. The University of Central Florida Institutional Review Boardapproved this research study (BIO-17-13679). All the procedures have beenperformed in accordance with the Declaration of Helsinki.
Consent for publicationNot Applicable.
Competing interestsThe authors declare that they have no competing interests.
Author details1School of Kinesiology and Physical Therapy, Institute of Exercise Physiologyand Rehabilitation Science, University of Central Florida, Orlando, Florida,USA. 2Department of Sport, School of Physical Education and Sport,University of São Paulo, São Paulo, Brazil.
Received: 31 July 2019 Accepted: 30 January 2020
References1. Fulgoni VL, Keast DR, Lieberman HR. Trends in intake and sources of
caffeine in the diets of US adults: 2001–2010. Am J Clin Nutr. 2015;101:1081–7.
2. Nawrot P, Jordan S, Eastwood J, Rotstein J, Hugenholtz A, Feeley M. Effectsof caffeine on human health. Food Addit Contam. 2003;20:1–30.
3. Bailey RL, Saldanha LG, Gahche JJ, Dwyer JT. Estimating caffeine intake fromenergy drinks and dietary supplements in the United States. Nutr Rev. 2014;72(Suppl 1):9–13.
4. Benson SM, Unice KM, Glynn ME. Hourly and daily intake patterns among U.S. caffeinated beverage consumers based on the National Health andnutrition examination survey (NHANES, 2013–2016). Food Chem Toxicol.2019;125:271–8.
5. Tran NL, Barraj LM, Bi X, Jack MM. Trends and patterns of caffeineconsumption among US teenagers and young adults, NHANES 2003–2012.Food Chem Toxicol. 2016;94:227–42.
6. Heckman MA, Sherry K, De Mejia EG. Energy drinks: an assessment of theirmarket size, consumer demographics, ingredient profile, functionality, andregulations in the United States. Compr Rev Food Sci F. 2010;9:303–17.
7. Verster JC, Koenig J. Caffeine intake and its sources: a review of nationalrepresentative studies. Cr Rev Food Sci. 2018;58:1250–9.
8. Mitchell DC, Knight CA, Hockenberry J, Teplansky R, Hartman TJ. Beveragecaffeine intakes in the U.S. Food Chem Toxicol. 2014;63:136–42.
9. Nehlig A. Interindividual differences in caffeine metabolism and factorsdriving caffeine consumption. Alexander SPH, editor. Pharmacol Rev. 2018;70:384–411.
10. Norton TR, Lazev AB, Sullivan MJ. The “buzz” on caffeine: patterns of caffeineuse in a convenience sample of college students. J Caff Res. 2011;1:35–40.
11. Higgins JP, Babu K, Deuster PA, Shearer J. Energy Drinks: A ContemporaryIssues Paper. Curr Sports Med Rep. 2018;17:65.
12. Bérubé-Parent S, Pelletier C, Doré J, Tremblay A. Effects of encapsulatedgreen tea and guarana extracts containing a mixture of epigallocatechin-3-gallate and caffeine on 24 h energy expenditure and fat oxidation in men.Br J Nutr. 2005;94:432–6.
Clark et al. Journal of the International Society of Sports Nutrition (2020) 17:10 Page 8 of 9

13. Koenig J, Jarczok MN, Kuhn W, Morsch K, Schäfer A, Hillecke TK, et al.Impact of caffeine on heart rate variability: a systematic review. J Caff Res.2013;3:22–37.
14. Acheson KJ, Gremaud G, Meirim I, Montigon F, Krebs Y, Fay LB, et al.Metabolic effects of caffeine in humans: lipid oxidation or futile cycling? AmJ Clin Nutr. 2004;79:40–6.
15. Dalbo VJ, Roberts MD, Stout JR, Kerksick CM. Acute effects of ingesting acommercial thermogenic drink on changes in energy expenditure andmarkers of lipolysis. J Int Soc Sports Nutr. 2008;5:6.
16. Astrup A, Toubro S, Cannon S, Hein P, Breum L, Madsen J. Caffeine: adouble-blind, placebo-controlled study of its thermogenic, metabolic, andcardiovascular effects in healthy volunteers. Am J Clin Nutr. 1990;51:759–67.
17. Costill DL, Dalsky GP, Fink WJ. Effects of caffeine ingestion on metabolismand exercise performance. Med Sci Sports. 1978;10:155–8.
18. Gutiérrez-Hellín J, Del Coso J. Effects of p-Synephrine and Caffeine Ingestion onSubstrate Oxidation during Exercise. Med Sci Sports Exerc. 2018;50:1899–906.
19. Purdom T, Kravitz L, Dokladny K, Mermier C. Understanding the factors thateffect maximal fat oxidation. J Int Soc Sports Nutr. 2018;15:3.
20. Attipoe S, Leggit J, Deuster PA. Caffeine content in popular energy drinksand energy shots. Mil Med. 2016;181:1016–20.
21. Heckman MA, Weil J, Mejia EGD. Caffeine (1, 3, 7-trimethylxanthine) infoods: a comprehensive review on consumption, functionality, safety, andregulatory matters. J Food Sci. 2010;75:R77–87.
22. Temple JL. Review: trends, safety, and recommendations for caffeine use inchildren and adolescents. J Am Acad Child Psy. 2019;58:36–45.
23. Or F, Kim Y, Simms J, Austin SB. Taking Stock of Dietary Supplements’Harmful Effects on Children, Adolescents, and Young Adults. J AdolescHealth. 2019;S1054139X19301636.
24. Ali F, Rehman H, Babayan Z, Stapleton D, Joshi D-D. Energy drinks and theiradverse health effects: a systematic review of the current evidence.Postgrad Med. 2015;127:308–22.
25. Martyn D, Lau A, Richardson P, Roberts A. Temporal patterns of caffeineintake in the United States. Food Chem Toxicol. 2018;111:71–83.
26. Landrum R. College students’ use of caffeine and its relationship topersonality. Coll Stud J. 1992;26:151–5.
27. Garber CE, Blissmer B, Deschenes MR, Franklin BA, Lamonte MJ, Lee I-M,et al. American College of Sports Medicine position stand. Quantity andquality of exercise for developing and maintaining cardiorespiratory,musculoskeletal, and neuromotor fitness in apparently healthy adults:guidance for prescribing exercise. Med Sci Sports Exerc. 2011;43:1334–59.
28. Kirkpatrick SI, Subar AF, Douglass D, Zimmerman TP, Thompson FE, KahleLL, et al. Performance of the automated self-administered 24-hour recallrelative to a measure of true intakes and to an interviewer-administered 24-h recall. Am J Clin Nutr. 2014;100:233–40.
29. Péronnet F, Massicotte D. Table of nonprotein respiratory quotient: anupdate. Can J Sport Sci. 1991;16:23–9.
30. Noble BJ, Borg GA, Jacobs I, Ceci R, Kaiser P. A category-ratio perceivedexertion scale: relationship to blood and muscle lactates and heart rate.Med Sci Sports Exerc. 1983;15:523–8.
31. Randell RK, Rollo I, Roberts TJ, Dalrymple KJ, Jeukendrup AE, Carter JM.Maximal fat oxidation rates in an athletic population. Med Sci Sports Exerc.2017;49:133–40.
32. Stisen AB, Stougaard O, Langfort J, Helge JW, Sahlin K, Madsen K. Maximalfat oxidation rates in endurance trained and untrained women. Eur J ApplPhysiol. 2006;98:497–506.
33. Mendel RW, Hofheins JE. Metabolic responses to the acute ingestion of twocommercially available carbonated beverages: a pilot study. J Int Soc SportsNutr. 2007;4:7.
34. Gonzalez AM, Hoffman JR, Wells AJ, Mangine GT, Townsend JR, Jajtner AR,et al. Effects of time-release caffeine containing supplement on metabolic rate,glycerol concentration and performance. J Sports Sci Med. 2015;14:322–32.
35. Klein S, Peters EJ, Holland OB, Wolfe RR. Effect of short- and long-term beta-adrenergic blockade on lipolysis during fasting in humans. Am J Phys. 1989;257:E65–73.
36. Graham TE, Helge JW, MacLean DA, Kiens B, Richter EA. Caffeine ingestiondoes not alter carbohydrate or fat metabolism in human skeletal muscleduring exercise. J Physiol. 2000;529(Pt 3):837–47.
37. Miles-Chan JL, Charrière N, Grasser EK, Montani J-P, Dulloo AG. The thermiceffect of sugar-free red bull: do the non-caffeine bioactive ingredients inenergy drinks play a role?: sugar-free energy drink and thermogenesis.Obesity. 2015;23:16–9.
Publisher’s NoteSpringer Nature remains neutral with regard to jurisdictional claims inpublished maps and institutional affiliations.
Clark et al. Journal of the International Society of Sports Nutrition (2020) 17:10 Page 9 of 9