the africa prosperity reportmedia.prosperity.com/2016/pdf/2016-africareport-web.pdf · 2016 the...
TRANSCRIPT
www.li.comwww.prosperity.com
2016
The Africa Prosperity Report
www.li.comwww.prosperity.com
©2016 Legatum Limited. All rights reserved. The Legatum Prosperity Index and its underlying methodologies comprise the exclusive intellectual property of Legatum and/or its affiliates. ‘Legatum’, the Legatum Logo and ‘Legatum Prosperity Index’ are the subjects of trade mark registrations of affiliates of Legatum Limited. Whilst every care has been taken in the preparation of this report, no responsibility can be taken for any error or omission contained herein. The Legatum Institute is the working name of the Legatum Institute Foundation, a registered charity (number 1140719), and a company limited by guarantee and incorporated in England and Wales (company number 7430903).
The Legatum Institute is an international think tank and educational charity focused on promoting prosperity. We do this by researching our core themes of revitalising capitalism and democracy. The Legatum Prosperity Index™, our signature publication, ranks 142 countries in terms of wealth and wellbeing.
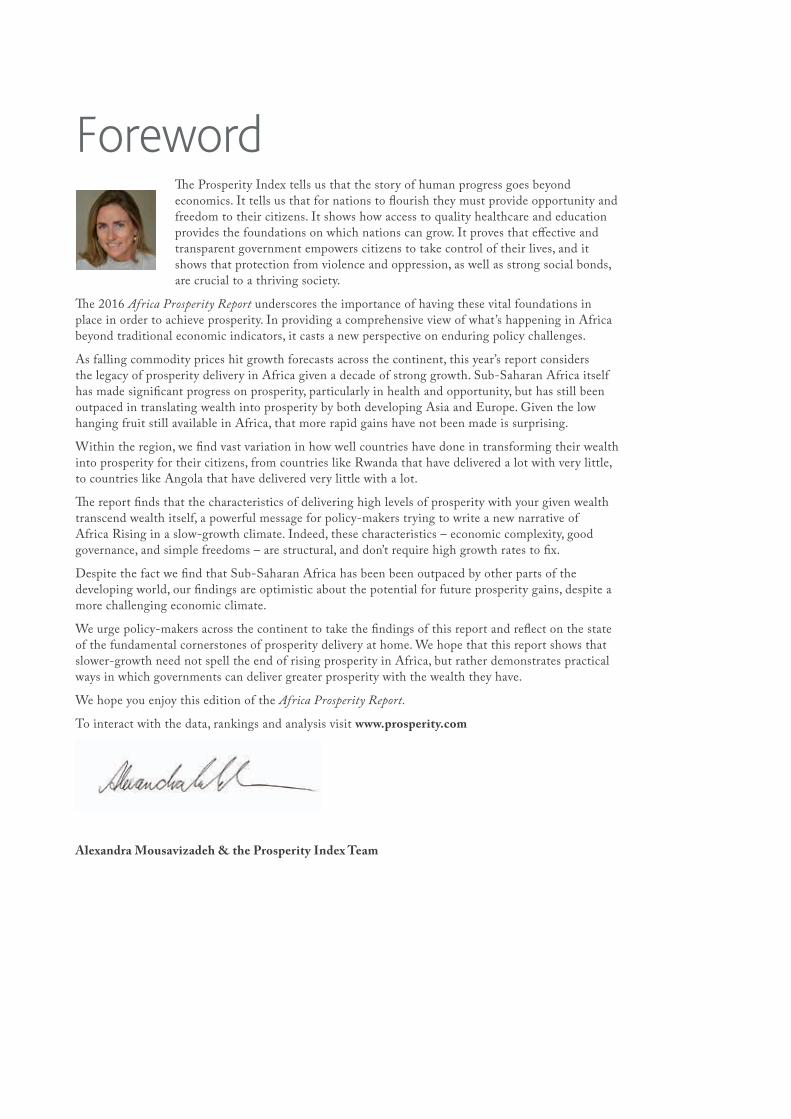
ForewordThe Prosperity Index tells us that the story of human progress goes beyond economics. It tells us that for nations to flourish they must provide opportunity and freedom to their citizens. It shows how access to quality healthcare and education provides the foundations on which nations can grow. It proves that effective and transparent government empowers citizens to take control of their lives, and it shows that protection from violence and oppression, as well as strong social bonds, are crucial to a thriving society.
The 2016 Africa Prosperity Report underscores the importance of having these vital foundations in place in order to achieve prosperity. In providing a comprehensive view of what’s happening in Africa beyond traditional economic indicators, it casts a new perspective on enduring policy challenges.
As falling commodity prices hit growth forecasts across the continent, this year’s report considers the legacy of prosperity delivery in Africa given a decade of strong growth. Sub-Saharan Africa itself has made significant progress on prosperity, particularly in health and opportunity, but has still been outpaced in translating wealth into prosperity by both developing Asia and Europe. Given the low hanging fruit still available in Africa, that more rapid gains have not been made is surprising.
Within the region, we find vast variation in how well countries have done in transforming their wealth into prosperity for their citizens, from countries like Rwanda that have delivered a lot with very little, to countries like Angola that have delivered very little with a lot.
The report finds that the characteristics of delivering high levels of prosperity with your given wealth transcend wealth itself, a powerful message for policy-makers trying to write a new narrative of Africa Rising in a slow-growth climate. Indeed, these characteristics – economic complexity, good governance, and simple freedoms – are structural, and don’t require high growth rates to fix.
Despite the fact we find that Sub-Saharan Africa has been been outpaced by other parts of the developing world, our findings are optimistic about the potential for future prosperity gains, despite a more challenging economic climate.
We urge policy-makers across the continent to take the findings of this report and reflect on the state of the fundamental cornerstones of prosperity delivery at home. We hope that this report shows that slower-growth need not spell the end of rising prosperity in Africa, but rather demonstrates practical ways in which governments can deliver greater prosperity with the wealth they have.
We hope you enjoy this edition of the Africa Prosperity Report.
To interact with the data, rankings and analysis visit www.prosperity.com
Alexandra Mousavizadeh & the Prosperity Index Team
3 | LEGATUM INSTITUTE | The 2016 Africa Prosperity Report
ContentsRankings
Prosperity in Africa 2016
Ranking Prosperity Delivery in Africa
Africa’s Prosperity: Rising but not Shining
Key Findings
The Legacy of Prosperity Delivery in Africa
At the Turning of the Economic High Tide: What Next for Africa’s Prosperity?
Delivering Greater Prosperity with Lower Growth
Diversify for Prosperity: Economic Complexity and Prosperity Delivery
The Cornerstones of Prosperity: Are Personal Freedom and Good Governance Prerequisites for Delivery?
Seven Recommendations to Grow Prosperity in Africa
Prosperity to 2030
Prosperity and the SDGs: An Independent Measure of Progress
Methodology
Acknowledgements
4
5
6
7
9
11
13
19
21
26
28
29
31
37
41
| 4LEGATUM INSTITUTE | The 2016 Africa Prosperity Report
OV
ERA
LL P
ROSP
ERIT
Y R
AN
K
CO
UN
TRY
ECO
NO
MY
ENTR
EPR
ENEU
RSH
IP &
O
PPO
RTU
NIT
Y
GO
VER
NA
NC
E
EDU
CAT
ION
HEA
LTH
SAFE
TY &
SEC
UR
ITY
PER
SON
AL
FREE
DO
M
SOC
IAL
CA
PITA
L
1 South Africa 12 1 4 2 9 19 8 6
2 Botswana 25 3 1 4 11 3 3 15
3 Morocco 1 4 7 8 3 7 23 8
4 Namibia 20 5 2 6 16 8 6 23
5 Algeria 2 7 18 1 1 9 35 21
6 Tunisia 10 2 12 3 2 5 29 35
7 Senegal 17 13 8 21 7 10 2 3
8 Rwanda 4 18 3 12 6 12 16 18
9 Ghana 30 9 5 7 5 2 12 25
10 Burkina Faso 3 27 13 24 17 11 5 17
11 Kenya 24 8 14 11 12 33 7 9
12 Benin 21 22 9 16 19 1 1 36
13 Egypt, Arab Rep. 15 6 24 5 4 15 37 27
14 Mali 13 24 22 35 18 17 9 1
15 Zambia 27 12 10 9 33 24 18 13
16 Niger 5 36 11 36 15 13 11 10
17 Uganda 19 20 19 15 22 32 10 11
18 Cameroon 8 19 25 14 10 25 19 22
19 Tanzania 22 16 15 22 21 21 21 12
20 Cote d'Ivoire 7 10 27 28 25 23 4 33
21 Mozambique 14 14 20 26 31 18 14 26
22 Djibouti 31 33 16 27 14 6 26 16
23 Mauritania 23 17 31 25 8 16 34 5
24 Malawi 35 28 6 17 13 14 25 30
25 Sierra Leone 34 30 21 23 36 27 15 4
26 Nigeria 16 11 28 20 27 34 30 14
27 Ethiopia 11 34 17 29 20 28 22 28
28 Congo, Rep. 9 26 32 13 32 20 24 32
29 Zimbabwe 28 23 34 10 23 29 31 20
30 Togo 29 29 26 18 26 4 13 38
31 Guinea 37 35 35 32 30 22 17 29
32 Liberia 38 15 30 34 29 26 28 19
33 Angola 18 25 29 31 28 30 36 31
34 Sudan 32 21 36 33 24 36 38 2
35 Congo, Dem. Rep. 26 31 37 30 34 38 32 7
36 Burundi 36 32 23 19 35 31 33 34
37 Chad 6 37 38 37 37 35 27 24
38 Central African Republic 33 38 33 38 38 37 20 37
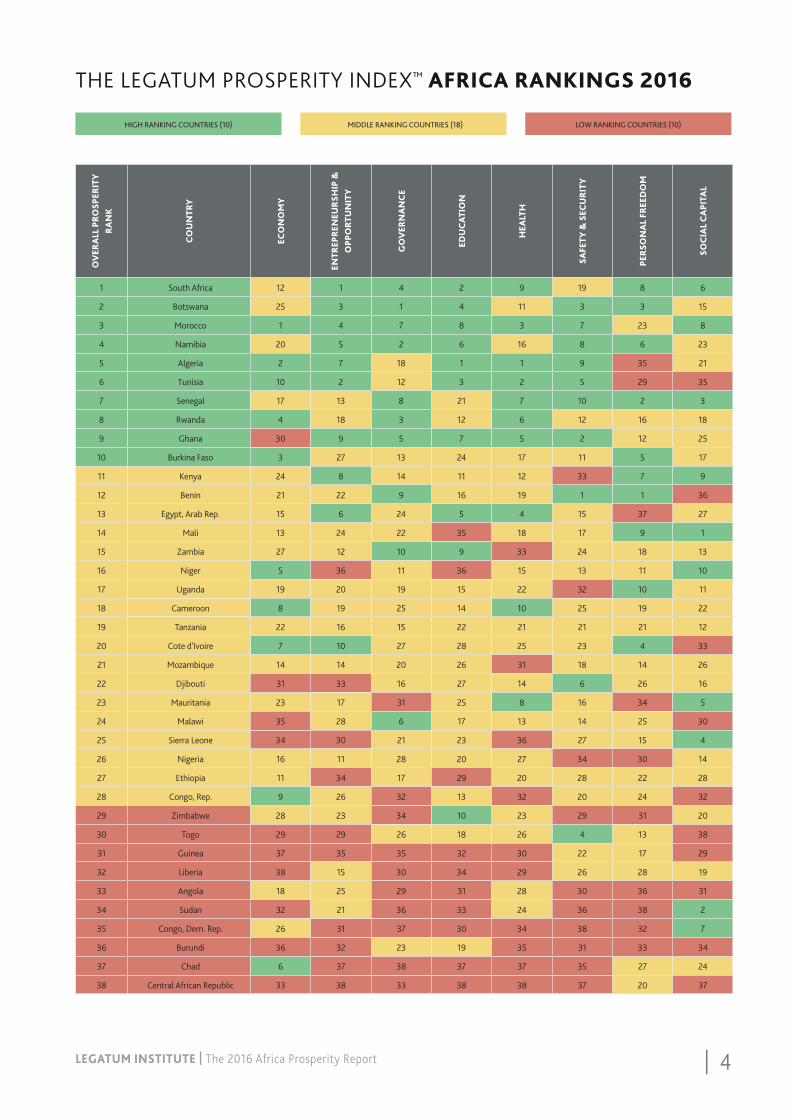
THE LEGATUM PROSPERITY INDEX™ AFRICA RANKINGS 2016
HIGH RANKING COUNTRIES (10) MIDDLE RANKING COUNTRIES (18) LOW RANKING COUNTRIES (10)

5 | LEGATUM INSTITUTE | The 2016 Africa Prosperity Report
PROSPERITY IN AFRICA 2016
HEALTHENTREPRENEURSHIP & OPPORTUNITY
+0.39+0.99+1.30+1.33 +0.07
-0.34
+0.14
CHANGE IN PROSPERITY INDEX SUB-INDEX SCORES FOR AFRICABETWEEN 2009 AND 2015
South Africa is the highest ranked country1st
Central African Republic is the lowest ranked country38th
HIGH RANKING COUNTRIES (1ST - 10TH)
MIDDLE RANKING COUNTRIES (11TH - 28TH)
LOW RANKING COUNTRIES (29TH - 38TH)
KEY
+0.32
PERSONALFREEDOM
GOVERNANCEEDUCATION SOCIAL CAPITAL
SAFETY & SECURITY
ECONOMY
MOST IMPROVEDRwanda is the most improved country
since 2009, rising 10 ranks within Africa.
LEAST IMPROVEDTanzania is the least improved country
since 2009, falling 5 ranks within Africa.
Prosperity in Africa 2016
| 6LEGATUM INSTITUTE | The 2016 Africa Prosperity Report
RANKING PROSPERITY DELIVERY IN AFRICA
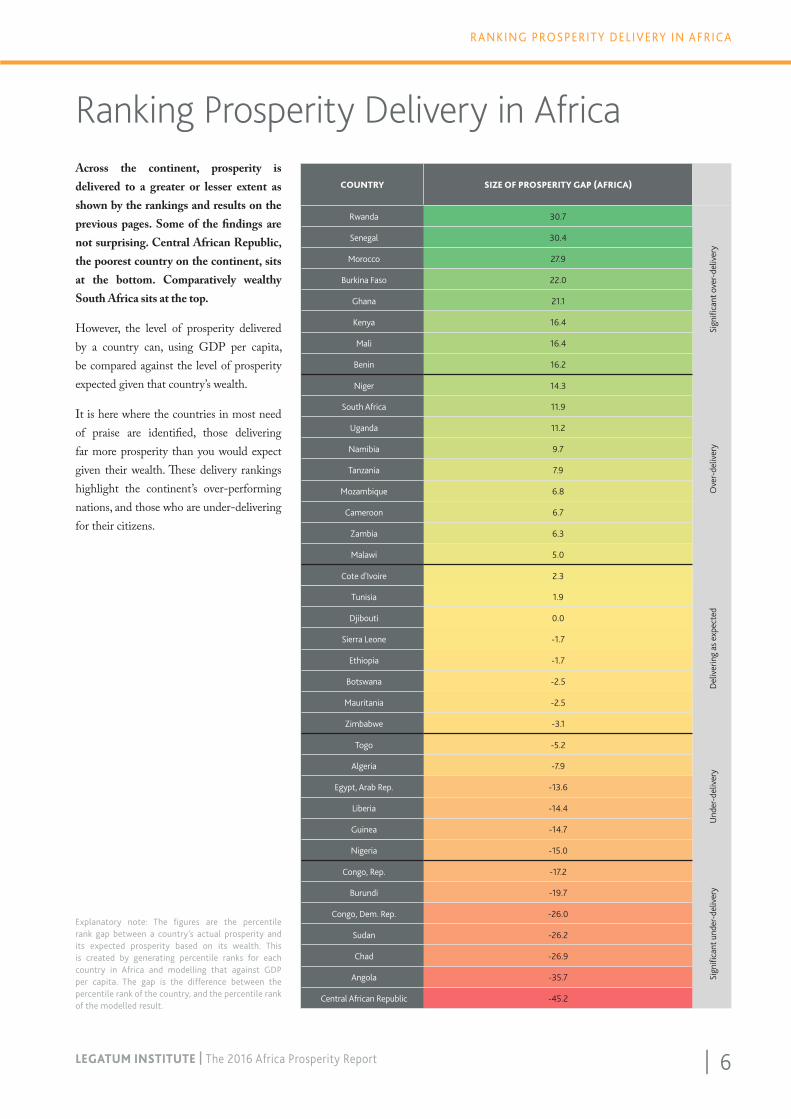
Ranking Prosperity Delivery in AfricaAcross the continent, prosperity is delivered to a greater or lesser extent as shown by the rankings and results on the previous pages. Some of the findings are not surprising. Central African Republic, the poorest country on the continent, sits at the bottom. Comparatively wealthy South Africa sits at the top.
However, the level of prosperity delivered by a country can, using GDP per capita, be compared against the level of prosperity expected given that country’s wealth.
It is here where the countries in most need of praise are identified, those delivering far more prosperity than you would expect given their wealth. These delivery rankings highlight the continent’s over-performing nations, and those who are under-delivering for their citizens.
COUNTRY SIZE OF PROSPERITY GAP (AFRICA)
Rwanda 30.7
Sign
ifica
nt o
ver-
deliv
ery
Senegal 30.4
Morocco 27.9
Burkina Faso 22.0
Ghana 21.1
Kenya 16.4
Mali 16.4
Benin 16.2
Niger 14.3
Ove
r-de
liver
y
South Africa 11.9
Uganda 11.2
Namibia 9.7
Tanzania 7.9
Mozambique 6.8
Cameroon 6.7
Zambia 6.3
Malawi 5.0
Cote d'Ivoire 2.3
Del
iver
ing
as e
xpec
ted
Tunisia 1.9
Djibouti 0.0
Sierra Leone -1.7
Ethiopia -1.7
Botswana -2.5
Mauritania -2.5
Zimbabwe -3.1
Togo -5.2
Und
er-d
eliv
eryAlgeria -7.9
Egypt, Arab Rep. -13.6
Liberia -14.4
Guinea -14.7
Nigeria -15.0
Congo, Rep. -17.2
Sign
ifica
nt u
nder
-del
iver
yBurundi -19.7
Congo, Dem. Rep. -26.0
Sudan -26.2
Chad -26.9
Angola -35.7
Central African Republic -45.2
Explanatory note: The figures are the percentile rank gap between a country’s actual prosperity and its expected prosperity based on its wealth. This is created by generating percentile ranks for each country in Africa and modelling that against GDP per capita. The gap is the difference between the percentile rank of the country, and the percentile rank of the modelled result.
HEALTHENTREPRENEURSHIP & OPPORTUNITY
+0.39+0.99+1.30+1.33 +0.07
-0.34
+0.14
CHANGE IN PROSPERITY INDEX SUB-INDEX SCORES FOR AFRICABETWEEN 2009 AND 2015
South Africa is the highest ranked country1st
Central African Republic is the lowest ranked country38th
HIGH RANKING COUNTRIES (1ST - 10TH)
MIDDLE RANKING COUNTRIES (11TH - 28TH)
LOW RANKING COUNTRIES (29TH - 38TH)
KEY
+0.32
PERSONALFREEDOM
GOVERNANCEEDUCATION SOCIAL CAPITAL
SAFETY & SECURITY
ECONOMY
MOST IMPROVEDRwanda is the most improved country
since 2009, rising 10 ranks within Africa.
LEAST IMPROVEDTanzania is the least improved country
since 2009, falling 5 ranks within Africa.
7 | LEGATUM INSTITUTE | The 2016 Africa Prosperity Report
AFRICA’S PROSPERITY: RISING BUT NOT SHINING
More than with any other region, we look for narratives to help us understand Africa’s progress. Its poor performance throughout the 1990s earned it a 2000 cover story in The Economist called “the hopeless continent.” War, famine, and disease were insurmountable barriers to prosperity, or so the narrative went.
In every single year since that cover story was published, African growth – averaging 5.5% a year over the last decade alone – outpaced global growth. The Economist renamed Africa “the hopeful continent” in 2011. Africa, the new narrative held, was “rising”.
The Legatum Prosperity Index™ shows that, alongside growth, global prosperity has been on the rise. With the exception of North Africa, where declining governance and security has pushed prosperity into retreat, the same trend can be seen across the African continent.
HEALTH AND OPPORTUNITY DRIVING PROSPERITY GROWTH IN AFRICAThe most significant prosperity gains have been made in Health, where life expectancy has increased by an average of five years and infant mortality has fallen by a third. Entrepreneurship & Opportunity too has seen large positive change. Here, business start-up costs have fallen by a third and economic development has grown steadily more equal. The only sub-index to record a decline is Safety & Security (see page 5). Increasing conflict across the continent has driven a notable increase in refugees and internally displaced people.
Africa’s Prosperity: Rising but not ShiningWhile this instability has resulted in a fairly sizeable decline in this sub-index, it has not been enough to halt Africa’s rising prosperity.
Given a decade of strong growth, this prosperity gain is not unsurprising. Much of it has come from low hanging fruit, particularly in Health, where life expectancy at its lowest in Africa a decade ago was a full 15 years less than the lowest in developing Latin America or Asia. Much was to be gained from simply catching up. Zambia has added 17 years to life expectancy since 2000 and far fewer African babies now die from preventable diseases. Yet, despite this, Sub-Saharan Africa’s prosperity gain has not set it apart. Indeed, Africa has been outpaced by Asia and Eastern Europe.1
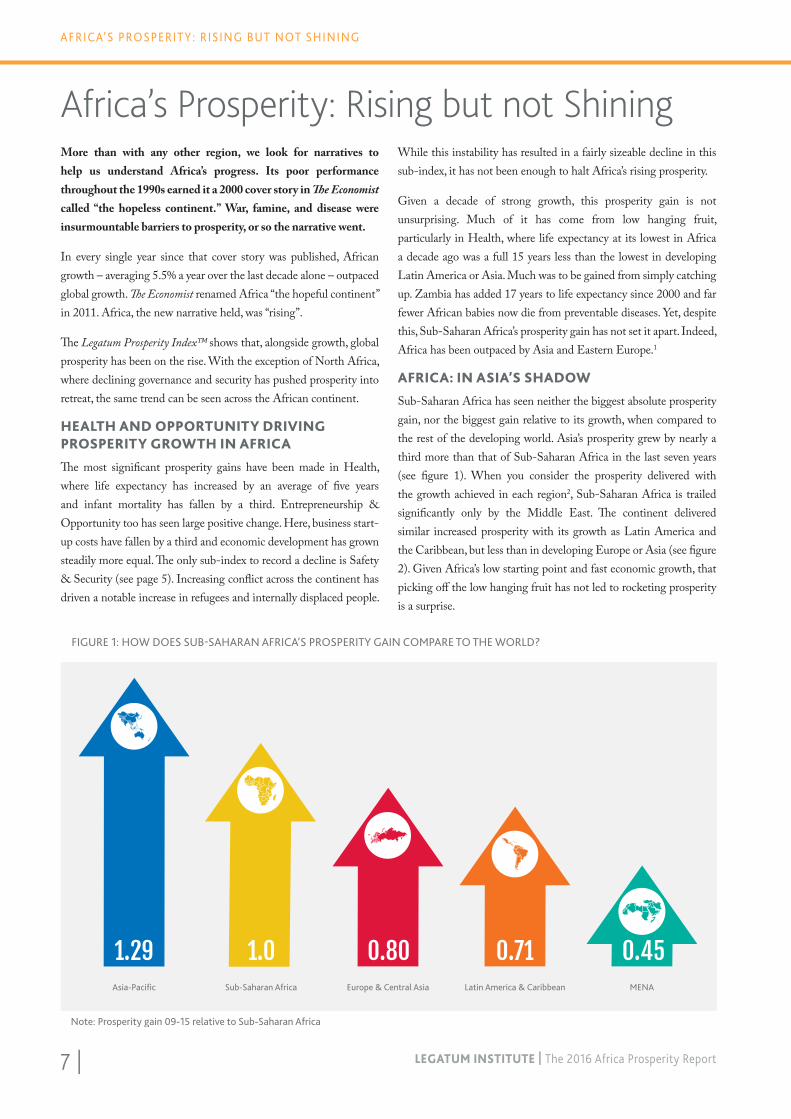
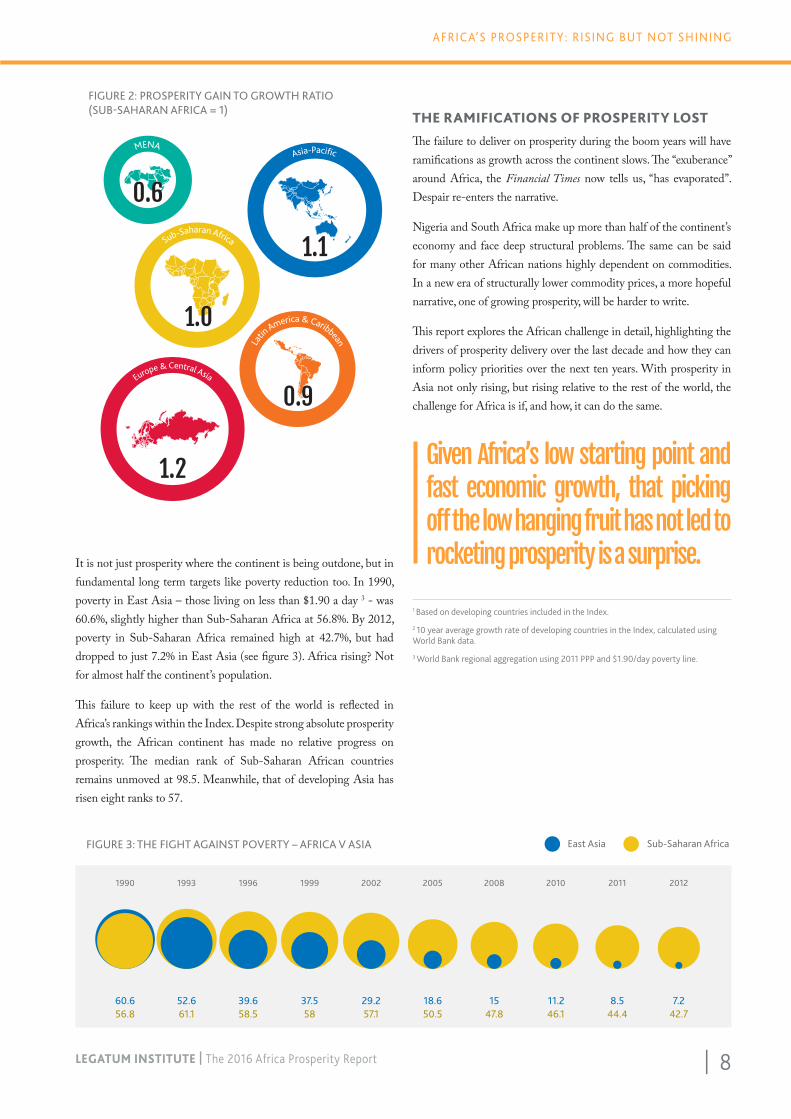
AFRICA: IN ASIA’S SHADOWSub-Saharan Africa has seen neither the biggest absolute prosperity gain, nor the biggest gain relative to its growth, when compared to the rest of the developing world. Asia’s prosperity grew by nearly a third more than that of Sub-Saharan Africa in the last seven years (see figure 1). When you consider the prosperity delivered with the growth achieved in each region2, Sub-Saharan Africa is trailed significantly only by the Middle East. The continent delivered similar increased prosperity with its growth as Latin America and the Caribbean, but less than in developing Europe or Asia (see figure 2). Given Africa’s low starting point and fast economic growth, that picking off the low hanging fruit has not led to rocketing prosperity is a surprise.
FIGURE 1: HOW DOES SUB-SAHARAN AFRICA’S PROSPERITY GAIN COMPARE TO THE WORLD?
Asia-Pacific Sub-Saharan Africa Europe & Central Asia Latin America & Caribbean MENA
1.29 1.0 0.80 0.71 0.45
Note: Prosperity gain 09-15 relative to Sub-Saharan Africa
| 8LEGATUM INSTITUTE | The 2016 Africa Prosperity Report
AFRICA’S PROSPERITY: RISING BUT NOT SHINING
THE RAMIFICATIONS OF PROSPERITY LOSTThe failure to deliver on prosperity during the boom years will have ramifications as growth across the continent slows. The “exuberance” around Africa, the Financial Times now tells us, “has evaporated”. Despair re-enters the narrative.
Nigeria and South Africa make up more than half of the continent’s economy and face deep structural problems. The same can be said for many other African nations highly dependent on commodities. In a new era of structurally lower commodity prices, a more hopeful narrative, one of growing prosperity, will be harder to write.
This report explores the African challenge in detail, highlighting the drivers of prosperity delivery over the last decade and how they can inform policy priorities over the next ten years. With prosperity in Asia not only rising, but rising relative to the rest of the world, the challenge for Africa is if, and how, it can do the same.
1 Based on developing countries included in the Index.
2 10 year average growth rate of developing countries in the Index, calculated using World Bank data.
3 World Bank regional aggregation using 2011 PPP and $1.90/day poverty line.
It is not just prosperity where the continent is being outdone, but in fundamental long term targets like poverty reduction too. In 1990, poverty in East Asia – those living on less than $1.90 a day 3 - was 60.6%, slightly higher than Sub-Saharan Africa at 56.8%. By 2012, poverty in Sub-Saharan Africa remained high at 42.7%, but had dropped to just 7.2% in East Asia (see figure 3). Africa rising? Not for almost half the continent’s population.
This failure to keep up with the rest of the world is reflected in Africa’s rankings within the Index. Despite strong absolute prosperity growth, the African continent has made no relative progress on prosperity. The median rank of Sub-Saharan African countries remains unmoved at 98.5. Meanwhile, that of developing Asia has risen eight ranks to 57.
FIGURE 2: PROSPERITY GAIN TO GROWTH RATIO (SUB-SAHARAN AFRICA = 1)
Sub-Saharan Africa
Asia-Pacific
Europe & Central Asia
Latin
America & Caribbean
MENA
1.0
1.1
1.2
0.9
0.6
2005
8.544.4
2012
7.242.7
1990
60.656.8
1993
52.661.1
1996
39.658.5
1999
37.558
2002
29.257.1
East AsiaFIGURE 3: THE FIGHT AGAINST POVERTY – AFRICA V ASIA Sub-Saharan Africa
2008 2010 2011
18.650.5
1547.8
11.246.1
Given Africa’s low starting point and fast economic growth, that picking off the low hanging fruit has not led to rocketing prosperity is a surprise.
9 | LEGATUM INSTITUTE | The 2016 Africa Prosperity Report
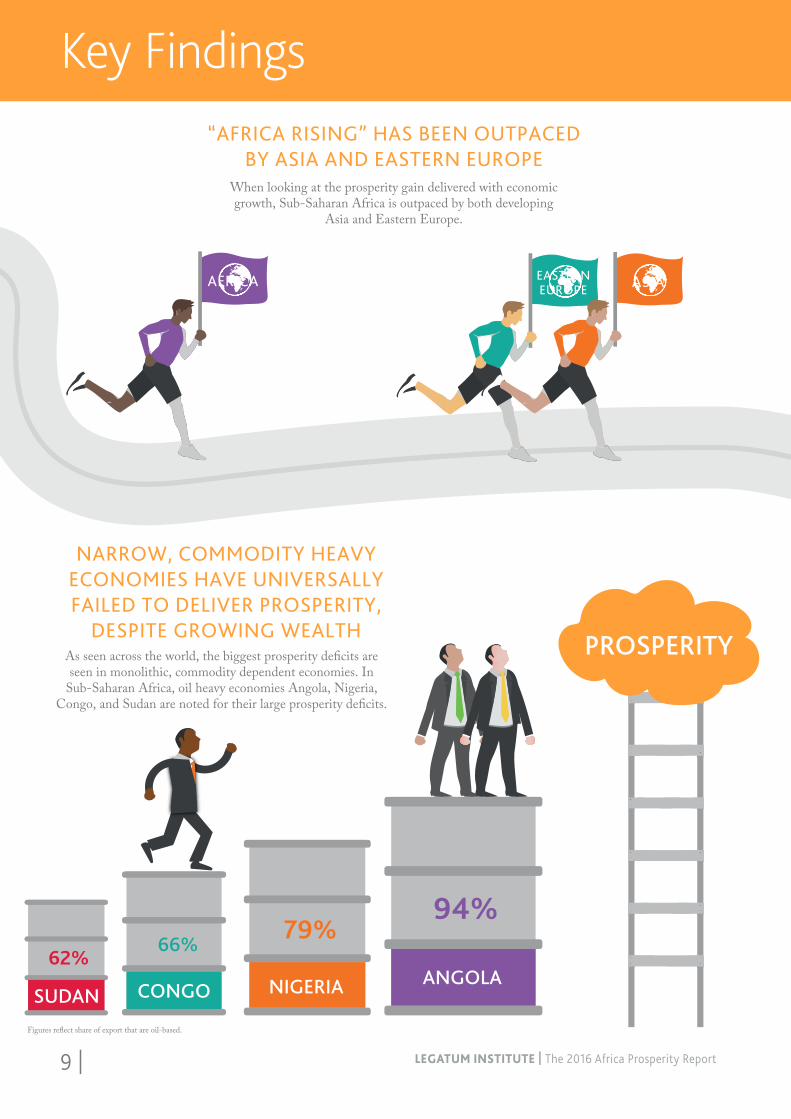
“AFRICA RISING” HAS BEEN OUTPACED BY ASIA AND EASTERN EUROPE
When looking at the prosperity gain delivered with economic growth, Sub-Saharan Africa is outpaced by both developing
Asia and Eastern Europe.
NARROW, COMMODITY HEAVY ECONOMIES HAVE UNIVERSALLY FAILED TO DELIVER PROSPERITY,
DESPITE GROWING WEALTHAs seen across the world, the biggest prosperity de�cits are seen in monolithic, commodity dependent economies. In
Sub-Saharan Africa, oil heavy economies Angola, Nigeria, Congo, and Sudan are noted for their large prosperity de�cits.
Figures re�ect share of export that are oil-based.
62%66%
79%94%
PROSPERITY
ANGOLANIGERIACONGOSUDAN
AFRICA EASTERNEUROPE ASIA
Key Findings
| 10LEGATUM INSTITUTE | The 2016 Africa Prosperity Report
“AFRICA RISING” HAS BEEN OUTPACED BY ASIA AND EASTERN EUROPE
When looking at the prosperity gain delivered with economic growth, Sub-Saharan Africa is outpaced by both developing
Asia and Eastern Europe.
NARROW, COMMODITY HEAVY ECONOMIES HAVE UNIVERSALLY FAILED TO DELIVER PROSPERITY,
DESPITE GROWING WEALTHAs seen across the world, the biggest prosperity de�cits are seen in monolithic, commodity dependent economies. In
Sub-Saharan Africa, oil heavy economies Angola, Nigeria, Congo, and Sudan are noted for their large prosperity de�cits.
Figures re�ect share of export that are oil-based.
62%66%
79%94%
PROSPERITY
ANGOLANIGERIACONGOSUDAN
AFRICA EASTERNEUROPE ASIA
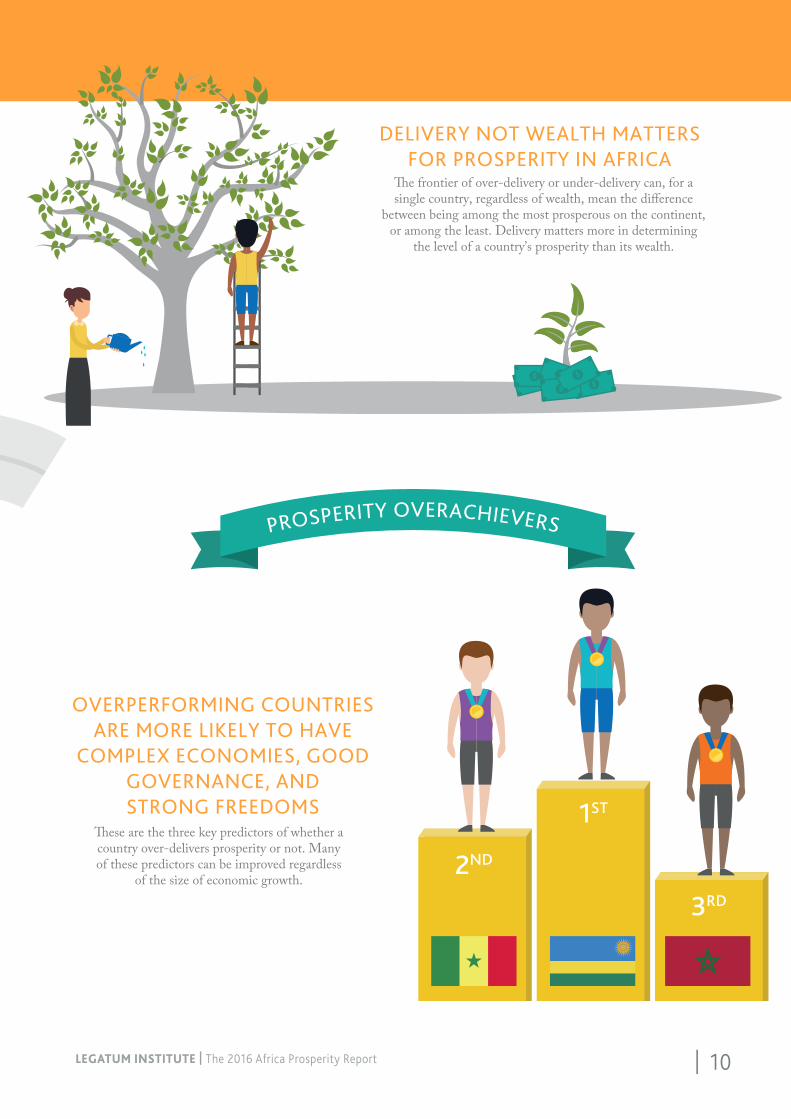
DELIVERY NOT WEALTH MATTERS FOR PROSPERITY IN AFRICA
�e frontier of over-delivery or under-delivery can, for a single country, regardless of wealth, mean the di�erence
between being among the most prosperous on the continent, or among the least. Delivery matters more in determining
the level of a country’s prosperity than its wealth.
�ese are the three key predictors of whether a country over-delivers prosperity or not. Many of these predictors can be improved regardless
of the size of economic growth.
OVERPERFORMING COUNTRIES ARE MORE LIKELY TO HAVE
COMPLEX ECONOMIES, GOOD GOVERNANCE, AND STRONG FREEDOMS 1ST
2ND
3RD
SECTION HEADING AND CHAPTER TITLE GOES HERE
LEGATUM INSTITUTE | The 2016 Africa Prosperity Report11 |
Across the continent, countries have had mixed success in turning their economic growth and wealth into the prosperity delivered to their citizens. As the delivery ranks on page six of this report show, there is a large variation across Africa, from Rwanda and Senegal with the best record of delivery, to the Central African Republic and Angola with the worst.
This chapter explores the characteristics of the top and bottom performing countries across Africa’s different income groups. It finds a number of common attributes that the top performing countries have at every level of wealth, but that are lacking in those nations that under-perform.
These attributes could provide significant prosperity gains to those countries that are under-delivering on prosperity, helping to drive prosperity upward across the continent despite slower growth.
The Legacy of Prosperity Delivery in AfricaTURNING GROWTH AND WEALTH INTO PROSPERITY
HEAT MAP: THE PROSPERITY GAP ACROSS AFRICA
KEY
> 30
20 to 29
10 to 19
0 to 9
-10 to -1
-20 to -19
< -30

SECTION HEADING AND CHAPTER TITLE GOES HERE
| 12LEGATUM INSTITUTE | The 2016 Africa Prosperity Report
HEAT MAP: THE PROSPERITY GAP ACROSS AFRICA
KEY
> 30
20 to 29
10 to 19
0 to 9
-10 to -1
-20 to -19
< -30
13 | LEGATUM INSTITUTE | The 2016 Africa Prosperity Report
AT THE TURNING OF THE ECONOMIC HIGH TIDE
Drive the palm lined highway along Luanda’s waterfront toward the Central Business District and it could almost be a young, nascent, Dubai. Cranes dance among tall, silvered office blocks, and sandy beaches stretch out toward the sea.
Buoyed by a decade of strong growth and an influx of skilled Portuguese migrant workers, Angola’s revival after 28 years of civil war is a testament to the story of Africa’s commodities boom. Oil production doubled in the six years following the end of the war in 2002, bringing with it soaring wealth and a twofold increase in GDP per capita. The accompanying ‘Africa Rising’ narrative did little to caution against commodities as the path to prosperity for the continent.
Yet, beneath the veneer of luxury apartments and vast Chinese-backed infrastructure projects, Angola tells a very different story of ‘Africa Rising’. The majority of Luanda’s six million residents live in musseques, overcrowded slums where seven in ten still live on under $1.25 a day.1 Despite the nation’s new found wealth, prosperity has not necessarily followed. Angola ranks just 33rd in Africa for prosperity, despite having the continent’s eighth highest GDP per capita. What’s worse, it is falling.
The failure of nations to deliver prosperity with the spoils of their commodities boom raises serious questions about their ability to prosper as growth on the continent slows. Sub-Saharan Africa grew at 3.5% in 2015 after averaging 5.8% in 2005-2014.2
At the Turning of the Economic High Tide: What Next for Africa’s Prosperity?
With China’s future growth unlikely to be as commodity-intensive as the past, and OPEC exerting downward pressure on oil prices to freeze out competition, lower commodity prices are not a brief blip in the otherwise onward march of African growth. They are illustrative of a new global climate that is here to stay, at least for the medium-term.
The most fundamental question for the continent is therefore how to deliver prosperity in this new slower-growth age.
Many of the answers to Africa’s low-growth conundrum lie in the legacy of prosperity delivery across the continent during the boom years. Angola may not have delivered prosperity with its new found wealth, but plenty of African states have prospered. Through the lens of the Prosperity Index, both the barriers to, and enablers of, delivery can be assessed. Many of them speak to the enduring need for structural reform in many countries, from economic diversification to institutional change. Using insights from the Index, policy priorities for prosperity across a post-boom Africa can be set.
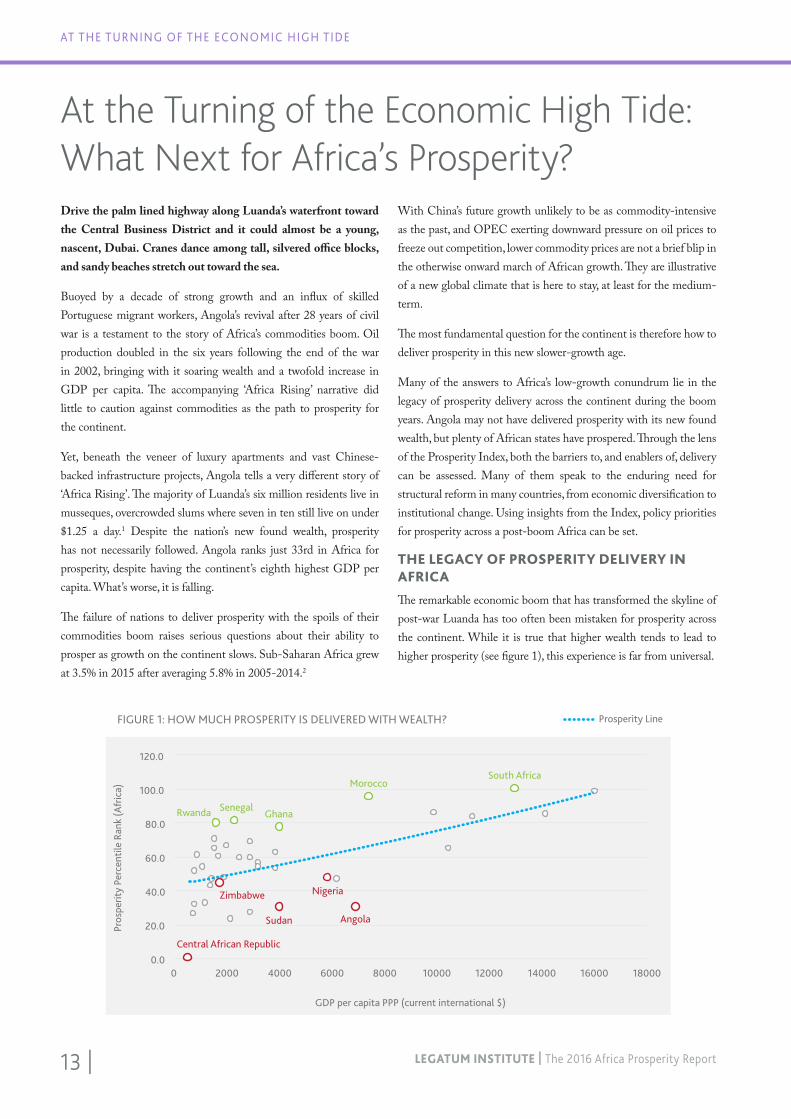
THE LEGACY OF PROSPERITY DELIVERY IN AFRICAThe remarkable economic boom that has transformed the skyline of post-war Luanda has too often been mistaken for prosperity across the continent. While it is true that higher wealth tends to lead to higher prosperity (see figure 1), this experience is far from universal.
0.0
20.0
40.0
60.0
80.0
100.0
120.0
0 2000 4000 6000 8000 10000 12000 14000 16000 18000
FIGURE 1: HOW MUCH PROSPERITY IS DELIVERED WITH WEALTH?
GDP per capita PPP (current international $)
Pros
perit
y Pe
rcen
tile
Rank
(Afr
ica)
AngolaSudan
Zimbabwe
Central African Republic
Nigeria
Rwanda SenegalGhana
MoroccoSouth Africa
Prosperity Line
| 14LEGATUM INSTITUTE | The 2016 Africa Prosperity Report
WHAT NEXT FOR AFRICA’S PROSPERITY?
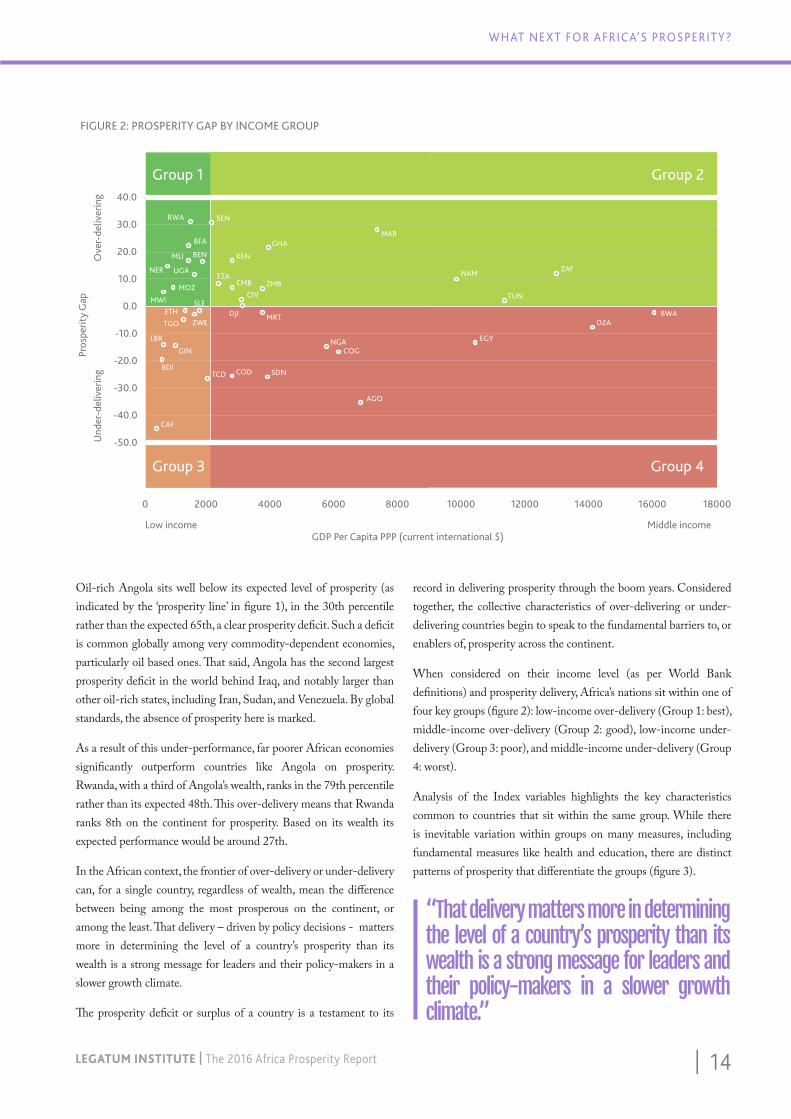
Oil-rich Angola sits well below its expected level of prosperity (as indicated by the ‘prosperity line’ in figure 1), in the 30th percentile rather than the expected 65th, a clear prosperity deficit. Such a deficit is common globally among very commodity-dependent economies, particularly oil based ones. That said, Angola has the second largest prosperity deficit in the world behind Iraq, and notably larger than other oil-rich states, including Iran, Sudan, and Venezuela. By global standards, the absence of prosperity here is marked.
As a result of this under-performance, far poorer African economies significantly outperform countries like Angola on prosperity. Rwanda, with a third of Angola’s wealth, ranks in the 79th percentile rather than its expected 48th. This over-delivery means that Rwanda ranks 8th on the continent for prosperity. Based on its wealth its expected performance would be around 27th.
In the African context, the frontier of over-delivery or under-delivery can, for a single country, regardless of wealth, mean the difference between being among the most prosperous on the continent, or among the least. That delivery – driven by policy decisions - matters more in determining the level of a country’s prosperity than its wealth is a strong message for leaders and their policy-makers in a slower growth climate.
The prosperity deficit or surplus of a country is a testament to its
record in delivering prosperity through the boom years. Considered together, the collective characteristics of over-delivering or under-delivering countries begin to speak to the fundamental barriers to, or enablers of, prosperity across the continent.
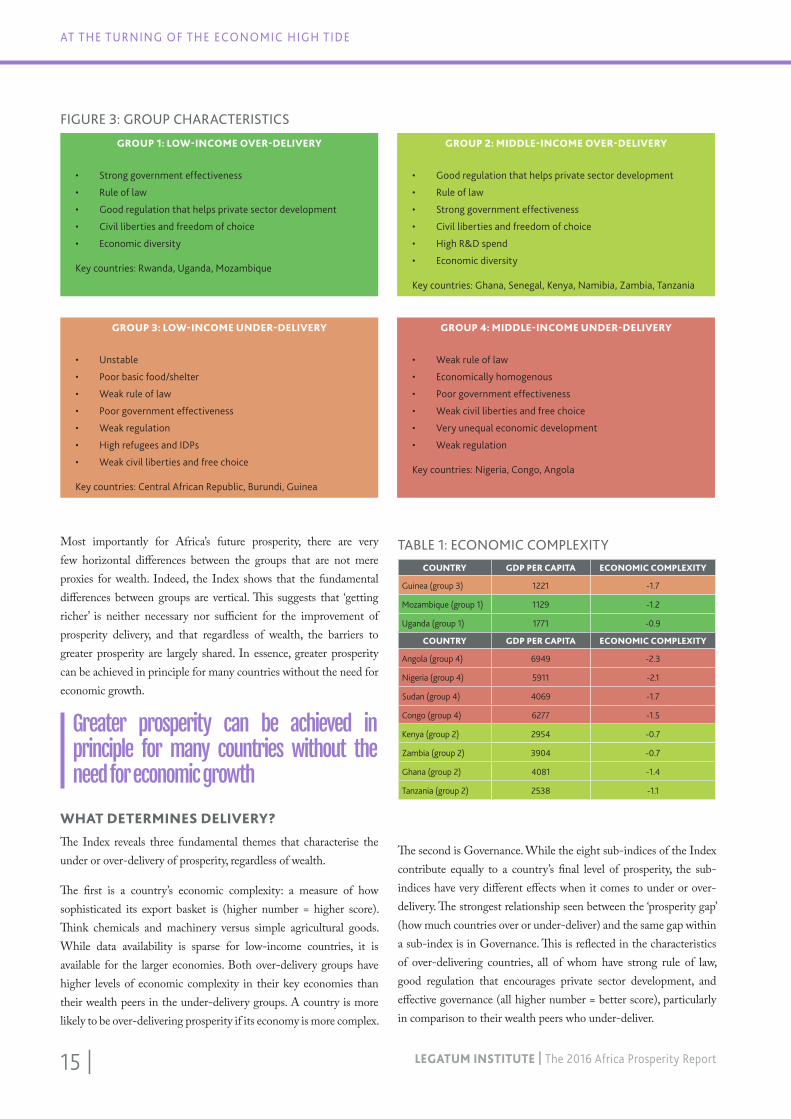
When considered on their income level (as per World Bank definitions) and prosperity delivery, Africa’s nations sit within one of four key groups (figure 2): low-income over-delivery (Group 1: best), middle-income over-delivery (Group 2: good), low-income under-delivery (Group 3: poor), and middle-income under-delivery (Group 4: worst).
Analysis of the Index variables highlights the key characteristics common to countries that sit within the same group. While there is inevitable variation within groups on many measures, including fundamental measures like health and education, there are distinct patterns of prosperity that differentiate the groups (figure 3).
FIGURE 2: PROSPERITY GAP BY INCOME GROUP
GDP Per Capita PPP (current international $)
Pros
perit
y G
apU
nder
-del
iver
ing
Ove
r-de
liver
ing
Low income Middle income
-50.0
-40.0
-30.0
-20.0
-10.0
0.0
10.0
20.0
30.0
40.0
0 160002000 4000 6000 8000 10000 12000 14000 18000
Group 3 Group 4
Group 1 Group 2
CAF
BDI
MWI
LBR
NER
MOZ
GIN
TGO
ETH
MLI
BFA
RWA
UGA
ZWE
SLE
BEN
TCD
SEN
TZA
KEN
CMR
COD
CIV
DJI
ZMB
MRT
SDN
GHA
NGACOG
AGO
MAR
NAM
EGY
TUN
ZAF
DZABWA
“That delivery matters more in determining the level of a country’s prosperity than its wealth is a strong message for leaders and their policy-makers in a slower growth climate.”
15 | LEGATUM INSTITUTE | The 2016 Africa Prosperity Report
AT THE TURNING OF THE ECONOMIC HIGH TIDE
Most importantly for Africa’s future prosperity, there are very few horizontal differences between the groups that are not mere proxies for wealth. Indeed, the Index shows that the fundamental differences between groups are vertical. This suggests that ‘getting richer’ is neither necessary nor sufficient for the improvement of prosperity delivery, and that regardless of wealth, the barriers to greater prosperity are largely shared. In essence, greater prosperity can be achieved in principle for many countries without the need for economic growth.
WHAT DETERMINES DELIVERY?The Index reveals three fundamental themes that characterise the under or over-delivery of prosperity, regardless of wealth.
The first is a country’s economic complexity: a measure of how sophisticated its export basket is (higher number = higher score). Think chemicals and machinery versus simple agricultural goods. While data availability is sparse for low-income countries, it is available for the larger economies. Both over-delivery groups have higher levels of economic complexity in their key economies than their wealth peers in the under-delivery groups. A country is more likely to be over-delivering prosperity if its economy is more complex.
FIGURE 3: GROUP CHARACTERISTICS
GROUP 1: LOW-INCOME OVER-DELIVERY
• Strong government effectiveness
• Rule of law
• Good regulation that helps private sector development
• Civil liberties and freedom of choice
• Economic diversity
Key countries: Rwanda, Uganda, Mozambique
GROUP 2: MIDDLE-INCOME OVER-DELIVERY
• Good regulation that helps private sector development
• Rule of law
• Strong government effectiveness
• Civil liberties and freedom of choice
• High R&D spend
• Economic diversity
Key countries: Ghana, Senegal, Kenya, Namibia, Zambia, Tanzania
GROUP 3: LOW-INCOME UNDER-DELIVERY
• Unstable
• Poor basic food/shelter
• Weak rule of law
• Poor government effectiveness
• Weak regulation
• High refugees and IDPs
• Weak civil liberties and free choice
Key countries: Central African Republic, Burundi, Guinea
GROUP 4: MIDDLE-INCOME UNDER-DELIVERY
• Weak rule of law
• Economically homogenous
• Poor government effectiveness
• Weak civil liberties and free choice
• Very unequal economic development
• Weak regulation
Key countries: Nigeria, Congo, Angola
TABLE 1: ECONOMIC COMPLEXITYCOUNTRY GDP PER CAPITA ECONOMIC COMPLEXITY
Guinea (group 3) 1221 -1.7
Mozambique (group 1) 1129 -1.2
Uganda (group 1) 1771 -0.9
COUNTRY GDP PER CAPITA ECONOMIC COMPLEXITY
Angola (group 4) 6949 -2.3
Nigeria (group 4) 5911 -2.1
Sudan (group 4) 4069 -1.7
Congo (group 4) 6277 -1.5
Kenya (group 2) 2954 -0.7
Zambia (group 2) 3904 -0.7
Ghana (group 2) 4081 -1.4
Tanzania (group 2) 2538 -1.1
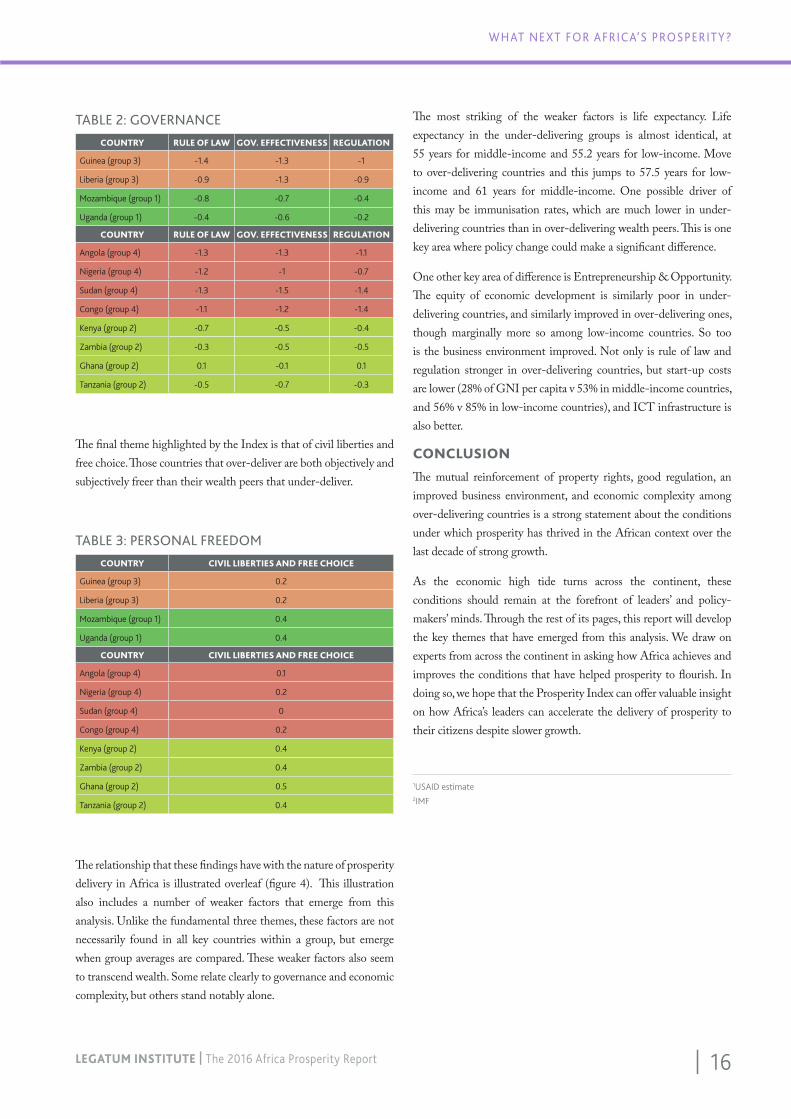
The second is Governance. While the eight sub-indices of the Index contribute equally to a country’s final level of prosperity, the sub-indices have very different effects when it comes to under or over-delivery. The strongest relationship seen between the ‘prosperity gap’ (how much countries over or under-deliver) and the same gap within a sub-index is in Governance. This is reflected in the characteristics of over-delivering countries, all of whom have strong rule of law, good regulation that encourages private sector development, and effective governance (all higher number = better score), particularly in comparison to their wealth peers who under-deliver.
Greater prosperity can be achieved in principle for many countries without the need for economic growth
| 16LEGATUM INSTITUTE | The 2016 Africa Prosperity Report
WHAT NEXT FOR AFRICA’S PROSPERITY?
TABLE 2: GOVERNANCECOUNTRY RULE OF LAW GOV. EFFECTIVENESS REGULATION
Guinea (group 3) -1.4 -1.3 -1
Liberia (group 3) -0.9 -1.3 -0.9
Mozambique (group 1) -0.8 -0.7 -0.4
Uganda (group 1) -0.4 -0.6 -0.2
COUNTRY RULE OF LAW GOV. EFFECTIVENESS REGULATION
Angola (group 4) -1.3 -1.3 -1.1
Nigeria (group 4) -1.2 -1 -0.7
Sudan (group 4) -1.3 -1.5 -1.4
Congo (group 4) -1.1 -1.2 -1.4
Kenya (group 2) -0.7 -0.5 -0.4
Zambia (group 2) -0.3 -0.5 -0.5
Ghana (group 2) 0.1 -0.1 0.1
Tanzania (group 2) -0.5 -0.7 -0.3
The final theme highlighted by the Index is that of civil liberties and free choice. Those countries that over-deliver are both objectively and subjectively freer than their wealth peers that under-deliver.
TABLE 3: PERSONAL FREEDOMCOUNTRY CIVIL LIBERTIES AND FREE CHOICE
Guinea (group 3) 0.2
Liberia (group 3) 0.2
Mozambique (group 1) 0.4
Uganda (group 1) 0.4
COUNTRY CIVIL LIBERTIES AND FREE CHOICE
Angola (group 4) 0.1
Nigeria (group 4) 0.2
Sudan (group 4) 0
Congo (group 4) 0.2
Kenya (group 2) 0.4
Zambia (group 2) 0.4
Ghana (group 2) 0.5
Tanzania (group 2) 0.4
The relationship that these findings have with the nature of prosperity delivery in Africa is illustrated overleaf (figure 4). This illustration also includes a number of weaker factors that emerge from this analysis. Unlike the fundamental three themes, these factors are not necessarily found in all key countries within a group, but emerge when group averages are compared. These weaker factors also seem to transcend wealth. Some relate clearly to governance and economic complexity, but others stand notably alone.
The most striking of the weaker factors is life expectancy. Life expectancy in the under-delivering groups is almost identical, at 55 years for middle-income and 55.2 years for low-income. Move to over-delivering countries and this jumps to 57.5 years for low-income and 61 years for middle-income. One possible driver of this may be immunisation rates, which are much lower in under-delivering countries than in over-delivering wealth peers. This is one key area where policy change could make a significant difference.
One other key area of difference is Entrepreneurship & Opportunity. The equity of economic development is similarly poor in under-delivering countries, and similarly improved in over-delivering ones, though marginally more so among low-income countries. So too is the business environment improved. Not only is rule of law and regulation stronger in over-delivering countries, but start-up costs are lower (28% of GNI per capita v 53% in middle-income countries, and 56% v 85% in low-income countries), and ICT infrastructure is also better.
CONCLUSIONThe mutual reinforcement of property rights, good regulation, an improved business environment, and economic complexity among over-delivering countries is a strong statement about the conditions under which prosperity has thrived in the African context over the last decade of strong growth.
As the economic high tide turns across the continent, these conditions should remain at the forefront of leaders’ and policy-makers’ minds. Through the rest of its pages, this report will develop the key themes that have emerged from this analysis. We draw on experts from across the continent in asking how Africa achieves and improves the conditions that have helped prosperity to flourish. In doing so, we hope that the Prosperity Index can offer valuable insight on how Africa’s leaders can accelerate the delivery of prosperity to their citizens despite slower growth.
1USAID estimate2IMF
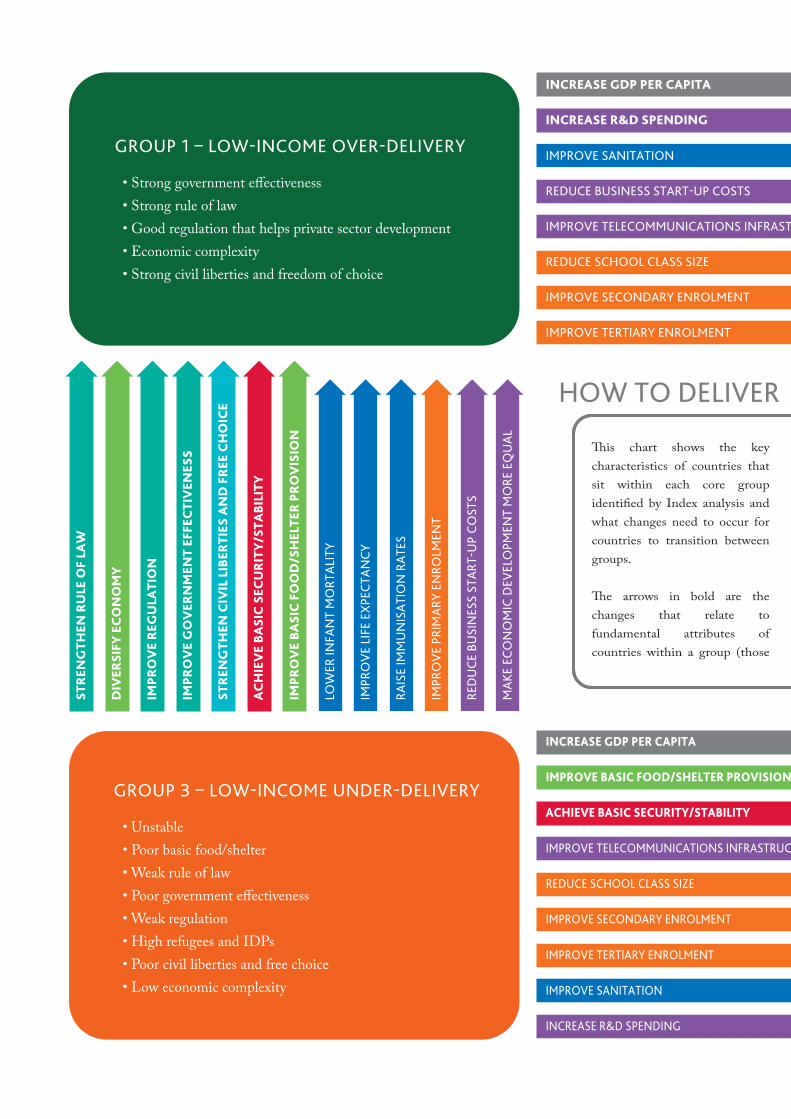
• Strong government e�ectiveness• Strong rule of law• Good regulation that helps private sector development• Economic complexity• Strong civil liberties and freedom of choice
GROUP 1 – LOW-INCOME OVER-DELIVERY• Strong government e�ectiveness• Strong rule of law • Good regulation that helps private sector development• Economic complexity• Strong civil liberties and freedom of choice• Higher R&D spend
GROUP 2 – MIDDLE-INCOME OVER-DELIVERY
• Unstable• Poor basic food/shelter• Weak rule of law• Poor government e�ectiveness• Weak regulation• High refugees and IDPs• Poor civil liberties and free choice• Low economic complexity
GROUP 3 – LOW-INCOME UNDER-DELIVERY
• Weak rule of law• Low economic complexity• Poor government e�ectiveness• Poor civil liberties and free choice• Very unequal economic development• Weak regulation
GROUP 4 – MIDDLE-INCOME UNDER-DELIVERY
�is chart shows the key characteristics of countries that sit within each core group identi�ed by Index analysis and what changes need to occur for countries to transition between groups.
�e arrows in bold are the changes that relate to fundamental attributes of countries within a group (those
attributes listed within the boxes). �ese changes should be prioritised by policymakers and apply in every case.
�e other arrows are the changes that apply in general, based on the average performance of the countries in each group. �ey may not be applicable in every case, but still warrant attention by governments.
HOW TO DELIVER MORE PROSPERITY
INCREASE R&D SPENDING
REDUCE BUSINESS START-UP COSTS
REDUCE SCHOOL CLASS SIZE
IMPROVE SECONDARY ENROLMENT
IMPROVE TERTIARY ENROLMENT
IMPROVE SANITATION
INCREASE GDP PER CAPITA
IMPROVE TELECOMMUNICATIONS INFRASTRUCTURE
REDUCE SCHOOL CLASS SIZE
IMPROVE SECONDARY ENROLMENT
IMPROVE TERTIARY ENROLMENT
IMPROVE SANITATION
INCREASE GDP PER CAPITA
IMPROVE BASIC FOOD/SHELTER PROVISION
ACHIEVE BASIC SECURITY/STABILITY
IMPROVE TELECOMMUNICATIONS INFRASTRUCTURE
INCREASE R&D SPENDING
AC
HIE
VE
BASI
C S
ECU
RIT
Y/ST
ABI
LITY
STR
ENG
THEN
RU
LE O
F LA
W
DIV
ERSI
FY E
CO
NO
MY
IMPR
OV
E R
EGU
LATI
ON
IMPR
OV
E G
OV
ERN
MEN
T EF
FEC
TIV
ENES
S
STR
ENG
THEN
CIV
IL L
IBER
TIES
AN
D F
REE
CH
OIC
E
LOW
ER IN
FAN
T M
ORT
ALI
TY
IMPR
OV
E LI
FE E
XPE
CTA
NC
Y
RAIS
E IM
MU
NIS
ATI
ON
RA
TES
IMPR
OV
E PR
IMA
RY E
NRO
LMEN
T
RED
UC
E BU
SIN
ESS
STA
RT-U
P C
OST
S
IMPR
OV
E BA
SIC
FO
OD
/SH
ELTE
R P
RO
VIS
ION
MA
KE E
CO
NO
MIC
DEV
ELO
PMEN
T M
ORE
EQ
UA
L
STR
ENG
THEN
RU
LE O
F LA
W
DIV
ERSI
FY E
CO
NO
MY
IMPR
OV
E R
EGU
LATI
ON
IMPR
OV
E G
OV
ERN
MEN
T EF
FEC
TIV
ENES
S
STR
ENG
THEN
CIV
IL L
IBER
TIES
AN
D F
REE
CH
OIC
E
MA
KE
ECO
NO
MIC
DEV
ELO
PMEN
T M
OR
E EQ
UA
L
IMPR
OV
E TE
LEC
OM
MU
NIC
ATI
ON
S IN
FRA
STRU
CTU
RE
LOW
ER IN
FAN
T M
ORT
ALI
TY
IMPR
OV
E LI
FE E
XPE
CTA
NC
Y
RAIS
E IM
MU
NIS
ATI
ON
RA
TES
IMPR
OV
E PR
IMA
RY E
NRO
LMEN
T
RED
UC
E BU
SIN
ESS
STA
RT-U
P C
OST
S
CU
RB S
TATE
VIO
LEN
CE
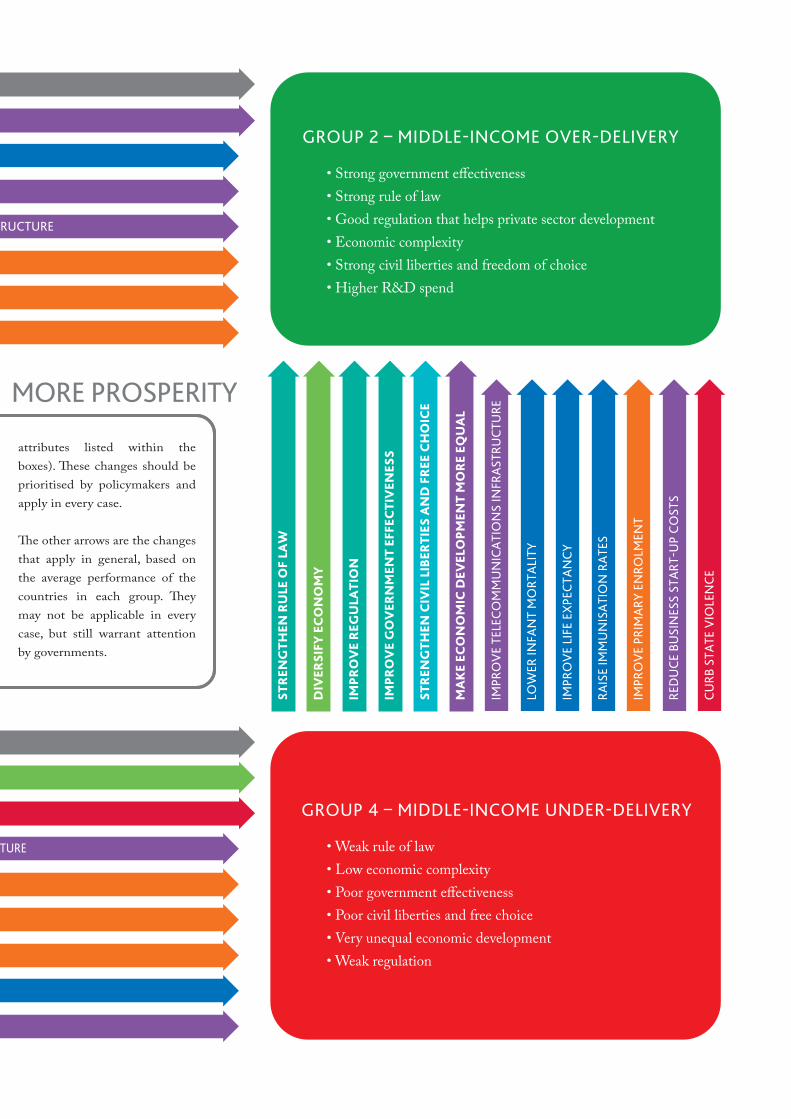
19 | LEGATUM INSTITUTE | The 2016 Africa Prosperity Report
SECTION HEADING AND CHAPTER TITLE GOES HERE
That there are three attributes common to over-delivering countries has real relevance to policy-makers across the continent. Furthermore, they are predominantly structural, meaning that change is possible without the need for strong economic growth.
This chapter analyses in more detail these three key drivers of prosperity over-delivery found in the previous chapter. First it considers the importance of economic complexity, and how diversification is necessary for sustainable prosperity growth long-term. Growing their manufacturing sectors is the best hope for African countries, yet barriers remain. The chapter then considers whether good governance and civil liberties are prerequisites for prosperity across the continent.
Delivering Greater Prosperity with Lower GrowthUNPACKING THE CHARACTERISTICS OF OVER-DELIVERY
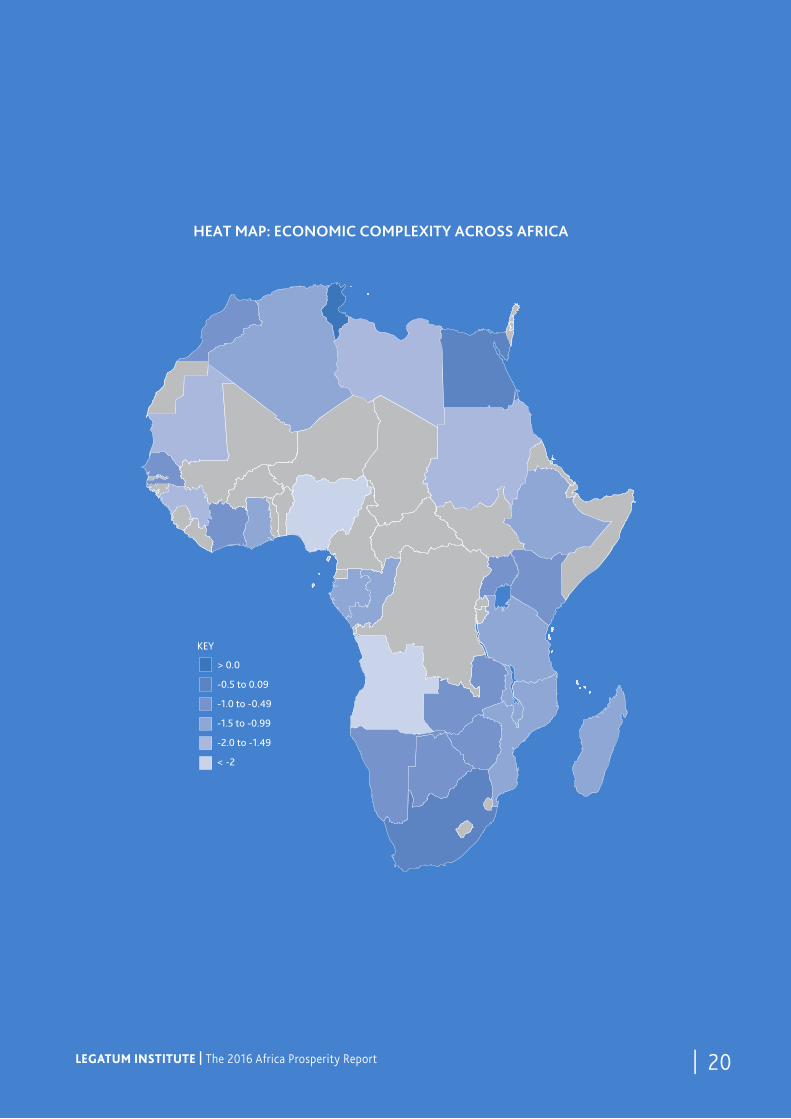
HEAT MAP: ECONOMIC COMPLEXITY ACROSS AFRICA
KEY
> 0.0
-0.5 to 0.09
-1.0 to -0.49
-1.5 to -0.99
-2.0 to -1.49
< -2
LEGATUM INSTITUTE | The 2016 Africa Prosperity Report 19 |
| 20LEGATUM INSTITUTE | The 2016 Africa Prosperity Report
SECTION HEADING AND CHAPTER TITLE GOES HERE
HEAT MAP: ECONOMIC COMPLEXITY ACROSS AFRICA
KEY
> 0.0
-0.5 to 0.09
-1.0 to -0.49
-1.5 to -0.99
-2.0 to -1.49
< -2
| 20LEGATUM INSTITUTE | The 2016 Africa Prosperity Report
21 | LEGATUM INSTITUTE | The 2016 Africa Prosperity Report
DIVERSIFY FOR PROSPERITY
As governments and leaders across the continent face the challenge of delivering prosperity with lower growth, the Index offers an important note of reassurance. The relationship between wealth and prosperity across Sub-Saharan Africa is relatively weak.1 In terms of prosperity delivery, a country’s wealth level is statistically irrelevant.2 Poor countries can, and do, deliver far greater prosperity than countries with many times their wealth. The slower rise of GDP per capita need not be, by any means, fatal for prosperity.
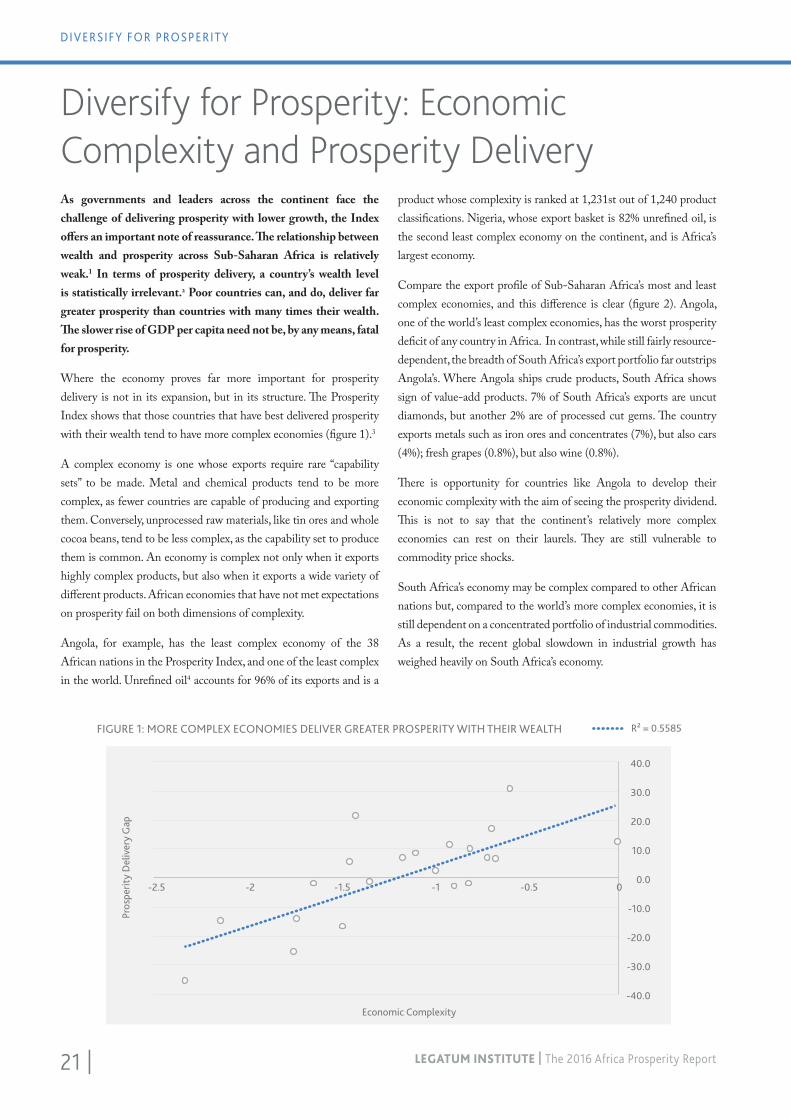
Where the economy proves far more important for prosperity delivery is not in its expansion, but in its structure. The Prosperity Index shows that those countries that have best delivered prosperity with their wealth tend to have more complex economies (figure 1).3
A complex economy is one whose exports require rare “capability sets” to be made. Metal and chemical products tend to be more complex, as fewer countries are capable of producing and exporting them. Conversely, unprocessed raw materials, like tin ores and whole cocoa beans, tend to be less complex, as the capability set to produce them is common. An economy is complex not only when it exports highly complex products, but also when it exports a wide variety of different products. African economies that have not met expectations on prosperity fail on both dimensions of complexity.
Angola, for example, has the least complex economy of the 38 African nations in the Prosperity Index, and one of the least complex in the world. Unrefined oil4 accounts for 96% of its exports and is a
Diversify for Prosperity: Economic Complexity and Prosperity Delivery
product whose complexity is ranked at 1,231st out of 1,240 product classifications. Nigeria, whose export basket is 82% unrefined oil, is the second least complex economy on the continent, and is Africa’s largest economy.
Compare the export profile of Sub-Saharan Africa’s most and least complex economies, and this difference is clear (figure 2). Angola, one of the world’s least complex economies, has the worst prosperity deficit of any country in Africa. In contrast, while still fairly resource-dependent, the breadth of South Africa’s export portfolio far outstrips Angola’s. Where Angola ships crude products, South Africa shows sign of value-add products. 7% of South Africa’s exports are uncut diamonds, but another 2% are of processed cut gems. The country exports metals such as iron ores and concentrates (7%), but also cars (4%); fresh grapes (0.8%), but also wine (0.8%).
There is opportunity for countries like Angola to develop their economic complexity with the aim of seeing the prosperity dividend. This is not to say that the continent’s relatively more complex economies can rest on their laurels. They are still vulnerable to commodity price shocks.
South Africa’s economy may be complex compared to other African nations but, compared to the world’s more complex economies, it is still dependent on a concentrated portfolio of industrial commodities. As a result, the recent global slowdown in industrial growth has weighed heavily on South Africa’s economy.
FIGURE 1: MORE COMPLEX ECONOMIES DELIVER GREATER PROSPERITY WITH THEIR WEALTH
Economic Complexity
Pros
perit
y D
eliv
ery
Gap
R² = 0.5585
-40.0
-30.0
-20.0
-10.0
0.0
10.0
20.0
30.0
40.0
-2.5 -2 -1.5 -1 -0.5 0

| 22LEGATUM INSTITUTE | The 2016 Africa Prosperity Report
ECONOMIC COMPLEXITY AND PROSPERITY DELIVERY
So too are countries like Zambia dependent on commodities. Its relatively complex economy is still dominated by copper, though mainly processed in some form. Falling commodity prices may soon undermine the prosperity payoff of complexity. Despite their strong delivery performance, the prosperity gains of these nations are at risk.
Added complexity needs to come through diversification away from commodities. Despite the relative complexity of some African economies, Sub-Saharan Africa is still the least economically complex region in the world, even behind the oil-rich Middle East. There are prosperity gains to be made from complexity, but only through diversification can these be said to be truly sustainable. Here lies a compounding problem with Africa’s concentration in commodity exports.
Previously, strong demand for African commodities led to an appreciation of exporters’ currencies. This appreciation hit the export competitiveness of other tradable sectors, particularly manufacturing, which has been in secular decline across sub-Saharan Africa over the past three decades - without ever having occupied a large share of the economy.
This premature deindustrialisation poses serious challenges for African nations. It closes off the main avenue of economic growth among developing countries: the shift of workers from the countryside to urban factories, where their productivity tends to be higher. Industrialisation drives growth both through this reallocation effect and because manufacturing experiences stronger productivity growth over the medium to long-term than other sectors, providing opportunities to build and enhance economic complexity.
There are subtler consequences of premature deindustrialisation, which also threaten the long-term sustainability of national prosperity. Industrialisation, which concentrates pools of workers, has historically been associated with the rise of class-based solidarity and labour-based political parties. It was through these two institutions that the working class morphed into a middle class, a group seen as central to Africa’s development story.
There are signs that economic diversification is happening, but not along the right lines. Sub-Saharan Africa’s services sector has expanded more than in any other part of the developing world since 2000, accounting for 58% of GDP up from 49%.5 In some parts of the continent, this expansion has been particularly significant.
FIGURE 2: EXPORT PROFILES OF THE MOST AND LEAST COMPLEX ECONOMIES IN SUB-SAHARAN AFRICA
0.75%
Dissolving Grades...
9.6%
Diamonds11%
Gold
7.0%
Platinum
4.1%
Ferroalloys0.68%
Scrap... Hot-RolledIron
0.64%
Large Flat...
Iron...
RefinedCopper
0.59%
NickelMattes
Raw Aluminium
AluminiumPlating
Raw...
Engine...
1.9%
Centrifuges
4.3%
Cars2.4%
DeliveryTrucks
Vehicle Parts
Other...
1.3%
Citrus
Apples andPears Corn
RawSugar
Fruit...
0.77%
Wine
5.2%
Iron Ore
1.6%
Manganese...
0.86%
CopperOre
0.99%
Chromium Ore
5.5%
Coal Briquettes
1.1%
Refined Petroleum
0.55%
Propylene...
TOTAL: $106B
96%
Crude Petroleum
SOUTH AFRICA
TOTAL: $54.6B
ANGOLA
Source: The Observatory of Economic Complexity
23 | LEGATUM INSTITUTE | The 2016 Africa Prosperity Report
DIVERSIFY FOR PROSPERITY
Nigeria has seen the biggest increase in its service sector of any country in the world. In 2000, services accounted for 21.8% GDP. By 2014, that had risen to over half the economy at 55.5%.6 Ghana too has seen a marked increase from 32.2% to 50% in the same period. A dependency on commodities is transitioning into a concentration of low skilled, low productivity services rather than much-needed manufacturing industries.
How can Africa diversify and build the economic complexity needed for long-term prosperity? African nations need to overcome barriers in four broad areas.
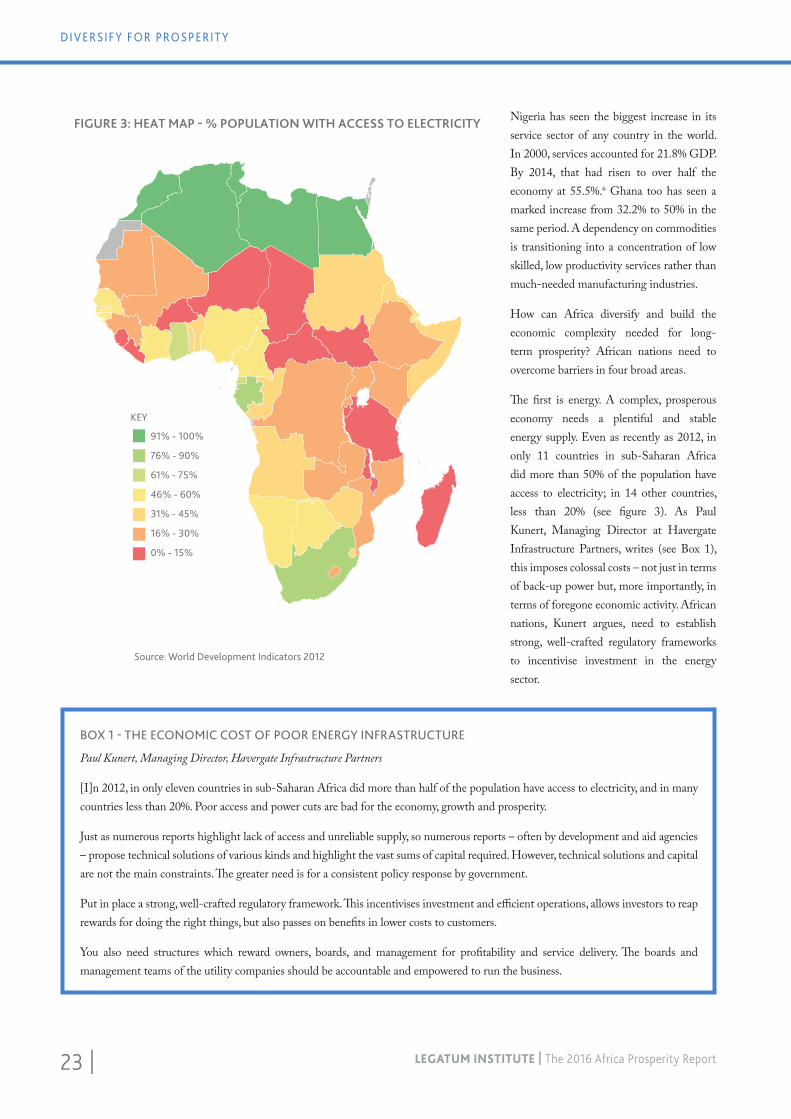
The first is energy. A complex, prosperous economy needs a plentiful and stable energy supply. Even as recently as 2012, in only 11 countries in sub-Saharan Africa did more than 50% of the population have access to electricity; in 14 other countries, less than 20% (see figure 3). As Paul Kunert, Managing Director at Havergate Infrastructure Partners, writes (see Box 1), this imposes colossal costs – not just in terms of back-up power but, more importantly, in terms of foregone economic activity. African nations, Kunert argues, need to establish strong, well-crafted regulatory frameworks to incentivise investment in the energy sector.
BOX 1 - THE ECONOMIC COST OF POOR ENERGY INFRASTRUCTURE
Paul Kunert, Managing Director, Havergate Infrastructure Partners
[I]n 2012, in only eleven countries in sub-Saharan Africa did more than half of the population have access to electricity, and in many countries less than 20%. Poor access and power cuts are bad for the economy, growth and prosperity.
Just as numerous reports highlight lack of access and unreliable supply, so numerous reports – often by development and aid agencies – propose technical solutions of various kinds and highlight the vast sums of capital required. However, technical solutions and capital are not the main constraints. The greater need is for a consistent policy response by government.
Put in place a strong, well-crafted regulatory framework. This incentivises investment and efficient operations, allows investors to reap rewards for doing the right things, but also passes on benefits in lower costs to customers.
You also need structures which reward owners, boards, and management for profitability and service delivery. The boards and management teams of the utility companies should be accountable and empowered to run the business.
FIGURE 3: HEAT MAP - % POPULATION WITH ACCESS TO ELECTRICITY
Source: World Development Indicators 2012
KEY
91% - 100%
76% - 90%
61% - 75%
46% - 60%
31% - 45%
16% - 30%
0% - 15%
| 24LEGATUM INSTITUTE | The 2016 Africa Prosperity Report
ECONOMIC COMPLEXITY AND PROSPERITY DELIVERY
BOX 2 - STEM IN AFRICA: THE BUSINESS CASE
Dr. Álvaro Sobrinho, Chairman, Planet Earth Institute, and Lord Paul Boateng, Trustee, Planet Earth Institute & Chair, African Enterprise Challenge Fund
Though doubling, enrolment rates in Africa are still amongst the lowest globally with an average of 7.1% compared to 25.1% elsewhere in the world. Only one in six African students is likely to graduate in a science or engineering field, compared to 40% of students in fast growing economies like China. Research in STEM makes up only 29% of all research in Sub-Saharan Africa. In contrast it’s 68% in Malaysia and Vietnam.
[P]assive and partial private sector engagement is no longer an option – business as usual will not do – a solution is needed to develop and scale-up business-led approaches that go beyond corporate responsibility and instead address future commercial viability.
Open communication is the first and perhaps most important thing that is required. In too many instances, the mechanisms for dialogue and collaboration between higher education institutions and private sector organisations have been lacking. Key to making this happen is ensuring that business is an equal partner and engaged from the beginning.
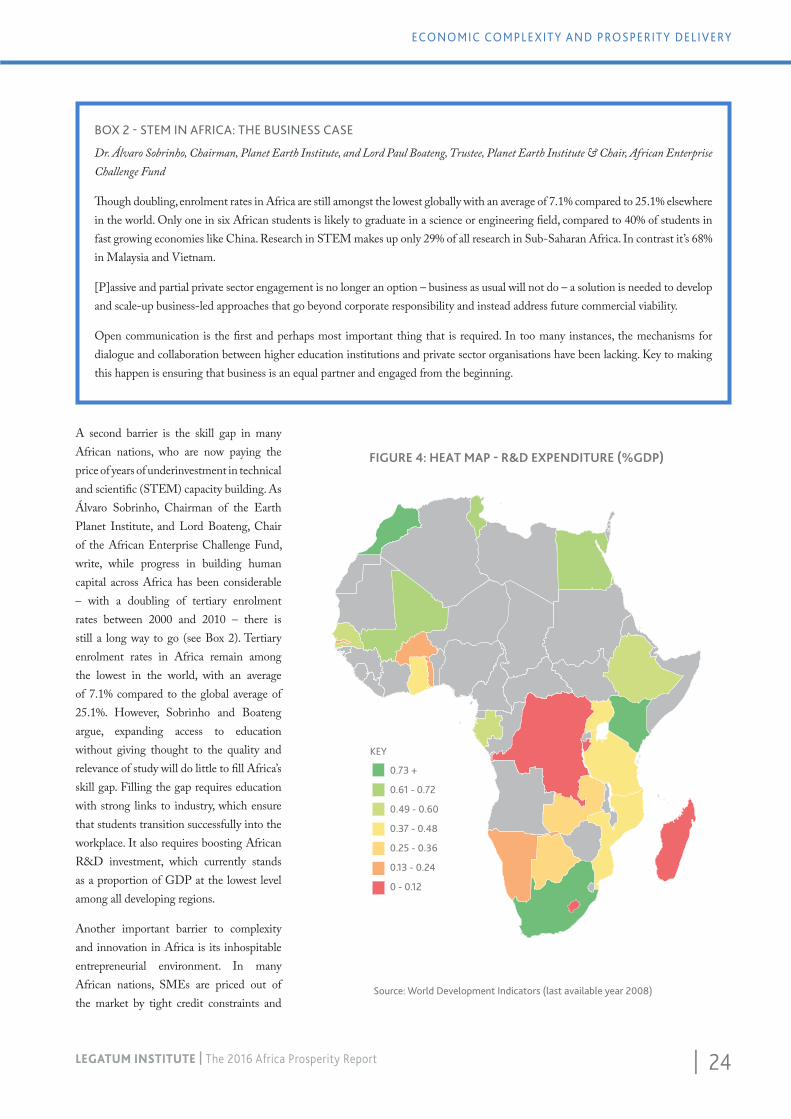
A second barrier is the skill gap in many African nations, who are now paying the price of years of underinvestment in technical and scientific (STEM) capacity building. As Álvaro Sobrinho, Chairman of the Earth Planet Institute, and Lord Boateng, Chair of the African Enterprise Challenge Fund, write, while progress in building human capital across Africa has been considerable – with a doubling of tertiary enrolment rates between 2000 and 2010 – there is still a long way to go (see Box 2). Tertiary enrolment rates in Africa remain among the lowest in the world, with an average of 7.1% compared to the global average of 25.1%. However, Sobrinho and Boateng argue, expanding access to education without giving thought to the quality and relevance of study will do little to fill Africa’s skill gap. Filling the gap requires education with strong links to industry, which ensure that students transition successfully into the workplace. It also requires boosting African R&D investment, which currently stands as a proportion of GDP at the lowest level among all developing regions.
Another important barrier to complexity and innovation in Africa is its inhospitable entrepreneurial environment. In many African nations, SMEs are priced out of the market by tight credit constraints and
FIGURE 4: HEAT MAP - R&D EXPENDITURE (%GDP)
Source: World Development Indicators (last available year 2008)
KEY
0.73 +
0.61 - 0.72
0.49 - 0.60
0.37 - 0.48
0.25 - 0.36
0.13 - 0.24
0 - 0.12
25 | LEGATUM INSTITUTE | The 2016 Africa Prosperity Report
DIVERSIFY FOR PROSPERITY
excessive or inappropriate government regulations. It is harder for a business to get credit in Angola than most other countries in the world.7 The world’s most expensive country in which to start a business is the Central African Republic. Less prohibitive is Angola, where starting a business involves completing eight different legal procedures. These procedures need at least 36 days to be completed and will cost in fees the equivalent of 22.5% of the country’s average per capita income. Furthermore, Angolan entrepreneurs must register their business with a minimum paid-in capital equivalent to 18.9% of the country’s average per capita income. Supporting African entrepreneurship requires a regulatory environment that enables millions of potential job creators to succeed rather than policies that protect a small number of government or private entities.
Finally, trade. Although, New York University Professor David Rice writes, trade between African nations has doubled since 2005, this growth simply kept pace with global trends (see Box 3). Africa continues to contribute only 2% to global trade. Such poor market access not only holds back the development of important export industries like manufacturing but, Rice argues, hinders economic expansion, slows income growth, and blocks the creation of stronger and more peaceful international relationships. While trade costs between Africa and other regions like the EU remain high, mainly due to import tariffs, trade costs between African countries are often higher. Rice cites the example that crossing borders with commercial products in Sub-Saharan Africa takes 12 days on average compared to six days in Central and East Asia, and four days in Central and Eastern Europe.8 A concerted effort to accelerate trade negotiations, harmonise regulations, and implement various trade agreements would substantially reduce African nations’ dependence on raw materials and commodity exports. It would also help broaden the market for SMEs, helping them to achieve high growth themselves, while in turn driving economic growth across economies.
1GDP per capita PPP (current international $) v Africa prosperity percentile rank. R-squared value of 0.292GDP per capita PPP (current international $) v Prosperity Gap. R-squared value of 0.000073As measured by the 2014 Economic Complexity Index (Cesar A. Hidalgo, Ricardo Hausmann (2009))4According to the UN’s Harmonized Commodity Description and Coding System (HS4), “Petroleum oils, crude.”5Services, value added (% GDP), 2000-2014, World Bank (retrieved 25.4.16)
6ibid
7World Bank Ease of Doing Business Report, 2015. Ranking of 189 countries.
8From Africans Investing in Africa, Palgrave MacMillan, 2015
BOX 3 - TRADE, ENTREPRENEURSHIP AND LOCAL VALUE CREATION: EASE OF AFRICANS DOING BUSINESS IN AFRICA
Professor David A. Rice, Development Dividend Project, New York University
Though trade between African countries has doubled since 2005 to 17% (compared to Europe’s 66% and Asia’s 48% ), this growth has only kept pace with global trends and the region continues to contribute just 2% to global trade.
The need for eliminating intra-African trade barriers need not be imagined. For example, research has found that crossing borders with commercial products in Sub-Saharan Africa takes 12 days on average compared to six days in Central and East Asia, and four days in Central and Eastern Europe .
Accelerating the ongoing negotiations, harmonisation, and implementation of various African regional trade agreements (including the Continental FTA) in 2016 would greatly help African economies reduce their reliance on raw material or primary commodity exports and develop a greater capacity to compete on a global scale.
| 26LEGATUM INSTITUTE | The 2016 Africa Prosperity Report
THE CORNERSTONES OF PROSPERITY
In delivering high levels of prosperity with their wealth, one of the striking things about top performing countries in Sub-Saharan Africa is that they seem to share comparatively strong levels of free choice and civil liberties alongside good governance in a number of fundamental areas.
The most interesting question is whether basic freedoms and good governance are more than mere correlates of prosperity delivery, and are actually its fundamental prerequisites.
Either way, that government holds so much in its gift when it comes to the potential for prosperity delivery is important to highlight as questions are raised about the impact of slower growth across the continent.
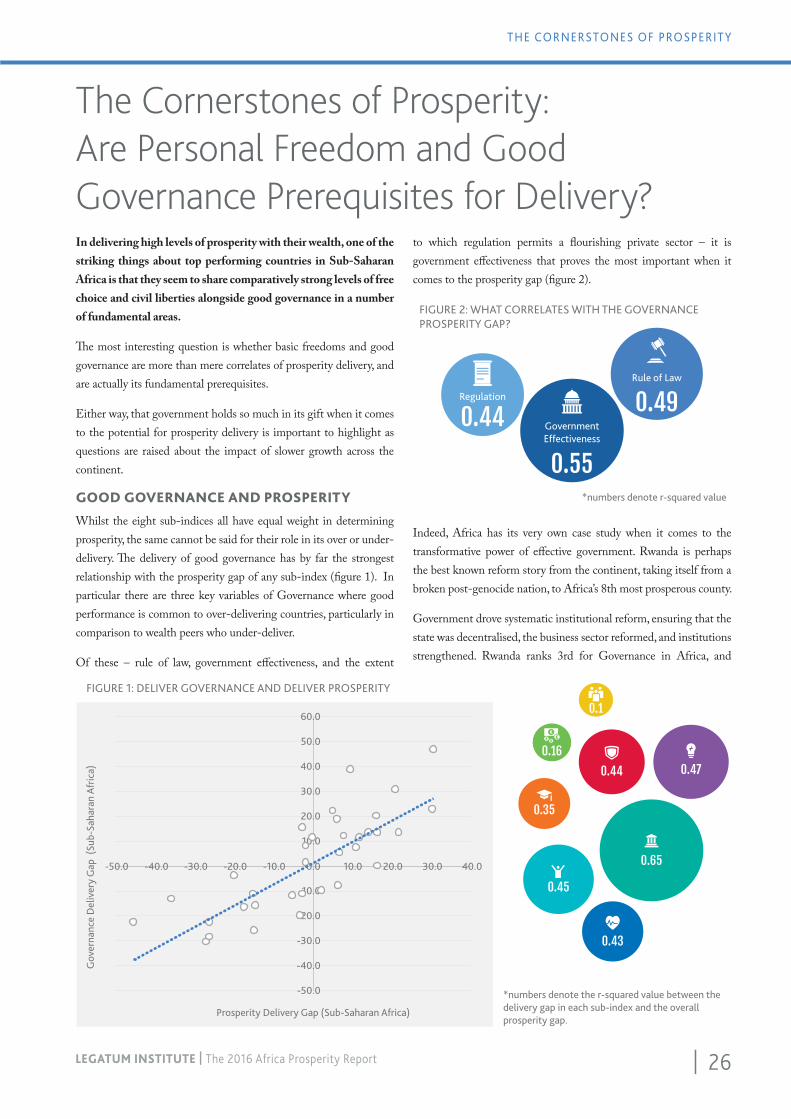
GOOD GOVERNANCE AND PROSPERITYWhilst the eight sub-indices all have equal weight in determining prosperity, the same cannot be said for their role in its over or under-delivery. The delivery of good governance has by far the strongest relationship with the prosperity gap of any sub-index (figure 1). In particular there are three key variables of Governance where good performance is common to over-delivering countries, particularly in comparison to wealth peers who under-deliver.
Of these – rule of law, government effectiveness, and the extent
The Cornerstones of Prosperity: Are Personal Freedom and Good Governance Prerequisites for Delivery?
to which regulation permits a flourishing private sector – it is government effectiveness that proves the most important when it comes to the prosperity gap (figure 2).
Indeed, Africa has its very own case study when it comes to the transformative power of effective government. Rwanda is perhaps the best known reform story from the continent, taking itself from a broken post-genocide nation, to Africa’s 8th most prosperous county.
Government drove systematic institutional reform, ensuring that the state was decentralised, the business sector reformed, and institutions strengthened. Rwanda ranks 3rd for Governance in Africa, and
FIGURE 2: WHAT CORRELATES WITH THE GOVERNANCE PROSPERITY GAP?
*numbers denote r-squared value
GovernmentEffectiveness
0.55
Regulation
0.44
Rule of Law
0.49
FIGURE 1: DELIVER GOVERNANCE AND DELIVER PROSPERITY
-50.0
-40.0
-30.0
-20.0
10.0
10.0
20.0
30.0
40.0
50.0
60.0
-50.0 -40.0 -30.0 -20.0 -10.0 0.0 10.0 20.0 30.0 40.0
Prosperity Delivery Gap (Sub-Saharan Africa)
Gov
erna
nce
Del
iver
y G
ap (
Sub-
Saha
ran
Afr
ica)
0.43
0.16
0.47
0.35
0.44
0.45
0.1
0.65
*numbers denote the r-squared value between the delivery gap in each sub-index and the overall prosperity gap.
27 | LEGATUM INSTITUTE | The 2016 Africa Prosperity Report
ARE PERSONAL FREEDOM AND GOOD GOVERNANCE PREREQUISITES FOR DELIVERY?
has the biggest prosperity surplus both overall and in Governance. Its transformation speaks to the enduring importance of good governance and in particular, rule of law, effective government, and regulation as a means of unlocking prosperity growth.
Writing in the Wall Street Journal in 2013, Rwandan President Paul Kagame remarked on the ongoing need in Africa for “governance reforms and social development, propelled by economic growth that delivers tangible improvements in the lives of citizens”.
As growth slows, the delivery of the type of health and education investment seen in Rwanda and elsewhere, will be harder to maintain. Yet, the Index suggests that prosperity can still be delivered as long as the potential for governance reform remains.
If governance is a prerequisite for the serious delivery of prosperity, then the budgetary constraints of lower growth driving it to prominence could prove promising for long-term prosperity across the continent.
LIBERTY AND THE PURSUIT OF PROSPERITYThe Index shows that it is those countries who combine strong structural rights (of association and expression, religious, political etc) and who achieve a sense of self-determination among their citizens, a sense that they control their destiny, that are most likely to be the ones that over-perform.
Here lies an important message for policy makers and leaders across the continent: simple structural reform that guarantees basic rights and freedoms can help supercharge prosperity.
Conceptually, the principle of freedom leading to a prosperity surplus in the African context is easy to see. For prosperity to be created and shared throughout society, the value and contribution of every citizen must be recognised. Wealthy but deeply impoverished states like Angola (with the second lowest level of freedom in Sub-Saharan Africa) are the result of failure here. Freedom is central to getting it right. Property rights enable wealth creation. Freedom of expression enables ideas to be voiced and shared. Freedom of association allows people to come together to try and drive change.
The catalytic effect of freedom gives a prosperity payoff that is not merely confined to the gain made from rising up the Personal Freedom sub-index ranks. The strong effect of freedom can be seen elsewhere.
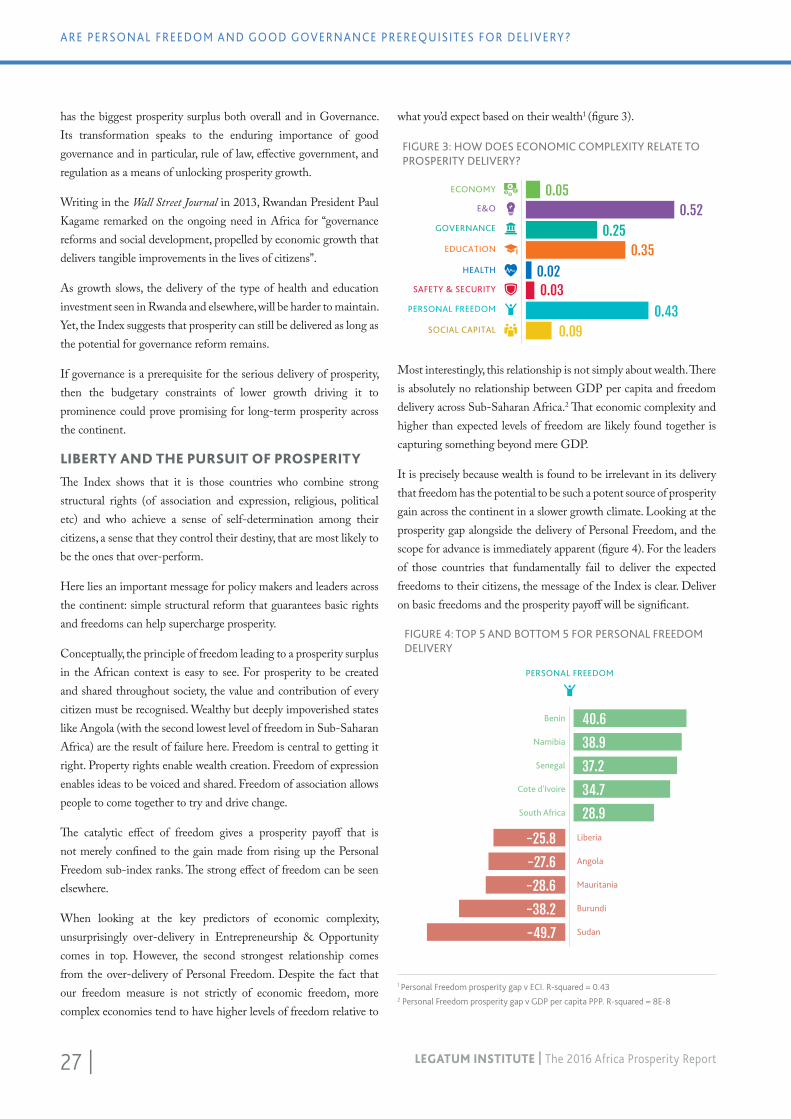
When looking at the key predictors of economic complexity, unsurprisingly over-delivery in Entrepreneurship & Opportunity comes in top. However, the second strongest relationship comes from the over-delivery of Personal Freedom. Despite the fact that our freedom measure is not strictly of economic freedom, more complex economies tend to have higher levels of freedom relative to
what you’d expect based on their wealth1 (figure 3).
Most interestingly, this relationship is not simply about wealth. There is absolutely no relationship between GDP per capita and freedom delivery across Sub-Saharan Africa.2 That economic complexity and higher than expected levels of freedom are likely found together is capturing something beyond mere GDP.
It is precisely because wealth is found to be irrelevant in its delivery that freedom has the potential to be such a potent source of prosperity gain across the continent in a slower growth climate. Looking at the prosperity gap alongside the delivery of Personal Freedom, and the scope for advance is immediately apparent (figure 4). For the leaders of those countries that fundamentally fail to deliver the expected freedoms to their citizens, the message of the Index is clear. Deliver on basic freedoms and the prosperity payoff will be significant.
1 Personal Freedom prosperity gap v ECI. R-squared = 0.432 Personal Freedom prosperity gap v GDP per capita PPP. R-squared = 8E-8
FIGURE 3: HOW DOES ECONOMIC COMPLEXITY RELATE TO PROSPERITY DELIVERY?
ECONOMY
E&O
HEALTH
PERSONAL FREEDOM
SOCIAL CAPITAL
SAFETY & SECURITY
GOVERNANCE
EDUCATION
0.050.52
0.250.35
0.020.03
0.430.09
FIGURE 4: TOP 5 AND BOTTOM 5 FOR PERSONAL FREEDOM DELIVERY
PERSONAL FREEDOM
Benin
Namibia
Senegal
Cote d'Ivoire
South Africa
Liberia
Angola
Mauritania
Burundi
Sudan
40.6
38.9
37.2
34.7
28.9
-25.8
-27.6
-28.6
-38.2
-49.7
1234
| 28LEGATUM INSTITUTE | The 2016 Africa Prosperity Report
SEVEN RECOMMENDATIONS TO GROW PROSPERITY IN AFRICA
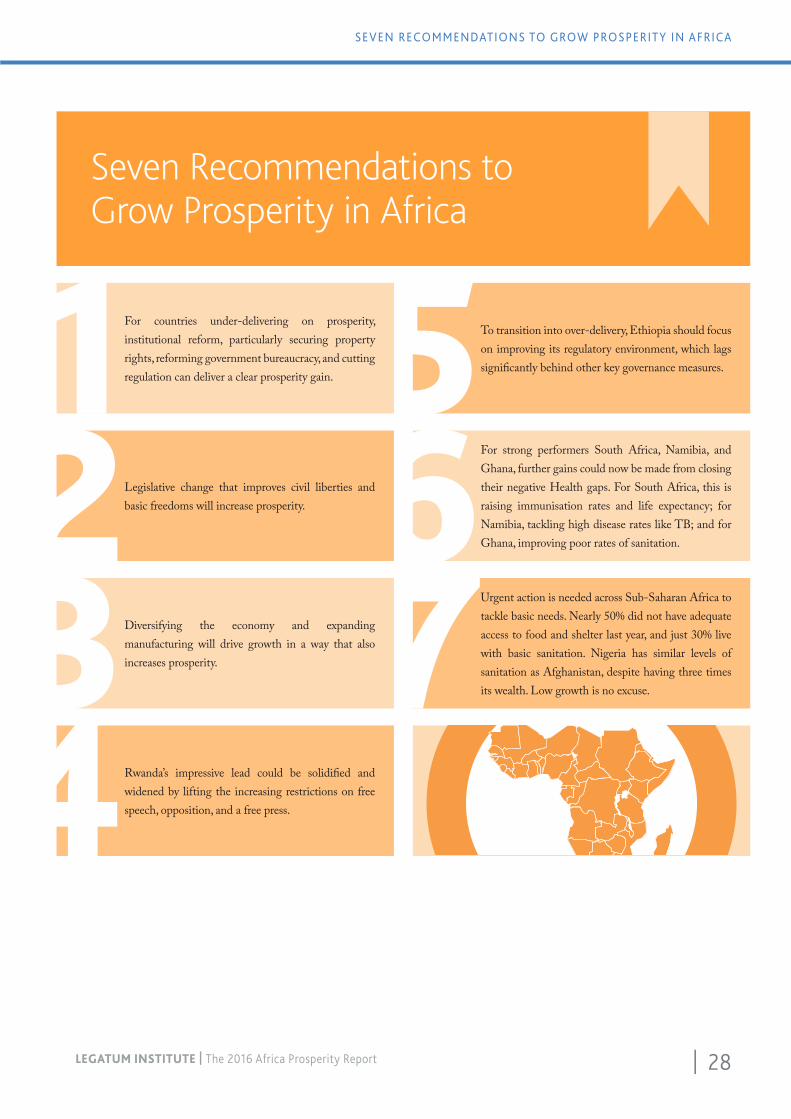
Seven Recommendations toGrow Prosperity in Africa
To transition into over-delivery, Ethiopia should focus on improving its regulatory environment, which lags significantly behind other key governance measures.
For strong performers South Africa, Namibia, and Ghana, further gains could now be made from closing their negative Health gaps. For South Africa, this is raising immunisation rates and life expectancy; for Namibia, tackling high disease rates like TB; and for Ghana, improving poor rates of sanitation.
Urgent action is needed across Sub-Saharan Africa to tackle basic needs. Nearly 50% did not have adequate access to food and shelter last year, and just 30% live with basic sanitation. Nigeria has similar levels of sanitation as Afghanistan, despite having three times its wealth. Low growth is no excuse.
567
For countries under-delivering on prosperity, institutional reform, particularly securing property rights, reforming government bureaucracy, and cutting regulation can deliver a clear prosperity gain.
Legislative change that improves civil liberties and basic freedoms will increase prosperity.
Diversifying the economy and expanding manufacturing will drive growth in a way that also increases prosperity.
Rwanda’s impressive lead could be solidified and widened by lifting the increasing restrictions on free speech, opposition, and a free press.
1234
29 | LEGATUM INSTITUTE | The 2016 Africa Prosperity Report
SECTION HEADING AND CHAPTER TITLE GOES HERE
LEGATUM INSTITUTE | The 2016 Africa Prosperity Report29 |
The Sustainable Development Goals set by the UN in 2015 cover 17 separate ambitions that break down into 169 specific targets. Broadly, they seek to eradicate poverty in all forms and dimensions, and help people to live more prosperous lives by securing education, health, and opportunity.
However, the outstanding question is how progress is measured independently.
This chapter looks at how the Legatum Prosperity Index™ can provide this independent measure of progress. We map our pillars and variables onto the SDGs to show how prosperity for all, in all corners of the world, is the fundamental goal that we are all aiming to achieve. The Index can measure our progress towards it.
Prosperity to
2030MEASURING PROGRESS AGAINST THE SUSTAINABLE DEVELOPMENT GOALS
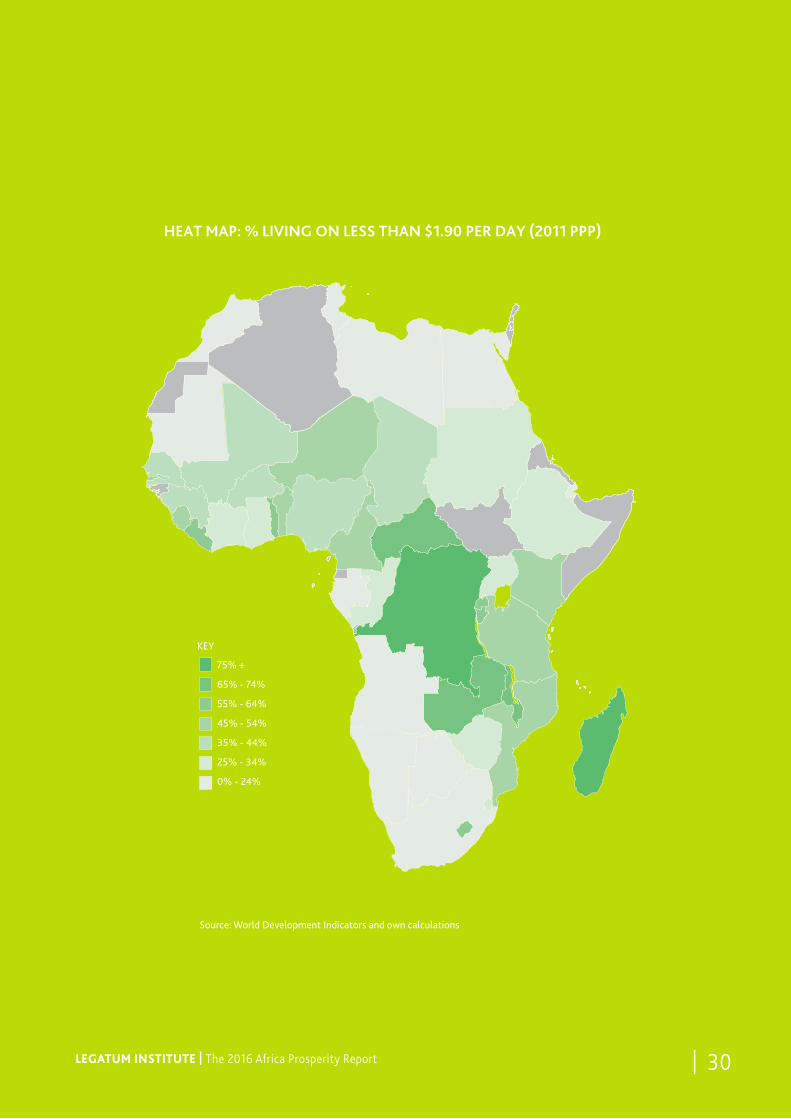
HEAT MAP: % LIVING ON LESS THAN $1.90 PER DAY (2011 PPP)
KEY
75% +
65% - 74%
55% - 64%
45% - 54%
35% - 44%
25% - 34%
0% - 24%
Source: World Development Indicators and own calculations
| 30LEGATUM INSTITUTE | The 2016 Africa Prosperity Report
SECTION HEADING AND CHAPTER TITLE GOES HERE
| 30LEGATUM INSTITUTE | The 2016 Africa Prosperity Report
HEAT MAP: % LIVING ON LESS THAN $1.90 PER DAY (2011 PPP)
KEY
75% +
65% - 74%
55% - 64%
45% - 54%
35% - 44%
25% - 34%
0% - 24%
Source: World Development Indicators and own calculations
31 | LEGATUM INSTITUTE | The 2016 Africa Prosperity Report
PROSPERITY AND THE SDGS: AN INDEPENDENT MEASURE OF PROGRESS
% without adequate food
END POVERTY IN ALL ITS FORMS EVERYWHERE
1
% without adequate food
% without adequate shelter
% living on less than $1.25 a day
% living below national poverty line
Feelings about household income
Satisfied with your standard of living?
Feelings about household income
Satisfied with your standard of living?
Can people get ahead by working hard?
% population with a bank account
Female labour force participation rate
% living on less than $1.25 a day
% living below national poverty line
Feelings about household income
% without adequate food
% without adequate shelter
END HUNGER AND ENSURE ACCESS TO NUTRITIOUS FOOD
2.1
END HUNGER, ACHIEVE FOOD SECURITY AND
IMPROVED NUTRITION
2
HALVE NATIONAL POVERTY
1.2
IMPLEMENT SOCIAL PROTECTION
SYSTEMS
1.3
EQUAL RIGHTS TO ECONOMIC RESOURCES
1.4
ERADICATE EXTREME POVERTY
1.1
BUILD THE RESILIANCE OF THE
POOR AND VULNERABLE
1.5
ENSURE HEALTHY LIVES AND PROMOTE
WELLBEING
3
END PREVENTABLE DEATHS OF NEWBORNS
3.2
ACHIEVE UNIVERSAL HEALTH
COVERAGE
3.8
HALVE DEATHS FROM ROAD ACCIDENTS
3.6
REDUCE PREMATURE MORTALITY,
PROMOTE MENTAL HEALTH AND WELLBEING
3.4
END THE EPIDEMIC OF
COMMUNICABLE DISEASES
3.3
REDUCE DEATHS FROM POLLUTION
3.9
Infant mortality
Immunisation (DPT)
Immunisation (measles)
Life satisfaction
Diabetes prevalence
Road deathsper 100,000
Immunisation (DPT)
Improved sanitation facilities
Household airpollution deaths
Satisfied withavailable healthcare?
Age standardised mortality rate
Age standardised mortality rate
Positive emotions experienced
Negative emotions experiences
Regulation of dangerous pesticides
% wastewater that receives treatment
Access to improved water source
% exposed to PM2.5
ENTREPRENEURSHIP & OPPORTUNITY PERSONAL FREEDOM
GOVERNANCE SOCIAL CAPITAL
ECONOMY SAFETY & SECURITY
ENVIRONMENTEDUCATION
HEALTH
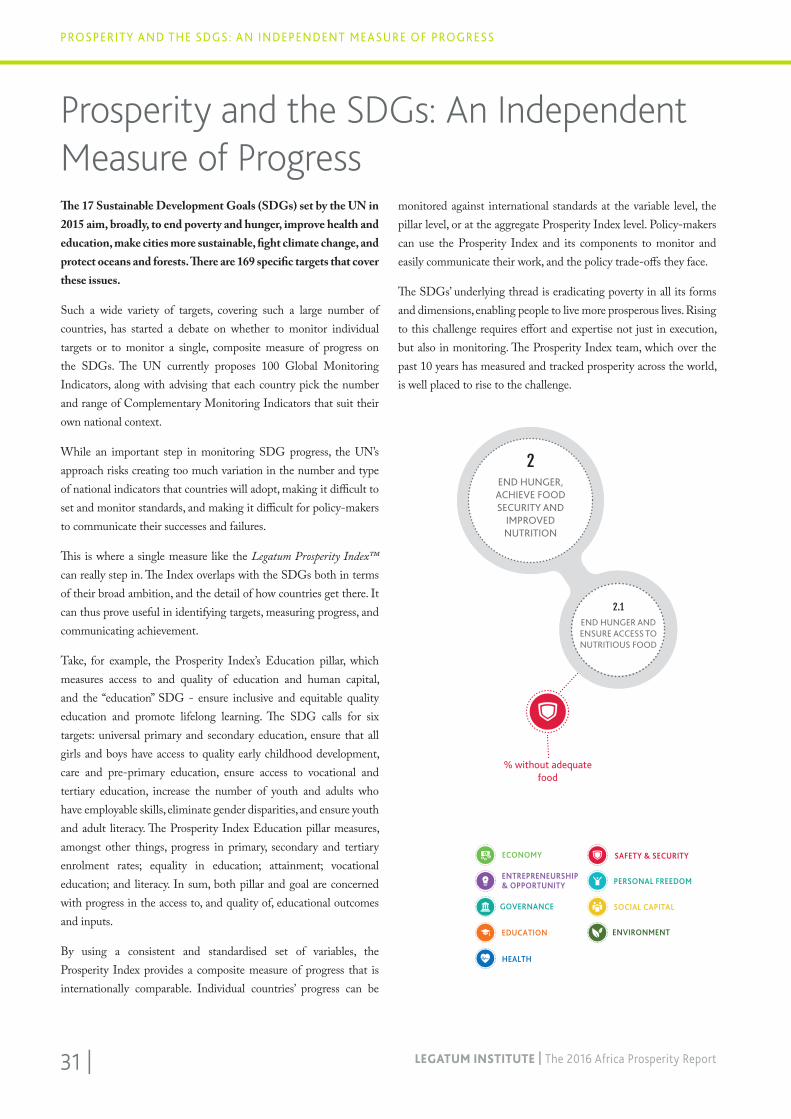
Prosperity and the SDGs: An Independent Measure of ProgressThe 17 Sustainable Development Goals (SDGs) set by the UN in 2015 aim, broadly, to end poverty and hunger, improve health and education, make cities more sustainable, fight climate change, and protect oceans and forests. There are 169 specific targets that cover these issues.
Such a wide variety of targets, covering such a large number of countries, has started a debate on whether to monitor individual targets or to monitor a single, composite measure of progress on the SDGs. The UN currently proposes 100 Global Monitoring Indicators, along with advising that each country pick the number and range of Complementary Monitoring Indicators that suit their own national context.
While an important step in monitoring SDG progress, the UN’s approach risks creating too much variation in the number and type of national indicators that countries will adopt, making it difficult to set and monitor standards, and making it difficult for policy-makers to communicate their successes and failures.
This is where a single measure like the Legatum Prosperity Index™ can really step in. The Index overlaps with the SDGs both in terms of their broad ambition, and the detail of how countries get there. It can thus prove useful in identifying targets, measuring progress, and communicating achievement.
Take, for example, the Prosperity Index’s Education pillar, which measures access to and quality of education and human capital, and the “education” SDG - ensure inclusive and equitable quality education and promote lifelong learning. The SDG calls for six targets: universal primary and secondary education, ensure that all girls and boys have access to quality early childhood development, care and pre-primary education, ensure access to vocational and tertiary education, increase the number of youth and adults who have employable skills, eliminate gender disparities, and ensure youth and adult literacy. The Prosperity Index Education pillar measures, amongst other things, progress in primary, secondary and tertiary enrolment rates; equality in education; attainment; vocational education; and literacy. In sum, both pillar and goal are concerned with progress in the access to, and quality of, educational outcomes and inputs.
By using a consistent and standardised set of variables, the Prosperity Index provides a composite measure of progress that is internationally comparable. Individual countries’ progress can be
monitored against international standards at the variable level, the pillar level, or at the aggregate Prosperity Index level. Policy-makers can use the Prosperity Index and its components to monitor and easily communicate their work, and the policy trade-offs they face.
The SDGs’ underlying thread is eradicating poverty in all its forms and dimensions, enabling people to live more prosperous lives. Rising to this challenge requires effort and expertise not just in execution, but also in monitoring. The Prosperity Index team, which over the past 10 years has measured and tracked prosperity across the world, is well placed to rise to the challenge.
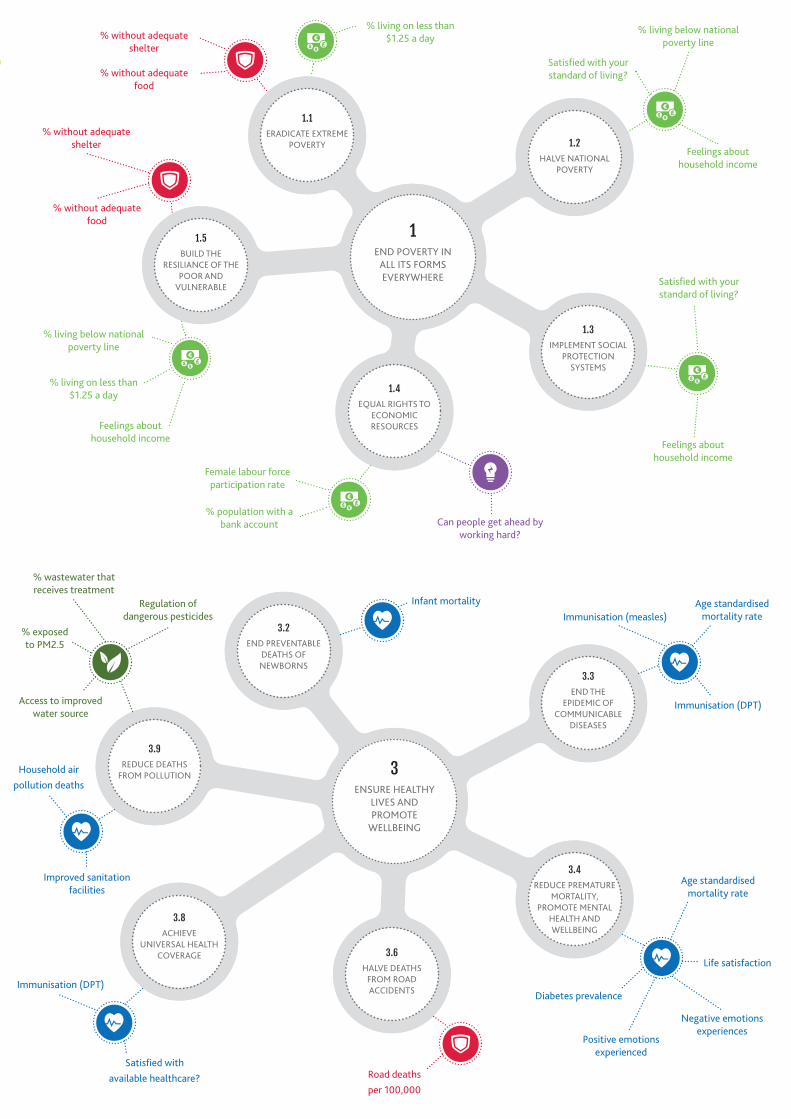
% without adequate food
END POVERTY IN ALL ITS FORMS EVERYWHERE
1
% without adequate food
% without adequate shelter
% living on less than $1.25 a day
% living below national poverty line
Feelings about household income
Satisfied with your standard of living?
Feelings about household income
Satisfied with your standard of living?
Can people get ahead by working hard?
% population with a bank account
Female labour force participation rate
% living on less than $1.25 a day
% living below national poverty line
Feelings about household income
% without adequate food
% without adequate shelter
END HUNGER AND ENSURE ACCESS TO NUTRITIOUS FOOD
2.1
END HUNGER, ACHIEVE FOOD SECURITY AND
IMPROVED NUTRITION
2
HALVE NATIONAL POVERTY
1.2
IMPLEMENT SOCIAL PROTECTION
SYSTEMS
1.3
EQUAL RIGHTS TO ECONOMIC RESOURCES
1.4
ERADICATE EXTREME POVERTY
1.1
BUILD THE RESILIANCE OF THE
POOR AND VULNERABLE
1.5
ENSURE HEALTHY LIVES AND PROMOTE
WELLBEING
3
END PREVENTABLE DEATHS OF NEWBORNS
3.2
ACHIEVE UNIVERSAL HEALTH
COVERAGE
3.8
HALVE DEATHS FROM ROAD ACCIDENTS
3.6
REDUCE PREMATURE MORTALITY,
PROMOTE MENTAL HEALTH AND WELLBEING
3.4
END THE EPIDEMIC OF
COMMUNICABLE DISEASES
3.3
REDUCE DEATHS FROM POLLUTION
3.9
Infant mortality
Immunisation (DPT)
Immunisation (measles)
Life satisfaction
Diabetes prevalence
Road deathsper 100,000
Immunisation (DPT)
Improved sanitation facilities
Household airpollution deaths
Satisfied withavailable healthcare?
Age standardised mortality rate
Age standardised mortality rate
Positive emotions experienced
Negative emotions experiences
Regulation of dangerous pesticides
% wastewater that receives treatment
Access to improved water source
% exposed to PM2.5
ENTREPRENEURSHIP & OPPORTUNITY PERSONAL FREEDOM
GOVERNANCE SOCIAL CAPITAL
ECONOMY SAFETY & SECURITY
ENVIRONMENTEDUCATION
HEALTH
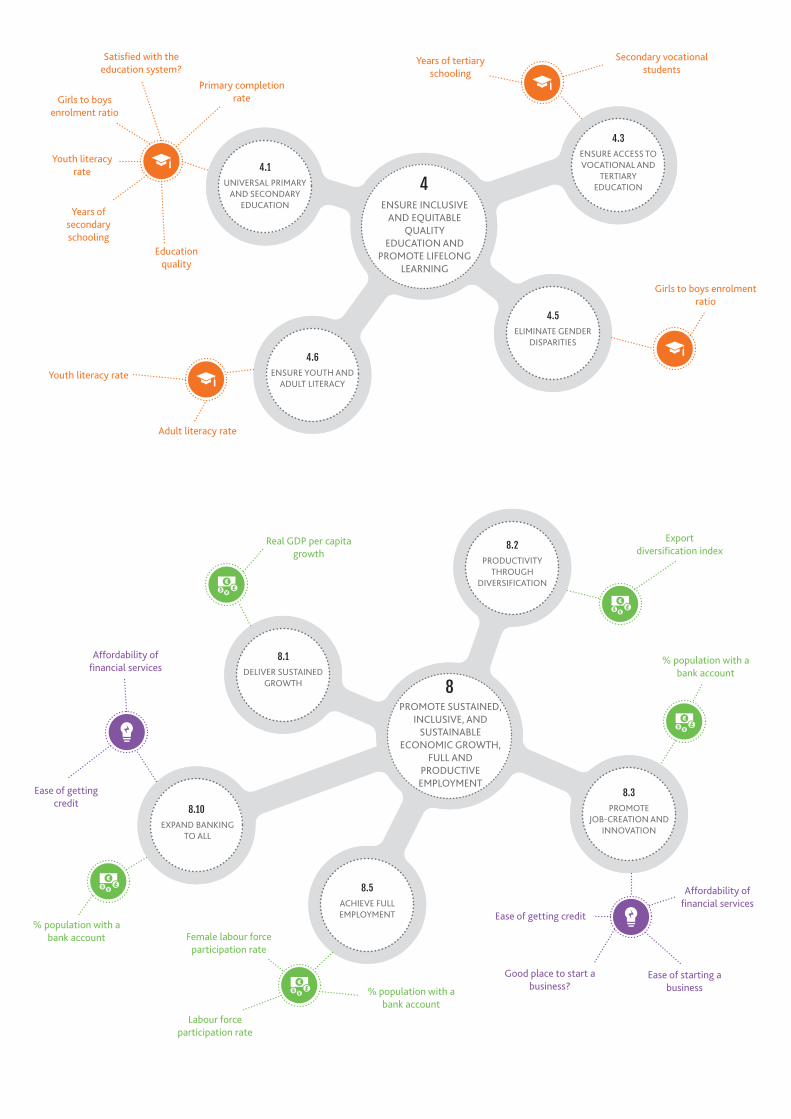
ENSURE INCLUSIVE AND EQUITABLE
QUALITY EDUCATION AND
PROMOTE LIFELONG LEARNING
4UNIVERSAL PRIMARY AND SECONDARY
EDUCATION
4.1
ENSURE YOUTH AND ADULT LITERACY
4.6
ELIMINATE GENDER DISPARITIES
4.5
ENSURE ACCESS TO VOCATIONAL AND
TERTIARY EDUCATION
4.3
Primary completion rate
Years of secondary schooling
Youth literacy rate
Girls to boys enrolment ratio
Education quality
Satisfied with the education system?
Years of tertiary schooling
Secondary vocational students
Girls to boys enrolment ratio
Youth literacy rate
Adult literacy rate
END ALL FORMS OF DISCRIMINATION
5.1
ACHIEVE GENDER EQUALITY AND EMPOWER ALL WOMEN AND
GIRLS
5
EQUAL OPPORTUNITIES FOR
LEADERSHIP
5.5
Female labour force participation rate
Marital rape
% women in parliament
Girls to boys enrolment ratio
ENSURE AVAILABILITY AND
SUSTAINABLE MANAGEMENT OF
WATER AND SANITATION
6
ACCESS TO SANITATION
6.2
IMPROVE WATER QUALITY
6.3
IMPROVE SUSTAINABLE WATER
USE
6.4
UNIVERSAL DRINKING WATER
6.1
PROTECT WATER ECOSYSTEMS
6.6
PROMOTE SUSTAINED, INCLUSIVE, AND
SUSTAINABLE ECONOMIC GROWTH,
FULL AND PRODUCTIVE EMPLOYMENT
8
PRODUCTIVITY THROUGH
DIVERSIFICATION
8.2
PROMOTE JOB-CREATION AND
INNOVATION
8.3
ACHIEVE FULL EMPLOYMENT
8.5
DELIVER SUSTAINED GROWTH
8.1
EXPAND BANKING TO ALL
8.10
ENSURE ACCESS TO AFFORDABLE,
RELIABLE, SUSTAINABLE, AND MODERN ENERGY
FOR ALL
7
UNIVERSAL RELIABLE,
AFFORDABLE ENERGY
7.1
Improved sanitation facilities
Access to improved water source
% wastewater that receives
treatment
Regulation of dangerous pesticides
Freshwater withdrawal (% renewable resource)
Terrestrial protected
areas
Cost of getting electricity
Affordability of financial services
Real GDP per capita growth
Export diversification index
% population with a bank account
Ease of starting a business
Ease of getting credit
Good place to start a business?
Female labour force participation rate
% population with a bank account
Labour force participation rate
Affordability of financial services
% population with a bank account
Ease of getting credit
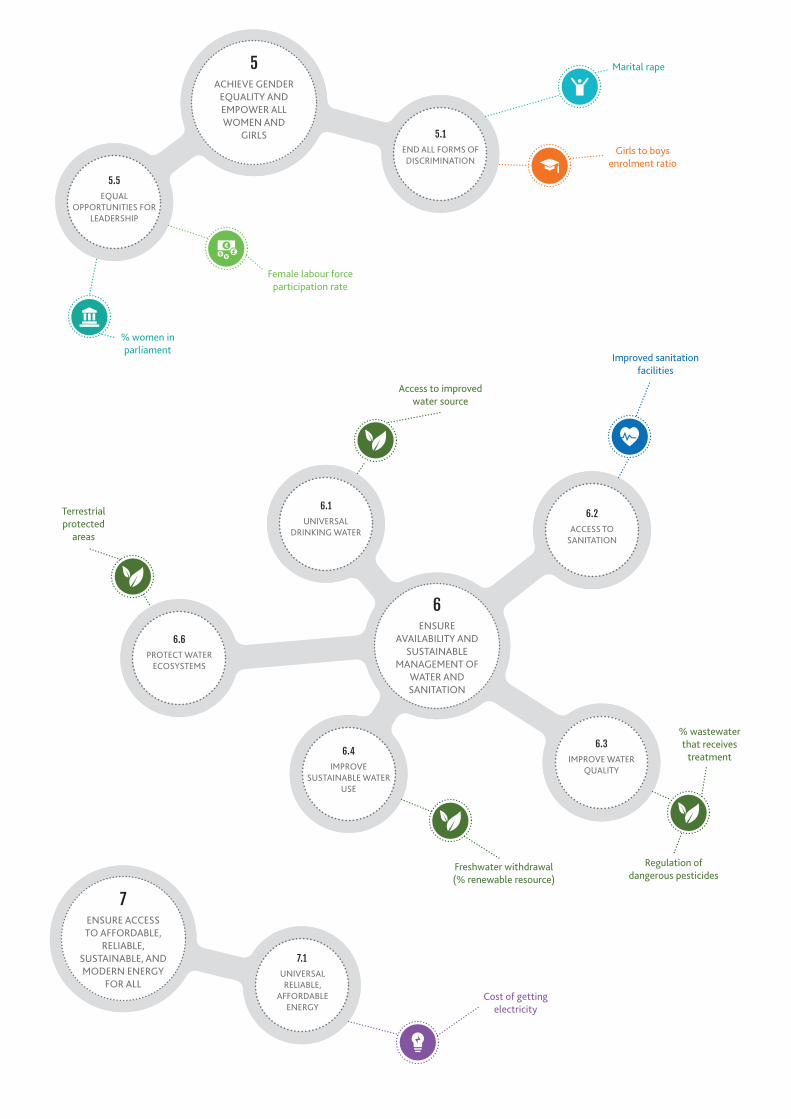
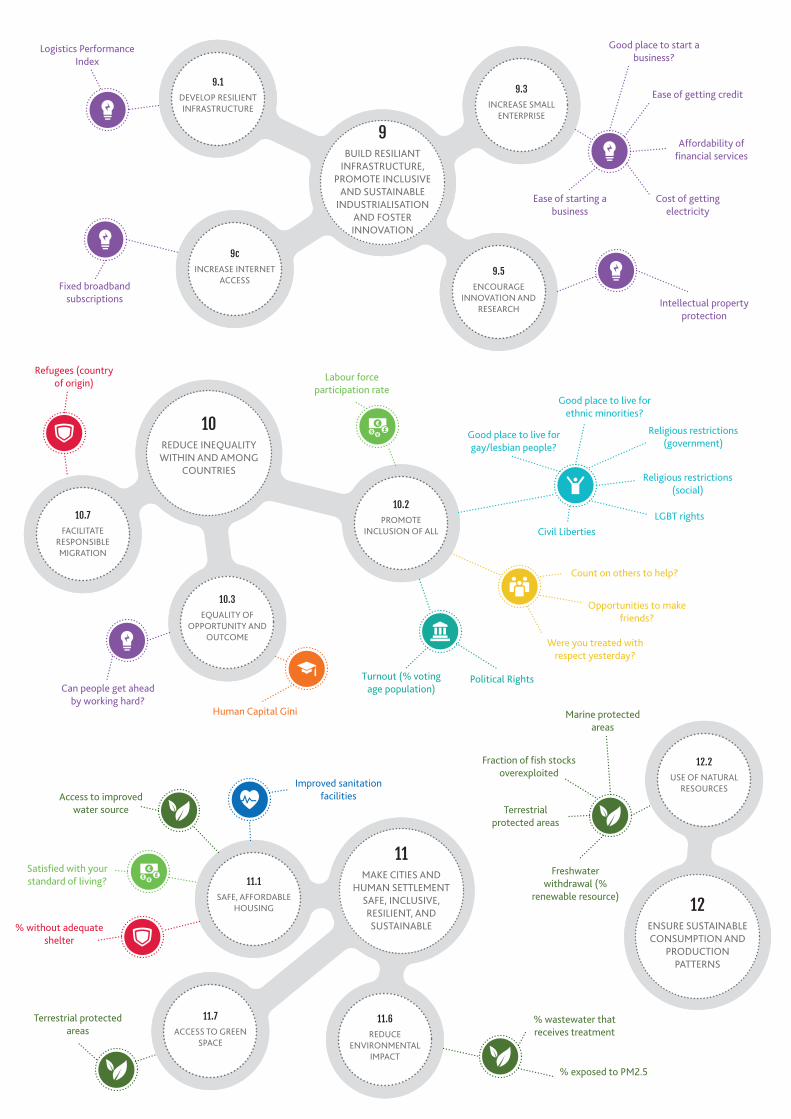
BUILD RESILIANT INFRASTRUCTURE,
PROMOTE INCLUSIVE AND SUSTAINABLE
INDUSTRIALISATION AND FOSTER INNOVATION
9
DEVELOP RESILIENT INFRASTRUCTURE
9.1
INCREASE INTERNET ACCESS
9c
ENCOURAGE INNOVATION AND
RESEARCH
9.5
INCREASE SMALL ENTERPRISE
9.3
Ease of starting a business
Affordability of financial services
Ease of getting credit
Logistics Performance Index
Cost of getting electricity
Good place to start a business?
Intellectual property protection
Fixed broadband subscriptions
REDUCE INEQUALITY WITHIN AND AMONG
COUNTRIES
10
FACILITATE RESPONSIBLE MIGRATION
10.7
EQUALITY OF OPPORTUNITY AND
OUTCOME
10.3
ENSURE SUSTAINABLE CONSUMPTION AND
PRODUCTION PATTERNS
12
ACCESS TO GREEN SPACE
11.7
REDUCE ENVIRONMENTAL
IMPACT
11.6
PROMOTE INCLUSION OF ALL
10.2
MAKE CITIES AND HUMAN SETTLEMENT
SAFE, INCLUSIVE, RESILIENT, AND SUSTAINABLE
11
USE OF NATURAL RESOURCES
12.2
SAFE, AFFORDABLE HOUSING
11.1
Refugees (country of origin)
Human Capital Gini
Can people get ahead by working hard?
Satisfied with your standard of living?
% without adequate shelter
Access to improved water source
Improved sanitation facilities
% wastewater that receives treatment
% exposed to PM2.5
Terrestrial protected areas
Marine protected areas
Terrestrial protected areas
Fraction of fish stocks overexploited
Freshwater withdrawal (%
renewable resource)
Good place to live for gay/lesbian people?
Good place to live for ethnic minorities?
Religious restrictions (government)
Religious restrictions (social)
LGBT rightsCivil Liberties
Labour force participation rate
Opportunities to make friends?
Count on others to help?
Were you treated with respect yesterday?
Turnout (% voting age population)
Political Rights
CONSERVE AND SUSTAINABLY USE
MARINE RESOURCES
14
CONSERVE 10% MARINE AREAS
14.5
END OVERFISHING
14.4
PROTECT MARINE ECOSYSTEMS
14.2
REDUCE MARINE POLLUTION
14.1
PROTECT, RESTORE, AND PROMOTE
SUSTAINABLE USE OF TERRESTRIAL ECOSYSTEMS
15
CONSERVATION OF TERRESTRIAL AREAS
15.1
% wastewater that receives treatment
Marine protected areas
Marine protected areas
Regulation of dangerous pesticides
Fraction of fish stocks overexploited
Terrestrial protected areas
PROMOTE PEACEFUL AND INCLUSIVE
SOCIETIES, PROVIDE ACCESS TO JUSTICE
16
PARTICIPATORY AND REPRESENTATIVE
DECISION-MAKING
16.7
DEVELOP EFFECTIVE AND ACCOUNTABLE
INSTITUTIONS
16.6
REDUCE BRIBERY AND CORRUPTION
16.5
PROMOTE RULE OF LAW AND EQUAL
ACCESS TO JUSTICE
16.3
REDUCE VIOLENCE AND DEATH RATES
16.1
PROTECT FUNDAMENTAL FREEDOMS AND
OPEN INFORMATION
16.10
IMPLEMENTING GLOBAL
PARTNERSHIPS FOR SUSTAINABLE
DEVELOPMENT
17PROMOTE FREE MARKET ACCESS
17.12
Prevalence of trade barriers
Terror attack deaths
Battlefield deaths
Casualities in civil/ethnic war
Political terror scale
Intentional homicides
Do you feel safe walking alone at
night?
Corruption Perceptions Index
Political rights
Judicial independence
Civil Liberties
Rule of law
Corruption Perceptions Index
Corruption Perceptions Index
Transparency of government
policymaking
Government effectiveness
Turnout (% voting age population)
Confidence in the honesty of elections?
Confidence in national
government?
Level of democracy
Overall press freedom
Civil Liberties
Dealth penalty
Conscription
Political rightsRule of law
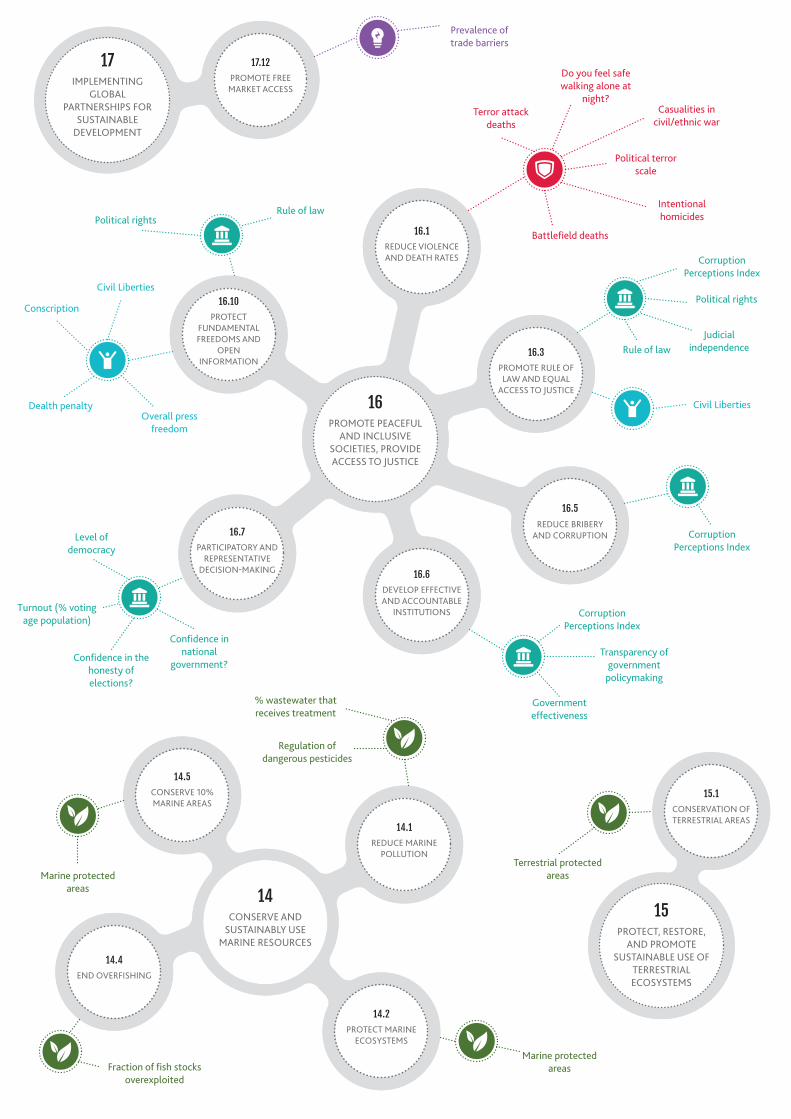
LEGATUM INSTITUTE | The 2016 Africa Prosperity ReportLEGATUM INSTITUTE | The 2016 Africa Prosperity Report
CALCULATING
37 |
| 38LEGATUM INSTITUTE | The 2016 Africa Prosperity Report | 38LEGATUM INSTITUTE | The 2016 Africa Prosperity Report
MethodologyThe 2016 Africa Prosperity Report uses the Legatum Prosperity
Index™ to offer an insight into how prosperity is forming and
changing across Africa. The Index is distinctive in that it is the
only global measurement of prosperity based on both income and
wellbeing.
Traditionally, a nation’s prosperity has been based solely on
macroeconomic indicators such as a country’s income, represented
either by GDP or by average income per person (GDP per capita).
However, most people would agree that prosperity is more than
just the accumulation of material wealth. It is also the joy of
everyday life and the prospect of being able to build an even better
life in the future.
In recent years, governments, academics, international
organisations, and businesses have increasingly moved their
attention towards indicators that measure wellbeing as a
complement to GDP.
Attempting to understand how we complement GDP, the so-called
‘GDP and beyond’ approach provides a stimulating challenge, one
we strive to meet with academic and analytical rigour in creating
the Legatum Prosperity Index™. Indeed, the Index recognises the
need for a country to promote high levels of per capita income,
but also advocates improvements in the subjective wellbeing of its
citizens.
This short methodological overview provides an understanding
of how the 2015 Legatum Prosperity Index™ is constructed by
combining established theoretical and empirical research on the
determinants of wealth and wellbeing.
Our econometric analysis has identified 89 variables, which are
spread across eight sub-indices. Through this process we are able
to identify and analyse the specific factors that contribute to the
prosperity of a country.
We endeavour to create an Index that is methodologically sound.
To that end, we also publish a full methodology document to
provide the reader with all the information required to understand
the Legatum Prosperity Index™ in a way that is transparent, useful,
and informative.
For more information on our methodology please refer to
the Methodology and Technical Appendix published on
www.prosperity.com.
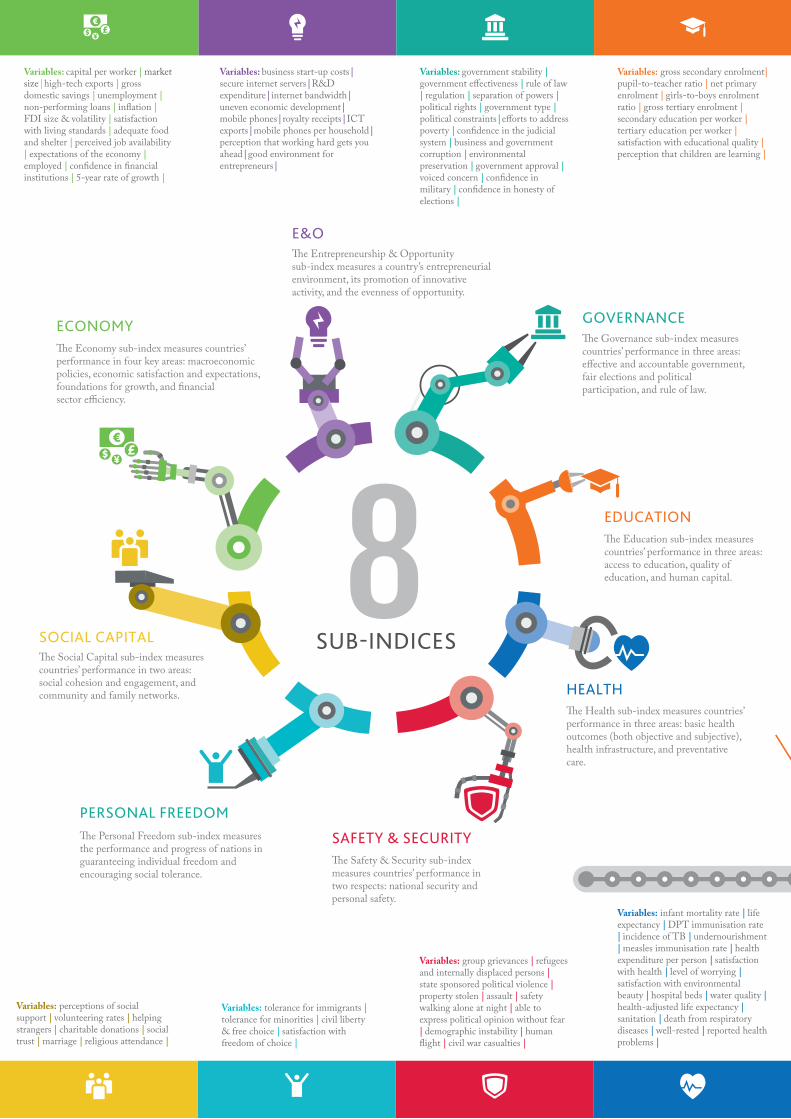
39 | LEGATUM INSTITUTE | The 2016 Africa Prosperity Report
SECTION HEADING AND CHAPTER TITLE GOES HERE
8
Variables: capital per worker | market size|high-tech exports | gross domestic savings | unemployment | non-performing loans | in�ation | FDI size & volatility | satisfaction with living standards | adequate food and shelter | perceived job availability | expectations of the economy | employed | con�dence in �nancial institutions | 5-year rate of growth |
Variables: business start-up costs| secure internet servers|R&D expenditure| internet bandwidth| uneven economic development| mobile phones|royalty receipts|ICT exports|mobile phones per household| perception that working hard gets you ahead|good environment for entrepreneurs|
Variables: government stability | government e�ectiveness | rule of law | regulation | separation of powers | political rights | government type | political constraints|e�orts to address poverty | con�dence in the judicial system | business and government corruption | environmental preservation | government approval | voiced concern | con�dence in military | con�dence in honesty of elections |
Variables: gross secondary enrolment| pupil-to-teacher ratio | net primary enrolment | girls-to-boys enrolment ratio | gross tertiary enrolment | secondary education per worker | tertiary education per worker | satisfaction with educational quality | perception that children are learning |
Variables: infant mortality rate | life expectancy | DPT immunisation rate | incidence of TB | undernourishment | measles immunisation rate | health expenditure per person | satisfaction with health | level of worrying | satisfaction with environmental beauty | hospital beds | water quality | health-adjusted life expectancy | sanitation | death from respiratory diseases | well-rested | reported health problems |
Variables: group grievances | refugees and internally displaced persons | state sponsored political violence | property stolen | assault | safety walking alone at night | able to express political opinion without fear | demographic instability | human �ight | civil war casualties |
Variables: tolerance for immigrants | tolerance for minorities | civil liberty & free choice | satisfaction with freedom of choice |
Variables: perceptions of social support | volunteering rates | helping strangers | charitable donations | social trust | marriage | religious attendance |
SUB-INDICES
�e Economy sub-index measures countries’ performance in four key areas: macroeconomic policies, economic satisfaction and expectations, foundations for growth, and �nancial sector e�ciency.
ECONOMY
�e Entrepreneurship & Opportunity sub-index measures a country’s entrepreneurial environment, its promotion of innovative activity, and the evenness of opportunity.
E&O
�e Health sub-index measures countries’ performance in three areas: basic health outcomes (both objective and subjective), health infrastructure, and preventative care.
HEALTH
�e Personal Freedom sub-index measures the performance and progress of nations in guaranteeing individual freedom and encouraging social tolerance.
PERSONAL FREEDOM
�e Social Capital sub-index measures countries’ performance in two areas: social cohesion and engagement, and community and family networks.
SOCIAL CAPITAL
�e Safety & Security sub-index measures countries’ performance in two respects: national security and personal safety.
SAFETY & SECURITY
�e Governance sub-index measures countries’ performance in three areas: e�ective and accountable government, fair elections and political participation, and rule of law.
GOVERNANCE
�e Education sub-index measures countries’ performance in three areas: access to education, quality of education, and human capital.
EDUCATION
50%
�e variables use many di�erent units of measurement. For example, citizens’ con�dence in �nancial institutions is measured in percentage terms, while capital per worker in US dollars.
All variables are standardised by subtracting the mean and
dividing by the standard deviation.
Starting with the current academic literature on economic growth and wellbeing, we identi�ed a large number of variables (200+) that have a proven impact upon wealth and wellbeing. �e �nal variables were selected according to their global coverage and by using regression analysis to determine those that have a statistically signi�cant relationship with wealth and wellbeing. �e resulting 89 variables are divided into the eight sub-indices.
STANDARDISATION2
Regression analysis was used to determine the weight of each variable. A variable’s weight (or ‘coe�cient’) represents its relative importance to the outcome (either income or wellbeing). In other words, statistically speaking, some
things matter more to prosperity than
others.
VARIABLE WEIGHTS3For each country, the latest data available were gathered. �e raw values are standardised and multiplied by the weights. �e weighted variable values are then summed to produce a country’s wellbeing and income score in each sub-index. �e income and wellbeing scores are then standardised so that they can be compared.
INCOME ANDWELLBEING SCORES4
�e standardised income and wellbeing scores are added together to create the countries’ sub-index scores. Countries are ranked according to their scores in each of the eight sub-indices.
SUB-INDEX SCORES
5
5 66
5Finally, the Prosperity Index score is determined by assigning equal weights to all eight sub-indices. �e average of the eight sub-indices yields a country’s overall Prosperity score. �e overall Prosperity Index rankings are based on this score.
PROSPERITY INDEX SCORE65
SELECTINGTHE VARIABLES
1
$78% $
$58%
$
$
$$$ 44%
21 %
Step-by-step guide to the methodology
60%COMPLETE
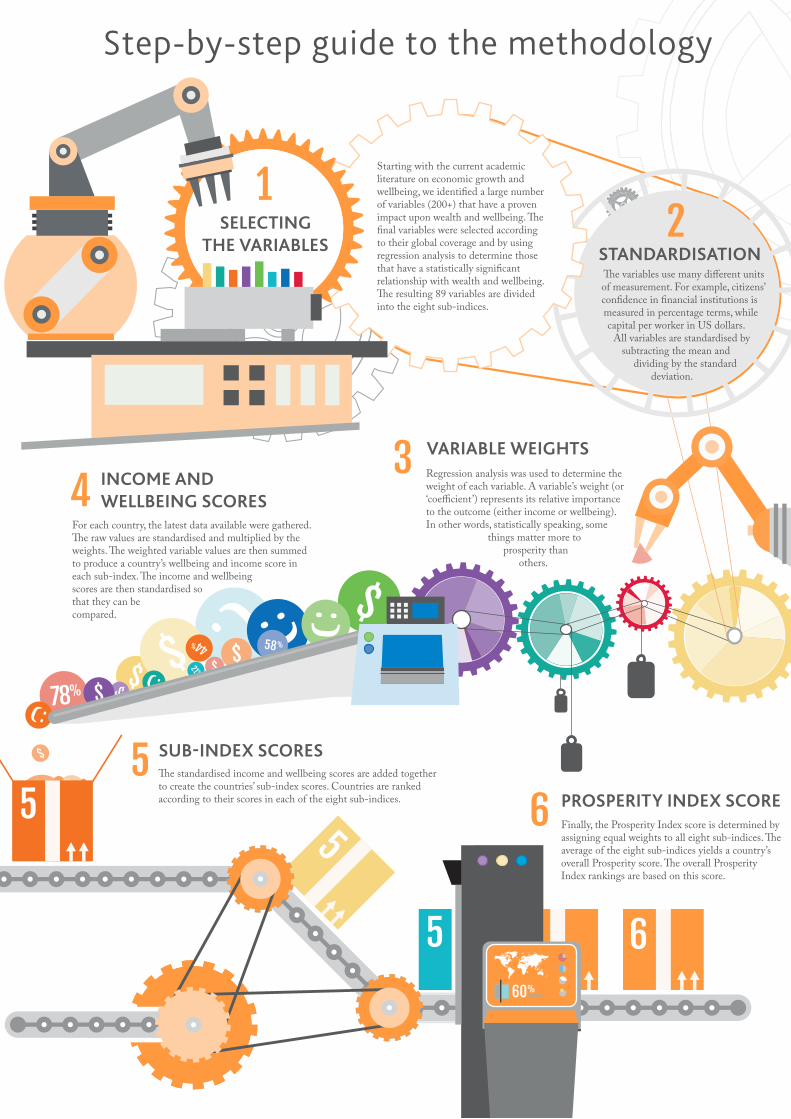
| 40LEGATUM INSTITUTE | The 2016 Africa Prosperity Report
SECTION HEADING AND CHAPTER TITLE GOES HERE
8
Variables: capital per worker | market size|high-tech exports | gross domestic savings | unemployment | non-performing loans | in�ation | FDI size & volatility | satisfaction with living standards | adequate food and shelter | perceived job availability | expectations of the economy | employed | con�dence in �nancial institutions | 5-year rate of growth |
Variables: business start-up costs| secure internet servers|R&D expenditure| internet bandwidth| uneven economic development| mobile phones|royalty receipts|ICT exports|mobile phones per household| perception that working hard gets you ahead|good environment for entrepreneurs|
Variables: government stability | government e�ectiveness | rule of law | regulation | separation of powers | political rights | government type | political constraints|e�orts to address poverty | con�dence in the judicial system | business and government corruption | environmental preservation | government approval | voiced concern | con�dence in military | con�dence in honesty of elections |
Variables: gross secondary enrolment| pupil-to-teacher ratio | net primary enrolment | girls-to-boys enrolment ratio | gross tertiary enrolment | secondary education per worker | tertiary education per worker | satisfaction with educational quality | perception that children are learning |
Variables: infant mortality rate | life expectancy | DPT immunisation rate | incidence of TB | undernourishment | measles immunisation rate | health expenditure per person | satisfaction with health | level of worrying | satisfaction with environmental beauty | hospital beds | water quality | health-adjusted life expectancy | sanitation | death from respiratory diseases | well-rested | reported health problems |
Variables: group grievances | refugees and internally displaced persons | state sponsored political violence | property stolen | assault | safety walking alone at night | able to express political opinion without fear | demographic instability | human �ight | civil war casualties |
Variables: tolerance for immigrants | tolerance for minorities | civil liberty & free choice | satisfaction with freedom of choice |
Variables: perceptions of social support | volunteering rates | helping strangers | charitable donations | social trust | marriage | religious attendance |
SUB-INDICES
�e Economy sub-index measures countries’ performance in four key areas: macroeconomic policies, economic satisfaction and expectations, foundations for growth, and �nancial sector e�ciency.
ECONOMY
�e Entrepreneurship & Opportunity sub-index measures a country’s entrepreneurial environment, its promotion of innovative activity, and the evenness of opportunity.
E&O
�e Health sub-index measures countries’ performance in three areas: basic health outcomes (both objective and subjective), health infrastructure, and preventative care.
HEALTH
�e Personal Freedom sub-index measures the performance and progress of nations in guaranteeing individual freedom and encouraging social tolerance.
PERSONAL FREEDOM
�e Social Capital sub-index measures countries’ performance in two areas: social cohesion and engagement, and community and family networks.
SOCIAL CAPITAL
�e Safety & Security sub-index measures countries’ performance in two respects: national security and personal safety.
SAFETY & SECURITY
�e Governance sub-index measures countries’ performance in three areas: e�ective and accountable government, fair elections and political participation, and rule of law.
GOVERNANCE
�e Education sub-index measures countries’ performance in three areas: access to education, quality of education, and human capital.
EDUCATION
50%
�e variables use many di�erent units of measurement. For example, citizens’ con�dence in �nancial institutions is measured in percentage terms, while capital per worker in US dollars.
All variables are standardised by subtracting the mean and
dividing by the standard deviation.
Starting with the current academic literature on economic growth and wellbeing, we identi�ed a large number of variables (200+) that have a proven impact upon wealth and wellbeing. �e �nal variables were selected according to their global coverage and by using regression analysis to determine those that have a statistically signi�cant relationship with wealth and wellbeing. �e resulting 89 variables are divided into the eight sub-indices.
STANDARDISATION2
Regression analysis was used to determine the weight of each variable. A variable’s weight (or ‘coe�cient’) represents its relative importance to the outcome (either income or wellbeing). In other words, statistically speaking, some
things matter more to prosperity than
others.
VARIABLE WEIGHTS3For each country, the latest data available were gathered. �e raw values are standardised and multiplied by the weights. �e weighted variable values are then summed to produce a country’s wellbeing and income score in each sub-index. �e income and wellbeing scores are then standardised so that they can be compared.
INCOME ANDWELLBEING SCORES4
�e standardised income and wellbeing scores are added together to create the countries’ sub-index scores. Countries are ranked according to their scores in each of the eight sub-indices.
SUB-INDEX SCORES
5
5 66
5Finally, the Prosperity Index score is determined by assigning equal weights to all eight sub-indices. �e average of the eight sub-indices yields a country’s overall Prosperity score. �e overall Prosperity Index rankings are based on this score.
PROSPERITY INDEX SCORE65
SELECTINGTHE VARIABLES
1
$78% $
$58%
$
$
$$$ 44%
21 %
Step-by-step guide to the methodology
60%COMPLETE
41 | LEGATUM INSTITUTE | The 2016 Africa Prosperity Report
The Legatum Institute Prosperity Index Team:
Director of Indices: Alexandra Mousavizadeh
External Authors:Lord Paul Boateng, Trustee, Planet Earth Institute & Chair, African Enterprise Challenge Fund
Paul Kunert, Managing Director, Havergate Infrastructure Partners
Professor David A. Rice, Development Dividend Project, New York University
Dr. Álvaro Sobrinho, Chairman, Planet Earth Institute
The Legatum Institute also wishes to thank Gallup, Inc. for permission to use the Gallup World Poll Service© and Gallup World Poll Data in construction of the Legatum Prosperity Index™. Copyright Gallup, Inc. 2016. Reprinted with permission of Gallup, Inc. All Rights Reserved.
Unless otherwise stated, all data is from the 2015 Legatum Prosperity Index™. All original data sources can be found in the Prosperity Index methodology report and online at www.prosperity.com
We encourage you to share the contents of this report. In doing so, we request that all data, findings, and analysis be attributed to the 2016 Africa Prosperity Report.
#AfricaProsperity | #ProsperityIndex | @ProsperityIndex | @LegatumInst
Acknowledgements
The Legatum Institute would like to thank the Legatum Foundation for their sponsorship and for making this report possible.
Learn more about the Legatum Foundation at www.legatum.org
Paul Caruana Galizia
Augustine Chipungu
Harriet Maltby
Abigail Watson
Fei Xue
Design, Visualisation, & Infographics by wond.co.uk

| 42LEGATUM INSTITUTE | The 2016 Africa Prosperity Report
SECTION HEADING AND CHAPTER TITLE GOES HERE
LEGATUM INSTITUTE 11 Charles Street Mayfair London W1J 5DW United Kingdom
t: +44 (0) 20 7148 5400
www.li.comwww.prosperity.com
JUNE 2016
9 781911 125082
ISBN 978-1-911125-08-2
The Legatum Institute is a charitable public policy think tank whose mission is to help people lead more prosperous lives.
#AfricaProsperity @ProsperityIndex @LegatumInst
HELPING PEOPLE LEAD MORE PROSPEROUS LIVES
Whilst GDP growth is important, the success of nations should not just be measured purely in terms of GDP – what makes a nation prosperous goes beyond this. Legatum’s Prosperity Index – which looks at both wealth and wellbeing – is therefore a welcome addition to the discussion on how best to assess and deliver.”TSITSI MASIYIWA, EXECUTIVE CHAIRPERSON, HIGHER LIFE FOUNDATION
“
Success should not just be measured by wealth alone. It should be measured by the impact you are making. Legatum’s Prosperity Index is a useful tool that helps us understand this impact - what works and what doesn’t”ASHISH J. THAKKAR, FOUNDER, MARA GROUP
“