the african development bank financial management
TRANSCRIPT

7170
African Development Bank Chapter 005
Annual Report 2007 7170
This chapter discusses the management of the financial resources of the Bank Group’s windows—the African Development Bank (ADB), the African Development Fund (ADF), and the Nigeria Trust Fund (NTF)—during the year. It also presents the Audited Financial Statements for 2007 for the three windows, as well as the ADB and ADF Administrative Budgets for the financial year 2008.
tHE AfRICAN dEVELOPMENt bANK
financial Management
Capital SubscriptionThe authorized capital stock of the Bank stood at UA 21.87 billion as of December 31, 2007, and has been allocated to regional and non-regional members in such proportion so that, when fully subscribed, the regional group holds 60 percent of the total capital stock and the non-regional group 40 percent. At December 31, 2007, members’ subscrip-tions reached UA 21.69 billion, that is 99.18 percent of the capital stock.
The capital stock is composed of paid-up and callable capital. The paid-up capital is the amount of capital payable over a period determined by the Board of Governors’ resolution for the relevant General Capital Increase (10 years for the fourth General Capital Increase and 8 years for the fifth General Capital Increase). The paid-in capital, which represents the portion of paid-up capi-tal that has been actually paid, reached UA 2.34 billion. As of December 31, 2007, the Bank’s callable capital was UA 19.34 billion of which UA 6.66 billion was from countries rated double-A and higher. The callable capital is subject to payment as and when required by the Bank to meet its incurred obligations, (a) by making or participating in direct loans out of funds borrowed or otherwise acquired by the Bank for inclusion in its ordinary capital resources or in special resources; or (b) by guaranteeing in whole or in part, loans made by other entities. It is a protection of the Bank’s creditors and
holders of Bank’s guarantees in the event that it is not able to meet its financial obli-gations. There has never been a call on the callable capital of the Bank.
In accordance with the Shares Transfer Rules, shares for which payment have become due and remain outstanding are forfeited after a prescribed period and offered for subscription to member countries. A member country’s payment of the first GCI-V installment trig-gers the subscription to the entire callable capital portion of shares allocated to it, however, shares representing the paid-up portion of subscriptions are issued only as and when the Bank receives actual payments for such shares.
The position of capital subscriptions at December 31, 2007 is shown in the Statement of Subscriptions to the Capital Stock and Voting Power, which forms part of the Financial Statements in this Report.
Bank RatingThe rating agencies Standard & Poor’s, Moody’s, Fitch Ratings, and the Japan Credit Rating Agency reaffirmed their AAA and AA+ rating of the African Development Bank’s senior and subordinated debt respectively, with a stable outlook. Their rating reflects the Bank’s strong membership support, its preferred creditor status, sound capital adequacy and prudent financial management and policies.
Borrowings The Bank strives to raise funds from the capital markets at the lowest possible cost to support its lending activities. The top-
notch credit ratings enjoyed by the Bank enable it to issue securities at low interest rates. Its borrowing activities are guided by client and cashflow requirements, assets and liability management goals, and risk management policies.
As at December 31, 2007, the borrowing portfolio of the Bank stood at UA 6.20 billion. The Bank is well within its debt policy limits. The key debt ratios are as follows:
• Total debt/total callable capital (max 80 percent): 32.05 percent
• Senior debt/non-borrowing members’ callable capital (max 80 percent): 65.04 percent
In December 2006, the ADB Board of Directors approved for the year 2007, a bor-rowing program of up to UA 1,015 million including a UA 140 million component for the Enhanced Private Sector Assistance for Africa Initiative (EPSA). In 2007, the Bank raised UA 724 million from the capital mar-kets at a weighted average cost of 6-month US Dollar LIBOR minus 32 basis points. In addition, the Bank raised UA 55 million under the EPSA initiative.
The highlight of the year was the Bank’s first transaction in the domestic bond market of any African country with the raising of ZAR 1.2 billion for a five-year maturity in the domestic bond market of South Africa. The transaction is also the first by any supranational in that market and is listed on the Bond Exchange of South Africa. The listing enables the Bank to offer its bond issues to the domestic South African investors. This is based on the specific
Chapter 005 African Development Bank
05_Chapter5_UK.indd 71 11/04/08 13:39:32

Chapter 005 African Development Bank
Annual Report 2007 7372 7372
documentation framework that has now been created by the Bank which is in line with local financial regulations in South Africa.
During 2007, the Bank also raised funds through transactions in the public market, the private placement market, the Uridashi market and through African currency-linked bonds.
The Bank maintained its presence in the public market through a highly successful five-year maturity inaugural transaction for an amount of Canadian Dollar 400 million in the Canadian domestic bond market in July 2007.
The Bank continues to focus its efforts on the possibility of issuance in African currencies. Following the successes of the earlier years, the Bank concluded offshore transactions linked to Nigerian Naira, Kenyan Shilling, Tanzanian Shilling and Ghanaian Cedi in 2007 in addition to the domestic South African Rand transaction. InvestmentsThe Bank’s cash and treasury investments (net of repurchase agreements) as of December 31, 2007 totaled UA 5.40 billion, compared to UA 5.34 billion at the end of 2006. Investment income for 2007 amounted to UA 238.40 million, or a return of 4.59 percent on an average liquidity of UA 5.20 billion, compared to UA 213.82 million in 2006, or a return of 4.22 percent, on an average liquidity of UA 5.06 billion.
Effective January 1, 2001, the ADB’s liquid assets were tranched into 3 portfolios, namely operational portfolio, prudential portfolio, and equity-backed portfolio, each with a different benchmark that reflects the cashflow and risk profile of its assets and funding sources. These benchmarks are one-month LIBID for the operational portfolio, and 6-month marked-to-market LIBOR, resetting on February 1 and August 1 for the prudential portfolio. The equity-backed
portfolio is managed against a re-pricing profile benchmark with 10 percent of the Bank’s net assets re-pricing uniformly over a period of 10 years.
Loan PortfolioLoans signed, net of cancellations, as at December 31, 2007 amounted to UA 18.83 billion. Total outstanding loans, as at December 31, 2007, was UA 5.54 billion, UA 249 million higher than the UA 5.29 billion outstanding as at the end of 2006. This increase was in spite of prepayments during the year amounting to UA 199.06 million. Undisbursed balances at December 31, 2007 totaled UA 1.62 billion, a decrease of UA 408.93 million from December 31, 2006. The number of active signed loans stood at 276 for a total amount of UA 5.54 billion. Also, at December 31, 2007, 547 loans amounting to UA 8.27 billion had been fully repaid. A breakdown of the loan portfolio by product type is presented below.
DisbursementsDisbursements on Bank loans increased from UA 548.44 million in 2006 to UA 884.75 million, representing an increase of 61.3 percent. At December 31, 2007, cumulative disbursements (including non-sovereign
loans) amounted to UA 16.87 billion. Fully disbursed loans at December 31, 2007 were 747 for a total amount of UA 15.78 billion, representing 93.40 percent of cumulative disbursements.
Financial ProductsLoans. The Bank offers 3 loan products: variable, floating, and fixed interest rate loans with a selection of loan currencies, currently, US Dollars, Euro, Japanese Yen, and South Africa Rand. To suit the long-term financing needs of borrowers, loans have a maximum maturity of 20 years, including a grace period on the repayment of the principal amount, generally not exceeding 5 years. For the single currency variable interest rate loan, the base rate is determined twice a year, on January 1 and July 1, and is based on the Bank’s average cost of a designated pool of borrowings funding the loans in the specific currency. The base rate for the floating interest rate loan is derived from the 6-month market reference rate in the specific currency, for example, LIBOR, EURIBOR or JIBAR. The base rate is reset on February 1 and August 1 each year and applies to the 6-month period following the reset date. For the fixed interest rate loan, the lending rate in
Loans Outstanding, december 31, 2007(percentages)
Undisbursed balances, december 31, 2007(percentages)
Multi-CurrencyFixed Rate
5.94%Single CurrencyVariable Rate
9.34%Multi-CurrencyVariable Rate
6.66%
Single CurrencyFloating Rate
31.85%
Single CurrencyFixed Rate46.21%
Multi-CurrencyFixed Rate
0.11%Single CurrencyVariable Rate
0.75%Multi-CurrencyVariable Rate
0.00%
Single CurrencyFloating Rate
35.25%
Single CurrencyFixed Rate63.89%
05_Chapter5_UK.indd 72 11/04/08 13:39:32

7372
African Development Bank Chapter 005
Annual Report 2007 7372
each currency is the fixed amortizing swap rate derived from the 6-month market reference rates. Borrowers may select from a number of rate-fixing alternatives, includ-ing fixing at each disbursement or after all disbursements have been completed. Prior to rate fixing, the currency-specific floating interest rate applies. The pricing formula applicable to all 3 loan products is the same. The applicable rate of interest is the sum of the chosen base rate plus a lending spread. Loans to sovereign and sovereign-guaranteed borrowers enjoy a lending spread of 40 basis points above the 6-month market reference rate. For non-sovereign guaranteed borrowers in both the private and public sector, the lending spread is computed based on the Bank’s risk-based pricing framework.
Agency Lines. Loans to private sector enterprises can be extended directly or through a private financial institution (PFI). In an agency line (AL), the credit risk of the borrower is borne by the Bank. In addition, the PFI acts as an agent for the Bank, to carry out a variety of activities, including, but not limited to, identifying projects within certain parameters; appraising such projects on behalf of the Bank; when approved, undertaking all of the administrative steps related to disbursement (billing, collection of Bank’s funds, filing of security); supervis-ing projects, monitoring the performance of the borrower, submitting reports thereon; and transmitting amounts related to the repayment of the loan to the Bank.
Guarantees. Through the guarantee product, the Bank seeks to leverage its preferred creditor status to assist eligible borrowers to obtain financing from third party lenders, including capital markets. Guarantees will also enable borrowers to obtain financing in their own local currency where the Bank is not able to provide such financing directly from its own resources.
Risk Management Products are offered to enable borrowers to manage the market risks associated with their loans from the Bank, including interest rate, cur-rency, and commodity price risks. These products assist borrowers to manage their balance sheets and their changing needs more efficiently over time. Risk manage-ment products such as interest rate swaps, currency swaps, interest rate caps and col-lars are available to borrowers at any time during the life of the loan.
Equity Participation or Quasi Equity Products. The Bank’s ability to provide risk capital through equity invest-ments is a key element of its resource mobi-lization role. Even though the Bank cannot be a majority shareholder in a company, it can participate in a project by acquir-ing ordinary stocks, redeemable preferred stocks, or debentures.
Other Financial Services. In addition to the products described above, the Bank may offer loan syndication and under-writing services through its private sector window.
Risk Management Policies and Processes
As a development finance institution, the African Development Bank seeks to reduce its exposure to risks that are not essential to its core business of providing development finance and related assistance. To this end, the Bank has adapted its risk management policies, guidelines and processes to reduce exposure to interest rate, currency, liquidity, counterparty, legal and other operational risks, while maximizing its capacity to assume credit risks to public and private sector clients, within approved risk limits.
Note D of the Financial Statements provides the details regarding the Risk Management policies and processes applied by the Bank to manage these risks.
financial Results
Since 2006, the Bank has accounted for distributions to organizations, funds or institutions for purposes complementary with the Bank’s mission as grant expenses in the period such distributions are approved by the Board of Governors. Prior to 2006, such distributions were presented as direct reductions of equity. Due to current expense treatment of distributions approved by the Board of Governors, “Income before transfer of income approved by the Board of Governors” is separately disclosed on the income statement, to highlight income from normal or ordinary operations of the Bank.
The highlights of the Bank’s financial perform-ance in 2007 include the following:
• Income before transfers approved by the Board of Governors increased by 66.81 percent from UA 194.03 million in 2006 to UA 323.67 million in 2007. The increase is mainly attributable to the following factors: a) net write-back of provision for impairment on loans and related charges receivable of UA 69.96 million in 2007 compared to a net charge for provision of UA 51.69 million in 2006, b) an increase of UA 21.24 million in 2007 in the unrealized gains on derivatives and borrowings for which fair value option was elected, and c) a reduction of UA 27.52 million in the amount of impairment for equity investments and other receivables.
• Loan income increased by UA 12.92 million, or 3.93 percent, in 2007. The increase in loan income was mainly due to a higher average loan balance during 2007. Investment income also increased in 2007 by UA 24.57 million, or 11.49 percent, as a result of higher average investment balances and higher yields, but the increase was more than offset by a UA 50.18 million increase in borrowing-related charges. In 2007,
05_Chapter5_UK.indd 73 11/04/08 13:39:33

Chapter 005 African Development Bank
Annual Report 2007 PB74
the Bank earned income of UA 4.97 million on investments in debt instru-ments issued by entities in its regional member countries.
• As a result of the arrears clearance mechanism approved by the Board of Directors during 2007, the number of sovereign borrowers in arrears for six months or more decreased from 6 at December 31, 2006 to 4 at December 31, 2007. Consequently, there was a write-back of impairment for losses on loans and related charges receivable in 2007 compared to a charge for impair-ment in 2006. At December 31, 2007 total accumulated provision for losses on principal and charges was UA 364.72 million, which was 6.10 percent of gross principal and charges receivable at that date, compared to UA 436.77 million, or 7.60 percent of gross principal and charges receivable at December 31, 2006.
• Total Bank Group administrative expenses increased from UA 154.34 million in 2006 to UA 180.65 million in 2007. The Bank’s share of the Bank Group administrative expenses amounted to UA 42.22 million for 2007, compared to UA 36.86 million for 2006. Bank Group administrative expenses are allocated between the Bank, the ADF and the NTF based on a predetermined cost-sharing formula driven primarily by the relative levels of certain operational volume indicators.
• For the past several years, the Bank has earned levels of net income sufficient to enable not only the further strengthening of the Bank’s reserves position, but also contributions on behalf of its sharehold-ers to other development initiatives for Africa. Total reserves plus accumulated loss provisions on outstanding loan principal and charges at December 31, 2007 were UA 2.90 billion, up from UA 2.74 billion at December 31, 2006. As a
percentage of gross loans, reserves plus loss provisions on loan principal increased from 47.7 percent at December 31, 2006 to 49.24 percent at December 31, 2007. Against the background of the strong risk-bearing capacity of the Bank, the Board of Governors in 2007 approved transfers of UA 119.90 million to various development initiatives in Africa. These transfers included UA 65.07 million to the special fund for post-conflict assistance to the Democratic Republic of Congo, UA 13.70 million to the ADF, UA 21.64 million to the Heavily Indebted Poor Countries (HIPC) initiative, UA 10 million to the Middle Income Countries Technical Assistance Fund, and UA 9.49 million to the Investment Climate Facility for Africa.
05_Chapter5_UK.indd 74 11/04/08 13:39:33

African Development Bank
Financial Statements and Report of the Independent Auditors
Years ended December 31, 2007 and 2006
Page
Balance Sheet 76
Income Statement 78
Statement of Recognized Income and Expense 79
Statement of Cash Flows 80
Notes to the Financial Statements 81
Report of the Independent Auditors 144
06_ADB_part a_UK.indd 75 11/04/08 13:40:41

Chapter 005 African Development Bank
Annual Report 200776
BALANCE SHEET AS AT DECEMBER 31, 2007 AND 2006(UA thousands - Note B)
ASSETS 2007 2006
CASH 95,528 129,329
DEMANDOBLIGATIONS 3,801 3,801
TREASURYINVESTMENTS(NoteF) 5,303,540 6,093,361
DERIVATIVEASSETS(NoteG) 425,338 273,310
NON-NEGOTIABLEINSTRUMENTS
ONACCOUNTOFCAPITAL(NoteH) 15,385 20,383
ACCOUNTSRECEIVABLE
Accruedincomeandchargesreceivableonloans(NoteI) 267,149 232,935
Otheraccountsreceivable 328,726 368,037
595,875 600,972
DEVELOPMENTFINANCINGACTIVITIES
Loans,net(NotesD&I) 5,344,073 5,076,771
Equityparticipations(NoteJ) 189,248 119,119
Otherdebtsecurities(NoteK) 94,622 -
5,627,943 5,195,890
OTHERASSETS
Property,equipmentandintangibleassets(NoteL) 14,362 14,241
Miscellaneous 667 713
15,029 14,954
TOTAL ASSETS 12,082,439 12,332,000
Theaccompanyingnotestothefinancialstatementsformpartofthisstatement.
06_ADB_part a_UK.indd 76 11/04/08 13:40:41

African Development Bank Chapter 005
Annual Report 2007 77
LIABILITIES & EQUITY 2007 2006
ACCOUNTSPAYABLE Accruedfinancialcharges 418,706 328,751 Otheraccountspayable 165,633 320,209
584,339 648,960
SECURITIESSOLDUNDERAGREEMENTSTOREPURCHASEANDPAYABLEFORCASHCOLLATERALRECEIVED(NoteF) - 877,833
DERIVATIVELIABILITIES(NoteG) 591,047 481,937
BORROWINGS(NoteM) Borrowingsatfairvalue 5,226,279 4,823,648 Borrowingsatamortizedcost 972,594 1,046,821
6,198,873 5,870,469EQUITY(NoteN) Capital Subscriptionspaid 2,336,457 2,303,062 CumulativeExchangeAdjustmentonSubscriptions(CEAS) (160,075) (155,742) Subscriptionspaid(netofCEAS) 2,176,382 2,147,320
Reserves Retainedearnings 2,498,288 2,305,345 Fairvaluegainsonavailable-for-saleinvestments 33,510 136 Totalreserves 2,531,798 2,305,481Totalequity 4,708,180 4,452,801
TOTAL LIABILITIES & EQUITY 12,082,439 12,332,000
06_ADB_part a_UK.indd 77 11/04/08 13:40:42

INCOME STATEMENT FOR THE YEARS ENDED DECEMBER 31, 2007 AND 2006(UA thousands - Note B)
2007 2006
OPERATIONALINCOME&EXPENSES Incomefrom: Loans(NoteO) 341,945 329,027 Investmentsandrelatedderivatives(NoteO) 238,397 213,824 Otherdebtsecurities 4,966 - Totalincomefromloansandinvestments 585,308 542,851
Borrowingexpenses(NoteP) Interestandamortizedissuancecosts (268,023) (245,413) Netinterestonborrowing-relatedderivatives (62,706) (35,137) Unrealizedgainonfair-valuedborrowingsandrelatedderivatives 21,239 10,672 Unrealizedgainonderivativesonnonfair-valuedborrowingsandothers 34,774 21,067
Provisionforimpairment(NoteI) Loanprincipal 17,453 (22,566) Loancharges 52,503 (29,120)Provisionforimpairmentonequityinvestmentsandotherreceivables (7,222) (34,745)Translation(losses)/gains (8,895) 4,101Otherincome 7,323 23,736Netoperationalincome 371,754 235,446
OTHEREXPENSES Administrativeexpenses(NoteQ) (42,218) (36,859) Depreciation-Property,equipmentandintangibleassets(NoteL) (5,375) (6,233) Sundry(expenses)/gains (493) 1,678Totalotherexpenses (48,086) (41,414)
IncomebeforetransfersapprovedbytheBoardofGovernors 323,668 194,032
TransfersofincomeapprovedbytheBoardofGovernors(NoteN) (119,902) (139,200)
NET INCOME 203,766 54,832
Theaccompanyingnotestothefinancialstatementsformpartofthisstatement.
Chapter 005 African Development Bank
Annual Report 200778
06_ADB_part a_UK.indd 78 11/04/08 13:40:42

STATEMENT OF RECOGNIZED INCOME AND EXPENSEFOR THE YEARS ENDED DECEMBER 31, 2007 AND 2006(UA thousands - Note B)
2007 2006
Gain/(loss)onavailable-for-saleinvestmentstakentoequity 33,374 (8,574)
Actuariallossesondefinedbenefitplans (10,823) (7,165)
Netincome/(loss)recognizeddirectlyinequity 22,551 (15,739)
Netincomefortheyear 203,766 54,832
TOTAL RECOGNIZED INCOME FOR THE YEAR 226,317 39,093
Theaccompanyingnotestothefinancialstatementsformpartofthisstatement.
African Development Bank Chapter 005
Annual Report 2007 79
06_ADB_part a_UK.indd 79 11/04/08 13:40:42

Chapter 005 African Development Bank
Annual Report 200780
STATEMENT OF CASH FLOWS FOR THE YEARS ENDED DECEMBER 31, 2007 AND 2006(UA thousands - Note B)
2007 2006
CASH FLOwS FROM:
OPERATING ACTIvITIES:Netincome 203,766 54,832Adjustmentstoreconcilenetincometonetcashprovidedbyoperatingactivities: Depreciation 5,375 6,233 Provisionforimpairmentonloanprincipalandcharges (69,956) 51,686 Unrealizedgainsoninvestmentsandrelatedderivatives (5,997) (2,638) Amortizationofdiscountorpremiumonheld-to-maturityinvestments (5,645) 2,814 Provisionforimpairmentonequityinvestmentsandreceivables 7,222 34,745 Amortizationofborrowingissuancecosts 3,333 2,936 Unrealizedgainonfairvalueborrowingsandderivatives (56,013) (48,799) Translationlosses/(gains) 8,895 (4,101) Shareofprofitsinassociate (479) (379)Netmovementsinderivatives (51,659) 130,972Changesinaccruedincomeonloans 15,640 (4,877)Changesinaccruedfinancialcharges 90,409 79,132Changesinotherreceivablesandpayables (123,330) 19,412Netcashprovidedbyoperatingactivities 21,561 321,968
INvESTING, LENDING AND DEvELOPMENT ACTIvITIES:Disbursementsonloans (884,747) (548,440)Repaymentsofloans 704,045 706,408Investmentsmaturingafter3monthsofacquisition: Held-to-maturityportfolio (79,764) (410,735) Tradingportfolio 359,145 (85,443)Otherdebtsecurities (92,801) -Changesinotherassets (5,451) (4,209)Equityparticipationsmovement (40,150) 2,919Netcashusedininvesting,lendinganddevelopmentactivities (39,723) (339,500)
FINANCING ACTIvITIES:Newissuesonborrowings 779,649 730,741Repaymentsonborrowings (402,541) (621,486)Netcashfromcapitalsubscriptions 33,363 40,302Netcashprovidedbyfinancingactivities 410,471 149,557Effectofexchangeratechangesoncashandcashequivalents (12,363) (18,150)Increaseincashandcashequivalents 379,946 113,875Cashandcashequivalentsatthebeginningoftheyear 705,890 592,015Cash and cash equivalents at the end of the year 1,085,836 705,890
COMPOSED OF:Investmentsmaturingwithin3monthsofacquisition: Held-to-maturityportfolio 24,114 80,075 Tradingportfolio 966,194 1,374,319Securitiessoldunderagreementstorepurchaseandpayableforcashcollateralreceived - (877,833)Cash 95,528 129,329Cash and cash equivalents at the end of the year 1,085,836 705,890
SUPPLEMENTARY DISCLOSURE:Movementresultingfromexchangeratefluctuations: Loans (70,008) 32,776 Borrowings (77,088) (251,558) Currencyswaps 89,729 163,523
Theaccompanyingnotestothefinancialstatementsformpartofthisstatement.
06_ADB_part a_UK.indd 80 11/04/08 13:40:43

African Development Bank Chapter 005
Annual Report 2007 81
NOTES TO THE FINANCIAL STATEMENTSYEARS ENDED DECEMBER 31, 2007 AND 2006
NOTE A – OPERATIONS AND AFFILIATED ORGANIZATIONS
TheAfricanDevelopmentBank(ADBortheBank)isamultilateraldevelopmentfinanceinstitutiondedicatedtotheeconomicandsocialprogressofitsregionalmemberstates.TheBankfinancesdevelopmentprojectsandprogramsinitsregionalmemberstates,typicallyincooperationwithothernationalor internationaldevelopment institutions. In furtheranceof thisobjective, theBankparticipates intheselection,studyandpreparationofprojectscontributingtosuchdevelopmentand,wherenecessary,providestechnicalassistance.TheBankalsopromotesinvestmentsofpublicandprivatecapitalinprojectsandprogramsdesignedtocontributetotheeconomicandsocialprogressoftheregionalmemberstates.TheactivitiesoftheBankarecomplementedbythoseoftheAfricanDevelopmentFund(ADFortheFund),whichwasestablishedbytheBankandcertaincountries;andtheNigeriaTrustFund(NTF),whichisaspecialfundadministeredbytheBank.Notably,theADB,ADF,andNTFeachhaveseparateanddistinctassetsandliabilities.ThereisnorecoursetotheADBforobligationsinrespectofanyoftheADForNTFliabilities.TheADFwasestablishedtoassisttheBankincontributingtotheeconomicandsocialdevelopmentoftheBank’sregionalmembers,topromotecooperationandincreasedinternationaltradeparticularlyamongtheBank’smembers,andtoprovidefinancingonconcessionaltermsforsuchpurposes.
NOTE B – SUMMARY OF SIGNIFICANT ACCOUNTING POLICIES
TheBank’sfinancialstatementsarepreparedinaccordancewithInternationalFinancialReportingStandards(IFRS)promulgatedbytheInternationalAccountingStandardsBoard.Thefinancialstatementshavebeenpreparedunderthehistoricalcostconventionexceptforcertainfinancialassetsandfinancialliabilitiesthatarecarriedatfairvalue.
ThesignificantaccountingpoliciesemployedbytheBankaresummarizedbelow.
Revenue RecognitionInterestincomeisaccruedandrecognizedbasedontheeffectiveinterestrateforthetimesuchinstrumentisoutstandingandheldbytheBank.Theeffectiveinterestrateistheratethatdiscountstheestimatedfuturecashflowsthroughtheexpectedlifeofthefinancialassettotheasset’snetcarryingamount.
Incomefrominvestmentsincludesrealizedandunrealizedgainsandlossesontradingfinancialinstruments.
DividendsrelatingtoinvestmentsinequityarerecognizedwhentheBank’srighttoreceivepaymentisestablished.
Functional and Presentation CurrenciesTheBankconductsitsoperationsinthecurrenciesofitsmembercountries.AsaresultoftheapplicationofIAS21revised,“TheEffectsofChangesinForeignExchangeRates”,theBankprospectivelychangeditsfunctionalcurrencyfromthecurrenciesofallitsmembercoun-triestotheUnitofAccount(UA)effectiveJanuary1,2005.TheUAisalsothecurrencyinwhichthefinancialstatementsarepresented.ThevalueoftheUnitofAccountisdefinedinArticle5.1(b)oftheAgreementEstablishingtheBank(theAgreement)asequivalenttooneSpecialDrawingRight(SDR)oftheInternationalMonetaryFund(IMF)oranyunitadoptedforthesamepurposebytheIMF.
Currency TranslationIncomeandexpensesare translated toUAat the ratesprevailingon thedateof the transaction.Monetaryassetsand liabilitiesaretranslatedintoUAatratesprevailingatthebalancesheetdate.TheratesusedfortranslatingcurrenciesintoUAatDecember31,2007and2006arereportedinNoteV-1.Non-monetaryassetsandliabilitiesaretranslatedintoUAathistoricalrates.Translationdifferencesareincludedinthedeterminationofnetincome.CapitalsubscriptionsarerecordedinUAattheratesprevailingatthetimeofreceipt.ThetranslationdifferencerelatingtopaymentsofcapitalsubscriptionsisreportedinthefinancialstatementsastheCumulativeExchangeAdjustmentonSubscriptions (CEAS).This is composedof thedifferencebetween theUAamountat thepredetermined rateand theUAamountusingtherateatthetimeofreceipt.Whencurrenciesareconvertedintoothercurrencies,theresultinggainsorlossesareincludedinthedeterminationofnetincome.
06_ADB_part a_UK.indd 81 11/04/08 13:40:44

Chapter 005 African Development Bank
Annual Report 200782
Member Countries’ SubscriptionsAlthoughtheAgreementestablishingtheADBallowsforamembercountrytowithdrawfromtheBank,nomemberhaseverwithdrawnitsmembershipvoluntarily,norhasanyindicatedtotheBankthatitintendstodoso.ThestabilityinthemembershipreflectsthefactthatthemembersareindependentAfricanandnon-Africancountries,andthatthepurposeoftheBankistocontributetothesustain-ableeconomicdevelopmentandsocialprogressofitsregionalmembercountriesindividuallyandjointly.Accordingly,asofDecember31,2007,theBankdidnotexpecttodistributeanyportionofitsnetassetsduetomembercountrywithdrawals.
Intheunlikelyeventofawithdrawalbyamember,theBankshallarrangefortherepurchaseoftheformermember’sshares.Therepur-chasepriceofthesharesisthevalueshownbythebooksoftheBankonthedatethecountryceasestobeamember,hereafterreferredtoas“theterminationdate.”TheBankmaypartiallyorfullyoffsetamountsdueforsharespurchasedagainstthemember’sliabilitiesonloansandguaranteesduetotheBank.Theformermemberwouldremainliablefordirectobligationsandcontingent liabilitiestotheBankforsolongasanypartsoftheloansorguaranteescontractedbeforetheterminationdateareoutstanding.Ifatadatesub-sequenttotheterminationdate,itbecomesevidentthatlossesmaynothavebeensufficientlytakenintoaccountwhentherepurchasepricewasdetermined,theformermembermayberequiredtopay,ondemand,theamountbywhichtherepurchasepriceoftheshareswouldhavebeenreducedhadthelossesbeentakenintoaccountwhentherepurchasepricewasdetermined.Inaddition,theformermemberremainsliableonanycall,subsequenttotheterminationdate,forunpaidsubscriptions,totheextentthatitwouldhavebeenrequiredtorespondiftheimpairmentofcapitalhadoccurredandthecallhadbeenmadeatthetimetherepurchasepriceofitsshareswasdetermined.
Wereamembertowithdraw,theBankmaysetthedatesinrespectofpaymentsforsharesrepurchased.If,forexample,payingaformermemberwouldhaveadverseconsequencesfortheBank’sfinancialposition,theBankcoulddeferpaymentuntiltheriskhadpassed,andindefinitelyifappropriate.Furthermore,sharesthatbecomeunsubscribedforanyreasonmaybeofferedbytheBankforpurchasebyeligiblemembercountries,basedonthesharetransferrulesapprovedbytheBoardofGovernors.Inanyevent,nopaymentsshallbemadeuntilsixmonthsaftertheterminationdate.
IftheBankweretoterminateitsoperations,allliabilitiesoftheBankwouldfirstbesettledoutoftheassetsoftheBankandthen,ifnecessary,outofmembers’callablecapital,beforeanydistributioncouldbemadetoanymembercountry.SuchdistributionissubjecttothepriordecisionoftheBoardofGovernorsoftheBankandwouldbebasedonthepro-ratashareofeachmembercountry.
Employee Benefits
1) Pension ObligationsThe Bank operates a contributory defined benefit pension plan for its employees.The Staff Retirement Plan (SRP) provides benefitpaymentstoparticipantsuponretirement.Adefinedbenefitplanisapensionplanthatdefinesanamountofpensionbenefitthatanemployeewill receiveon retirement,usuallydependentononeormore factors suchasage, yearsof serviceandcompensation.AnactuarialvaluationofthecostofprovidingbenefitsfortheSRPisdeterminedusingtheProjectedUnitCreditMethod.Uponreachingretirementage,pensioniscalculatedbasedontheaverageremunerationforthefinalthreeyearsofpensionableserviceandthepensionissubjecttoannualinflationaryadjustments.Actuarialgainsandlossesarerecognizedimmediatelyinretainedearningsintheyeartheyoccur.Pastservicecostisrecognizedimmediatelytotheextentthatbenefitsarealreadyvested,otherwise,amortizedonastraight-linebasisovertheaverageperioduntilthebenefitsbecomevested.Thepensionliabilityisrecognizedaspartofotheraccountspayableinthebalancesheet.TheliabilityrepresentsthepresentvalueoftheBank’sdefinedbenefitobligations,netofthefairvalueofplanassetsandunrecognizedactuarialgainsandlosses.
2) Post-Employment Medical BenefitsTheBankoperatesacontributorydefinedMedicalBenefitPlan(MBP),whichprovidespost-employmenthealthcarebenefitstoeligibleformerstaff,includingretirees.MembershipoftheMBPincludesbothstaffandretireesoftheBank.Theentitlementtothepost-retire-ment healthcare benefit is usually conditional on the employee remaining in service up to retirement age and the completion of aminimumserviceperiod.Theexpectedcostsof thesebenefitsderive fromcontributions fromplanmembersaswellas theBankandareaccruedovertheperiodofemploymentandduringretirement.ContributionsbytheBanktotheMBParechargedtoexpensesandincludedinthestatementofincomeandexpenses.TheMBPBoard,anindependentbodycreatedbytheBank,determinestheadequacyofthecontributionsandisauthorizedtorecommendchangestothecontributionratesofboththeBankandplanmembers.
06_ADB_part a_UK.indd 82 11/04/08 13:40:44

African Development Bank Chapter 005
Annual Report 2007 83
Financial InstrumentsFinancialassetsandfinancialliabilitiesarerecognizedontheBank’sbalancesheetwhentheBankassumesrelatedcontractualrightsorobligations.
1) Financial AssetsTheBankclassifiesitsfinancialassetsinthefollowingcategories:financialassetsatfairvaluethroughprofitorloss;loansandreceiva-bles;held-to-maturityinvestments;andavailable-for-salefinancialassets.Managementdeterminestheclassificationofitsinvestmentsatinitialrecognition.
i) FinancialAssetsatFairValuethroughProfitorLossAlltradingassetsarecarriedatfairvaluethroughtheincomestatementandgainsandlossesarereportedintheincomestatementintheperiodinwhichtheyarise.Theinvestmentsinthetradingportfolioareacquiredprincipallyforthepurposeofsellingintheshortterm.Derivativesarealsocategorizedasheld-for-trading.
ii) LoansandReceivablesTheBankhasclassifieddemandobligations,accruedincomeandreceivablesfromloansandinvestmentsandothersundryamountsasreceivables.Loansandreceivablesarenon-derivativefinancialassetswithfixedordeterminablepaymentsthatarenotquotedinanactivemarket.TheyarisewhentheBankprovidesmoney,goodsorservicesdirectlytoadebtorwithnointentionoftradingthereceivable.Loansandreceivablesarecarriedatamortizedcostusingtheeffectiveinterestmethod.
iii) Held-to-MaturityInvestmentsTheBankhasclassifieditsinvestmentsincertaindebtsecuritiesasheld-to-maturity.Held-to-maturityinvestmentsarenon-derivativefinancialassetswithfixedordeterminablepaymentsandfixedmaturitiesthattheBank’smanagementhasthepositiveintentionandabilitytoholdtomaturity.Held-to-maturityinvestmentsaresubsequentlymeasuredatamortizedcost.Held-to-maturityinvestmentsarecarriedatamortizedcostusingtheeffectiveinterestmethod.
iv) Available-for-SaleFinancialAssetsTheBankhasclassifiedequityinvestmentsoverwhichitdoesnothavecontrolorsignificantinfluenceasavailable-for-sale.Available-for-saleinvestmentsarethoseintendedtobeheldforanindefiniteperiodoftime,andmayormaynotbesoldinthefuture.Gainsand losses arising from changes in the fair valueof available-for-sale financial assets are recognizeddirectly in equity, until thefinancialassetisderecognizedorimpairedatwhichtimethecumulativegainorlosspreviouslyrecognizedinequityisrecognizedinprofitorloss.
Purchasesandsalesoffinancialassetsatfairvaluethroughprofitorloss,held-to-maturityandavailable-for-saleinvestmentsarerec-ognizedonatrade-datebasis,whichisthedateonwhichtheBankcommitstopurchaseorselltheasset.Loansarerecognizedwhencashisadvancedtotheborrowers.Financialassetsnotcarriedatfairvaluethroughprofitorlossareinitiallyrecognizedatfairvalueplustransactioncosts.FinancialassetsarederecognizedwhentherightstoreceivecashflowsfromthefinancialassetshaveexpiredorwheretheBankhastransferredsubstantiallyallrisksandrewardsofownership.
Securitiespurchasedunderresaleagreementsandsecuritiessoldunderrepurchaseagreementsarereportedatmarketrates.TheBankreceivessecuritiespurchasedunderresaleagreements,monitorsthefairvalueofthesecuritiesandifnecessarymayrequireadditionalcollateral.
Cashandcashequivalentscomprisecashonhand,demanddepositsandothershort-term,highly liquid investments thatarereadilyconvertibletoaknownamountofcash,aresubjecttoinsignificantriskofchangesinvalueandhaveatimetomaturityuponacquisitionofthreemonthsorless.
06_ADB_part a_UK.indd 83 11/04/08 13:40:45
Chapter 005 African Development Bank
Annual Report 200784
2) Financial Liabilitiesi) Borrowings
Intheordinarycourseofitsbusiness,theBankborrowsfundsinthemajorcapitalmarketsforlendingandliquiditypurposes.TheBankissuesdebtinstrumentsdenominatedinvariouscurrencies,withdifferingmaturitiesatfixedorvariableinterestrates.TheBank’sborrowing strategy is drivenby threemajor factors, namely: timeliness inmeeting cash flow requirements, optimizingasset andliabilitymanagementwiththeobjectiveofmitigatingexposuretofinancialrisks,andprovidingcost-effectivefunding.Inadditiontolongandmedium-termborrowings,theBankalsoundertakesshort-termborrowingforcashandliquiditymanagementpurposesonly.Borrowingsnotdesignatedatfairvaluethroughprofitorlossarecarriedonthebalancesheetatamortizedcostwithinterestexpensedeterminedusingtheeffectiveinterestmethod.Borrowingexpensesarerecognizedinprofitorlossandincludetheamortizationofissuancecosts,discountsandpremiums,whichisdeterminedusingtheeffectiveinterestmethod.CertainoftheBank’sborrowingshavebeenobtainedfromthegovernmentsofsomemembercountriesoftheBankandareinterest/free.InaccordancewithIAS20–”AccountingforGovernmentGrantsandDisclosureofGovernmentAssistance”,thebenefitofborrowingatsubsidizedratesfrommembercountries’governmentshasnotbeenrecognizedthroughtheimputationofinterestexpenseinthefinancialstatements.
ii) FinancialLiabilitiesatFairValuethroughProfitorLossThiscategoryhastwosub-categories:financialliabilitiesheldfortrading,andthosedesignatedatfairvaluethroughprofitorlossatinception.Derivativesarecategorizedasheld-for-trading.TheBankprimarilyappliesfairvaluedesignationtoborrowingswhichhavebeenswappedintofloating-ratedebtusingderivativecontracts.Inthesecases,thedesignationoftheborrowingatfairvaluethroughprofitorlossismadeinordertosignificantlyreduceanaccountingmismatchwhichwouldotherwisehaveariseniftheborrowingswerecarriedonthebalancesheetatamortizedcostwhiletherelatedswapsarecarriedonthebalancesheetatfairvalue.
iii) OtherLiabilitiesAllfinancialliabilitiesthatarenotderivativesordesignatedatfairvaluethroughprofitorlossarerecordedatamortizedcost.Theamountsincludeaccruedfinancechargesonborrowingsandotheraccountspayable.
Financialliabilitiesarederecognizedwhentheyaredischargedorcancelledorwhentheyexpire.
DerivativesThe Bank uses derivative instruments in its portfolios for asset/liability management, cost reduction, risk management and hedgingpurposes.Theseinstrumentsincludecross-currencyswapsandinterestrateswaps.ThederivativesonborrowingsareusedtomodifytheinterestrateorcurrencycharacteristicsorbothofthedebttheBankissues.Thiseconomicrelationshipisestablishedonthedatethedebtisissued,andmaintainedthroughoutthetermsofthecontracts.Theinterestcomponentofthesederivativesisreportedaspartofborrowingexpenses.
AlthoughIAS39allowshedgeaccountingforcertainqualifyinghedgingrelationships,theBankhaselectednottoapplyhedgeaccount-ingtoanyqualifyinghedgingrelationship,butratherclassifiesallderivativesasheld-for-tradingatfairvalue,withallchangesinfairvaluerecognizedintheincomestatement.Whenthecriteriafortheapplicationofthefairvalueoptionaremet,thentherelateddebtisalsocarriedatfairvaluewithchangesinfairvaluerecognizedintheincomestatement.
Derivatives embedded in other financial instruments or other non-financial host contracts are treated as separate derivatives whentheirrisksandcharacteristicsarenotcloselyrelatedtothoseofthehostcontractandthehostcontractisnotcarriedatfairvaluewithunrealizedgainsorlossesreportedinprofitorloss.Suchderivativesarestrippedfromthehostcontractandmeasuredatfairvaluewithunrealizedgainsandlossesreportedinprofitorloss.
Impairment of Financial Assets
1) Assets Carried at Amortized CostTheBankfirstassesseswhetherobjectiveevidenceofimpairmentexistsindividuallyforfinancialassets.IftheBankdeterminesthatnoobjectiveevidenceofimpairmentexistsforanindividuallyassessedfinancialasset,thatassetisincludedinagroupoffinancialassetswithsimilarcreditcharacteristicsandcollectivelyassessedforimpairment.Assetsthatareindividuallyassessedforimpairmentandfor
06_ADB_part a_UK.indd 84 11/04/08 13:40:45

African Development Bank Chapter 005
Annual Report 2007 85
whichanimpairmentlossisorcontinuestoberecognizedarenotincludedinacollectiveassessmentofimpairment.Afinancialassetoragroupoffinancialassetsisimpairedandimpairmentlossesareincurredif,andonlyif,thereisobjectiveevidenceofimpairmentasaresultofoneormoreeventsthatoccurredaftertheinitialrecognitionoftheasset(a‘lossevent’)andthatlossevent(orevents)hasanimpactontheestimatedfuturecashflowsofthefinancialassetorgroupoffinancialassetsthatcanbereliablyestimated.
IftheBankdeterminesthatthereisobjectiveevidencethatanimpairmentlossonloansandreceivablesorheld-to-maturityinvestmentscarriedatamortizedcosthasbeenincurred,theamountofthelossismeasuredasthedifferencebetweentheasset’scarryingamountand thepresent valueof estimated future cash flows (excluding future credit losses thathavenotbeen incurred)discountedat thefinancialasset’soriginaleffectiveinterestrate.Forsovereign-guaranteedloans,theestimatedimpairmentarisesfromdelaysthatmaybeexperiencedinreceivingamountsdue.Fornon-sovereign-guaranteedloans,theimpairmentreflectsmanagement’sbestestimateofthenon-collectibility,inwholeorinpart,ofamountsdueaswellasdelaysinthereceiptofsuchamounts.
Thecarryingamountoftheassetisreducedthroughtheuseofanallowanceaccountandtheamountofthelossisrecognizedintheincomestatement.Ifaloanorheld-to-maturityinvestmenthasavariableinterestrate,thediscountrateformeasuringanyimpairmentlossisthecurrenteffectiveinterestratedeterminedunderthecontract.
Interestandchargesareaccruedonallloansincludingthoseinarrears.
2) Available-for-Sale AssetsTheBankassessesateachbalancesheetdatewhetherthereisobjectiveevidencethatafinancialassetoragroupoffinancialassetsisimpaired.Foravailable-for-saleequityinstrumentscarriedatfairvalue,asignificantorprolongeddeclineinthefairvalueofthesecuritybelowitscostisconsideredindeterminingwhethertheassetsareimpaired.Ifanysuchevidenceexistsforavailable-for-saleequityinstru-mentscarriedatfairvalue,thecumulativeloss,whichismeasuredasthedifferencebetweentheacquisitioncostandthecurrentfairvalue,netofanyimpairmentlosspreviouslyrecognizedinprofitorloss,isreclassifiedfromequitytotheincomestatement.Impairmentlossesrecognizedintheincomestatementonavailable-for-saleequityinstrumentscarriedatfairvaluearereversedthroughequity.
Ifthereisobjectiveevidencethatanimpairmentlosshasbeenincurredonanavailable-for-saleequityinstrumentthatiscarriedatcostbecauseitsfairvaluecannotbereliablymeasured,theamountofimpairmentlossismeasuredasthedifferencebetweenthecarryingamountoftheimpairedequityinstrumentandthepresentvalueoftheestimatedfuturecashflowsdiscountedatthecurrentmarketrateofreturnforasimilarequity instrument.Oncerecognized, impairmentlossesontheseequity instrumentscarriedatcostarenotreversed.
Offsetting Financial InstrumentsFinancialassetsandliabilitiesareoffsetandreportedonanetbasiswhenthereisalegallyenforceablerighttooffsettherecognizedamountsandthereisanintentiontosettleonanetbasis,orrealizetheassetandsettletheliabilitysimultaneously.
Fair value DisclosureThefairvaluesofquoted investments inactivemarketsarebasedoncurrentbidprices.For financialassetswith inactivemarketsorunlistedsecurities,theBankestablishesfairvaluebyusingvaluationtechniquesthatincorporatethemaximumuseofmarketdatainputs.Theseincludetheuseofrecentarm’slengthtransactions,discountedcashflowanalysis,optionpricingmodelsandothervaluationtech-niquescommonlyusedbymarketparticipants.Financial instrumentsforwhichmarketquotationsarenotreadilyavailablehavebeenvaluedusingmethodologiesandassumptionsthatnecessarilyrequiretheuseofsubjectivejudgments.Accordingly,theactualvalueatwhichsuchfinancialinstrumentscouldbeexchangedinacurrenttransactionorwhethertheyareactuallyexchangeableisnotreadilydeterminable.Managementbelievesthatthesemethodologiesandassumptionsarereasonable;however,thevaluesactuallyrealizedinasalemightbedifferentfromthefairvaluesdisclosed.
ThemethodsandassumptionsusedbytheBankinestimatingthefairvaluesoffinancialinstrumentsareasfollows:
06_ADB_part a_UK.indd 85 11/04/08 13:40:45

Chapter 005 African Development Bank
Annual Report 200786
Cash:Thecarryingamountisthefairvalue.Investments:Fairvaluesforinvestmentsecuritiesarebasedonquotedmarketprices,whereavailable.Ifquotedmarketpricesarenotavailable,fairvaluesarebasedonquotedmarketpricesofcomparableinstruments.
Borrowings:ThefairvaluesoftheBank’sborrowingsarebasedonmarketquotationswhenpossibleorvaluationtechniquesbasedondiscountedcashflowmodelsusingLIBORmarket-determineddiscountcurvesadjustedbytheBank’screditspread.CreditspreadsareobtainedfrommarketdataaswellasindicativequotationsreceivedfromcertaincounterpartiesfortheBank’snewpublicbondissues.TheBankalsousessystemsbasedonindustrystandardpricingmodelsandvaluationtechniquestovalueborrowingsandtheirassociatedderivatives.Themodelsusemarket-sourcedinputssuchasinterestrates,yieldcurves,exchangeratesandoptionvolatilities.Valuationmodelsaresubjecttointernalandperiodicexternalreviews.
EquityInvestments:TheunderlyingassetsofentitiesinwhichtheBankhasequityinvestmentscarriedatfairvalueareperiodicallyfair valuedbothby fundmanagersand independentvaluationexpertsusingmarketpractices.The fair valueof investments in listedenterprisesisbasedonthelatestavailablequotedbidprices.Thefairvalueofinvestmentsinunlistedentitiesisassessedusingappropri-atemethods,forexample,discountedcashflows.ThefairvalueoftheBank’sequityparticipationsisestimatedastheBank’spercentageownershipofthenetassetvalueofthefunds.
DerivativeFinancialInstruments:Thefairvaluesofderivativefinancialinstrumentsarebasedonmarketquotationswhenpossibleorvaluationtechniquesthatusemarketestimatesofcashflowsanddiscountrates.TheBankalsousesvaluationtoolsbasedonindustrystandardpricingmodelsandvaluationtechniquestovaluederivativefinancialinstruments.Themodelsusemarket-sourcedinputssuchasinterestrates,yieldcurves,exchangeratesandoptionvolatilities.AllfinancialmodelsusedforvaluingtheBank’sfinancialinstrumentsaresubjecttobothinternalandperiodicexternalreviews.
Loans:TheBankdoesnotsellitsloans,nordoesitbelievethereisacomparablemarketforitsloans.Thefairvalueofloansreportedinthesefinancialstatementsrepresentsmanagement’sbestestimatesofthepresentvalueoftheexpectedcashflowsoftheseloans.Formulti-currencyandsinglecurrencyfixedrateloans,fairvaluesareestimatedusingadiscountedcashflowmodelbasedontheyear-endvariable lendingrate in thatcurrency,adjustedfor impairment.Forall loansnot impaired, fairvalueadjustmentsaremadetoreflectexpectedloanlosses.TheestimatedfairvalueofloansisdisclosedinNoteI.
Day One Profit and LossThebestevidenceofthefairvalueofafinancialinstrumentatinitialrecognitionisthetransactionprice(i.e.thefairvalueoftheconsiderationgivenorreceived).Againorlossmayonlyberecognizedoninitialrecognitionofafinancialinstrumentifthefairvalueofthatinstrumentisevidencedbycomparisonwithotherobservablecurrentmarkettransactionsinthesameinstrument(i.e.withoutmodificationorrepackaging)orbasedonavaluationtechniquewhosevariablesincludeonlydatafromobservablemarkets.Oninitialrecognition,againorlossmaynotberecognizedwhenusingavaluationtechniquethatdoesnotincorporatedatasolelyfromobservablemarkets.TheBankonlyrecognizesgainsorlossesafterinitialrecognitiontotheextentthattheyarisefromachangeinafactor(includingtime)thatmarketparticipantswouldconsiderinsettingaprice.Thegainorlossisamortizedoverthelifeoftheapplicableborrowingonastraight-linebasis.
Investment in AssociateUnderIAS28,“InvestmentsinAssociates”,theADFisconsideredanassociateoftheBank.AnassociateisanentityoverwhichtheBankhassignificantinfluence,butnotcontrol,overtheentity’sfinancialandoperatingpolicydecisions.TherelationshipbetweentheBankandtheADFisdescribedinmoredetailinNoteJ.IAS28requiresthattheequitymethodbeusedtoaccountforinvestmentsinassociates.Undertheequitymethod,aninvestmentinanassociateisinitiallyrecognizedatcostandthecarryingamountisincreasedordecreasedtorecognizetheinvestor’sshareoftheprofitorlossoftheinvesteeafterthedateofacquisition.Theinvestor’sshareoftheprofitorlossoftheinvesteeisrecognizedintheinvestor’sincomestatement.ThesubscriptionsbytheBanktothecapitaloftheADFoccurredbetween1974and1990.AtDecember31,2007,suchsubscriptionscumulativelyrepresentedapproximately1%oftheeconomicinterestinthecapitaloftheADF.AlthoughADFisanot-for-profitentityandhasneverdistributedanydividendtoitssubscriberssinceitscreationin1972,therevisionstoIAS28requirethattheequitymethodbeusedtoaccountfortheBank’sinvestmentintheADF.Furthermore,inaccordancewithIAS36,thenetinvestmentintheADFisassessedforimpairment.Cumulativelossesasmeasuredundertheequitymethodarelimitedtotheinvestment’soriginalcostastheADBhasnotguaranteedanypotentiallossesoftheADF.
06_ADB_part a_UK.indd 86 11/04/08 13:40:46

African Development Bank Chapter 005
Annual Report 2007 87
Property and EquipmentPropertyandequipmentismeasuredathistoricalcostlessdepreciation.Historicalcostincludesexpendituredirectlyattributabletotheacquisitionoftheitems.Subsequentcostsareincludedintheasset’scarryingamountorarerecognizedasaseparateasset,asappropri-ate,onlywhenitisprobablethatfutureeconomicbenefitsassociatedwiththeitemwillflowtotheBankandthecostoftheitemcanbemeasuredreliably.Repairsandmaintenancearechargedtotheincomestatementwhentheyareincurred.
Landisnotdepreciated.Depreciationonotherassetsiscalculatedusingthestraight-linemethodtoamortizethedifferencebetweencostandestimatedresidualvaluesoverestimatedusefullives.Theestimatedusefullivesareasfollows:
-Buildings:15-20years-Fixturesandfittings:6-10years-Furnitureandequipment:3-7years-Motorvehicles:5years
Theresidualvaluesandusefullivesofassetsarereviewedperiodicallyandadjustedifappropriate.Assetsthataresubjecttoamortizationarereviewedannuallyforimpairment.Anasset’scarryingamountiswrittendownimmediatelytoitsrecoverableamountiftheasset’scarryingamountisgreaterthanitsestimatedrecoverableamount.Therecoverableamountisthehigheroftheasset’sfairvaluelesscoststosellanditsvalueinuse.Gainsandlossesondisposalaredeterminedasthedifferencebetweenproceedsandtheasset’scarryingamountandareincludedintheincomestatementintheperiodofdisposal.
Intangible AssetsIntangibleassetsincludecomputersystemssoftwareandarestatedathistoricalcostlessamortization.Amortizationonintangibleassetsiscalculatedusingthestraight-linemethodover3-5years.
LeasesTheBankhasentered intoseveraloperating leaseagreements, including those for itsoffices inTunisiaand incertainother regionalmembercountries.Undersuchagreements,alltherisksandbenefitsofownershipareeffectivelyretainedbythelessor.Paymentsmadeunderoperatingleasesarechargedtotheincomestatementonastraight-linebasisovertheperiodofthelease.Benefitsreceivedandreceivableasan incentivetoenter intoanoperating leasearealsorecognizedonastraight-linebasisoverthe leaseterm.Whenanoperatingleaseisterminatedbeforetheleaseperiodhasexpired,anypaymentrequiredtobemadetothelessorbywayofpenaltyisrecognizedasanexpenseintheperiodinwhichtheterminationtakesplace.
Transfers Approved by the Board of GovernorsInaccordancewiththeAgreementestablishingtheBank,theBoardofGovernorsisthesoleauthorityforapprovingallocationsfromincometosurplusaccountordistributionstootherentitiesfordevelopmentpurposes.SurplusconsistsofearningsfromprioryearswhichareretainedbytheBankuntilfurtherdecisionismadeontheirdispositionortheconditionsoftransferforspecifieduseshavebeenmet.Distributionsfordevelopmentpurposes,referredtoas“BoardofGovernors’ApprovedTransfers”,arereportedasexpensesontheIncomeStatementintheyearofapproval.Transfersfordevelopmentpurposesmaybefundedfromamountspreviouslytransferredtosurplusaccountorfromthecurrentyear’sincome.
Retained EarningsRetainedearningsoftheBankconsistofamountsallocatedtoreservesfromprioryear’sincome,balanceofamountsallocatedtosurplusafterdeductingtransfersapprovedbytheBoardofGovernors,unallocatedcurrentyearnetincome,andexpensesrecognizeddirectlyinequityasrequiredbyIFRS.
Critical Accounting Judgments and Key Sources of Estimation UncertaintyInthepreparationoffinancialstatementsinconformitywithIFRS,managementmakescertainestimates,assumptionsandjudgmentsthataffect the reportedamountsofassets, liabilities, revenueandexpensesaswellas thedisclosureof contingent liabilities.Actualresultscoulddifferfromsuchestimates.Estimatesandjudgmentsarecontinuallyevaluatedandarebasedonhistoricalexperienceand
06_ADB_part a_UK.indd 87 11/04/08 13:40:46

Chapter 005 African Development Bank
Annual Report 200788
otherfactors,includingexpectationsoffutureeventsthatarebelievedtobereasonableunderthecircumstances.Themostsignificantjudgmentsandestimatesaresummarizedbelow:
1) Significant JudgmentsTheBank’saccountingpoliciesrequirethatassetsandliabilitiesbedesignatedatinceptionintodifferentaccountingcategories.Suchdecisionsrequiresignificantjudgmentandrelatetothefollowingcircumstances:
Held-for-Trading-Inclassifyingfinancialassetsorliabilitiesas“trading”,theBankhasdeterminedthatsuchassetsorliabilitiesmeetitsdescriptionandsetcriteriaforclassificationassuch.
FairValuethroughProfitandLoss-Indesignatingfinancialassetsorliabilitiesatfairvaluethroughprofitorloss,theBankhasdeter-minedthatsuchassetsorliabilitiesmeetthecriteriaforthisclassification.
Held-to-Maturity -TheBank follows theguidanceof IAS39onclassifyingnon-derivative financialassetswith fixedordeterminablepaymentsand fixedmaturityasheld-to-maturity. Inmaking this judgment, theBankevaluates its intentionandability tohold suchinvestmentstomaturity.
2) Significant estimatesTheBankalsousesestimatesforitsfinancialstatementsinthefollowingcircumstances:
ImpairmentLossesonLoansandAdvances-Ateachfinancialreportingdate,theBankreviewsitsloanportfoliosforimpairment.TheBankfirstassesseswhetherobjectiveevidenceofimpairmentexistsforindividualloans.Ifsuchobjectiveevidenceexists,impairmentisdeterminedbydiscountingexpectedfuturecashflowsusingtheloan’soriginaleffectiveinterestrateandcomparingthisamounttotheloan’snetcarryingamount.Determiningtheamountandtimingoffuturecashflowsonimpairedloansrequiressignificantjudgment.IftheBankdeterminesthatnoobjectiveevidenceofimpairmentexistsforanindividuallyassessedloan,thatloanisincludedinagroupof loanswith similar credit characteristicsandcollectivelyassessed for impairment.Objectiveevidenceof impairment foragroupofloansmayincludeobservabledataindicatingthattherehasbeenanadversechangeinthepaymentstatusofborrowersinagroup,ornationalorlocaleconomicconditionsthatcorrelatewithdefaultsonassetsinthegroup.Managementusesestimatesbasedonhistori-callossexperienceforassetswithcreditriskcharacteristicsandobjectiveevidenceofimpairmentsimilartothoseintheportfoliowhenschedulingitsfuturecashflows.Themethodologyandassumptionsusedforestimatingboththeamountandtimingoffuturecashflowsarereviewedregularlytoreduceanydifferencesbetweenlossestimatesandactuallossexperience.
FairValueofFinancialInstruments-Thefairvalueoffinancialinstrumentsthatarenotquotedinactivemarketsisdeterminedbyusingvaluationtechniques.Wherevaluationtechniques(forexample,models)areusedtodeterminefairvalues,theyarevalidatedandperi-odicallyreviewedbyqualifiedpersonnelindependentoftheareathatcreatedthem.Allvaluationmodelsarecalibratedtoensurethatoutputsreflectactualdataandcomparativemarketprices.Totheextentpractical,valuationmodelsuseonlyobservabledata;however,areassuchascreditrisk(bothownandcounterparty),volatilitiesandcorrelationsrequiremanagementtomakeestimates.Changesinassumptionsaboutthesefactorscouldaffectthereportedfairvalueoffinancialinstruments.
ImpairmentofAvailable-for-SaleEquityInvestments-TheBankdeterminesthatavailable-for-saleequityinvestmentsareimpairedwhentherehasbeenasignificantorprolongeddeclineinfairvaluebelowthecarryingamount.Thedeterminationofwhatissignificantorprolongedrequiresjudgment.Inmakingthisjudgment,theBankevaluatesanyevidenceofdeteriorationinthefinancialhealthoftheinvestee,industryandsectorperformance,changesintechnology,andoperationalandfinancingcashflows.
06_ADB_part a_UK.indd 88 11/04/08 13:40:47

African Development Bank Chapter 005
Annual Report 2007 89
NOTE C – THE EFFECT OF NEW AND REVISED INTERNATIONAL FINANCIAL REPORTING STANDARDS
In2007,theBankadoptedInternationalFinancialReportingStandard(IFRS)7,FinancialInstruments:Disclosuresandrelatedamend-mentstoInternationalAccountingStandard(IAS)1,PresentationofFinancialStatements–CapitalDisclosures.IFRS7supersedesIAS30,DisclosuresintheFinancialStatementsofBanksandSimilarFinancialInstitutionandIAS32,FinancialInstruments:Presentation,andintroducesnewandenhancedqualitativeandquantitativedisclosuresaboutexposurestorisksarisingfromfinancialinstrumentsandhowtheBankmanagesthoserisks.TheamendmentstoIAS1requirenewdisclosuresontheBank’sobjectives,policiesandprocessesformanagingcapital.ThenewdisclosuresarepresentedinNoteD.
Atthedateofauthorizationofthesefinancialstatements,certainnewandamendedInternationalFinancialReportingStandardsandInterpretationshavebeenissuedandwillbecomeeffectiveforperiodsafterDecember31,2007. IFRS8,OperatingSegments,whichbecomeseffectiveforfinancialstatementsfortheperiodbeginningJanuary1,2009,replacesthesegmentalreportingrequirementsofIAS14,SegmentReporting,andrequiresalignmentofthesegmentsinthefinancialstatementswiththoseusedinternallybymanage-ment in theallocationof resourcesandassessingperformance.Theamendments to IAS1 require theBank to present in separatestatements, changes in equity related to its shareholders and those related to comprehensive income (i.e., non-shareholder-relatedcomponents),includingrelatedreclassificationadjustmentsofthosecomponents.ItalsorequiresthepresentationofabalancesheetasatthebeginningoftheearliestcomparativeperiodinacompletesetoffinancialstatementswhentheBankappliesanaccountingpolicyretrospectivelyormakesa retrospective restatement.Noneof thesenewstandardsoramendments isexpectedtohaveasignificantimpactontheBank’sfinancialstatements.
OnFebruary14,2008,theInternationalAccountingStandardsBoard(IASB)issuedamendmentstoIAS32andIAS1.Theamendmentsrequireanentitytoclassifyaspartofitsequitythosefinancialinstrumentsthatitissuesthatareeither(a)puttablefinancialinstruments,or(b)financialinstrumentsorcomponentsoffinancialinstrumentsthatimposeanobligationtodelivertoanotherpartyapro-ratashareofitsnetassetsonlyonliquidation,ifcertaincriteriaaremet.Priortotheseamendments,suchfinancialinstrumentsweretobeclassifiedasliabilities.TheamendmentsareeffectiveforannualperiodsbeginningonorafterJanuary1,2009,withearlyadoptionpermitted.
SubscriptionsbythemembercountriestotheBank’scapitaldescribedinNoteBareputtablefinancialinstrumentsthatmeettherequire-mentsforequityclassificationundertheamendedstandards.Whilethestandardspriortotheamendmentsrequiredliabilityclassificationbytheissuerofputtablefinancialinstruments,theBankhasalwaysreportedthesubscriptionsbythemembercountriestoitscapitalasequity.UndertheAgreementestablishingtheBank,suchinstrumentsprovideanequalandresidualrighttoitsmembercountriesthataresubordinatetotherightsofitscreditors.TheequityclassificationrequirementsundertheamendedstandardsarefullyconsistentwithandconfirmtheBank’spriorclassificationoftheseinstrumentsasequity.TheamendmentstoIAS32andIAS1relatingtoputtablefinancialinstrumentswereissuedafterthebalancesheetdatebutbeforetheapprovalofthefinancialstatements.TheBankhasoptedtoearlyadopttheamendments.TheapplicationoftheseamendedstandardshadnoeffectsontheBank’sfinancialstatements.
NOTE D - RISK MANAGEMENT POLICIES AND PROCEDURES
Incarryingoutitsdevelopmentmandate,theBankseekstomaximizeitscapacitytoassumecorebusinessrisksresultingfromitslendingandinvestingoperationswhileatthesametimeminimizingitsnon-corebusinessrisks(marketrisk,counterpartyrisk,andoperationalrisk)thatareincidentalbutneverthelesscriticaltotheexecutionofitsmandate.
ThedegreeofrisktheBankiswillingtoassumetoachieveitsdevelopmentmandateislimitedbyitsrisk-bearingcapacity.Thisinstitu-tionalriskappetiteisembodiedintheBank’scapitaladequacypolicyanditscommitmenttomaintainaprudentriskprofileconsistentwiththehighestcreditrating.
The policies, processes and procedures by which the Bank manages its risk profile continually evolve in response to market, credit,product,andotherdevelopments.ThehighestlevelofriskmanagementoversightisassuredbytheBank’sBoardofExecutiveDirectors,
06_ADB_part a_UK.indd 89 11/04/08 13:40:47

Chapter 005 African Development Bank
Annual Report 200790
whichischairedbythePresident.Inadditiontoapprovingallriskmanagementpolicies,theExecutiveDirectorsregularlyreviewtrendsintheBank’sriskprofilesandperformancetoensurecompliancewiththeunderlyingpolicies.
Theguidingprinciplesbywhich theBankmanages itscoreandnon-core risksaregovernedby theGeneralAuthorityontheBank’sFinancialProductsandServices(theFPSAuthority)andtheGeneralAuthorityonAssetLiabilityManagement(theALMAuthority).
TheFPSAuthorityprovidestheframeworkunderwhichtheBankdevelopsandimplementsfinancialproductsandservicesforitsborrow-ers’andseparateguidelineswhichprescribetherulesgoverningthemanagementofcreditandoperationalriskfortheBank’ssovereignandnon-sovereignloanandequityinvestmentportfolios.
TheALMAuthorityistheoverarchingframeworkthroughwhichManagementhasbeenvestedwiththeauthoritytomanagetheBank’sfinancialassetsand liabilitieswithindefinedparameters.TheALMAuthority setsout theguidingprinciples formanaging theBank’sinterestraterisk,currencyexchangeraterisk,liquidityrisk,counterpartycreditriskandoperationalrisk.TheALMAuthoritycoverstheBank’sentirearrayofALMactivitiessuchasdebt-fundingoperationsandinvestmentofliquidresources.ItalsoincludestheinterestrateandcurrencyriskmanagementaspectsoftheBank’slendingandequityinvestmentoperations.
UndertheumbrellaoftheFPSAuthorityandtheALMAuthority,thePresidentisauthorizedtoapproveandamendmoredetailedopera-tionalguidelinesasnecessary,upontherecommendationsoftheAssetandLiabilityManagementCommittee(ALCO).ALCOistheotheroversightandcontrolorganoftheBank’sriskmanagementactivities.ItistheBank’smostseniormanagementforumonriskmanage-mentissuesandischairedbytheVicePresidentforFinance.
ALCOmeetsonaregularbasistoperformitsoversightrole.AmongALCO’skeyfunctions, itreviewsregularandad-hocfinanceandriskmanagementreportsandprojections,approvesstrategiestoadjustthebalancesheet,andconfirmscountryandprojectcreditriskratingsandtheassociatedincurredlossestimates.ALCOissupportedbyseveralstandingworkinggroupsthatreportonspecificissuesincludingcountryrisk,non-sovereigncreditrisk,counterpartycreditrisk,interestraterisk,currencyrisk,operationalrisk,financialprojec-tions,andfinancialproductsandservices.
Day-to-dayoperationalresponsibilityforimplementingtheBank’sriskmanagementpoliciesandguidelinesisdelegatedtotheappro-priatebusinessunits,andtheFinancialManagementDepartmentisresponsibleformonitoringtheday-to-daycompliancewiththosepoliciesandguidelines.
ThefollowingsectionsdescribeindetailthemannerinwhichtheindividualsourcesofriskaremanagedbytheBank.
Credit RiskCreditriskisthepotentialfinanciallossduetodefaultofoneormoredebtors/obligors.CreditriskisthelargestsourceofriskfortheBankarisingessentiallyfromitslendingandtreasuryoperations.
TheBankmanagesthreeprincipalsourcesofcreditrisk:(i)sovereigncreditriskonitspublicsectorportfolio;(ii)non-sovereigncreditriskonitsportfolioofprivatesector,non-sovereignandenclaveprojects;and(iii)counterpartycreditriskonitsportfoliooftreasuryinvest-mentsandderivativetransactions.Theserisksaremanagedwithinanintegratedframeworkofcreditpolicies,guidelinesandprocesses,whicharedescribedinmoredetailinthefollowingsections.
1) Sovereign Credit RiskWhentheBanklendstopublicsectorborrowers,itgenerallyrequiresafullsovereignguaranteeortheequivalentfromtheborrowingmemberstate.Inextendingcredittosovereignentities,itisexposedtocountryriskwhichincludespotentiallossesarisingfromacoun-try’sinabilityorunwillingnesstoserviceitsobligationstotheBank.TheBankmanagescountrycreditriskthroughfinancialpoliciesandlendingstrategies,includingindividualcountryexposurelimitsandoverallcreditworthinessassessments.Theseincludetheassessmentofthecountry’smacroeconomicperformanceaswellasitssociopoliticalconditionsandfuturegrowthprospects.
06_ADB_part a_UK.indd 90 11/04/08 13:40:48
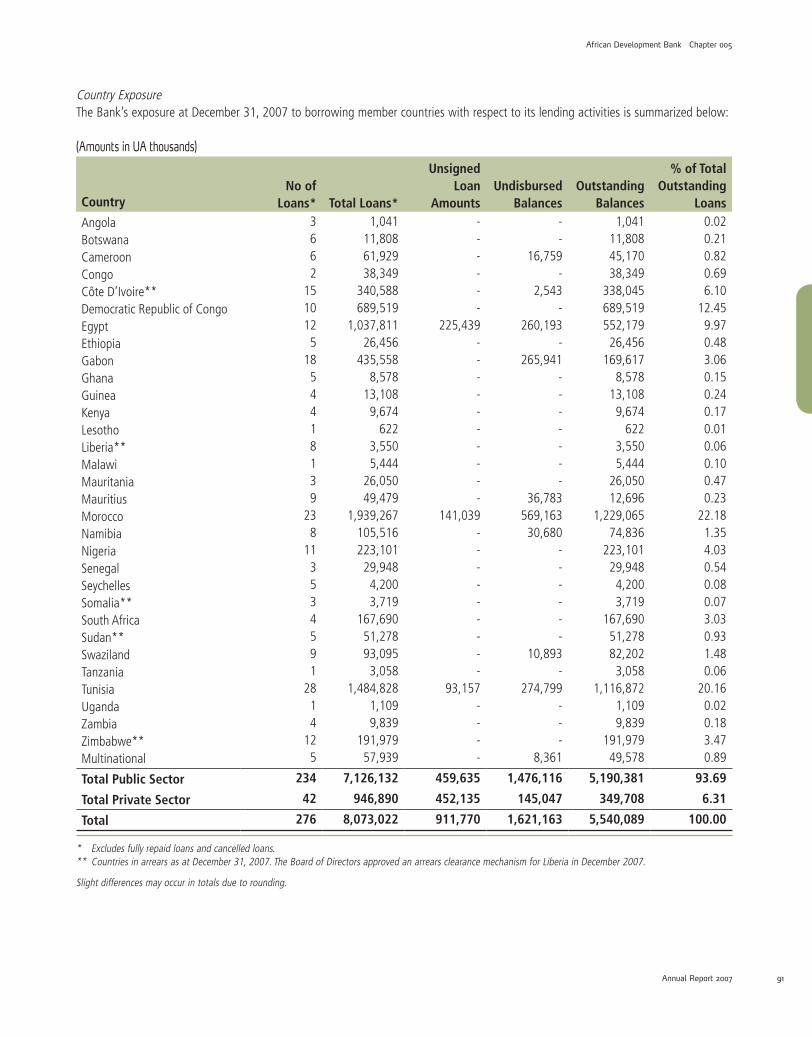
CountryExposureTheBank’sexposureatDecember31,2007toborrowingmembercountrieswithrespecttoitslendingactivitiesissummarizedbelow:
(Amounts in UA thousands)
CountryNo of
Loans* Total Loans*
Unsigned Loan
AmountsUndisbursed
BalancesOutstanding
Balances
% of Total Outstanding
LoansAngolaBotswanaCameroonCongoCôteD’Ivoire**DemocraticRepublicofCongoEgyptEthiopiaGabonGhanaGuineaKenyaLesothoLiberia**MalawiMauritaniaMauritiusMoroccoNamibiaNigeriaSenegalSeychellesSomalia**SouthAfricaSudan**SwazilandTanzaniaTunisiaUgandaZambiaZimbabwe**Multinational
3662
1510125
1854418139
238
113534591
2814
125
1,04111,80861,92938,349
340,588689,519
1,037,81126,456
435,5588,578
13,1089,674
6223,5505,444
26,05049,479
1,939,267105,516223,10129,9484,2003,719
167,69051,27893,0953,058
1,484,8281,1099,839
191,97957,939
------
225,439----------
141,039---------
93,157----
--
16,759-
2,543-
260,193-
265,941-------
36,783569,16330,680
------
10,893-
274,799---
8,361
1,04111,80845,17038,349
338,045689,519552,17926,456
169,6178,578
13,1089,674
6223,5505,444
26,05012,696
1,229,06574,836
223,10129,9484,2003,719
167,69051,27882,2023,058
1,116,8721,1099,839
191,97949,578
0.020.210.820.696.10
12.459.970.483.060.150.240.170.010.060.100.470.23
22.181.354.030.540.080.073.030.931.480.06
20.160.020.183.470.89
Total Public Sector 234 7,126,132 459,635 1,476,116 5,190,381 93.69
Total Private Sector 42 946,890 452,135 145,047 349,708 6.31
Total 276 8,073,022 911,770 1,621,163 5,540,089 100.00
* Excludesfullyrepaidloansandcancelledloans.** CountriesinarrearsasatDecember31,2007.TheBoardofDirectorsapprovedanarrearsclearancemechanismforLiberiainDecember2007.
Slightdifferencesmayoccurintotalsduetorounding.
African Development Bank Chapter 005
Annual Report 2007 91
06_ADB_part a_UK.indd 91 11/04/08 13:40:48

SystematicCreditRiskAssessmentThefoundationoftheBank’screditriskmanagementframeworkisasystematiccreditriskassessmentbasedonauniforminternalcreditriskratingscalethatiscalibratedtoreflecttheBank’sstatisticallossexpectationsasshowninthefollowingtable.
Risk Rating Description Risk Class International Equivalent1 Excellent VeryLowRisk A-BBB2 VeryGood LowRisk BB3 Good
ModerateRisk B4 Fair5 Acceptable
HighRisk CCC6 Marginal7 SpecialAttention
VeryHighRisk <CCC8 Substandard9 Doubtful10 KnownLoss
These sovereign risk credit ratingsarederived froma riskassessmenton five risk indices that includemacroeconomicperformance,debtsustainability,sociopoliticalfactors,businessenvironmentandportfolioperformance.Thesefiveriskindicesarecombinedtoderiveacompositesovereigncountryriskindexandacompositenon-sovereigncountryriskindexwhichinturnareconvertedintoseparatecountryriskratingforthesovereignandnon-sovereignportfolios.Thesecountryriskratingsarevalidatedagainsttheaveragecountryriskratingsfromaccreditedratingagenciesandotherspecializedinternationalbodies.TheALCOreviewsthecountryratingsonaquar-terlybasistoensurecompliancewithcountryexposurelimits,changesincountrycreditriskconditions,andtoapprovechangesinlossprovisioning,ifany.
PortfolioRiskMonitoringIn2007,theoverall riskprofileof theBank’ssovereignguaranteedportfolio improvedslightly,mainlyduetothecombinedeffectofimprovement in theweightedaveragecredit ratingofcertain regionalmembercountriesand theBank’s increasedexposure tohighgradedcountries.
Theportfolio’sweighted-averageriskratingshowedamarginalstrengtheningfrom2.93attheendof2006to2.67attheendof2007.ThedistributionofthesovereignportfolioacrosstheBank’sfivecreditriskclassesisshowninthetablebelow.
Risk Profile of the Outstanding Sovereign-Guaranteed Loan Portfoliovery Low Risk Low Risk Moderate Risk High Risk very High Risk
2007 37% 31% 8% 15% 9%2006 28% 35% 10% 17% 10%
2005 26% 26% 18% 17% 13%
2004 28% 28% 21% 11% 12%
2003 25% 32% 21% 16% 6%
It is theBank’spolicy that if thepaymentofprincipal, interestorotherchargeswith respect toanyBankGroupcreditbecomes30daysoverdue,nonewloanstothatmembercountry,ortoanypublicsectorborrowerinthatcountry,willbepresentedtotheBoardofDirectorsforapproval,norwillanypreviouslyapprovedloanbesigned,untilallarrearsarecleared.Furthermore,forsuchcountries,disbursementsonallloanstoorguaranteedbythatmembercountryaresuspendeduntilalloverdueamountshavebeenpaid.Thesecountriesalsobecomeineligibleinthesubsequentbillingperiodforawaiverof0.50%onthecommitmentfeeschargedonqualifyingundisbursedloans.
Chapter 005 African Development Bank
Annual Report 200792
06_ADB_part a_UK.indd 92 11/04/08 13:40:49

African Development Bank Chapter 005
Annual Report 2007 93
AlthoughtheBankbenefitsfromtheadvantagesofpreferredcreditorstatusandrigorouslymonitorstheexposureonnon-performingsovereignborrowers, somecountrieshaveexperienceddifficulties to service theirdebts to theBankona timelybasis.Aspreviouslydescribed,theBankmakesprovisionsforimpairmentinitssovereignloanportfoliocommensuratewiththeassessmentoftheincurredlossinsuchportfolio.
Tocoverpotentialunexpectedcredit-related lossesdue toextremeandunpredictableevents, theBankmaintainsaconservative riskcapitalcushionforsovereigncredit risks.TheBank’scapitaladequacypolicyarticulatesdifferentiatedriskcapital requirementsforallcredit-sensitiveassets (loansandequity investments)plus contingent liabilities (guaranteesandclient riskmanagementproducts) ineachriskclass1.Attheendof2007,theBank’spublicsectorloanportfoliousedup37%oftheBank’stotalriskcapitalbasedontheBank’scapitaladequacyframework.Thiscompareswith45%attheendof2006andreflectstheimprovementinthecompositionofthesovereignportfolio.TheBankdefinesriskcapitalasthesumofpaid-incapitalplusaccumulatedreservesnetoftranslationadjustments.Callablecapitalisnotincludedinthecomputationofriskcapital.
2) Non-Sovereign Credit RiskWhentheBanklendstoprivatesectorborrowersortoenclaveprojectsitdoesnotbenefitfromfullsovereignguarantees.TheBankmayalsoprovidefinancingtocreditworthycommerciallyorientedentitiesthatarepubliclyowned,withoutasovereignguarantee.
Toassessthecreditriskofnon-sovereignprojectsorfacilities,theBankusesasimilaruniforminternalcreditriskratingasforsovereignprojects.However,theseinternalcreditratingsarederivedonthebasisoffourmajorgroupsoffactors.
Thefirstfactorinvolvestheoverallevaluationandassessmentoftheprojectcompany’sfinancialstrength.Thisassessmentlooksat:1)capacityoftheprojecttogeneratesufficientcashflowtoserviceitsdebt;2)thecompany’soperatingperformanceandprofitability;3)theprojectcompany’scapitalstructure,financialflexibilityandliquiditypositions.
Secondly,thefollowing,fourmainnon-financialparametersareanalyzed:1)theoutlookoftheindustryinwhichtheprojectcompanyoperates;2)thecompetitivepositionoftheprojectcompanywithintheindustry;3)thestrengthoftheprojectcompany’smanagementwithparticularemphasisonitsabilitytodealwithadverseconditions;4)thequalityoftheinformationonwhichtheanalysisisbased.
Thirdly,theriskfactorsthatconsiderthestructureofthefacilityintermsofmaturity,theexistenceofthirdpartyguarantee,thevalueofanyassignedcollateral,andothercreditenchancementareextensivelyexamined.
Finally,theprojectcompany’sriskratingisadjustedtoreflecttheoverallhostcountryriskrating.
Allnewnon-sovereignprojects requireaminimum initialcredit ratingandundergo rigorousprojectapproval.TheALCOreviews thenon-sovereigncreditratingofeachprojectonaquarterlybasisandmayrecommendchangesifjustifiedbyevolvingcountryandprojectconditions.
In2007,theBankincreaseditsinvestmentsinthenon-sovereignloanandequityportfolios.Theweighted-averageriskratinghaddete-rioratedmarginallyfrom3.52attheendof2006to3.82atyear-end2007.Thedistributionofthenon-sovereignportfolioacrosstheBank’sfivecreditriskclassesisshowninthetablebelow.
1 Reflectingitshigherriskoperatingenvironmentandunavoidableportfolioconcentrations,theBankrequiresriskcapitalbackingthatisthreetotentimesmoreconservativethanBiScommercialbankingstandards.Verylowrisk=25%,lowrisk=28%,moderaterisk=35%,highrisk=50%,veryhighrisk=75%,andequityinvestments=100%.
06_ADB_part a_UK.indd 93 11/04/08 13:40:49

Chapter 005 African Development Bank
Annual Report 200794
Risk Profile of the Outstanding Non-Sovereign Loan and Equity Portfolio very Low Risk Low Risk Moderate Risk High Risk very High Risk
2007 8% 10% 46% 31% 5%
2006 16% 15% 52% 6% 11%2005 14% 20% 56% 7% 3%2004 15% 14% 55% 10% 6%2003 - 20% 62% 10% 8%
IncompliancewiththerevisedIFRS,theBanknolongermakesgeneralprovisionstocovertheexpectedlossesintheperformingnon-sovereignportfolio.Forthenon-performingportfolio,theBankmakesaspecificprovisionbasedonanassessmentofthecreditimpair-ment,orincurredloss,oneachloan.Attheendof2007,theimpairmentallowancetocovertheincurredlossonimpairedloansinthenon-sovereignportfoliodecreasedmarginallytoUA12.13millionasacomparisontoUA15.40millionin2006becauseofthereductioninthesizeoftheportfolioofimpairednon-sovereignloans.
Inadditiontoprivatesectorlending,theBankmakesequityinvestmentsinprivatesectorprojects,eitherdirectlyorthroughinvestmentfunds.Totheextentpossible,equityinvestmentsarecarriedatfairvalue.Intheeventthatthefairvalueofanequityinvestmentcannotbereliablydetermined,itiscarriedatamortizedcost,andperiodicallyassessedforimpairment.TheBankrecognizeslossprovisionbasedonacceptedimpairmenttestsmeasuredagainstthecarryingcostoftheequityinvestment.Attheendof2007,theprovisionforimpair-mentonequityinvestmentwasequivalentto6.58%oftheoutstandingequityportfolio.
Tocoverpotentialunexpectedcreditrelatedlossesduetoextremeandunpredictableevents,theBankmaintainsaconservativeriskcapi-talcushionfornon-sovereigncreditrisks.Attheendof2007,theBank’snon-sovereignportfoliorequiredasriskcapitalapproximately5.3%oftheBank’stotalon-balancesheetriskcapitalsources,slightlyabovethelevelattheendof2006.Thiswasstillwellbelowthelimitof20%determinedbytheBankfortotalnon-sovereignoperations.
CreditExposureLimitsTheBankoperatesasystemofexposurelimitstoensurethedevelopmentofanadequatelydiversifiedportfolio.TheBankmanagescreditriskatthegloballevel(combinedsovereignguaranteedandnon-sovereignguaranteedportfolios)byensuringthatintheaggregate,thetotalcountryexposurelimitdoesnotexceed15%ofthemaximumsustainableportfolio.Themaximumsustainableportfolioisdeter-minedasthelargestoutstandingportfolio(outstandingloanspluspotentialnewlending)thatcanbesupportedbythecurrentlevelofriskcapitalapplyingtheBank’scapitaladequacypolicy.Eachspecificcountrylimitisbasedontheeconomicpotentialofthecountryandperceivedrisklevel.Countryexposurelimitsarereviewedannuallyandareusedasarisk-basedbenchmarktoplantheBank’smedium-termcountryassistancestrategies.
Thecreditexposureonthenon-sovereignportfolioisfurthermanagedbylimitingexposurestocertainindustrysectors,equityinvest-mentsandsingleobligor.Inaddition,theBankgenerallyrequiresarangeofsecuritiesandguaranteesfromprojectsponsorstopartiallymitigatethecreditriskfordirectprivatesectorloans.
3) Counterparty Credit RiskInthenormalcourseofbusiness,theBankutilizesvariousfinancialinstrumentstomeettheneedsofitsborrowers,manageitsexposureto fluctuations inmarket interestandcurrencyrates,andtotemporarily invest its liquidresourcesprior todisbursement.Allof thesefinancialinstrumentsinvolve,tovaryingdegrees,theriskthatthecounterpartytothetransactionmaybeunabletomeetitsobligationtotheBank.
GiventhenatureoftheBank’sbusiness,itisnotpossibletocompletelyeliminatecounterpartycreditrisk,however,theBankminimizesthisriskbyexecutingtransactionswithinaprudentialframeworkofapprovedcounterparties,minimumcreditratingstandards,counter-partyexposurelimits,andcounterpartycreditriskmitigationmeasures.
06_ADB_part a_UK.indd 94 11/04/08 13:40:50

African Development Bank Chapter 005
Annual Report 2007 95
CounterpartiesmustmeettheBank’sminimumcreditratingrequirementsandareapprovedbytheBank’sVicePresidentforFinance.Forlocalcurrencyoperations,lessstringentminimumcreditratinglimitsarepermittedinordertoprovideadequateavailabilityofinvestmentopportunitiesandderivativecounterpartiesforimplementingappropriateriskmanagementstrategies.ALCOapprovescounterpartiesthatareratedbelowtheminimumratingrequirements.
Counterpartiesareclassifiedasinvestmentcounterparties,derivativecounterparties,andtradingcounterparties.Theirratingsarecloselymonitored.
TradingcounterpartiesaregenerallyratedA/A2.
Thefollowingtabledetailstheminimumcreditratingsforauthorizedinvestmentcounterparties:
Maturity6 months 1 year 5 years 10 years 15 years 30 years
Government A/A2 AA-/Aa3 AAA/AaaGovernmentAgenciesandSupranationals
A/A2 AA-/Aa3 AAA/Aaa
Banks A/A2 AA-/Aa3 AAA/AaaCorporationsincludingnonbankfinancialinstitutions
A/A2 AA-/Aa3 AAA/Aaa
MBS/ABS Nomaturitylimit,butrepaymentprojectionsmandatory
TheBankalsoinvestsinmortgage-backedandasset-backedsecuritieswithaminimumratingofAAA/Aaa;moneymarketmutualfundswithaminimumratingofAA-/Aa3;andentersintocollateralizedsecuritiesrepurchaseagreements.
Asarule,theBankexecutesanISDAmasteragreementandnettingagreementwithitsderivativecounterpartiespriortoundertakinganytransactions.DerivativecounterpartiesarerequiredtoberatedAA-/Aa3byatleasttwoapprovedratingagenciesorA-forcounterpartieswithwhomtheBankhasenteredintoacollateralexchangeagreement.Approvedtransactionswithderivativecounterparties includeswaps,forwards,optionsandotherover-the-counterderivatives.
Inadditiontotheseminimumratingrequirements,theBankoperateswithinaframeworkofexposurelimitsbasedonthecounterpartycreditratingandsize,subjecttoamaximumof8%oftheBank’stotalriskcapitalforanysinglecounterparty.Individualcounterpartycredit exposures are aggregated across all instruments using the Bank for International Settlements (BIS) potential future exposuremethodologyandmonitoredregularlyagainsttheBank’screditlimitsafterconsideringthebenefitsofanycollateral.
Asshowninthefollowingtable,theestimatedpotentialcounterpartycreditexposureoftheinvestmentandderivativeportfolioscontin-uestobepredominantlyAAorhigherrated.
Credit Risk Profile of the Investment and Derivative Portfolios
AAA AA A
2007 43% 54% 3%
2006 56% 39% 5%
2005 56% 36% 8%
2004 62% 36% 2%
2003 67% 27% 6%
06_ADB_part a_UK.indd 95 11/04/08 13:40:50

Chapter 005 African Development Bank
Annual Report 200796
Tocoverpotentialunexpectedcredit lossesdue toextremeandunpredictableevents, theBankmaintainsaconservative riskcapitalcushionforcounterpartycreditrisksinlinewiththecurrentBISstandards.Attheendof2007,theBank’scounterpartycreditportfolioincludingall investmentsandderivative instruments requiredas riskcapital justover2.0%of theBank’s totalon-balancesheet riskcapitalsources.Thisisaminorchangefrom2.2%in2006.
Liquidity RiskLiquidityriskisthepotentialforlossresultingfrominsufficientliquiditytomeetcashflowneedsinatimelymanner.TheBank’sprincipalliquidityriskmanagementobjectiveistoholdsufficientliquidresourcestoenableittomeetallprobablecashflowneedsforarolling1-yearhorizonwithoutadditionalfinancingfromthecapitalmarketsforanextendedperiod. Inordertominimizethisrisk,theBankmaintainsaprudentialminimumlevelofliquidity(PML)basedontheprojectednetcashrequirementforarollingone-yearperiod.ThePMLisupdatedquarterlyandcomputedasthesumoffourcomponents:1)1-yeardebtservicepayments;2)1-yearprojectednetloandisbursements(loansdisbursedlessrepayments)ifgreaterthanzero;3)loanequivalentvalueofcommittedguarantees;and4)undis-bursedequityinvestments.
Tostrikeanoptimalbalancebetweengeneratingadequateinvestmentreturnsandholdingsecuritiesthatcanbeeasilysoldforcashifrequired,theBankdividesits investmentportfolio intotrancheswithdifferent liquidityobjectivesandbenchmarks.TheBank’scoreliquidityportfolioisinvestedinrelativelyliquidsecuritiesthatcanbereadilysoldifrequired.Inadditiontothecoreportfolio,theBankmaintainsasecondtrancheofliquiditythatisalwaysinvestedinthemosthighlyliquidsecuritiestocoveritsexpectedoperationalcashflowneeds.Probableredemptionsofswapsandborrowingswithembeddedoptionsareincludedinthecomputationofthesizeoftheoperationaltrancheofliquidity.Athirdtrancheofliquidity,whichisfundedbytheBank’sequityresources,isheldinaportfoliooffixedincomesecuritiesdesignatedas“held-to-maturity”investments(HTM).OnlyHTMinvestmentswitharemainingmaturityofoneyearorlessareconsideredasliquidinvestmentsinthedeterminationoftheBank’sminimumliquidityrequirements.
ThecontractualmaturitiesoffinancialliabilitiesandfutureinterestpaymentsatDecember31,2007and2006wereasfollows:
Contractual Maturities of Financial Liabilities and Future Interest Payments at December 31, 2007
(UA thousands)
Carrying Amount
Contractual Cash Flows
1 year or less
More than 1 year but
less than 2 years
More than 2 years but
less than 3 years
More than 3 years but
less than 4 years
More than 4 years but
less than 5 years
More than 5 years
Liabilities
Accountspayable (584,339) (584,339) (584,339) - - - - -
Netderivativeliabilities (172,458) (651,235) (42,078) (49,125) (46,498) 18,772 (1,633) (530,673)
Borrowings (6,198,873) (7,906,030) (1,793,169) (1,167,663) (1,248,284) (305,462) (491,894) (2,899,558)
Total (6,955,670) (9,141,604) (2,419,586) (1,216,788) (1,294,782) (286,690) (493,527) (3,430,231)
06_ADB_part a_UK.indd 96 11/04/08 13:40:51

African Development Bank Chapter 005
Annual Report 2007 97
Contractual Maturities of Financial Liabilities and Future Interest Payments at December 31, 2006
(UA thousands)
Carrying Amount
Contractual Cash Flows
1 year or less
More than 1 year but
less than 2 years
More than 2 years but
less than 3 years
More than 3 years but
less than 4 years
More than 4 years but
less than 5 years
More than 5 years
Liabilities
Accountspayable (648,960) (648,960) (648,960) - - - - -
Netderivativeliabilities (202,531) (631,207) (61,922) 3,819 (13,036) (43,762) (2,765) (513,541)
Borrowings (5,870,469) (7,720,550) (817,563) (1,312,966) (1,125,147) (1,005,305) (276,143) (3,183,426)
Total (6,721,960) (9,000,717) (1,528,445) (1,309,147) (1,138,183) (1,049,067) (278,908) (3,696,967)
Currency RiskCurrencyriskisthepotentiallossduetoadversemovementsinmarketforeignexchangerates.Topromotestablegrowthinitsriskbear-ingcapacity,theBank’sprincipalcurrencyriskmanagementobjectiveistoprotectitsriskcapitalfromtranslationriskduetofluctuationsinforeigncurrencyexchangeratesbymatchingthecurrencycompositionofitsnetassetstothecurrencycompositionoftheSDR(UA).TheagreementestablishingtheBankexplicitlyprohibitsitfromtakingdirectcurrencyexchangeexposuresbyrequiringliabilitiesinanyonecurrencytobematchedwithassetsinthesamecurrency.Thisisachievedprimarilybyholdingorlendingtheproceedsofitsborrow-ings(afterswapactivities)inthesamecurrenciesinwhichtheywereborrowed(afterswapactivities).Toavoidcreatingnewcurrencymismatches,theBankrequiresitsborrowerstoservicetheirloansinthecurrenciesdisbursed.
Becausealargepartofitsbalancesheetisfundedbyequityresources,whicharedenominatedinUnitsofAccount(equivalenttotheSDR),theBankhasanetassetpositionthatispotentiallyexposedtotranslationriskwhencurrencyexchangeratesfluctuate.TheBank’spolicy is tominimizethepotential fluctuationof thevalueof itsnetworthmeasured inUnitsofAccountbymatching, totheextentpossible,thecurrencycompositionofitsnetassetswiththecurrencybasketoftheSDR(theUnitofAccount).Inlinewiththispolicy,throughout2007theBank’scurrencyalignmentwasadjustedwithinatightbandoftherisk-neutralpositionineachofthecurrenciesmakinguptheSDRcomposition.InkeepingwiththeBank’scurrencyriskmanagementpolicy,spotcurrencytransactionsarecarriedouttorealignthenetassetstotheSDRbasketeachtimethereisarevisiontotheSDRcurrencycomposition.Asresultofthesepoliciesandpractices,despitesharpmovementsinthevaluesofthemajorcurrenciesduringtheyear,theBankexperiencedtranslationadjustmentsoflessthan0.20%ofnetassets(2006:gainlessthan0.10%).
TheBankalsohedgesitsexposuretoadversemovementsoncurrencyexchangeratesonitsadministrativeexpenses.ThedistributionofthecurrenciesoftheBank’srecurringadministrativeexpendituresshowsahighconcentrationofexpensesinEuros,USDandTunisianDinar. For2007, theBank’s strategyofpurchasing currencies in the forwardmarket to cover theestimated currency compositionofexpensesmitigatedtheunfavorableimpactofthosecurrenciesmovementsduringtheyear.
06_ADB_part a_UK.indd 97 11/04/08 13:40:51

NetcurrencypositionatDecember31,2007and2006wasasfollows:
Net Currency Position at December 31, 2007
(UA thousands)
Euro
United States Dollar
JapaneseYen
Pound Sterling Other Sub-total
Units of Account Total
AssetsCashDemandobligationsInvestments–trading(netofrepos)(a)
Investments–held-to-maturityNon-negotiableinstrumentsonaccountofcapitalAccountsreceivableLoansEquityparticipationsOtherdebtsecuritiesOtherassets
LiabilitiesAccountspayableBorrowings
Currencyswapsonborrowingsandrelatedderivatives(b)
Currency position of equity as at December 31, 2007
%ofsub-total
SDR composition as at December 31, 2007
(2,162)-
792,134724,683
526172,603
2,686,5222,033
-1,492
4,377,831
(136,858)-
(136,858)
(2,534,775)
1,706,198
36.40
38.25
44,889-
1,614,7821,188,074
11,536266,626
1,757,90658,960
-186
4,942,959
(296,168)(2,671,338)(2,967,506)
(111,400)
1,864,053
39.76
40.05
46,049-
64,142223,793
-57,593
525,955--
-917,532
(3,682)(1,532,246)(1,535,928)
1,096,639
478,243
10.20
10.24
1,696-
20,264506,996
-18,7722,864
--
659551,251
(7,904)(63,389)(71,293)
38,033
517,991
11.05
11.46
5,0563,801
175,421--
60,793370,82664,419
94,6221,051
775,989
(74,714)(1,811,940)(1,886,654)
1,232,216
121,551
2.59
-
95,5283,801
2,666,7432,643,546
12,062576,387
5,344,073125,41294,622
3,38811,565,562
(519,326)(6,078,913)(6,598,239)
(279,287)
4,688,036
100.00
100.00
----
3,32319,488
-63,836
-11,64198,288
(65,013)(119,960)(184,973)
106,829
20,144
-
-
95,5283,801
2,666,7432,643,546
15,385595,875
5,344,073189,248
94,62215,029
11,663,850
(584,339)(6,198,873)(6,783,212)
(172,458)
4,708,180
100.00
100.00
(a) Investmentsheldfortradingcomprise: Investmentsheldfortrading,netofrepos Derivativeassets Derivativeliabilities Amountperstatementofnetcurrencyposition
(b) Currencyswapsonborrowingscomprise: Derivativeassets Derivativeliabilities Netswapsonborrowingsperstatementofnetcurrencyposition
2,659,9948,997
(2,248)2,666,743
416,341(588,799)(172,458)
Chapter 005 African Development Bank
Annual Report 200798
06_ADB_part a_UK.indd 98 11/04/08 13:40:52
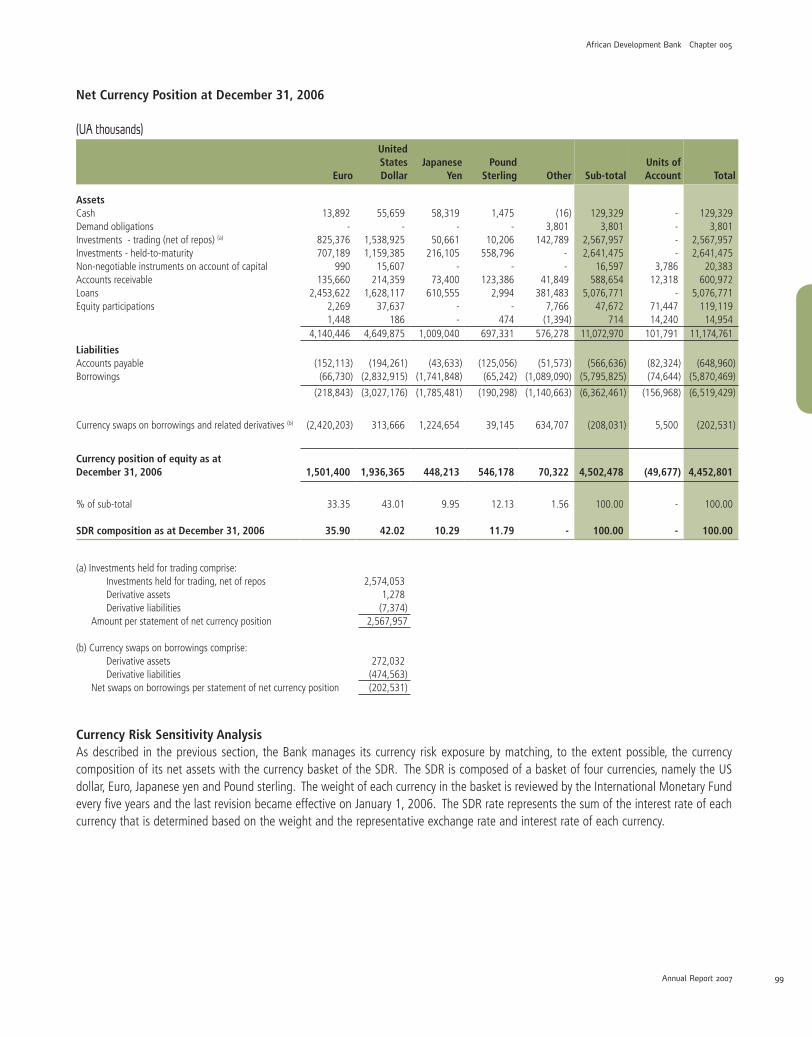
Net Currency Position at December 31, 2006
(UA thousands)
Euro
United States Dollar
JapaneseYen
PoundSterling Other Sub-total
Units of Account Total
AssetsCashDemandobligationsInvestments-trading(netofrepos)(a)
Investments-held-to-maturityNon-negotiableinstrumentsonaccountofcapitalAccountsreceivableLoansEquityparticipations
13,892-
825,376707,189
990135,660
2,453,6222,2691,448
55,659-
1,538,9251,159,385
15,607214,359
1,628,11737,637
186
58,319-
50,661216,105
-73,400
610,555--
1,475-
10,206558,796
-123,386
2,994-
474
(16)3,801
142,789--
41,849381,483
7,766(1,394)
129,3293,801
2,567,9572,641,475
16,597588,654
5,076,77147,672
714
----
3,78612,318
-71,44714,240
129,3293,801
2,567,9572,641,475
20,383600,972
5,076,771119,119
14,9544,140,446 4,649,875 1,009,040 697,331 576,278 11,072,970 101,791 11,174,761
LiabilitiesAccountspayableBorrowings
(152,113)(66,730)
(194,261)(2,832,915)
(43,633)(1,741,848)
(125,056)(65,242)
(51,573)(1,089,090)
(566,636)(5,795,825)
(82,324)(74,644)
(648,960)(5,870,469)
(218,843) (3,027,176) (1,785,481) (190,298) (1,140,663) (6,362,461) (156,968) (6,519,429)
Currencyswapsonborrowingsandrelatedderivatives(b) (2,420,203) 313,666 1,224,654 39,145 634,707 (208,031) 5,500 (202,531)
Currency position of equity as at December 31, 2006 1,501,400 1,936,365 448,213 546,178 70,322 4,502,478 (49,677)
4,452,801
%ofsub-total
SDR composition as at December 31, 2006
33.35
35.90
43.01
42.02
9.95
10.29
12.13
11.79
1.56
-
100.00
100.00
-
-
100.00
100.00
(a)Investmentsheldfortradingcomprise: Investmentsheldfortrading,netofrepos Derivativeassets Derivativeliabilities Amountperstatementofnetcurrencyposition
(b)Currencyswapsonborrowingscomprise: Derivativeassets Derivativeliabilities Netswapsonborrowingsperstatementofnetcurrencyposition
2,574,0531,278
(7,374)2,567,957
272,032(474,563)(202,531)
Currency Risk Sensitivity AnalysisAsdescribed in theprevious section, theBankmanages its currency riskexposurebymatching, to theextentpossible, thecurrencycompositionofitsnetassetswiththecurrencybasketoftheSDR.TheSDRiscomposedofabasketoffourcurrencies,namelytheUSdollar,Euro,JapaneseyenandPoundsterling.TheweightofeachcurrencyinthebasketisreviewedbytheInternationalMonetaryFundeveryfiveyearsandthelastrevisionbecameeffectiveonJanuary1,2006.TheSDRraterepresentsthesumoftheinterestrateofeachcurrencythatisdeterminedbasedontheweightandtherepresentativeexchangerateandinterestrateofeachcurrency.
African Development Bank Chapter 005
Annual Report 2007 99
06_ADB_part a_UK.indd 99 11/04/08 13:40:53

Chapter 005 African Development Bank
Annual Report 2007100
ThefollowingtablesillustratethesensitivityoftheBank’snetassetstocurrencyfluctuationsduetomovementsintheexchangerateofthecurrenciesintheSDRbasketasofDecember31,2007and2006,respectively.Thesensitivityanalysisshownassumesaseparate10%appreciation/depreciationforeachcurrencyinthebasketagainsttheUSdollar.DuetoamoderatechangeintheAfricancurrencyholdingsfrom2006to2007,the2007tablealsoincludestheeffectofa10%appreciation/depreciationofeachAfricancurrencyagainsttheSDR.Underthedifferentscenarios,thecurrencyriskmanagementstrategyoftheBankshowsaminimalchangeinnetassetsasaresultofcurrencymismatches.
Sensitivity of the Bank’s Net Assets to Currency Fluctuations at December 31, 2007
(Amounts in UA millions)
US Dollar Euro Japanese Yen Pound SterlingOther
Currencies Net Assets
Change in Net Assets
Gain/(Loss)
Basis Point Change
of Total Net Assets
Netassetsresultingfroma10%appreciationagainsttheUSD
EURGBPJPY
1,811.721,859.601,861.56
1,864.671,739.951,741.79
462.90475.13523.20
501.16565.85514.95
66.5466.5466.54
4,706.994,707.074,708.04
(1.19)(1.11)(0.14)
3bps2bps
*
Netassetsresultingfrom10%appreciationofeachAfricancurrencyagainsttheSDR
1,880.89 1,759.88
480.57
520.30 73.20 4,714.84 6.66 14bps
Netassetsresultingfroma10%depreciationagainsttheUSD
EURGBPJPY
1,948.511,900.661,898.81
1,657.411,778.371,776.64
497.85485.63441.05
539.00477.97525.25
66.5466.5466.54
4,709.314,709.174,708.29
1.130.990.11
2bps2bps
*
Netassetsresultingfrom10%depreciationofeachAfricancurrencyagainsttheSDR
1,880.89 1,759.88 480.57 520.30 60.49 4,702.13 (6.05) 13bps
Assumptions:
Basenetassets 1,880.88 1,759.88 480.58 520.30 66.54 4,708.18 - -
Currencyweight 0.6320 0.4100 18.4000 0.0903 - - - -
Baseexchangerate 1.5803 1.0735 179.9472 0.7889 - - - -
*Lessthan1basispoint.
Sensitivity of the Bank’s Net Assets to Currency Fluctuations at December 31, 2006
(Amounts in UA millions)
US Dollar Euro Japanese Yen Pound SterlingOther
Currencies Net Assets
Change in Net Assets
Gain/(Loss)
Basis Point Change
of Total Net Assets
Netassetsresultingfroma10%appreciationagainsttheUSD
EURGBPJPY
1,858.001,902.441,905.24
1,632.941,520.001,522.23
427.65437.88482.38
521.45587.32534.71
6.786.786.78
4,446.824,454.424,451.34
(5.98)1.62
(1.46)
1bp**
Netassetsresultingfroma10%depreciationagainsttheUSD
EURGBPJPY
1,989.861,945.621,942.97
1,445.311,554.481,552.37
458.00447.82406.55
558.46496.40545.29
6.786.786.78
4,458.414,451.104,453.96
5.61(1.70)1.16
1bp**
Assumptions:
Basenetassets 1,924.86 1,537.90 443.04 540.21 6.78 4,452.80 - -
Currencyweight 0.6320 0.4100 18.4000 0.0903 - - - -
Baseexchangerate 1.5040 1.1403 179.0799 0.7686 - - - -
*Lessthan1basispoint.
06_ADB_part a_UK.indd 100 11/04/08 13:40:53

African Development Bank Chapter 005
Annual Report 2007 101
Interest Rate RiskTheBank’sinterestraterisksensitivityiscomprisedoftwoelements:1)thesensitivityoftheinterestmarginbetweentheratetheBankearnsonitsassetsandthecostoftheborrowingsfundingsuchassets;and2)thesensitivityoftheincomeonassetsfundedbyequityresourcestochangesininterestrates.TheBank’sprincipalinterestrateriskmanagementobjectiveistogenerateastableoverallnetinterestmarginthatisnotoverlysensitivetosharpchangesinmarketinterestrates,butyetadequatelyresponsivetogeneralmarkettrends.
InterestrateriskpositionasatDecember31,2007and2006wasasfollows:
Interest Rate Risk Position as at December 31, 2007(UA thousands)
1 year or less
More than 1 year but
less than 2 years
More than 2 years but less
than 3 years
More than 3 years but less
than 4 years
More than 4 years but less
than 5 years
More than 5 years
Non interest bearing
funds Total
AssetsCashDemandobligationsTreasuryInvestments(a)
Non-negotiableinstrumentsonaccountofcapitalAccountsreceivableLoans-disbursedandoutstandingAccumulatedprovisionforloanimpairmentEquityparticipationsOtherdebtsecuritiesOtherassets
95,5283,801
2,940,5513,655
764,5752,979,075
----
--
378,5683,616
-216,388
----
--
357,0803,694
-146,020
----
--
454,2621,575
-222,674
----
--
305,4831,046
-147,551
----
--
891,8821,799
-1,828,381
--
92,924-
--
(17,537)-
(168,700)-
(196,016)189,248
1,69815,029
95,5283,801
5,310,28915,385
595,8755,540,089(196,016)189,248
94,62215,029
6,787,185 598,572 506,794 678,511 454,080 2,814,986 (176,278) 11,663,850
LiabilitiesAccountspayableBorrowings(b)
Macrohedgeswaps
(584,339)(5,399,080)(389,812)
-(60,675)42,398
-(236)
-
-(69,285)
-
-(236)
-
-(831,390)
347,414
-(10,429)
-
(584,339)(6,371,331)
-
(6,373,231) (18,277) (236) (69,285) (236) (483,976) (10,429) (6,955,670)
Interest rate risk position as at December 31, 2007* 413,954 580,295 506,558 609,226 453,844 2,331,010 (186,707) 4,708,180
*Interestrateriskpositionrepresentsequity.
(a)Treasuryinvestmentsismadeupasfollows: Treasuryinvestments Derivativeassets-investments Derivativeliabilities-investments Amountperstatementofinterestraterisk
(b)Borrowingsismadeupasfollows: Borrowings Derivativeassets-borrowings Derivativeliabilities-borrowings Netborrowingsperstatementofinterestraterisk
5,303,5408,997
(2,248)5,310,289
6,198,873(416,341)588,799
6,371,331
06_ADB_part a_UK.indd 101 11/04/08 13:40:54

Chapter 005 African Development Bank
Annual Report 2007102
Interest Rate Risk Position as at December 31, 2006(UA thousands)
1 year or less
More than 1 year but
less than 2 years
More than 2 years but less
than 3 years
More than 3 years but less
than 4 years
More than 4
years but less than
5 yearsMore than
5 years
Not interest bearing
funds Total
AssetsCashDemandobligationsTreasuryinvestments(a)
NonnegotiableinstrumentsonaccountofcapitalAccountsreceivableLoans-disbursedandoutstandingAccumulatedprovisionforloanimpairmentEquityparticipationsOtherassets
129,3293,801
2,879,7214,637
823,5602,271,415
---
--
237,3473,971
-286,961
---
--
337,7103,760
-239,624
---
--
381,2553,842
-211,502
---
--
378,5851,616
-200,596
---
--
1,012,7822,557
-2,080,853
---
--
(17,968)-
(222,588)-
(214,180)119,119
14,954
129,3293,801
5,209,43220,383
600,9725,290,951(214,180)119,119
14,954
6,112,463 528,279 581,094 596,599 580,797 3,096,192 (320,663) 11,174,761
LiabilitiesAccountspayableBorrowings(b)
Macrohedgeswaps
(648,960)(4,612,678)(290,482)
-(326,422)
31,242
-(57,022)
-
-(8,605)
-
-(56,985)259,240
-(1,077,633)
-
-66,345
-
(648,960)(6,073,000)
-
(5,552,120) (295,180) (57,022) (8,605) 202,255 (1,077,633) 66,345 (6,721,960)
Interest rate risk position as at December 31, 2006*
560,343
233,099
524,072 587,994 783,052 2,018,559
(254,318) 4,452,801
*Interestrateriskpositionrepresentsequity.
(a)Treasuryinvestmentscomprise: Treasuryinvestments Derivativeassets-investments Derivativeliabilities-investments Securitiessoldunderagreementstorepurchase Amountperstatementofnetcurrencyposition
(b)Borrowingscomprise: Derivativeassets-borrowings Derivativeliabilities-borrowings Netborrowingsperstatementofinterestraterisk
6,093,3611,278
(7,374)(877,833)
5,209,432
5,870,469(272,032)474,563
6,073,000
Interest Rate Risk on Assets Funded by DebtOverhalfoftheBank’sinterest-rate-sensitiveassetsarefundedbydebt.TheBankseekstogenerateastablenetinterestmarginonassetsfundedbydebtbymatchingtheinterestratecharacteristicsofeachclassofassetswiththoseofthecorrespondingliabilities.
In1990,theBankbeganoffering”variablerateloans”.Theinterestrateontheseloansresetssemi-annuallybasedontheaveragecostofadedicatedpooloftheBank’sborrowings.Thesepoolsarefundedwithamixoffixedrateandfloatingrateborrowingstoprovidebor-rowerswithbroadlystableinterestratesthatgraduallytrackchangesinmarketinterestrates.Thecostoffundspass-throughformulationincorporatedinthelendingrateschargedontheBank’spool-basedloanshastraditionallyhelpedtominimizetheinterestratesensitivityofthenetinterestmarginonthispartofitsloanportfolio.Inviewofdecliningdemandforthisproductinfavorofmarket-basedloans,theBankiscarefullymanagingthegradualwindingdownofthedesignatedfundingpools.
06_ADB_part a_UK.indd 102 11/04/08 13:40:55

African Development Bank Chapter 005
Annual Report 2007 103
Since1997,theBankoffersfixedandfloatingrate loanswhoseinterestrate isdirectly linkedtomarket interestrates(market-basedloans).Forthemarket-basedloanproducts,theBank’snetinterestmarginispreservedbyusingswapstoaligntheinterestratesensitivityoftheloanswiththatoftheBank’sunderlyingfundingreference(six-monthLiborfloatingrate).TheBankmayalsoprovideborrowerswithriskmanagementproductssuchasswapstomodifythecurrencyandinterestratetermsofitsmarket-basedloanproducts.Althoughitretainsthecreditrisksoftheborrower,theBankeliminatestheassociatedmarketriskontheseriskmanagementproductsbysimul-taneouslylayingoffmarketriskswithanapprovedderivativecounterparty.
Fortheportfolioof liquidassetsfundedbyborrowings,theBankprotects itsnet interestmarginbymanagingits investmentswithinlimitsaroundbenchmarksthatreplicatetheinterestratecharacteristicsoftheunderlyingfundingforeachportfoliotranche.Theportfolioof liquidassetsfundedbyborrowings iscurrentlydividedintotwotranchestoreflectthedifferentbusinesspurposesandunderlyingfunding.ThecorepartoftheinvestmentportfolioisheldtocomplywiththeBank’sliquiditypolicyandusesasix-monthLiborfloatingratebenchmark.Theoperational liquidityportfolio ismanagedtomeetprojectedoperationalcashflowneedsandusesaone-monthLiborfloatingratebenchmark.
TheBankdiversifiesthesourcesofitsfundingbyissuingdebtinavarietyofmarketsandinstruments.Unlessfixedratefundingisrequiredforoneofitspool-basedloanproducts,theBankprotectsitsnetinterestmarginbysimultaneouslyswappingallnewborrowingsintofloatingrateinoneoftheBank’sactivecurrenciesonastandardsix-monthLiborratereference.WheretheBankissuesstructureddebt,the Bank simultaneously enters into a swap with matching terms to synthetically create the desired six-month Libor-based floatingratefunding.Forriskmanagementpurposes,callablefundingisconsideredasonealternativetoissuingshort-termdebtsuchasEuroCommercialPaper.TheBankmanagesrefinancingriskbylimitingtheamountofdebtthatwillmatureorispotentiallycallablewithinoneyearto25%oftheoutstandingdebtportfolio.
Interest Rate Risk on Assets Funded by EquityThesecondprincipalsourceofinterestrateriskistheinterestratesensitivityoftheincomeearnedfromfundingasignificantportionoftheBank’sassetswithequityresources.ChangesinmarketinterestratesinthecurrenciesoftheBank’sequityresources(theSDR)affectthenetinterestmarginearnedonassetsfundedbyequity.Ingeneral,lowernominalmarketinterestratesresultinlowerlendingandinvestmentrates,whichinthelong-term,reducethenominalearningsontheBank’sequityresources.
TheBankmanagestheinterestrateprofileoftheassetsfundedbyequityresourceswiththeobjectiveofreducingthesensitivityofthenetinterestmargintofluctuationsinmarketinterestrates.ThisisachievedbycontinuouslyadjustingtherepricingprofileoftheassetsfundedbytheBank’sequityresources(fixedrateloansandinvestments)tomatcharepricingprofilebenchmark.TheBank’srepricingprofilebenchmarkisa10-year ladderwherebyauniform10%oftheBank’sassetsfundedbyequityreprice ineachyear.Usingthisbenchmark,theBank’snetinterestmarginonassetsfundedbyequitytendstotrackaten-yearmovingaverageof10-yearmaturitySDRinterestrates.Attheendof2007and2006,theBank’soverallrepricingprofilewascloselyalignedtothebenchmarkinalmostallannualbuckets.Fornetassetsrepricingwithinoneyear,theBankhadamanageablegaprelativetothebenchmark.
06_ADB_part a_UK.indd 103 11/04/08 13:40:55
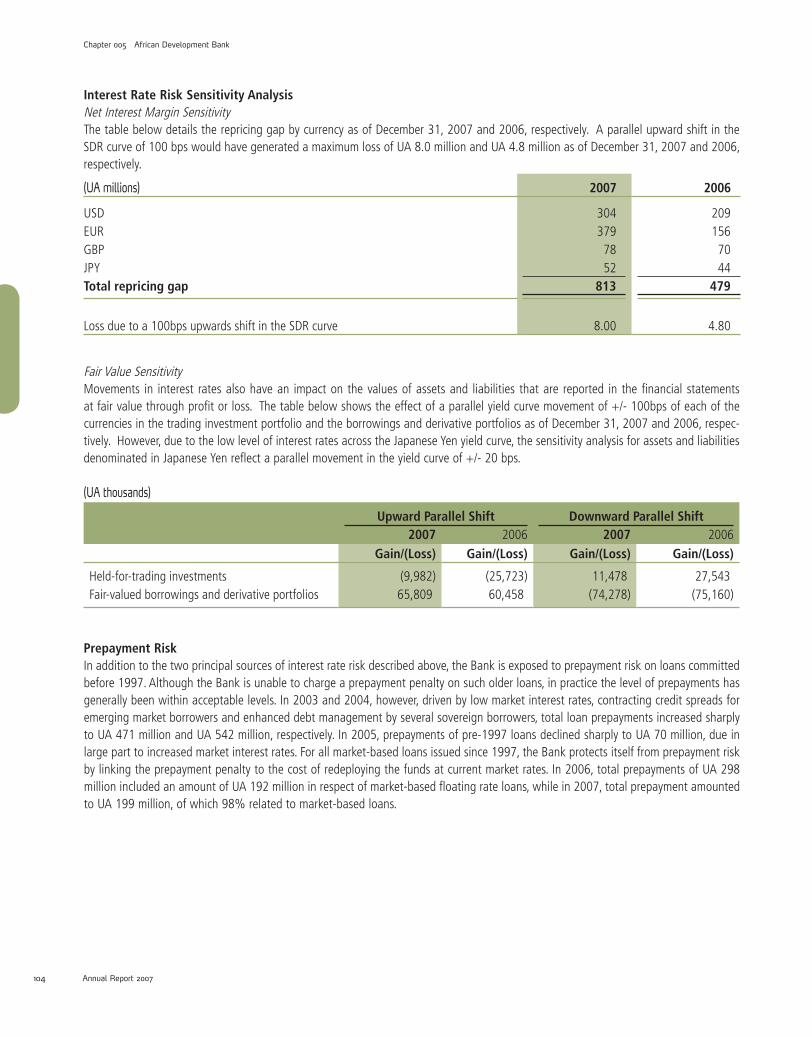
Chapter 005 African Development Bank
Annual Report 2007104
Interest Rate Risk Sensitivity AnalysisNetInterestMarginSensitivityThetablebelowdetailstherepricinggapbycurrencyasofDecember31,2007and2006,respectively.AparallelupwardshiftintheSDRcurveof100bpswouldhavegeneratedamaximumlossofUA8.0millionandUA4.8millionasofDecember31,2007and2006,respectively.
(UA millions) 2007 2006
USD 304 209EUR 379 156GBP 78 70JPY 52 44Total repricing gap 813 479
Lossduetoa100bpsupwardsshiftintheSDRcurve 8.00 4.80
FairValueSensitivityMovements in interest ratesalsohavean impacton thevaluesofassetsand liabilities thatare reported in the financial statementsatfairvaluethroughprofitorloss.Thetablebelowshowstheeffectofaparallelyieldcurvemovementof+/-100bpsofeachofthecurrenciesinthetradinginvestmentportfolioandtheborrowingsandderivativeportfoliosasofDecember31,2007and2006,respec-tively.However,duetothelowlevelofinterestratesacrosstheJapaneseYenyieldcurve,thesensitivityanalysisforassetsandliabilitiesdenominatedinJapaneseYenreflectaparallelmovementintheyieldcurveof+/-20bps.
(UA thousands)
Upward Parallel Shift Downward Parallel Shift2007 2006 2007 2006
Gain/(Loss) Gain/(Loss) Gain/(Loss) Gain/(Loss)
Held-for-tradinginvestments (9,982) (25,723) 11,478 27,543Fair-valuedborrowingsandderivativeportfolios 65,809 60,458 (74,278) (75,160)
Prepayment RiskInadditiontothetwoprincipalsourcesofinterestrateriskdescribedabove,theBankisexposedtoprepaymentriskonloanscommittedbefore1997.AlthoughtheBankisunabletochargeaprepaymentpenaltyonsucholderloans,inpracticethelevelofprepaymentshasgenerallybeenwithinacceptablelevels.In2003and2004,however,drivenbylowmarketinterestrates,contractingcreditspreadsforemergingmarketborrowersandenhanceddebtmanagementbyseveralsovereignborrowers,totalloanprepaymentsincreasedsharplytoUA471millionandUA542million,respectively.In2005,prepaymentsofpre-1997loansdeclinedsharplytoUA70million,dueinlargeparttoincreasedmarketinterestrates.Forallmarket-basedloansissuedsince1997,theBankprotectsitselffromprepaymentriskbylinkingtheprepaymentpenaltytothecostofredeployingthefundsatcurrentmarketrates.In2006,totalprepaymentsofUA298millionincludedanamountofUA192millioninrespectofmarket-basedfloatingrateloans,whilein2007,totalprepaymentamountedtoUA199million,ofwhich98%relatedtomarket-basedloans.
06_ADB_part a_UK.indd 104 11/04/08 13:40:55

African Development Bank Chapter 005
Annual Report 2007 105PB
Operational RiskThe Bank defines operational risks to include all aspects of risk-related exposure other than those falling within the scope of credit, market and liquidity risks including specifically the risk of loss resulting from inadequate or failed internal processes, people and systems or from external events and reputational risk.
Like all financial institutions, the Bank is also exposed to controls and operational risks arising from its systems, functions and interde-pendencies among its departments, which could impact broadly its activities with a possible consequence of operational losses. There are also many interdependencies among risk factors that may result in an operational risk loss.
In the past, the Bank Group has relied almost exclusively upon internal controls within departments, although not necessarily identified as managing operational risk, for its internal controls and operational risk management. The evolving best practice is for specific structures and methods to be dedicated for managing and coordinating operational risks. Following approval by the Board of Directors in 2004, the Bank established an Internal Control Unit (ICU) to develop assessments and measure areas of operational risk in the Bank in line with the evolving best practices. The Bank also adopted and commenced in 2005, the implementation of the COSO control framework to regularly evaluate the effectiveness of its internal controls in all significant business operations.
The implementation of Operational Risk Management is being done in phases: the first phase focused on the documentation and testing of controls around financial reporting. Management attestation on the adequacy of internal controls was published in the annual reports for the first time in 2006. Phase two of the implementation commenced in 2007 and is extending the COSO framework to other areas of operational risk management.
There are other initiatives or activities in the other areas of the Bank Group that are complementing the work on operational risk man-agement and controls including:
• Review of Code of Conduct and Staff Rules • Fraud and Investigation Unit • Whistleblower Protection Policy • Document Retention Policy • Business Continuity Planning and Preparedness
Effects of Recent Developments in the Financial MarketsAs a result of its prudent risk management policies and practices, the impact on the Bank of the recent turbulence in the world financial markets related in large part to losses on sub-prime mortgage loans and related derivatives have been insignificant. With regard to the funding activities, there has been no adverse effect on the Bank’s ability to borrow at very attractive rates, consistent with the Bank’s solid financial position as evidenced by the continued uniform top rating by all the major rating agencies. Consequently, the Bank continues to be well placed to play its intermediation role in support of the development financing needs of its member countries. With regard to investing activities, the Bank’s investment guidelines and practices have helped to ensure a very limited exposure to financial instruments backed by sub-prime mortgages and other risky asset classes. At December 31, 2007, the Bank held an asset-backed commercial paper issued by a SIV-lite with exposure to sub-prime mortgages. This investment amounted to USD 50 million or UA 31.64 million, representing 0.26% of the Bank’s total assets or 0.67% of total equity. The estimated loss to the Bank on such asset-backed commercial paper has been provided for in these financial statements.

Chapter 005 African Development Bank
Annual Report 2007 107106
NOTE E – FINANCIAL ASSETS AND LIABILITIES
The tables below set out the Bank’s classification of each class of financial assets and liabilities, and their respective fair values:
Analysis of Financial Assets and Liabilities by Measurement Basis
(UA thousands)Financial Assets and
Liabilities through Profit or Loss Held-to-
MaturityAvailable-
for-SaleLoans and
Receivables
Financial Assets and
Liabilities at Amortized
Cost
Total Carrying Amount
Fair ValueDecember 31, 2007 Held-for-
TradingDesignated
at Fair Value
Cash - - - - - 95,528 95,528 95,528
Demand obligations - - - - - 3,801 3,801 3,801
Treasury investments 2,659,994 - 2,643,546 - - - 5,303,540 5,296,591
Derivative assets 425,338 - - - - - 425,338 425,338
Non-negotiable instruments on account of capital - - - - - 15,385 15,385 15,385
Accounts receivable - - - - 595,875 - 595,875 595,875
Loans - - - - 5,344,073 - 5,344,073 5,637,708
Equity participations - - - 189,248 - - 189,248 189,248
Other debt securities - - - 94,622 - - 94,622 94,622
Total financial assets 3,085,332 - 2,643,546 283,870 5,939,948 114,714 12,067,410 12,354,096
Accounts payable - - - - - 584,339 584,339 584,339
Securities sold under agreements to repurchase and payable for cash collateral received - - - - - - - -
Derivative liabilities 591,047 - - - - - 591,047 591,047
Borrowings - 5,226,279 - - - 972,594 6,198,874 6,396,478
Total financial liabilities 591,047 5,226,279 - - - 1,556,933 7,374,259 7,571,864
(UA thousands)Financial Assets and
Liabilities through Profit or Loss Held-to-
maturityAvailable-
for-SaleLoans and
Receivables
Financial Assets and
Liabilities at Amortized
Cost
Total Carrying Amount
Fair ValueDecember 31, 2006 Held-for-
TradingDesignated
at Fair Value
Cash - - - - - 129,329 129,329 129,329
Demand obligations - - - - - 3,801 3,801 3,801
Treasury investments 3,451,886 - 2,641,475 - - - 6,093,361 6,085,626
Derivative assets 273,310 - - - - - 273,310 273,310
Non-negotiable instruments on account of capital - - - - - 20,383 20,383 20,383
Accounts receivable - - - - 600,972 - 600,972 600,972
Loans - - - - 5,076,771 - 5,076,771 5,354,861
Equity participations - - - 119,119 - - 119,119 119,119
Other debt securities - - - - - - - -
Total financial assets 3,725,196 - 2,641,475 119,119 5,677,743 153,513 12,317,046 12,587,401
Accounts payable - - - - - 648,960 648,960 648,960
Securities sold under agreements to repurchase and payable for cash collateral received 877,833
- - - - - 877,833 877,833
Derivative liabilities 481,937 - - - - - 481,937 481,937
Borrowings - 4,823,648 - - - 1,046,821 5,870,469 6,058,453
Total financial liabilities 1,359,770 4,823,648 - - - 1,695,781 7,879,199 8,067,183

African Development Bank Chapter 005
Annual Report 2007 107106
NOTE F – TREASURY INVESTMENTS
As part of its overall portfolio management strategy, the Bank invests in government and agency obligations, time deposits, asset-backed securities, secured lending transactions, resale agreements and related derivative instruments including futures, forward contracts, cross-currency swaps, interest rate swaps, options and short sales.
For government and agency obligations with final maturity longer than 1 year and less than 15 years, the Bank may only invest in obliga-tions with counterparties having a minimum credit rating of AA- or unconditionally guaranteed by governments of member countries or other official entities. For asset-backed securities, the Bank may only invest in securities with a AAA credit rating. Investments in money market instruments are restricted to instruments having maturities of not more than 1 year and a minimum credit rating of A. Over-the-counter (OTC) options on government securities and interest rate products are purchased only if the life of the option contract does not exceed 1 year, and such transactions are only executed with counterparties with credit ratings of AA- or above. Cross-currency and interest rate swaps including asset swap transactions are only permitted with approved counterparties or guaranteed by entities with minimum credit ratings of AA-/Aa3 at the time of the transaction.
The Bank uses external managers in the management of certain of its liquid assets, in accordance with the Bank’s Asset and Liability Management Guidelines. At December 31, 2007, investments under external management were UA 154.85 million (2006: UA 120.39 million). These amounts were included in the held-for-trading portfolio below.
At December 31, 2007, the Bank had no securities sold under repurchase agreements (Repos). At December 31, 2006, Repos with a nominal value of UA 877.83 million and a market value including accrued interest of UA 879.41 million were outstanding on the balance sheet date. Securities pledged as collateral outstanding at December 31, 2006 had a carrying value of UA 757.49 million. The nominal value of securities sold under repurchase agreements, but not yet settled and therefore not requiring collateral to be pledged at December 31, 2006 was UA 117.64 million. These securities included held-for-trading and held-to-maturity instruments and were reported in their respective captions below.
The composition of treasury investments as at December 31, 2007 and 2006 was as follows:
(UA thousands) 2007 2006
Held-for-trading 2,659,994 3,451,886Held-to-maturity 2,643,546 2,641,475Total 5,303,540 6,093,361
Held-for-Trading InvestmentsA summary of the Bank’s held-for-trading investments at December 31, 2007 and 2006 follows:
(UA millions)US Dollar Euro GBP Other Currencies All Currencies
2007 2006 2007 2006 2007 2006 2007 2006 2007 2006
Time deposits 444.23 535.08 246.69 43.62 20.26 464.70 215.22 168.58 926.40 1,211.98
Asset-backed securities 158.17 509.56 134.35 355.32 - - - - 292.52 864.88
Government and agency obligations 41.24 - - 17.99 - - - 9.04 41.24 27.03
Corporate bonds and commercial paper 964.24 784.16 411.22 519.21 - - 24.37 44.63 1,399.83 1,348.00
Total held-for-trading investments 1,607.88 1,828.80 792.26 936.14 20.26 464.70 239.59 222.25 2,659.99 3,451.89
Repos - (284.48) - (110.06) - (454.48) - (28.81) - (877.83)
The nominal balance of the Bank’s held-for-trading investments as at December 31, 2007 was UA 2,650.03 million (2006: UA 3,449.01 million). The average yield of held-for-trading investments in 2007 was 4.54% (2006: 4.28%).
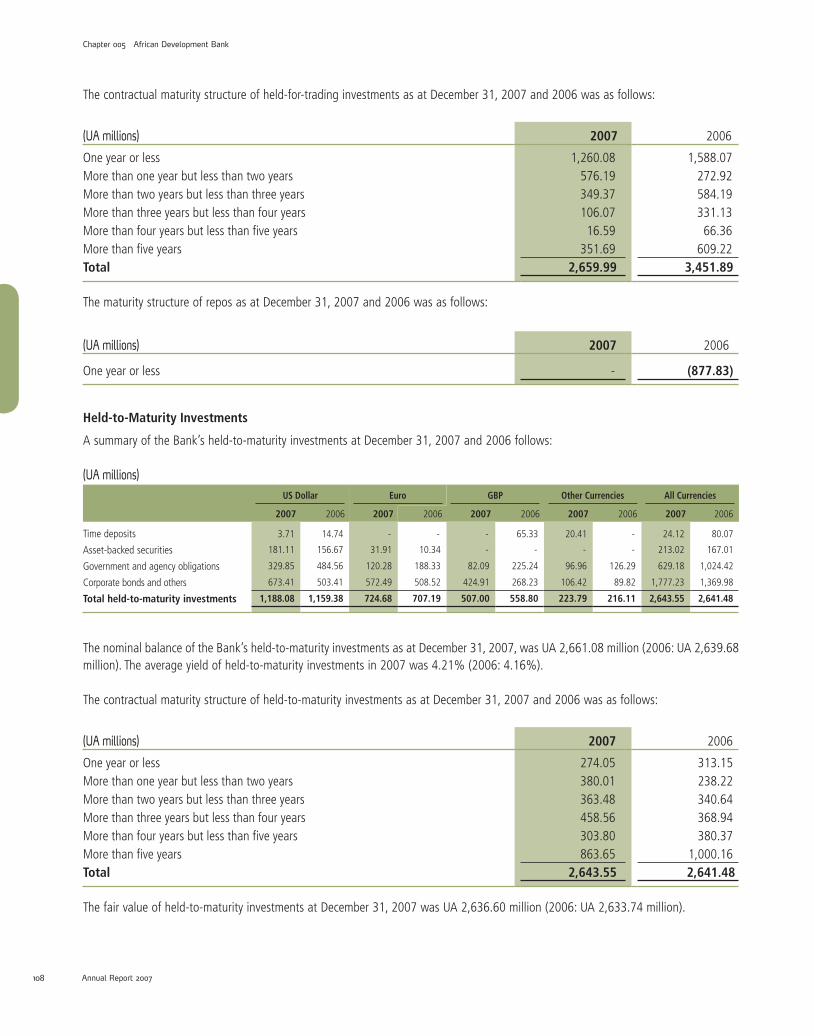
Chapter 005 African Development Bank
Annual Report 2007 109108 109108
The contractual maturity structure of held-for-trading investments as at December 31, 2007 and 2006 was as follows:
(UA millions) 2007 2006
One year or less 1,260.08 1,588.07More than one year but less than two years 576.19 272.92More than two years but less than three years 349.37 584.19More than three years but less than four years 106.07 331.13More than four years but less than five years 16.59 66.36More than five years 351.69 609.22Total 2,659.99 3,451.89
The maturity structure of repos as at December 31, 2007 and 2006 was as follows:
(UA millions) 2007 2006
One year or less - (877.83)
Held-to-Maturity Investments
A summary of the Bank’s held-to-maturity investments at December 31, 2007 and 2006 follows:
(UA millions)US Dollar Euro GBP Other Currencies All Currencies
2007 2006 2007 2006 2007 2006 2007 2006 2007 2006
Time deposits 3.71 14.74 - - - 65.33 20.41 - 24.12 80.07
Asset-backed securities 181.11 156.67 31.91 10.34 - - - - 213.02 167.01
Government and agency obligations 329.85 484.56 120.28 188.33 82.09 225.24 96.96 126.29 629.18 1,024.42
Corporate bonds and others 673.41 503.41 572.49 508.52 424.91 268.23 106.42 89.82 1,777.23 1,369.98
Total held-to-maturity investments 1,188.08 1,159.38 724.68 707.19 507.00 558.80 223.79 216.11 2,643.55 2,641.48
The nominal balance of the Bank’s held-to-maturity investments as at December 31, 2007, was UA 2,661.08 million (2006: UA 2,639.68 million). The average yield of held-to-maturity investments in 2007 was 4.21% (2006: 4.16%).
The contractual maturity structure of held-to-maturity investments as at December 31, 2007 and 2006 was as follows:
(UA millions) 2007 2006
One year or less 274.05 313.15More than one year but less than two years 380.01 238.22More than two years but less than three years 363.48 340.64More than three years but less than four years 458.56 368.94More than four years but less than five years 303.80 380.37More than five years 863.65 1,000.16Total 2,643.55 2,641.48
The fair value of held-to-maturity investments at December 31, 2007 was UA 2,636.60 million (2006: UA 2,633.74 million).

109108
African Development Bank Chapter 005
Annual Report 2007 109108
NOTE G – DERIVATIVE ASSETS AND LIABILITIES
The fair values of derivative financial assets and financial liabilities at December 31, 2007 and 2006 were as follows:
2007 2006(UA thousands) Assets Liabilities Assets Liabilities
Borrowings-related:Cross-currency swaps 318,039 560,594 198,550 394,460Interest rate swaps 74,365 16,697 49,960 54,080Loan swaps 23,635 10,546 23,203 24,834Embedded derivatives 302 962 319 1,189
416,341 588,799 272,032 474,563Investments-related:Asset swaps 42 2,233 1,071 775Macro-hedge swaps 8,955 15 207 6,599
8,997 2,248 1,278 7,374Total 425,338 591,047 273,310 481,937
The notional amounts of derivative financial assets and financial liabilities at December 31, 2007 and 2006 were as follows:
(UA thousands) 2007 2006Borrowings-related: Cross-currency swaps 4,403,494 4,139,026Interest rate swaps 3,542,754 3,772,252Loan swaps 952,633 880,152Embedded derivatives 18,339 18,441
8,917,220 8,809,871Investments-related: Asset swaps 108,456 126,176Macro-hedge swaps 228,911 289,817
337,367 415,993Total 9,254,587 9,225,864
Loan SwapsThe Bank has entered into interest rate swaps to effectively convert fixed rate income on loans in certain currencies into variable rate income.
Administrative Expenses HedgeTo insulate the Bank from possible significant increases in administrative expenses that could arise from an appreciation of the principal currencies of administrative expenditure i.e. EUR, GBP and USD vis-à-vis the UA, the Bank executed forward exchange transactions to economically hedge its administrative expenses. As at December 31, 2007 and 2006, there were no open positions with respect to the forward exchange transactions.

Chapter 005 African Development Bank
Annual Report 2007 111110 111110
NOTE H – NON-NEGOTIABLE INSTRUMENTS ON ACCOUNT OF CAPITAL
Prior to May 1981, all payments in respect of paid-up capital had been made in convertible currencies. However, for the capital increases authorized in May 1979 (but effective December 1982) and May 1981, regional members had the following two options for making their payments:
1) Five (5) equal annual installments, of which at least 50 percent is payable in convertible currency and the remainder in local currency; or
2) Five (5) equal annual installments, of which 20 percent is payable in convertible currency and 80 percent in non-negotiable, non- interest bearing notes. Such notes are redeemable by the Bank solely in convertible currency in installments commencing on the fifth anniversary of the first subscription payment date.
Non-regional members were required to make their payments solely in convertible currencies.
The paid-up portion of subscriptions, authorized in accordance with Board of Governors’ Resolution B/BG/87/11 relating to the Fourth General Capital Increase (GCI-IV), is to be paid as follows:
1) Regional Members – 50 percent in five (5) equal annual installments in cash in freely convertible currency or freely convertible currencies selected by the member state, and 50 percent by the deposit of five non-negotiable, non-interest bearing notes of equal value denominated in Units of Account. Such notes are redeemable by the Bank solely in convertible currency in five (5) equal annual installments commencing on the fifth anniversary of the first subscription payment date.
2) Non-Regional members – five (5) equal annual installments in their national currencies, where such currencies are freely convert-ible or in notes denominated in freely convertible currencies encashable on demand.
Under the Fifth General Capital Increase (GCI-V), there is no distinction in payment arrangements between regional and non-regional members. Each member is required to pay for the paid-up portion of its subscribed shares in eight (8) equal and consecutive annual installments. The first installments shall be paid in cash and in a freely convertible currency. The second to the eighth installments shall be paid in cash or notes encashable on demand in a freely convertible currency.
At December 31, 2007 and 2006, the non-negotiable notes balances were as follows:
(UA thousands) 2007 2006
Balance at January 1 20,383 25,897Net movement for the year (4,998) (5,514)Balance at December 31 15,385 20,383

111110
African Development Bank Chapter 005
Annual Report 2007 111110
NOTE I – LOANS
The Bank’s loan portfolio comprises loans granted to, or guaranteed by borrowing member countries as well as certain other non-sover-eign guaranteed loans. Amounts disbursed on loans are repayable in the currency or currencies disbursed by the Bank or in other freely convertible currency or currencies approved by the Bank. The amount repayable in each of these currencies shall be equal to the amount disbursed in the original currency. Loans are granted for a maximum period of twenty years, including a grace period, which is typically the period of project implementation. Loans are for the purpose of financing development projects and programs, and are not intended for sale. Furthermore, management does not believe there is a comparable secondary market for the type of loans made by the Bank.
The types of loans currently held by the Bank and the rates charged are described below:
Multi-Currency Fixed Rate Loans: For all loans negotiated prior to July 1, 1990, the Bank charges interest at fixed rates.
Multi-Currency Variable Rate Loans: Between July 1, 1990 and September 30, 1997, the Bank offered variable rate loans to its borrowers. The variable interest rate is reset twice a year and is based on the Bank’s own cost of qualified borrowing plus 50 basis points, resulting in a pass-through of average borrowing costs to borrowers.
Conversion of Multi-Currency Pool-Based Variable Rate Loans: Borrowers were offered the choice to convert the disbursed and undisbursed amounts of their multi-currency pool-based variable rate to single currency variable terms or retain the terms of their existing multi-currency pool-based variable rate loans. The conversion dates were October 1, 1997 and March 1, 1998. The other terms and conditions of converted loans remained the same as in the original loan agreements. Since October 1, 1997, the Bank has provided several alternative interest rate mechanisms. In all cases, the applicable rate of interest is the sum of two components, namely, the chosen base rate plus a lending margin.
Single Currency Variable Rate Loans: Since October 1, 1997, the Bank has offered single currency variable rate loans. The vari-able base rate is the average cost of funding a designated pool of borrowings in each currency and is adjusted semi-annually on January 1 and July 1.
Single Currency Floating Rate Loans: Since October 1, 1997, the Bank has offered LIBOR-based single currency floating rate loans. The floating base rate is determined for each currency and reset frequency is based on the Bank’s selected reference interest rate in each market. The Bank’s standard floating base rate is the six (6)-month reference rate (USD LIBOR, JPY LIBOR, EURIBOR and JIBAR) which is reset semi-annually on February 1 and August 1 and is applicable for the six-month period following the reset date.
Single Currency Fixed Rate Loans: Fixed rate loans were reintroduced with effect from October 1997 in the form of single cur-rency fixed rate loans. The fixed rate is computed as the inter-bank swap market rate corresponding to the principal amortization schedule.
Lending Margin: The lending margin is a rate premium expressed as a nominal interest rate added to the Borrower’s chosen base rate to determine the total lending rate. The lending margin determined by the Bank is independent of the base rate chosen, and remains unchanged throughout the life of the loan. The lending margin for sovereign guaranteed loans is fixed at 40 to 50 basis points. For non- sovereign guaranteed loans, the lending margin is based on the Bank’s assessment of the risks inherent in each project.
At December 31, 2007 and 2006, outstanding loans were as follows:
(UA thousands) 2007 2006 Disbursed and outstanding loans 5,540,089 5,290,951Less: accumulated provision for impairment (196,016) (214,180)Balance at December 31 5,344,073 5,076,771

Chapter 005 African Development Bank
Annual Report 2007 113112 113112
Fair Value of LoansAt December 31, 2007 and 2006, the carrying and estimated fair values of loans were as follows:
(UA thousands) 2007 2006
Carrying Value
Estimated Fair Value
Carrying Value
Estimated Fair Value
Fixed rate loans 2,889,112 3,176,494 2,701,177 2,948,806Floating rate loans 1,764,346 1,708,687 1,389,586 1,342,702Variable rate loans 886,631 752,527 1,200,188 1,063,353
5,540,089 5,637,708 5,290,951 5,354,861Accumulated provision for impairment (196,016) - (214,180) - Net loans 5,344,073 5,637,708 5,076,771 5,354,861
Maturity and Currency Composition of Outstanding LoansThe contractual maturity structure of loans as at December 31, 2007 and 2006 was as follows:
(UA millions) 2007 2006Periods Fixed Rate Floating Rate Variable Rate Total TotalOne year or less 392.92 171.89 360.98 925.79 929.31 More than one year but less than two years 180.83 157.86 139.71 478.40 502.71 More than two years but less than three years 171.59 163.38 134.32 469.29 474.86 More than three years but less than four years 171.75 143.92 116.05 431.72 448.34 More than four years but less than five years 181.59 147.55 63.74 392.88 415.63 More than five years 1,790.43 979.75 71.83 2,842.01 2,520.10 Total 2,889.11 1,764.35 886.63 5,540.09 5,290.95
Borrowers may repay loans before their contractual maturity, subject to the terms specified in the loan agreements.

113112
African Development Bank Chapter 005
Annual Report 2007 113112
The currency composition and types of loans as at December 31, 2007 and 2006 were as follows:
(Amounts in UA millions) 2007 2006
Amount % Amount %
Fixed Rate: Multi-Currency Euro 155.83 100.93Japanese Yen 381.32 143.72Pound Sterling 3.09 0.67Swiss Franc 156.38 36.17US Dollar 320.96 192.83Others 0.96 1.54
1,018.54 18.38 475.86 8.99 Single Currency Euro 1,690.28 1,433.01
Japanese Yen 12.67 311.34Pound Sterling - 2.55South African Rand 69.30 54.35Swiss Franc - 129.72US Dollar 98.32 294.00Others - 0.33
1,870.57 33.76 2,225.30 42.07 Floating Rate: Single Currency Euro 517.34 457.46
Japanese Yen 12.27 11.26South African Rand 137.48 153.30US Dollar 1,097.26 767.57
1,764.35 31.85 1,389.59 26.26 Variable Rate: Multi-Currency Euro 175.58 190.88
Japanese Yen 33.99 42.22Swiss Franc 0.95 1.15US Dollar 158.17 181.88Others 0.18 0.24
368.87 6.66 416.37 7.87 Single Currency Euro 214.67 336.53
Japanese Yen 111.92 132.19Swiss Franc 16.22 17.16US Dollar 174.92 297.91Others 0.03 0.04
517.76 9.35 783.83 14.81 Total 5,540.09 100.00 5,290.95 100.00
The weighted-average yield on outstanding loans for the year ended December 31, 2007 was 6.21% (2006: 6.20%).

Chapter 005 African Development Bank
Annual Report 2007 115114 115114
A comparative summary of the currency composition of loans at December 31, 2007 and 2006 follows:
(Amounts in UA millions) 2007 2006
Amount % Amount %
Euro 2,753.69 49.70 2,518.81 47.61Japanese Yen 552.17 9.97 640.72 12.11Pound Sterling 3.09 0.06 3.22 0.06South African Rand 206.78 3.73 207.65 3.92Swiss Franc 173.55 3.13 184.20 3.48US Dollar 1,849.64 33.39 1,734.19 32.78Others 1.17 0.02 2.16 0.04Total 5,540.09 100.00 5,290.95 100.00
Accrued Income and Charges Receivables on LoansThe accrued income and charges receivable on loans as at December 31, 2007 and 2006 were as follows:
(UA thousands) 2007 2006 Accrued income and charges receivable on loans 435,850 455,523Less: accumulated provision for impairment (168,701) (222,588)Balance at December 31 267,149 232,935
Provision for Impairment on Loan Principal and Charges ReceivableAt December 31, 2007, loans with an aggregate principal balance of UA 603.44 million (2006: UA 670.11 million), of which UA 418.22 million (2006: UA 418.59 million) was overdue, were considered to be impaired. The gross amounts of loans and charges receivable that were impaired and the cumulative impairment on them at December 31, 2007 and 2006 were as follows:
(UA thousands) 2007 2006Outstanding balance on impaired loans 603,437 670,111Less: accumulated provision for impairment (196,016) (214,180)Net balance on impaired loans 407,421 455,931
Charges receivable and accrued income on impaired loans 261,895 330,103Less: accumulated provision for impairment (168,701) (222,588)Net charges receivable and accrued income on impaired loans 93,194 107,515

115114
African Development Bank Chapter 005
Annual Report 2007 115114
The movements in the accumulated provision for impairment on outstanding loan principal for the years ended December 31, 2007 and 2006 were as follows:
(UA thousands) 2007 2006 Balance at January 1 214,180 194,613Provision for impairment on loan principal for the year (17,453) 22,566Translation effects (711) (2,999)Balance at December 31 196,016 214,180
Provision for loan impairment included those relating to private sector loans. During the year ended December 31, 2007, a write-back of provision on private sector loans of UA 2.66 million (2006: charge of UA 0.13 million) were made. The accumulated provisions on private sector loans at December 31, 2007 amounted to UA 12.13 million (2006: UA 15.40 million).
The movements in the accumulated provision for impairment on loan interest and charges receivable for the years ended December 31, 2007 and 2006 were as follows:
(UA thousands) 2007 2006 Balance at January 1 222,588 197,764Provision for impairment on loan interest and charges for the year (52,503) 29,120Translation effects (1,384) (4,296)Balance at December 31 168,701 222,588
GuaranteesThe Bank may enter into special irrevocable commitments to pay amounts to the borrowers or other parties for goods and services to be financed under loan agreements. At December 31, 2007, irrevocable reimbursement guarantees issued by the Bank to commercial banks on undisbursed loans amounted to UA 1.27 million (2006: UA 8.09 million).
Also, the Bank may provide guarantees for securities issued by an entity eligible for the Bank’s loans. Guarantees are regarded as out-standing when the borrower incurs the underlying financial obligation and are called when a guaranteed party demands payment under the guarantee. Guarantees represent potential risk to the Bank if the payments guaranteed for an entity are not made. At December 31, 2007 and 2006, the Bank had no outstanding guarantee to any entity.

Chapter 005 African Development Bank
Annual Report 2007 117116 117116
NOTE J – EQUITY PARTICIPATIONS
Investment in Associate: ADFThe ADF was established in 1972 as an international institution to assist the Bank in contributing to the economic and social develop-ment of African countries, to promote co-operation and increased international trade particularly among the African countries, and to provide financing on highly concessional terms for such purposes. The Fund’s original subscriptions were provided by the Bank and the original State Participants to the ADF Agreement, and State Participants acceding to the Agreement since the original signing date. Thereafter, further subscriptions were received from participants in the form of Special General Increases and General Replenishments.
The ADF has a 12-member Board of Directors, made up of 6 members selected by the African Development Bank and 6 members selected by State Participants. The Fund’s Board of Directors reports to the Board of Governors made up of representatives of the State Participants and the ADB. The President of the Bank is the ex-officio President of the Fund.
To carry out its functions, the Fund utilizes the offices, staff, organization, services and facilities of the Bank, for which it pays a share of the administrative expenses. The share of administrative expenses paid by the Fund to the Bank is calculated annually on the basis of a cost-sharing formula, approved by the Board of Directors, which is driven in large part by the number of programs and projects executed during the year. Based on the cost-sharing formula, the share of administrative expenses incurred by ADF for the year ended December 31, 2007 amounted to UA 135.85 million (2006: UA 114.56 million), representing 73.06 percent (2006: 71.39 percent) of the shareable administrative expenses incurred by the Bank. The accounts of the ADF are kept separate and distinct from those of the Bank.
Although the ADB by agreement exercises fifty percent (50%) of the voting powers in the ADF, the Agreement establishing the ADF also provides that in the event of termination of the ADF’s operations, the assets of the Fund shall be distributed pro-rata to its participants in proportion to the amounts paid-in by them on account of their subscriptions, after settlement of any outstanding claims against the participants. At December 31, 2007, the Bank’s pro-rata or economic share in ADF was 0.86% (2006: 0.93%).
As a result of the implementation in 2006 of the Multilateral Debt Relief Initiative described in note V-2, the net asset value of ADF which is the basis for determining the value of the Banks investment in the Fund continue to decline resulting in impairment loss on the Bank’s investment. The net assets of ADF is made up of its net development resources less outstanding demand obligations plus disbursed and outstanding loans excluding balances due from countries that have reached their HIPC completion points and are therefore due for MDRI loan cancellation at the balance sheet date.
Other Equity ParticipationsThe Bank may take equity positions in privately owned productive enterprises and financial intermediaries, public sector companies that are in the process of being privatized or regional and sub-regional institutions. The Bank’s objective in such equity investments is to promote the economic development of its regional member countries and in particular the development of their private sectors. The Bank’s equity participation is also intended to promote efficient use of resources, promoting African participation, playing a catalytic role in attracting other investors and lenders and mobilizing the flow of domestic and external resources to financially viable projects, which also have significant economic merit.
Although the Bank is allowed to take equity positions of up to twenty five percent (25%) the Bank currently holds less than 20% of the total equity capital of each institution in which it participates. The Bank therefore does not seek a controlling interest in the companies in which it invests, but closely monitors its equity investments through Board representation. In accordance with the Board of Governors’ Resolution B/BG/2001/09 of May 29, 2001, total equity investment by the Bank shall not at any time exceed ten percent (10%) of the aggregate amount of the Bank’s paid-up capital and reserves and surplus included in its ordinary capital resources.
Equity investments for which fair value cannot be reliably measured are reported at cost less provision for losses for estimated permanent and lasting decline in value. The investments for which fair value cannot be reliably measured typically relate to sub-regional and national development institutions. Investments in these institutions are made with a long-term development objective, including capacity building. The shares of such institutions are not listed and also not available for sale to the general public. Only member states or institutions

117116
African Development Bank Chapter 005
Annual Report 2007 117116
owned by member states are allowed to subscribe to the shares of these institutions. Provisions for losses on impaired equity investments are included in the income statement.
The Bank’s equity interests at the end of 2007 and 2006 are summarized below:
(Amounts in UA thousands)
InstitutionsYear
Established%
ShareholdingCallableCapital
Carrying Value2007 2006
African Development Fund 1972 0.86 - 111,741 111,741 Accumulated share of loss & impairment on January 1 (48,743) (14,377) Share of profit for the year 479 379 Impairment for the year 360 (34,745)
63,837 62,998 Regional Development Banks (Carried at Cost) Afreximbank 1993 6.70 9,492 6,328 6,647 BDEAC 1975 3.19 2,556 1,704 1,601 BDEGL 1980 - - 1,946 1,946 BOAD 1973 0.31 2,130 710 667 East African Development Bank 1967 11.30 - 4,272 5,000 PTA Bank 1985 5.76 8,606 4,303 5,000
22,784 19,263 20,861 Other Development Institutions (Carried at Cost) Africa - Re 1977 8.00 - 5,512 5,790 K-REP Bank Limited 1997 15.14 - 714 718 National Development Bank of Sierra Leone * - - - - Shelter Afrique 1982 10.00 - 3,164 3,323 Zimbabwe Development Bank 1984 - - 8 9
- 9,398 9,840 Investment Funds (Carried at Fair value)** Acacia Fund Limited 1996 10.40 - 733 808 Access Bank Tanzania Limited 2007 15.80 - 525 - AIG Africa Infrastructure Fund 1999 12.27 462 11,140 14,405 EMP Africa Fund II LLC 2005 13.06 13,385 23,280 5,979 Indian Ocean Regional Fund Limited 1999 16.83 - 79 92 Pan African Infrastructure Development Fund 2007 8.00 31,170 5 - South Africa Infrastructure Fund 1996 14.10 - 17,518 7,049 United Bank for Africa 1961 1.57 - 45,661 - Zambia Venture Capital Fund 1996 16.11 - 144 592
45,017 99,085 28,925 Total 67,801 191,583 122,624 Less: Accumulated provision for impairment - (2,335) (3,505)Net 67,801 189,248 119,119
* Amounts fully disbursed, but the value is less than UA 100, at the applicable exchange rates. ** The cost of equity investment carried at fair value at December 31, 2007 amounted to UA 74.16 million (2006: UA 29.37 million).

Chapter 005 African Development Bank
Annual Report 2007 119118 119118
An analysis of the movement in accumulated provision for impairment on equity participations other than ADF was as follows:
(UA thousands) 2007 2006 Balance at January 1 3,505 3,496Provision for the year (417) -Translation adjustment (753) 9Balance at December 31 2,335 3,505
NOTE K – OTHER DEBT SECURITIES
The Bank may invest in certain debt instruments issued by entities in its Regional Member Countries (RMC) for the purpose of financing development projects and programs. Such investments are classified as available-for-sale.
The fair value of “Other debt securities” at December 31, 2007 and 2006 was as follows:
(UA thousands) 2007 2006Investment in debt instruments issued in RMC 94,622 -
The nominal value of the securities outstanding as at December 31, 2007, was UA 92.92 million.

119118
African Development Bank Chapter 005
Annual Report 2007 119118
NOTE L – PROPERTY, EQUIPMENT AND INTANGIBLE ASSETS
(UA thousands)
2007
Property and EquipmentIntangible
Assets Grand Total
LandBuilding and
Improvements
Furniture, Fixtures &
Fittings
Equipment & Motor Vehicles
Total Property & Equipment
Computer Software
Property, Equipment
& Intangible Assets
Cost:
Balance at January 1 141 22,779 7,256 38,575 68,751 17,982 86,733
Additions during the year - 64 1,783 2,769 4,616 887 5,503
Disposals during the year - - (41) (1,822) (1,863) - (1,863)
Balance at December 31 141 22,843 8,998 39,522 71,504 18,869 90,373
Accumulated Depreciation:
Balance at January 1 - 21,284 4,927 30,302 56,513 15,979 72,492
Depreciation during the year - 102 1,187 2,887 4,176 1,199 5,375
Disposals during the year - - (41) (1,815) (1,856) - (1,856)
Balance at December 31 - 21,386 6,073 31,374 58,833 17,178 76,011
Net Book Values: December 31, 2007 141 1,457 2,925 8,148 12,671 1,691 14,362
(UA thousands)
2006
Property and EquipmentIntangible
Assets Grand Total
LandBuilding and
Improvements
Furniture, Fixtures &
Fittings
Equipment & Motor Vehicles
Total Property & Equipment
Computer Software
Property, Equipment
& Intangible Assets
Cost:
Balance at January 1 141 22,752 7,337 36,703 66,933 16,517 83,450
Additions during the year - 27 656 1,990 2,673 1,465 4,138
Disposals during the year - - (737) (118) (855) - (855)
Balance at December 31 141 22,779 7,256 38,575 68,751 17,982 86,733
Accumulated Depreciation:
Balance at January 1 - 21,182 4,678 26,579 52,439 14,660 67,099
Depreciation during the year - 102 982 3,830 4,914 1,319 6,233
Disposals during the year - - (733) (107) (840) - (840)
Balance at December 31 - 21,284 4,927 30,302 56,513 15,979 72,492
Net Book Values: December 31, 2006 141 1,495 2,329 8,273 12,238 2,003 14,241
Chapter 005 African Development Bank
Annual Report 2007 121120 121120
Under the Headquarters’ Agreement with the host country, the Bank’s owned buildings in the host country are intended to be used for the purposes of the business of the Bank Group only. The rights on the lands and buildings therefore cannot be transferred to a third party. If the Bank elected to give up the use of the lands and buildings, the properties would have to be surrendered to the host country. At December 31, 2007, the book value of such assets is not significant.
NOTE M – BORROWINGS
It is the Bank’s policy to limit senior borrowing and guarantees chargeable to the Bank’s ordinary capital resources to 80 percent of the callable capital of its non-borrowing members and also to limit the total borrowing represented by both senior and subordinated debt to 80 percent of the total callable capital of all its member countries. At December 31, 2007, total borrowings amounted to UA 6,198.87 million (2006: UA 5,870.47 million) comprising senior debt and subordinated debt amounting to UA 5,530.59 million (2006: UA 5,178.74 million) and UA 668.28 million (2006: UA 691.73 million), respectively. As of the same date, the ratio of senior debt to the non-borrowing members’ callable capital of UA 8,503.17 million (2006: UA 8,533.51 million) was 65.04 percent (2006: 60.69 per-cent). Also at December 31, 2007, the ratio of total outstanding borrowings to the total callable capital of UA 19,341.63 million (2006: UA 19,436.76 million) was 32.05 percent (2006: 30.20 percent). At December 31, 2007, borrowings with embedded callable options amounted to UA 316.50 million (2006: UA 381.05 million). The Bank uses derivatives in its borrowing and liability management activities to take advantage of cost-savings opportunities and to lower its funding costs.
The Bank has entered into cross-currency swap agreements with major international banks through which proceeds from borrowings are converted into a different currency and include a forward exchange contract providing for the future exchange of the two currencies in order to recover the currency converted. The Bank has also entered into interest rate swaps, which transform a floating rate payment obligation in a particular currency into a fixed rate payment obligation or vice-versa.
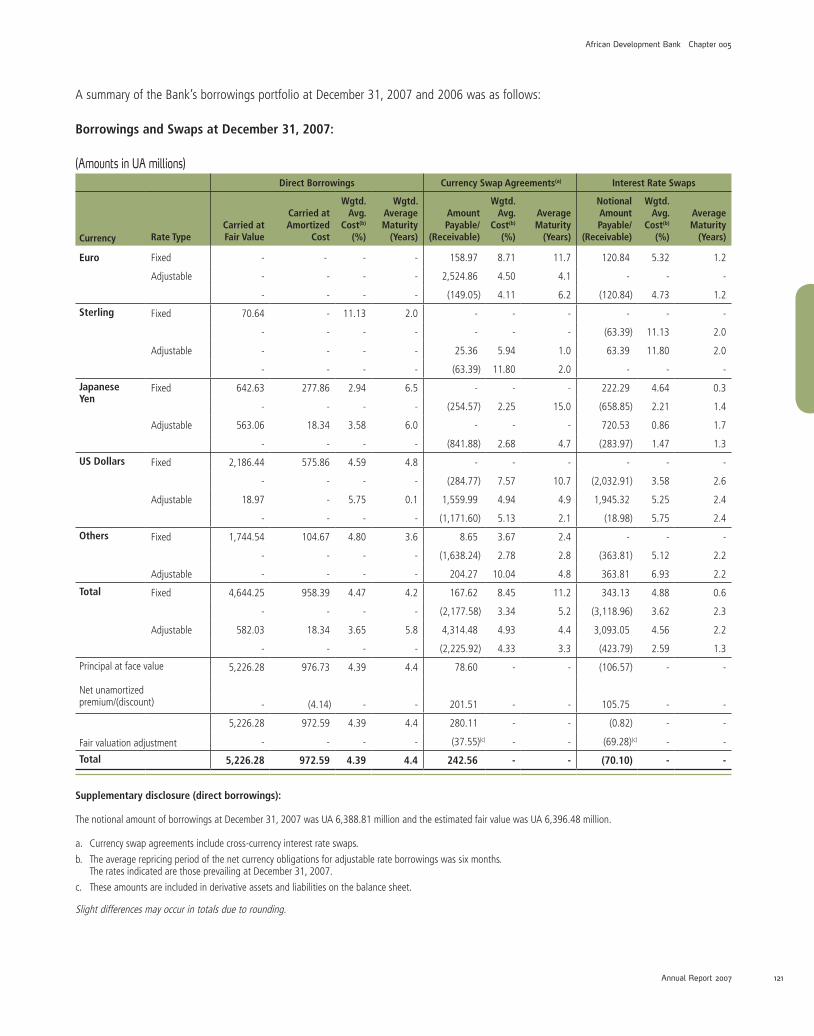
121120
African Development Bank Chapter 005
Annual Report 2007 121120
A summary of the Bank’s borrowings portfolio at December 31, 2007 and 2006 was as follows:
Borrowings and Swaps at December 31, 2007:
(Amounts in UA millions)Direct Borrowings Currency Swap Agreements(a) Interest Rate Swaps
Currency Rate TypeCarried at Fair Value
Carried at Amortized
Cost
Wgtd.Avg.
Cost(b)
(%)
Wgtd.AverageMaturity
(Years)
Amount Payable/
(Receivable)
Wgtd.Avg.
Cost(b)
(%)
AverageMaturity
(Years)
Notional Amount Payable/
(Receivable)
Wgtd.Avg.
Cost(b)
(%)
AverageMaturity
(Years)
Euro Fixed - - - - 158.97 8.71 11.7 120.84 5.32 1.2
Adjustable - - - - 2,524.86 4.50 4.1 - - -
- - - - (149.05) 4.11 6.2 (120.84) 4.73 1.2
Sterling Fixed 70.64 - 11.13 2.0 - - - - - -
- - - - - - - (63.39) 11.13 2.0
Adjustable - - - - 25.36 5.94 1.0 63.39 11.80 2.0
- - - - (63.39) 11.80 2.0 - - -
JapaneseYen
Fixed 642.63 277.86 2.94 6.5 - - - 222.29 4.64 0.3
- - - - (254.57) 2.25 15.0 (658.85) 2.21 1.4
Adjustable 563.06 18.34 3.58 6.0 - - - 720.53 0.86 1.7
- - - - (841.88) 2.68 4.7 (283.97) 1.47 1.3
US Dollars Fixed 2,186.44 575.86 4.59 4.8 - - - - - -
- - - - (284.77) 7.57 10.7 (2,032.91) 3.58 2.6
Adjustable 18.97 - 5.75 0.1 1,559.99 4.94 4.9 1,945.32 5.25 2.4
- - - - (1,171.60) 5.13 2.1 (18.98) 5.75 2.4
Others Fixed 1,744.54 104.67 4.80 3.6 8.65 3.67 2.4 - - -
- - - - (1,638.24) 2.78 2.8 (363.81) 5.12 2.2
Adjustable - - - - 204.27 10.04 4.8 363.81 6.93 2.2
Total Fixed 4,644.25 958.39 4.47 4.2 167.62 8.45 11.2 343.13 4.88 0.6
- - - - (2,177.58) 3.34 5.2 (3,118.96) 3.62 2.3
Adjustable 582.03 18.34 3.65 5.8 4,314.48 4.93 4.4 3,093.05 4.56 2.2
- - - - (2,225.92) 4.33 3.3 (423.79) 2.59 1.3
Principal at face value
Net unamortized premium/(discount)
5,226.28 976.73 4.39 4.4 78.60 - - (106.57) - -
- (4.14) - - 201.51 - - 105.75 - -
Fair valuation adjustment
5,226.28 972.59 4.39 4.4 280.11 - - (0.82) - -
- - - - (37.55)(c) - - (69.28)(c) - -
Total 5,226.28 972.59 4.39 4.4 242.56 - - (70.10) - -
Supplementary disclosure (direct borrowings):
The notional amount of borrowings at December 31, 2007 was UA 6,388.81 million and the estimated fair value was UA 6,396.48 million.
a. Currency swap agreements include cross-currency interest rate swaps.
b. The average repricing period of the net currency obligations for adjustable rate borrowings was six months. The rates indicated are those prevailing at December 31, 2007.
c. These amounts are included in derivative assets and liabilities on the balance sheet.
Slight differences may occur in totals due to rounding.

Chapter 005 African Development Bank
Annual Report 2007 123122 123122
Borrowings and Swaps at December 31, 2006:
(Amounts in UA millions)Direct Borrowings Currency Swap Agreements(a) Interest Rate Swaps
Currency Rate TypeCarried at Fair Value
Carried at Amortized
Cost
Wgtd.Avg.
Cost(b)
(%)
Wgtd.AverageMaturity
(Years)
Amount Payable
(Receivable)
Wgtd.Avg.
Cost(b)
(%)
AverageMaturity
(Years)
Notional Amount Payable
(Receivable)
Wgtd.Avg.
Cost(b)
(%)
AverageMaturity
(Years)
Euro Fixed - - - - 149.39 8.71 12.9 205.13 5.16 1.4
Adjustable 66.59 - 3.79 0.3 2,453.29 3.48 4.6 66.73 3.13 0.3
- - - - (182.48) 3.09 5.7 (271.86) 3.36 1.1
Sterling Fixed 75.41 - 11.13 3.1 - - - - - -
- - - - - - - (65.24) 11.13 3.1
Adjustable - - - - 26.10 4.68 2.6 65.24 10.48 3.1
- - - - (65.24) 10.48 3.1 - - -
JapaneseYen
Fixed 755.65 355.69 3.23 4.7 - - - 223.53 4.64 1.3
- - - - (289.47) 2.69 6.5 (718.41) 2.29 2.3
Adjustable 601.10 18.44 4.08 6.5 86.55 0.35 0.8 780.44 0.38 2.6
- - - - (1,021.49) 2.49 4.6 (285.56) 1.16 2.3
US Dollars Fixed 2,226.72 604.89 4.77 7.7 - - - - - -
- - - - (299.12) 7.57 11.9 (2,135.40) 3.58 3.7
Adjustable 39.67 6.65 5.21 0.3 1,254.24 5.23 4.1 2,069.99 5.45 3.4
- - - - (1,273.79) 5.32 2.8 (46.53) 6.61 0.2
Others Fixed 1,058.51 66.71 3.77 4.6 8.38 3.67 3.4 - - -
- - - - (1,007.44) 3.80 5.2 (249.25) 3.47 2.0
Adjustable - - - - 194.13 8.08 6.2 249.25 3.87 2.0
Total Fixed 4,116.29 1,027.29 4.31 5.5 157.77 8.44 12.3 428.66 4.89 1.4
- - - - (1,596.03) 4.31 6.7 (3,168.30) 3.43 3.2
Adjustable 707.36 25.09 4.13 5.5 4,014.31 4.19 4.4 3,231.65 4.16 3.0
- - - - (2,543.00) 4.16 3.7 (603.95) 2.57 1.6
Principal at face value
Net unamortized premium/(discount)
4,823.65 1,052.38 4.29 5.5 33.05 - - (111.94) - -
- (5.56) - - 175.82 - - 111.10 - -
Fair valuation adjustment
4,823.65 1,046.82 4.29 5.5 208.87 - - (0.84) - -
- - - (12.96)(c) - - 7.46(c) - -
Total 4,823.65 1,046.82 4.29 5.5 195.91 - - 6.62 - -
Supplementary disclosure (direct borrowings):
The notional amount of borrowings at December 31, 2006 was UA 6,088.55 million and the estimated fair value was UA 6,058.45 million.
a. Currency swap agreements include cross-currency interest rate swaps.
b. The average repricing period of the net currency obligations for adjustable rate borrowings was six months. The rates indicated are those prevailing at December 31, 2006.
c. These amounts are included in derivative assets and liabilities on the balance sheet.
Slight differences may occur in totals due to rounding.
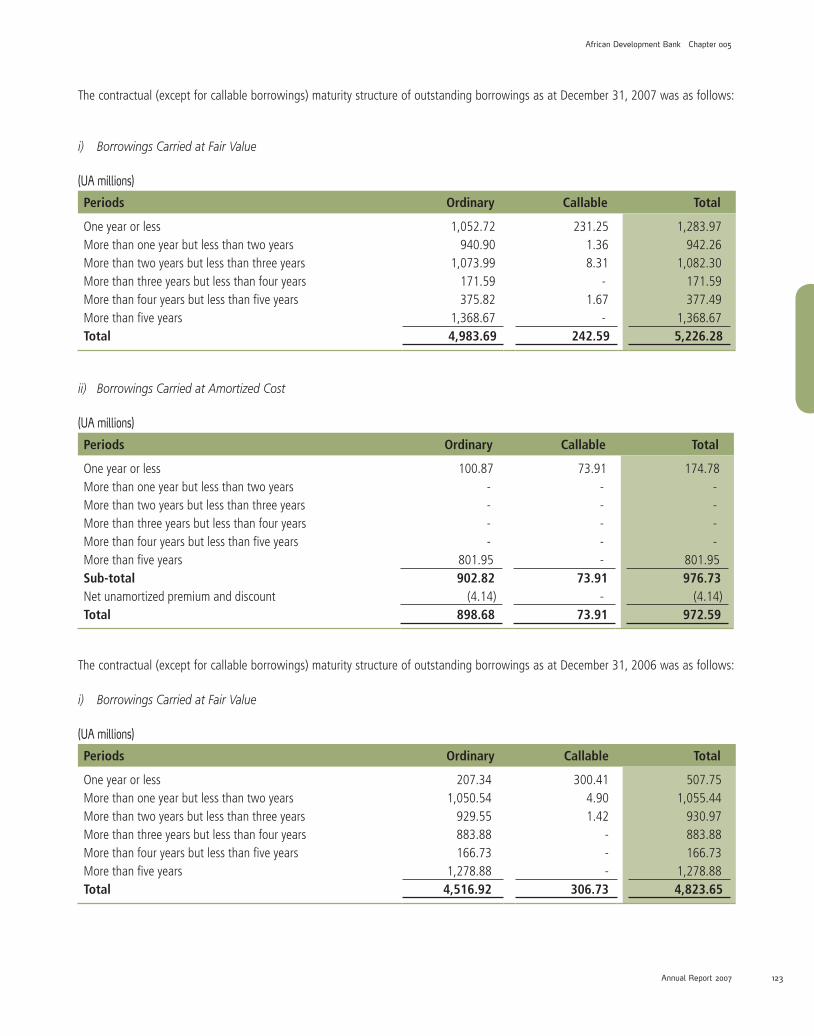
123122
African Development Bank Chapter 005
Annual Report 2007 123122
The contractual (except for callable borrowings) maturity structure of outstanding borrowings as at December 31, 2007 was as follows:
i) BorrowingsCarriedatFairValue
(UA millions)
Periods Ordinary Callable Total
One year or less 1,052.72 231.25 1,283.97 More than one year but less than two years 940.90 1.36 942.26 More than two years but less than three years 1,073.99 8.31 1,082.30 More than three years but less than four years 171.59 - 171.59 More than four years but less than five years 375.82 1.67 377.49 More than five years 1,368.67 - 1,368.67 Total 4,983.69 242.59 5,226.28
ii) BorrowingsCarriedatAmortizedCost
(UA millions)
Periods Ordinary Callable Total
One year or less 100.87 73.91 174.78 More than one year but less than two years - - -More than two years but less than three years - - -More than three years but less than four years - - -More than four years but less than five years - - -More than five years 801.95 - 801.95 Sub-total 902.82 73.91 976.73 Net unamortized premium and discount (4.14) - (4.14)Total 898.68 73.91 972.59
The contractual (except for callable borrowings) maturity structure of outstanding borrowings as at December 31, 2006 was as follows:
i) BorrowingsCarriedatFairValue
(UA millions)
Periods Ordinary Callable Total
One year or less 207.34 300.41 507.75 More than one year but less than two years 1,050.54 4.90 1,055.44 More than two years but less than three years 929.55 1.42 930.97 More than three years but less than four years 883.88 - 883.88 More than four years but less than five years 166.73 - 166.73 More than five years 1,278.88 - 1,278.88 Total 4,516.92 306.73 4,823.65

Chapter 005 African Development Bank
Annual Report 2007 125124 125124
ii) BorrowingsCarriedatAmortizedCost
(UA millions)
Periods Ordinary Callable Total
One year or less 115.93 74.32 190.25 More than one year but less than two years 29.82 - 29.82 More than two years but less than three years - - - More than three years but less than four years - - - More than four years but less than five years - - - More than five years 832.31 - 832.31 Sub-total 978.06 74.32 1,052.38 Net unamortized premium and discount (5.56) - (5.56)Total 972.50 74.32 1,046.82
The fair value of borrowings carried at fair value through profit or loss at December 31, 2007 was UA 5,226.28 million (2006: UA 4,823.65 million). For these borrowings, the amount the Bank will be contractually required to pay at maturity at December 31, 2007 was UA 5,106.32 million (2006: UA 4,748.81 million). The surrender value of callable borrowings is equivalent to the notional amount plus accrued finance charges.
As per Note P, there was a net gain of UA 21.24 million on fair-valued borrowings and related derivatives for the year ended December 31, 2007 (2006: UA 10.67 million). This included a gain of UA 3.00 million which was attributable to changes in the Bank’s credit risk during the year ended December 31, 2007. Fair value changes attributable to changes in the Bank’s credit risk are determined by com-paring the discounted cash flows for the borrowings designated at fair value through profit or loss using the Bank’s credit spread versus LIBOR both at the beginning and end of the relevant period.
For borrowings designated at fair value through profit or loss at December 31, 2007, the cumulative unrealized fair value losses to date were UA 119.96 million (2006: losses of UA 74.64 million).
NOTE N – EQUITY
Equity is composed of capital and reserves. These are further detailed as follows:
CapitalCapital includes subscriptions paid-in by member countries and cumulative exchange adjustments on subscriptions (CEAS). The Bank is not exposed to any externally imposed capital requirements.
Subscriptions Paid InSubscriptions to the capital stock of the Bank are made up of the subscription to the initial capital, a voluntary capital increase and five General Capital Increases (GCI). The Fifth General Capital Increase (GCI-V) was approved by the Board of Governors of the Bank on May 29, 1998 and became effective on September 30, 1999 upon ratification by member states and entry into force of the related amend-ments to the Agreements establishing the Bank. The GCI-V increased the authorized capital of the Bank by 35 percent from 1.62 million shares to 2.187 million shares with a par value of UA 10,000 per share. The GCI-V shares, a total of 567,000 shares, are divided into paid-up and callable shares in proportion of six percent (6%) paid-up and ninety-four percent (94%) callable. The GCI-V shares were allocated to the regional and non-regional members such that, when fully subscribed, the regional members shall hold 60 percent of the total stock of the Bank and non-regional members shall hold the balance of 40 percent.
Prior to the GCI-V, subscribed capital was divided into paid-up capital and callable capital in the proportion of 1 to 7. With the GCI-V, the authorized capital stock of the Bank consists of 10.81 percent paid-up shares and 89.19 percent callable shares.
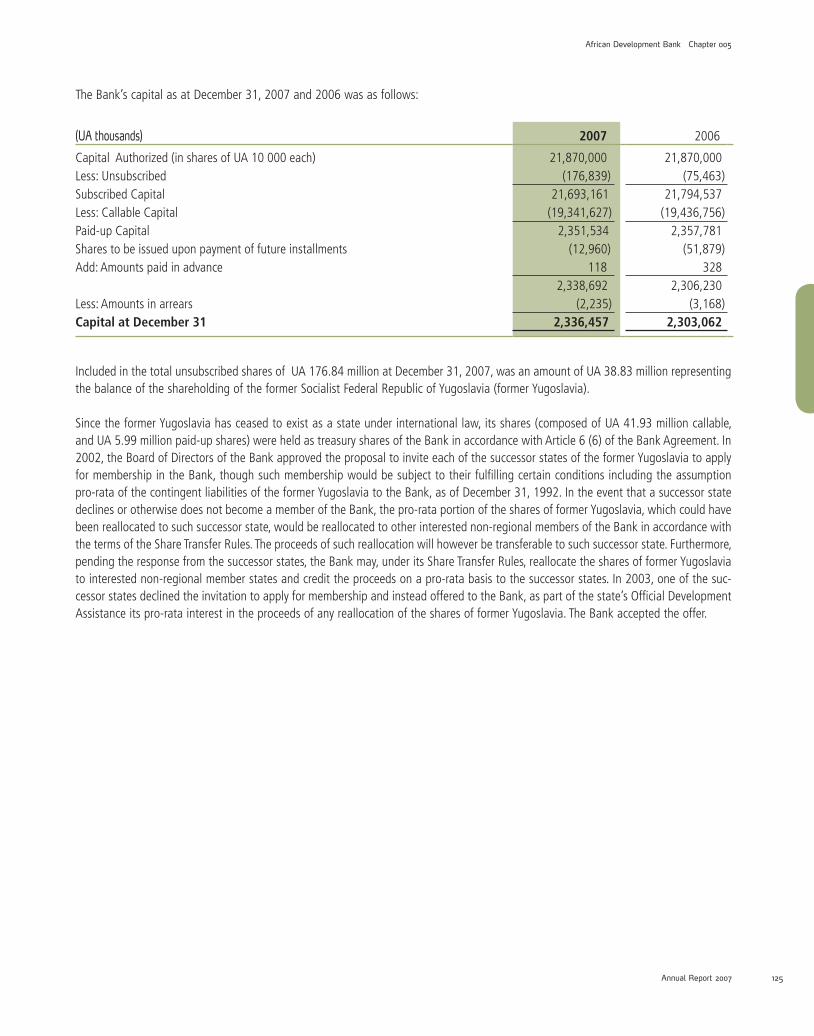
125124
African Development Bank Chapter 005
Annual Report 2007 125124
The Bank’s capital as at December 31, 2007 and 2006 was as follows:
(UA thousands) 2007 2006
Capital Authorized (in shares of UA 10 000 each) 21,870,000 21,870,000 Less: Unsubscribed (176,839) (75,463)Subscribed Capital 21,693,161 21,794,537 Less: Callable Capital (19,341,627) (19,436,756)Paid-up Capital 2,351,534 2,357,781 Shares to be issued upon payment of future installments (12,960) (51,879)Add: Amounts paid in advance 118 328
2,338,692 2,306,230 Less: Amounts in arrears (2,235) (3,168)Capital at December 31 2,336,457 2,303,062
Included in the total unsubscribed shares of UA 176.84 million at December 31, 2007, was an amount of UA 38.83 million representing the balance of the shareholding of the former Socialist Federal Republic of Yugoslavia (former Yugoslavia).
Since the former Yugoslavia has ceased to exist as a state under international law, its shares (composed of UA 41.93 million callable, and UA 5.99 million paid-up shares) were held as treasury shares of the Bank in accordance with Article 6 (6) of the Bank Agreement. In 2002, the Board of Directors of the Bank approved the proposal to invite each of the successor states of the former Yugoslavia to apply for membership in the Bank, though such membership would be subject to their fulfilling certain conditions including the assumption pro-rata of the contingent liabilities of the former Yugoslavia to the Bank, as of December 31, 1992. In the event that a successor state declines or otherwise does not become a member of the Bank, the pro-rata portion of the shares of former Yugoslavia, which could have been reallocated to such successor state, would be reallocated to other interested non-regional members of the Bank in accordance with the terms of the Share Transfer Rules. The proceeds of such reallocation will however be transferable to such successor state. Furthermore, pending the response from the successor states, the Bank may, under its Share Transfer Rules, reallocate the shares of former Yugoslavia to interested non-regional member states and credit the proceeds on a pro-rata basis to the successor states. In 2003, one of the suc-cessor states declined the invitation to apply for membership and instead offered to the Bank, as part of the state’s Official Development Assistance its pro-rata interest in the proceeds of any reallocation of the shares of former Yugoslavia. The Bank accepted the offer.

Chapter 005 African Development Bank
Annual Report 2007 127126 127126
Subscriptions by member countries and their voting power at December 31, 2007 were as follows:
(Amounts in UA thousands)
MEMBER STATESTotal
Shares
% ofTotal
Shares Amount
Paid Callable Capital
Number of Votes
% of Total Voting Power
1 ALGERIA 83,169 3.836 94,089 737,600 83,793 3.7862 ANGOLA 25,405 1.172 28,837 225,212 26,030 1.1763 BENIN 4,246 0.196 4,817 37,633 4,870 0.2204 BOTSWANA 46,633 2.151 52,925 413,405 47,258 2.1355 BURKINA FASO 9,307 0.429 10,920 82,155 9,932 0.4496 BURUNDI 5,173 0.239 6,465 45,256 5,798 0.2627 CAMEROON 22,588 1.042 25,439 200,371 23,143 1.0468 CAPE VERDE 1,672 0.077 2,090 14,630 2,297 0.1049 CENTRAL AFRICAN REPUBLIC 973 0.045 1,217 8,512 1,598 0.07210 CHAD 1,641 0.076 2,052 14,360 2,266 0.10211 COMOROS 483 0.022 588 4,250 1,093 0.04912 CONGO 9,861 0.455 11,450 87,170 10,266 0.46413 COTE D’IVOIRE 81,008 3.737 101,260 708,820 81,633 3.68914 DEMOCRATIC REPUBLIC OF CONGO 22,740 1.049 28,426 198,975 23,365 1.05615 DJIBOUTI 1,213 0.056 1,517 10,618 1,838 0.08316 EGYPT 111,829 5.158 126,920 991,370 112,454 5.08117 EQUATORIAL GUINEA 3,491 0.161 3,930 30,615 3,807 0.17218 ERITREA 2,003 0.092 2,506 17,522 2,628 0.11919 ETHIOPIA 34,778 1.604 39,470 308,310 35,403 1.60020 GABON 27,229 1.256 32,684 238,255 26,765 1.20921 GAMBIA 3,341 0.154 3,891 29,523 3,966 0.17922 GHANA 49,593 2.287 54,185 441,752 50,217 2.26923 GUINEA 8,868 0.409 10,658 78,031 9,494 0.42924 GUINEA BISSAU 600 0.028 750 5,250 1,225 0.05525 KENYA 31,707 1.462 35,990 281,080 32,332 1.46126 LESOTHO 3,324 0.153 3,773 29,470 3,949 0.17827 LIBERIA 4,230 0.195 5,287 37,017 4,855 0.21928 LIBYA 79,862 3.684 90,643 707,978 80,487 3.63729 MADAGASCAR 14,162 0.653 16,070 125,550 14,787 0.66830 MALAWI 6,472 0.299 8,090 56,630 7,097 0.32131 MALI 9,535 0.440 10,937 84,411 10,161 0.45932 MAURITANIA 3,543 0.163 4,015 31,000 3,838 0.17333 MAURITIUS 14,094 0.650 16,000 124,940 14,719 0.66534 MOROCCO 72,268 3.333 82,020 640,660 72,893 3.29435 MOZAMBIQUE 13,767 0.635 15,636 122,038 14,391 0.65036 NAMIBIA 7,397 0.341 8,400 65,570 8,022 0.36237 NIGER 5,526 0.255 6,908 48,353 6,151 0.27838 NIGERIA 193,131 8.908 221,382 1,709,933 193,756 8.75539 RWANDA 2,965 0.137 3,333 26,310 3,527 0.15940 SAO TOME & PRINCIPE 1,488 0.069 1,864 13,024 2,114 0.09641 SENEGAL 22,344 1.031 25,318 198,132 22,459 1.01542 SEYCHELLES 1,224 0.056 1,501 10,739 1,849 0.08443 SIERRA LEONE 5,298 0.244 6,623 46,362 5,923 0.26844 SOMALIA 1,941 0.090 2,427 16,986 2,566 0.11645 SOUTH AFRICA 98,808 4.558 78,930 909,160 99,433 4.49346 SUDAN 8,830 0.407 11,036 77,257 9,455 0.42747 SWAZILAND 7,241 0.334 8,134 64,280 7,715 0.34948 TANZANIA 17,860 0.824 20,685 157,927 18,486 0.83549 TOGO 3,451 0.158 4,314 30,201 4,077 0.18450 TUNISIA 30,492 1.406 34,610 270,310 31,117 1.40651 UGANDA 11,012 0.508 13,331 96,787 11,637 0.52652 ZAMBIA 26,960 1.244 31,059 238,554 27,211 1.23053 ZIMBABWE 45,028 2.077 54,094 396,188 45,653 2.063
Total Regionals 1,301,802 60.046 1,469,496 11,546,436 1,331,799 60.180
Slight differences may occur in totals due to rounding.

127126
African Development Bank Chapter 005
Annual Report 2007 127126
(Amounts in UA thousands)
MEMBER STATESTotal
Shares
% ofTotal
Shares Amount
Paid Callable Capital
Number of Votes
% of Total Voting Power
Total Regionals 1,301,802 60.046 1,469,496 11,546,436 1,331,799 60.180
54 ARGENTINA 5,846 0.270 6,108 52,364 6,472 0.29255 AUSTRIA 9,707 0.448 9,720 87,350 10,332 0.46756 BELGIUM 13,288 0.613 13,579 119,314 13,914 0.62957 BRAZIL 9,674 0.446 9,700 87,036 10,299 0.46558 CANADA 81,648 3.766 81,750 734,730 82,273 3.71859 CHINA 24,300 1.121 24,330 218,670 24,925 1.12660 DENMARK 25,168 1.161 25,200 226,480 25,793 1.16661 FINLAND 10,627 0.490 10,640 95,630 11,252 0.50862 FRANCE 81,648 3.766 81,750 734,730 82,273 3.71863 GERMANY 89,631 4.134 89,740 806,570 90,256 4.07864 INDIA 4,860 0.224 4,870 43,730 5,485 0.24865 ITALY 52,644 2.428 52,710 473,730 53,269 2.40766 JAPAN 119,400 5.507 119,550 1,074,450 120,025 5.42467 KOREA 9,707 0.448 9,720 87,350 10,332 0.46768 KUWAIT 9,707 0.448 9,720 87,350 10,332 0.46769 NETHERLANDS 18,555 0.856 17,116 168,450 19,180 0.86770 NORWAY 25,168 1.161 25,200 226,480 25,793 1.16671 PORTUGAL 5,205 0.240 5,074 46,980 5,830 0.26372 SAUDI ARABIA 4,212 0.194 4,220 37,900 4,837 0.21973 SPAIN 23,034 1.062 21,870 208,470 23,659 1.06974 SWEDEN 33,592 1.549 33,630 302,290 34,217 1.54675 SWITZERLAND 31,882 1.471 31,920 286,900 32,507 1.46976 UNITED KINGDOM 36,554 1.686 36,600 328,940 37,179 1.68077 UNITED STATES OF AMERICA 140,154 6.465 142,245 1,259,298 140,779 6.361
Total Non-Regionals 866,210 39.954 866,961 7,795,191 881,213 39.820
Grand Total 2,168,012 100.000 2,336,457 19,341,627 2,213,012 100.000
Slight differences may occur in totals due to rounding.
Cumulative Exchange Adjustment on Subscriptions (CEAS)Prior to the fourth General Capital Increase (GCI-IV), payments on the share capital subscribed by the non-regional member countries were fixed in terms of their national currencies. Under GCI-IV, payments by regional and non-regional members in US dollars were fixed at an exchange rate of 1 UA = US$ 1.20635. As a result of these practices, losses or gains could arise from converting these currencies to UA when received. Such conversion differences are reported in the Cumulative Exchange Adjustment on Subscriptions account.
At December 31, 2007 and 2006, the Cumulative Exchange Adjustment on Subscriptions was as follows:
(UA thousands) 2007 2006
Balance at January 1 155,742 151,759Net conversion losses on subscriptions 4,333 3,983Balance at December 31 160,075 155,742
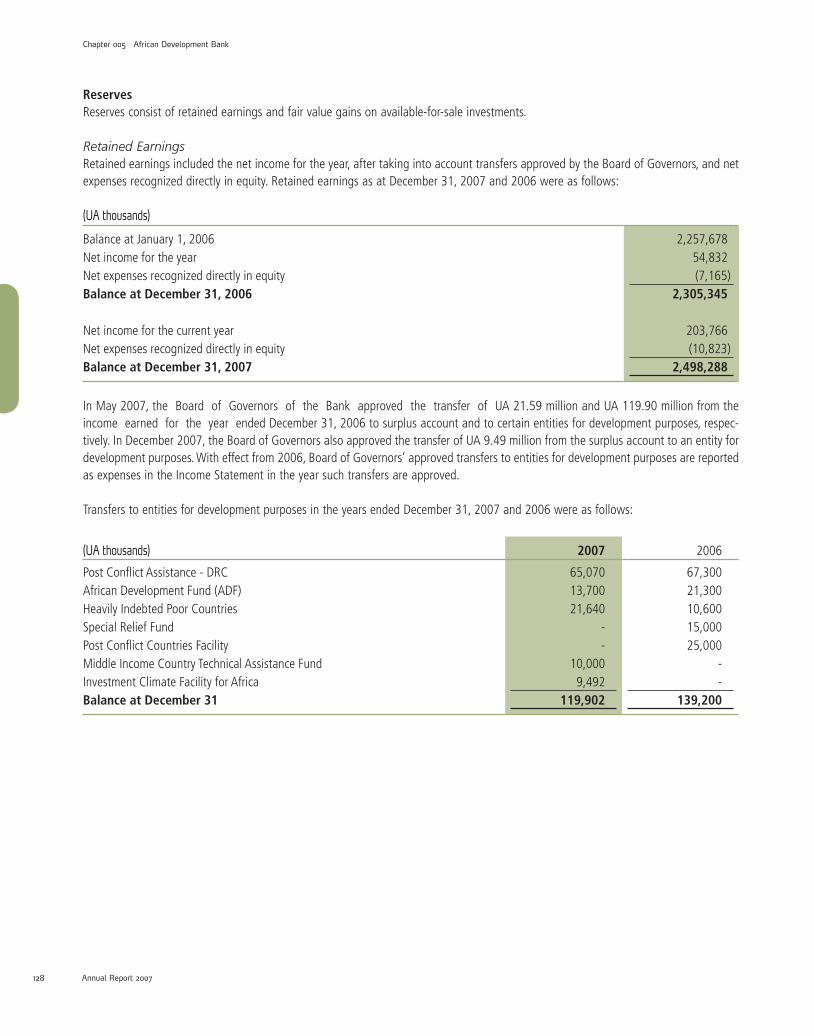
Chapter 005 African Development Bank
Annual Report 2007 129128 129128
ReservesReserves consist of retained earnings and fair value gains on available-for-sale investments.
RetainedEarningsRetained earnings included the net income for the year, after taking into account transfers approved by the Board of Governors, and net expenses recognized directly in equity. Retained earnings as at December 31, 2007 and 2006 were as follows:
(UA thousands)
Balance at January 1, 2006 2,257,678 Net income for the year 54,832Net expenses recognized directly in equity (7,165)Balance at December 31, 2006 2,305,345
Net income for the current year 203,766 Net expenses recognized directly in equity (10,823)Balance at December 31, 2007 2,498,288
In May 2007, the Board of Governors of the Bank approved the transfer of UA 21.59 million and UA 119.90 million from the income earned for the year ended December 31, 2006 to surplus account and to certain entities for development purposes, respec-tively. In December 2007, the Board of Governors also approved the transfer of UA 9.49 million from the surplus account to an entity for development purposes. With effect from 2006, Board of Governors’ approved transfers to entities for development purposes are reported as expenses in the Income Statement in the year such transfers are approved.
Transfers to entities for development purposes in the years ended December 31, 2007 and 2006 were as follows:
(UA thousands) 2007 2006
Post Conflict Assistance - DRC 65,070 67,300 African Development Fund (ADF) 13,700 21,300 Heavily Indebted Poor Countries 21,640 10,600 Special Relief Fund - 15,000 Post Conflict Countries Facility - 25,000 Middle Income Country Technical Assistance Fund 10,000 - Investment Climate Facility for Africa 9,492 -Balance at December 31 119,902 139,200

129128
African Development Bank Chapter 005
Annual Report 2007 129128
FairValueGainsonAvailable-for-SaleInvestmentsAt December 31, 2007 and 2006, the fair value gains on available-for-sale investments were as follows:
(UA thousands) 2007 2006
Balance at January 1 136 8,710Net gain/(loss) for the year 33,374 (8,574)Balance at December 31 33,510 136
NOTE O – INCOME FROM LOANS AND INVESTMENTS AND RELATED DERIVATIVES
Income from Loans Income from loans for the years ended December 31, 2007 and 2006 was as follows:
(UA thousands) 2007 2006
Interest income on loans not impaired 300,678 284,769Interest income on impaired loans 36,511 38,687Commitment charges 3,432 3,848Statutory commission 1,324 1,723Total 341,945 329,027
Income from Investments and Related Derivatives Income from investments for the years ended December 31, 2007 and 2006 was as follows:
(UA thousands) 2007 2006
Interest income 238,951 214,989
Realized and unrealized fair value losses (554) (1,165)
Total 238,397 213,824
Total interest income on investment at amortized cost for the year ended December 31, 2007 was UA 123.51 million (2006: UA 106.22 million).
NOTE P – BORROWING EXPENSES
Interest and Amortized Issuance CostsInterest and amortized issuance costs on borrowings for the years ended December 31, 2007 and 2006 were as follows:
(UA thousands) 2007 2006
Interest cost 264,690 242,477
Amortization of issuance costs 3,333 2,936
Total 268,023 245,413

Chapter 005 African Development Bank
Annual Report 2007 131130 131130
Total interest expense for financial liabilities not at fair value through profit or loss for the year ended December 31, 2007 was UA 65.13 million (2006: UA 76.38 million).
Net Interest on Borrowing-Related Derivatives Net interest on borrowing-related derivatives for the years ended December 31, 2007 and 2006 was as follows:
(UA thousands) 2007 2006
Interest on derivatives payable 410,714 322,500
Interest on derivatives receivable (348,008) (287,363)
Total 62,706 35,137
Unrealized Gain on Fair-Valued Borrowings and Related Derivatives Unrealized gain on fair-valued borrowings and related derivatives for the years ended December 31, 2007 and 2006 was as follows:
(UA thousands) 2007 2006
Fair-valued borrowings (45,315) 48,799
Cross-currency swaps 10,628 (25,780)
Interest rate swaps 55,926 (12,347)
Total 21,239 10,672
Unrealized Gain on Derivatives on Non-Fair Valued Borrowings and Others Unrealized net gain on derivative on non-fair valued borrowings and others for the years ended December 31, 2007 and 2006 was as follows:
(UA thousands) 2007 2006
Interest rate swaps 21,876 22,283
Cross-currency swaps 13,958 6,464
Macro hedge swaps (1,269) (8,061)
Embedded derivatives 209 381
Total 34,774 21,067
NOTE Q – ADMINISTRATIVE EXPENSES
Total administrative expenses relate to expenses incurred on behalf of the ADF, the NTF and for the operations of the Bank itself. The ADF and NTF reimburse the Bank for their share of the total administrative expenses, based on an agreed-upon cost-sharing formula, which is driven by certain selected indicators of operational activity for operational expenses and relative balance sheet sizes for non-operational expenses. However, the expenses allocated to the NTF shall not exceed 20 percent of the NTF’s gross income.

131130
African Development Bank Chapter 005
Annual Report 2007 131130
Administrative expenses comprised the following:
(UA thousands) 2007 2006
Personnel expenses 141,086 123,234
Other general expenses 39,567 31,106
Total 180,653 154,340
Reimbursable by ADF (135,848) (114,561)
Reimbursable by NTF (2,587) (2,920)
Net 42,218 36,859
Included in general administrative expenses is an amount of UA 4.65 million (2006: UA 3.91 million) incurred under operating lease agreements for offices in Tunisia and in certain other regional member countries.
At the balance sheet date, the Bank had outstanding commitments under operating leases which fall due as follows:
(UA thousands) 2007 2006
Within one year 3,945 3,941
In the second to fifth years inclusive 1,155 2,285
Total 5,100 6,226
Leases are generally negotiated for an average term of one (1) to three (3) years and rentals are fixed for an average of one (1) year. Leases may be extended for periods that are no longer than the original term of the leases.
NOTE R – EMPLOYEE BENEFITS
Staff Retirement PlanThe Staff Retirement Plan (SRP), a defined benefit plan established under Board of Governors’ Resolution 05-89 of May 30, 1989, became effective on December 31, 1989, following the termination of the Staff Provident Fund. Every person employed by the Bank on a full-time basis, as defined in the Bank’s employment policies, is eligible to participate in the SRP, upon completion of 6 months service without interruption of more than 30 days.
The SRP is administered as a separate fund by a committee of trustees appointed by the Bank on behalf of its employees. In November 2004, the Board of Directors of the Bank approved certain revisions to the SRP, including simplification of the calculation of the employee contribution rate, more explicit reference to the Bank’s residual responsibility and rights as the SRP sponsor, changes in survivor child benefits and an increase in the pension accumulation rate from 2 percent to 2.5 percent for each year of service. The past service cost associated with these changes amounted to UA 1.64 million and has been recorded in 2004. Also, new members from the local field offices of the Bank joined the Plan in 2007 and the associated past service cost of UA 1.07 million were reported in the 2007 financial statements. Under the revised SRP, employees contribute at a rate of 9 percent of regular salary. A tax factor included in the basis for the determination of contribution in the previous SRP has been eliminated. The Bank typically contributes twice the employee contribution, but may vary such contribution based on the results of annual actuarial valuations.
All contributions to the SRP are irrevocable and are held by the Bank separately in a retirement fund to be used in accordance with the provisions of the SRP. Neither the contributions nor any income thereon shall be used for or diverted to purposes other than the exclu-sive benefit of active and retired participants or their beneficiaries or estates, or to the satisfaction of the SRP’s liabilities. At December 31, 2007, virtually all of the SRP’s investments were under external management and these were invested in indexed funds, with the following objectives: a) Equity portfolio – to track as closely as possible, the returns of the Morgan Stanley Capital International World

Chapter 005 African Development Bank
Annual Report 2007 133132 133132
Index as well as hedging the currency exposure of the SRP’s anticipated future liabilities; b) Bond portfolio – to track as closely as pos-sible, the returns of the Citigroup World Government Bond Index as well as hedge the currency exposure of the SRP’s anticipated future liabilities.
Medical Benefit PlanThe Medical Benefit Plan (MBP) was created under the Board of Directors’ resolution B/BD/2002/17 and F/BD/2002/18 of July 17, 2002 and became effective on January 1, 2003. Under the MBP, all plan members including existing staff or retirees contribute a percentage of their salary or pension while the Bank also contributes twice the total staff contribution towards the financing of the MBP. Contribution rates by staff members and retirees, which are based on marital status and number of eligible children, range between 0.70 percent to a maximum of 3.10 percent of salary or pension. An MBP board, composed of selected officers of the Bank and representatives of retirees and the staff association, oversees the management and activities of the MBP. The contributions from the Bank, staff and retirees are deposited in a trust account. In accordance with the directive establishing the Plan, all Plan members including staff and retirees are eligible as beneficiaries for making claims for medical services provided to them and their recognized dependants.
In accordance with IAS 19, and based on actuarial valuations, the pension and post employment medical benefit expenses for 2007 and 2006 for the Bank, the ADF and the NTF combined (the Bank Group) comprised the following:
Staff Retirement Plan Medical Benefit Plan
(UA millions) 2007 2006 2007 2006
Current service cost – gross 17.57 16.56 4.03 3.87
Less: estimated employee contributions (5.66) (5.05) (1.02) (0.97)
Net current service cost 11.91 11.51 3.01 2.90
Interest cost 11.53 9.39 2.12 2.07
Expected return on plan assets (12.65) (10.44) (0.40) (0.27)
Past service cost 1.07 - - -Expense for the year 11.86 10.46 4.73 4.70
At December 31, 2007, the Bank group’s liability to the SRP and the post-employment aspect of the MBP amounted to UA 7.37 million and UA 40.76 million respectively (2006: UA 34.40 million and UA 35.86 million respectively).

133132
African Development Bank Chapter 005
Annual Report 2007 133132
At December 31, 2007 and 2006 the determination of these liabilities, which are included in “Other accounts payable” on the Balance Sheet is set out below:
Staff Retirement Plan Medical Benefit Plan
(UA millions) 2007 2006 2007 2006
Fair value of plan assets:
Market value of plan assets at beginning of year 199.48 166.76 7.00 4.76
Actual return on assets 10.11 10.92 0.52 0.26
Employer’s contribution 47.44 23.14 2.06 1.99
Plan participants’ contribution 5.66 5.05 1.02 0.99
Benefits paid (7.71) (6.39) (1.56) (1.00)
Market value of plan assets at end of year 254.98 199.48 9.04 7.00
Present value of defined benefit obligation:
Benefit obligation at beginning of year 233.88 200.57 42.86 44.08
Current service cost 11.91 11.51 3.01 2.90
Employee contributions 5.66 5.05 1.02 0.99
Interest cost 11.53 9.39 2.12 2.07
Actuarial loss/(gain) 7.08 13.75 2.35 (6.18)
Benefits paid (7.71) (6.39) (1.56) (1.00)
Benefit obligation at end of year 262.35 233.88 49.80 42.86
Funded status:
Liability recognized on the balance sheet at December 31, representing excess of benefit over plan asset (7.37) (34.40) (40.76) (35.86)
There were no unrecognized past service costs at December 31, 2007 and 2006. The cumulative amounts of actuarial gains and losses recognized in the statement of recognized income and expenses up to December 31, 2007 for the SRP and MBP were a net loss of UA 23.05 million and UA 1.32 million respectively (2006: SRP – UA 14.50 million; MBP – UA 3.55 million).
The following summarizes the funding status of the SRP at the end of the last five fiscal years:
(UA millions) 2007 2006 2005 2004 2003Staff Retirement PlanFair value of Plan assets 254.98 199.48 166.76 140.89 119.81 Present value of defined benefit obligation (262.35) (233.88) (200.57) (177.83) (156.74)Plan deficit (7.37) (34.40) (33.81) (36.94) (36.93)
Experience adjustments on plan assets 0.90 3.45 2.97 1.56 (1.26)Experience adjustments on plan liabilities (23.95) (17.95) (4.20) (1.53) (5.37)Net (23.05) (14.50) (1.23) 0.03 (6.63)

Chapter 005 African Development Bank
Annual Report 2007 135134 135134
The funding status of the Medical Benefit Plan at the end of the last four fiscal years was as follows:
(UA millions) 2007 2006 2005 2004Medical Benefit PlanFair value of plan assets 9.04 7.00 4.76 3.07Present value of defined benefit obligation (49.80) (42.86) (44.08) (37.17)Plan deficit (40.76) (35.86) (39.32) (34.10)
Experience adjustments on plan assets (0.13) (0.01) (2.55) (0.06)Experience adjustments on plan liabilities (1.19) 3.56 - -Net (1.32) 3.55 (2.55) (0.06)
Assumptions used in the latest available actuarial valuations at December 31, 2007 and 2006 were as follows:
Staff Retirement Plan Medical Benefit Plan
(Percentages) 2007 2006 2007 2006
Discount rate 5.625 5.000 5.625 5.000 Expected return on plan assets 6.000 6.000 4.250 5.000Rate of salary increase 4.000 4.000 4.000 4.000 Future pension increase 2.500 2.500
Health care cost growth rate -at end of fiscal year 8.000 8.000 -ultimate health care cost growth rate 5.000 5.000
Year ultimate health cost growth rate reached 2010 2009
The expected return on plan assets is an average of the expected long-term (10 years or more) returns for debt securities and equity securities, weighted by the portfolio allocation. Asset class returns are developed based on historical returns as well as forward-looking expectations. Equity return expectations are generally based upon the sum of expected inflation, expected real earnings growth and expected long-term dividend yield. Bond return expectations are based upon the sum of expected inflation, real bond yield, and risk premium. The discount rate used in determining the benefit obligation is selected by reference to the long-term year-end rates on AAA corporate bonds.
For measurement purposes, the annual growth rate in the per capita cost of covered health care benefits is assumed to decrease ratably between the current period and 2010, with the growth rate assumed to remain at that level thereafter.
No plan assets are invested in any of the Bank’s own financial instruments, nor any property occupied by, or other assets used by the Bank.

135134
African Development Bank Chapter 005
Annual Report 2007 135134
The following table presents the weighted-average asset allocation at December 31, 2007 and 2006 for the Staff Retirement Plan:
(UA thousands) 2007 2006
Debt securities 101,993 79,794Equity securities 127,491 99,742Others 25,498 19,948Total 254,982 199,484
At December 31, 2007 and 2006, the assets of the MBP were invested primarily in time deposits.
The Bank’s estimate of contributions it expects to make to the SRP and the MBP for the year ended December 31, 2008, are UA 13.56 million and UA 2.58 million respectively.
The health care cost growth rate can significantly affect the reported post-retirement benefit income or costs and benefit obligations for the MBP.
The following table shows the effects of a one-percentage-point change in the assumed health care cost growth rate:
1% Increase 1% Decrease
(UA millions) 2007 2006 2007 2006
Effect on total service and interest cost 1.283 1.065 (0.839) (0.900)Effect on post-retirement benefit obligation 10.794 10.242 (8.363) (8.271)
NOTE S – RELATED PARTIES
The following related parties have been identified:The Bank makes or guarantees loans to some of its members who are also its shareholders, and borrows funds from the capital markets in the territories of some of its shareholders. As a multilateral development institution with membership comprising 53 African states and 24 non-African states (the “regional members” and “non-regional members” respectively), subscriptions to the capital of the Bank are made by all its members. All the powers of the Bank are vested in the Board of Governors, which consists of the Governors appointed by each member of the Bank, who exercise the voting power of the appointing member country. Member country subscriptions and voting powers are disclosed in Note N. The Board of Directors, which is composed of eighteen (18) Directors elected by the member countries, is responsible for the conduct of the general operations of the Bank, and for this purpose, exercises all the powers delegated to it by the Board of Governors. The Bank also makes or guarantees loans to certain of the agencies of its regional member countries and to public and private enterprises operating within such countries. Such loans are approved by the Board of Directors.
In addition to its ordinary resources, the Bank administers the resources of other entities under special arrangements. In this regard, the Bank administers the resources of the ADF. Furthermore, the Bank administers various special funds and trust funds, which have purposes that are consistent with its objectives of promoting the economic development and social progress of its regional member countries. In this connection, the Bank administers the NTF as well as certain multilateral and bilateral donor funds in the form of grants.
The ADF was established pursuant to an agreement between the Bank and certain countries. The general operation of the ADF is con-ducted by a 12-member Board of Directors of which 6 members are selected by the Bank. The Bank exercises 50 percent of the voting power in the ADF and the President of the Bank is the ex-officio President of the Fund. To carry out its functions, the ADF utilizes the offices, staff, organization, services and facilities of the Bank, for which it reimburses the Bank based on an agreed cost-sharing formula, driven in large part by the number of programs and projects executed during the year.
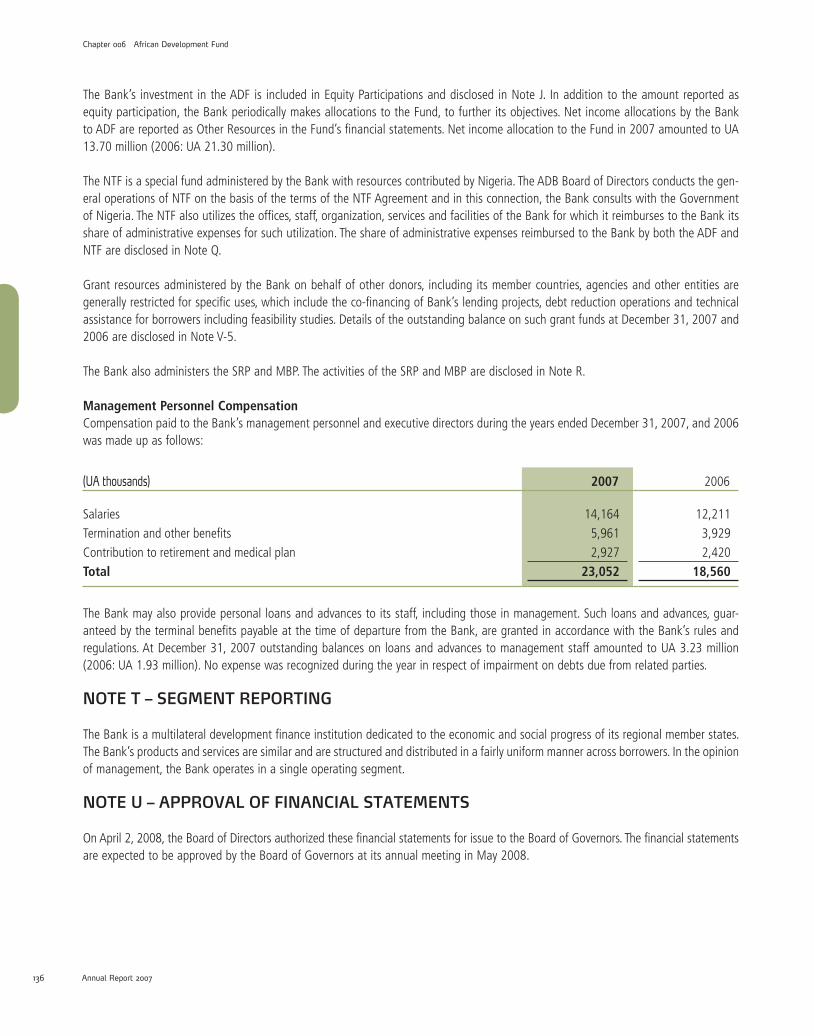
Chapter 005 African Development Bank
Annual Report 2007 137136 137136
Chapter 006 African Development Fund
The Bank’s investment in the ADF is included in Equity Participations and disclosed in Note J. In addition to the amount reported as equity participation, the Bank periodically makes allocations to the Fund, to further its objectives. Net income allocations by the Bank to ADF are reported as Other Resources in the Fund’s financial statements. Net income allocation to the Fund in 2007 amounted to UA 13.70 million (2006: UA 21.30 million).
The NTF is a special fund administered by the Bank with resources contributed by Nigeria. The ADB Board of Directors conducts the gen-eral operations of NTF on the basis of the terms of the NTF Agreement and in this connection, the Bank consults with the Government of Nigeria. The NTF also utilizes the offices, staff, organization, services and facilities of the Bank for which it reimburses to the Bank its share of administrative expenses for such utilization. The share of administrative expenses reimbursed to the Bank by both the ADF and NTF are disclosed in Note Q.
Grant resources administered by the Bank on behalf of other donors, including its member countries, agencies and other entities are generally restricted for specific uses, which include the co-financing of Bank’s lending projects, debt reduction operations and technical assistance for borrowers including feasibility studies. Details of the outstanding balance on such grant funds at December 31, 2007 and 2006 are disclosed in Note V-5.
The Bank also administers the SRP and MBP. The activities of the SRP and MBP are disclosed in Note R.
Management Personnel CompensationCompensation paid to the Bank’s management personnel and executive directors during the years ended December 31, 2007, and 2006 was made up as follows:
(UA thousands) 2007 2006
Salaries 14,164 12,211Termination and other benefits 5,961 3,929Contribution to retirement and medical plan 2,927 2,420Total 23,052 18,560
The Bank may also provide personal loans and advances to its staff, including those in management. Such loans and advances, guar-anteed by the terminal benefits payable at the time of departure from the Bank, are granted in accordance with the Bank’s rules and regulations. At December 31, 2007 outstanding balances on loans and advances to management staff amounted to UA 3.23 million (2006: UA 1.93 million). No expense was recognized during the year in respect of impairment on debts due from related parties.
NOTE T – SEGMENT REPORTING
The Bank is a multilateral development finance institution dedicated to the economic and social progress of its regional member states. The Bank’s products and services are similar and are structured and distributed in a fairly uniform manner across borrowers. In the opinion of management, the Bank operates in a single operating segment.
NOTE U – APPROVAL OF FINANCIAL STATEMENTS
On April 2, 2008, the Board of Directors authorized these financial statements for issue to the Board of Governors. The financial statements are expected to be approved by the Board of Governors at its annual meeting in May 2008.

137136
African Development Bank Chapter 005
137136 Annual Report 2006
African Development Fund Chapter 006
NOTE V – SUPPLEMENTARY DISCLOSURES
NOTE V-1: EXCHANGE RATESThe rates used for translating currencies into Units of Account at December 31, 2007 and 2006 were as follows:
2007 2006
1 UA = SDR = Algerian DinarAngolan Kwanza Botswana PulaBrazilian RealCanadian DollarChinese YuanCFA FrancDanish KronerEgyptian PoundEthiopian BirrEuroGambian DalasiGhanaian Cedi *Guinean FrancIndian RupeeJapanese YenKenyan ShillingKorean WonKuwaiti DinarLibyan DinarMauritian RupeeMoroccan DirhamNigerian NairaNorwegian KronePound SterlingSao Tomé DobraSaudi Arabian RiyalSouth African RandSwedish KronaSwiss FrancTunisian DinarUgandan ShillingUS DollarZimbabwean Dollar
106.161000 119.287000
9.502360 2.797830 1.561440
11.530200 704.144000
8.020210 8.649740
13.304000 1.073460
33.937600 1.424030
8,283.200000 62.277700
179.947000 105.994 000
1,482.590000 0.431408 1.932370
44.588500 12.235300
195.584000 8.550740 0.788780
19,668.400000 5.925930
10.761500 10.208800 1.778570 1.936680
2,727.920000 1.580250
391.005000
107.190000 120.940000
9.090080 3.215210 1.753080
11.747400 749.293000
8.517020 8.474270
13.127200 1.142290
41.391100 13,915.500000
8,283.200000 66.539800
178.948000 105.462000
1,398.490000 0.434622 1.932370
51.656400 12.728400
191.482000 9.410170 0.766377
17,360.200000 5.641490
10.485700 10.339000 1.835820 1.960350
2,726.760000 1.504400
372.130000
* The Ghanaian Cedi was redenominated during 2007.
No representation is made that any currency held by the Bank can be or could have been converted into any other currency at the cross rates resulting from the rates indicated above.

139138 139138
Chapter 006 African Development Fund
Annual Report 2006
NOTE V-2: OTHER DEVELOPMENT ASSISTANCE ACTIVITIES
(i) Democratic Republic of Congo (DRC)In connection with an internationally co-coordinated effort between the Bank, the International Monetary Fund (the IMF), the World Bank and other bilateral and multilateral donors to assist the Democratic Republic of Congo (DRC) in its reconstruction efforts, the Board of Directors on June 26, 2002, approved an arrears clearance plan for the DRC. Under the arrears clearance plan, contributions received from the donor community were used immediately for partial clearance of the arrears owed by the DRC. The residual amount of DRC’s arrears to the Bank and loan amounts not yet due were consolidated into new contractual receivables, such that the present value of the new loans was equal to the present value of the amounts that were owed under the previous contractual terms. The new loans carry the weighted average interest rate of the old loans. In approving the arrears clearance plan, the Board of Directors considered the following factors: a) the arrears clearance plan is part of an internationally coordinated arrangement for the DRC; b) the magnitude of DRC’s arrears to the Bank ruled out conventional solutions; c) the prolonged armed conflict in the DRC created extensive destruction of physical assets, such that the DRC had almost no capacity for servicing its debt; and d) the proposed package would result in a significant improvement in its repayment capacity, if appropriate supporting measures are taken. Furthermore, there was no automatic linkage between the arrears clearance mechanism and the debt relief that may be subsequently provided on the consolidated facility. In June 2004, the DRC reached its decision point under the Heavily Indebted Poor Countries (HIPC) initiative. Consequently, the consolidated facility has since that date benefited from partial debt service relief under HIPC.
A special account, separate from the assets of the Bank, was established for all contributions towards the DRC arrears clearance plan. Such contributions may include allocations of the net income of the Bank that the Board of Governors may from time to time make to the special account, representing the Bank’s contribution to the arrears clearance plan. The amount of such net income allocation is subject to the approval of the Boards of Governors of the Bank, typically occurring during the annual general meeting of the Bank. Consequently, income received on the consolidated DRC loans is recognized in current earnings and is transferred out of reserves to the special account only after the formal approval of such transfer, in whole or in part, by the Board of Governors of the Bank.
(ii) Post-Conflict Countries AssistanceThe Post Conflict Countries’ Fund was established as a framework to assist countries emerging from conflict in their efforts towards re- engagement with the donor community in order to reactivate development assistance and help these countries reach the Heavily Indebted Poor Countries (HIPC) decision point to qualify for debt relief after clearing their loan arrears to the Bank Group. The frame-work entails the setting aside of a pool of resources through a separate facility with allocations from the ADB’s net income, and contributions from the ADF and other private donors. Resources from the facility are provided on a case-by-case basis to genuine post-conflict countries not yet receiving debt relief to fill financing gaps after maximum effort by the post-conflict country to clear its arrears to the Bank Group. In this connection, the Board of Governors by its Resolution B/BG/2004/07 of May 25, 2004, established the Post-Conflict Countries Facility (PCCF) under the administration of the ADF and approved an allocation of UA 45 million from the 2003 net income of the Bank. The Board of Governors also, by its resolution B/BG/2005/05 of May 18, 2005, approved an additional allocation of UA 30 million from the 2004 net income as the second installment of the Bank’s contribution to the facility and by its resolution B/BG/2006/04 of May 17, 2006, the Board of Governors also approved the third and final installment of the Bank’s allocation of UA 25 million from the 2005 net income. By policy, contributions made by ADB to the PCCF are not used to clear the debt owed to the Bank by beneficiary post-conflict countries.
(iii) Heavily Indebted Poor Countries (HIPC) InitiativeThe Bank participates in a multilateral initiative for addressing the debt problems of countries identified as HIPCs. Under this initiative, creditors provide debt relief for eligible countries that demonstrate good policy performance over an extended period to bring their debt burdens to sustainable levels. Under the original HIPC framework, selected loans to eligible beneficiary countries were paid off by the HIPC Trust Fund at a price equivalent to the lower of the net present value of the loans or their nominal values, as calculated using the methodology agreed under the initiatives.
Following the signature of a HIPC debt relief agreement, the relevant loans were paid off at the lower of their net present value or their carrying value. On average, loans in the ADB’s portfolio carry higher interest rates than the present value discount rates applied and therefore the net present value of the loans exceeds the book value. Consequently, affected ADB loans were paid off by the HIPC Trust Fund at book values.

139138
African Development Bank Chapter 005
Annual Report 2007 139138
The HIPC initiative was enhanced in 1999 to provide greater, faster and more poverty-focused debt relief. This was achieved by reduc-ing the eligibility criteria for qualification under the initiative and by commencing debt relief much earlier than under the original framework. Under the enhanced framework, where 33 African countries are eligible, the debt relief is delivered through annual debt service reductions, as well as the release of up to 80 percent of annual debt service obligations as they come due until the total debt relief is provided. In addition, interim financing between the decision and completion points of up to 40 percent of total debt relief is provided whenever possible within a 15-year horizon. At December 31, 2007, the Board of Directors had approved relief for 26 ADB borrowing countries, of which 19 had reached the completion point.
(iv) Multilateral Debt Relief Initiative (MDRI)At the Gleneagles Summit on July 8, 2005, the Group of 8 major industrial countries agreed on a proposal for the ADF, the International Development Association (IDA), and the International Monetary Fund (IMF) to cancel 100 percent of their claims on countries that have reached, or will reach, the completion point under the enhanced HIPC Initiative.
The main objective of the MDRI is to complete the process of debt relief for HIPCs by providing additional resources to help 38 countries worldwide, 33 of which are in Africa, to make progress towards achieving the Millennium Development Goals (MDGs), while simultaneously safeguarding the long-term financing capacity of the ADF and the IDA. The debt cancellation would be delivered by relieving post-completion-point HIPCs’ repayment obligations and adjusting their gross assistance flows downward by the same amount. To maintain the financial integrity of the ADF, donors have committed to make additional contributions to the ADF to match “dollar-for-dollar” the foregone principal and service charge payments.
The MDRI became effective for the ADF on September 1, 2006. As of that date, the ADF wrote down its balance of disbursed and outstanding loans net of HIPC relief by an amount of UA 3.84 billion, with a corresponding decrease as of that date in the ADF’s net assets. Reduction in ADF net assets results in a decrease in the value of the Bank’s investment in the Fund. Subsequent write-down of loan balances is effected as and when other countries reach their HIPC completion point and are declared beneficiaries of MDRI loan cancellation. The reduction in the net asset value of the ADF does not include loans outstanding to MDRI countries that have not reached their HIPC completion points at the end of the year.
NOTE V-3: SPECIAL FUNDS
Under Article 8 of the Agreement Establishing the Bank, the Bank may establish or be entrusted with the administration of special funds. At December 31, 2007 and 2006, the following funds were held separately from those of the ordinary capital resources of the Bank:
(i) The NTF was established under an agreement signed on February 26, 1976 (the Agreement) between the African Development Bank and the Federal Republic of Nigeria. The Agreement stipulates that the NTF shall be in effect for a period of 30 years from the date the Agreement became effective and that the resources of the NTF shall be transferred to Nigeria upon termination. However, the 30-year sunset period may be extended by mutual agreement between the Bank and Nigeria. The terms of the current agreement which terminated on April 25, 2006 have been extended twice with the latest one-year extension up to April 25, 2008. Following an independent review of the operations of the Fund over the current Agreement period, both the Government of Nigeria and the Bank have agreed in principle to renew the NTF Agreement for a period of ten years starting from April 26, 2008. The initial capital of the NTF was Naira 50 million payable in two equal installments of Naira 25 million each, in freely convertible currencies. The first installment, equivalent to US$ 39.90 million, was received by the Bank on July 14, 1976, and payment of the second installment, equivalent to US$ 39.61 million, was made on February 1, 1977.
During May 1981, the Federal Republic of Nigeria announced the replenishment of the NTF with Naira 50 million. The first installment of Naira 35 million (US$ 52.29 million) was paid on October 7, 1981. The second installment of Naira 8 million (US$ 10.87 million) was received on May 4, 1984. The payment of the third installment of Naira 7 million (US$ 7.38 million) was made on September 13, 1985.Following a request by the Government of Nigeria on June 14, 2006, a payment of US$ 200 million (UA 135.74 million) was made to the Government of Nigeria from the resources of the Fund.

Chapter 005 African Development Bank
Annual Report 2007 141140 141140
The resources of the NTF at December 31, 2007 and 2006 are summarized below:
(UA thousands) 2007 2006Contribution received 128,586 128,586Funds generated (net) 269,657 251,201
Adjustment for translation of currencies (124,777) (111,666)
273,466 268,121Represented by:Due from banks 6,331 2,404Investments 190,346 191,760Accrued income and charges receivable on loans 16,708 9,685Accrued interest on investments 520 960Other amounts receivable 177 89Loans outstanding 64,383 64,274
278,465 269,172Less: Current accounts payable (4,999) (1,051)
273,466 268,121
(ii) The Special Relief Fund (for African countries affected by drought) was established by Board of Governors’ Resolution 20-74 to assist African countries affected by unpredictable disasters. The purpose of this fund was subsequently expanded in 1991 to include the provision of assistance, on a grant basis, to research institutions whose research objectives in specified fields are likely to facilitate the Bank’s objective of meeting the needs of regional member countries in those fields. The resources of this Fund consist of contributions by the Bank, the ADF and various member states.
The summary statement of the resources and assets of the Special Relief Fund (for African countries affected by drought) as at December 31, 2007 and 2006 follows:
(UA thousands) 2007 2006
Fund balance 62,448 62,448Funds generated 3,876 3,808Funds allocated to SDA 1 1Less: Relief disbursed (48,931) (46,996)
17,394 19,261Represented by:Due from bank 799 757Investments 16,550 18,466Interest receivable 45 38
17,394 19,261
At December 31, 2007, a total of UA 3.86 million (2006: UA 4.67 million) had been committed but not yet disbursed under the Special Relief Fund.

141140
African Development Bank Chapter 005
Annual Report 2007 141140
NOTE V-4: TRUST FUNDS
The Bank has been entrusted, under Resolutions 11-70, 19-74 and 10-85 of the Board of Governors, with the administration of the Mamoun Beheiry Fund, the Arab Oil Fund, and the Special Emergency Assistance Fund for Drought and Famine in Africa. These funds, held separately from those of the ordinary resources of the Bank, are maintained and accounted for in specific currencies, which are translated into Units of Account at exchange rates prevailing at the end of the year.
(i) The Mamoun Beheiry Fund was established under Board of Governors’ Resolution 11-70 of October 31, 1970, whereby Mr. Mamoun Beheiry, former President of the Bank, agreed to set up a fund, which could be used by the Bank to reward staff members who had demonstrated outstanding performance in fostering the objectives of the Bank.
(ii) The Arab Oil Fund (contribution of Algeria) was established following Board of Governors’ Resolution 19-74 of July 4, 1974. Under a protocol agreement dated November 15, 1974, the Bank received the sum of US$ 20 million from the Government of Algeria to be kept as a Trust Fund from which loans could be granted to member countries affected by high oil prices. On August 11, 1975, an amount of US$ 5.55 million was refunded to Algeria upon request, leaving a balance of US$ 14.45 million, from which loans refundable directly to Algeria have been made. At December 31, 2007, a total of US$ 13.45 million (2006: US$ 13.45 million) had been so repaid.
(iii) The Special Emergency Assistance Fund for Drought and Famine in Africa (SEAF) was established by the 20th Meeting of Heads of State and Government of member countries of the African Union formerly Organization of African Unity (OAU) held in Addis Ababa, Ethiopia, from November 12 to 15, 1984, under Resolution AHG/Res. 133 (XX), with the objective of giving assistance to African member countries affected by drought and famine.

Chapter 005 African Development Bank
Annual Report 2007 143142 143142
The financial highlights of these Trust Funds at December 31, 2007 and 2006 are summarized below:
(UA thousands) 2007 2006i) Mamoun Beheiry Fund
Contribution 152 152Income from investments 242 233
394 385Less: Prize awarded (30) (30) Gift (25) (25)
339 330Represented by:Short-term deposits 316 310Due from banks 17 17Accrued interest 6 3
339 330
ii) Arab Oil Fund (contribution of Algeria)Net contribution 632 665Represented by:Loans disbursed net of repayments 632 665
iii) Special Emergency Assistance Fund for Drought and Famine in AfricaContributions 19,923 20,927Funds generated 5,290 5,331
25,213 26,258Relief granted (20,940) (21,995)
4,273 4,263Represented by:Due from banks 71 68Investments 4,193 4,193Accrued interest 9 2
4,273 4,263
Total Resources & Assets of Trust Funds 5,244 5,258

143142
African Development Bank Chapter 005
Annual Report 2007 143142
NOTE V-5: GRANTS
The Bank administers grants on behalf of donors, including member countries, agencies and other entities. Grant resources are restricted for specific uses, which include the co-financing of the Bank’s lending projects, debt reduction operations, technical assistance for bor-rowers including feasibility studies and project preparation, global and regional programs and research and training programs. These funds are placed in trust and are not included in the assets of the Bank. In accordance with Article 11 of the Agreement establishing the Bank, the accounts of these grants are kept separate from those of the Bank.
The undisbursed balances of the grant resources at December 31, 2007 and 2006 were as follows:
(UA thousands) 2007 2006Africa Water Facility Fund 19,159 16,359AMINA 1,389 1,475AMTA/NAMTA 140 172Austria 993 906Belgium 1,100 2,204Canada 518 278China 45 229Denmark 1,472 1,578Finland 1,648 1,248France 2,957 2,907ICA-Infrastructure Consortium for Africa 222 - ICP -Africa 894 221India 668 945Italy 16,030 4,694Japan (FAPA) 13,376 6,921Korea 792 1,068Multi-donor Water Partnership Program 2,305 1,828Nepad Infrastructure 4,745 2,596Nordic 1,086 1,108Norway 756 1,000The Netherlands 1,877 2,398The Nigeria Technical Cooperation Fund 16,862 16,980The United Kingdom 1,123 1,322RWSSI 47,848 21,145Spain 392 354Sweden 669 988Switzerland 280 272Others 250 158Total 139,596 91,354

Chapter 005 African Development Bank
Annual Report 2007 145144 145144
African Development BankTemporary Relocation Agency15, Avenue du Ghana1002 Tunis BelvédèreTunisie
Independent Auditors’ Report to the Board of Governors of the African Development BankYear ended 31 December 2007
We have audited the accompanying financial statements of the African Development Bank (‘‘the Bank’’) which comprise the balance sheet as at 31 December 2007 and the income statement, the statement of recognized income and expense and cash flow statement for the year then ended, and a summary of significant accounting policies and other explanatory notes as set out in notes A to V.
The financial statements have been prepared under the accounting policies set out therein, for the purpose of submitting approved and audited financial statements to the Board of Governors as required by Article 32(d) of the Agreement establishing the Bank. This report is made solely to the Bank’s Board of Governors, as a body, in accordance with Article 32(d) of the Agreement Establishing the Bank. Our audit work has been undertaken so that we might state to the Bank’s members those matters we are required to state to them in an auditors’ report and for no other purpose. To the fullest extent permitted by law, we do not accept or assume responsibility to anyone other than the Bank and the Bank’s members as a body, for our audit work, for this report, or for the opinions we have formed.
Management’s Responsibility for the Financial StatementsManagement is responsible for the preparation and fair presentation of these financial statements in accordance with International Finan-cial Reporting Standards, and in the manner required by the Agreement Establishing the Bank. This responsibility includes: designing, implementing and maintaining internal control relevant to the preparation and fair presentation of financial statements that are free from material misstatements, whether due to fraud or error; selecting and applying appropriate accounting policies; and making accounting estimates that are reasonable in the circumstances.
Auditors’ ResponsibilityOur responsibility is to express an opinion on these financial statements based on our audit. We conducted our audit in accordance with International Standards on Auditing. Those standards require that we comply with relevant ethical requirements and plan and perform the audit to obtain reasonable assurance whether the financial statements are free of material misstatement.
An audit involves performing procedures to obtain audit evidence about the amounts and disclosures in the financial statements. The procedures selected depend on our judgment, including the assessment of the risks of material misstatement of the financial statements,
Téléphone: +33 (0)1 55 68 68 68Télécopie: +33 (0)1 55 68 73 00Site internet: www.kpmg.fr
KPMG S.A. cabinet français membre de KPMG International.une coopérative de droit suisse.
Société anonyme d’expertisecomptable - commissariat auxcomptes à directoire et conseilde surveillance.Inscrite au Tableau de l’ordreà Paris sous le no 14-30080101et à la Compagnie desCommissaires aux Comptesde Versailles.
Siège social :KPMG S.A.Immeuble le Palatin3, cours du Triangle92939 Paris La Défense CedexCapital : 5 497 100 €Code APE 741 C775726417 R.C.S. NanterreTVA Union EuropéenneFR 77 775 726 417
1, cours Valmy92923 Paris La Défense CedexFrance
KPMG Audit

145144
African Development Bank Chapter 005
Annual Report 2007 145144
whether due to fraud or error. In making those risk assessments, we consider internal control relevant to the entity’s preparation and fair presentation of the financial statements in order to design audit procedures that are appropriate in the circumstances, but not for the pur-pose of expressing an opinion on the effectiveness of the entity’s internal control. An audit also includes evaluating the appropriateness of accounting principles used and the reasonableness of accounting estimates made by management, as well as evaluating the overall presentation of the financial statements.
We believe that the audit evidence we have obtained is sufficient and appropriate to provide a basis for our opinion.
Opinion In our opinion, the financial statements present fairly, in all material respects, the financial position of the Bank as at 31 December 2007, and of its financial performance and its cash flows for the year then ended in accordance with International Financial Reporting Standards.
Emphasis of MatterWithout qualifying our opinion we draw attention to Note C which highlights the effect of new and revised international financial re-porting standards. For the years ended 31 December 2005 and 2006 the independent auditor issued a qualified opinion for the financial statements because International Financial Reporting Standard IAS 32, “Financial Instruments: Disclosure and Presentation”, required that the Bank’s, member countries’ capital subscriptions be reclassified in the Bank’s financial statements as financial liabilities instead of equity.
On 14 February 2008 the International Accounting Standards Board (IASB), issued amendments to IAS1 and IAS32. The Bank’s member countries’ capital subscriptions are puttable financial instruments that meet the requirements for equity classification under the amended standards. Prior to the amendments, the Bank also classified these financial instruments as equity. The amendments were issued after the balance sheet date, but before the approval of the financial statements. The Bank has opted to early adopt the amended standards which had no effects on the Bank’s financial statements.
Paris La Défense, 2nd April 2008
KPMG Audit A division of KPMG S.A.
Pascal Brouard Partner
African Development BankIndependent Auditors’ Report to the Board of Governors
of the African Development Bank
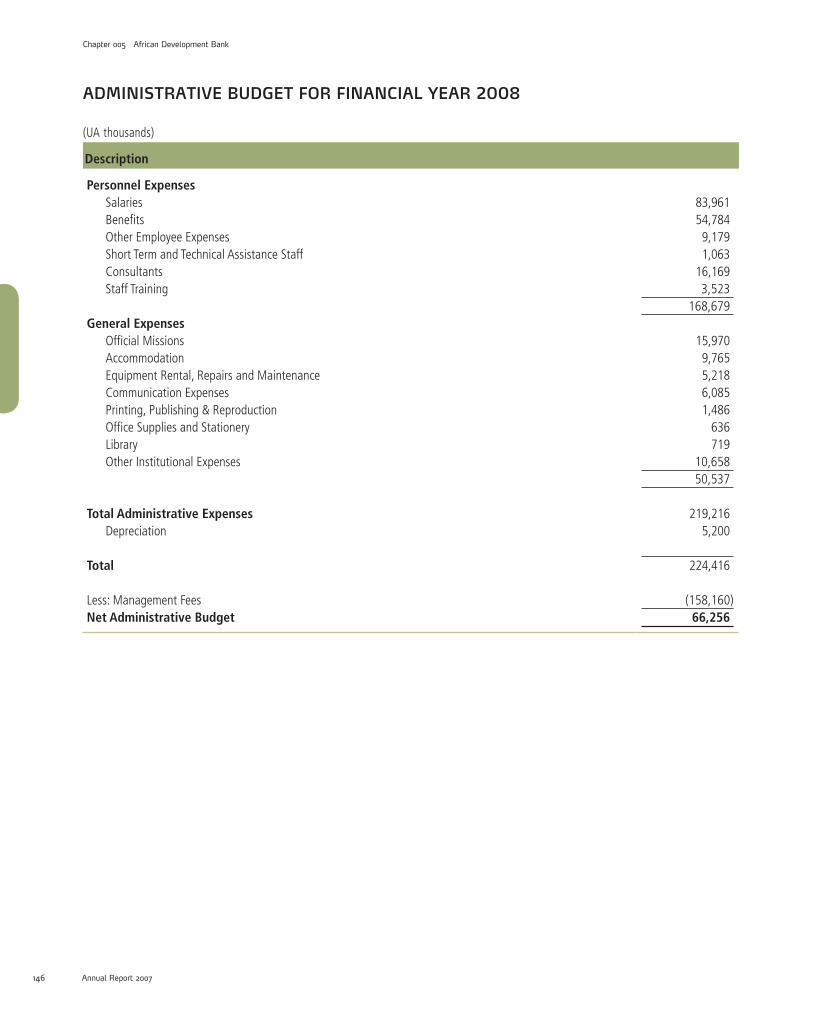
Chapter 005 African Development Bank
Annual Report 2007 PB146
ADMINISTRATIVE BUDGET FOR FINANCIAL YEAR 2008
(UA thousands)
Description
Personnel Expenses Salaries Benefits Other Employee Expenses Short Term and Technical Assistance Staff Consultants Staff Training
General Expenses Official Missions Accommodation Equipment Rental, Repairs and Maintenance Communication Expenses Printing, Publishing & Reproduction Office Supplies and Stationery Library Other Institutional Expenses
Total Administrative Expenses Depreciation
Total
Less: Management FeesNet Administrative Budget
83,961 54,784 9,179 1,063
16,169 3,523
168,679
15,970 9,765 5,218 6,085 1,486
636719
10,658 50,537
219,216 5,200
224,416
(158,160) 66,256

African Development Bank Chapter 005
Annual Report 2007 105PB
Operational RiskThe Bank defines operational risks to include all aspects of risk-related exposure other than those falling within the scope of credit, market and liquidity risks including specifically the risk of loss resulting from inadequate or failed internal processes, people and systems or from external events and reputational risk.
Like all financial institutions, the Bank is also exposed to controls and operational risks arising from its systems, functions and interde-pendencies among its departments, which could impact broadly its activities with a possible consequence of operational losses. There are also many interdependencies among risk factors that may result in an operational risk loss.
In the past, the Bank Group has relied almost exclusively upon internal controls within departments, although not necessarily identified as managing operational risk, for its internal controls and operational risk management. The evolving best practice is for specific structures and methods to be dedicated for managing and coordinating operational risks. Following approval by the Board of Directors in 2004, the Bank established an Internal Control Unit (ICU) to develop assessments and measure areas of operational risk in the Bank in line with the evolving best practices. The Bank also adopted and commenced in 2005, the implementation of the COSO control framework to regularly evaluate the effectiveness of its internal controls in all significant business operations.
The implementation of Operational Risk Management is being done in phases: the first phase focused on the documentation and testing of controls around financial reporting. Management attestation on the adequacy of internal controls was published in the annual reports for the first time in 2006. Phase two of the implementation commenced in 2007 and is extending the COSO framework to other areas of operational risk management.
There are other initiatives or activities in the other areas of the Bank Group that are complementing the work on operational risk man-agement and controls including:
• Review of Code of Conduct and Staff Rules • Fraud and Investigation Unit • Whistleblower Protection Policy • Document Retention Policy • Business Continuity Planning and Preparedness
Effects of Recent Developments in the Financial MarketsAs a result of its prudent risk management policies and practices, the impact on the Bank of the recent turbulence in the world financial markets related in large part to losses on sub-prime mortgage loans and related derivatives have been insignificant. With regard to the funding activities, there has been no adverse effect on the Bank’s ability to borrow at very attractive rates, consistent with the Bank’s solid financial position as evidenced by the continued uniform top rating by all the major rating agencies. Consequently, the Bank continues to be well placed to play its intermediation role in support of the development financing needs of its member countries. With regard to investing activities, the Bank’s investment guidelines and practices have helped to ensure a very limited exposure to financial instruments backed by sub-prime mortgages and other risky asset classes. At December 31, 2007, the Bank held an asset-backed commercial paper issued by a SIV-lite with exposure to sub-prime mortgages. This investment amounted to USD 50 million or UA 31.64 million, representing 0.26% of the Bank’s total assets or 0.67% of total equity. The estimated loss to the Bank on such asset-backed commercial paper has been provided for in these financial statements.
07_ADB_part b_UK_1.indd 105 11/04/08 15:15:28
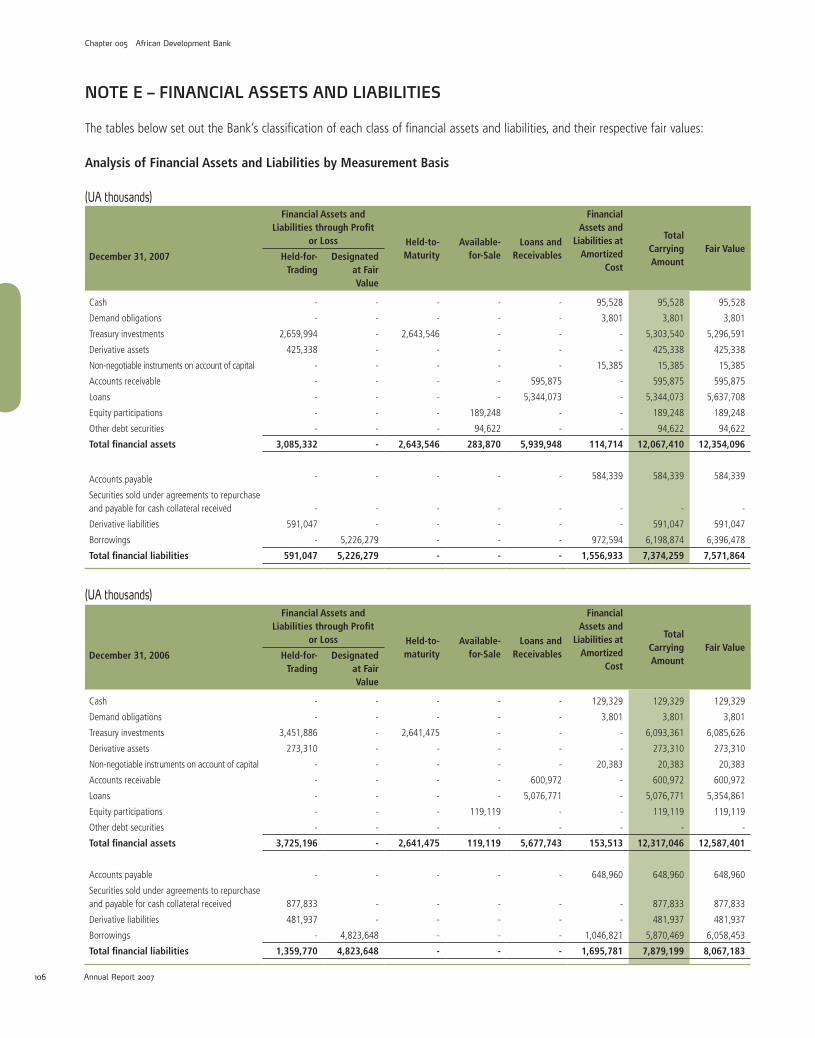
Chapter 005 African Development Bank
Annual Report 2007 107106
NOTE E – FINANCIAL ASSETS AND LIABILITIES
The tables below set out the Bank’s classification of each class of financial assets and liabilities, and their respective fair values:
Analysis of Financial Assets and Liabilities by Measurement Basis
(UA thousands)Financial Assets and
Liabilities through Profit or Loss Held-to-
MaturityAvailable-
for-SaleLoans and
Receivables
Financial Assets and
Liabilities at Amortized
Cost
Total Carrying Amount
Fair ValueDecember 31, 2007 Held-for-
TradingDesignated
at Fair Value
Cash - - - - - 95,528 95,528 95,528
Demand obligations - - - - - 3,801 3,801 3,801
Treasury investments 2,659,994 - 2,643,546 - - - 5,303,540 5,296,591
Derivative assets 425,338 - - - - - 425,338 425,338
Non-negotiable instruments on account of capital - - - - - 15,385 15,385 15,385
Accounts receivable - - - - 595,875 - 595,875 595,875
Loans - - - - 5,344,073 - 5,344,073 5,637,708
Equity participations - - - 189,248 - - 189,248 189,248
Other debt securities - - - 94,622 - - 94,622 94,622
Total financial assets 3,085,332 - 2,643,546 283,870 5,939,948 114,714 12,067,410 12,354,096
Accounts payable - - - - - 584,339 584,339 584,339
Securities sold under agreements to repurchase and payable for cash collateral received - - - - - - - -
Derivative liabilities 591,047 - - - - - 591,047 591,047
Borrowings - 5,226,279 - - - 972,594 6,198,874 6,396,478
Total financial liabilities 591,047 5,226,279 - - - 1,556,933 7,374,259 7,571,864
(UA thousands)Financial Assets and
Liabilities through Profit or Loss Held-to-
maturityAvailable-
for-SaleLoans and
Receivables
Financial Assets and
Liabilities at Amortized
Cost
Total Carrying Amount
Fair ValueDecember 31, 2006 Held-for-
TradingDesignated
at Fair Value
Cash - - - - - 129,329 129,329 129,329
Demand obligations - - - - - 3,801 3,801 3,801
Treasury investments 3,451,886 - 2,641,475 - - - 6,093,361 6,085,626
Derivative assets 273,310 - - - - - 273,310 273,310
Non-negotiable instruments on account of capital - - - - - 20,383 20,383 20,383
Accounts receivable - - - - 600,972 - 600,972 600,972
Loans - - - - 5,076,771 - 5,076,771 5,354,861
Equity participations - - - 119,119 - - 119,119 119,119
Other debt securities - - - - - - - -
Total financial assets 3,725,196 - 2,641,475 119,119 5,677,743 153,513 12,317,046 12,587,401
Accounts payable - - - - - 648,960 648,960 648,960
Securities sold under agreements to repurchase and payable for cash collateral received 877,833
- - - - - 877,833 877,833
Derivative liabilities 481,937 - - - - - 481,937 481,937
Borrowings - 4,823,648 - - - 1,046,821 5,870,469 6,058,453
Total financial liabilities 1,359,770 4,823,648 - - - 1,695,781 7,879,199 8,067,183
07_ADB_part b_UK_1.indd 106 11/04/08 15:15:29

African Development Bank Chapter 005
Annual Report 2007 107106
NOTE F – TREASURY INVESTMENTS
As part of its overall portfolio management strategy, the Bank invests in government and agency obligations, time deposits, asset-backed securities, secured lending transactions, resale agreements and related derivative instruments including futures, forward contracts, cross-currency swaps, interest rate swaps, options and short sales.
For government and agency obligations with final maturity longer than 1 year and less than 15 years, the Bank may only invest in obliga-tions with counterparties having a minimum credit rating of AA- or unconditionally guaranteed by governments of member countries or other official entities. For asset-backed securities, the Bank may only invest in securities with a AAA credit rating. Investments in money market instruments are restricted to instruments having maturities of not more than 1 year and a minimum credit rating of A. Over-the-counter (OTC) options on government securities and interest rate products are purchased only if the life of the option contract does not exceed 1 year, and such transactions are only executed with counterparties with credit ratings of AA- or above. Cross-currency and interest rate swaps including asset swap transactions are only permitted with approved counterparties or guaranteed by entities with minimum credit ratings of AA-/Aa3 at the time of the transaction.
The Bank uses external managers in the management of certain of its liquid assets, in accordance with the Bank’s Asset and Liability Management Guidelines. At December 31, 2007, investments under external management were UA 154.85 million (2006: UA 120.39 million). These amounts were included in the held-for-trading portfolio below.
At December 31, 2007, the Bank had no securities sold under repurchase agreements (Repos). At December 31, 2006, Repos with a nominal value of UA 877.83 million and a market value including accrued interest of UA 879.41 million were outstanding on the balance sheet date. Securities pledged as collateral outstanding at December 31, 2006 had a carrying value of UA 757.49 million. The nominal value of securities sold under repurchase agreements, but not yet settled and therefore not requiring collateral to be pledged at December 31, 2006 was UA 117.64 million. These securities included held-for-trading and held-to-maturity instruments and were reported in their respective captions below.
The composition of treasury investments as at December 31, 2007 and 2006 was as follows:
(UA thousands) 2007 2006
Held-for-trading 2,659,994 3,451,886Held-to-maturity 2,643,546 2,641,475Total 5,303,540 6,093,361
Held-for-Trading InvestmentsA summary of the Bank’s held-for-trading investments at December 31, 2007 and 2006 follows:
(UA millions)US Dollar Euro GBP Other Currencies All Currencies
2007 2006 2007 2006 2007 2006 2007 2006 2007 2006
Time deposits 444.23 535.08 246.69 43.62 20.26 464.70 215.22 168.58 926.40 1,211.98
Asset-backed securities 158.17 509.56 134.35 355.32 - - - - 292.52 864.88
Government and agency obligations 41.24 - - 17.99 - - - 9.04 41.24 27.03
Corporate bonds and commercial paper 964.24 784.16 411.22 519.21 - - 24.37 44.63 1,399.83 1,348.00
Total held-for-trading investments 1,607.88 1,828.80 792.26 936.14 20.26 464.70 239.59 222.25 2,659.99 3,451.89
Repos - (284.48) - (110.06) - (454.48) - (28.81) - (877.83)
The nominal balance of the Bank’s held-for-trading investments as at December 31, 2007 was UA 2,650.03 million (2006: UA 3,449.01 million). The average yield of held-for-trading investments in 2007 was 4.54% (2006: 4.28%).
07_ADB_part b_UK_1.indd 107 11/04/08 15:15:29

Chapter 005 African Development Bank
Annual Report 2007 109108 109108
The contractual maturity structure of held-for-trading investments as at December 31, 2007 and 2006 was as follows:
(UA millions) 2007 2006
One year or less 1,260.08 1,588.07More than one year but less than two years 576.19 272.92More than two years but less than three years 349.37 584.19More than three years but less than four years 106.07 331.13More than four years but less than five years 16.59 66.36More than five years 351.69 609.22Total 2,659.99 3,451.89
The maturity structure of repos as at December 31, 2007 and 2006 was as follows:
(UA millions) 2007 2006
One year or less - (877.83)
Held-to-Maturity Investments
A summary of the Bank’s held-to-maturity investments at December 31, 2007 and 2006 follows:
(UA millions)US Dollar Euro GBP Other Currencies All Currencies
2007 2006 2007 2006 2007 2006 2007 2006 2007 2006
Time deposits 3.71 14.74 - - - 65.33 20.41 - 24.12 80.07
Asset-backed securities 181.11 156.67 31.91 10.34 - - - - 213.02 167.01
Government and agency obligations 329.85 484.56 120.28 188.33 82.09 225.24 96.96 126.29 629.18 1,024.42
Corporate bonds and others 673.41 503.41 572.49 508.52 424.91 268.23 106.42 89.82 1,777.23 1,369.98
Total held-to-maturity investments 1,188.08 1,159.38 724.68 707.19 507.00 558.80 223.79 216.11 2,643.55 2,641.48
The nominal balance of the Bank’s held-to-maturity investments as at December 31, 2007, was UA 2,661.08 million (2006: UA 2,639.68 million). The average yield of held-to-maturity investments in 2007 was 4.21% (2006: 4.16%).
The contractual maturity structure of held-to-maturity investments as at December 31, 2007 and 2006 was as follows:
(UA millions) 2007 2006
One year or less 274.05 313.15More than one year but less than two years 380.01 238.22More than two years but less than three years 363.48 340.64More than three years but less than four years 458.56 368.94More than four years but less than five years 303.80 380.37More than five years 863.65 1,000.16Total 2,643.55 2,641.48
The fair value of held-to-maturity investments at December 31, 2007 was UA 2,636.60 million (2006: UA 2,633.74 million).
07_ADB_part b_UK_1.indd 108 11/04/08 15:15:30

109108
African Development Bank Chapter 005
Annual Report 2007 109108
NOTE G – DERIVATIVE ASSETS AND LIABILITIES
The fair values of derivative financial assets and financial liabilities at December 31, 2007 and 2006 were as follows:
2007 2006(UA thousands) Assets Liabilities Assets Liabilities
Borrowings-related:Cross-currency swaps 318,039 560,594 198,550 394,460Interest rate swaps 74,365 16,697 49,960 54,080Loan swaps 23,635 10,546 23,203 24,834Embedded derivatives 302 962 319 1,189
416,341 588,799 272,032 474,563Investments-related:Asset swaps 42 2,233 1,071 775Macro-hedge swaps 8,955 15 207 6,599
8,997 2,248 1,278 7,374Total 425,338 591,047 273,310 481,937
The notional amounts of derivative financial assets and financial liabilities at December 31, 2007 and 2006 were as follows:
(UA thousands) 2007 2006Borrowings-related: Cross-currency swaps 4,403,494 4,139,026Interest rate swaps 3,542,754 3,772,252Loan swaps 952,633 880,152Embedded derivatives 18,339 18,441
8,917,220 8,809,871Investments-related: Asset swaps 108,456 126,176Macro-hedge swaps 228,911 289,817
337,367 415,993Total 9,254,587 9,225,864
Loan SwapsThe Bank has entered into interest rate swaps to effectively convert fixed rate income on loans in certain currencies into variable rate income.
Administrative Expenses HedgeTo insulate the Bank from possible significant increases in administrative expenses that could arise from an appreciation of the principal currencies of administrative expenditure i.e. EUR, GBP and USD vis-à-vis the UA, the Bank executed forward exchange transactions to economically hedge its administrative expenses. As at December 31, 2007 and 2006, there were no open positions with respect to the forward exchange transactions.
07_ADB_part b_UK_1.indd 109 11/04/08 15:15:30

Chapter 005 African Development Bank
Annual Report 2007 111110 111110
NOTE H – NON-NEGOTIABLE INSTRUMENTS ON ACCOUNT OF CAPITAL
Prior to May 1981, all payments in respect of paid-up capital had been made in convertible currencies. However, for the capital increases authorized in May 1979 (but effective December 1982) and May 1981, regional members had the following two options for making their payments:
1) Five (5) equal annual installments, of which at least 50 percent is payable in convertible currency and the remainder in local currency; or
2) Five (5) equal annual installments, of which 20 percent is payable in convertible currency and 80 percent in non-negotiable, non- interest bearing notes. Such notes are redeemable by the Bank solely in convertible currency in installments commencing on the fifth anniversary of the first subscription payment date.
Non-regional members were required to make their payments solely in convertible currencies.
The paid-up portion of subscriptions, authorized in accordance with Board of Governors’ Resolution B/BG/87/11 relating to the Fourth General Capital Increase (GCI-IV), is to be paid as follows:
1) Regional Members – 50 percent in five (5) equal annual installments in cash in freely convertible currency or freely convertible currencies selected by the member state, and 50 percent by the deposit of five non-negotiable, non-interest bearing notes of equal value denominated in Units of Account. Such notes are redeemable by the Bank solely in convertible currency in five (5) equal annual installments commencing on the fifth anniversary of the first subscription payment date.
2) Non-Regional members – five (5) equal annual installments in their national currencies, where such currencies are freely convert-ible or in notes denominated in freely convertible currencies encashable on demand.
Under the Fifth General Capital Increase (GCI-V), there is no distinction in payment arrangements between regional and non-regional members. Each member is required to pay for the paid-up portion of its subscribed shares in eight (8) equal and consecutive annual installments. The first installments shall be paid in cash and in a freely convertible currency. The second to the eighth installments shall be paid in cash or notes encashable on demand in a freely convertible currency.
At December 31, 2007 and 2006, the non-negotiable notes balances were as follows:
(UA thousands) 2007 2006
Balance at January 1 20,383 25,897Net movement for the year (4,998) (5,514)Balance at December 31 15,385 20,383
07_ADB_part b_UK_1.indd 110 11/04/08 15:15:31

111110
African Development Bank Chapter 005
Annual Report 2007 111110
NOTE I – LOANS
The Bank’s loan portfolio comprises loans granted to, or guaranteed by borrowing member countries as well as certain other non-sover-eign guaranteed loans. Amounts disbursed on loans are repayable in the currency or currencies disbursed by the Bank or in other freely convertible currency or currencies approved by the Bank. The amount repayable in each of these currencies shall be equal to the amount disbursed in the original currency. Loans are granted for a maximum period of twenty years, including a grace period, which is typically the period of project implementation. Loans are for the purpose of financing development projects and programs, and are not intended for sale. Furthermore, management does not believe there is a comparable secondary market for the type of loans made by the Bank.
The types of loans currently held by the Bank and the rates charged are described below:
Multi-Currency Fixed Rate Loans: For all loans negotiated prior to July 1, 1990, the Bank charges interest at fixed rates.
Multi-Currency Variable Rate Loans: Between July 1, 1990 and September 30, 1997, the Bank offered variable rate loans to its borrowers. The variable interest rate is reset twice a year and is based on the Bank’s own cost of qualified borrowing plus 50 basis points, resulting in a pass-through of average borrowing costs to borrowers.
Conversion of Multi-Currency Pool-Based Variable Rate Loans: Borrowers were offered the choice to convert the disbursed and undisbursed amounts of their multi-currency pool-based variable rate to single currency variable terms or retain the terms of their existing multi-currency pool-based variable rate loans. The conversion dates were October 1, 1997 and March 1, 1998. The other terms and conditions of converted loans remained the same as in the original loan agreements. Since October 1, 1997, the Bank has provided several alternative interest rate mechanisms. In all cases, the applicable rate of interest is the sum of two components, namely, the chosen base rate plus a lending margin.
Single Currency Variable Rate Loans: Since October 1, 1997, the Bank has offered single currency variable rate loans. The vari-able base rate is the average cost of funding a designated pool of borrowings in each currency and is adjusted semi-annually on January 1 and July 1.
Single Currency Floating Rate Loans: Since October 1, 1997, the Bank has offered LIBOR-based single currency floating rate loans. The floating base rate is determined for each currency and reset frequency is based on the Bank’s selected reference interest rate in each market. The Bank’s standard floating base rate is the six (6)-month reference rate (USD LIBOR, JPY LIBOR, EURIBOR and JIBAR) which is reset semi-annually on February 1 and August 1 and is applicable for the six-month period following the reset date.
Single Currency Fixed Rate Loans: Fixed rate loans were reintroduced with effect from October 1997 in the form of single cur-rency fixed rate loans. The fixed rate is computed as the inter-bank swap market rate corresponding to the principal amortization schedule.
Lending Margin: The lending margin is a rate premium expressed as a nominal interest rate added to the Borrower’s chosen base rate to determine the total lending rate. The lending margin determined by the Bank is independent of the base rate chosen, and remains unchanged throughout the life of the loan. The lending margin for sovereign guaranteed loans is fixed at 40 to 50 basis points. For non- sovereign guaranteed loans, the lending margin is based on the Bank’s assessment of the risks inherent in each project.
At December 31, 2007 and 2006, outstanding loans were as follows:
(UA thousands) 2007 2006 Disbursed and outstanding loans 5,540,089 5,290,951Less: accumulated provision for impairment (196,016) (214,180)Balance at December 31 5,344,073 5,076,771
07_ADB_part b_UK_1.indd 111 11/04/08 15:15:31

Chapter 005 African Development Bank
Annual Report 2007 113112 113112
Fair Value of LoansAt December 31, 2007 and 2006, the carrying and estimated fair values of loans were as follows:
(UA thousands) 2007 2006
Carrying Value
Estimated Fair Value
Carrying Value
Estimated Fair Value
Fixed rate loans 2,889,112 3,176,494 2,701,177 2,948,806Floating rate loans 1,764,346 1,708,687 1,389,586 1,342,702Variable rate loans 886,631 752,527 1,200,188 1,063,353
5,540,089 5,637,708 5,290,951 5,354,861Accumulated provision for impairment (196,016) - (214,180) - Net loans 5,344,073 5,637,708 5,076,771 5,354,861
Maturity and Currency Composition of Outstanding LoansThe contractual maturity structure of loans as at December 31, 2007 and 2006 was as follows:
(UA millions) 2007 2006Periods Fixed Rate Floating Rate Variable Rate Total TotalOne year or less 392.92 171.89 360.98 925.79 929.31 More than one year but less than two years 180.83 157.86 139.71 478.40 502.71 More than two years but less than three years 171.59 163.38 134.32 469.29 474.86 More than three years but less than four years 171.75 143.92 116.05 431.72 448.34 More than four years but less than five years 181.59 147.55 63.74 392.88 415.63 More than five years 1,790.43 979.75 71.83 2,842.01 2,520.10 Total 2,889.11 1,764.35 886.63 5,540.09 5,290.95
Borrowers may repay loans before their contractual maturity, subject to the terms specified in the loan agreements.
07_ADB_part b_UK_1.indd 112 11/04/08 15:15:31

113112
African Development Bank Chapter 005
Annual Report 2007 113112
The currency composition and types of loans as at December 31, 2007 and 2006 were as follows:
(Amounts in UA millions) 2007 2006
Amount % Amount %
Fixed Rate: Multi-Currency Euro 155.83 100.93Japanese Yen 381.32 143.72Pound Sterling 3.09 0.67Swiss Franc 156.38 36.17US Dollar 320.96 192.83Others 0.96 1.54
1,018.54 18.38 475.86 8.99 Single Currency Euro 1,690.28 1,433.01
Japanese Yen 12.67 311.34Pound Sterling - 2.55South African Rand 69.30 54.35Swiss Franc - 129.72US Dollar 98.32 294.00Others - 0.33
1,870.57 33.76 2,225.30 42.07 Floating Rate: Single Currency Euro 517.34 457.46
Japanese Yen 12.27 11.26South African Rand 137.48 153.30US Dollar 1,097.26 767.57
1,764.35 31.85 1,389.59 26.26 Variable Rate: Multi-Currency Euro 175.58 190.88
Japanese Yen 33.99 42.22Swiss Franc 0.95 1.15US Dollar 158.17 181.88Others 0.18 0.24
368.87 6.66 416.37 7.87 Single Currency Euro 214.67 336.53
Japanese Yen 111.92 132.19Swiss Franc 16.22 17.16US Dollar 174.92 297.91Others 0.03 0.04
517.76 9.35 783.83 14.81 Total 5,540.09 100.00 5,290.95 100.00
The weighted-average yield on outstanding loans for the year ended December 31, 2007 was 6.21% (2006: 6.20%).
07_ADB_part b_UK_1.indd 113 11/04/08 15:15:32

Chapter 005 African Development Bank
Annual Report 2007 115114 115114
A comparative summary of the currency composition of loans at December 31, 2007 and 2006 follows:
(Amounts in UA millions) 2007 2006
Amount % Amount %
Euro 2,753.69 49.70 2,518.81 47.61Japanese Yen 552.17 9.97 640.72 12.11Pound Sterling 3.09 0.06 3.22 0.06South African Rand 206.78 3.73 207.65 3.92Swiss Franc 173.55 3.13 184.20 3.48US Dollar 1,849.64 33.39 1,734.19 32.78Others 1.17 0.02 2.16 0.04Total 5,540.09 100.00 5,290.95 100.00
Accrued Income and Charges Receivables on LoansThe accrued income and charges receivable on loans as at December 31, 2007 and 2006 were as follows:
(UA thousands) 2007 2006 Accrued income and charges receivable on loans 435,850 455,523Less: accumulated provision for impairment (168,701) (222,588)Balance at December 31 267,149 232,935
Provision for Impairment on Loan Principal and Charges ReceivableAt December 31, 2007, loans with an aggregate principal balance of UA 603.44 million (2006: UA 670.11 million), of which UA 418.22 million (2006: UA 418.59 million) was overdue, were considered to be impaired. The gross amounts of loans and charges receivable that were impaired and the cumulative impairment on them at December 31, 2007 and 2006 were as follows:
(UA thousands) 2007 2006Outstanding balance on impaired loans 603,437 670,111Less: accumulated provision for impairment (196,016) (214,180)Net balance on impaired loans 407,421 455,931
Charges receivable and accrued income on impaired loans 261,895 330,103Less: accumulated provision for impairment (168,701) (222,588)Net charges receivable and accrued income on impaired loans 93,194 107,515
07_ADB_part b_UK_1.indd 114 11/04/08 15:15:32

115114
African Development Bank Chapter 005
Annual Report 2007 115114
The movements in the accumulated provision for impairment on outstanding loan principal for the years ended December 31, 2007 and 2006 were as follows:
(UA thousands) 2007 2006 Balance at January 1 214,180 194,613Provision for impairment on loan principal for the year (17,453) 22,566Translation effects (711) (2,999)Balance at December 31 196,016 214,180
Provision for loan impairment included those relating to private sector loans. During the year ended December 31, 2007, a write-back of provision on private sector loans of UA 2.66 million (2006: charge of UA 0.13 million) were made. The accumulated provisions on private sector loans at December 31, 2007 amounted to UA 12.13 million (2006: UA 15.40 million).
The movements in the accumulated provision for impairment on loan interest and charges receivable for the years ended December 31, 2007 and 2006 were as follows:
(UA thousands) 2007 2006 Balance at January 1 222,588 197,764Provision for impairment on loan interest and charges for the year (52,503) 29,120Translation effects (1,384) (4,296)Balance at December 31 168,701 222,588
GuaranteesThe Bank may enter into special irrevocable commitments to pay amounts to the borrowers or other parties for goods and services to be financed under loan agreements. At December 31, 2007, irrevocable reimbursement guarantees issued by the Bank to commercial banks on undisbursed loans amounted to UA 1.27 million (2006: UA 8.09 million).
Also, the Bank may provide guarantees for securities issued by an entity eligible for the Bank’s loans. Guarantees are regarded as out-standing when the borrower incurs the underlying financial obligation and are called when a guaranteed party demands payment under the guarantee. Guarantees represent potential risk to the Bank if the payments guaranteed for an entity are not made. At December 31, 2007 and 2006, the Bank had no outstanding guarantee to any entity.
07_ADB_part b_UK_1.indd 115 11/04/08 15:15:33

Chapter 005 African Development Bank
Annual Report 2007 117116 117116
NOTE J – EQUITY PARTICIPATIONS
Investment in Associate: ADFThe ADF was established in 1972 as an international institution to assist the Bank in contributing to the economic and social develop-ment of African countries, to promote co-operation and increased international trade particularly among the African countries, and to provide financing on highly concessional terms for such purposes. The Fund’s original subscriptions were provided by the Bank and the original State Participants to the ADF Agreement, and State Participants acceding to the Agreement since the original signing date. Thereafter, further subscriptions were received from participants in the form of Special General Increases and General Replenishments.
The ADF has a 12-member Board of Directors, made up of 6 members selected by the African Development Bank and 6 members selected by State Participants. The Fund’s Board of Directors reports to the Board of Governors made up of representatives of the State Participants and the ADB. The President of the Bank is the ex-officio President of the Fund.
To carry out its functions, the Fund utilizes the offices, staff, organization, services and facilities of the Bank, for which it pays a share of the administrative expenses. The share of administrative expenses paid by the Fund to the Bank is calculated annually on the basis of a cost-sharing formula, approved by the Board of Directors, which is driven in large part by the number of programs and projects executed during the year. Based on the cost-sharing formula, the share of administrative expenses incurred by ADF for the year ended December 31, 2007 amounted to UA 135.85 million (2006: UA 114.56 million), representing 73.06 percent (2006: 71.39 percent) of the shareable administrative expenses incurred by the Bank. The accounts of the ADF are kept separate and distinct from those of the Bank.
Although the ADB by agreement exercises fifty percent (50%) of the voting powers in the ADF, the Agreement establishing the ADF also provides that in the event of termination of the ADF’s operations, the assets of the Fund shall be distributed pro-rata to its participants in proportion to the amounts paid-in by them on account of their subscriptions, after settlement of any outstanding claims against the participants. At December 31, 2007, the Bank’s pro-rata or economic share in ADF was 0.86% (2006: 0.93%).
As a result of the implementation in 2006 of the Multilateral Debt Relief Initiative described in note V-2, the net asset value of ADF which is the basis for determining the value of the Banks investment in the Fund continue to decline resulting in impairment loss on the Bank’s investment. The net assets of ADF is made up of its net development resources less outstanding demand obligations plus disbursed and outstanding loans excluding balances due from countries that have reached their HIPC completion points and are therefore due for MDRI loan cancellation at the balance sheet date.
Other Equity ParticipationsThe Bank may take equity positions in privately owned productive enterprises and financial intermediaries, public sector companies that are in the process of being privatized or regional and sub-regional institutions. The Bank’s objective in such equity investments is to promote the economic development of its regional member countries and in particular the development of their private sectors. The Bank’s equity participation is also intended to promote efficient use of resources, promoting African participation, playing a catalytic role in attracting other investors and lenders and mobilizing the flow of domestic and external resources to financially viable projects, which also have significant economic merit.
Although the Bank is allowed to take equity positions of up to twenty five percent (25%) the Bank currently holds less than 20% of the total equity capital of each institution in which it participates. The Bank therefore does not seek a controlling interest in the companies in which it invests, but closely monitors its equity investments through Board representation. In accordance with the Board of Governors’ Resolution B/BG/2001/09 of May 29, 2001, total equity investment by the Bank shall not at any time exceed ten percent (10%) of the aggregate amount of the Bank’s paid-up capital and reserves and surplus included in its ordinary capital resources.
Equity investments for which fair value cannot be reliably measured are reported at cost less provision for losses for estimated permanent and lasting decline in value. The investments for which fair value cannot be reliably measured typically relate to sub-regional and national development institutions. Investments in these institutions are made with a long-term development objective, including capacity building. The shares of such institutions are not listed and also not available for sale to the general public. Only member states or institutions
07_ADB_part b_UK_1.indd 116 11/04/08 15:15:33

117116
African Development Bank Chapter 005
Annual Report 2007 117116
owned by member states are allowed to subscribe to the shares of these institutions. Provisions for losses on impaired equity investments are included in the income statement.
The Bank’s equity interests at the end of 2007 and 2006 are summarized below:
(Amounts in UA thousands)
InstitutionsYear
Established%
ShareholdingCallableCapital
Carrying Value2007 2006
African Development Fund 1972 0.86 - 111,741 111,741 Accumulated share of loss & impairment on January 1 (48,743) (14,377) Share of profit for the year 479 379 Impairment for the year 360 (34,745)
63,837 62,998 Regional Development Banks (Carried at Cost) Afreximbank 1993 6.70 9,492 6,328 6,647 BDEAC 1975 3.19 2,556 1,704 1,601 BDEGL 1980 - - 1,946 1,946 BOAD 1973 0.31 2,130 710 667 East African Development Bank 1967 11.30 - 4,272 5,000 PTA Bank 1985 5.76 8,606 4,303 5,000
22,784 19,263 20,861 Other Development Institutions (Carried at Cost) Africa - Re 1977 8.00 - 5,512 5,790 K-REP Bank Limited 1997 15.14 - 714 718 National Development Bank of Sierra Leone * - - - - Shelter Afrique 1982 10.00 - 3,164 3,323 Zimbabwe Development Bank 1984 - - 8 9
- 9,398 9,840 Investment Funds (Carried at Fair value)** Acacia Fund Limited 1996 10.40 - 733 808 Access Bank Tanzania Limited 2007 15.80 - 525 - AIG Africa Infrastructure Fund 1999 12.27 462 11,140 14,405 EMP Africa Fund II LLC 2005 13.06 13,385 23,280 5,979 Indian Ocean Regional Fund Limited 1999 16.83 - 79 92 Pan African Infrastructure Development Fund 2007 8.00 31,170 5 - South Africa Infrastructure Fund 1996 14.10 - 17,518 7,049 United Bank for Africa 1961 1.57 - 45,661 - Zambia Venture Capital Fund 1996 16.11 - 144 592
45,017 99,085 28,925 Total 67,801 191,583 122,624 Less: Accumulated provision for impairment - (2,335) (3,505)Net 67,801 189,248 119,119
* Amounts fully disbursed, but the value is less than UA 100, at the applicable exchange rates. ** The cost of equity investment carried at fair value at December 31, 2007 amounted to UA 74.16 million (2006: UA 29.37 million).
07_ADB_part b_UK_1.indd 117 11/04/08 15:15:34

Chapter 005 African Development Bank
Annual Report 2007 119118 119118
An analysis of the movement in accumulated provision for impairment on equity participations other than ADF was as follows:
(UA thousands) 2007 2006 Balance at January 1 3,505 3,496Provision for the year (417) -Translation adjustment (753) 9Balance at December 31 2,335 3,505
NOTE K – OTHER DEBT SECURITIES
The Bank may invest in certain debt instruments issued by entities in its Regional Member Countries (RMC) for the purpose of financing development projects and programs. Such investments are classified as available-for-sale.
The fair value of “Other debt securities” at December 31, 2007 and 2006 was as follows:
(UA thousands) 2007 2006Investment in debt instruments issued in RMC 94,622 -
The nominal value of the securities outstanding as at December 31, 2007, was UA 92.92 million.
07_ADB_part b_UK_1.indd 118 11/04/08 15:15:34

119118
African Development Bank Chapter 005
Annual Report 2007 119118
NOTE L – PROPERTY, EQUIPMENT AND INTANGIBLE ASSETS
(UA thousands)
2007
Property and EquipmentIntangible
Assets Grand Total
LandBuilding and
Improvements
Furniture, Fixtures &
Fittings
Equipment & Motor Vehicles
Total Property & Equipment
Computer Software
Property, Equipment
& Intangible Assets
Cost:
Balance at January 1 141 22,779 7,256 38,575 68,751 17,982 86,733
Additions during the year - 64 1,783 2,769 4,616 887 5,503
Disposals during the year - - (41) (1,822) (1,863) - (1,863)
Balance at December 31 141 22,843 8,998 39,522 71,504 18,869 90,373
Accumulated Depreciation:
Balance at January 1 - 21,284 4,927 30,302 56,513 15,979 72,492
Depreciation during the year - 102 1,187 2,887 4,176 1,199 5,375
Disposals during the year - - (41) (1,815) (1,856) - (1,856)
Balance at December 31 - 21,386 6,073 31,374 58,833 17,178 76,011
Net Book Values: December 31, 2007 141 1,457 2,925 8,148 12,671 1,691 14,362
(UA thousands)
2006
Property and EquipmentIntangible
Assets Grand Total
LandBuilding and
Improvements
Furniture, Fixtures &
Fittings
Equipment & Motor Vehicles
Total Property & Equipment
Computer Software
Property, Equipment
& Intangible Assets
Cost:
Balance at January 1 141 22,752 7,337 36,703 66,933 16,517 83,450
Additions during the year - 27 656 1,990 2,673 1,465 4,138
Disposals during the year - - (737) (118) (855) - (855)
Balance at December 31 141 22,779 7,256 38,575 68,751 17,982 86,733
Accumulated Depreciation:
Balance at January 1 - 21,182 4,678 26,579 52,439 14,660 67,099
Depreciation during the year - 102 982 3,830 4,914 1,319 6,233
Disposals during the year - - (733) (107) (840) - (840)
Balance at December 31 - 21,284 4,927 30,302 56,513 15,979 72,492
Net Book Values: December 31, 2006 141 1,495 2,329 8,273 12,238 2,003 14,241
07_ADB_part b_UK_1.indd 119 11/04/08 15:15:35

Chapter 005 African Development Bank
Annual Report 2007 121120 121120
Under the Headquarters’ Agreement with the host country, the Bank’s owned buildings in the host country are intended to be used for the purposes of the business of the Bank Group only. The rights on the lands and buildings therefore cannot be transferred to a third party. If the Bank elected to give up the use of the lands and buildings, the properties would have to be surrendered to the host country. At December 31, 2007, the book value of such assets is not significant.
NOTE M – BORROWINGS
It is the Bank’s policy to limit senior borrowing and guarantees chargeable to the Bank’s ordinary capital resources to 80 percent of the callable capital of its non-borrowing members and also to limit the total borrowing represented by both senior and subordinated debt to 80 percent of the total callable capital of all its member countries. At December 31, 2007, total borrowings amounted to UA 6,198.87 million (2006: UA 5,870.47 million) comprising senior debt and subordinated debt amounting to UA 5,530.59 million (2006: UA 5,178.74 million) and UA 668.28 million (2006: UA 691.73 million), respectively. As of the same date, the ratio of senior debt to the non-borrowing members’ callable capital of UA 8,503.17 million (2006: UA 8,533.51 million) was 65.04 percent (2006: 60.69 per-cent). Also at December 31, 2007, the ratio of total outstanding borrowings to the total callable capital of UA 19,341.63 million (2006: UA 19,436.76 million) was 32.05 percent (2006: 30.20 percent). At December 31, 2007, borrowings with embedded callable options amounted to UA 316.50 million (2006: UA 381.05 million). The Bank uses derivatives in its borrowing and liability management activities to take advantage of cost-savings opportunities and to lower its funding costs.
The Bank has entered into cross-currency swap agreements with major international banks through which proceeds from borrowings are converted into a different currency and include a forward exchange contract providing for the future exchange of the two currencies in order to recover the currency converted. The Bank has also entered into interest rate swaps, which transform a floating rate payment obligation in a particular currency into a fixed rate payment obligation or vice-versa.
07_ADB_part b_UK_1.indd 120 11/04/08 15:15:35

121120
African Development Bank Chapter 005
Annual Report 2007 121120
A summary of the Bank’s borrowings portfolio at December 31, 2007 and 2006 was as follows:
Borrowings and Swaps at December 31, 2007:
(Amounts in UA millions)Direct Borrowings Currency Swap Agreements(a) Interest Rate Swaps
Currency Rate TypeCarried at Fair Value
Carried at Amortized
Cost
Wgtd.Avg.
Cost(b)
(%)
Wgtd.AverageMaturity
(Years)
Amount Payable/
(Receivable)
Wgtd.Avg.
Cost(b)
(%)
AverageMaturity
(Years)
Notional Amount Payable/
(Receivable)
Wgtd.Avg.
Cost(b)
(%)
AverageMaturity
(Years)
Euro Fixed - - - - 158.97 8.71 11.7 120.84 5.32 1.2
Adjustable - - - - 2,524.86 4.50 4.1 - - -
- - - - (149.05) 4.11 6.2 (120.84) 4.73 1.2
Sterling Fixed 70.64 - 11.13 2.0 - - - - - -
- - - - - - - (63.39) 11.13 2.0
Adjustable - - - - 25.36 5.94 1.0 63.39 11.80 2.0
- - - - (63.39) 11.80 2.0 - - -
JapaneseYen
Fixed 642.63 277.86 2.94 6.5 - - - 222.29 4.64 0.3
- - - - (254.57) 2.25 15.0 (658.85) 2.21 1.4
Adjustable 563.06 18.34 3.58 6.0 - - - 720.53 0.86 1.7
- - - - (841.88) 2.68 4.7 (283.97) 1.47 1.3
US Dollars Fixed 2,186.44 575.86 4.59 4.8 - - - - - -
- - - - (284.77) 7.57 10.7 (2,032.91) 3.58 2.6
Adjustable 18.97 - 5.75 0.1 1,559.99 4.94 4.9 1,945.32 5.25 2.4
- - - - (1,171.60) 5.13 2.1 (18.98) 5.75 2.4
Others Fixed 1,744.54 104.67 4.80 3.6 8.65 3.67 2.4 - - -
- - - - (1,638.24) 2.78 2.8 (363.81) 5.12 2.2
Adjustable - - - - 204.27 10.04 4.8 363.81 6.93 2.2
Total Fixed 4,644.25 958.39 4.47 4.2 167.62 8.45 11.2 343.13 4.88 0.6
- - - - (2,177.58) 3.34 5.2 (3,118.96) 3.62 2.3
Adjustable 582.03 18.34 3.65 5.8 4,314.48 4.93 4.4 3,093.05 4.56 2.2
- - - - (2,225.92) 4.33 3.3 (423.79) 2.59 1.3
Principal at face value
Net unamortized premium/(discount)
5,226.28 976.73 4.39 4.4 78.60 - - (106.57) - -
- (4.14) - - 201.51 - - 105.75 - -
Fair valuation adjustment
5,226.28 972.59 4.39 4.4 280.11 - - (0.82) - -
- - - - (37.55)(c) - - (69.28)(c) - -
Total 5,226.28 972.59 4.39 4.4 242.56 - - (70.10) - -
Supplementary disclosure (direct borrowings):
The notional amount of borrowings at December 31, 2007 was UA 6,388.81 million and the estimated fair value was UA 6,396.48 million.
a. Currency swap agreements include cross-currency interest rate swaps.
b. The average repricing period of the net currency obligations for adjustable rate borrowings was six months. The rates indicated are those prevailing at December 31, 2007.
c. These amounts are included in derivative assets and liabilities on the balance sheet.
Slight differences may occur in totals due to rounding.
07_ADB_part b_UK_1.indd 121 11/04/08 15:15:36

Chapter 005 African Development Bank
Annual Report 2007 123122 123122
Borrowings and Swaps at December 31, 2006:
(Amounts in UA millions)Direct Borrowings Currency Swap Agreements(a) Interest Rate Swaps
Currency Rate TypeCarried at Fair Value
Carried at Amortized
Cost
Wgtd.Avg.
Cost(b)
(%)
Wgtd.AverageMaturity
(Years)
Amount Payable
(Receivable)
Wgtd.Avg.
Cost(b)
(%)
AverageMaturity
(Years)
Notional Amount Payable
(Receivable)
Wgtd.Avg.
Cost(b)
(%)
AverageMaturity
(Years)
Euro Fixed - - - - 149.39 8.71 12.9 205.13 5.16 1.4
Adjustable 66.59 - 3.79 0.3 2,453.29 3.48 4.6 66.73 3.13 0.3
- - - - (182.48) 3.09 5.7 (271.86) 3.36 1.1
Sterling Fixed 75.41 - 11.13 3.1 - - - - - -
- - - - - - - (65.24) 11.13 3.1
Adjustable - - - - 26.10 4.68 2.6 65.24 10.48 3.1
- - - - (65.24) 10.48 3.1 - - -
JapaneseYen
Fixed 755.65 355.69 3.23 4.7 - - - 223.53 4.64 1.3
- - - - (289.47) 2.69 6.5 (718.41) 2.29 2.3
Adjustable 601.10 18.44 4.08 6.5 86.55 0.35 0.8 780.44 0.38 2.6
- - - - (1,021.49) 2.49 4.6 (285.56) 1.16 2.3
US Dollars Fixed 2,226.72 604.89 4.77 7.7 - - - - - -
- - - - (299.12) 7.57 11.9 (2,135.40) 3.58 3.7
Adjustable 39.67 6.65 5.21 0.3 1,254.24 5.23 4.1 2,069.99 5.45 3.4
- - - - (1,273.79) 5.32 2.8 (46.53) 6.61 0.2
Others Fixed 1,058.51 66.71 3.77 4.6 8.38 3.67 3.4 - - -
- - - - (1,007.44) 3.80 5.2 (249.25) 3.47 2.0
Adjustable - - - - 194.13 8.08 6.2 249.25 3.87 2.0
Total Fixed 4,116.29 1,027.29 4.31 5.5 157.77 8.44 12.3 428.66 4.89 1.4
- - - - (1,596.03) 4.31 6.7 (3,168.30) 3.43 3.2
Adjustable 707.36 25.09 4.13 5.5 4,014.31 4.19 4.4 3,231.65 4.16 3.0
- - - - (2,543.00) 4.16 3.7 (603.95) 2.57 1.6
Principal at face value
Net unamortized premium/(discount)
4,823.65 1,052.38 4.29 5.5 33.05 - - (111.94) - -
- (5.56) - - 175.82 - - 111.10 - -
Fair valuation adjustment
4,823.65 1,046.82 4.29 5.5 208.87 - - (0.84) - -
- - - (12.96)(c) - - 7.46(c) - -
Total 4,823.65 1,046.82 4.29 5.5 195.91 - - 6.62 - -
Supplementary disclosure (direct borrowings):
The notional amount of borrowings at December 31, 2006 was UA 6,088.55 million and the estimated fair value was UA 6,058.45 million.
a. Currency swap agreements include cross-currency interest rate swaps.
b. The average repricing period of the net currency obligations for adjustable rate borrowings was six months. The rates indicated are those prevailing at December 31, 2006.
c. These amounts are included in derivative assets and liabilities on the balance sheet.
Slight differences may occur in totals due to rounding.
07_ADB_part b_UK_1.indd 122 11/04/08 15:15:37
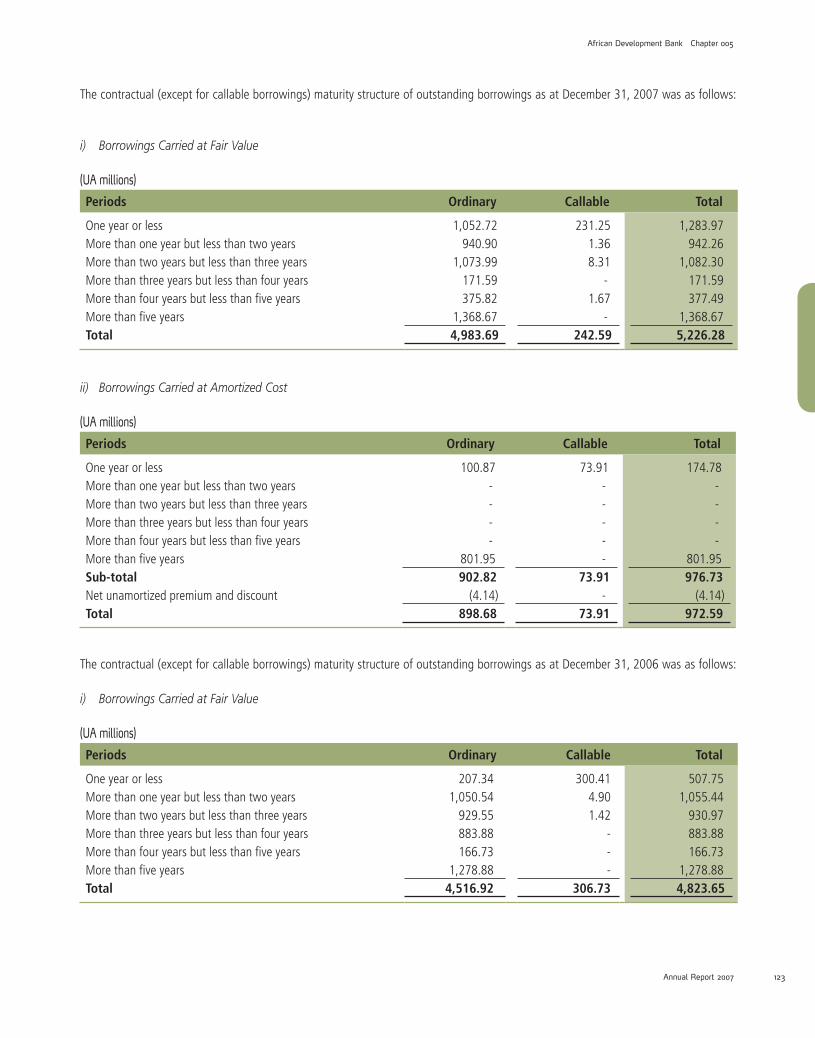
123122
African Development Bank Chapter 005
Annual Report 2007 123122
The contractual (except for callable borrowings) maturity structure of outstanding borrowings as at December 31, 2007 was as follows:
i) BorrowingsCarriedatFairValue
(UA millions)
Periods Ordinary Callable Total
One year or less 1,052.72 231.25 1,283.97 More than one year but less than two years 940.90 1.36 942.26 More than two years but less than three years 1,073.99 8.31 1,082.30 More than three years but less than four years 171.59 - 171.59 More than four years but less than five years 375.82 1.67 377.49 More than five years 1,368.67 - 1,368.67 Total 4,983.69 242.59 5,226.28
ii) BorrowingsCarriedatAmortizedCost
(UA millions)
Periods Ordinary Callable Total
One year or less 100.87 73.91 174.78 More than one year but less than two years - - -More than two years but less than three years - - -More than three years but less than four years - - -More than four years but less than five years - - -More than five years 801.95 - 801.95 Sub-total 902.82 73.91 976.73 Net unamortized premium and discount (4.14) - (4.14)Total 898.68 73.91 972.59
The contractual (except for callable borrowings) maturity structure of outstanding borrowings as at December 31, 2006 was as follows:
i) BorrowingsCarriedatFairValue
(UA millions)
Periods Ordinary Callable Total
One year or less 207.34 300.41 507.75 More than one year but less than two years 1,050.54 4.90 1,055.44 More than two years but less than three years 929.55 1.42 930.97 More than three years but less than four years 883.88 - 883.88 More than four years but less than five years 166.73 - 166.73 More than five years 1,278.88 - 1,278.88 Total 4,516.92 306.73 4,823.65
07_ADB_part b_UK_1.indd 123 11/04/08 15:15:37
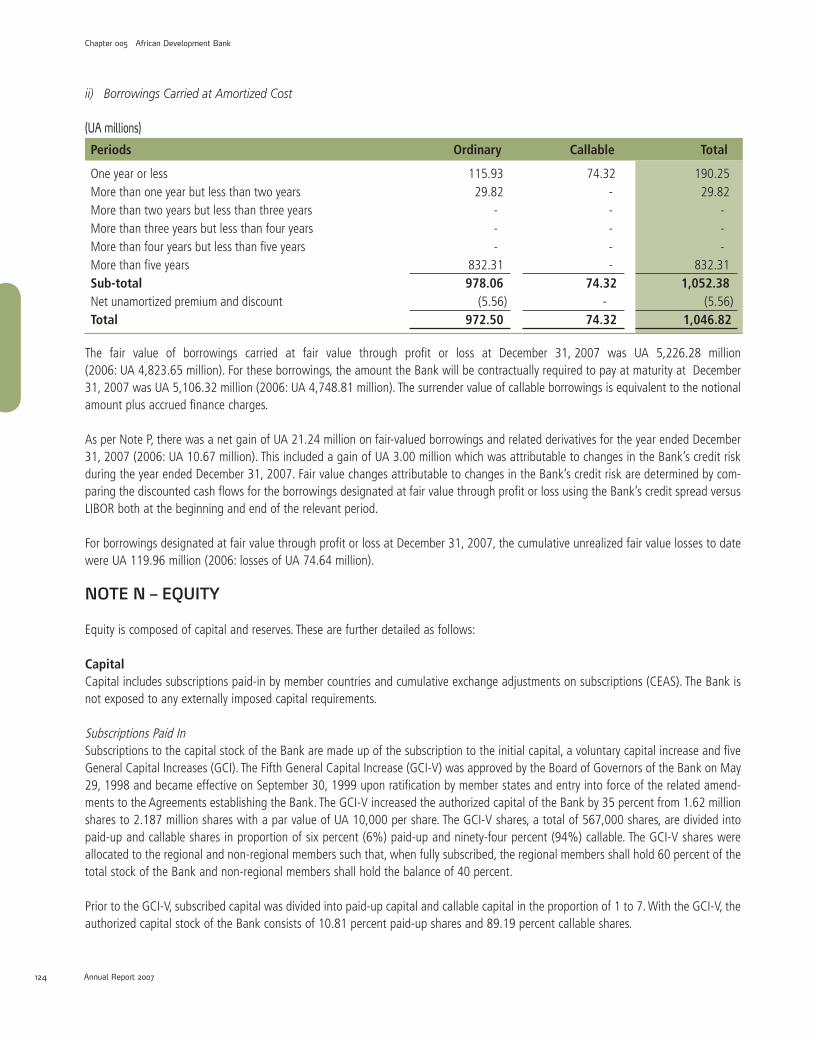
Chapter 005 African Development Bank
Annual Report 2007 125124 125124
ii) BorrowingsCarriedatAmortizedCost
(UA millions)
Periods Ordinary Callable Total
One year or less 115.93 74.32 190.25 More than one year but less than two years 29.82 - 29.82 More than two years but less than three years - - - More than three years but less than four years - - - More than four years but less than five years - - - More than five years 832.31 - 832.31 Sub-total 978.06 74.32 1,052.38 Net unamortized premium and discount (5.56) - (5.56)Total 972.50 74.32 1,046.82
The fair value of borrowings carried at fair value through profit or loss at December 31, 2007 was UA 5,226.28 million (2006: UA 4,823.65 million). For these borrowings, the amount the Bank will be contractually required to pay at maturity at December 31, 2007 was UA 5,106.32 million (2006: UA 4,748.81 million). The surrender value of callable borrowings is equivalent to the notional amount plus accrued finance charges.
As per Note P, there was a net gain of UA 21.24 million on fair-valued borrowings and related derivatives for the year ended December 31, 2007 (2006: UA 10.67 million). This included a gain of UA 3.00 million which was attributable to changes in the Bank’s credit risk during the year ended December 31, 2007. Fair value changes attributable to changes in the Bank’s credit risk are determined by com-paring the discounted cash flows for the borrowings designated at fair value through profit or loss using the Bank’s credit spread versus LIBOR both at the beginning and end of the relevant period.
For borrowings designated at fair value through profit or loss at December 31, 2007, the cumulative unrealized fair value losses to date were UA 119.96 million (2006: losses of UA 74.64 million).
NOTE N – EQUITY
Equity is composed of capital and reserves. These are further detailed as follows:
CapitalCapital includes subscriptions paid-in by member countries and cumulative exchange adjustments on subscriptions (CEAS). The Bank is not exposed to any externally imposed capital requirements.
Subscriptions Paid InSubscriptions to the capital stock of the Bank are made up of the subscription to the initial capital, a voluntary capital increase and five General Capital Increases (GCI). The Fifth General Capital Increase (GCI-V) was approved by the Board of Governors of the Bank on May 29, 1998 and became effective on September 30, 1999 upon ratification by member states and entry into force of the related amend-ments to the Agreements establishing the Bank. The GCI-V increased the authorized capital of the Bank by 35 percent from 1.62 million shares to 2.187 million shares with a par value of UA 10,000 per share. The GCI-V shares, a total of 567,000 shares, are divided into paid-up and callable shares in proportion of six percent (6%) paid-up and ninety-four percent (94%) callable. The GCI-V shares were allocated to the regional and non-regional members such that, when fully subscribed, the regional members shall hold 60 percent of the total stock of the Bank and non-regional members shall hold the balance of 40 percent.
Prior to the GCI-V, subscribed capital was divided into paid-up capital and callable capital in the proportion of 1 to 7. With the GCI-V, the authorized capital stock of the Bank consists of 10.81 percent paid-up shares and 89.19 percent callable shares.
07_ADB_part b_UK_1.indd 124 11/04/08 15:15:38

125124
African Development Bank Chapter 005
Annual Report 2007 125124
The Bank’s capital as at December 31, 2007 and 2006 was as follows:
(UA thousands) 2007 2006
Capital Authorized (in shares of UA 10 000 each) 21,870,000 21,870,000 Less: Unsubscribed (176,839) (75,463)Subscribed Capital 21,693,161 21,794,537 Less: Callable Capital (19,341,627) (19,436,756)Paid-up Capital 2,351,534 2,357,781 Shares to be issued upon payment of future installments (12,960) (51,879)Add: Amounts paid in advance 118 328
2,338,692 2,306,230 Less: Amounts in arrears (2,235) (3,168)Capital at December 31 2,336,457 2,303,062
Included in the total unsubscribed shares of UA 176.84 million at December 31, 2007, was an amount of UA 38.83 million representing the balance of the shareholding of the former Socialist Federal Republic of Yugoslavia (former Yugoslavia).
Since the former Yugoslavia has ceased to exist as a state under international law, its shares (composed of UA 41.93 million callable, and UA 5.99 million paid-up shares) were held as treasury shares of the Bank in accordance with Article 6 (6) of the Bank Agreement. In 2002, the Board of Directors of the Bank approved the proposal to invite each of the successor states of the former Yugoslavia to apply for membership in the Bank, though such membership would be subject to their fulfilling certain conditions including the assumption pro-rata of the contingent liabilities of the former Yugoslavia to the Bank, as of December 31, 1992. In the event that a successor state declines or otherwise does not become a member of the Bank, the pro-rata portion of the shares of former Yugoslavia, which could have been reallocated to such successor state, would be reallocated to other interested non-regional members of the Bank in accordance with the terms of the Share Transfer Rules. The proceeds of such reallocation will however be transferable to such successor state. Furthermore, pending the response from the successor states, the Bank may, under its Share Transfer Rules, reallocate the shares of former Yugoslavia to interested non-regional member states and credit the proceeds on a pro-rata basis to the successor states. In 2003, one of the suc-cessor states declined the invitation to apply for membership and instead offered to the Bank, as part of the state’s Official Development Assistance its pro-rata interest in the proceeds of any reallocation of the shares of former Yugoslavia. The Bank accepted the offer.
07_ADB_part b_UK_1.indd 125 11/04/08 15:15:38
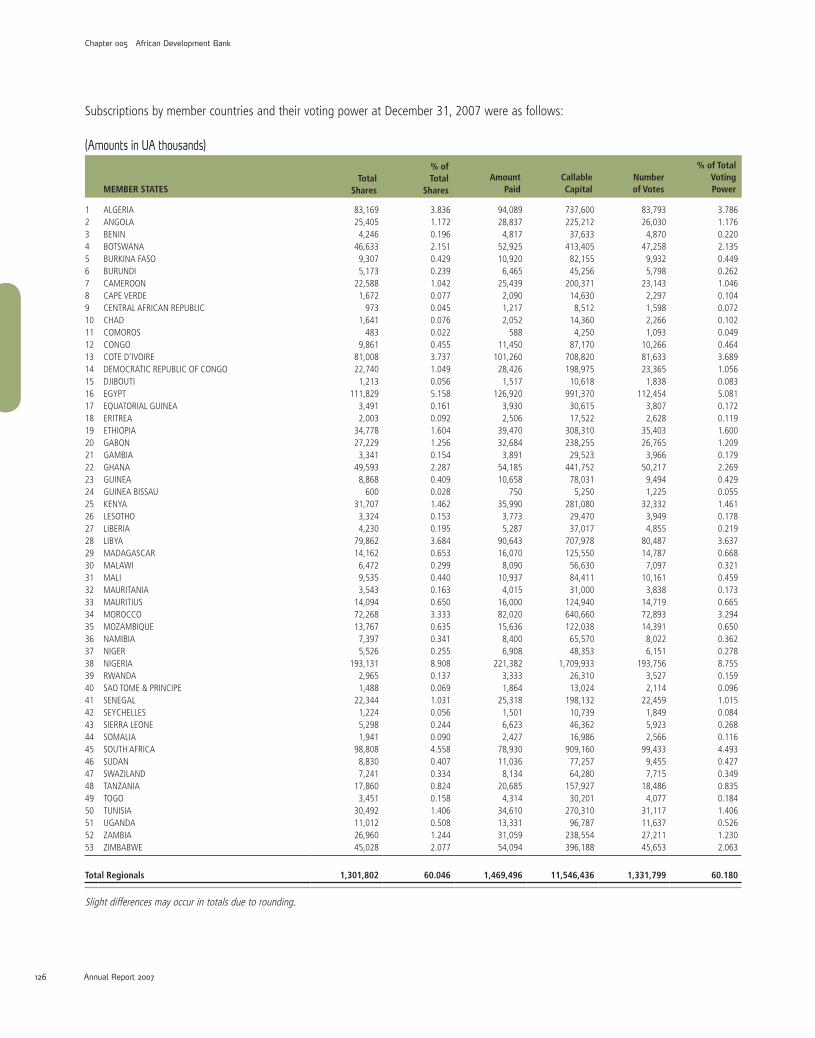
Chapter 005 African Development Bank
Annual Report 2007 127126 127126
Subscriptions by member countries and their voting power at December 31, 2007 were as follows:
(Amounts in UA thousands)
MEMBER STATESTotal
Shares
% ofTotal
Shares Amount
Paid Callable Capital
Number of Votes
% of Total Voting Power
1 ALGERIA 83,169 3.836 94,089 737,600 83,793 3.7862 ANGOLA 25,405 1.172 28,837 225,212 26,030 1.1763 BENIN 4,246 0.196 4,817 37,633 4,870 0.2204 BOTSWANA 46,633 2.151 52,925 413,405 47,258 2.1355 BURKINA FASO 9,307 0.429 10,920 82,155 9,932 0.4496 BURUNDI 5,173 0.239 6,465 45,256 5,798 0.2627 CAMEROON 22,588 1.042 25,439 200,371 23,143 1.0468 CAPE VERDE 1,672 0.077 2,090 14,630 2,297 0.1049 CENTRAL AFRICAN REPUBLIC 973 0.045 1,217 8,512 1,598 0.07210 CHAD 1,641 0.076 2,052 14,360 2,266 0.10211 COMOROS 483 0.022 588 4,250 1,093 0.04912 CONGO 9,861 0.455 11,450 87,170 10,266 0.46413 COTE D’IVOIRE 81,008 3.737 101,260 708,820 81,633 3.68914 DEMOCRATIC REPUBLIC OF CONGO 22,740 1.049 28,426 198,975 23,365 1.05615 DJIBOUTI 1,213 0.056 1,517 10,618 1,838 0.08316 EGYPT 111,829 5.158 126,920 991,370 112,454 5.08117 EQUATORIAL GUINEA 3,491 0.161 3,930 30,615 3,807 0.17218 ERITREA 2,003 0.092 2,506 17,522 2,628 0.11919 ETHIOPIA 34,778 1.604 39,470 308,310 35,403 1.60020 GABON 27,229 1.256 32,684 238,255 26,765 1.20921 GAMBIA 3,341 0.154 3,891 29,523 3,966 0.17922 GHANA 49,593 2.287 54,185 441,752 50,217 2.26923 GUINEA 8,868 0.409 10,658 78,031 9,494 0.42924 GUINEA BISSAU 600 0.028 750 5,250 1,225 0.05525 KENYA 31,707 1.462 35,990 281,080 32,332 1.46126 LESOTHO 3,324 0.153 3,773 29,470 3,949 0.17827 LIBERIA 4,230 0.195 5,287 37,017 4,855 0.21928 LIBYA 79,862 3.684 90,643 707,978 80,487 3.63729 MADAGASCAR 14,162 0.653 16,070 125,550 14,787 0.66830 MALAWI 6,472 0.299 8,090 56,630 7,097 0.32131 MALI 9,535 0.440 10,937 84,411 10,161 0.45932 MAURITANIA 3,543 0.163 4,015 31,000 3,838 0.17333 MAURITIUS 14,094 0.650 16,000 124,940 14,719 0.66534 MOROCCO 72,268 3.333 82,020 640,660 72,893 3.29435 MOZAMBIQUE 13,767 0.635 15,636 122,038 14,391 0.65036 NAMIBIA 7,397 0.341 8,400 65,570 8,022 0.36237 NIGER 5,526 0.255 6,908 48,353 6,151 0.27838 NIGERIA 193,131 8.908 221,382 1,709,933 193,756 8.75539 RWANDA 2,965 0.137 3,333 26,310 3,527 0.15940 SAO TOME & PRINCIPE 1,488 0.069 1,864 13,024 2,114 0.09641 SENEGAL 22,344 1.031 25,318 198,132 22,459 1.01542 SEYCHELLES 1,224 0.056 1,501 10,739 1,849 0.08443 SIERRA LEONE 5,298 0.244 6,623 46,362 5,923 0.26844 SOMALIA 1,941 0.090 2,427 16,986 2,566 0.11645 SOUTH AFRICA 98,808 4.558 78,930 909,160 99,433 4.49346 SUDAN 8,830 0.407 11,036 77,257 9,455 0.42747 SWAZILAND 7,241 0.334 8,134 64,280 7,715 0.34948 TANZANIA 17,860 0.824 20,685 157,927 18,486 0.83549 TOGO 3,451 0.158 4,314 30,201 4,077 0.18450 TUNISIA 30,492 1.406 34,610 270,310 31,117 1.40651 UGANDA 11,012 0.508 13,331 96,787 11,637 0.52652 ZAMBIA 26,960 1.244 31,059 238,554 27,211 1.23053 ZIMBABWE 45,028 2.077 54,094 396,188 45,653 2.063
Total Regionals 1,301,802 60.046 1,469,496 11,546,436 1,331,799 60.180
Slight differences may occur in totals due to rounding.
07_ADB_part b_UK_1.indd 126 11/04/08 15:15:39

127126
African Development Bank Chapter 005
Annual Report 2007 127126
(Amounts in UA thousands)
MEMBER STATESTotal
Shares
% ofTotal
Shares Amount
Paid Callable Capital
Number of Votes
% of Total Voting Power
Total Regionals 1,301,802 60.046 1,469,496 11,546,436 1,331,799 60.180
54 ARGENTINA 5,846 0.270 6,108 52,364 6,472 0.29255 AUSTRIA 9,707 0.448 9,720 87,350 10,332 0.46756 BELGIUM 13,288 0.613 13,579 119,314 13,914 0.62957 BRAZIL 9,674 0.446 9,700 87,036 10,299 0.46558 CANADA 81,648 3.766 81,750 734,730 82,273 3.71859 CHINA 24,300 1.121 24,330 218,670 24,925 1.12660 DENMARK 25,168 1.161 25,200 226,480 25,793 1.16661 FINLAND 10,627 0.490 10,640 95,630 11,252 0.50862 FRANCE 81,648 3.766 81,750 734,730 82,273 3.71863 GERMANY 89,631 4.134 89,740 806,570 90,256 4.07864 INDIA 4,860 0.224 4,870 43,730 5,485 0.24865 ITALY 52,644 2.428 52,710 473,730 53,269 2.40766 JAPAN 119,400 5.507 119,550 1,074,450 120,025 5.42467 KOREA 9,707 0.448 9,720 87,350 10,332 0.46768 KUWAIT 9,707 0.448 9,720 87,350 10,332 0.46769 NETHERLANDS 18,555 0.856 17,116 168,450 19,180 0.86770 NORWAY 25,168 1.161 25,200 226,480 25,793 1.16671 PORTUGAL 5,205 0.240 5,074 46,980 5,830 0.26372 SAUDI ARABIA 4,212 0.194 4,220 37,900 4,837 0.21973 SPAIN 23,034 1.062 21,870 208,470 23,659 1.06974 SWEDEN 33,592 1.549 33,630 302,290 34,217 1.54675 SWITZERLAND 31,882 1.471 31,920 286,900 32,507 1.46976 UNITED KINGDOM 36,554 1.686 36,600 328,940 37,179 1.68077 UNITED STATES OF AMERICA 140,154 6.465 142,245 1,259,298 140,779 6.361
Total Non-Regionals 866,210 39.954 866,961 7,795,191 881,213 39.820
Grand Total 2,168,012 100.000 2,336,457 19,341,627 2,213,012 100.000
Slight differences may occur in totals due to rounding.
Cumulative Exchange Adjustment on Subscriptions (CEAS)Prior to the fourth General Capital Increase (GCI-IV), payments on the share capital subscribed by the non-regional member countries were fixed in terms of their national currencies. Under GCI-IV, payments by regional and non-regional members in US dollars were fixed at an exchange rate of 1 UA = US$ 1.20635. As a result of these practices, losses or gains could arise from converting these currencies to UA when received. Such conversion differences are reported in the Cumulative Exchange Adjustment on Subscriptions account.
At December 31, 2007 and 2006, the Cumulative Exchange Adjustment on Subscriptions was as follows:
(UA thousands) 2007 2006
Balance at January 1 155,742 151,759Net conversion losses on subscriptions 4,333 3,983Balance at December 31 160,075 155,742
07_ADB_part b_UK_1.indd 127 11/04/08 15:15:40

Chapter 005 African Development Bank
Annual Report 2007 129128 129128
ReservesReserves consist of retained earnings and fair value gains on available-for-sale investments.
RetainedEarningsRetained earnings included the net income for the year, after taking into account transfers approved by the Board of Governors, and net expenses recognized directly in equity. Retained earnings as at December 31, 2007 and 2006 were as follows:
(UA thousands)
Balance at January 1, 2006 2,257,678 Net income for the year 54,832Net expenses recognized directly in equity (7,165)Balance at December 31, 2006 2,305,345
Net income for the current year 203,766 Net expenses recognized directly in equity (10,823)Balance at December 31, 2007 2,498,288
In May 2007, the Board of Governors of the Bank approved the transfer of UA 21.59 million and UA 119.90 million from the income earned for the year ended December 31, 2006 to surplus account and to certain entities for development purposes, respec-tively. In December 2007, the Board of Governors also approved the transfer of UA 9.49 million from the surplus account to an entity for development purposes. With effect from 2006, Board of Governors’ approved transfers to entities for development purposes are reported as expenses in the Income Statement in the year such transfers are approved.
Transfers to entities for development purposes in the years ended December 31, 2007 and 2006 were as follows:
(UA thousands) 2007 2006
Post Conflict Assistance - DRC 65,070 67,300 African Development Fund (ADF) 13,700 21,300 Heavily Indebted Poor Countries 21,640 10,600 Special Relief Fund - 15,000 Post Conflict Countries Facility - 25,000 Middle Income Country Technical Assistance Fund 10,000 - Investment Climate Facility for Africa 9,492 -Balance at December 31 119,902 139,200
07_ADB_part b_UK_1.indd 128 11/04/08 15:15:40

129128
African Development Bank Chapter 005
Annual Report 2007 129128
FairValueGainsonAvailable-for-SaleInvestmentsAt December 31, 2007 and 2006, the fair value gains on available-for-sale investments were as follows:
(UA thousands) 2007 2006
Balance at January 1 136 8,710Net gain/(loss) for the year 33,374 (8,574)Balance at December 31 33,510 136
NOTE O – INCOME FROM LOANS AND INVESTMENTS AND RELATED DERIVATIVES
Income from Loans Income from loans for the years ended December 31, 2007 and 2006 was as follows:
(UA thousands) 2007 2006
Interest income on loans not impaired 300,678 284,769Interest income on impaired loans 36,511 38,687Commitment charges 3,432 3,848Statutory commission 1,324 1,723Total 341,945 329,027
Income from Investments and Related Derivatives Income from investments for the years ended December 31, 2007 and 2006 was as follows:
(UA thousands) 2007 2006
Interest income 238,951 214,989
Realized and unrealized fair value losses (554) (1,165)
Total 238,397 213,824
Total interest income on investment at amortized cost for the year ended December 31, 2007 was UA 123.51 million (2006: UA 106.22 million).
NOTE P – BORROWING EXPENSES
Interest and Amortized Issuance CostsInterest and amortized issuance costs on borrowings for the years ended December 31, 2007 and 2006 were as follows:
(UA thousands) 2007 2006
Interest cost 264,690 242,477
Amortization of issuance costs 3,333 2,936
Total 268,023 245,413
07_ADB_part b_UK_1.indd 129 11/04/08 15:15:41

Chapter 005 African Development Bank
Annual Report 2007 131130 131130
Total interest expense for financial liabilities not at fair value through profit or loss for the year ended December 31, 2007 was UA 65.13 million (2006: UA 76.38 million).
Net Interest on Borrowing-Related Derivatives Net interest on borrowing-related derivatives for the years ended December 31, 2007 and 2006 was as follows:
(UA thousands) 2007 2006
Interest on derivatives payable 410,714 322,500
Interest on derivatives receivable (348,008) (287,363)
Total 62,706 35,137
Unrealized Gain on Fair-Valued Borrowings and Related Derivatives Unrealized gain on fair-valued borrowings and related derivatives for the years ended December 31, 2007 and 2006 was as follows:
(UA thousands) 2007 2006
Fair-valued borrowings (45,315) 48,799
Cross-currency swaps 10,628 (25,780)
Interest rate swaps 55,926 (12,347)
Total 21,239 10,672
Unrealized Gain on Derivatives on Non-Fair Valued Borrowings and Others Unrealized net gain on derivative on non-fair valued borrowings and others for the years ended December 31, 2007 and 2006 was as follows:
(UA thousands) 2007 2006
Interest rate swaps 21,876 22,283
Cross-currency swaps 13,958 6,464
Macro hedge swaps (1,269) (8,061)
Embedded derivatives 209 381
Total 34,774 21,067
NOTE Q – ADMINISTRATIVE EXPENSES
Total administrative expenses relate to expenses incurred on behalf of the ADF, the NTF and for the operations of the Bank itself. The ADF and NTF reimburse the Bank for their share of the total administrative expenses, based on an agreed-upon cost-sharing formula, which is driven by certain selected indicators of operational activity for operational expenses and relative balance sheet sizes for non-operational expenses. However, the expenses allocated to the NTF shall not exceed 20 percent of the NTF’s gross income.
07_ADB_part b_UK_1.indd 130 11/04/08 15:15:41
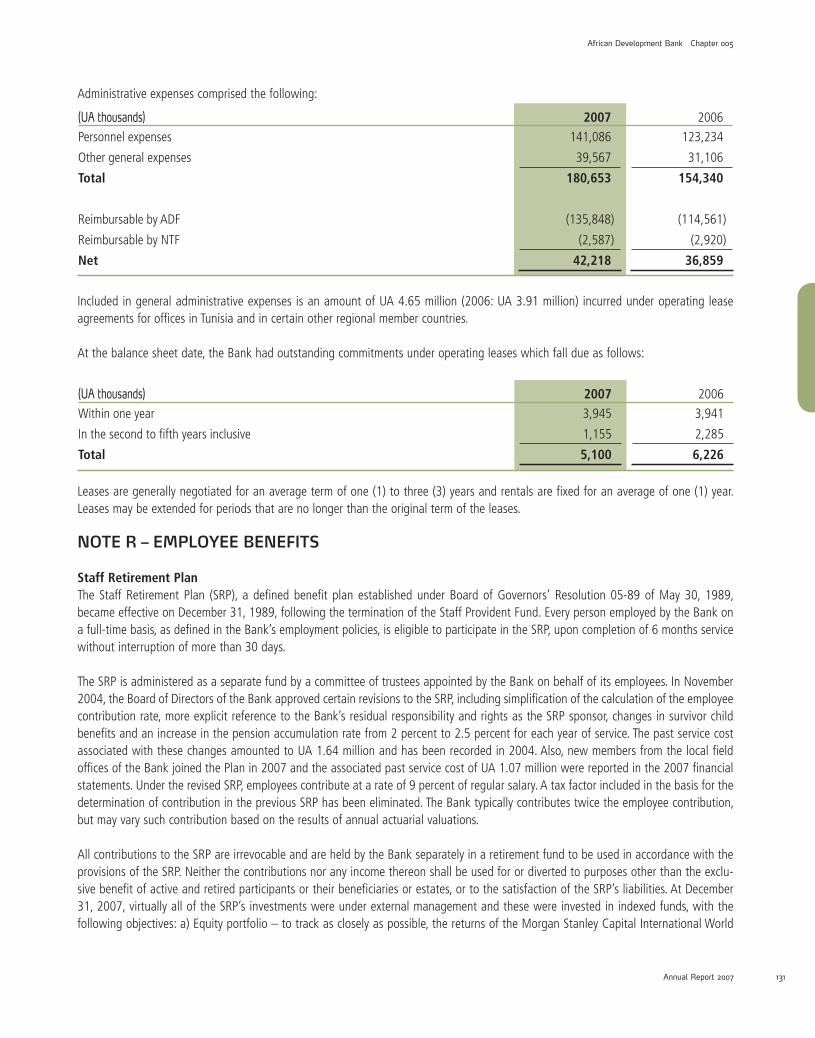
131130
African Development Bank Chapter 005
Annual Report 2007 131130
Administrative expenses comprised the following:
(UA thousands) 2007 2006
Personnel expenses 141,086 123,234
Other general expenses 39,567 31,106
Total 180,653 154,340
Reimbursable by ADF (135,848) (114,561)
Reimbursable by NTF (2,587) (2,920)
Net 42,218 36,859
Included in general administrative expenses is an amount of UA 4.65 million (2006: UA 3.91 million) incurred under operating lease agreements for offices in Tunisia and in certain other regional member countries.
At the balance sheet date, the Bank had outstanding commitments under operating leases which fall due as follows:
(UA thousands) 2007 2006
Within one year 3,945 3,941
In the second to fifth years inclusive 1,155 2,285
Total 5,100 6,226
Leases are generally negotiated for an average term of one (1) to three (3) years and rentals are fixed for an average of one (1) year. Leases may be extended for periods that are no longer than the original term of the leases.
NOTE R – EMPLOYEE BENEFITS
Staff Retirement PlanThe Staff Retirement Plan (SRP), a defined benefit plan established under Board of Governors’ Resolution 05-89 of May 30, 1989, became effective on December 31, 1989, following the termination of the Staff Provident Fund. Every person employed by the Bank on a full-time basis, as defined in the Bank’s employment policies, is eligible to participate in the SRP, upon completion of 6 months service without interruption of more than 30 days.
The SRP is administered as a separate fund by a committee of trustees appointed by the Bank on behalf of its employees. In November 2004, the Board of Directors of the Bank approved certain revisions to the SRP, including simplification of the calculation of the employee contribution rate, more explicit reference to the Bank’s residual responsibility and rights as the SRP sponsor, changes in survivor child benefits and an increase in the pension accumulation rate from 2 percent to 2.5 percent for each year of service. The past service cost associated with these changes amounted to UA 1.64 million and has been recorded in 2004. Also, new members from the local field offices of the Bank joined the Plan in 2007 and the associated past service cost of UA 1.07 million were reported in the 2007 financial statements. Under the revised SRP, employees contribute at a rate of 9 percent of regular salary. A tax factor included in the basis for the determination of contribution in the previous SRP has been eliminated. The Bank typically contributes twice the employee contribution, but may vary such contribution based on the results of annual actuarial valuations.
All contributions to the SRP are irrevocable and are held by the Bank separately in a retirement fund to be used in accordance with the provisions of the SRP. Neither the contributions nor any income thereon shall be used for or diverted to purposes other than the exclu-sive benefit of active and retired participants or their beneficiaries or estates, or to the satisfaction of the SRP’s liabilities. At December 31, 2007, virtually all of the SRP’s investments were under external management and these were invested in indexed funds, with the following objectives: a) Equity portfolio – to track as closely as possible, the returns of the Morgan Stanley Capital International World
07_ADB_part b_UK_1.indd 131 11/04/08 15:15:41

Chapter 005 African Development Bank
Annual Report 2007 133132 133132
Index as well as hedging the currency exposure of the SRP’s anticipated future liabilities; b) Bond portfolio – to track as closely as pos-sible, the returns of the Citigroup World Government Bond Index as well as hedge the currency exposure of the SRP’s anticipated future liabilities.
Medical Benefit PlanThe Medical Benefit Plan (MBP) was created under the Board of Directors’ resolution B/BD/2002/17 and F/BD/2002/18 of July 17, 2002 and became effective on January 1, 2003. Under the MBP, all plan members including existing staff or retirees contribute a percentage of their salary or pension while the Bank also contributes twice the total staff contribution towards the financing of the MBP. Contribution rates by staff members and retirees, which are based on marital status and number of eligible children, range between 0.70 percent to a maximum of 3.10 percent of salary or pension. An MBP board, composed of selected officers of the Bank and representatives of retirees and the staff association, oversees the management and activities of the MBP. The contributions from the Bank, staff and retirees are deposited in a trust account. In accordance with the directive establishing the Plan, all Plan members including staff and retirees are eligible as beneficiaries for making claims for medical services provided to them and their recognized dependants.
In accordance with IAS 19, and based on actuarial valuations, the pension and post employment medical benefit expenses for 2007 and 2006 for the Bank, the ADF and the NTF combined (the Bank Group) comprised the following:
Staff Retirement Plan Medical Benefit Plan
(UA millions) 2007 2006 2007 2006
Current service cost – gross 17.57 16.56 4.03 3.87
Less: estimated employee contributions (5.66) (5.05) (1.02) (0.97)
Net current service cost 11.91 11.51 3.01 2.90
Interest cost 11.53 9.39 2.12 2.07
Expected return on plan assets (12.65) (10.44) (0.40) (0.27)
Past service cost 1.07 - - -Expense for the year 11.86 10.46 4.73 4.70
At December 31, 2007, the Bank group’s liability to the SRP and the post-employment aspect of the MBP amounted to UA 7.37 million and UA 40.76 million respectively (2006: UA 34.40 million and UA 35.86 million respectively).
07_ADB_part b_UK_1.indd 132 11/04/08 15:15:42

133132
African Development Bank Chapter 005
Annual Report 2007 133132
At December 31, 2007 and 2006 the determination of these liabilities, which are included in “Other accounts payable” on the Balance Sheet is set out below:
Staff Retirement Plan Medical Benefit Plan
(UA millions) 2007 2006 2007 2006
Fair value of plan assets:
Market value of plan assets at beginning of year 199.48 166.76 7.00 4.76
Actual return on assets 10.11 10.92 0.52 0.26
Employer’s contribution 47.44 23.14 2.06 1.99
Plan participants’ contribution 5.66 5.05 1.02 0.99
Benefits paid (7.71) (6.39) (1.56) (1.00)
Market value of plan assets at end of year 254.98 199.48 9.04 7.00
Present value of defined benefit obligation:
Benefit obligation at beginning of year 233.88 200.57 42.86 44.08
Current service cost 11.91 11.51 3.01 2.90
Employee contributions 5.66 5.05 1.02 0.99
Interest cost 11.53 9.39 2.12 2.07
Actuarial loss/(gain) 7.08 13.75 2.35 (6.18)
Benefits paid (7.71) (6.39) (1.56) (1.00)
Benefit obligation at end of year 262.35 233.88 49.80 42.86
Funded status:
Liability recognized on the balance sheet at December 31, representing excess of benefit over plan asset (7.37) (34.40) (40.76) (35.86)
There were no unrecognized past service costs at December 31, 2007 and 2006. The cumulative amounts of actuarial gains and losses recognized in the statement of recognized income and expenses up to December 31, 2007 for the SRP and MBP were a net loss of UA 23.05 million and UA 1.32 million respectively (2006: SRP – UA 14.50 million; MBP – UA 3.55 million).
The following summarizes the funding status of the SRP at the end of the last five fiscal years:
(UA millions) 2007 2006 2005 2004 2003Staff Retirement PlanFair value of Plan assets 254.98 199.48 166.76 140.89 119.81 Present value of defined benefit obligation (262.35) (233.88) (200.57) (177.83) (156.74)Plan deficit (7.37) (34.40) (33.81) (36.94) (36.93)
Experience adjustments on plan assets 0.90 3.45 2.97 1.56 (1.26)Experience adjustments on plan liabilities (23.95) (17.95) (4.20) (1.53) (5.37)Net (23.05) (14.50) (1.23) 0.03 (6.63)
07_ADB_part b_UK_1.indd 133 11/04/08 15:15:42
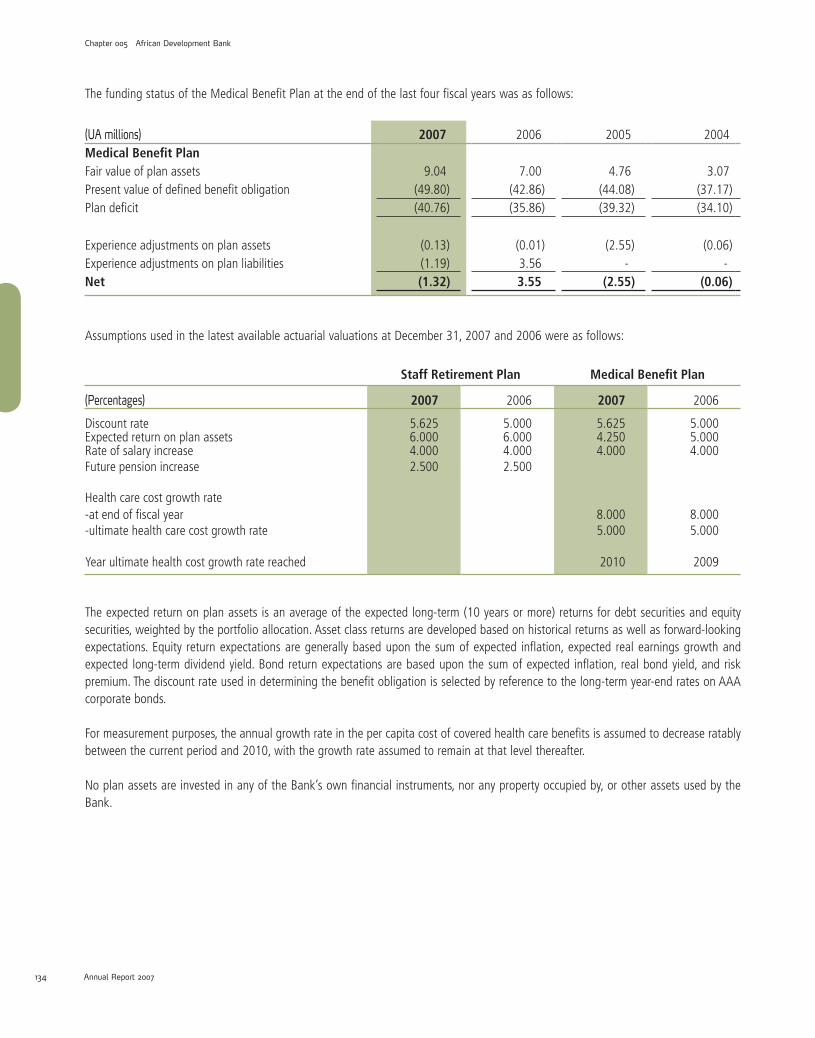
Chapter 005 African Development Bank
Annual Report 2007 135134 135134
The funding status of the Medical Benefit Plan at the end of the last four fiscal years was as follows:
(UA millions) 2007 2006 2005 2004Medical Benefit PlanFair value of plan assets 9.04 7.00 4.76 3.07Present value of defined benefit obligation (49.80) (42.86) (44.08) (37.17)Plan deficit (40.76) (35.86) (39.32) (34.10)
Experience adjustments on plan assets (0.13) (0.01) (2.55) (0.06)Experience adjustments on plan liabilities (1.19) 3.56 - -Net (1.32) 3.55 (2.55) (0.06)
Assumptions used in the latest available actuarial valuations at December 31, 2007 and 2006 were as follows:
Staff Retirement Plan Medical Benefit Plan
(Percentages) 2007 2006 2007 2006
Discount rate 5.625 5.000 5.625 5.000 Expected return on plan assets 6.000 6.000 4.250 5.000Rate of salary increase 4.000 4.000 4.000 4.000 Future pension increase 2.500 2.500
Health care cost growth rate -at end of fiscal year 8.000 8.000 -ultimate health care cost growth rate 5.000 5.000
Year ultimate health cost growth rate reached 2010 2009
The expected return on plan assets is an average of the expected long-term (10 years or more) returns for debt securities and equity securities, weighted by the portfolio allocation. Asset class returns are developed based on historical returns as well as forward-looking expectations. Equity return expectations are generally based upon the sum of expected inflation, expected real earnings growth and expected long-term dividend yield. Bond return expectations are based upon the sum of expected inflation, real bond yield, and risk premium. The discount rate used in determining the benefit obligation is selected by reference to the long-term year-end rates on AAA corporate bonds.
For measurement purposes, the annual growth rate in the per capita cost of covered health care benefits is assumed to decrease ratably between the current period and 2010, with the growth rate assumed to remain at that level thereafter.
No plan assets are invested in any of the Bank’s own financial instruments, nor any property occupied by, or other assets used by the Bank.
07_ADB_part b_UK_1.indd 134 11/04/08 15:15:43

135134
African Development Bank Chapter 005
Annual Report 2007 135134
The following table presents the weighted-average asset allocation at December 31, 2007 and 2006 for the Staff Retirement Plan:
(UA thousands) 2007 2006
Debt securities 101,993 79,794Equity securities 127,491 99,742Others 25,498 19,948Total 254,982 199,484
At December 31, 2007 and 2006, the assets of the MBP were invested primarily in time deposits.
The Bank’s estimate of contributions it expects to make to the SRP and the MBP for the year ended December 31, 2008, are UA 13.56 million and UA 2.58 million respectively.
The health care cost growth rate can significantly affect the reported post-retirement benefit income or costs and benefit obligations for the MBP.
The following table shows the effects of a one-percentage-point change in the assumed health care cost growth rate:
1% Increase 1% Decrease
(UA millions) 2007 2006 2007 2006
Effect on total service and interest cost 1.283 1.065 (0.839) (0.900)Effect on post-retirement benefit obligation 10.794 10.242 (8.363) (8.271)
NOTE S – RELATED PARTIES
The following related parties have been identified:The Bank makes or guarantees loans to some of its members who are also its shareholders, and borrows funds from the capital markets in the territories of some of its shareholders. As a multilateral development institution with membership comprising 53 African states and 24 non-African states (the “regional members” and “non-regional members” respectively), subscriptions to the capital of the Bank are made by all its members. All the powers of the Bank are vested in the Board of Governors, which consists of the Governors appointed by each member of the Bank, who exercise the voting power of the appointing member country. Member country subscriptions and voting powers are disclosed in Note N. The Board of Directors, which is composed of eighteen (18) Directors elected by the member countries, is responsible for the conduct of the general operations of the Bank, and for this purpose, exercises all the powers delegated to it by the Board of Governors. The Bank also makes or guarantees loans to certain of the agencies of its regional member countries and to public and private enterprises operating within such countries. Such loans are approved by the Board of Directors.
In addition to its ordinary resources, the Bank administers the resources of other entities under special arrangements. In this regard, the Bank administers the resources of the ADF. Furthermore, the Bank administers various special funds and trust funds, which have purposes that are consistent with its objectives of promoting the economic development and social progress of its regional member countries. In this connection, the Bank administers the NTF as well as certain multilateral and bilateral donor funds in the form of grants.
The ADF was established pursuant to an agreement between the Bank and certain countries. The general operation of the ADF is con-ducted by a 12-member Board of Directors of which 6 members are selected by the Bank. The Bank exercises 50 percent of the voting power in the ADF and the President of the Bank is the ex-officio President of the Fund. To carry out its functions, the ADF utilizes the offices, staff, organization, services and facilities of the Bank, for which it reimburses the Bank based on an agreed cost-sharing formula, driven in large part by the number of programs and projects executed during the year.
07_ADB_part b_UK_1.indd 135 11/04/08 15:15:43

Chapter 005 African Development Bank
Annual Report 2007 137136 137136
Chapter 006 African Development Fund
The Bank’s investment in the ADF is included in Equity Participations and disclosed in Note J. In addition to the amount reported as equity participation, the Bank periodically makes allocations to the Fund, to further its objectives. Net income allocations by the Bank to ADF are reported as Other Resources in the Fund’s financial statements. Net income allocation to the Fund in 2007 amounted to UA 13.70 million (2006: UA 21.30 million).
The NTF is a special fund administered by the Bank with resources contributed by Nigeria. The ADB Board of Directors conducts the gen-eral operations of NTF on the basis of the terms of the NTF Agreement and in this connection, the Bank consults with the Government of Nigeria. The NTF also utilizes the offices, staff, organization, services and facilities of the Bank for which it reimburses to the Bank its share of administrative expenses for such utilization. The share of administrative expenses reimbursed to the Bank by both the ADF and NTF are disclosed in Note Q.
Grant resources administered by the Bank on behalf of other donors, including its member countries, agencies and other entities are generally restricted for specific uses, which include the co-financing of Bank’s lending projects, debt reduction operations and technical assistance for borrowers including feasibility studies. Details of the outstanding balance on such grant funds at December 31, 2007 and 2006 are disclosed in Note V-5.
The Bank also administers the SRP and MBP. The activities of the SRP and MBP are disclosed in Note R.
Management Personnel CompensationCompensation paid to the Bank’s management personnel and executive directors during the years ended December 31, 2007, and 2006 was made up as follows:
(UA thousands) 2007 2006
Salaries 14,164 12,211Termination and other benefits 5,961 3,929Contribution to retirement and medical plan 2,927 2,420Total 23,052 18,560
The Bank may also provide personal loans and advances to its staff, including those in management. Such loans and advances, guar-anteed by the terminal benefits payable at the time of departure from the Bank, are granted in accordance with the Bank’s rules and regulations. At December 31, 2007 outstanding balances on loans and advances to management staff amounted to UA 3.23 million (2006: UA 1.93 million). No expense was recognized during the year in respect of impairment on debts due from related parties.
NOTE T – SEGMENT REPORTING
The Bank is a multilateral development finance institution dedicated to the economic and social progress of its regional member states. The Bank’s products and services are similar and are structured and distributed in a fairly uniform manner across borrowers. In the opinion of management, the Bank operates in a single operating segment.
NOTE U – APPROVAL OF FINANCIAL STATEMENTS
On April 2, 2008, the Board of Directors authorized these financial statements for issue to the Board of Governors. The financial statements are expected to be approved by the Board of Governors at its annual meeting in May 2008.
07_ADB_part b_UK_1.indd 136 11/04/08 15:15:43

137136
African Development Bank Chapter 005
137136 Annual Report 2006
African Development Fund Chapter 006
NOTE V – SUPPLEMENTARY DISCLOSURES
NOTE V-1: EXCHANGE RATESThe rates used for translating currencies into Units of Account at December 31, 2007 and 2006 were as follows:
2007 2006
1 UA = SDR = Algerian DinarAngolan Kwanza Botswana PulaBrazilian RealCanadian DollarChinese YuanCFA FrancDanish KronerEgyptian PoundEthiopian BirrEuroGambian DalasiGhanaian Cedi *Guinean FrancIndian RupeeJapanese YenKenyan ShillingKorean WonKuwaiti DinarLibyan DinarMauritian RupeeMoroccan DirhamNigerian NairaNorwegian KronePound SterlingSao Tomé DobraSaudi Arabian RiyalSouth African RandSwedish KronaSwiss FrancTunisian DinarUgandan ShillingUS DollarZimbabwean Dollar
106.161000 119.287000
9.502360 2.797830 1.561440
11.530200 704.144000
8.020210 8.649740
13.304000 1.073460
33.937600 1.424030
8,283.200000 62.277700
179.947000 105.994 000
1,482.590000 0.431408 1.932370
44.588500 12.235300
195.584000 8.550740 0.788780
19,668.400000 5.925930
10.761500 10.208800 1.778570 1.936680
2,727.920000 1.580250
391.005000
107.190000 120.940000
9.090080 3.215210 1.753080
11.747400 749.293000
8.517020 8.474270
13.127200 1.142290
41.391100 13,915.500000 8,283.200000
66.539800 178.948000 105.462000
1,398.490000 0.434622 1.932370
51.656400 12.728400
191.482000 9.410170 0.766377
17,360.200000 5.641490
10.485700 10.339000
1.835820 1.960350
2,726.760000 1.504400
372.130000
* The Ghanaian Cedi was redenominated during 2007.
No representation is made that any currency held by the Bank can be or could have been converted into any other currency at the cross rates resulting from the rates indicated above.
07_ADB_part b_UK_1.indd 137 11/04/08 15:15:44

139138 139138
Chapter 006 African Development Fund
Annual Report 2006
NOTE V-2: OTHER DEVELOPMENT ASSISTANCE ACTIVITIES
(i) Democratic Republic of Congo (DRC)In connection with an internationally co-coordinated effort between the Bank, the International Monetary Fund (the IMF), the World Bank and other bilateral and multilateral donors to assist the Democratic Republic of Congo (DRC) in its reconstruction efforts, the Board of Directors on June 26, 2002, approved an arrears clearance plan for the DRC. Under the arrears clearance plan, contributions received from the donor community were used immediately for partial clearance of the arrears owed by the DRC. The residual amount of DRC’s arrears to the Bank and loan amounts not yet due were consolidated into new contractual receivables, such that the present value of the new loans was equal to the present value of the amounts that were owed under the previous contractual terms. The new loans carry the weighted average interest rate of the old loans. In approving the arrears clearance plan, the Board of Directors considered the following factors: a) the arrears clearance plan is part of an internationally coordinated arrangement for the DRC; b) the magnitude of DRC’s arrears to the Bank ruled out conventional solutions; c) the prolonged armed conflict in the DRC created extensive destruction of physical assets, such that the DRC had almost no capacity for servicing its debt; and d) the proposed package would result in a significant improvement in its repayment capacity, if appropriate supporting measures are taken. Furthermore, there was no automatic linkage between the arrears clearance mechanism and the debt relief that may be subsequently provided on the consolidated facility. In June 2004, the DRC reached its decision point under the Heavily Indebted Poor Countries (HIPC) initiative. Consequently, the consolidated facility has since that date benefited from partial debt service relief under HIPC.
A special account, separate from the assets of the Bank, was established for all contributions towards the DRC arrears clearance plan. Such contributions may include allocations of the net income of the Bank that the Board of Governors may from time to time make to the special account, representing the Bank’s contribution to the arrears clearance plan. The amount of such net income allocation is subject to the approval of the Boards of Governors of the Bank, typically occurring during the annual general meeting of the Bank. Consequently, income received on the consolidated DRC loans is recognized in current earnings and is transferred out of reserves to the special account only after the formal approval of such transfer, in whole or in part, by the Board of Governors of the Bank.
(ii) Post-Conflict Countries AssistanceThe Post Conflict Countries’ Fund was established as a framework to assist countries emerging from conflict in their efforts towards re- engagement with the donor community in order to reactivate development assistance and help these countries reach the Heavily Indebted Poor Countries (HIPC) decision point to qualify for debt relief after clearing their loan arrears to the Bank Group. The frame-work entails the setting aside of a pool of resources through a separate facility with allocations from the ADB’s net income, and contributions from the ADF and other private donors. Resources from the facility are provided on a case-by-case basis to genuine post-conflict countries not yet receiving debt relief to fill financing gaps after maximum effort by the post-conflict country to clear its arrears to the Bank Group. In this connection, the Board of Governors by its Resolution B/BG/2004/07 of May 25, 2004, established the Post-Conflict Countries Facility (PCCF) under the administration of the ADF and approved an allocation of UA 45 million from the 2003 net income of the Bank. The Board of Governors also, by its resolution B/BG/2005/05 of May 18, 2005, approved an additional allocation of UA 30 million from the 2004 net income as the second installment of the Bank’s contribution to the facility and by its resolution B/BG/2006/04 of May 17, 2006, the Board of Governors also approved the third and final installment of the Bank’s allocation of UA 25 million from the 2005 net income. By policy, contributions made by ADB to the PCCF are not used to clear the debt owed to the Bank by beneficiary post-conflict countries.
(iii) Heavily Indebted Poor Countries (HIPC) InitiativeThe Bank participates in a multilateral initiative for addressing the debt problems of countries identified as HIPCs. Under this initiative, creditors provide debt relief for eligible countries that demonstrate good policy performance over an extended period to bring their debt burdens to sustainable levels. Under the original HIPC framework, selected loans to eligible beneficiary countries were paid off by the HIPC Trust Fund at a price equivalent to the lower of the net present value of the loans or their nominal values, as calculated using the methodology agreed under the initiatives.
Following the signature of a HIPC debt relief agreement, the relevant loans were paid off at the lower of their net present value or their carrying value. On average, loans in the ADB’s portfolio carry higher interest rates than the present value discount rates applied and therefore the net present value of the loans exceeds the book value. Consequently, affected ADB loans were paid off by the HIPC Trust Fund at book values.
07_ADB_part b_UK_1.indd 138 11/04/08 15:15:44
139138
African Development Bank Chapter 005
Annual Report 2007 139138
The HIPC initiative was enhanced in 1999 to provide greater, faster and more poverty-focused debt relief. This was achieved by reduc-ing the eligibility criteria for qualification under the initiative and by commencing debt relief much earlier than under the original framework. Under the enhanced framework, where 33 African countries are eligible, the debt relief is delivered through annual debt service reductions, as well as the release of up to 80 percent of annual debt service obligations as they come due until the total debt relief is provided. In addition, interim financing between the decision and completion points of up to 40 percent of total debt relief is provided whenever possible within a 15-year horizon. At December 31, 2007, the Board of Directors had approved relief for 26 ADB borrowing countries, of which 19 had reached the completion point.
(iv) Multilateral Debt Relief Initiative (MDRI)At the Gleneagles Summit on July 8, 2005, the Group of 8 major industrial countries agreed on a proposal for the ADF, the International Development Association (IDA), and the International Monetary Fund (IMF) to cancel 100 percent of their claims on countries that have reached, or will reach, the completion point under the enhanced HIPC Initiative.
The main objective of the MDRI is to complete the process of debt relief for HIPCs by providing additional resources to help 38 countries worldwide, 33 of which are in Africa, to make progress towards achieving the Millennium Development Goals (MDGs), while simultaneously safeguarding the long-term financing capacity of the ADF and the IDA. The debt cancellation would be delivered by relieving post-completion-point HIPCs’ repayment obligations and adjusting their gross assistance flows downward by the same amount. To maintain the financial integrity of the ADF, donors have committed to make additional contributions to the ADF to match “dollar-for-dollar” the foregone principal and service charge payments.
The MDRI became effective for the ADF on September 1, 2006. As of that date, the ADF wrote down its balance of disbursed and outstanding loans net of HIPC relief by an amount of UA 3.84 billion, with a corresponding decrease as of that date in the ADF’s net assets. Reduction in ADF net assets results in a decrease in the value of the Bank’s investment in the Fund. Subsequent write-down of loan balances is effected as and when other countries reach their HIPC completion point and are declared beneficiaries of MDRI loan cancellation. The reduction in the net asset value of the ADF does not include loans outstanding to MDRI countries that have not reached their HIPC completion points at the end of the year.
NOTE V-3: SPECIAL FUNDS
Under Article 8 of the Agreement Establishing the Bank, the Bank may establish or be entrusted with the administration of special funds. At December 31, 2007 and 2006, the following funds were held separately from those of the ordinary capital resources of the Bank:
(i) The NTF was established under an agreement signed on February 26, 1976 (the Agreement) between the African Development Bank and the Federal Republic of Nigeria. The Agreement stipulates that the NTF shall be in effect for a period of 30 years from the date the Agreement became effective and that the resources of the NTF shall be transferred to Nigeria upon termination. However, the 30-year sunset period may be extended by mutual agreement between the Bank and Nigeria. The terms of the current agreement which terminated on April 25, 2006 have been extended twice with the latest one-year extension up to April 25, 2008. Following an independent review of the operations of the Fund over the current Agreement period, both the Government of Nigeria and the Bank have agreed in principle to renew the NTF Agreement for a period of ten years starting from April 26, 2008. The initial capital of the NTF was Naira 50 million payable in two equal installments of Naira 25 million each, in freely convertible currencies. The first installment, equivalent to US$ 39.90 million, was received by the Bank on July 14, 1976, and payment of the second installment, equivalent to US$ 39.61 million, was made on February 1, 1977.
During May 1981, the Federal Republic of Nigeria announced the replenishment of the NTF with Naira 50 million. The first installment of Naira 35 million (US$ 52.29 million) was paid on October 7, 1981. The second installment of Naira 8 million (US$ 10.87 million) was received on May 4, 1984. The payment of the third installment of Naira 7 million (US$ 7.38 million) was made on September 13, 1985.Following a request by the Government of Nigeria on June 14, 2006, a payment of US$ 200 million (UA 135.74 million) was made to the Government of Nigeria from the resources of the Fund.
07_ADB_part b_UK_1.indd 139 11/04/08 15:15:44

Chapter 005 African Development Bank
Annual Report 2007 141140 141140
The resources of the NTF at December 31, 2007 and 2006 are summarized below:
(UA thousands) 2007 2006Contribution received 128,586 128,586Funds generated (net) 269,657 251,201
Adjustment for translation of currencies (124,777) (111,666)
273,466 268,121Represented by:Due from banks 6,331 2,404Investments 190,346 191,760Accrued income and charges receivable on loans 16,708 9,685Accrued interest on investments 520 960Other amounts receivable 177 89Loans outstanding 64,383 64,274
278,465 269,172Less: Current accounts payable (4,999) (1,051)
273,466 268,121
(ii) The Special Relief Fund (for African countries affected by drought) was established by Board of Governors’ Resolution 20-74 to assist African countries affected by unpredictable disasters. The purpose of this fund was subsequently expanded in 1991 to include the provision of assistance, on a grant basis, to research institutions whose research objectives in specified fields are likely to facilitate the Bank’s objective of meeting the needs of regional member countries in those fields. The resources of this Fund consist of contributions by the Bank, the ADF and various member states.
The summary statement of the resources and assets of the Special Relief Fund (for African countries affected by drought) as at December 31, 2007 and 2006 follows:
(UA thousands) 2007 2006
Fund balance 62,448 62,448Funds generated 3,876 3,808Funds allocated to SDA 1 1Less: Relief disbursed (48,931) (46,996)
17,394 19,261Represented by:Due from bank 799 757Investments 16,550 18,466Interest receivable 45 38
17,394 19,261
At December 31, 2007, a total of UA 3.86 million (2006: UA 4.67 million) had been committed but not yet disbursed under the Special Relief Fund.
07_ADB_part b_UK_1.indd 140 11/04/08 15:15:45

141140
African Development Bank Chapter 005
Annual Report 2007 141140
NOTE V-4: TRUST FUNDS
The Bank has been entrusted, under Resolutions 11-70, 19-74 and 10-85 of the Board of Governors, with the administration of the Mamoun Beheiry Fund, the Arab Oil Fund, and the Special Emergency Assistance Fund for Drought and Famine in Africa. These funds, held separately from those of the ordinary resources of the Bank, are maintained and accounted for in specific currencies, which are translated into Units of Account at exchange rates prevailing at the end of the year.
(i) The Mamoun Beheiry Fund was established under Board of Governors’ Resolution 11-70 of October 31, 1970, whereby Mr. Mamoun Beheiry, former President of the Bank, agreed to set up a fund, which could be used by the Bank to reward staff members who had demonstrated outstanding performance in fostering the objectives of the Bank.
(ii) The Arab Oil Fund (contribution of Algeria) was established following Board of Governors’ Resolution 19-74 of July 4, 1974. Under a protocol agreement dated November 15, 1974, the Bank received the sum of US$ 20 million from the Government of Algeria to be kept as a Trust Fund from which loans could be granted to member countries affected by high oil prices. On August 11, 1975, an amount of US$ 5.55 million was refunded to Algeria upon request, leaving a balance of US$ 14.45 million, from which loans refundable directly to Algeria have been made. At December 31, 2007, a total of US$ 13.45 million (2006: US$ 13.45 million) had been so repaid.
(iii) The Special Emergency Assistance Fund for Drought and Famine in Africa (SEAF) was established by the 20th Meeting of Heads of State and Government of member countries of the African Union formerly Organization of African Unity (OAU) held in Addis Ababa, Ethiopia, from November 12 to 15, 1984, under Resolution AHG/Res. 133 (XX), with the objective of giving assistance to African member countries affected by drought and famine.
07_ADB_part b_UK_1.indd 141 11/04/08 15:15:45

Chapter 005 African Development Bank
Annual Report 2007 143142 143142
The financial highlights of these Trust Funds at December 31, 2007 and 2006 are summarized below:
(UA thousands) 2007 2006i) Mamoun Beheiry Fund
Contribution 152 152Income from investments 242 233
394 385Less: Prize awarded (30) (30) Gift (25) (25)
339 330Represented by:Short-term deposits 316 310Due from banks 17 17Accrued interest 6 3
339 330
ii) Arab Oil Fund (contribution of Algeria)Net contribution 632 665Represented by:Loans disbursed net of repayments 632 665
iii) Special Emergency Assistance Fund for Drought and Famine in AfricaContributions 19,923 20,927Funds generated 5,290 5,331
25,213 26,258Relief granted (20,940) (21,995)
4,273 4,263Represented by:Due from banks 71 68Investments 4,193 4,193Accrued interest 9 2
4,273 4,263
Total Resources & Assets of Trust Funds 5,244 5,258
07_ADB_part b_UK_1.indd 142 11/04/08 15:15:45
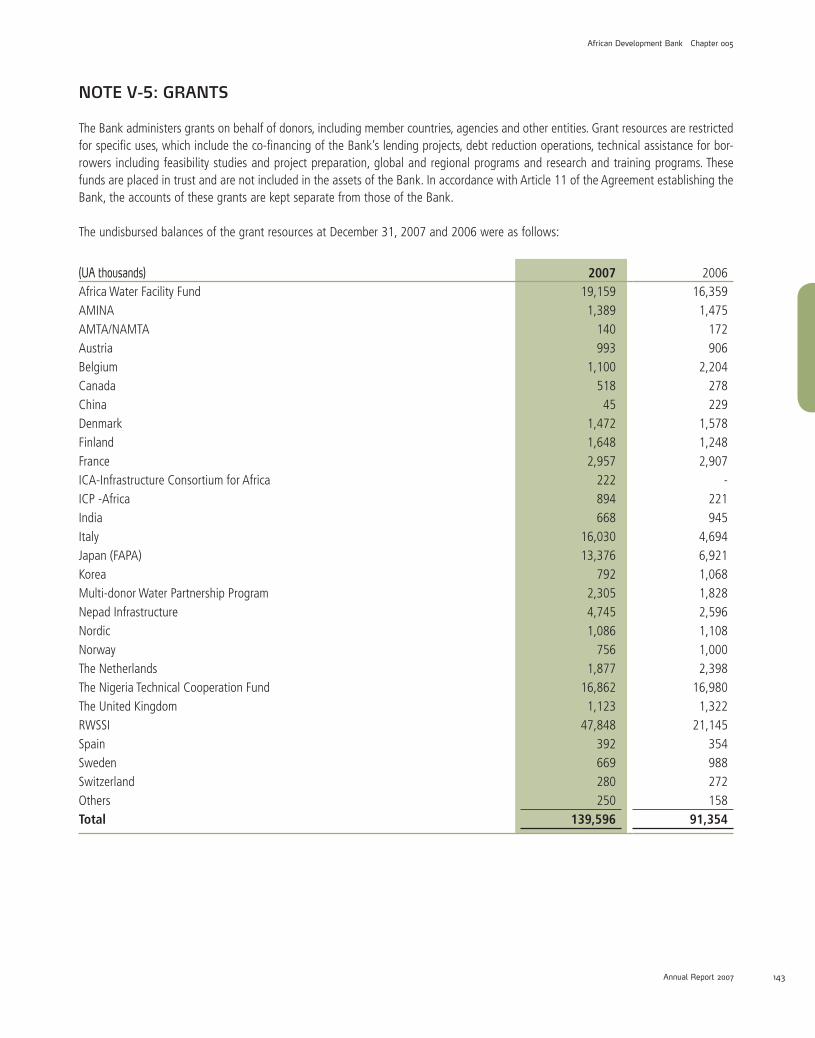
143142
African Development Bank Chapter 005
Annual Report 2007 143142
NOTE V-5: GRANTS
The Bank administers grants on behalf of donors, including member countries, agencies and other entities. Grant resources are restricted for specific uses, which include the co-financing of the Bank’s lending projects, debt reduction operations, technical assistance for bor-rowers including feasibility studies and project preparation, global and regional programs and research and training programs. These funds are placed in trust and are not included in the assets of the Bank. In accordance with Article 11 of the Agreement establishing the Bank, the accounts of these grants are kept separate from those of the Bank.
The undisbursed balances of the grant resources at December 31, 2007 and 2006 were as follows:
(UA thousands) 2007 2006Africa Water Facility Fund 19,159 16,359AMINA 1,389 1,475AMTA/NAMTA 140 172Austria 993 906Belgium 1,100 2,204Canada 518 278China 45 229Denmark 1,472 1,578Finland 1,648 1,248France 2,957 2,907ICA-Infrastructure Consortium for Africa 222 - ICP -Africa 894 221India 668 945Italy 16,030 4,694Japan (FAPA) 13,376 6,921Korea 792 1,068Multi-donor Water Partnership Program 2,305 1,828Nepad Infrastructure 4,745 2,596Nordic 1,086 1,108Norway 756 1,000The Netherlands 1,877 2,398The Nigeria Technical Cooperation Fund 16,862 16,980The United Kingdom 1,123 1,322RWSSI 47,848 21,145Spain 392 354Sweden 669 988Switzerland 280 272Others 250 158Total 139,596 91,354
07_ADB_part b_UK_1.indd 143 11/04/08 15:15:46

Chapter 005 African Development Bank
Annual Report 2007 145144 145144
African Development BankTemporary Relocation Agency15, Avenue du Ghana1002 Tunis BelvédèreTunisie
Independent Auditors’ Report to the Board of Governors of the African Development BankYear ended 31 December 2007
We have audited the accompanying financial statements of the African Development Bank (‘‘the Bank’’) which comprise the balance sheet as at 31 December 2007 and the income statement, the statement of recognized income and expense and cash flow statement for the year then ended, and a summary of significant accounting policies and other explanatory notes as set out in notes A to V.
The financial statements have been prepared under the accounting policies set out therein, for the purpose of submitting approved and audited financial statements to the Board of Governors as required by Article 32(d) of the Agreement establishing the Bank. This report is made solely to the Bank’s Board of Governors, as a body, in accordance with Article 32(d) of the Agreement Establishing the Bank. Our audit work has been undertaken so that we might state to the Bank’s members those matters we are required to state to them in an auditors’ report and for no other purpose. To the fullest extent permitted by law, we do not accept or assume responsibility to anyone other than the Bank and the Bank’s members as a body, for our audit work, for this report, or for the opinions we have formed.
Management’s Responsibility for the Financial StatementsManagement is responsible for the preparation and fair presentation of these financial statements in accordance with International Finan-cial Reporting Standards, and in the manner required by the Agreement Establishing the Bank. This responsibility includes: designing, implementing and maintaining internal control relevant to the preparation and fair presentation of financial statements that are free from material misstatements, whether due to fraud or error; selecting and applying appropriate accounting policies; and making accounting estimates that are reasonable in the circumstances.
Auditors’ ResponsibilityOur responsibility is to express an opinion on these financial statements based on our audit. We conducted our audit in accordance with International Standards on Auditing. Those standards require that we comply with relevant ethical requirements and plan and perform the audit to obtain reasonable assurance whether the financial statements are free of material misstatement.
An audit involves performing procedures to obtain audit evidence about the amounts and disclosures in the financial statements. The procedures selected depend on our judgment, including the assessment of the risks of material misstatement of the financial statements,
Téléphone: +33 (0)1 55 68 68 68Télécopie: +33 (0)1 55 68 73 00Site internet: www.kpmg.fr
KPMG S.A. cabinet français membre de KPMG International.une coopérative de droit suisse.
Société anonyme d’expertisecomptable - commissariat auxcomptes à directoire et conseilde surveillance.Inscrite au Tableau de l’ordreà Paris sous le no 14-30080101et à la Compagnie desCommissaires aux Comptesde Versailles.
Siège social :KPMG S.A.Immeuble le Palatin3, cours du Triangle92939 Paris La Défense CedexCapital : 5 497 100 €Code APE 741 C775726417 R.C.S. NanterreTVA Union EuropéenneFR 77 775 726 417
1, cours Valmy92923 Paris La Défense CedexFrance
KPMG Audit
Téléphone: +33 (0)1 55 68 68 68Télécopie: +33 (0)1 55 68 73 00Site internet: www.kpmg.fr
KPMG S.A. cabinet français membre de KPMG International.une coopérative de droit suisse.
Société anonyme d’expertisecomptable - commissariat auxcomptes à directoire et conseilde surveillance.Inscrite au Tableau de l’ordreà Paris sous le no 14-30080101et à la Compagnie desCommissaires aux Comptesde Versailles.
Siège social :KPMG S.A.Immeuble le Palatin3, cours du Triangle92939 Paris La Défense CedexCapital : 5 497 100 €Code APE 741 C775726417 R.C.S. NanterreTVA Union EuropéenneFR 77 775 726 417
1, cours Valmy92923 Paris La Défense CedexFrance
KPMG Audit
07_ADB_part b_UK_1.indd 144 11/04/08 15:15:47

145144
African Development Bank Chapter 005
Annual Report 2007 145144
whether due to fraud or error. In making those risk assessments, we consider internal control relevant to the entity’s preparation and fair presentation of the financial statements in order to design audit procedures that are appropriate in the circumstances, but not for the pur-pose of expressing an opinion on the effectiveness of the entity’s internal control. An audit also includes evaluating the appropriateness of accounting principles used and the reasonableness of accounting estimates made by management, as well as evaluating the overall presentation of the financial statements.
We believe that the audit evidence we have obtained is sufficient and appropriate to provide a basis for our opinion.
Opinion In our opinion, the financial statements present fairly, in all material respects, the financial position of the Bank as at 31 December 2007, and of its financial performance and its cash flows for the year then ended in accordance with International Financial Reporting Standards.
Emphasis of MatterWithout qualifying our opinion we draw attention to Note C which highlights the effect of new and revised international financial re-porting standards. For the years ended 31 December 2005 and 2006 the independent auditor issued a qualified opinion for the financial statements because International Financial Reporting Standard IAS 32, “Financial Instruments: Disclosure and Presentation”, required that the Bank’s, member countries’ capital subscriptions be reclassified in the Bank’s financial statements as financial liabilities instead of equity.
On 14 February 2008 the International Accounting Standards Board (IASB), issued amendments to IAS1 and IAS32. The Bank’s member countries’ capital subscriptions are puttable financial instruments that meet the requirements for equity classification under the amended standards. Prior to the amendments, the Bank also classified these financial instruments as equity. The amendments were issued after the balance sheet date, but before the approval of the financial statements. The Bank has opted to early adopt the amended standards which had no effects on the Bank’s financial statements.
Paris La Défense, 2nd April 2008
KPMG Audit A division of KPMG S.A.
Pascal Brouard Partner
African Development BankIndependent Auditors’ Report to the Board of Governors
of the African Development BankTéléphone: +33 (0)1 55 68 68 68Télécopie: +33 (0)1 55 68 73 00Site internet: www.kpmg.fr
KPMG S.A. cabinet français membre de KPMG International.une coopérative de droit suisse.
Société anonyme d’expertisecomptable - commissariat auxcomptes à directoire et conseilde surveillance.Inscrite au Tableau de l’ordreà Paris sous le no 14-30080101et à la Compagnie desCommissaires aux Comptesde Versailles.
Siège social :KPMG S.A.Immeuble le Palatin3, cours du Triangle92939 Paris La Défense CedexCapital : 5 497 100 €Code APE 741 C775726417 R.C.S. NanterreTVA Union EuropéenneFR 77 775 726 417
1, cours Valmy92923 Paris La Défense CedexFrance
KPMG Audit
07_ADB_part b_UK_1.indd 145 11/04/08 15:15:48

Chapter 005 African Development Bank
Annual Report 2007 PB146
ADMINISTRATIVE BUDGET FOR FINANCIAL YEAR 2008
(UA thousands)
Description
Personnel Expenses Salaries Benefits Other Employee Expenses Short Term and Technical Assistance Staff Consultants Staff Training
General Expenses Official Missions Accommodation Equipment Rental, Repairs and Maintenance Communication Expenses Printing, Publishing & Reproduction Office Supplies and Stationery Library Other Institutional Expenses
Total Administrative Expenses Depreciation
Total
Less: Management FeesNet Administrative Budget
83,961 54,784 9,179 1,063
16,169 3,523
168,679
15,970 9,765 5,218 6,085 1,486
636719
10,658 50,537
219,216 5,200
224,416
(158,160) 66,256
07_ADB_part b_UK_1.indd 146 11/04/08 15:15:48