the agency’s financial statements for 2018 · analysis of financial statements 5. the financial...
TRANSCRIPT

The Agency’s Financial Statementsfor 2018
GC(63)/6
The Agency’s Financial Statements for 2018
1

THE AGENCY’S FINANCIAL STATEMENTS FOR 2018 _________________________________________
Printed by the International Atomic Energy Agency July 2019
Atoms for Peace and Development

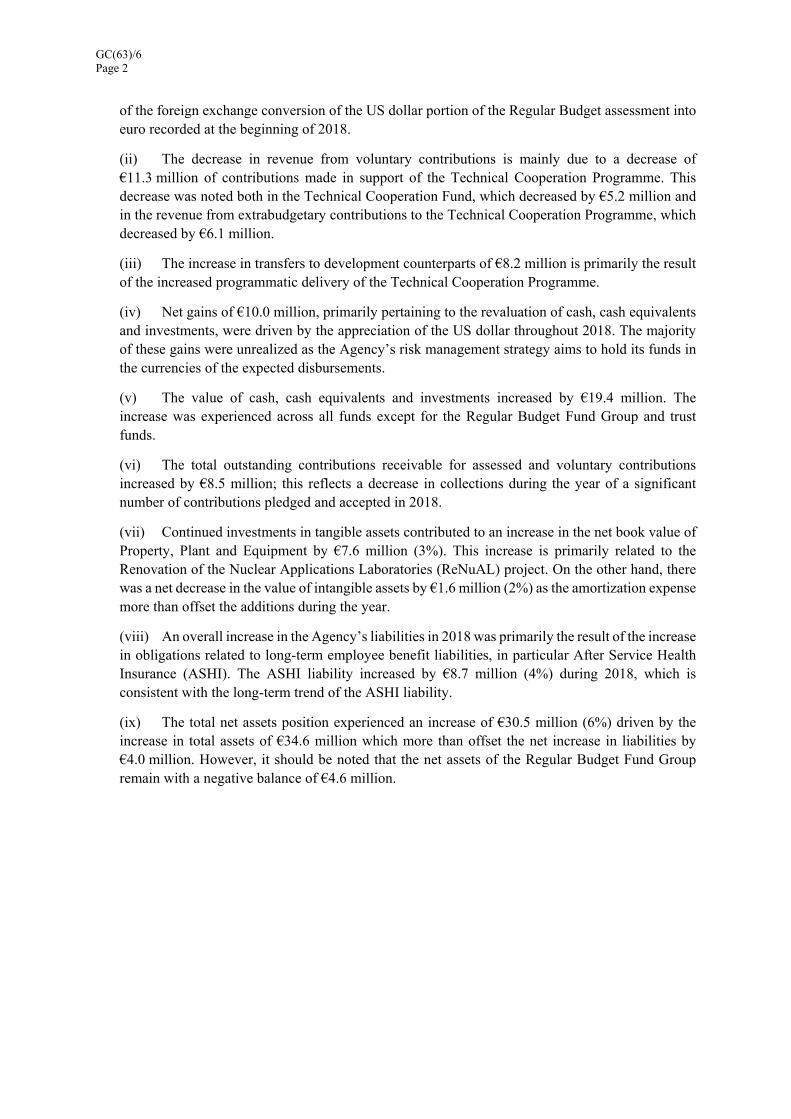
GC(63)/6 Page i
Report by the Board of Governors
1. In accordance with Financial Regulation 11.03(b)[1], the Board of Governors hereby transmits to the Members of the Agency the report of the External Auditor on the Agency’s financial statements for 2018.
2. The Board has examined the report of the External Auditor and the report by the Director General on the financial statements, and also the financial statements themselves as well as the notes and annexes thereto (Parts I to V of GOV/2019/6) and submits the following draft resolution for the consideration of the General Conference.
3. The Board takes note of the report of the External Auditor on the External Auditor’s planned scope, timing and other information related to the audit of the Agency’s financial statements for 2019 (Part VI of GOV/2019/6).
The General Conference, Having regard to Financial Regulation 11.03(b), Takes note of the report of the External Auditor on the Agency’s financial statements for the year 2018 and of the report of the Board of Governors thereon [*]. [*] GC(63)/6 [1] INFCIRC/8/Rev.4

GC(63)/6 Page iii
Sixty third regular session
The Agency’s Financial Statements For 2018 Contents Page Table of contents iii
Report of the Director General on the Agency’s Financial Statements for the year ended 31 December 2018 1
Statement of the Director General’s responsibilities and confirmation of the financial statements with the financial regulations of the International Atomic Energy Agency as at 31 December 2018 17
Part I - Audit opinion 19
Part II - Financial Statements 25
I Statement of financial position as at 31 December 2018 28
II Statement of financial performance for the year ended 31 December 2018 29
III Statement of changes in equity for the year ended 31 December 2018 30
IV Statement of cash flow for the year ended 31 December 2018 31
Va Statement of comparison of budget and actual amounts (Regular Budget Fund operational portion) for the year ended 31 December 2018 32
Vb Statement of comparison of budget and actual amounts (Regular Budget Fund capital portion) for the year ended 31 December 2018 33
VI Statement of segment reporting by Major Programme for the year ended 31 December 2018 34
VIIa Statement of segment reporting by Fund – Financial position as at 31 December 2018 36
VIIb Statement of segment reporting by Fund – Financial performance for the year ended 31 December 2018 38
Part III - Notes to the Financial Statements 41
Part IV - Annexes to the Financial Statements 115
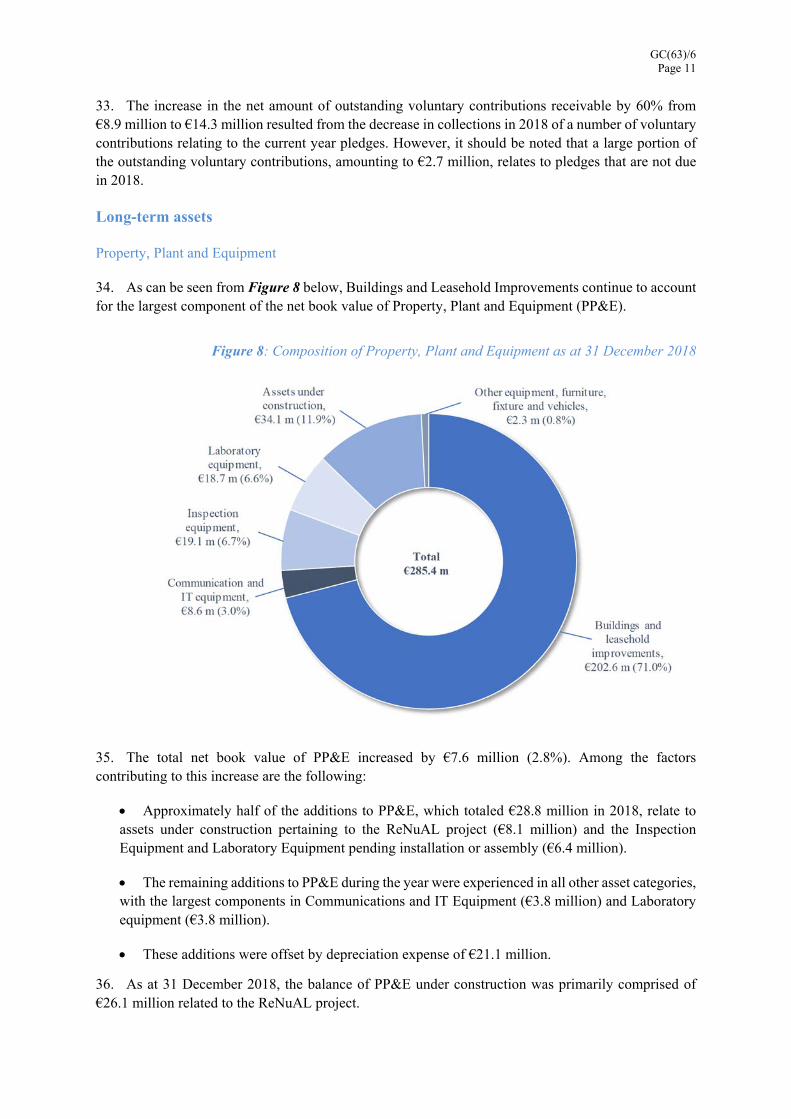
A1 List of Acronyms 117
A2 Revenue from contributions for the year ended 31 December 2018 119
A3 Status of outstanding contributions as at 31 December 2018 124
A4 Status of deferred revenue as at 31 December 2018 129
A5 Status of cash surplus as at 31 December 2018 131
A6 Statement of investments as at 31 December 2018 132

GC(63)/6 Page iv
Part V - Report of the External Auditor on the audit of the financial statements of the International Atomic Energy Agency for the year ended 31 December 2018 133

GC(63)/6 Page 1
REPORT OF THE DIRECTOR GENERAL ON THE AGENCY’S FINANCIAL STATEMENTS FOR THE YEAR
ENDED 31 DECEMBER 2018
Introduction
1. I have the honour to present the financial statements of the International Atomic Energy Agency (hereafter IAEA or the Agency) for the year ended 31 December 2018. In accordance with the Financial Regulation 11.03 of the Agency, the financial statements are submitted with the report of the External Auditor that contains an unqualified opinion on the financial statements.
2. The IAEA is a not-for-profit autonomous intergovernmental organization founded in 1957 in accordance with its Statute. It is part of the United Nations Common System and the relationship with the United Nations is regulated by the “Agreement Governing the Relationship between the United Nations and the International Atomic Energy Agency” which came into force on 14 November 1957.
3. The Agency’s statutory objective is to seek to accelerate and enlarge the contribution of atomic energy to peace, health and prosperity throughout the world and to ensure, so far as it is able, that assistance provided by it or at its request or under its supervision or control is not used in such a way as to further any military purpose. To fulfil this statutory objective, the Agency manages its work under the following six Major Programmes:
Nuclear Power, Fuel Cycle and Nuclear Science;
Nuclear Techniques for Development and Environmental Protection;
Nuclear Safety and Security;
Nuclear Verification;
Policy, Management and Administration Services; and
Management of Technical Cooperation for Development.
4. The Agency carries out its mandate within a results-based framework ensuring effectiveness, accountability and transparency. This framework is supported by high quality financial reporting and management information. The comprehensive financial statements prepared under the International Public Sector Accounting Standards (IPSAS) are a key enabler to allow the Agency to deliver its mandate in an efficient manner.
Analysis of Financial Statements
5. The financial statements of the Agency have been prepared on the accrual basis in accordance with IPSAS. The budget, as well as the budgetary information contained in the financial statements, continues to be prepared on a modified cash basis. The Agency’s functional currency is the euro.
6. During 2018, the Agency continued to focus on the effective implementation of programmatic activities and the efficiency of the process supporting such implementation. Within this context, the following are some of the highlights of the 2018 financial year in perspective:
(i) The Regular Budget Fund (RBF) experienced a utilization rate of 99% during 2018. The slight decrease in revenue from assessed contributions of €1.6 million (0.4%), is the reflection
GC(63)/6 Page 2
of the foreign exchange conversion of the US dollar portion of the Regular Budget assessment into euro recorded at the beginning of 2018.
(ii) The decrease in revenue from voluntary contributions is mainly due to a decrease of €11.3 million of contributions made in support of the Technical Cooperation Programme. This decrease was noted both in the Technical Cooperation Fund, which decreased by €5.2 million and in the revenue from extrabudgetary contributions to the Technical Cooperation Programme, which decreased by €6.1 million.
(iii) The increase in transfers to development counterparts of €8.2 million is primarily the result of the increased programmatic delivery of the Technical Cooperation Programme.
(iv) Net gains of €10.0 million, primarily pertaining to the revaluation of cash, cash equivalents and investments, were driven by the appreciation of the US dollar throughout 2018. The majority of these gains were unrealized as the Agency’s risk management strategy aims to hold its funds in the currencies of the expected disbursements.
(v) The value of cash, cash equivalents and investments increased by €19.4 million. The increase was experienced across all funds except for the Regular Budget Fund Group and trust funds.
(vi) The total outstanding contributions receivable for assessed and voluntary contributions increased by €8.5 million; this reflects a decrease in collections during the year of a significant number of contributions pledged and accepted in 2018.
(vii) Continued investments in tangible assets contributed to an increase in the net book value of Property, Plant and Equipment by €7.6 million (3%). This increase is primarily related to the Renovation of the Nuclear Applications Laboratories (ReNuAL) project. On the other hand, there was a net decrease in the value of intangible assets by €1.6 million (2%) as the amortization expense more than offset the additions during the year.
(viii) An overall increase in the Agency’s liabilities in 2018 was primarily the result of the increase in obligations related to long-term employee benefit liabilities, in particular After Service Health Insurance (ASHI). The ASHI liability increased by €8.7 million (4%) during 2018, which is consistent with the long-term trend of the ASHI liability.
(ix) The total net assets position experienced an increase of €30.5 million (6%) driven by the increase in total assets of €34.6 million which more than offset the net increase in liabilities by €4.0 million. However, it should be noted that the net assets of the Regular Budget Fund Group remain with a negative balance of €4.6 million.

GC(63)/6 Page 3
Financial Performance
7. A summary of the Financial Performance by Fund for 2018 is shown in Table 1 below.
Table 1: Summary of Financial Performance by Fund for the year ended 31 December 2018
(expressed in millions of euro)
Regular Budget Technical
Cooperation Extrabudgetary Other
RBF &
WCF MCIF TCF TC-EB EBF
LEU Bank
Trust Funds and
Special Funds
Inter-fund Elimination
Total IAEA
Total Revenue from all sources a/
373.7
8.0
83.6
17.8
107.6
2.0
-
(7.7)
585.0
Total Expenses
388.9
3.1
82.9
12.1
80.4
1.6
0.2
(7.7)
561.5 Net gains/(losses) b/
(1.2)
(0.2)
1.3
1.0
4.5
4.6
- -
10.0
Net surplus/(deficit) for the year
(16.4)
4.7
2.0
6.7
31.7
5.0
(0.2) -
33.5
a/ Total Revenue includes assessed, voluntary and other contributions; revenue from exchange transactions and interest revenue b/ Includes realized and unrealized foreign exchange gains/(losses) and gains/(losses) on sale or disposal of property, plant and equipment
Revenue analysis
8. As shown in Table 2, the Agency’s total revenue decreased by €2.5 million from €587.5 million in 2017 to €585.0 million in 2018, which is mainly due to the decrease in revenue from voluntary and assessed contributions by €7.0 million and €1.6 million, respectively. The decrease was partially offset by an increase in revenue from other contributions and investment revenue of €4.2 million and €2.1 million, respectively.
Table 2: Comparative Revenue Analysis
Revenue
(expressed in millions of euro)
2018 2017 Change Change (%)
Assessed contributions
362.1
363.7
(1.6) (0.4)
Voluntary contributions
210.2
217.2
(7.0) (3.2)
Other contributions
5.5
1.3
4.2 323.1
Revenue from exchange transactions
2.4
2.6
(0.2) (7.7)
Investment revenue
4.8
2.7
2.1 77.8
Total revenue
585.0
587.5
(2.5) (0.4)
9. Similar to previous years and as depicted in Figure 1 below, the majority of the Agency’s revenue continued to be derived from assessed contributions (€362.1 million) and monetary voluntary
GC(63)/6 Page 4
contributions (€197.0 million). Voluntary contributions are comprised of contributions to the Technical Cooperation Fund (TCF) and monetary extrabudgetary contributions to the Regular and Technical Cooperation Programmes. Voluntary contributions in Table 2 above also include €13.2 million of in-kind contributions, primarily pertaining to the free use of premises in Austria and Monaco, of which €8.3 million represents the in-kind contribution from the Government of Austria for the use of the Vienna International Centre (VIC). The increase in value of voluntary contributions in-kind relates to two pieces of laboratory equipment received from donors during 2018 amounting to €3.1 million.
Figure 1: Composition of revenue for the period ended 31 December 2018
10. The revenue from assessed contributions was impacted by the strengthening of the euro against the US dollar. The overall decrease in revenue from voluntary monetary contributions from €207.0 million in 2017 to €197.0 million in 2018 resulted primarily from an €11.3 million decline in revenue from contributions in support of Technical Cooperation. Revenue from extrabudgetary contributions to the Technical Cooperation Programme decreased by €6.1 million, which was largely attributable to a decrease in the amounts provided towards Government Cost Sharing. There was also a decrease in revenue related to the Technical Cooperation Fund, primarily resulting from a higher amount of contributions received in 2017 that were in excess of Member State specific target shares.
11. This decrease was partially offset by a €1.3 million increase in Extrabudgetary contributions in support of the Regular Programme, which was also impacted by the strengthening of the euro against other currencies, primarily the US dollar. The higher extrabudgetary revenue in the years 2015 and 2016 which is displayed in Figure 2 below, related to the funding of a number of specific activities, such as Zika related activities.
Technical Cooperation Fund, €79.3 m, (13.6%)
Technical Cooperation Fund
Extrabudgetary Fund, €17.6 m, (3.0%)
Extrabudgetary Programme Fund, €100.0 m, (17.1%)Assessed Contributions,
€362.1 m, (61.9%)
Other revenue, €26.0 m, (4.4%)
Total €585.0 m

GC(63)/6 Page 5
Figure 2: Evolution of monetary voluntary contributions
12. The increase in other contributions reflects the fact that National Participation Costs (NPCs) are higher in the first year of the biennium.
13. Investment revenue increased by € 2.1 million which is the result of higher interest earned on US dollar denominated cash, cash equivalents and investments.
Expense analysis
14. In 2018, total expenses were €561.5 million, denoting an increase of €23.7 million (4.4%) compared to previous year. The overall increase in IPSAS-based expenses was primarily experienced in the TCF (€14.2 million) resulting from increased implementation. Increase in expenses were also experienced in the Regular Budget Fund Group (€8.2 million) and the Extrabudgetary Programme Fund (EBF) (€2.4 million), while there was a decrease in expenses in the Technical Cooperation Extrabudgetary Fund (€2.2 million).
62.2 65.779.0 84.6 79.3
17.0 11.520.7 23.7 17.6
86.5
127.9 130.6
98.8 100.0
0.0
20.0
40.0
60.0
80.0
100.0
120.0
140.0
2014 2015 2016 2017 2018
€ m
illi
ons
Technical Cooperation Fund Technical Cooperation Extrabudgetary Fund
Extrabudgetary Programme Fund
GC(63)/6 Page 6
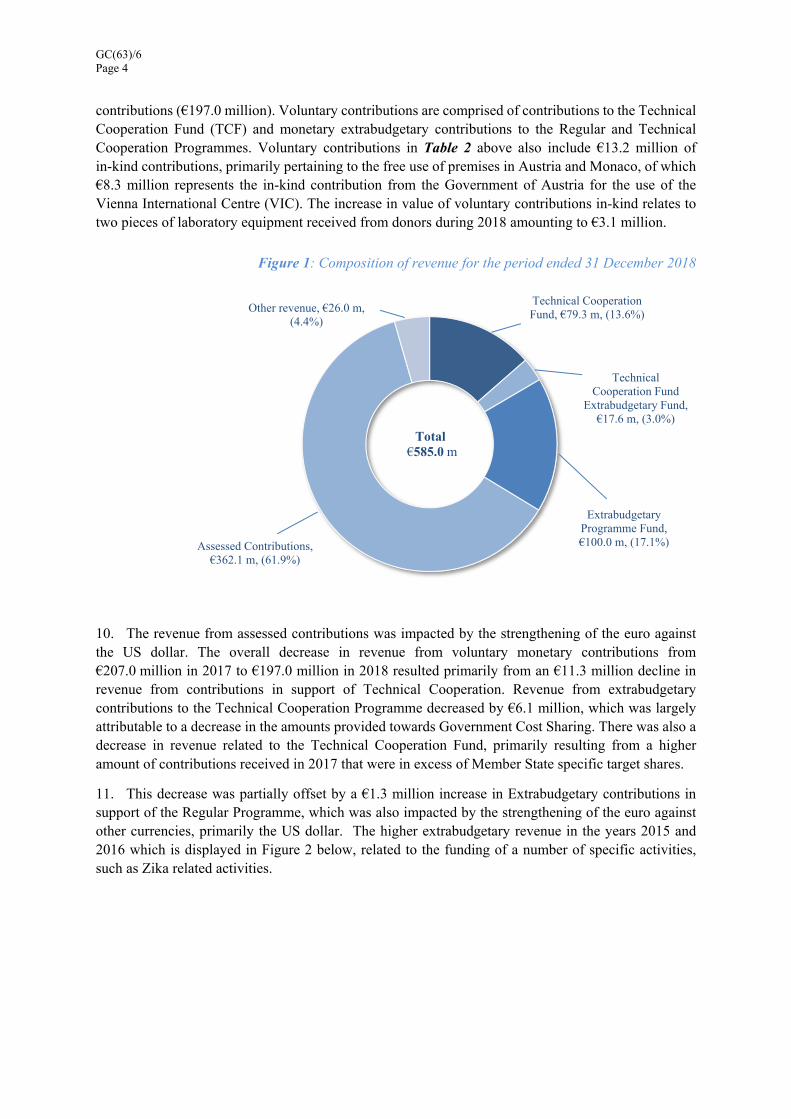
Figure 3 below shows the breakdown of 2018 expenses by nature:
Figure 3: Expense analysis for the period ended 31 December 2018
Table 3 below shows that, while expenses remained generally stable, the largest increase in total expenses was driven by the categories of transfers to development counterparts, depreciation and amortization as well as contractual and other services.
Table 3: Comparative Expense Analysis
Expenses 2018 2017 Change Change (%)
Salaries and employee benefits 289.8 286.9 2.9 1.0
Consultants, experts 16.2 16.1 0.1 0.6
Travel 46.6 45.5 1.1 2.5
Transfers to development counterparts 56.5 48.2 8.3 17.2 Vienna International Centre common services 19.6 18.6 1.0 5.2
Training 43.1 41.3 1.8 4.4
Depreciation and amortization 33.7 30.4 3.3 10.9
Contractual and other services 28.7 23.9 4.8 20.0
Other operating expenses 27.3 26.9 0.4 1.5
Total expenses 561.5 537.8 23.7 4.4
15. Salaries and employee benefits include the accrued costs of post-employment and other long-term employee benefits which better account for the true cost of employing staff on an annual basis. Across all funds, the related expense remained relatively stable between 2018 and 2017 with an overall slight increase of 1%.
16. Travel and training costs experienced an overall increase of €1.1 million (2.5%) and €1.8 million (4.4%), respectively, driven by the nature of the programmatic activities undertaken during 2018.
Depreciation and amortization, €33.7 m (6.0%)
Contractual and other services, €28.7 m (5.1%)
Other operating expenses, €27.3 m (4.9%)
Salaries and employee benefits, €289.8 m (51.6%)
Consultants, experts, €16.2 m (2.9%)
Travel, €46.6 m (8.3%)
Transfers to development counterparts,
€56.5 m (10.1%)
VIC common services, €19.6 m (3.5%)
Training, €43.1 m (7.7%)
Total €561.5 m

GC(63)/6 Page 7
17. The increase in transfers to development counterparts of €8.3 million (17.2%) is primarily the result of the increased programmatic delivery under the Technical Cooperation Programme.
18. The increase in depreciation and amortization expense of €3.3 million (10.9%) is the result of amortization of internally developed intangible assets. In particular, the increase relates to the finalization and go-live of the software projects under the MOSAIC (Modernization of Safeguards Information Technology) umbrella in the Department of Safeguards towards the end of 2017 and beginning of 2018.
19. Contractual and other services increased by €4.8 million (20%), which mainly relates to information technology contractual services due to implementation of IT projects and scientific and technical contractual services.
20. The other expense categories remained stable between 2017 and 2018.
Net surplus/(deficit) of the year
21. The overall net surplus experienced in 2018 was €33.5 million, which was driven by the revenue exceeding expense of €23.5 million and net gains of €10.0 million, primarily related to unrealized foreign exchange gains. The 2018 net surplus was €24.0 million higher than that of 2017, primarily due to the fact that the 2017 net surplus was impacted by net losses, primarily resulting from unrealized foreign exchange losses of €40.2 million. As can be seen in Figure 4 below, net foreign exchange gains were experienced in 2014, 2015, 2016 and again in 2018, resulting from the US dollar appreciating against the euro.
Figure 4: Evolution of Net gains/(losses)
Budgetary performance
22. The Regular Budget of the Agency continues to be prepared on a modified cash basis and is presented in the financial statements as Statement V, Statement of Comparison of Budget and Actual Amounts. In order to facilitate a comparison between the budget and the financial statements that are
0.750
0.800
0.850
0.900
0.950
1.000
(50.0)
(40.0)
(30.0)
(20.0)
(10.0)
0.0
10.0
20.0
30.0
40.0
2014 2015 2016 2017 2018U
SD/E
UR
fx
rate
€ m
illio
ns
Net gains / (losses) USD/EUR exchange rate

GC(63)/6 Page 8
prepared under IPSAS, reconciliation of the budget to the Cash Flow Statement is included in the Note 39b to the financial statements.
23. The original operational portion of the Regular Budget appropriation for 2018 was approved for €365.3 million (€360.9 million in 2017) at an exchange rate of €1 = US$1. The final budget for the operational portion of the Regular Budget appropriation for 2018 was recalculated to €357.9 million at the UN average operational rate of exchange of €0.847 to US$1. There were no changes between the original capital portion of the Regular Budget appropriation and the final budget for 2018. As shown in Note 39a to the financial statements, there were no movements of the Regular Budget appropriations between Major Programmes.
24. Total operational Regular Budget expenditures, measured on a modified cash basis, were €354.6 million including €3.1 million reimbursable work for others. In 2017, these expenditures totalled €355.8 million.
Figure 5 shows a comparative analysis of 2017 and 2018 total expenditures by Major Programme on a budgetary basis.
Figure 5: Comparative analysis of Regular Budget operational portion expenditures by Major Programme
25. The overall utilization rate of the operational portion of the Regular Budget in 2018 was 99%, highlighting the high level of utilization of available resources. Table 4 shows the budgetary utilization by Major Programmes (MP).
37.2 39.8 34.2
138.6
77.0
24.7
38.7 39.5 34.3
137.0
78.6
24.4
-
20.0
40.0
60.0
80.0
100.0
120.0
140.0
160.0
MP1 MP2 MP3 MP4 MP5 MP6
€ m
illio
ns
2018
2017

GC(63)/6 Page 9
Table 4: Regular Budget operational portion- budgetary utilization rates for 2018
Major Programme Utilization Rate Operational Portion
2018 2017 MP1 - Nuclear Power, Fuel Cycle and Nuclear Science 95.5% 99.8% MP2 - Nuclear Techniques for Development and Environmental Protection 99.9% 99.9% MP3 - Nuclear Safety and Security 98.5% 99.2% MP4 - Nuclear Verification 100.0% 100.0% MP5 - Policy, Management and Administration Services 98.8% 99.9% MP6 - Management of Technical Cooperation for Development 98.8% 99.9% Total Agency 99.0% 99.9%
26. For the capital portion of the Regular Budget, expenditures on the modified cash basis were €4.7 million out of a total €8.1 million in 2018.
Financial Position
Cash, investments and liquidity analysis
27. In 2018, the cash, cash equivalents and investments balances increased by €19.4 million (2.8%) to €721.7 million at 31 December 2018. The largest increase was noted in the Extrabudgetary Programme Fund, mainly as a result of net surplus for the year. The appreciation of the US dollar against the euro on the US dollar balance held by the LEU Bank Fund and the Technical Cooperation Fund, contributed to a total increase in the euro value of cash and investments in these Funds, which increased by €3.8 million (3.2%) and €5.4 million (4.8%), respectively.
28. Of the total cash, cash equivalents and investments of €721.7 million, 69% was held in the Extrabudgetary Programme Fund, the LEU Bank Fund and the Technical Cooperation Extrabudgetary Fund and are therefore earmarked for specific activities.
29. As at the end of 2018, 68.2% of the total cash, cash equivalents and investments were denominated in euro while 31.6% were denominated in US dollars. Interest rates on euro denominated investments remained near zero in 2018; however, interest rates in US dollar denominated investments continued to increase during the year. Based upon the mix of currencies in the Agency’s cash equivalent and investment portfolio, the overall return achieved on the Agency’s cash equivalents and investments increased during 2018 by €2.1 million.
30. As can be seen in Figure 6 below, the Agency shifted its holdings from investments to cash and cash equivalents over the past years. The reason for this shift was the continued inability to make euro denominated investments at positive interest rates. However, during 2018, it was possible to identify investment opportunities in euro avoiding negative rates, hence the shift in the portfolio towards investments.

GC(63)/6 Page 10
Figure 6: Evolution of cash, cash equivalents and investments
Accounts receivable
31. Overall, the total net receivables from non-exchange transactions increased by €8.5 million to €50.9 million at 31 December 2018. The main components of this balance are receivables from assessed contributions (€35.4 million), voluntary contributions receivable (€14.3 million), and other receivables (€1.3 million).
32. The increase experienced in 2018 is mainly driven by the increase in assessed contributions receivable, as depicted in the Figure 7 below. During 2018, the rate of collection of assessed contributions remained at 93%. The largest increase in outstanding contributions (€3.3 million) was experienced for those contributions aged more than one year. Total outstanding Regular Budget contributions from 2018 and prior years, which amount to €44.8 million, represent 12% of the total Regular Budget assessment for 2018, and this may pose a liquidity risk to the Agency if not paid in a timely manner. Member States are reminded of the importance to the Agency’s operations of paying their assessed contributions in full and on time.
Figure 7: Outstanding Assessed contributions receivable and rate of collection
115.2 201.9
430.2 469.2 394.9
396.1
400.5
268.5 233.2 326.8
-
100
200
300
400
500
600
700
800
2014 2015 2016 2017 2018
€ m
illio
ns
Cash and cash equivalents Investments
43.6
19.4 19.624.9 26.1
15.4
21.113.4
15.418.7
82.0
84.0
86.0
88.0
90.0
92.0
94.0
96.0
0.0
10.0
20.0
30.0
40.0
50.0
60.0
70.0
2014 2015 2016 2017 2018
Col
lect
ion
rate
%
€ m
illi
ons
Assessed contributions aged more than 1 yearAssessed contributions aged 1 year or lessAssessed Contributions Collection rate %
GC(63)/6 Page 11
33. The increase in the net amount of outstanding voluntary contributions receivable by 60% from €8.9 million to €14.3 million resulted from the decrease in collections in 2018 of a number of voluntary contributions relating to the current year pledges. However, it should be noted that a large portion of the outstanding voluntary contributions, amounting to €2.7 million, relates to pledges that are not due in 2018.
Long-term assets
Property, Plant and Equipment
34. As can be seen from Figure 8 below, Buildings and Leasehold Improvements continue to account for the largest component of the net book value of Property, Plant and Equipment (PP&E).
Figure 8: Composition of Property, Plant and Equipment as at 31 December 2018
35. The total net book value of PP&E increased by €7.6 million (2.8%). Among the factors contributing to this increase are the following:
Approximately half of the additions to PP&E, which totaled €28.8 million in 2018, relate to assets under construction pertaining to the ReNuAL project (€8.1 million) and the Inspection Equipment and Laboratory Equipment pending installation or assembly (€6.4 million).
The remaining additions to PP&E during the year were experienced in all other asset categories, with the largest components in Communications and IT Equipment (€3.8 million) and Laboratory equipment (€3.8 million).
These additions were offset by depreciation expense of €21.1 million.
36. As at 31 December 2018, the balance of PP&E under construction was primarily comprised of €26.1 million related to the ReNuAL project.

GC(63)/6 Page 12
Intangible Assets
37. As shown in Table 5 below, the net carrying amount of Intangible Assets at 31 December 2018 was €65.6 million.
Table 5: Comparative Analysis of Intangible Assets
(expressed in millions of euro)
2018 2017 Change %
Intangible assets
Computer software purchased 6.5 5.3 1.2 0.2
Computer software internally developed 55.2 47.2 8.0 0.2
Intangible assets under development 3.9 14.7 (10.8) (0.7)
Total Intangible Assets 65.6 67.2 (1.6) (0.3)
38. The principal driver for the decrease in the carrying value of Intangible Assets during 2018 is the amortization of MOSAIC projects that were still under development in previous reporting periods but went live towards the end of 2017 and beginning of 2018. During 2018, total costs of €9.2 million were added to the value of internally developed software, of which €3.3 million relates to MOSAIC and €5.9 million relates to other internally developed software projects.
39. In connection with the above-mentioned projects, as shown in Figure 9 below, in 2018 the proportion of intangible assets internally developed continued to increase following the trend observed in the previous years. However, intangible assets under development experienced a decrease in 2018 as a result of MOSAIC projects going live in the first half of 2018.
Figure 9: Evolution of the composition of Intangible Assets
4.7 4.8 5.0 5.3 6.5
14.8
27.7 33.2
47.2
55.2
16.9
10.6
19.1
14.7 3.9
-
10.0
20.0
30.0
40.0
50.0
60.0
70.0
80.0
2014 2015 2016 2017 2018
€ m
illio
ns
Computer software purchasedComputer software internally developedIntangible assets under development

GC(63)/6 Page 13
Deferred revenue
40. Since the recognition of the VIC premises in 2015, the largest portion of deferred revenue relates to the donated right to use of these premises, whereby the Agency has the obligation of maintaining its Headquarters seat in Vienna and to occupy the VIC building until 2078 or return it to the Austrian Government. This obligation is fulfilled by remaining in the VIC over the remaining term of the agreement and the deferred revenue is recognized annually in the Statement of Financial Performance.
41. Deferred revenue comprises two other major components. The larger of these two components is contributions received in advance, which relates to assessed contributions for 2019 paid in 2018 (€61.8 million), TCF and NPC contributions for 2019 paid in 2018 (€11.9 million and €0.2 million, respectively) and voluntary contributions received prior to the completion of formal acceptance by the Agency (€16.9 million). The total contributions received in advance increased by €1.1 million, primarily related to assessed contributions and NPC contributions received in advance. The other component is contributions received subject to conditions, which amounted to €43.1 million in 2018, a decrease from €45.8 million in 2017. These contributions will be recognized as revenue upon satisfaction of the related conditions in the agreements.
42. A comparison of 2014 through 2018 year-end balances by category of deferred revenue is shown in Figure 10 below.
Figure 10: Evolution of the composition of Deferred Revenue
Employee benefits liabilities
43. Employee benefits liabilities consist of both current and non-current liabilities. As shown in Figure 11 below, over the past years, liabilities related to After Service Health Insurance (ASHI) have represented the largest component among the employee benefit liabilities, followed by post-employment repatriation and separation entitlements.
44. The lack of funding of the ASHI liability is an ongoing issue of concern.
54.1 58.9 84.0 89.8 90.9 -
153.3 146.3 139.7 133.1
58.8
46.2 44.4 45.8 43.1
0.0
0.3 0.6 0.2 0.3
0
50
100
150
200
250
300
2014 2015 2016 2017 2018
€ m
illio
ns
Other
Extrabudgetary contributions transferred subject to conditions
Use of the VIC building
Contributions received in advance

GC(63)/6 Page 14
45. Employee benefits liabilities increased by €12.5 million (4.2%) during 2018. This increase was primarily driven by an increase in the ASHI liability as a result of the current service cost for 2018 and actuarial methodologies applied in determination of future medical costs in alignment with age grading of underlying premiums.
Figure 11: Evolution of the composition of the main employee benefits liabilities
Net assets/equity
46. Net assets represent the difference between an organization’s assets and its liabilities, which is illustrated by the orange line in Figure 12 below. Despite a consistent increase in the Agency’s liabilities over the years, the net assets have increased as the assets grew at a faster rate. In 2017, the Agency experienced an overall decrease in net assets of €27.4 million as a result of the actuarial losses and foreign exchange losses, however in 2018, net assets increased again to €580.6 million from €550.1 million.
Figure 12: Evolution of Net Assets
202.8175.5 165.4
213.4 222.1
48.950.4 56.0
52.0 54.7 20.1
20.8 22.0
25.0 26.0
2.8 2.6
2.8 2.8
-
50
100
150
200
250
300
350
2014 2015 2016 2017 2018
€ m
illi
ons
Other staff costs liabilities
Annual leave
Post-employment repatriation & separation entitlements
After service health insurance
3.4
( 800)
( 600)
( 400)
( 200)
-
200
400
600
800
1 000
1 200
1 400
2014 2015 2016 2017 2018
€ m
illio
ns
Assets Liabilities Net Assets

GC(63)/6 Page 15
47. From the perspective of the composition of the net assets by fund, as shown in Figure 13 below, the above events had an impact as follows:
The net assets of the RBF and WCF increased by €2.9 million in 2018 but continues in a negative position of €4.6 million due primarily to the increase in the employee benefits liabilities, primarily ASHI.
The net assets of the TCF remained relatively stable, experiencing a small increase of €1.8 million, primarily resulting from foreign exchange gains on US dollar funds held by the TCF.
The net assets of the TC-EB increased by €6.5 million to €49.5 million in 2018, as a result of the net surplus of the year.
The net assets of the EBF increased by €18.7 million to €299.0 million as a result of the net surplus of the year.
The net assets of the LEU Bank increased by €5.0 million to €100.8 million, which was driven by the net gains from foreign exchange revaluation.
Figure 13: Evolution of the composition of Net Assets by fund
Risk management
48. The financial statements prepared under IPSAS provide details of how the Agency manages its financial risk, including credit risk, market risk (foreign currency exchange and interest rate) and liquidity risk. From an overall perspective, the Agency’s investment management prioritizes capital preservation as its primary objective, ensuring sufficient liquidity to meet cash operating requirements, and then earning a competitive rate of return on its portfolio within these constraints.
Summary
49. The financial statements presented here show the Agency’s strong overall financial health. The financial statements show high Regular Budget utilization, increased activity and programmatic delivery in the area of Technical cooperation and continued focus on the Agency’s long-term assets related to projects such as ReNuAL and MOSAIC, all within a background of the Agency’s
( 50)
-
50
100
150
200
250
300
350
RBF andWCF
MCIF TCF TC-EB EBF LEU Bank Other
€ m
illi
ons
2018
2017
GC(63)/6 Page 16
commitment to financial responsibility and in line with the identified priorities. While the Agency’s overall financial health is strong, the RBF is in a negative net asset position. The negative net asset position of the RBF is driven by the Agency’s unfunded employee benefits liabilities and identifies that additional focus on the funding of these liabilities is required.
(signed) Yukiya Amano Director General

GC(63)/6 Page 17
STATEMENT OF THE DIRECTOR GENERAL’S RESPONSIBILITIES AND
CONFIRMATION OF THE FINANCIAL STATEMENTS WITH THE FINANCIAL REGULATIONS
OF THE INTERNATIONAL ATOMIC ENERGY AGENCY AS AT 31 DECEMBER 2018
The Director General’s responsibilities
The Director General is required by the Financial Regulations to maintain such accounting records as are necessary in accordance with the accounting standards generally in use throughout the United Nations system and to prepare annual financial statements. He is also required to give such other financial information as the Board may require or as he may deem necessary or useful.
In line with the Financial Regulations, the Agency prepares its financial statements in accordance with the International Public Sector Accounting Standards (IPSAS).
To lay the foundations for the financial statements, the Director General is responsible for establishing detailed financial rules and procedures to ensure effective financial administration, the exercise of economy, and the effective custody of the Agency’s assets. The Director General is also required to maintain an internal financial control which shall provide an effective examination of financial transactions to ensure: the regularity of the receipt, custody and disposal of all funds and other financial resources of the Agency; and the conformity of expenditures with the appropriations approved by the General Conference, the decisions of the Board on the use of funds for the Technical Cooperation Programme or other authority governing expenditures from extrabudgetary resources; and the economic use of the resources of the Agency.
Confirmation of the Financial Statements with the Financial Regulations
We hereby confirm that the following appended financial statements, comprising Statements I to VIIb, and supporting Notes, were properly prepared in accordance with Article XI of the Financial Regulations, with due regard to the International Public Sector Accounting Standards.
(signed) YUKIYA AMANO (signed) TRISTAN BAUSWEIN Director General Director, Division of Budget and Finance
08 March 2019
GC(63)/6 Page 19
Part I
Audit Opinion

GC(63)/6 Page 21
Letter from the External Auditor to the Chairperson of the Board of Governors
The Chairperson of the Board of Governors International Atomic Energy Agency A-1400 VIENNA Austria
Jakarta, 28 March 2019
Madam, On behalf of the Audit Board of the Republic of Indonesia, I have the honour to transmit the financial statements of the International Atomic Energy Agency for the year ended 31 December 2018 which were submitted to us by the Director General in accordance with Financial Regulation 11.03(a). We have audited these statements and have expressed our opinion thereon.
Further, in accordance with Financial Regulation 12.08, we have the honour to present our report on the Financial Statements of the Agency for the year ended 31 December 2018.
Please accept the assurances of our highest consideration.
(signed)
Prof. Dr. Moermahadi Soerja Djanegara, CA., CPA
The Chair of the Audit Board of the Republic of Indonesia
External Auditor

GC(63)/6 Page 22
AUDIT OPINION
CERTIFICATE OF THE EXTERNAL AUDITOR ON THE FINANCIAL STATEMENTS OF THE INTERNATIONAL
ATOMIC ENERGY AGENCY FOR THE FINANCIAL PERIOD ENDED
31 DECEMBER 2018
To the General Conference of the International Atomic Energy Agency
Report on the Financial Statements
We have audited the accompanying Financial Statements of the International Atomic Energy Agency, which comprise the statement of financial position at 31 December 2018, and the statement of financial performance, statement of changes in equity, statement of cash flow, statement of comparison of budget and actual amounts, statements of segment reporting by major programme/fund for the year ended 31 December 2018 and notes to the financial statements.
Management’s Responsibility for the Financial Statements
Management is responsible for the preparation and fair presentation of these financial statements in accordance with International Public Sector Accounting Standards (IPSAS). This responsibility includes: designing, implementing and maintaining internal control relevant to the preparation and fair presentation of financial statements that are free from material misstatements, whether due to fraud or error; selecting and applying appropriate accounting policies; and making accounting estimates that are reasonable in the circumstances.
Auditor’s Responsibility
Our responsibility is to express an opinion on these financial statements based on our audit. We conducted our audit in accordance with the International Standards on Auditing. Those standards require that we comply with ethical requirements and plan and perform the audit to obtain reasonable assurance whether the financial statements are free from material misstatement.
An audit involves performing procedures to obtain audit evidence about the amounts and disclosures in the financial statements. The procedures selected depend on the auditor’s judgment, including the assessment of the risks of material misstatement of the financial statements, whether due to fraud or error. In making those risk assessments, the auditor considers internal control relevant to the entity’s preparation and fair presentation of the financial statements in order to design audit procedures that are appropriate in the circumstances, but not for the purpose of expressing an opinion on the effectiveness of the entity’s internal control. An audit also includes evaluating the appropriateness of accounting policies used and the reasonableness of accounting estimates made by management, as well as evaluating the overall presentation of the financial statements.
We believe that the audit evidence we have obtained is sufficient and appropriate to provide a basis for our audit opinion.

GC(63)/6 Page 23
Opinion
In our opinion, these financial statements present fairly, in all material respects, the financial position of the International Atomic Energy Agency as at 31 December 2018, and its financial performance and of its cash flows for the year ended 31 December 2018 in accordance with International Public Sector Accounting Standards (IPSAS).
Report on Other Legal and Regulatory Requirements
Further, in our opinion, the transactions of the International Atomic Energy Agency that have come to our notice or which we have tested as part of our audit have, in all significant respects, been in accordance with the International Atomic Energy Agency’s Financial Regulations.
In accordance with the Article XII of the Financial Regulations, we have also issued a long-form report on our audit of the International Atomic Energy Agency.
(signed)
Prof. Dr. Moermahadi Soerja Djanegara, CA., CPA
The Chair of the Audit Board of the Republic of Indonesia
External Auditor
Jakarta, Indonesia 28 March 2019

GC(63)/6 Page 25
Part II
Financial Statements

GC(63)/6 Page 27
Financial Statements
Text of a Letter dated 08 March 2019 from the Director General to the External Auditor
Sir,
Pursuant to Financial Regulation 11.03(a), I have the honour to submit the financial statements of the International Atomic Energy Agency for the year ended 31 December 2018, which I hereby approve. The financial statements have been prepared and signed by the Director, Division of Budget and Finance, Department of Management.
Accept, Sir, the assurances of my highest consideration.
(signed) Yukiya Amano Director General

GC(63)/6 Page 28
Note 31-12-2018 31-12-2017
ASSETSCurrent assetsCash and cash equivalents 4 394 920 469 210Investments 5 326 828 233 169Accounts receivable from non-exchange transactions 6, 7 49 175 39 921Accounts receivable from exchange transactions 8 6 197 7 377Advances and prepayments 9 25 135 21 294Inventory 10 10 639 12 282Total current assets 812 894 783 253 Non-current assets
Accounts receivable from non-exchange transactions 6, 7 1 764 2 511Advances and prepayments 9 7 628 8 030Investment in common services entities 11 809 809Property, plant & equipment 12 285 433 277 793Intangible assets 13 65 640 67 189Total non-current assets 361 274 356 332
TOTAL ASSETS 1 174 168 1 139 585
LIABILITIESCurrent liabilitiesAccounts payable 14 18 701 17 774Deferred revenue 15 129 161 113 600Employee benefit liabilities 16, 17 16 220 15 561Other financial liabilities 18 168 50Provisions 19 169 1 472Total current liabilities 164 419 148 457 Non-current liabilities
Deferred revenue 15 138 197 161 881Employee benefit liabilities 16, 17 289 426 277 634Other financial liabilities 18 304 304Provisions 19 1 218 1 218Total non-current liabilities 429 145 441 037
TOTAL LIABILITIES 593 564 589 494
NET ASSETS 580 604 550 091 EQUITY
Fund balances 20, 21 529 113 504 939Reserves 22 51 491 45 152TOTAL EQUITY 580 604 550 091
Director, Division of Budget and Finance
STATEMENT I: STATEMENT OF FINANCIAL POSITIONAs at 31 December 2018(expressed in euro'000s)
The accompanying Notes are an integral part of these Statements.
(signed) TRISTAN BAUSWEIN
GC(63)/6 Page 29
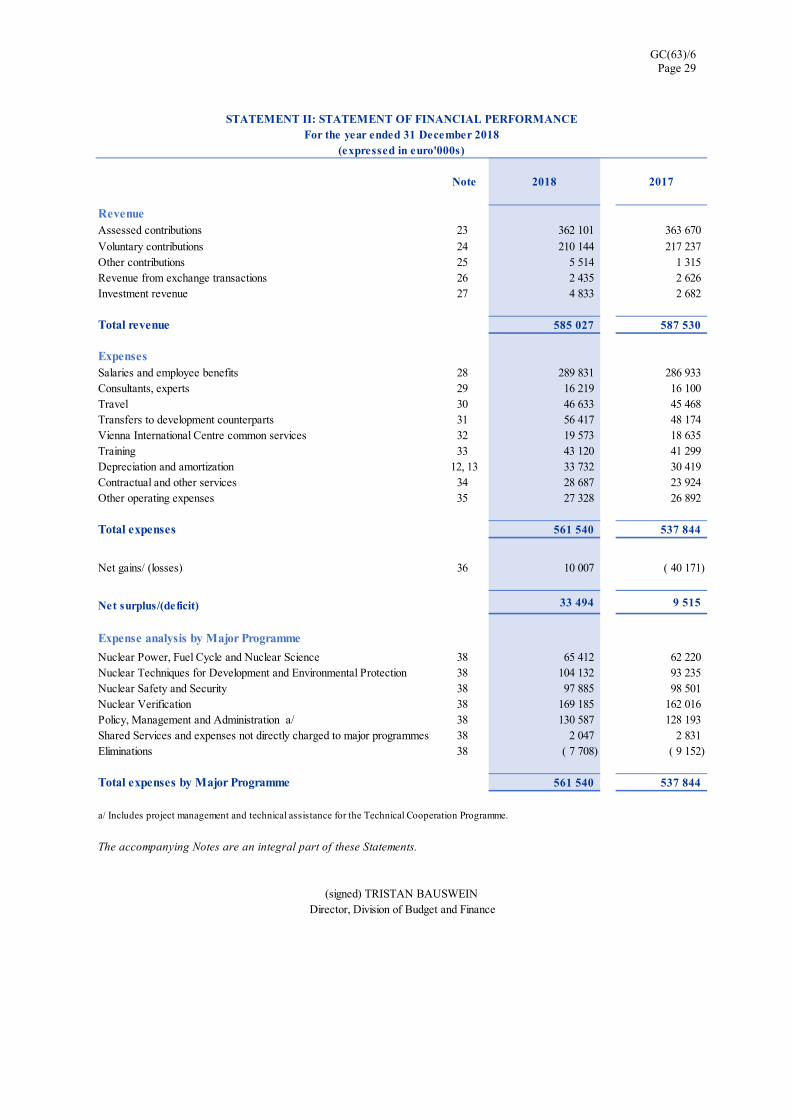
Note 2018 2017
RevenueAssessed contributions 23 362 101 363 670
Voluntary contributions 24 210 144 217 237Other contributions 25 5 514 1 315Revenue from exchange transactions 26 2 435 2 626Investment revenue 27 4 833 2 682
Total revenue 585 027 587 530
ExpensesSalaries and employee benefits 28 289 831 286 933Consultants, experts 29 16 219 16 100Travel 30 46 633 45 468Transfers to development counterparts 31 56 417 48 174Vienna International Centre common services 32 19 573 18 635Training 33 43 120 41 299Depreciation and amortization 12, 13 33 732 30 419Contractual and other services 34 28 687 23 924Other operating expenses 35 27 328 26 892
Total expenses 561 540 537 844
Net gains/ (losses) 36 10 007 ( 40 171)
Net surplus/(deficit) 33 494 9 515
Expense analysis by Major Programme
Nuclear Power, Fuel Cycle and Nuclear Science 38 65 412 62 220Nuclear Techniques for Development and Environmental Protection 38 104 132 93 235Nuclear Safety and Security 38 97 885 98 501Nuclear Verification 38 169 185 162 016Policy, Management and Administration a/ 38 130 587 128 193Shared Services and expenses not directly charged to major programmes 38 2 047 2 831Eliminations 38 ( 7 708) ( 9 152)
Total expenses by Major Programme 561 540 537 844
a/ Includes project management and technical assistance for the Technical Cooperation Programme.
The accompanying Notes are an integral part of these Statements.
STATEMENT II: STATEMENT OF FINANCIAL PERFORMANCEFor the year ended 31 December 2018
(expressed in euro'000s)
(signed) TRISTAN BAUSWEIN Director, Division of Budget and Finance

GC(63)/6 Page 30
2018 2017
Equity at the beginning of the year 550 091 577 484
Actuarial gains/(losses) on employee benefit liabilities ( 1 874) ( 35 751)
Refunds/transfers of prior year voluntary contributions recognized directly in equity ( 1 119) ( 1 135)Prior year adjustments - ( 1)Net revenue recognized directly in equity ( 2 993) ( 36 887)
Net surplus/(deficit) for the year 33 494 9 515
Impact on Working Capital Fund from new Member States - ( 4)Credits to Member States 12 ( 17)
Equity at the end of the year 580 604 550 091
The accompanying Notes are an integral part of these Statements.
STATEMENT III: STATEMENT OF CHANGES IN EQUITYFor the year ended 31 December 2018
(expressed in euro'000s)
(signed) TRISTAN BAUSWEINDirector, Division of Budget and Finance

GC(63)/6 Page 31
2018 2017
Cash flows from operating activitiesNet surplus/(deficit) 33 494 9 515
Refund of prior year voluntary contributions recognized in equity (1 119) (1 135)
Prior year adjustments - (1)
Discount Amortization (2) 30
Depreciation and amortization 33 732 30 419
Amortization of deferred revenue on VIC depreciation (7 360) (7 490)
Impairment 92 (8)
Increase/(decrease) in allowance for undeliverable inventory in transit 511 633
Actuarial gains/(losses) on employee benefit liabilities (1 874) (35 751)
Increase/(decrease) in doubtful debts allowance 1 796 2 382
(Gains)/losses on disposal of PPE and Intangibles (22) 1 426
Donated PPE and Inventory (3 089) -
Unrealized foreign-exchange (gains)/losses on cash, cash equivalents and investments (8 810) 33 515
(Increase)/decrease in receivables (9 122) 1 038
(Increase)/decrease in inventories 1 132 (4 058)
(Increase)/decrease in prepayments (3 439) 897
Increase/(decrease) in deferred revenue (763) 7 690
Increase/(decrease) in accounts payable 928 1 172
Increase/(decrease) in employee benefit liabilities 12 451 47 171
Increase/(decrease) in other liabilities and provisions 208 (110)
Net cash flows from operating activities 48 744 87 335
Cash flows from investing activities Purchase or construction of PPE and intangibles (36 804) ( 49 107)
Sale of PPE and intangibles ( 1 394) 7
Costs of asset decommissioning - ( 985)
Investments ( 84 889) 7 231
Net cash flows from investing activities ( 123 087) ( 42 854)
Cash flows from financing activities Increase/(decrease) in Working Capital Fund from new Member States - ( 5)
Credits to Member States 12 ( 16)
Net cash flows from financing activities 12 ( 21)
Net increase/(decrease) in cash and cash equivalents ( 74 331) 44 460
Cash and cash equivalents at beginning of the period 469 210 430 166
Unrealized foreign-exchange gains/(losses) on cash and cash equivalents 41 ( 5 416)
Cash and cash equivalents and bank overdrafts at the end of the period 394 920 469 210
The accompanying Notes are an integral part of these Statements.
STATEMENT IV: STATEMENT OF CASH FLOWFor the year ended 31 December 2018
(expressed in euro'000s)
(signed) TRISTAN BAUSWEIN
Director, Division of Budget and Finance
GC(63)/6 Page 32
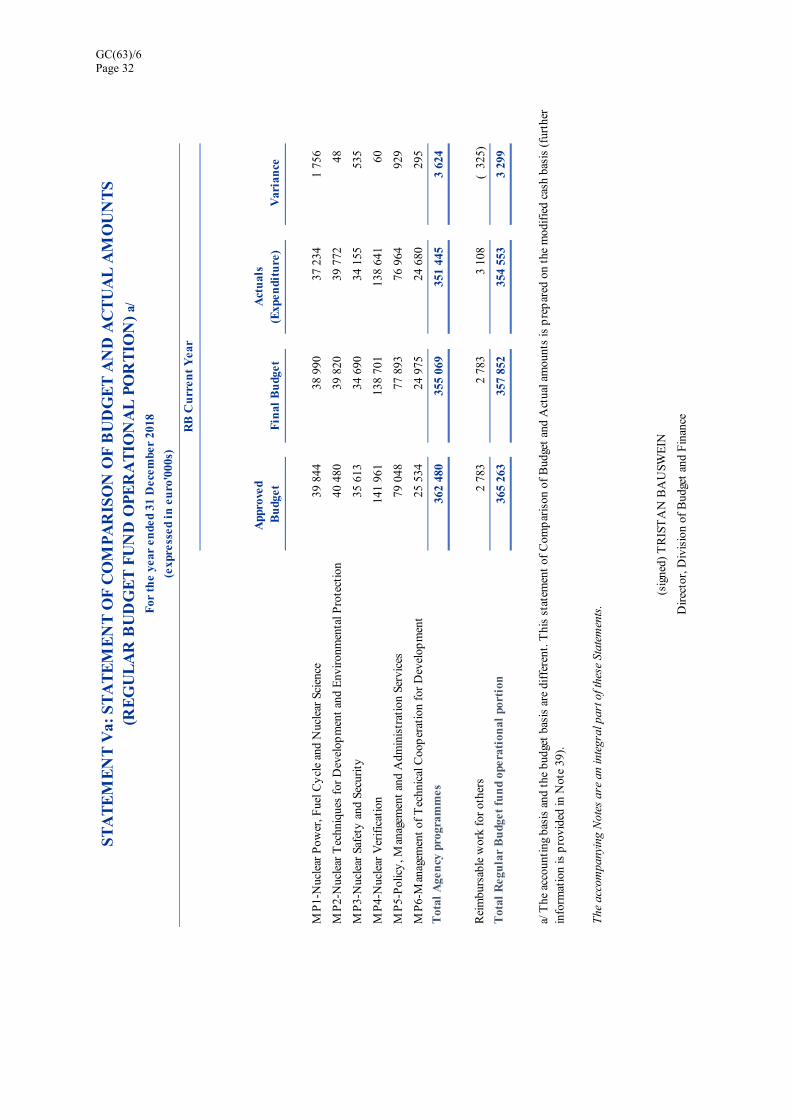
A
ppro
ved
Bu
dget
Fin
al B
udg
et A
ctu
als
(Exp
endi
ture
) V
aria
nce
MP
1-N
ucle
ar P
ower
, Fue
l Cy
cle
and
Nuc
lear
Sci
ence
39
844
38
990
37
234
1 7
56
MP
2-N
ucle
ar T
echn
ique
s fo
r D
evel
opm
ent
and
Env
iron
men
tal P
rote
ctio
n 4
0 48
0 3
9 82
0 3
9 77
2 4
8
MP
3-N
ucle
ar S
afet
y a
nd S
ecur
ity
35
613
34
690
34
155
535
MP
4-N
ucle
ar V
erif
icat
ion
141
961
138
701
138
641
60
MP
5-P
olic
y, M
anag
emen
t an
d A
dmin
istr
atio
n Se
rvic
es 7
9 04
8 7
7 89
3 7
6 96
4 9
29
MP
6-M
anag
emen
t of
Tec
hnic
al C
oop
erat
ion
for
Dev
elop
men
t 2
5 53
4 2
4 97
5 2
4 68
0 2
95
Tot
al A
gen
cy p
rogr
amm
es
362
480
355
069
351
445
3 6
24
Rei
mbu
rsab
le w
ork
for
othe
rs
2
783
2 7
83 3
108
( 3
25)
Tot
al R
egu
lar
Bu
dget
fu
nd
oper
atio
nal
por
tion
365
263
357
852
354
553
3 2
99
ST
AT
EM
EN
T V
a: S
TA
TE
ME
NT
OF
CO
MP
AR
ISO
N O
F B
UD
GE
T A
ND
AC
TU
AL
AM
OU
NT
S
(RE
GU
LA
R B
UD
GE
T F
UN
D O
PE
RA
TIO
NA
L P
OR
TIO
N)
a/
For
th
e ye
ar e
nde
d 31
Dec
embe
r 20
18 RB
Cu
rren
t Y
ear
(exp
ress
ed i
n e
uro
'000
s)
Dir
ecto
r, D
ivis
ion
of B
udge
t an
d F
inan
ce
a/ T
he a
ccou
ntin
g ba
sis
and
the
budg
et b
asis
are
dif
fere
nt. T
his
stat
emen
t of
Com
par
ison
of
Bud
get
and
Act
ual a
mou
nts
is p
rep
ared
on
the
mod
ifie
d ca
sh b
asis
(fu
rthe
r in
form
atio
n is
pro
vide
d in
Not
e 39
).
The
acc
ompa
nyin
g N
otes
are
an
inte
gral
par
t of t
hese
Sta
tem
ents
.
(sig
ned)
TR
IST
AN
BA
USW
EIN

GC(63)/6 Page 33
A
ppro
ved
Bu
dget
Fin
al B
udg
et A
ctu
als
(Exp
endi
ture
) V
aria
nce
b/
MP
2-N
ucle
ar T
echn
ique
s fo
r D
evel
opm
ent
2
011
2 0
11 1
401
610
MP
3-N
ucle
ar S
afet
y a
nd S
ecur
ity
270
270
93
177
MP
4-N
ucle
ar V
erif
icat
ion
2 0
16 2
016
1 0
08 1
008
MP
5-P
olic
y, M
anag
emen
t an
d A
dmin
istr
atio
n Se
rvic
es 3
762
3 7
62 2
207
1 5
55
Tot
al R
egu
lar
Bu
dget
fu
nd
capi
tal
port
ion
8 0
59 8
059
4 7
09 3
350
The
acc
ompa
nyin
g N
otes
are
an
inte
gral
par
t of t
hese
Sta
tem
ents
.
b/ R
efer
to
Not
e 39
c fo
r a
disc
ussi
on o
f th
e va
rian
ce b
etw
een
fina
l bud
get
and
actu
als.
(sig
ned)
TR
IST
AN
BA
USW
EIN
Dir
ecto
r, D
ivis
ion
of B
udge
t an
d F
inan
ce
ST
AT
EM
EN
T V
b: S
TA
TE
ME
NT
OF
CO
MP
AR
ISO
N O
F B
UD
GE
T A
ND
AC
TU
AL
AM
OU
NT
S
(RE
GU
LA
R B
UD
GE
T F
UN
D C
AP
ITA
L P
OR
TIO
N)
a/
For
th
e ye
ar e
nde
d 31
Dec
embe
r 20
18
(exp
ress
ed i
n e
uro
'000
s)
a/ T
he a
ccou
ntin
g ba
sis
and
the
budg
et b
asis
are
dif
fere
nt. T
his
stat
emen
t of
Com
par
ison
of
Bud
get
and
Act
ual a
mou
nts
is p
rep
ared
on
the
mod
ifie
d ca
sh b
asis
(N
ote
39).

GC(63)/6 Page 34
Nu
clea
r P
ower
, Fu
el
Cyc
le a
nd
Nu
clea
r S
cien
ce
Nu
clea
r T
ech
niq
ues
fo
r D
evel
opm
ent
and
En
viro
nm
enta
l P
rote
ctio
nN
ucl
ear
Saf
ety
and
Sec
uri
tyN
ucl
ear
Ver
ific
atio
n
Pol
icy,
Man
agem
ent
and
Adm
inis
trat
ion
S
ervi
ces
a/
Exp
ense
s n
ot
Dir
ectl
y C
har
ged
to
Maj
or P
rogr
amm
es
b/
Eli
min
atio
ns
c/
Tot
al
Exp
ense
s
Sala
ries
and
em
plo
yee
ben
efit
s 3
1 52
4 2
8 25
6 4
0 61
5 1
12 2
59 7
7 17
7-
-
289
831
Con
sult
ants
, exp
erts
3 7
42 3
337
5 1
47 6
42 3
351
-
-
1
6 21
9
Tra
vel
9 3
22 9
313
16
266
8 7
58 2
974
-
-
4
6 63
3
Tra
nsfe
rs t
o de
velo
pm
ent
coun
terp
arts
8 0
09 3
3 75
5 1
3 60
8 5
0 9
95-
-
56
417
VIC
com
mon
ser
vice
s 5
1 1
075
322
1 5
10 1
6 61
5-
-
19
573
Tra
inin
g 5
297
16
913
13
844
2 5
08 4
558
-
-
4
3 12
0
Dep
reci
atio
n an
d am
orti
zati
on 1
251
1 8
46 1
993
19
501
9 1
41-
-
33
732
Con
trac
tual
and
oth
er s
ervi
ces
3 2
27 2
345
926
10
574
11
615
-
-
2
8 68
7
Oth
er o
per
atin
g ex
pen
ses
2 9
89 7
292
5 1
64 1
3 38
3 4
161
2 0
47(
7 70
8) 2
7 32
8
Tot
al e
xpen
se 6
5 41
2 1
04 1
32 9
7 88
5 1
69 1
85 1
30 5
87 2
047
( 7
708)
561
540
Ass
ets
Pro
per
ty, p
lant
& e
quip
men
t, a
nd in
tang
ible
s 1
3 11
0 4
9 05
0 2
3 02
8 1
81 1
47 8
4 73
8-
-
351
073
Ass
et a
ddit
ion
s
Pro
per
ty, p
lant
& e
quip
men
t, a
nd in
tang
ible
s 7
04 1
3 03
3 2
664
16
421
7 1
45-
-
39
967
a/ I
nclu
des
pro
ject
man
agem
ent
and
tech
nica
l ass
ista
nce
for
the
Tec
hnic
al C
oop
erat
ion
Pro
gram
me.
The
acc
ompa
nyin
g N
otes
are
an
inte
gral
par
t of t
hese
Sta
tem
ents
.
Dir
ecto
r, D
ivis
ion
of B
udge
t an
d F
inan
ce
ST
AT
EM
EN
T V
I: S
TA
TE
ME
NT
OF
SE
GM
EN
T R
EP
OR
TIN
G B
Y M
AJO
R P
RO
GR
AM
ME
For
th
e ye
ar e
nde
d 31
Dec
embe
r 20
18
(exp
ress
ed i
n e
uro
"00
0s)
b/ E
xpen
ses
not
dire
ctly
cha
rged
to
Maj
or P
rogr
amm
es p
rim
arily
incl
ude
exp
ense
s tr
acke
d ce
ntra
lly p
erta
inin
g to
un-
allo
cate
d sh
ared
ser
vice
s, r
eim
burs
able
wor
k fo
r ot
hers
, dou
btfu
l deb
t ex
pen
ses,
etc
.
c/ M
ajor
Pro
gram
me
exp
ense
s ar
e sh
own
incl
usiv
e of
allo
cate
d sh
ared
ser
vice
s co
sts
and
pro
gram
me
sup
por
t co
sts.
Elim
inat
ions
col
umn
incl
udes
elim
inat
ion
of p
rogr
amm
e su
pp
ort
cost
s an
d ot
her
tran
sact
ions
occ
urri
ng b
etw
een
Maj
or P
rogr
amm
es t
o re
conc
ile t
o to
tal e
xpen
ses
in t
he s
tate
men
t of
fin
anci
al p
erfo
rman
ce.
(sig
ned)
TR
IST
AN
BA
USW
EIN

GC(63)/6 Page 35
Nu
clea
r P
ower
, F
uel
Cyc
le a
nd
Nu
clea
r S
cien
ce
Nu
clea
r T
ech
niq
ues
fo
r D
evel
opm
ent
and
En
viro
nm
enta
l P
rote
ctio
nN
ucl
ear
Saf
ety
and
Sec
uri
tyN
ucl
ear
Ver
ific
atio
n
Pol
icy,
M
anag
emen
t an
d A
dmin
istr
atio
n
Ser
vice
s a/
Exp
ense
s n
ot
Dir
ectl
y C
har
ged
to
Maj
or P
rogr
amm
es
b/
Eli
min
atio
ns
c/
Tot
al
Exp
ense
Sala
ries
and
em
plo
yee
ben
efit
s 3
2 02
1 2
7 38
4 4
0 33
3 1
10 8
15 7
6 38
0-
-
286
933
Con
sult
ants
, exp
erts
3
296
3 4
44 5
248
696
3 4
16-
-
16
100
Tra
vel
8 9
71 8
115
16
073
8 9
04 3
405
-
-
4
5 46
8
Tra
nsfe
rs t
o de
velo
pm
ent
coun
terp
arts
7 6
21 2
7 12
5 1
2 55
2 4
2 8
34-
-
48
174
VIC
com
mon
ser
vice
s 7
2 1
154
454
1 0
72 1
5 88
3-
-
18
635
Tra
inin
g 5
189
15
866
14
446
1 9
53 3
845
-
-
4
1 29
9
Dep
reci
atio
n an
d am
orti
sati
on 1
196
1 6
43 1
984
16
813
8 7
83-
-
30
419
Con
trac
tual
and
oth
er s
ervi
ces
735
686
737
8 7
28 1
3 03
4 4
-
23
924
Oth
er o
per
atin
g ex
pen
ses
3 1
19 7
818
6 6
74 1
2 99
3 2
613
2 8
27(
9 15
2) 2
6 89
2
Tot
al e
xpen
se 6
2 22
0 9
3 23
5 9
8 50
1 1
62 0
16 1
28 1
93 2
831
( 9
152)
537
844
Ass
ets
Pro
per
ty, p
lant
, equ
ipm
ent
and
inta
ngib
les
13
659
37
958
22
356
184
224
86
785
-
-
3
44 9
82
Ass
et a
ddit
ion
s
Pro
per
ty, p
lant
, equ
ipm
ent
and
inta
ngib
les
530
15
652
1 1
75 2
5 33
4 6
450
-
-
4
9 14
1
a/ I
nclu
des
pro
ject
man
agem
ent
and
tech
nica
l ass
ista
nce
for
the
Tec
hnic
al C
oop
erat
ion
Pro
gram
me.
The
acc
ompa
nyin
g N
otes
are
an
inte
gral
par
t of t
hese
Sta
tem
ents
.
Dir
ecto
r, D
ivis
ion
of B
udge
t an
d F
inan
ce
CO
MP
AR
AT
IVE
ST
AT
EM
EN
T V
I: S
TA
TE
ME
NT
OF
SE
GM
EN
T R
EP
OR
TIN
G B
Y M
AJO
R P
RO
GR
AM
ME
For
th
e ye
ar e
nde
d 31
Dec
embe
r 20
17
(exp
ress
ed i
n e
uro
'000
s)
b/ E
xpen
ses
not
dire
ctly
cha
rged
to
Maj
or P
rogr
amm
es p
rim
arily
incl
ude
exp
ense
s tr
acke
d ce
ntra
lly m
ainl
y p
erta
inin
g to
dou
btfu
l deb
t ex
pen
ses,
un-
allo
cate
d sh
ared
ser
vice
s an
d re
imbu
rsab
le w
ork
for
othe
rs.
c/ M
ajor
Pro
gram
me
exp
ense
s ar
e sh
own
incl
usiv
e of
allo
cate
d sh
ared
ser
vice
s co
sts
and
pro
gram
me
sup
por
t co
sts.
Elim
inat
ions
col
umn
incl
udes
elim
inat
ion
of p
rogr
amm
e su
pp
ort
cost
s an
d ot
her
tran
sact
ions
occ
urri
ng b
etw
een
Maj
or P
rogr
amm
es t
o re
conc
ile t
o to
tal e
xpen
ses
in t
he s
tate
men
t of
fin
anci
al p
erfo
rman
ce.
(sig
ned)
TR
IST
AN
BA
USW
EIN

GC(63)/6 Page 36
O
ther
Reg
ula
r B
udg
et
Fu
nd
and
Wor
kin
g C
apit
al F
un
d M
ajor
Cap
ital
In
vest
men
t F
un
d T
ech
nic
al
Coo
pera
tion
Fu
nd
Tec
hn
ical
C
oope
rati
on
Ext
rabu
dget
ary
Fu
nd
Ext
rabu
dget
ary
Pro
gram
me
Fu
nd
Low
En
rich
ed
Ura
niu
m B
ank
Tru
st F
un
ds a
nd
Spe
cial
Fu
nds
Tot
al
Ass
ets
C
ash
and
cash
equ
ival
ents
53
393
21
544
89
999
24
217
181
343
23
183
1 2
41 3
94 9
20
In
vest
men
ts 3
0 00
0-
27
484
23
160
148
072
98
112
-
3
26 8
28
A
ccou
nts
rece
ivab
le 3
8 98
3 5
93 2
332
825
12
905
1 4
98-
57
136
A
dvan
ces
and
pre
pay
men
ts 2
6 71
9 1
857
1 2
73 7
73 1
367
774
-
3
2 76
3
In
vent
ory
381
-
7
887
2 0
88 2
61 2
0 2
10
639
P
rop
erty
, pla
nt &
equ
ipm
ent
285
426
-
-
-
-
7
-
2
85 4
33
In
tang
ible
ass
ets
65
616
-
-
22
-
-
2 6
5 64
0
In
vest
men
t in
com
mon
ser
vice
ent
itie
s 8
09-
-
-
-
-
-
809
Tot
al a
sset
s 5
01 3
27 2
3 99
4 1
28 9
75 5
1 08
5 3
43 9
48 1
23 5
94 1
245
1 17
4 16
8
Lia
bili
ties
A
ccou
nts
pay
able
9 3
22 1
302
4 6
85 5
91 2
776
22
3 1
8 70
1
D
efer
red
reve
nue
195
196
-
1
2 15
2 9
55 3
6 23
5 2
2 82
0-
267
358
E
mp
loy
ee b
enef
it li
abili
ties
301
149
96
-
2
2 4
372
7-
305
646
O
ther
fin
anci
al li
abili
ties
105
-
1
65
301
-
-
472
P
rovi
sion
s 1
69-
-
-
1
218
-
-
1 3
87
Tot
al l
iabi
liti
es 5
05 9
41 1
398
16
838
1 6
33 4
4 90
2 2
2 84
9 3
593
564
Net
ass
ets
( 4
614)
22
596
112
137
49
452
299
046
100
745
1 2
42 5
80 6
04
Equ
ity
F
und
bala
nces
29
018
16
887
88
808
45
609
270
162
77
425
1 2
04 5
29 1
13
R
eser
ves
( 33
632
) 5
709
23
329
3 8
43 2
8 88
4 2
3 32
0 3
8 5
1 49
1
Tot
al e
quit
y(
4 61
4) 2
2 59
6 1
12 1
37 4
9 45
2 2
99 0
46 1
00 7
45 1
242
580
604
The
acc
ompa
nyin
g N
otes
are
an
inte
gral
par
t of t
hese
Sta
tem
ents
.
(sig
ned)
TR
IST
AN
BA
USW
EIN
Dir
ecto
r, D
ivis
ion
of B
udge
t an
d F
inan
ce
ST
AT
EM
EN
T V
IIa:
ST
AT
EM
EN
T O
F S
EG
ME
NT
RE
PO
RT
ING
BY
FU
ND
- F
INA
NC
IAL
PO
SIT
ION
As
at 3
1 D
ecem
ber
2018
(exp
ress
ed i
n e
uro
'000
s)
Reg
ula
r B
udg
etT
ech
nic
al C
oope
rati
onE
xtra
budg
etar
y

GC(63)/6 Page 37
O
ther
Reg
ula
r B
udg
et
Fu
nd
and
Wor
kin
g C
apit
al F
un
d M
ajor
Cap
ital
In
vest
men
t F
un
d T
ech
nic
al
Coo
pera
tion
Fu
nd
Tec
hn
ical
C
oope
rati
on
Ext
rabu
dget
ary
Fu
nd
Ext
rabu
dget
ary
Pro
gram
me
Fu
nd
a/L
ow E
nri
ched
U
ran
ium
Ban
k T
rust
Fu
nds
an
d S
peci
al F
un
ds T
otal
Ass
ets
C
ash
and
cash
equ
ival
ents
84
440
26
120
84
122
17
897
180
747
74
412
1 4
72 4
69 2
10
In
vest
men
ts-
-
2
8 02
2 2
4 69
2 1
37 3
51 4
3 10
4-
233
169
A
ccou
nts
rece
ivab
le 3
8 97
4 5
88 1
583
876
7 4
80 3
08-
49
809
A
dvan
ces
and
pre
pay
men
ts 2
5 31
9 3
42 1
253
1 2
25 3
69 8
16-
29
324
In
vent
ory
418
-
1
0 00
3 1
105
756
-
-
12
282
P
rop
erty
, pla
nt &
equ
ipm
ent
277
784
-
1
-
-
8
-
2
77 7
93
In
tang
ible
ass
ets
67
127
-
2
42
-
-
18
67
189
In
vest
men
t in
com
mon
ser
vice
ent
itie
s 8
09-
-
-
-
-
-
809
Tot
al a
sset
s 4
94 8
71 2
7 05
0 1
24 9
86 4
5 83
7 3
26 7
03 1
18 6
48 1
490
1 13
9 58
5
Lia
bili
ties
A
ccou
nts
pay
able
8 6
24 3
16 4
776
1 3
24 2
694
39
1 1
7 77
4
D
efer
red
reve
nue
204
779
-
9
868
1 5
76 3
6 43
8 2
2 82
0-
275
481
E
mp
loy
ee b
enef
it li
abili
ties
288
867
20
-
1
9 4
285
4-
293
195
O
ther
fin
anci
al li
abili
ties
47
-
6
-
301
-
-
354
P
rovi
sion
s 7
8-
-
-
2
612
-
-
2 6
90
Tot
al l
iabi
liti
es 5
02 3
95 3
36 1
4 65
0 2
919
46
330
22
863
1 5
89 4
94
Net
ass
ets
( 7
524)
26
714
110
336
42
918
280
373
95
785
1 4
89 5
50 0
91
Equ
ity
F
und
bala
nces
23
667
19
535
77
823
36
698
250
384
95
352
1 4
80 5
04 9
39
R
eser
ves
( 31
191
) 7
179
32
514
6 2
19 2
9 99
0 4
32 9
45
152
Tot
al e
quit
y(
7 52
4) 2
6 71
4 1
10 3
37 4
2 91
7 2
80 3
74 9
5 78
4 1
489
550
091
The
acc
ompa
nyin
g N
otes
are
an
inte
gral
par
t of t
hese
Sta
tem
ents
.
(sig
ned)
TR
IST
AN
BA
USW
EIN
Dir
ecto
r, D
ivis
ion
of B
udge
t an
d F
inan
ce
CO
MP
AR
AT
IVE
ST
AT
EM
EN
T V
IIa:
ST
AT
EM
EN
T O
F S
EG
ME
NT
RE
PO
RT
ING
BY
FU
ND
- F
INA
NC
IAL
PO
SIT
ION
As
at 3
1 D
ecem
ber
2017
(exp
ress
ed i
n e
uro
'000
s)
Reg
ula
r B
udg
etT
ech
nic
al C
oope
rati
onE
xtra
budg
etar
y

GC(63)/6 Page 38
O
ther
Reg
ula
r B
udg
et
Fu
nd
and
Wor
kin
g C
apit
al F
un
d M
ajor
Cap
ital
In
vest
men
t F
un
d T
ech
nic
al
Coo
pera
tion
Fu
nd
Tec
hn
ical
C
oope
rati
on
Ext
rabu
dget
ary
Fu
nd
Ext
rabu
dget
ary
Pro
gram
me
Fu
nd
Low
En
rich
ed
Ura
niu
m B
ank
Tru
st F
un
ds a
nd
Spe
cial
Fu
nds
Eli
min
atio
n a
/ T
otal
Rev
enu
e
Ass
esse
d co
ntri
buti
ons
354
042
8 0
59-
-
-
-
-
-
3
62 1
01
Vol
unta
ry m
onet
ary
con
trib
utio
ns-
-
7
9 33
0 1
7 61
6 1
00 0
27-
-
-
196
973
Vol
unta
ry in
-kin
d co
ntri
buti
ons
13
171
-
-
-
-
-
-
-
1
3 17
1
Oth
er c
ontr
ibut
ions
1 6
61-
3 8
53-
-
-
-
-
5 5
14
Rev
enue
fro
m e
xcha
nge
tran
sact
ions
2 4
35-
-
-
-
-
-
-
2 4
35
Inve
stm
ent
reve
nue
828
-
4
81 1
53 1
367
2 0
04-
-
4
833
Inte
rnal
rev
enue
incl
udin
g p
rogr
amm
e su
pp
ort
cost
s 1
535
-
-
-
6
173
-
-
( 7
708)
-
Tot
al r
even
ue
373
672
8 0
59 8
3 66
4 1
7 76
9 1
07 5
67 2
004
-
(
7 70
8) 5
85 0
27
Exp
ense
s
Sala
ries
and
em
plo
yee
ben
efit
s 2
56 3
63 4
1-
299
31
963
1 1
65-
-
2
89 8
31
Con
sult
ants
, exp
erts
8 2
18 7
8 3
919
459
3 5
36 9
-
-
16
219
Tra
vel
18
003
-
1
3 78
9 1
336
13
453
52
-
-
46
633
Tra
nsfe
rs t
o de
velo
pm
ent
coun
terp
arts
6 5
15-
35
224
4 4
50 1
0 00
9 4
215
-
5
6 41
7
VIC
com
mon
ser
vice
s 1
9 43
2-
1-
140
-
-
-
1
9 57
3
Tra
inin
g 3
839
9 2
8 04
9 4
713
6 4
96 1
4-
-
4
3 12
0
Dep
reci
atio
n an
d am
orti
sati
on 3
3 69
7-
2 2
0-
5 8
-
3
3 73
2
Con
trac
tual
and
oth
er s
ervi
ces
19
813
1 4
00 4
6-
7 2
86 1
42-
-
2
8 68
7
Oth
er o
per
atin
g ex
pen
ses
22
972
1 5
91 1
928
797
7 4
99 2
37 1
2(
7 70
8) 2
7 32
8
Tot
al e
xpen
ses
388
852
3 1
19 8
2 95
8 1
2 07
4 8
0 38
2 1
628
235
( 7
708)
561
540
Net
gai
ns/(
loss
es)
( 1
262)
( 1
74)
1 2
95 1
004
4 5
64 4
584
( 4
)-
10
007
Net
su
rplu
s/(d
efic
it)
( 16
442
) 4
766
2 0
01 6
699
31
749
4 9
60(
239
)-
33
494
a/ F
und
exp
ense
s ar
e sh
own
incl
usiv
e of
pro
gram
me
sup
por
t co
sts
and
tran
sact
ions
occ
urri
ng b
etw
een
fund
s. T
his
colu
mn
incl
udes
elim
inat
ion
of p
rogr
amm
e su
pp
ort
cost
s an
d ot
her
tran
sact
ions
occ
urri
ng b
etw
een
fund
s to
rec
onci
le t
o to
tal e
xpen
ses
in t
he s
tate
men
t of
fin
anci
al
per
form
ance
.
(sig
ned)
TR
IST
AN
BA
USW
EIN
Dir
ecto
r, D
ivis
ion
of B
udge
t an
d F
inan
ce
ST
AT
EM
EN
T V
IIb:
ST
AT
EM
EN
T O
F S
EG
ME
NT
RE
PO
RT
ING
BY
FU
ND
- F
INA
NC
IAL
PE
RF
OR
MA
NC
EF
or t
he
year
en
ded
31 D
ecem
ber
2018
(exp
ress
ed i
n e
uro
'000
s)
Reg
ula
r B
udg
etT
ech
nic
al C
oope
rati
onE
xtra
budg
etar
y

GC(63)/6 Page 39
O
ther
Reg
ula
r B
udg
et
Fu
nd
and
Wor
kin
g C
apit
al F
un
d M
ajor
Cap
ital
In
vest
men
t F
un
d T
ech
nic
al
Coo
pera
tion
Fu
nd
Tec
hn
ical
C
oope
rati
on
Ext
rabu
dget
ary
Fu
nd
Ext
rabu
dget
ary
Pro
gram
me
Fu
nd
Low
En
rich
ed
Ura
niu
m B
ank
Tru
st F
un
ds a
nd
Spe
cial
Fu
nds
Eli
min
atio
n a
/ T
otal
Rev
enu
e
Ass
esse
d co
ntri
buti
ons
355
569
8 1
01-
-
-
-
-
-
3
63 6
70
Vol
unta
ry m
onet
ary
con
trib
utio
ns-
-
8
4 57
1 2
3 66
9 9
8 77
2-
-
-
207
012
Vol
unta
ry in
-kin
d co
ntri
buti
ons
10
225
-
-
-
-
-
-
-
1
0 22
5
Oth
er c
ontr
ibut
ions
1 0
99-
216
-
-
-
-
-
1
315
Rev
enue
fro
m e
xcha
nge
tran
sact
ions
2 6
26-
-
-
-
-
-
-
2 6
26
Inve
stm
ent
reve
nue
445
-
3
67 9
8 8
38 9
34-
-
2
682
Inte
rnal
rev
enue
incl
udin
g p
rogr
amm
e su
pp
ort
cost
s 2
534
-
-
-
6
618
-
-
( 9
152)
-
Tot
al r
even
ue
372
498
8 1
01 8
5 15
4 2
3 76
7 1
06 2
28 9
34-
( 9
152)
587
530
Exp
ense
s
Sala
ries
and
em
plo
yee
ben
efit
s 2
51 0
79 9
23-
370
33
145
1 4
16-
-
2
86 9
33
Con
sult
ants
, exp
erts
8 1
90 2
40 3
953
779
2 8
71 6
7-
-
1
6 10
0
Tra
vel
19
769
3 1
1 00
9 3
203
11
251
233
-
-
45
468
Tra
nsfe
rs t
o de
velo
pm
ent
coun
terp
arts
6 9
69-
23
934
5 0
56 1
2 16
9 1
5 3
1-
48
174
VIC
com
mon
ser
vice
s 1
8 55
1-
1-
83
-
-
-
1
8 63
5
Tra
inin
g 3
753
1 2
8 22
9 3
900
5 4
11 5
-
-
41
299
Dep
reci
atio
n an
d am
orti
sati
on 3
0 30
1-
4 2
0-
6 8
8-
30
419
Con
trac
tual
and
oth
er s
ervi
ces
19
766
1 3
76 1
4 1
2 4
68 2
99-
-
2
3 92
4
Oth
er o
per
atin
g ex
pen
ses
22
320
505
1 6
47 9
64 1
0 55
0 5
2 6
( 9
152)
26
892
Tot
al e
xpen
ses
380
698
3 0
48 6
8 79
1 1
4 29
3 7
7 94
8 2
093
125
( 9
152)
537
844
Net
gai
ns/(
loss
es)
( 3
648)
506
( 5
267)
( 4
363)
( 13
658
)(
13 7
51)
10
( 40
171
)
Net
su
rplu
s/(d
efic
it)
( 11
848
) 5
559
11
096
5 1
11 1
4 62
2(
14 9
10)
( 1
15)
-
9
515
The
acc
ompa
nyin
g N
otes
are
an
inte
gral
par
t of t
hese
Sta
tem
ents
.
a/ F
und
exp
ense
s ar
e sh
own
incl
usiv
e of
pro
gram
me
sup
por
t co
sts
and
tran
sact
ions
occ
urri
ng b
etw
een
fund
s. T
his
colu
mn
incl
udes
elim
inat
ion
of p
rogr
amm
e su
pp
ort
cost
s an
d ot
her
tran
sact
ions
occ
urri
ng b
etw
een
fund
s to
rec
onci
le t
o to
tal e
xpen
ses
in t
he s
tate
men
t of
fin
anci
al
per
form
ance
.
(sig
ned)
TR
IST
AN
BA
USW
EIN
Dir
ecto
r, D
ivis
ion
of B
udge
t an
d F
inan
ce
CO
MP
AR
AT
IVE
ST
AT
EM
EN
T V
IIb:
ST
AT
EM
EN
T O
F S
EG
ME
NT
RE
PO
RT
ING
BY
FU
ND
- F
INA
NC
IAL
PE
RF
OR
MA
NC
EF
or t
he
year
en
ded
31 D
ecem
ber
2017
(exp
ress
ed i
n e
uro
'000
s)
Reg
ula
r B
udg
etT
ech
nic
al C
oope
rati
onE
xtra
budg
etar
y

GC(63)/6 Page 41
Part III
Notes to the Financial Statements

GC(63)/6 Page 43
Notes to the Financial Statements
NOTE 1: Reporting entity ..................................................................................................................... 45
NOTE 2: Basis of preparation ............................................................................................................... 45
NOTE 3: Significant accounting policies ............................................................................................. 47
NOTE 4: Cash and cash equivalents ..................................................................................................... 61
NOTE 5: Investments ........................................................................................................................... 62
NOTE 6: Accounts receivable from non-exchange transactions .......................................................... 62
NOTE 7: Non-Exchange receivable information .................................................................................. 64
NOTE 8: Accounts receivable from exchange transactions ................................................................. 66
NOTE 9: Advances and prepayments ................................................................................................... 67
NOTE 10: Inventory ............................................................................................................................. 68
NOTE 11: Investment in common services entities .............................................................................. 69
NOTE 12: Property, plant and equipment ............................................................................................ 70
NOTE 13: Intangible assets .................................................................................................................. 73
NOTE 14: Accounts payable ................................................................................................................ 75
NOTE 15: Deferred revenue ................................................................................................................. 76
NOTE 16: Employee benefit liabilities ................................................................................................. 77
NOTE 17: Post-employment related plans ........................................................................................... 77
NOTE 18: Other financial liabilities ..................................................................................................... 83
NOTE 19: Provisions ............................................................................................................................ 83
NOTE 20: Movements in fund balances ............................................................................................... 85
NOTE 21: Movement in fund balances of individual funds with specific purposes ............................ 86
NOTE 22: Movements in reserves by fund group ................................................................................ 87
NOTE 23: Assessed contributions ........................................................................................................ 88
NOTE 24: Voluntary contributions ....................................................................................................... 89
NOTE 25: Other contributions .............................................................................................................. 90
NOTE 26: Revenue from exchange transactions .................................................................................. 90
NOTE 27: Investment revenue ............................................................................................................. 91
NOTE 28: Salaries and employee benefits ........................................................................................... 91
NOTE 29: Consultants, experts ............................................................................................................ 92
NOTE 30: Travel .................................................................................................................................. 92
NOTE 31: Transfers to development counterparts ............................................................................... 93
NOTE 32: Vienna International Centre common services ................................................................... 93
NOTE 33: Training ............................................................................................................................... 93
NOTE 34: Contractual and other services ............................................................................................ 94
NOTE 35: Other operating expenses .................................................................................................... 94

GC(63)/6 Page 44
NOTE 36: Net gains/ (losses) ............................................................................................................... 95
NOTE 37: Interests in other entities ..................................................................................................... 95
NOTE 38: Segment reporting by Major Programme - composition by fund ...................................... 102
NOTE 39: Budget ............................................................................................................................... 104
NOTE 39a: Movements between original and final budgets (Regular Budget) ................................. 104
NOTE 39b: Reconciliation between actual amounts on a budget comparable basis and the cash flow statement ............................................................................................................................................. 105
NOTE 39c: Budget to actuals variance analysis ................................................................................. 106
NOTE 39d: Major Capital Investment Fund (MCIF) ......................................................................... 107
NOTE 40: Related parties ................................................................................................................... 108
NOTE 41: Financial instruments disclosure ....................................................................................... 109
NOTE 42: Commitments .................................................................................................................... 112
NOTE 43: Contingent liabilities and contingent assets ...................................................................... 113
NOTE 44: Events after the reporting date .......................................................................................... 114
NOTE 45: Ex-gratia payments ............................................................................................................ 114
GC(63)/6 Page 45
NOTE 1: Reporting entity
The International Atomic Energy Agency (IAEA or the Agency) is a not-for-profit autonomous intergovernmental organization founded in 1957 in accordance with its Statute. The Agency is a part of the United Nations Common System and the relationship with the United Nations is regulated by the ‘Agreement Governing the Relationship between the United Nations and the International Atomic Energy Agency’ which came into force on 14 November 1957.
The Agency’s statutory objective is to seek to accelerate and enlarge the contribution of atomic energy to peace, health and prosperity throughout the world and to ensure, so far as it is able, that assistance provided by it or at its request or under its supervision or control is not used in such a way as to further any military purpose. To fulfil this statutory objective, the Agency manages its work under the following six Major Programmes:
Nuclear Power, Fuel Cycle and Nuclear Science;
Nuclear Techniques for Development and Environmental Protection;
Nuclear Safety and Security;
Nuclear Verification;
Policy, Management and Administration Services; and
Management of Technical Cooperation for Development.
The statements and related notes on segment reporting by Major Programme and by Fund provide further detail on how these core activities are managed and financed.
NOTE 2: Basis of preparation
These financial statements have been prepared on the accrual basis of accounting in accordance with the requirements of the International Public Sector Accounting Standards (IPSAS). Where IPSAS is silent concerning any specific matter, the appropriate International Financial Reporting Standard (IFRS) or International Accounting Standard (IAS) is applied.
The financial statements have been prepared on a going concern basis and the accounting policies have been applied consistently throughout the period.
Accounting convention
The financial statements have been prepared using the historical cost convention.
Changes in presentation
IPSAS 39, Employee Benefits, which was issued in July 2016, replaced IPSAS 25, Employee Benefits with an effective date 1 January 2018. The Agency has adopted IPSAS 39 in the 2018 financial statements. The main differences between IPSAS 39 and IPSAS 25 are in the recognition and presentation of actuarial gains and losses arising from the defined benefit plans, which has no impact for the IAEA. Nevertheless, the adoption of IPSAS 39 requires additional

GC(63)/6 Page 46
disclosures to be provided, and therefore the comparative figures of Note 17 were adjusted to include further details as applicable. No other changes were required due to the adoption of IPSAS 39.
Certain prior-year amounts have been reclassified to conform to the current year’s presentation. In an effort to harmonize the treatment of training related travel costs by its nature, the reporting of certain travel costs that are in support of non-staff training activities were reclassified in 2017. To fully align the accounting and reporting for 2017, expenses amounting to a further €6.650 million, has been reclassified to non-staff training expenses. These transactions stem from our pre-AIPS systems. This reclassification is contained in the 2017 comparative information in Statement II, Statement VI, and Statement VIIb, as well as Note 30 and Note 33.
Functional currency and translation of foreign currencies
Functional and presentation currency
The functional currency of the Agency (including all Fund groups) is the euro. The financial statements are presented in euros, and all values are rounded to the nearest thousand euros (euro ’000s) unless otherwise stated.
Transactions and balances
Foreign currency transactions are translated into euros using the United Nations Operational Rates of Exchange (UNORE). The UNORE are set once a month, and revised mid-month if there are significant exchange rate fluctuations relating to individual currencies.
Monetary assets and liabilities denominated in foreign currencies are converted into euros at the UNORE year-end closing rate.
Realized and unrealized foreign exchange gains and losses resulting from the settlement of foreign currency transactions and from the conversion of year-end exchange rates of monetary assets and liabilities denominated in foreign currencies, are recognized in the Statement of Financial Performance.
Materiality and use of judgment and estimates
Materiality is central to the Agency’s financial statements. The Agency’s accounting materiality framework provides a systematic method to identify, analyze, evaluate, endorse and periodically review materiality decisions across a number of accounting areas.
The financial statements include amounts based on judgments, estimates and assumptions by management. Changes in estimates are reflected in the period in which they become known.

GC(63)/6 Page 47
NOTE 3: Significant accounting policies
Assets
Financial assets
Financial assets are either cash or financial instruments. Financial assets maturing within one year of the reporting date are classified as current assets. Financial assets with a maturity date of more than one year after the reporting date are classified as non-current assets.
The Agency may classify financial instruments into the following categories: at fair value through surplus or deficit; loans and receivables; held to maturity; and available for sale. The classification, which depends on the purpose for which the financial instruments are acquired, is determined at initial recognition and re-evaluated at each reporting date.
Classification Financial instrument
Loans and receivables Investments – term deposits
Cash equivalents, contributions receivable and other receivables
Held to maturity Investments – treasury bills and other discounted notes
Available for sale None at 31 December 2018 and 2017
Fair value through surplus or deficit None at 31 December 2018 and 2017
Loans and receivables are financial assets with fixed or determinable payments that are not quoted in an active market.
‘Held to maturity’ assets are non-derivative financial assets with fixed or determinable payments and fixed maturity that the Agency has the positive intention and ability to hold to maturity. They are initially recorded at fair value plus transaction costs and are subsequently recorded at amortized cost using the effective interest method. Treasury bills and other discounted notes are classified as ‘held to maturity’.
Cash and cash equivalents
Cash and cash equivalents include cash on hand, deposits held at call with banks and other short-term highly liquid investments with original maturities of three months or less.
Investments
Investments include term deposits, treasury bills and other discounted notes, all with original maturities greater than three months. As term deposits are purchased at face value, no discount amortization is required.
Contributions and receivables
Receivables relate to amounts owed to the Agency from Member States, donors, staff and others. They represent non-derivative financial assets. Receivables are recognized at their nominal value unless the effect of discounting them to their net present value is material.
Allowances for doubtful accounts are recognized when there is objective evidence that a receivable is impaired. Allowances are recognized based on historical collection experience and/or

GC(63)/6 Page 48
evidence indicating that the collection of a particular receivable is in doubt. Impairment losses are recognized in the Statement of Financial Performance in the year they arise.
Advances and prepayments
Advances and prepayments represent settlements of a debt or installment payment before its official due date. Advances and prepayments are recognized at their nominal value unless the effect of discounting is material.
Inventories
All goods (e.g. equipment, supplies and software) procured by the Agency or donated to it for transfer to recipient Member and non-Member States are recorded as project inventories. The transfer of these project inventories, also known as ‘field procurement’, takes place mostly under the Technical Cooperation Programme, but also directly within the technical departments in the framework of specific assistance programmes. Goods still under control of the Agency at the reporting date are included in project inventories in-transit to counterparts. In accordance with the agreements in place with the Agency’s counterparts, project inventories are de-recognized when they clear customs in the recipient country, which is considered the point at which the Agency transfers control over such inventories to the recipients. In order to reflect the fact that inventories that have been in transit for some time may not actually be delivered or may suffer damage or obsolescence, an item in-transit allowance is made of 50% of value for items in transit for over twelve months and 100% for over 24 months.
The Agency produces and holds publications and reference materials. These are not recognized as assets and the cost of producing each type of publication and reference material is expensed as incurred. This is due to the fact that the present value of the long-term service potential of these items, net of a required slow moving and obsolete inventory allowance, cannot be reliably determined in view of an indeterminable remaining holding period and the related risks of obsolescence.
Inventories are stated at fair value, measured as the lower of cost and either current replacement cost or net realizable value. Current replacement cost, which is used for inventories to be distributed to beneficiaries at no or nominal charge, is the cost the Agency would incur to acquire the asset on the reporting date. Net realizable value, which is used for inventories to be sold at broadly commercial terms or used by the Agency, is the estimated selling price in the ordinary course of business, less the cost of completion and selling expenses.
Cost is determined using a weighted average cost formula unless the inventory items are unique in nature, in which case the specific identification method is used. The Agency utilizes a periodic system for the determination of inventories balances and respective inventory expense at the year end.
GC(63)/6 Page 49
These policies apply to the Agency’s major inventory categories as follows:
Inventory item Valuation method Cost formula
Project inventories in transit to counterparts
Lower of cost or current replacement cost
Specific identification method
Safeguards spare parts and maintenance materials
Lower of cost or net realizable value Weighted average cost
Printing supplies Lower of cost or net realizable value Weighted average cost
The Agency manages its Safeguards spare parts and maintenance materials inventory primarily in a centralized fashion. Inventories which are managed in central locations with a cost of €0.100 million or greater are capitalized. Currently, such inventories are comprised of batteries and cables. Other minor inventory items centrally managed or held in decentralized locations are not capitalized due to the immateriality of such balances.
A charge for impairment is recorded in the Statement of Financial Performance in the year in which the inventory is determined to be impaired due to obsolescence or excess quantities relative to demand.
Property, plant and equipment
Measurement of costs at recognition
PP&E is considered non-cash generating assets and stated at historical cost less accumulated depreciation and any recognized impairment loss. For donated assets, the fair value as of the date of acquisition is utilized as a proxy for historical cost. Construction in progress assets are recorded at cost and will only begin to depreciate from the date they are available for use. Heritage assets are not capitalized. PP&E items are capitalized in the financial statements if they have a cost equal to or greater than €3 000, except specific PP&E items of computer equipment and furniture which are considered group items and capitalized irrespective of costs.
Subsequent costs are included in the asset’s carrying amount or recognized as a separate asset, as appropriate, only when it is probable that future economic benefits or service potential associated with the item will flow to the Agency and the cost of the item can be measured reliably. Repairs and maintenance costs are charged as an expense in the Statement of Financial Performance during the financial period in which they are incurred.
Depreciation method and useful life
Depreciation is charged so as to allocate the cost of assets over their estimated useful lives using the straight-line method.

GC(63)/6 Page 50
The estimated useful lives for the different PP&E classes are as follows and are subject to annual review.
Asset Class Useful Life (Years)
Communications and Information Technology Equipment
2 to 4
Vehicles 5
Furniture and Fixtures 12
Buildings 5 years (for prefabricated and containerized structures) and
15 to 100 years for others
Leasehold Buildings and Improvements Shorter of lease term or useful life
Inspection Equipment 8
Laboratory Equipment 11
Other Equipment 5
Intangible assets
Measurement of costs at recognition
The Agency has applied IPSAS 31 Intangible Assets prospectively. As a result, intangible asset costs which were incurred before 1 January 2011 related to acquired or internally developed intangible assets have not been capitalized.
Intangible assets are carried at cost less accumulated amortization and any recognized impairment loss. For donated intangible assets, the fair value as of the date of acquisition is used as a proxy for cost. Capitalized intangible assets under development are recorded at cost and begin to be amortized once they are available for use. Intangible assets are capitalized in the financial statements if they have a cost equal to or greater than €3 000, except for internally developed software for which the capitalization threshold has been set at €25 000.
Subsequent costs are included in the asset’s carrying amount or recognized as a separate asset, as appropriate, only when it is probable that future economic benefits or service potential associated with the item will flow to the Agency and the cost of the item can be measured reliably. Maintenance costs are charged as an expense in the Statement of Financial Performance during the financial period in which they are incurred.
Amortization method and useful life
Amortization is provided on a straight-line basis on all intangible assets of finite life, at rates that will allocate the cost or value of the assets to their estimated useful lives. The estimated useful lives of major classes of intangible assets are subject to an annual review. Internally developed software generally has a useful life of 5 years; however, it has been determined that the Agency-wide Information System for Programme Support (AIPS) has a useful life of up to 12 years and projects developed under the Modernization of the Safeguards Information Technology (MOSAIC) project have a useful life of 8 years.

GC(63)/6 Page 51
Asset Class Useful Life (Years)
Software acquired separately 5
Software internally developed 5 to 12
Verification and impairment of assets
Asset verification is an internal control measure that ensures the existence, location and condition of the assets and supports the ongoing maintenance of assets within the Agency. The Agency has physical verification procedures to ensure that assets are accurately recorded in the asset register and reflected in the financial statements.
Assets that are subject to depreciation or amortization are reviewed annually for impairment to ensure that the carrying amount is still considered to be recoverable. Impairment occurs through complete loss, major damage or obsolescence. In case of complete loss, full impairment is recorded. In the case of major damage or obsolescence, impairment is recognized when the impairment exceeds €25 000. An impairment loss is recognized in the Statement of Financial Performance for the amount by which the asset’s carrying amount exceeds its recoverable service amount. The recoverable service amount is the higher of an asset’s fair value less costs to sell and value in use. This impairment loss can be reversed in the subsequent periods if the recoverable service amount increases, to the extent of such increase, subject to a maximum of the impairment loss recognized.
Assets subject to restrictions
All of the Agency’s financial assets and inventories are subject to restrictions such that they can only be utilized in support of the approved activities of the funds to which they were provided. Additionally, the financial assets and inventories of the Technical Cooperation Extrabudgetary Fund, Extrabudgetary Programme Fund, Low Enriched Uranium (LEU) Bank and Trust Funds and Special Funds are further restricted to specific programmatic activities within these Funds. Statement VIIa shows the balances of these assets by Fund.
Leases
Finance leases
Leases of tangible assets, for which the Agency has substantially all the risks and rewards of ownership, are classified as finance leases.
Operating leases
Leases where the lessor retains a significant portion of the risks and rewards inherent in ownership are classified as operating leases. Payments due under operating leases are charged to the Statement of Financial Performance as an expense.
Liabilities
Financial liabilities
Financial liabilities include accounts payable, employee benefits liabilities, provisions and other financial liabilities.

GC(63)/6 Page 52
Accounts payable
Accounts payable are financial liabilities in respect of goods or services that have been received by the Agency, but not paid for. They are initially recognized at fair value and, when applicable, subsequently measured at amortized cost using the effective interest method. As the Agency’s accounts payable generally fall due within 12 months, the impact of discounting is immaterial, and nominal values are applied to initial recognition and subsequent measurement.
Other financial liabilities
Other financial liabilities primarily include unspent funds held for future refunds and other miscellaneous items such as unapplied cash receipts. They are designated similar to accounts payable, and are recorded at nominal value as the impact of discounting is immaterial.
Employee benefit liabilities
The Agency recognizes the following categories of employee benefits:
Short-term employee benefits;
Post-employment benefits;
Other long-term employee benefits; and
Termination benefits.
Short-term employee benefits
Short-term employee benefits comprise of first-time employee benefits (assignment grants), regular monthly benefits (wages, salaries, allowances) and other short-term benefits (education grant, reimbursement of income taxes). Short-term employee benefits are expected to be settled within 12 months of the reporting date and are measured at their nominal values based on accrued entitlements at current rates of pay. These are treated as current liabilities. Certain other short-term employee benefits such as paid sick leave and maternity leave are recognized as an expense as they occur.
Post-employment benefits
Post-employment benefits comprise of the Agency’s contribution to the After Service Health Insurance (ASHI) plan, repatriation grants and end-of-service allowances, along with separation based travel and shipping costs. The liability recognized for these plans is the present value of the defined benefit obligations at the reporting date. The defined benefit obligations are calculated by independent actuaries using the projected unit credit method. The present value of the defined benefit obligation is determined by discounting the estimated future cash outflows using interest rates of high quality euro corporate bonds with maturity dates approximating those of the individual plans. Some elements of normally long-term benefits may be expected to be settled within 12 months of the reporting date and are therefore treated as current liabilities.
Actuarial gains or losses relating to ASHI and post-employment repatriation and separation obligations are accounted for using the ‘reserve approach’, i.e. they are recognized through net assets/equity in the Statement of Financial Position and in the Statement of Changes in Equity in the year in which they occur.

GC(63)/6 Page 53
Other long-term employee benefits
Other long-term employee benefits are benefits that are due to be settled beyond 12 months such as annual leave and home leave. Annual leave and home leave benefits are calculated without the use of actuaries and are not discounted as the effect of discounting is not material. Long-term employee benefits are normally treated as non-current liabilities. Some elements of normally long-term benefits may be expected to be settled within 12 months of the reporting date and are therefore treated as current liabilities. Other long-term employee benefits are recognized immediately in the Statement of Financial Performance.
Termination benefits
Termination benefits are the benefits payable if the Agency terminates employment before the retirement date/contract expiry date. These are recognized when the Agency gives notice to an employee that the contract will be terminated early, or if termination relates to a number of staff, when a detailed plan for termination exists.
United Nations Joint Staff Pension Fund
The Agency is a member organization participating in the United Nations Joint Staff Pension Fund (UNJSPF), which was established by the United Nations General Assembly to provide retirement, death, disability and related benefits to employees. The Pension Fund is a funded, multi-employer defined benefit plan. As specified in Article 3(b) of the Regulations of the Fund, membership in the Fund shall be open to the specialized agencies and to any other international, intergovernmental organization which participates in the common system of salaries, allowances and other conditions of service of the United Nations and the specialized agencies.
The plan exposes participating organizations to actuarial risks associated with the current and former employees of other organizations participating in the Fund, with the result that there is no consistent and reliable basis for allocating the obligation, plan assets and costs to individual organizations participating in the plan. The Agency and the UNJSPF, in line with the other participating organizations in the Fund, are not in a position to identify the Agency’s proportionate share of the defined benefit obligation, the plan assets and the costs associated with the plan with sufficient reliability for accounting purposes. Hence, the Agency has treated this plan as if it were a defined contribution plan in line with the requirements of IPSAS 39 Employee Benefits. The Agency’s contributions to the plan during the financial period are recognized as expenses in the Statement of Financial Performance.
Provisions
Provisions are recognized when the Agency has a present legal or constructive obligation as a result of past events, it is probable that an outflow of resources will be required to settle the obligation, and the amount can be reliably estimated. The amount of the provision is the best estimate of the expenditures expected to be required to settle the present obligation at the reporting date. This estimate is discounted where the effect of the time value of money is material.
GC(63)/6 Page 54
Contingent liabilities and contingent assets
Contingent liabilities
Any possible obligations that arise from past events and whose existence will be confirmed only by the occurrence or non-occurrence of one or more uncertain future events not wholly within the control of the Agency are disclosed.
Contingent assets
Any probable assets that arise from past events and whose existence will be confirmed only by the occurrence or non-occurrence of one or more uncertain future events not wholly within the control of the Agency are disclosed.
Equity
Components of Net Assets/Equity are disaggregated into Fund Balances, which represent accumulated surpluses and deficits, and Reserves. Reserves represent specific categories of net assets/equity with a potential future impact on Fund Balances. Examples of such reserves include a reserve for commitments, which represents purchase orders and service contracts that are not yet delivered as at end of the reporting period and reserves for actuarial gains/losses on employee benefit liabilities.
Revenue
Non-exchange revenue
Assessed contributions from Member States
Revenue from assessed contributions from Member States is recorded as of the first day of the year to which they relate. Assessed contributions received in advance of the year to which they relate are recorded as deferred revenue.
Voluntary contributions
Voluntary contribution agreements normally contain stipulations on the use of transferred resources by the Agency. Stipulations can be either restrictions or conditions. Restrictions limit or direct the purpose for which resources are used, while conditions require resources to be used as specified or returned to the transferor.
Voluntary contributions made to the Extrabudgetary Programme Fund, Low Enriched Uranium Extrabudgetary Programme Fund, Technical Cooperation Extrabudgetary Fund, and Trust Funds and Special Funds are generally restricted in their use.
Revenue from voluntary contributions is recognized upon the signing of a binding pledge agreement between the Agency and the third party providing the contribution as long as the agreement does not impose conditions on the Agency. Revenue from voluntary contributions relating to the Technical Cooperation Fund is recognized at the later of the first day of the target year to which it relates or the date a binding pledge is received.
Voluntary contributions that include conditions on their use are initially treated as deferred revenue and recognized as revenue when the conditions are satisfied. Generally, the conditions
GC(63)/6 Page 55
are deemed satisfied upon approval of progress or final reports. Interest on such awards is recognized as it is earned unless the terms of the contribution would also require the return of such interest to the donor if the conditions are not met.
Refunds of voluntary contributions for which revenue was recognized in prior years are recorded as direct adjustment to equity.
National Participation Costs
National Participation Costs (NPCs) represent contributions from Member States related to the approved technical cooperation national programme for each Member State. As NPCs comprise only 5% of the approved technical cooperation national programme (including national projects, fellows and scientific visitors funded under regional or interregional activities), such contributions are considered non-exchange revenue. Revenue from NPCs is recognized when the projects comprising the technical cooperation national programme have been approved by the Technical Assistance and Cooperation Committee of the Board of Governors (TACC) and the amounts become due to the Agency, which is generally on 1 January following the TACC meeting in the preceding year. Since a majority of the projects are approved as of the first year of a biennium, NPCs revenue will generally be higher in that year compared to the second year of the biennium.
Goods and services in-kind contributions
Goods-in-kind
Goods that are donated to the Agency are recognized as revenue if the item value is worth €3 000 or more, with a corresponding increase in the appropriate asset, when such donations are received by the Agency. Revenue is recognized at fair value, measured as of the date the donated goods are recognized. Fair value is generally measured by reference to the price of the same or similar goods in an active market.
The Agency is provided with the use, under lease type arrangements with governments, of some of its land, buildings and facilities. The Agency’s treatment of these arrangements is set out in the leases section previously described.
Services-in-kind
Services that are donated to the Agency are not recognized as revenue although disclosures related to the nature and types of these services are provided.
Exchange revenue
Revenue from the sale of goods is recognized when significant risk and rewards of ownership of the goods are transferred to the purchaser.
Revenue from services is recognized when the service is rendered according to the estimated stage of completion of that service, provided that the outcome can be reliably estimated.

GC(63)/6 Page 56
Revenue from use of entity’s assets from the use of assets is recognized when both of the following conditions are satisfied:
(1) The amount of revenue can be measured reliably
(2) It is probable that the economic benefits or service potential will flow to the entity
Investment revenue
Investment revenue is recognized over the period that it is earned. Interest on treasury bills and other discounted notes is recognized using the effective interest method.
Expenses
Exchange expenses
Exchange expenses arising from the purchase of goods and services are recognized at the point that the supplier has performed its contractual obligations, which is when the goods and services are delivered and accepted by the Agency. For some service contracts, this process may occur in stages.
Non-exchange expenses
The Agency incurs non-exchange expenses primarily in the transfer of project inventories to development counterparts. An expense is recognized when the project inventories clear customs in the recipient country, which is considered the point at which the Agency transfers control over such inventories to the recipients.
Other non-exchange expenses are incurred primarily in provision of grants to fund research and fellowship agreements. An expense is recognized at the point that the Agency has authorized the funds for release, or has a binding obligation to pay, whichever is earlier. For yearly non-exchange funding agreements, an expense is recognized for the period to which the funding relates.
Interests in other entities
The Agency participates in a number of arrangements which are classified in line with the requirements of IPSAS 35 to 38 as described below. For specific details on these arrangements, their governance and legal background refer to Note 37. The VIC Based Organizations (VBOs) have an agreement whereby the costs of certain VIC common services provided by each organization are to be shared according to the established cost-sharing ratios. The ratios are derived each year based on key factors such as number of employees, total space occupied, etc. The cost-sharing ratio for the Agency for 2018 is 54.873% (55.140% for 2017).

GC(63)/6 Page 57
IPSAS standard and requirements Accounting treatment Applicable to
IPSAS 35: Consolidated Financial Statements
Control is the key criteria for consolidation. It implies all of the following:
Full consolidation of revenue, expenses, assets and liabilities.
VIC common services provided by the Agency:
-Medical services
Power over the other entity. -Printing and reproduction
Exposure to rights to variable financial and non-financial benefits.
Ability to use its power over the other entity to affect the nature or amount of the benefits from its involvement with the other entity.
IPSAS 37: Joint Arrangements
Two or more parties have joint control (as defined in IPSAS 35) with the following characteristics:
Joint Operation - Proportionate consolidation of Agency’s share of revenue, expenses, assets and liabilities.
The following Joint Operations:
The parties are bound by a binding arrangement which gives them joint control.
Joint Venture – Equity method accounting.
- Joint Division of Nuclear Techniques with the Food and Agriculture Organization (FAO)
Activities require unanimous consent among the parties with joint control.
-VIC land and buildings including Major Repairs and Replacements Fund (MRRF) (based on a defined cost sharing ratio)
There are two types of joint arrangements:
- Joint Operations
- Joint Ventures
IPSAS 38: Disclosure of interests in other entities
Prescribes disclosure requirements for interests in other entities that do not meet the requirements of the following categories: controlled entities, joint arrangements and associates, as well as structured entities that are not consolidated.
Disclose information that enables users of the financial statements to evaluate: the nature of, and risk associated with its interest in the other entities as well as the effects of those interests on its financial position, financial performance and cash flows.
- Abdus Salam International Centre for Theoretical Physics (ICTP) in Trieste: jointly funded with the United Nations Educational Scientific and Cultural Organization (UNESCO) and the Italian Government
- the VIC Commissary
Services provided by other VBOs, such as the Buildings Maintenance Services (BMS) provided by the United Nations Industrial Development Organization (UNIDO) and the UN security services and some conference services provided by the United Nations Office in Vienna (UNOV), are services provided to the Agency and thus are expensed when the related services have been received.
Other IPSAS standards, such as IPSAS 34 Separate Financial Statements and IPSAS 36 Investments in Associates and Joint Ventures, are not currently applicable to the Agency. IPSAS 34 is to be applied when an entity prepares and presents its financial statements under the

GC(63)/6 Page 58
accrual basis and elects or is required by its regulations to present investments in controlled entities separately. IPSAS 36 requires the equity method to be applied when a significant influence and a quantifiable ownership interest exist.
Segment reporting and fund accounting
Segment reporting information is presented on the basis of the Agency’s activities on both a Major Programme basis and a source of funding (Fund groups) basis.
A Fund is a self-balancing accounting entity established to account for the transactions of a specified purpose or objective. Funds are segregated for the purpose of conducting specific activities or attaining certain objectives in accordance with special regulations, restrictions or limitations. The financial statements are prepared on a Fund accounting basis, showing at the end of the period the consolidated position of all funds. Fund balances represent the accumulated residual of revenue and expenses.
Apportionment of common costs
Common costs incurred centrally by the Agency are apportioned to each of the Agency’s segments (i.e. each Major Programme) in a systematic and rational manner to ensure that: i) segment reporting is accurate (i.e. costs are shared by Major Programmes appropriately); ii) presentation of expenditures is made based on the nature of the expense; and iii) inter-segment transactions are eliminated from the consolidated financial statements.
Major Programmes
The Agency’s six Major Programmes form the structure for Regular Budget appropriations. The six Major Programmes are:
(1) Nuclear Power, Fuel Cycle and Nuclear Science – Major Programme 1 provides scientific and technical support, services and advice for reliable and safe operation of existing nuclear power plants, research reactors and other nuclear fuel cycle facilities; for the introduction and the expanded use of nuclear power and research reactor technology, including the development of the national nuclear infrastructure; for the development of advanced and innovative reactors and their fuel cycles, including through the International Project on Innovative Nuclear Reactors and Fuel Cycles (INPRO); in all areas of radioactive waste technology, decommissioning, spent fuel and radioactive waste management; for energy analysis and planning, including objective consideration of the role of nuclear power for sustainable development and climate change mitigation; for nuclear knowledge and nuclear information management, communication and stakeholders’ involvement; for the development of nuclear sciences, including in the areas of nuclear fusion, accelerator applications and nuclear instrumentation; and for the development and provision of validated nuclear, atomic and molecular data.
(2) Nuclear Techniques for Development and Environmental Protection – Major Programme 2 provides Member States with science based advice, education and training materials, standards and reference materials, and technical documents, building on a core foundation of adaptive and applied research and development. The overall objectives of this Major Programme continue to support the development and peaceful uses of nuclear sciences and applications.

GC(63)/6 Page 59
(3) Nuclear Safety and Security – Major Programme 3 establishes and continuously improves Agency nuclear safety standards and security guidance. The Agency provides for application of these standards and guidance to its own operations, and assists, upon request, Member States in implementing them in their own activities, including through the conduct of peer reviews and advisory services. It also participates in capacity building of various stakeholders in all safety and security related activities. The Agency promotes international instruments related to nuclear safety and security. This Major Programme also helps coordinate international preparedness for effectively responding to and mitigating the consequences of a nuclear and radiological emergency, and for supporting global efforts to improve nuclear security.
(4) Nuclear Verification – Major Programme 4 supports the Agency’s statutory mandate to establish and administer safeguards designed to ensure that special fissionable and other materials, services, equipment, facilities and information made available by the Agency, or at its request or under its supervision or control, are not used in such a way as to further any military purpose; and to apply safeguards, at the request of the parties, to any bilateral or multilateral arrangement, or at a request of a State to any of that State’s activities in the field of atomic energy. To this end, the Agency concludes safeguards agreements with States, which confer upon the Agency the legal obligation and authority to apply safeguards to nuclear material, facilities and other items subject to safeguards. Under this Major Programme, the Agency carries out verification activities, including the analysis of safeguards relevant information, installation of safeguards instrumentation, in-field inspections, and sample analysis required for implementing safeguards. These activities enable the Agency to draw soundly based safeguards conclusions. In addition, the Agency, in accordance with its Statute, assists with other verification tasks, including in connection with nuclear disarmament or arms control agreements as requested by States and approved by the Board of Governors.
(5) Policy, Management and Administration Services - Major Programme 5 provides provides leadership, direction and management support for all Agency activities and initiatives. It provides innovative solutions across a wide range of financial, human resources management, administrative, information technology, legal, oversight and general services to support all Agency programmes, emphasizing a service oriented culture of continuous improvement to meet the needs of all customers, including the Secretariat and Member States. It provides effective coordination to ensure a one-house approach, particularly with respect to overall directions and priorities; interactions with Member States; development and implementation of programmes; results based management, including performance assessment and risk management; gender mainstreaming; partnerships and resource mobilization. It continues to promote an organizational culture of integrity, accountability and transparency. It facilitates the efficient exchange of information within the Secretariat, as well as communications with Member States, the media and the general public.
(6) Management of Technical Cooperation for Development – Major Programme 6 encompasses the development, implementation and management of the technical cooperation projects in the framework of biennial Technical Cooperation Programme. The Technical Cooperation Programme consists of national, regional and interregional projects funded from the Technical Cooperation Fund (TCF) and extrabudgetary contributions.
For purposes of segmental disclosure, Major Programme 5 and Major Programme 6 are shown as a single segment – Policy, Management and Administration.

GC(63)/6 Page 60
Fund Groups
Agency activities across these six Major Programmes are financed through various funding sources, which are defined as Funds. The Funds are established on the basis of resolutions passed by the General Conference and are administered in accordance with the Financial Regulations adopted by the Board of Governors and Financial Rules issued by the Director General. Each Fund has differing parameters relating to how the revenue may be utilized. The grouping of Funds in the financial statements and their respective components are described below.
Regular Budget
(1) The Regular Budget Fund and Working Capital Fund (WCF) are the principal means of financing Agency activities and enable the Agency to meet obligations arising from authorized appropriations. The Regular Budget Fund is based on an annual Regular Budget approved by the General Conference and is financed from assessed contributions and miscellaneous income. The WCF, which serves to finance appropriations pending the receipt of assessed contributions, and for purposes which are determined from time to time by the Board of Governors with the approval of the General Conference, is financed from advances by Member States.
(2) The Major Capital Investment Fund (MCIF) is a Reserve Fund established as part of the Regular Budget to segregate such funds for future use. The MCIF is financed in part by the annual assessed contributions for the capital portion of the Regular Budget and in part through other sources, such as year-end savings from the operational portion of the Regular Budget appropriations.
Technical Cooperation
(3) The Technical Cooperation Fund is a component of the General Fund and is the main financing mechanism for the Agency’s technical cooperation activities. The Technical Cooperation Fund is primarily financed by voluntary contributions from Member States who are asked to pledge contributions against their indicative share of the Technical Cooperation Fund target, which is approved annually by the General Conference. The Technical Cooperation Fund is also funded by national participation costs and miscellaneous income.
(4) The Technical Cooperation Extrabudgetary Fund is a component of the General Fund and is a financing mechanism to enable donors to make voluntary contributions for activities in support of projects approved by the IAEA Board of Governors as nominated by the donor.
Extrabudgetary
(5) The Extrabudgetary Programme Fund is a component of the General Fund and is a financing mechanism to enable donors to make voluntary contributions for activities in support of programmes within the Regular Budget. The financial statements also present the Low Enriched Uranium Fuel Bank (LEU Bank), which is an activity under the Extrabudgetary Programme Fund, as a separate segment.
Other
(6) Trust Funds and Special Funds relate to funds for specific activities that have been approved by the IAEA Board of Governors.

GC(63)/6 Page 61
Budget comparison
The Agency’s budgetary and financial reporting bases differ. Budgets within the Agency are approved on a modified cash basis, while financial statements follow the full accrual basis and comply with the requirements of IPSAS.
While the Agency’s financial statements cover all activities of the Agency, budgets are separately approved annually for the Regular Budget, both the operational and the capital portion of the Regular Budget (classified according to Major Programme) and for the Technical Cooperation Fund (based on target for voluntary contributions). There are no approved budgets relating to the Technical Cooperation Extrabudgetary Fund, the Extrabudgetary Fund Group or the Other Fund Group. All Funds are administered in accordance with the Financial Regulations adopted by the Board of Governors, and Financial Rules issued by the Director General.
Statement V (Statement of Comparison of Budget and Actual Amounts) compares the final budgets for the Regular Budget Fund to actual amounts calculated on the same basis as the corresponding budgetary amounts. As the bases used to prepare the budget and financial statements differ, Note 39b provides reconciliation between the actual amounts presented in that note to the actual amounts presented in the Statement of Cash Flow.
NOTE 4: Cash and cash equivalents
(expressed in euro'000s)
31-12-2018 31-12-2017
Cash in current accounts at bank and on hand 243 370 285 378 Cash in call accounts 133 154 121 057 Term deposits with original maturities of 3 months or less 18 396 62 775
Total cash and cash equivalents 394 920 469 210
The decrease of €74.290 million (or 15.83%) in the total cash and cash equivalents was mainly driven by the increase in term deposits with original maturity between 3 months and 12 months. More euro funds were placed in medium-term time deposits to allow the Agency to obtain zero or positive interest rates.
Some cash is held in currencies which are legally restricted or not readily convertible to euro. At 31 December 2018, the euro equivalent of these currencies was €1.753 million (€4.050 million at 31 December 2017), based on the respective United Nations Operational Rates of Exchange.

GC(63)/6 Page 62
NOTE 5: Investments
(expressed in euro'000s)
31-12-2018 31-12-2017
Term deposits with original maturities between 3 and 12 months 303 886 167 136
Treasury bills with original maturities between 3 and 12 months - 27 619
Other discounted notes 22 942 38 414
Total investments 326 828 233 169
The increase of €93.659 million (or 40.17%) in investments is the result of the increase in investments in term deposits with original maturity between 3 and 12 months. This is mainly the result of investing more euro funds previously held in cash into time deposits at zero or positive rates. As shown in Note 41, the weighted average period to maturity of the Agency’s cash and investments at the end of 2018 increased for euro and for US dollar holdings but remained under 3 months.
NOTE 6: Accounts receivable from non-exchange transactions
(expressed in euro'000s)
31-12-2018 31-12-2017
Assessed contributions receivable
Regular Budget 44 761 40 254
Working Capital Fund
5
21 Allowance for doubtful accounts (9 398) (7 647)
Net assessed contributions receivable 35 368 32 628
Voluntary contributions receivable
Extrabudgetary 12 815 7 862
Technical cooperation Fund 1 494 1 066
Allowance for doubtful accounts (26) (25)
Net voluntary contributions receivable 14 283 8 903
Other receivables
Assessed programme costs
862
824
National participation costs
716
406
Safeguard agreements receivable
572
495
Allowance for doubtful accounts
(862)
(824)
Net other receivables 1 288 901
Total net accounts receivable from non-exchange transactions 50 939 42 432
Composition of accounts receivable from non-exchange transactions
Current 49 175 39 921
Non-current 1 764 2 511
Total net accounts receivable from non-exchange transactions 50 939 42 432

GC(63)/6 Page 63
The net assessed contributions receivable increased during the year by €2.740 million to €35.368 million. This was due to an increase in outstanding assessed contributions receivable primarily relating to the current year and offset by an increase in the allowance for doubtful accounts as a result of the further aging of certain assessed contributions in arrears. The increase in net voluntary contributions receivable during the year by €5.380 million, is primarily due to the decrease in the collection in 2018 of a number of significant contributions pledged and accepted in 2018. However, it should be noted that €2.646 million of the total voluntary contributions receivable is not due in 2018. The amount of extrabudgetary voluntary contributions receivable is shown net of €1.728 million which represents advance allotment. The details of outstanding contributions by Member States and other donors provided in Annex A3 include this advance allotment.
Non-current receivables comprise of the non-current portion of the voluntary extrabudgetary contributions which are due after 12 months.

GC(63)/6 Page 64
Ope
nin
g A
llow
ance
for
D
oubt
ful
Deb
t
Dou
btfu
l D
ebt
Exp
ense
D
uri
ng
the
Yea
r
Un
real
ized
F
orei
gn
Exc
han
ge
(Gai
n)/
Los
s
Am
oun
ts
Wri
tten
Off
as
U
nco
llec
tibl
e
Dou
btfu
l D
ebt
Exp
ense
R
ever
sed
Clo
sin
g A
llow
ance
for
D
oubt
ful
Deb
t
Ope
nin
g A
llow
ance
for
D
oubt
ful
Deb
t
Dou
btfu
l D
ebt
Exp
ense
D
uri
ng
the
Yea
r
Un
real
ized
F
orei
gn
Exc
han
ge
(Gai
n)/
Los
s
Am
oun
ts
Wri
tten
Off
as
U
nco
llec
tibl
e
Dou
btfu
l D
ebt
Exp
ense
R
ever
sed
Clo
sin
g A
llow
ance
for
D
oubt
ful
Deb
t
Rec
eiva
bles
fro
m n
on-
exch
ange
tra
nsa
ctio
ns
Ass
esse
d co
ntri
butio
ns
rece
ivab
le
Reg
ular
Bud
get
7 6
47
1 7
51
-
-
-
9
398
5
292
2
355
-
-
-
7 6
47
Rel
ated
to a
sses
sed
cont
ribu
tions
rec
eiva
ble
7 6
47
1 7
51
-
-
-
9
398
5
292
2
355
-
-
-
7 6
47
--
--
--
Vol
unta
ry c
ontr
ibut
ions
re
ceiv
able
Tec
hnic
al C
oop
erat
ion
Fun
d 2
5
-
1
-
-
26
28
-
(
3)
-
-
25
Ext
rabu
dget
ary
-
-
-
-
-
-
-
-
-
-
-
-
Rel
ated
to v
olun
tary
co
ntri
butio
ns r
ecei
vabl
e 2
5
-
1
-
-
26
28
-
(
3)
-
-
25
--
--
--
Oth
er r
ecei
vabl
es
Ass
esse
d p
rogr
amm
e co
sts
824
-
38
-
-
862
9
41
-
(
117
)
-
-
8
24
Nat
iona
l Par
tici
pat
ion
Cos
ts
-
-
-
-
-
-
-
-
-
-
-
-
Rel
ated
to o
ther
rec
eiva
bles
824
-
38
-
-
862
9
41
-
(
117
)
-
-
8
24
Tot
al r
elat
ed t
o re
ceiv
able
s fr
om n
on-e
xch
ange
tr
ansa
ctio
ns
8 4
96
1 7
51
39
-
-
10
286
6 2
61
2 3
55
( 1
20)
-
-
8 4
96
Allo
wan
ce f
or d
oubt
ful d
ebts
(exp
ress
ed i
n e
uro
'000
s)
2018
2017
NO
TE
7:
Non
-Exc
han
ge r
ecei
vab
le in
form
atio
n

GC(63)/6 Page 65
Car
ryin
g am
oun
t<
1 y
ear
1-3
year
s3-
5 ye
ars
> 5
yea
rsC
arry
ing
amou
nt
< 1
yea
r1-
3 ye
ars
3-5
year
s>
5 y
ears
Rec
eiva
bles
fro
m n
on-e
xch
ange
tr
ansa
ctio
ns
Ass
esse
d co
ntri
butio
ns r
ecei
vabl
e
Reg
ular
Bud
get
44
761
26
098
9 5
84
5 5
01
3 5
78
40
254
24
850
8 6
74
4 4
23
2 3
07
Wor
king
Cap
ital
Fun
d 5
-
-
-
5
21
16
3
-
2
Tot
al a
sses
sed
cont
ribu
tions
re
ceiv
able
44
766
26
098
9 5
84
5 5
01
3 5
83
40
275
24
866
8 6
77
4 4
23
2 3
09
Vol
unta
ry c
ontr
ibut
ions
rec
eiva
ble
Ext
rabu
dget
ary
12
815
10
136
2 6
53
8
18
7 8
62
3 8
48
3 9
81
33
-
Tec
hnic
al C
oop
erat
ion
Fun
d 1
494
1
019
4
27
8
40
1 0
66
812
2
07
8
39
Tot
al v
olun
tary
con
trib
utio
ns
rece
ivab
le 1
4 30
9 1
1 15
5 3
080
1
6 5
8 8
928
4
660
4
188
4
1 3
9
Oth
er r
ecei
vabl
es
Ass
esse
d p
rogr
amm
e co
sts
862
-
-
-
862
8
24
-
-
-
8
24
Nat
iona
l par
tici
pat
ion
cost
s 7
16
504
1
18
87
7
406
7
7 1
69
95
65
Safe
guar
ds a
gree
men
ts c
ontr
ibut
ions
572
5
72
-
-
-
4
95
495
-
-
-
Tot
al o
ther
rec
eiva
bles
2 1
50
1 0
76
118
8
7 8
69
1 7
25
572
1
69
95
889
Tot
al r
ecei
vabl
es f
rom
non
-ex
chan
ge t
ran
sact
ion
s 6
1 22
5 3
8 32
9 1
2 78
2 5
604
4
510
5
0 92
8 3
0 09
8 1
3 03
4 4
559
3
237
Agi
ng o
f re
ceiv
able
s(e
xpre
ssed
in
eu
ro'0
00s)
As
at 3
1 D
ecem
ber
2018
As
at 3
1 D
ecem
ber
2017
Ou
tsta
ndi
ng
for
Ou
tsta
ndi
ng
for

GC(63)/6 Page 66
Management of credit risk relating to non-exchange receivables
Assessed contributions comprise of the majority of the Agency’s receivables; they are due and payable within 30 days of receipt of the assessment letter or as of the first day of the financial year, whichever is later. As of 1 January the following year, the unpaid balance is considered one year in arrears. Under Article XIX.A of the Statute, a Member State loses its voting rights when its arrears equal or exceed the assessed amounts for the previous two years.
To facilitate the payment of arrears of assessed contributions, payment plans are available whereby arrears are consolidated and made payable in annual instalments over a period of up to 10 years. As long as the Member State with a payment plan pays the annual instalment of the arrears, the current year’s assessed contribution and any outstanding advances due to the WCF, voting rights may be reinstated by the General Conference. As at 31 December 2018, there are no receivables for which payment plans have been negotiated (€0.077 million as at 31 December 2017). In January 2019, a payment relating to prior years outstanding receivables was received for Regular Budget. This resulted in an adjustment of €0.641 million in the allowance for doubtful debts as described in Note 44.
The status of outstanding contributions as at 31 December 2018 by Member States and other donors is provided in Annex A3.
NOTE 8: Accounts receivable from exchange transactions
(expressed in euro'000s)
31-12-2018 31-12-2017
Accounts receivable – Value Added Tax refunds 2 769 2 689
Accounts receivable – income tax refunds 36 1 162
Accounts receivable – others 3 565 3 693
Allowance for doubtful accounts (173) (167)
Total net accounts receivable from exchange transactions
6 197 7 377
All accounts receivable from exchange transactions as at 31 December 2018 and 2017 are current. Value added tax receivables consist of amounts of value added tax paid by the Agency on its purchases of goods and services which the Agency can recover.
The allowance for doubtful debts showed the following movements during 2018 and 2017:
(expressed in euro'000s)
2018 2017
Opening balance as on 1 January 167 20
Doubtful debt expense during the year 61 147
Doubtful debt expense reversed (56) -
Closing balance as on 31 December 172 167

GC(63)/6 Page 67
The aging of the accounts receivable from exchange transactions was as follows:
(expressed in euro'000s)
31-12-2018 31-12-2017
Outstanding for:
Less than 1 year 5 779 6 061
1 - 3 years 318 1 450
3 - 5 years 265 34
More than 5 years - -
Gross carrying value 6 362 7 545
NOTE 9: Advances and prepayments
(expressed in euro'000s)
31-12-2018 31-12-2017
Vienna International Centre common services 15 376 16 152
Other international organizations 777 1 208
Staff 7 138 7 222
Travel 65 75
Other 9 407 4 666
Total advances and prepayments 32 763 29 323
Advances and prepayments composition
Current 25 135 21 294
Non-current 7 628 8 030
Total advances and prepayments 32 763 29 323
The advances for the VIC common services reflect the payments made by the Agency to the common services operated by other VBOs, in line with the cost sharing ratio for the Agency, which have not yet been utilized by them for providing the services.
Staff advances primarily consist of advances pending settlement towards education grant and income taxes.
Other advances relate to prepayments to suppliers. A prepayment made in connection with the construction of the Energy Centre in Seibersdorf amounting to €3.800 million is the main driver for the increase in prepayments to suppliers.

GC(63)/6 Page 68
NOTE 10: Inventory
(expressed in euro'000s)
31-12-2018 31-12-2017
Project inventories in-transit to counterparts 10 287 11 864
Safeguards spare parts and maintenance materials 338 412
Printing supplies 14 6
Total inventory 10 639 12 282
The Technical Cooperation Programme accounts for €9.976 million (97%) of the inventories in transit as at 31 December 2018, a 11% decrease from last year (€11.157 million (94%) in 2017). There was no donated inventory received in 2018. In consideration of the fact that inventories which have been in transit for some time may not actually be delivered or may suffer damage or obsolescence, their value is recognized net of an allowance of €1.339 million, out of which €0.667 million relates to goods which have been in transit for more than 12 months with 50% allowance and €0.672 million relates to those which have been in transit for more than 24 months with 100% allowance.
Reference materials are not regarded as inventory and the costs of their production are expensed in the same year. The amount of labour and allocated overheads incurred by the Agency’s laboratories with respect to reference materials during 2018 was approximately €0.134 million (€0.144 million in 2017).
Total inventory expense for 2018 and 2017 was as follows:
(expressed in euro'000s)
31-12-2018 31-12-2017
Project inventories distributed to development counterparts
38 992 30 403
Safeguards spare parts and maintenance materials 85 29
Printing supplies 49 51
Impairment of inventory - 8
Change in allowance for inventory in transit 511 633
Total inventory expense 39 637 31 124
Expense related to project inventories in-transit to counterparts is included in Transfers to development counterparts in the Statement of Financial Performance (refer to Note 31) and expenses related to printing supplies and Safeguards spare parts and maintenance materials is included in other operating expenses in the Statement of Financial Performance (refer to Note 35).
During 2018, the change in the allowance created for goods in-transit amounts to €0.511 million. There were no impairments recorded in 2018.

GC(63)/6 Page 69
NOTE 11: Investment in common services entities
(expressed in euro'000s)
31-12-2018 31-12-2017
Investment in Commissary 809 809
Total investment in common services entities 809 809
IAEA and UNIDO each made an initial investment of €0.809 million on 1 October 1979, which is to be returned in the event of dissolution of the VIC Commissary. Further details on the Commissary arrangement are provided in Note 37.

GC(63)/6 Page 70
2018
Bu
ildi
ngs
an
d L
ease
hol
d Im
prov
emen
tsF
urn
itu
re &
F
ixtu
res
Com
mu
nic
atio
ns
& I
nfo
rmat
ion
T
ech
nol
ogy
Equ
ipm
ent
Insp
ecti
on
Equ
ipm
ent
Lab
orat
ory
Equ
ipm
ent
Veh
icle
sO
ther
E
quip
men
tA
sset
s u
nde
r C
onst
ruct
ion
Tot
al P
rope
rty,
P
lan
t an
d E
quip
men
t
Cos
t at
1 J
anua
ry 2
018
364
669
4
209
3
7 83
9 8
2 34
3 4
8 70
8 1
420
3
546
2
1 48
0 5
64 2
14
Add
itio
ns a
1 3
45
214
3
842
2
008
3
754
2
74
76
17
315
28
828
Dis
pos
als
-
( 1
0)(
3 71
6)(
1 98
5)(
2 90
1)(
222
)(
144
)
-
(
8 97
8)
Oth
er A
djus
tmen
ts
-
-
(
107
) 3
2 4
60
36
( 4
21)
-
-
Ass
ets
unde
r C
onst
ruct
ion
Cap
ital
ized
1 3
59
-
2
2 6
01
624
-
6
3 (
4 64
9)
-
Cos
t at
31
Dec
embe
r 20
18 3
67 3
73
4 4
13
37
860
84
999
50
645
1 5
08
3 1
20
34
146
584
064
Acc
umul
ated
dep
reci
atio
n at
1 J
anua
ry 2
018
154
208
2
628
2
8 53
5 6
5 32
0 3
1 47
3 9
22
3 2
16
-
286
302
Dep
reci
atio
n 1
0 53
9 1
94
4 5
40
2 7
74
2 6
79
227
1
32
-
21
085
Dis
pos
als
-
( 1
0)(
3 71
3)(
1 98
6)(
2 80
3)(
210
)(
145
)
-
(
8 86
7)
Oth
er A
djus
tmen
ts
-
-
(
66)
( 1
88)
626
2
0 (
392
)
-
-
Acc
um
ula
ted
depr
ecia
tion
at
31 D
ecem
ber
2018
164
747
2
812
2
9 29
6 6
5 92
0 3
1 97
5 9
59
2 8
11
-
298
520
Acc
umul
ated
imp
airm
ent
at 1
Jan
uary
201
8 5
9
7 3
6
4
-
4
-
1
19
Imp
airm
ent
-
-
3
-
97
-
-
-
100
Dis
pos
als
-
-
( 3
)
-
(
97)
-
-
-
( 1
00)
Oth
er A
djus
tmen
ts b
-
-
( 1
)(
1)
( 2
)
-
(
4)
-
( 8
)
Acc
um
ula
ted
impa
irm
ent
at 3
1 D
ecem
ber
2018
5
97
2
5
2
-
-
-
111
Net
car
ryin
g am
oun
t at
31
Dec
embe
r 20
18 2
02 6
21
1 5
04
8 5
62
19
074
18
668
549
3
09
34
146
285
433
a Add
itio
ns u
nder
Lab
orat
ory
Equ
ipm
ent
and
Ass
ets
unde
r C
onst
ruct
ion
incl
ude
in-k
ind
dona
tion
s of
tw
o p
iece
s of
Lab
orat
ory
Equ
ipm
ent
amou
ntin
g to
EU
R 0
.289
mill
ion
and
EU
R 2
.8 m
illio
n, r
esp
ecti
vely
.b In
clud
es im
pai
rmen
t re
vers
als
(exp
ress
ed i
n e
uro
'000
s)
NO
TE
12:
Pro
per
ty, p
lan
t an
d e
qu
ipm
ent

GC(63)/6 Page 71
2017
Bu
ildi
ngs
an
d L
ease
hol
d Im
prov
emen
tsF
urn
itu
re &
F
ixtu
res
Com
mu
nic
atio
ns
& I
nfo
rmat
ion
T
ech
nol
ogy
Equ
ipm
ent
Insp
ecti
on
Equ
ipm
ent
Lab
orat
ory
Equ
ipm
ent
Veh
icle
sO
ther
E
quip
men
tA
sset
s u
nde
r C
onst
ruct
ion
Tot
al P
rope
rty,
P
lan
t an
d E
quip
men
t
Cos
t at
1 J
anua
ry 2
017
362
069
3
810
3
4 83
9 8
0 23
5 4
8 23
2 1
409
3
452
7
120
5
41 1
66
Add
itio
ns 2
600
4
13
4 1
26
1 7
74
2 0
49
119
4
2 1
8 13
7 2
9 26
0
Dis
pos
als
-
( 1
4)(
2 88
1)(
2 61
2)(
564
)(
108
)(
33)
-
(
6 21
2)
Oth
er A
djus
tmen
ts
-
-
8
7 8
81
( 1
009)
-
41
-
-
Ass
ets
unde
r C
onst
ruct
ion
Cap
ital
ized
-
-
1 6
68
2 0
65
-
-
44
( 3
777)
-
Cos
t at
31
Dec
embe
r201
7 3
64 6
69
4 2
09
37
839
82
343
48
708
1 4
20
3 5
46
21
480
564
214
Acc
umul
ated
dep
reci
atio
n at
1 J
anua
ry 2
017
143
730
2
464
2
6 79
9 6
4 89
6 3
0 30
5 8
11
3 0
46
-
2
72 0
51
Dep
reci
atio
n 1
0 47
8 1
78
4 5
59
2 7
07
2 1
32
198
1
81
-
2
0 43
3
Dis
pos
als
-
( 1
4)(
2 87
6)(
2 60
8)(
564
)(
87)
( 3
3)
-
(
6 18
2)
Oth
er A
djus
tmen
ts
-
-
5
3 3
25
( 4
00)
-
22
-
-
Acc
um
ula
ted
depr
ecia
tion
at
31 D
ecem
ber2
017
154
208
2
628
2
8 53
5 6
5 32
0 3
1 47
3 9
22
3 2
16
-
286
302
Acc
umul
ated
imp
airm
ent
at 1
Jan
uary
201
7 5
9
7 1
0 2
3 4
-
4
-
1
43
Imp
airm
ent
-
-
1
-
-
-
-
-
1
Dis
pos
als
-
-
( 4
)(
4)
-
-
-
-
( 8
)
Oth
er A
djus
tmen
ts*
-
-
( 4
)(
13)
-
-
-
-
( 1
7)
Acc
um
ula
ted
impa
irm
ent
at 3
1 D
ecem
ber2
017
5
97
3
6
4
-
4
-
119
Net
car
ryin
g am
oun
t at
31
Dec
embe
r 20
17 2
10 4
56
1 4
84
9 3
01
17
017
17
231
498
3
26
21
480
277
793
* in
clud
es im
pai
rmen
t re
vers
als
(exp
ress
ed i
n e
uro
'000
s)

GC(63)/6 Page 72
For the PP&E projects with a value greater than €0.500 million, their values and their completion status (complete or construction in progress (CIP)) on 31 December 2018 are as follows:
Completed in 2018
There was no PP&E project with a value greater than €0.500 million which completed this year.
Construction in progress
Renovation of the Nuclear Applications Laboratories (ReNuAL) – (€26.103 million CIP, and €1.442 million already placed in service) – ReNuAL is a €31 million capital project that is fully funded. The funding is made up of one third from the Agency’s Regular Budget and two thirds from extrabudgetary sources with the project being part of a programme of modernisation of the Agency’s Nuclear Applications Laboratories at Seibersdorf. The project consists of the construction and commissioning of the Insect Pest Control Laboratory (IPCL) and the Flexible Modular Laboratory (FML) as well as the upgrade to the overall site infrastructure to service these new buildings and the purchase of urgently needed new equipment. Major construction of the IPCL and the FML are complete, however the final fit-out of the IPCL followed by the commissioning is expected to occur in August 2019, while for FML, which started in October 2018, is due for completion in April 2020. Construction of the Dosimetry Bunker to support the new Linear Accelerator will be completed in April 2019. The portion already placed in service since 2016 relates to the transformer substation which is part of the main infrastructure required to service the new ReNuAL buildings (€18.044 million in 2017).
Japan Mixed Oxide Fuel Fabrication Plant (JMOX) (€0.869 million). This is a project to develop an integrated safeguards approach for a large mixed oxide fuel fabrication plant in Japan. The CIP asset consists of tubes filled with Helium-3 gas. No additional significant development activity took place on this project between 2013 and 2018 due to uncertainties about the deadline for construction and commissioning of the facility. A new date for the start of operation in 2022 was provided by Japan. However, some development, manufacturing, testing and installation of equipment and software are necessary in order to have all safeguards systems available for use in the facility (€0.869 million CIP since 2013).
Energy Centre (€1.518 million). The Energy Centre that will provide the exact environmental conditions needed for both the Insect Pest Control Laboratory (IPCL) and the Flexible Modular Laboratory (FML) is a €5.4 million capital project that is fully funded, 58% of which is from the ReNuAL project while the other 42% is from the Department of MT. This project is 28% completed as at 31 December 2018 (€0.219 million CIP in 2017).
In 2018, physical verification of assets in the VIC and Seibersdorf continued. Some of the items of Furniture and Fixtures, Laboratory Equipment, and Communications and IT Equipment which were impaired in 2015 were located during 2018, hence the respective impairments were reversed. However, those which remained unlocated are anticipated to be identified during the Physical Verification Exercise to be conducted by MTGS starting February 2019, with the introduction of Radio-Frequency Identification (RFID) tags that will replace the existing bar code labels. Impairments due to damage, obsolescence or loss which were recognized in 2018, amounted to €0.100 million (€0.002 million in 2017).
Efforts to dispose of old inactive equipment which were fully depreciated in 2017 continued, resulting in the retirement of assets with an aggregate original cost of €7.547 million this year. The gross value of fully depreciated items of property, plant and equipment which remain in use

GC(63)/6 Page 73
as of 31 December 2018, including components of the VIC building, amounted to €92.960 million (€96.323 million in 2017).
In-kind donation of laboratory equipment from two non-traditional donors consummated through partnership agreements in 2017 amounting to €3.089 million (see Note 24) were received in 2018, €2.800 million of which relates to a Linear Accelerator (LINAC) which is to be installed in 2019 following the completion of the Dosimetry Bunker.
NOTE 13: Intangible assets
2018
(expressed in euro '000s)
Computer Software
Purchased
Computer Software Internally Developed
Intangible Assets Under Development
Total Intangible
Assets Cost at 1 January 2018 12 991 71 186 14 722 98 899 Additions 1 384 3 032 6 722 11 138 Disposals (221) (2 303) (40) (2 564) Assets under Construction Capitalized 2 055 15 431 (17 486) - Cost at 31 December 2018 16 209 87 346 3 918 107 473 Accumulated amortization at 1 January 2018 7 708 24 002 - 31 710 Amortization 2 178 10 469 - 12 647 Disposal (221) (2 303) - (2 524) Accumulated amortization at 31 December 2018 9 665 32 168 - 41 833 Net carrying amount at 31 December 2018 6 544 55 178 3 918 65 640
2017
(expressed in euro '000s)
Computer Software
Purchased
Computer Software Internally Developed
Intangible Assets Under Development
Total Intangible
Assets Cost at 1 January 2017 10 560 49 362 19 148 79 070 Additions 1 800 1 737 16 344 19 881 Disposals - - (54) (54) Other Adjustments 283 (283) - - Assets under Construction Capitalized 347 20 370 (20 717) - Cost at 31 December 2017 12 990 71 186 14 721 98 897 Accumulated amortization at 1 January 2017 5 562 16 160 - 21 722 Amortization 1 948 8 038 - 9 986 Other Adjustments 197 (197) - - Accumulated amortization at 31 December 2017 7 707 24 001 - 31 708 Net carrying amount at 31 December 2017 5 283 47 185 14 721 67 189
Software developed under the MOSAIC programme represents the most material portion of the Agency’s Intangible assets. MOSAIC is a multi-phased project to upgrade and optimize the IT systems and infrastructure that support the activities of the Department of Safeguards. The aim of these systems is to improve the quality and efficiency of verification activities in the Department of Safeguards. The first phase, consisting of the transfer of mainframe applications, was completed

GC(63)/6 Page 74
during 2014-2015. Since 2015, the Agency has been further enhancing existing, and introducing new, tools and applications, to make the data and information more readily available and improve support to users. The MOSAIC programme was completed in 2018.
For projects with a value greater than €0.500 million, all part of the MOSAIC programme, their values and their completion status (complete, partly complete or construction in progress (CIP)) on 31 December 2018 are as follows:
Completed in 2018
Integrated Scheduler and Planner System (ISP) (€4.201 million). The objective of the Integrated Scheduler and Planner (ISP) application is to support the planning, scheduling and reporting of inspections and other verification activities, as well as any other type of activity performed by a Safeguards staff member with a travel component (e.g. meetings, training, etc.). It is intended to be the central collaboration system for Safeguard Divisions to plan, schedule, execute and close activities, providing an end-to-end view of the process (€3.424 million CIP in 2017).
State-Level Data Configurator (SLDC) (€1.183 million): The aim of the project is to fill the gap of missing IT support for the strategic long-term and annual planning of safeguards activities. The software tool created in the SLDC project will:
o facilitate a uniform State-level approach (SLA) across the different State-evaluation groups (SEGs) by establishing a central repository for SLA related structured data;
o address the needs of the SEGs for capturing the Annual Implementation Plans (AIP) and supporting the complex approval process, facilitate the update of the AIP and/or the adaptation of the SLA by aggregating all relevant anomalies and other state-level issues in SLDC and allow the management of follow-up actions; and
o allow an efficient on-going monitoring of the implementation status as well as the subsequent evaluation (€1.115 million CIP in 2017).
Safeguards Inspection Reporting and Evaluation (SAFIRE) (€4.135 million): The SAFIRE project will create an IT product that aims to boost operational efficiency in the planning, reporting and evaluation of verification activities. SAFIRE therefore directly supports all core processes under the Safeguards macro-process “Verification". In 2018, further enhancements were carried out to ensure improved usability of the SAFIRE user interface and allow the system to be integrated with other systems. (€2.321 million CIP in 2017).
Safeguards Information Resources through Integrated Unified Services (SIRIUS) (€2.985 million): The goal of the SIRIUS project is to develop a productive and user-friendly working environment in ISE (Integrated Safeguards Environment). It will merge the capabilities of Document Management and Workflow Support (DMWS), electronic State File (eSF), and Geo-Based Data Integration (GDI). In addition to the scope of the earlier projects, SIRIUS will deliver default home page (ISE Portal) with a consolidated list of tasks each user needs to perform in various applications, with an effective notification and tracking mechanisms and other features that would consolidate and make easier access to the information available in various MOSAIC applications (€2.129 million CIP in 2017).
OWL (€0.707 million): The Owl Project implements several improvements in the Department of Safeguards' computing environments that will enhance the security and business utility of the Department of Safeguards' information systems (€0.317 million CIP in 2017).
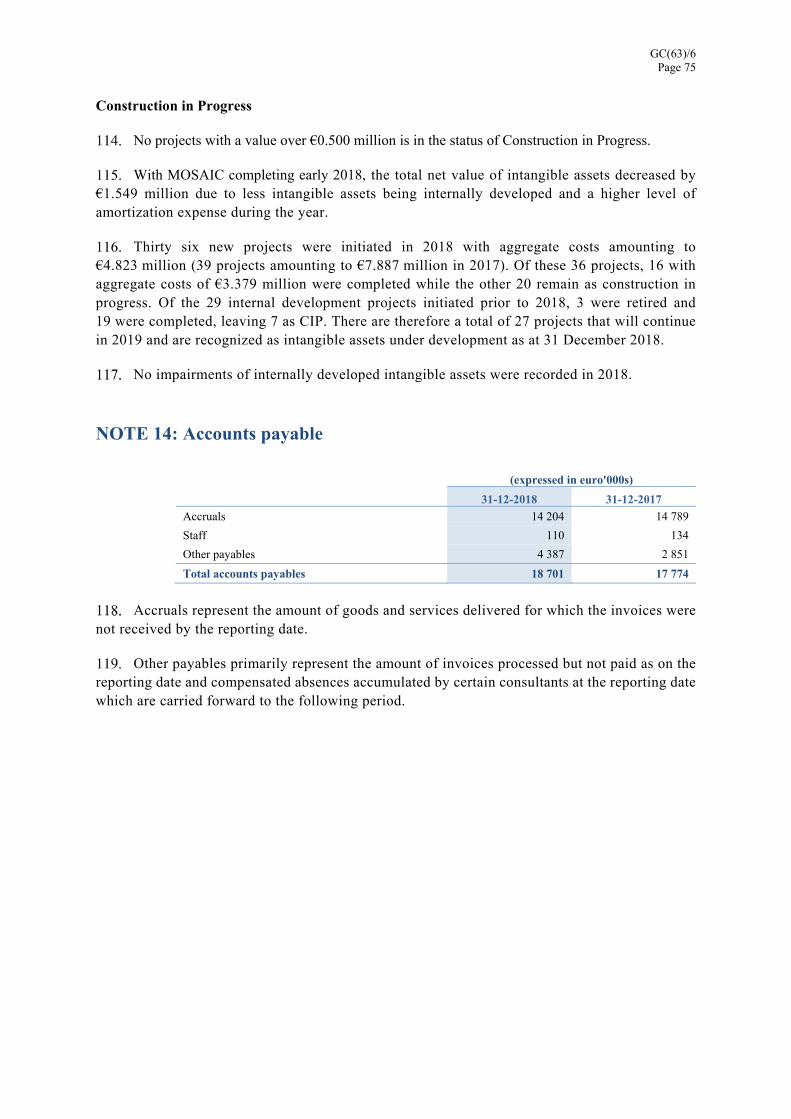
GC(63)/6 Page 75
Construction in Progress
No projects with a value over €0.500 million is in the status of Construction in Progress.
With MOSAIC completing early 2018, the total net value of intangible assets decreased by €1.549 million due to less intangible assets being internally developed and a higher level of amortization expense during the year.
Thirty six new projects were initiated in 2018 with aggregate costs amounting to €4.823 million (39 projects amounting to €7.887 million in 2017). Of these 36 projects, 16 with aggregate costs of €3.379 million were completed while the other 20 remain as construction in progress. Of the 29 internal development projects initiated prior to 2018, 3 were retired and 19 were completed, leaving 7 as CIP. There are therefore a total of 27 projects that will continue in 2019 and are recognized as intangible assets under development as at 31 December 2018.
No impairments of internally developed intangible assets were recorded in 2018.
NOTE 14: Accounts payable
(expressed in euro'000s)
31-12-2018 31-12-2017
Accruals 14 204 14 789
Staff 110 134
Other payables 4 387 2 851
Total accounts payables 18 701 17 774
Accruals represent the amount of goods and services delivered for which the invoices were not received by the reporting date.
Other payables primarily represent the amount of invoices processed but not paid as on the reporting date and compensated absences accumulated by certain consultants at the reporting date which are carried forward to the following period.

GC(63)/6 Page 76
NOTE 15: Deferred revenue
(expressed in euro'000s)
31-12-2018 31-12-2017
Contributions received in advance 90 856 89 762
Extrabudgetary contributions transferred subject to conditions 43 115 45 832
Other
307
215 Premises deferred 133 080 139 672
Total deferred revenue 267 358 275 481
Deferred revenue composition
Current 129 161 113 600
Non-current 138 197 161 881
Total deferred revenue 267 358 275 481
Deferred revenue pertaining to the use of the VIC buildings recognizes that the Austrian Government leased to the Agency the original buildings for a nominal rental and contributed 50% of the cost of leasehold improvements. In return, the Agency has an obligation to maintain its headquarters seat in Vienna and to occupy the VIC until 2078 or return it to the Government. This obligation is fulfilled by occupation of the VIC over the remaining term of the lease and the deferred revenue is recognized annually in the Statement of Financial Performance. Further details may be found in Note 37.
Contributions received in advance primarily include Regular Budget assessed contributions received prior to the year to which they relate, as well as funds received for extrabudgetary contributions from Member States that have not been formally accepted by the Agency. Contributions received in advance increased in 2018 by €1.094 million.
At the end of 2018, contributions received subject to conditions decreased by €2.717 million. Out of the total balance of contributions received subject to conditions, 70.2% was received from one non-Member State donor. These contributions will be recognized as revenue, as and when the conditions are satisfied. The portion of these voluntary contributions that are expected to be reclassified as revenue in the next twelve months, totaling €30.7 million, have been classified as current. Final and progress reports for these contributions are expected to be submitted during 2019, and the respective revenue recognition will be based on the approval of such reports by the donor.
A detail of contributions received in advance and extrabudgetary contributions transferred subject to conditions as of 31 December 2018 is provided in Annex A4.

GC(63)/6 Page 77
NOTE 16: Employee benefit liabilities
(expressed in euro'000s)
31-12-2018 31-12-2017
After-Service Health Insurance 222 121 213 413 Post-employment repatriation and separation entitlements
54 649 51 989
Annual leave 26 041 25 035 Health Insurance Premium reserve account - staff contributions
983 816
Other staff costs 1 852 1 942
Total staff related liabilities 305 646 293 195
Composition of employee benefit liabilities
Current 16 220 15 561
Non-current 289 426 277 634
Total employee benefit liabilities 305 646 293 195
Liabilities for After-Service Health Insurance (ASHI) and post-employment repatriation and separation entitlements have been recognized on the basis of actuarial valuation. These liabilities have increased during the year, primarily due to changes in the actuarial assumptions (more details are provided in Note 17).
Liabilities for annual leave have been calculated based upon the actual number of unused leave days as at year end.
The staff contributions towards the Health Insurance Premium reserve account represent the employee’s share of the funds held related to health insurance premiums. The reserve increased by €0.167 million during 2018 (€0.496 million increase in 2017), due to a decrease in premiums by the insurance company.
Liabilities for other staff costs as at 31 December 2018 consisted mainly of home leave accruals amounting to €1.049 million (€1.104 million as on 31 December 2017) and accruals for compensatory time-off amounting to €0.680 million (€0.714 million as on 31 December 2017).
As at 31 December 2018, the ASHI and post-employment repatriation benefit obligations, as well as the annual leave liability, were entirely unfunded. Nearly all of these liabilities, which total €302.811 million at 31 December 2018 relate to the Regular Budget Fund. The unfunded status of these liabilities negatively impacts this Fund such that the total equity is negative as at 31 December 2018.
NOTE 17: Post-employment related plans
Post-employment related benefits include ASHI and post-employment repatriation and separation benefits.
The Agency operates the ASHI scheme, which is a defined employee benefit plan. Under the scheme and in accordance with the Staff Regulations and Rules, eligible former staff members of the Agency are eligible to obtain medical insurance through the Agency.

GC(63)/6 Page 78
Other post-employment entitlements are those that staff members of the Agency are eligible to receive on separation from service with the Agency. These include a repatriation grant and the related travel and removal costs on separation from the Agency, as well as an end-of-service allowance that certain general service staff members are entitled to, and which are based on length of service.
Actuarial valuations
Liabilities arising from ASHI, and repatriation and separation benefits are determined with assistance from professional actuaries.
The following assumptions and methods have been used to determine the value of post-employment and other separation-related employee benefit liabilities for the Agency as at 31 December 2018:
Parameter 31-Dec-18 31-Dec-17
Discount rate ASHI: 2.07%
ASHI: 1.74%
Other post-employment entitlements: repatriation entitlements 1.17%; End of Service allowance 1.46%
Other post-employment entitlements: repatriation entitlements 0.98%; End of Service allowance 1.28%
Market yields on high quality euro corporate bonds at the reporting date (estimated duration: ASHI: 21 years; Other post-employment entitlements: 6 to 9 years depending on entitlement)
Market yields on high quality euro corporate bonds at the reporting date (estimated duration: ASHI: 21 years; Other post-employment entitlements: 6 to 9 years depending on entitlement)
Expected rate of salary increase
Professional and Higher Staff Professional and Higher Staff
2.70 % for ASHI, 2.93% for other post-employment
1.66% for first four years (ASHI only) 2.63 %
General Staff General Staff
2.88% 2.92%
Expected rate of medical cost increase
2.88% – 3.02% (range for the various insurance plans)
2.92% – 3.03% (range for the various insurance plans)
Expected rate of travel costs increase
1.80% 1.80%
Expected rate of shipping cost increase
1.80% 1.80%
The following tables provide additional information and analysis on the employee benefit liabilities calculated by the actuary.

GC(63)/6 Page 79
(expressed in euro '000s)
ASHI 31-12-2018 31-12-2017
Movement in defined benefit obligation
Opening defined benefit obligation 213 414 165 422
Expense for the period
Current service cost 8 155 7 529
Interest cost 3 677 2 978
Benefits paid (3 980) (3 642)
Transfers in/out
(171) 99
Actuarial losses/(gains) recognized in net assets
Actuarial (Gain)/Loss due to Experience Adjustments
(451) 36 226
Actuarial (Gain)/Loss due to Demographic Assumption Changes 19 202 7 382
Actuarial (Gain)/Loss due to Financial Assumption Changes (17 725) (2 581)
Closing defined benefit obligation 222 121 213 414
(expressed in euro '000s)
Other Post-employment benefits 31-12-2018 31-12-2017
Movement in defined benefit obligation
Opening defined benefit obligation 51 989 55 991
Expense for the period
Current service cost 6 054 6 886
Interest cost 544 663
Past service cost
Benefits paid (4 760) (6 274)
Transfers in/out
(26) (1)
Actuarial losses/(gains) recognized in net assets
Actuarial (Gain)/Loss due to Experience Adjustments 1 277 (4 265)
Actuarial (Gain)/Loss due to Demographic Assumption Changes
- 1 025
Actuarial (Gain)/Loss due to Financial Assumption Changes
(429) (2 037)
Closing defined benefit obligation 54 649 51 989
of which
Repatriation entitlements 28 885 26 792
End of Service Allowance 25 764 25 196
54 649 51 989
Within the ASHI liability closing defined benefit obligation, €106.041 million represents the liability towards former staff members and their dependents (€97.539 million in 2017) and €116.080 million represents the accrual towards active staff and their dependents (€115.875 million in 2017).
Actuarial gains or losses arise when the actuarial assessment differs from the long-term expectations on the obligations. They result from experience adjustments (differences between the previous actuarial assumptions and what has actually occurred) and the effects of change in actuarial assumptions.

GC(63)/6 Page 80
Changes in financial assumptions, primarily the increase in the long-term discount rate resulted in an actuarial gain of €17.725 million for ASHI. However, this gain was offset by the introduction of age grading in determining medical trend rates in line with best practices, which resulted in an actuarial loss in 2018 of €19.202 million.
As at 31 December 2018, the ASHI and post-employment repatriation benefit obligations were entirely unfunded. Therefore, the present value of funded obligations and the fair value of plan assets are nil.
Sensitivity analysis
If the assumptions described above were to change, the estimated impact on the measurement of defined benefit obligations and current service and interest cost would be as per the table below:
(expressed in euro '000s)
Impact of change in assumptions Change After Service Health Insurance
Other post-employment
benefits
Effect of discount rate change on defined benefit obligation
+1% (39 764) (3 508)
-1% 53 428 4 001
Effect of salary increase rate change on defined benefit obligation
+1% (3 670) 3 595
-1% 4 794 (3 201)
Effect of turnover rate change on defined benefit obligation
+1% (4 296) 130
-1% 4 733 (145)
Effect of changes in full retirement age on defined benefit obligation
+1% (1 622) (399)
-1% 1 258 383
Full retirement at 65
(4 253) (929)
Effect of change in expected rate of medical costs increase on:
*current service cost component of liability +1% 2 903 n/a
-1% (2 059) n/a
*interest cost component of liability +1% 859 n/a
-1% (654) n/a
* total defined benefit obligation +1% 50 968 n/a
-1% (38 902) n/a
Effect of changes in life expectancy on defined benefit obligation
+1% 7 382 n/a
-1% (5 896) n/a
Effect of changes in shipping and travel costs on total defined benefit obligation
+1% n/a 417
-1% n/a (382)
The above sensitivity analyses are based on a change in one assumption while holding all other assumptions constant. In practice, this is unlikely to occur as changes in some of the assumptions may be correlated.
When calculating the sensitivity of the DBO to significant assumptions, the same method has been applied as when calculating the pension liability recognized in the statement of financial position. There have been no changes from the previous period in the methods or assumption adjustments used in preparing the sensitivity analyses.

GC(63)/6 Page 81
The sensitivity on life expectancy is calculated by adjusting the underlying mortality rates such that the life expectancy for a pensioner age 65 at the date of the valuation would increase (or decrease) by one year.
The Agency’s best estimate of benefits payments expected to be made for the next 12 months for ASHI plans is €4.205 million, and for post-employment repatriation and separation entitlements is €6.345 million.
The post-employment benefit liabilities represent a material unfunded liability of the Agency. Consistent with many other UN Organizations, the Agency is in the process of examining the possible approaches for addressing these long-term unfunded liabilities; however, no approach has yet been formalized.
The following tables provide the details of the defined benefit obligation and the experience adjustments for the current period and previous four periods.
After service health insurance (expressed in euro'000s)
2018 2017 2016 2015 2014
Defined benefit obligation 222 121 213 413 165 422 175 551 185 988
Plan assets at fair value - - - - -
Surplus/(deficit) (222 121) (213 413) (165 422) (175 551) (185 988) Remeasurement losses/(gains) due to experience adjustments
(451) 36 226
(28 585)
6 015
(2 837)
Remeasurement due to experience adjustments as a percentage of defined benefit obligation
(0.2 %) 16.97% (17.28%) 3.43% (1.53%)
Other post-employment benefits (expressed in euro'000s)
2018 2017 2016 2015 2014
Defined benefit obligation 54 649 51 989 55 991 50 390 48 856
Plan assets at fair value - - - - -
Surplus/(deficit) (54 649) (51 989) (55 991) (50 390) (48 856) Remeasurement losses/(gains) due to experience adjustments
1 277 (4 265)
3 600
2 209
269
Remeasurement due to experience adjustments as a percentage of defined benefit obligation
2% (8.2 %) 6.43% 4.38% 0.55%
United Nations Joint Staff Pension Fund
The Fund’s Regulations state that the Pension Board shall have an actuarial valuation made of the Fund at least once every three years by the Consulting Actuary. The practice of the Pension Board has been to carry out an actuarial valuation every two years using the Open Group Aggregate Method. The primary purpose of the actuarial valuation is to determine whether the current and estimated future assets of the Pension Fund will be sufficient to meet its liabilities.
The Agency’s financial obligation to the UNJSPF consists of its mandated contribution, at the rate established by the United Nations General Assembly (currently at 7.9% for participants and 15.8% for member organizations) together with any share of any actuarial deficiency payments under Article 26 of the Regulations of the Pension Fund. Such deficiency payments are only payable if and when the United Nations General Assembly has invoked the provision of

GC(63)/6 Page 82
Article 26, following determination that there is a requirement for deficiency payments based on an assessment of the actuarial sufficiency of the Fund as of the valuation date. Each member organization shall contribute to this deficiency an amount proportionate to the total contributions which each paid during the three years preceding the valuation date.
During 2017, the Fund identified that there were anomalies in the census data utilized in the actuarial valuation performed as of 31 December 2015. As such, as an exception to the normal biennial cycle, a roll forward of the participation data as of 31 December 2013 to 31 December 2016 was used by the Fund for their 2016 financial statements.
The actuarial valuation as of 31 December 2017 resulted in a funded ratio of actuarial assets to actuarial liabilities, assuming no future pension adjustments, of 139.2% (150.1% in the 2016 roll forward). The funded ratio was 102.7% (101.4% in the 2016 roll forward) when the current system of pension adjustments was taken into account.
After assessing the actuarial sufficiency of the Fund, the Consulting Actuary concluded that there was no requirement, as of 31 December 2017, for deficiency payments under Article 26 of the Regulations of the Fund as the actuarial value of assets exceeded the actuarial value of all accrued liabilities under the Fund. In addition, the market value of assets also exceeded the actuarial value of all accrued liabilities as of the valuation date. At the time of this report, the General Assembly has not invoked the provision of Article 26.
Should Article 26 be invoked due to an actuarial deficiency, either during the ongoing operation or due to the termination of the UNJSPF pension plan, deficiency payments required from each member organization would be based upon the proportion of that member organization’s contributions to the total contributions paid to the Fund during the three years preceding the valuation date. Total contributions paid to the UNJSPF during the preceding three years (2015, 2016 and 2017) amounted to USD 204.4 million, of which 66.32% was contributed by the Agency.
During 2018, contributions paid to UNJSPF amounted to €61.929 million (€63.032 million in 2017). Expected contributions due in 2019 are approximately €63.944 million.
Membership of the Fund may be terminated by decision of the United Nations General Assembly, upon the affirmative recommendation of the Pension Board. A proportionate share of the total assets of the Fund at the date of termination shall be paid to the former member organization for the exclusive benefit of its staff who were participants in the Fund at that date, pursuant to an arrangement mutually agreed between the organization and the Fund. The amount is determined by the United Nations Joint Staff Pension Board based on an actuarial valuation of the assets and liabilities of the Fund on the date of termination; no part of the assets which are in excess of the liabilities are included in the amount.
The United Nations Board of Auditors carries out an annual audit of the UNJSPF and reports to the UNJSPF Pension Board on the audit every year. The UNJSPF publishes quarterly reports on its investments and these can be viewed by visiting the UNJSPF at www.unjspf.org.

GC(63)/6 Page 83
NOTE 18: Other financial liabilities
(expressed in euro'000s)
31-12-2018 31-12-2017
Deposits received 304 304
Others 168 50
Total financial liabilities 472 354
Composition of financial liabilities
Current 168 50
Non-current 304 304
Total financial liabilities 472 354
As at 31 December 2018, ‘Others’ consisted primarily of cash received for which the purpose has not yet been identified.
NOTE 19: Provisions
(expressed in euro'000s)
31-12-2018 31-12-2017
Provision for ILOAT cases 169 78
Provision for asset disposal and site restoration 1 218 2 612
Total provisions 1 387 2 690
Composition of provisions
Current 169 1 472
Non-current 1 218 1 218
Total provisions 1 387 2 690
Provisions for asset disposal relate to the estimated costs for disposal of laboratory glove boxes in the new Nuclear Material Laboratory (NML) in Seibersdorf at the end of the useful life of the glove boxes (€1.218 million). A portion of the provision accrued as at 31 December 2017 amounting to €1.394 million has been utilized in 2018 and pertains to the works carried out for the decommissioning of the Safeguards Analytical Laboratory (SAL), enabling the handover of the building to its owner for demolition.
As at 31 December 2018, there were appeal cases against the Agency with the International Labour Organization Administrative Tribunal (ILOAT) relating to claims of current or former staff members, for which a provision has been recorded amounting to €0.169 million. The provision includes cases which were decided by the ILOAT in February 2019 with a resulting liability of approximately €0.119 million to the Agency. The provision also includes other cases which are still under consideration by the ILOAT, and it is deemed probable that they will be decided in favour of current or former staff members.
The WCF was established in accordance with the Financial Regulations to be used for advances to the Regular Budget Fund to temporarily finance appropriations and for other purposes authorized by the General Conference. The WCF level is approved by the General Conference and
GC(63)/6 Page 84
funded by Member State advances made in accordance with their respective base rates of assessment as determined by the General Conference. Each advance is carried to the credit of the respective Member State.
The Nuclear Security Fund (NSF) was established in accordance with the Financial Regulations to fund a range of activities with the objective of supporting the capacity of Member States to protect nuclear facilities, and nuclear material in use, storage or transport, against nuclear terrorism (GOV/2002/10).
The Programme Support Cost Sub-fund was established in 2009 under the Extrabudgetary Programme Fund to record all income and expenditures related to programme support costs in accordance with Financial Regulation 8.03.
The Research Institute Trust Fund was established in accordance with the Financial Regulations to enable multi-year funding availability for the purchase of equipment and supplies necessary for the Agency’s research contract programme (GOV/2403).
The Equipment Replacement Fund was established as approved by the Board of Governors (GOV/2005/22) to upgrade or replace the ICT infrastructure so that an appropriate level of ICT services can be delivered to support the Agency’s programmes.

GC(63)/6 Page 85
NO
TE
20:
Mov
emen
ts in
fu
nd
bal
ance
s
2018
2017
2018
2017
2018
2017
2018
2017
2018
2017
2018
2017
2018
2017
2018
2017
Ope
nin
g B
alan
ce 2
3 66
7 1
5 78
8 1
9 53
5 1
3 86
0 7
7 82
3 7
5 96
1 3
6 69
8 3
2 24
2 2
50 3
84 2
63 3
74 9
5 35
2 1
09 8
95 1
480
1 5
77 5
04 9
39 5
12 6
97
Tra
nsfe
rs t
o / (
from
) fu
nd b
alan
ces
21
793
19
727
( 7
414)
116
8 9
84(
9 23
4) 2
212
( 6
55)
( 11
971
)(
27 6
12)
( 22
887
) 3
67(
37)
18
( 9
320)
( 17
273
)
Net
sur
plu
s/ (
defi
cit)
( 16
442
)(
11 8
48)
4 7
66 5
559
2 0
01 1
1 09
6 6
699
5 1
11 3
1 74
9 1
4 62
2 4
960
( 14
910
)(
239
)(
115
) 3
3 49
4 9
515
Clo
sin
g ba
lan
ce29
018
2
3 66
716
887
1
9 53
588
808
7
7 82
345
609
3
6 69
827
0 16
2 2
50 3
8477
425
9
5 35
21
204
1 4
8052
9 11
3 5
04 9
39
Incl
ude
d in
fu
nd
bala
nce
s ar
e in
divi
dual
fu
nds
wit
h
spec
ific
pu
rpos
es:
Wor
king
Cap
ital
Fun
d 1
5 20
1 1
5 19
4-
-
-
-
-
-
-
-
-
-
-
-
1
5 20
1 1
5 19
4
Nuc
lear
Sec
urit
y F
und
-
-
-
-
-
-
-
-
81
405
67
696
-
-
-
-
81
405
67
696
Pro
gram
me
Sup
por
t C
ost
Sub-
fund
-
-
-
-
-
-
-
-
4 7
21 6
484
-
-
-
-
4 7
21 6
484
Res
earc
h In
stit
ute
Tru
st F
und
-
-
-
-
-
-
-
-
-
-
-
-
433
654
433
654
Equ
ipm
ent
Rep
lace
men
t F
und
-
-
-
-
-
-
-
-
-
-
-
-
771
827
771
827
(exp
ress
ed i
n e
uro
'000
s)
Reg
ula
r B
udg
et
Fu
nd
and
Wor
kin
g C
apit
al F
un
d
Maj
or C
apit
al
Inve
stm
ent
Fu
nd
Tec
hn
ical
C
oope
rati
on F
un
d
Tec
hn
ical
C
oope
rati
on
Ext
rabu
dget
ary
Pro
gram
me
Fu
nd
Ext
rabu
dget
ary
Pro
gram
me
Fu
nd
Low
En
rich
ed
Ura
niu
m B
ank
Tru
st F
un
ds, R
eser
ve
Fu
nds
an
d S
peci
al
Fu
nds
T
otal

GC(63)/6 Page 86
NO
TE
21:
Mov
emen
t in
fu
nd
bal
ance
s of
ind
ivid
ual
fu
nd
s w
ith
sp
ecif
ic p
urp
oses
Ope
nin
g B
alan
ce
Rev
enu
e a/
Tra
nsf
ers
to/(
from
)E
xpen
seN
et g
ain
s/
(los
ses)
Clo
sin
g B
alan
ceO
pen
ing
Bal
ance
Rev
enu
e a/
Tra
nsf
ers
to/(
from
) E
xpen
seN
et g
ain
s/
(los
ses)
Clo
sin
g B
alan
ce
Wor
king
Cap
ital
Fun
d 1
5 19
4-
-
-
7
15
201
15
215
-
( 4
)-
(
17)
15
194
Nuc
lear
Sec
urit
y F
und
67
696
33
481
4 9
99(
26 6
62)
1 8
91 8
1 40
5 7
0 16
6 2
9 07
1(
4 47
1)(
24 5
55)
( 2
515)
67
696
Pro
gram
me
Sup
por
t C
ost
Sub-
Fun
d 6
484
6 1
77(
142
)(
7 71
3)(
85)
4 7
21 7
573
6 6
21(
1 07
0)(
6 90
0) 2
60 6
484
Res
earc
h In
stit
ute
Tru
st F
und
654
-
( 3
3)(
227
) 3
9 4
33 7
99-
1
3(
37)
( 1
21)
654
Equ
ipm
ent
Rep
lace
men
t F
und
827
-
( 6
)(
8)
( 4
2) 7
71 7
83-
3
( 8
8) 1
29 8
27
(exp
ress
ed i
n e
uro
'000
s)
2018
2017
a/ R
even
ue in
clud
es c
ontr
ibut
ions
, int
eres
t, e
tc.

GC(63)/6 Page 87
2018
2017
2018
2017
2018
2017
2018
2017
2 01
8
20
172
018
2017
2 01
8
2017
2018
2017
Ope
nin
g ba
lan
ce(
31 1
91)
9 1
30 7
179
3 3
34 3
2 51
4 2
3 71
6 6
219
5 6
0829
990
2
2 17
543
2
800
9
24
45
152
64
787
Tra
nsfe
rs t
o/(f
rom
) (
2 44
1)(
40 3
21)
( 1
470)
3 8
45(
9 18
5) 8
798
( 2
376)
611
(1 1
06)
7
815
22 8
88
( 3
68)
29
( 1
5) 6
339
( 19
635
)C
losi
ng
bala
nce
( 33
632
)(
31 1
91)
5 7
09
7 1
79
23
329
32
514
3 8
43
6 2
19
28
884
29
990
23
320
432
3
8 9
5
1 49
1 4
5 15
2
Mov
emen
ts i
n r
eser
ves
com
pris
e:
Hea
lth
in
sura
nce
pre
miu
m r
eser
ve o
pen
ing
bala
nce
864
432
-
-
-
-
-
-
8
64 4
32
Tra
nsfe
rs t
o/(f
rom
) 1
28 4
32-
-
-
-
-
-
128
432
Hea
lth
In
sura
nce
pre
miu
m r
eser
ve c
losi
ng
bala
nce
992
864
-
-
-
-
-
-
9
92 8
64
Com
mit
men
ts o
pen
ing
bala
nce
25
441
23
642
7 2
47 3
406
32
513
23
716
6 2
28 5
618
30 2
99
22
807
437
8
049
2
4 1
02 1
74 8
0 01
7T
rans
fers
to/
(fro
m)
( 4
363)
1 7
99(
1 46
8) 3
841
( 9
185)
8 7
97(
2 37
6) 6
10(1
077
)
7 4
9222
888
(
367
)29
(
15)
4 4
48 2
2 15
7C
omm
itm
ents
clo
sin
g ba
lan
ce 2
1 07
8 2
5 44
1 5
779
7 2
47 2
3 32
8 3
2 51
3 3
852
6 2
2829
222
3
0 29
923
325
4
3738
9
106
622
102
174
Cas
h s
urp
lus/
(def
icit
) re
serv
e op
enin
g ba
lan
ce 4
9 6
5-
-
-
-
-
-
49
65
Tra
nsfe
rs t
o/(f
rom
) 1
6-
-
-
-
-
-
-
16
Cre
dit
to M
embe
r St
ates
( 4
)(
16)
-
-
-
-
-
-
(
4)
( 1
6)C
ash
su
rplu
s/(d
efic
it)
rese
rve
clos
ing
bala
nce
61
49
-
-
-
-
-
-
6
1 4
9 P
ost
empl
oym
ent
rela
ted
plan
s re
valu
atio
n r
eser
ve
open
ing
bala
nce
(
57 5
45)
( 21
467
)(
69)
( 7
2)-
(
9)
( 1
0)(3
09)
( 6
32)
(4)
(
4)
-
(
57 9
36)
( 22
185
)
Act
uari
al g
ains
/(lo
sses
) re
cogn
ized
thr
ough
equ
ity
( 1
843)
( 36
078
)(
2)
3-
-
1(2
9)
323
-
-
(
1 87
4)(
35 7
51)
Res
erve
for
act
uar
ial
gain
s/lo
sses
on
em
ploy
ee
ben
efit
lia
bili
ties
clo
sin
g ba
lan
ce(
59 3
88)
( 57
545
)(
71)
( 6
9)-
(
9)
( 9
)(3
38)
( 3
09)
(4)
(
4)
-
(
59 8
10)
( 57
936
)
Res
erve
for
car
ry-o
ver
of u
nob
liga
ted
appr
opri
atio
ns
open
ing
bala
nce
-
6 4
58-
-
-
-
-
-
-
6 4
58
Tra
nsfe
rs t
o/(f
rom
) 3
624
( 6
458)
-
-
-
-
-
-
3
624
( 6
458)
Res
erve
for
car
ry-o
ver
of u
nob
liga
ted
appr
opri
atio
ns
clos
ing
bala
nce
3 6
25-
-
-
-
-
-
-
3 6
25-
(exp
ress
ed i
n e
uro
'000
s)
Reg
ula
r B
udg
et F
un
d an
d W
ork
ing
Cap
ital
F
un
d M
ajor
Cap
ital
In
vest
men
t F
un
d T
ech
nic
al
Coo
pera
tion
Fu
nd
Tec
hn
ical
C
oope
rati
on
Ext
rabu
dget
ary
Fu
nd
Ext
rabu
dget
ary
Pro
gram
me
Fu
nd
Low
En
rich
ed
Ura
niu
m B
ank
T
rust
Fu
nds
an
d S
peci
al F
un
ds
Tot
al
NO
TE
22:
Mov
emen
ts in
res
erve
s b
y fu
nd
gro
up

GC(63)/6 Page 88
The reserves increased by €6.339 million in 2018 primarily due an increase in the committed funds for open contracts for goods and services as well as the transfer to the reserve for carry-over of unobligated appropriations from fund balances which was partially offset by an increase in actuarial loss on post-employment employee benefit liabilities.
The health insurance premium reserve represents the Agency’s share of the funds related to health insurance premiums. The reserve increased by €0.128 million during 2018 (€0.432 million increase in 2017).
Commitments represent committed funds for open contracts for goods and services which have not been received by the Agency. During 2018, such future commitments increased by €4.448 million (€22.157 million increase in 2017). This increase is shown as a transfer from Fund balances to the reserves.
The cash surplus reserve opening balances represent the accumulated cash surplus for prior years amounting to €0.049 million. During 2018, €0.004 million was surrendered to Member States for their share of the cash surplus withheld from prior years.
The liabilities arising from post-employment benefits and other long-term employee benefits are determined by independent actuaries. The reserve for actuarial gains/(losses) on employee benefit liabilities represents the balance of actuarial gains or losses relating to the ASHI and post-employment repatriation and separation benefit obligations. During 2018, a total of €1.874 million actuarial loss (€35.751 million on actuarial loss in 2017) was recorded (refer to Note 17). This actuarial loss is mainly due to a change in the actuary assumptions relating to the introduction of age grading methodology in determining medical trend rates.
NOTE 23: Assessed contributions
(expressed in euro'000s)
2018 2017
Operational Assessment 354 042 355 569
Capital Assessment 8 059 8 101
Total assessed contributions 362 101 363 670
In accordance with Article XIVD of the IAEA’s Statute and Financial Regulation 5.01, the scale of assessment of Member States’ contributions towards the Regular Budget is calculated in line with the principles and arrangements established by the General Conference (GC). The operational portion of the assessment represents funding towards the activities in the Agency’s approved Regular Budget programme for the specified year. The capital portion of the assessment represents funding towards the Agency’s major capital investments. The split between the Operational and Capital portion is based on the Agency’s budget as approved by the relevant GC resolutions.
A detail of assessed contributions by Member State and other donors is provided in Annex A2.

GC(63)/6 Page 89
NOTE 24: Voluntary contributions
(expressed in eur'000)
2018 2017
Voluntary monetary contributions
Technical Cooperation Fund 79 331 84 572
Technical Cooperation Fund Extrabudgetary Fund 17 616 23 669
Extrabudgetary Programme Fund 100 026 98 771
Total voluntary monetary contributions 196 973 207 012
Voluntary in-kind contributions
Lease of premises-Building VIC 7 360 7 490
Lease of premises - building other 1 365 1 440
Lease of premises - land VIC 956 892
Lease of premises - land other 401 403
Equipment 3 089 -
Total voluntary in-kind contributions 13 171 10 225
Total voluntary contributions 210 144 217 237
Voluntary contributions consist of monetary and in-kind contributions. A detail of voluntary monetary contributions by Member State and other donors is provided in Annex A2.
The above amounts do not reflect the impact of the refunds and transfers of unused portions of extrabudgetary contributions to donors for voluntary contributions for which revenue was recognized in prior years and credits related to prior years’ National Participation Costs. During 2018 and 2017, such refunds and transfers amounted to €1.119 million and €1.135 million, respectively. In accordance with the Agency’s accounting policy for such refunds, these amounts were recognized as direct adjustments to equity.
In-kind contributions primarily comprise the use of the Vienna International Centre (VIC) as a donated asset (€8.316 million) as well as the donated right-to-use of the land, buildings and related utilities in Agency’s other locations including Seibersdorf and Monaco (€1.755 million). The contribution related to the VIC consists of the Agency’s portion of depreciation charges on structures in existence as at 1 January 2015 and still in use, plus additional leasehold improvements financed by the Austrian Government. It also includes the Agency’s portion of the notional rental charge for the land on which the VIC sits.
Other in-kind contributions received by the Agency include goods that qualify as PP&E, intangibles and project inventories for counterparts. In 2018, the Agency received a donation of two pieces of specialized laboratory equipment valued at €3.089 million. Revenue is recognized for these contributions if the cost of the donated goods can be reliably measured and the goods have been transferred to the control of the Agency.
The above does not include the value of services-in-kind received by the Agency. In accordance with the Agency’s accounting policies and in compliance with IPSAS, services-in-kind are not recorded as revenue. The Agency receives a significant amount of services in-kind from certain donors relating to training activities, technical support, consultancy services,
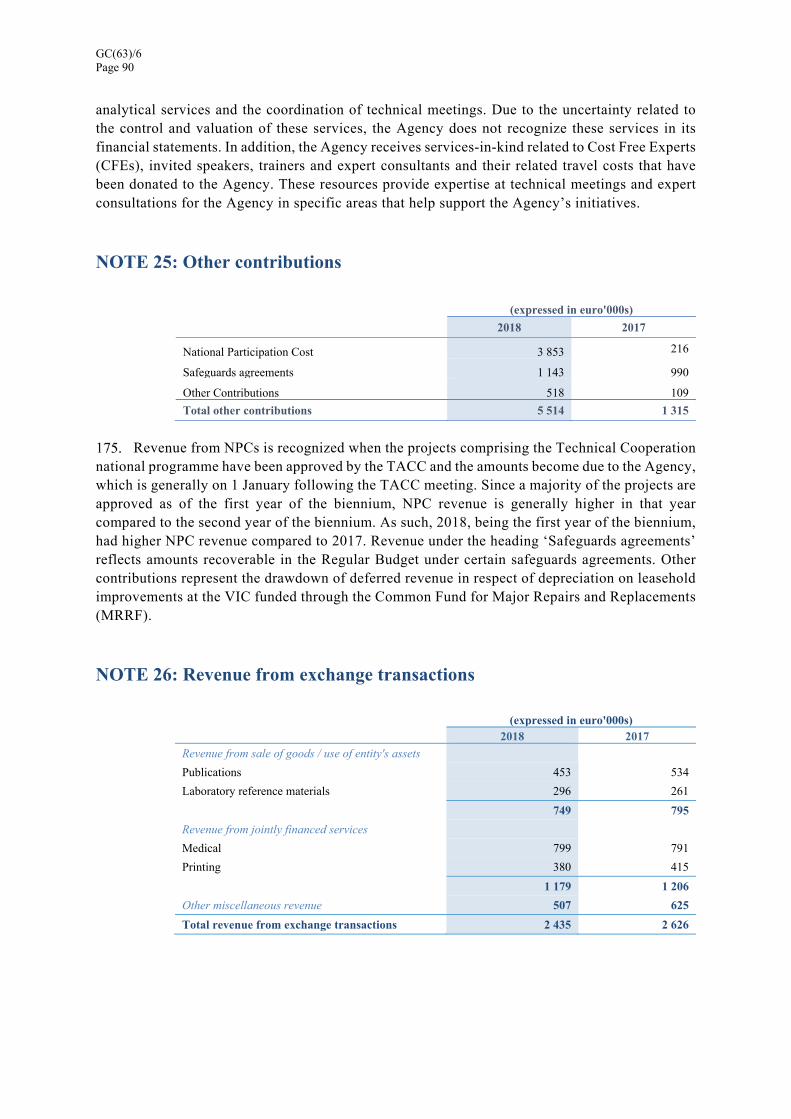
GC(63)/6 Page 90
analytical services and the coordination of technical meetings. Due to the uncertainty related to the control and valuation of these services, the Agency does not recognize these services in its financial statements. In addition, the Agency receives services-in-kind related to Cost Free Experts (CFEs), invited speakers, trainers and expert consultants and their related travel costs that have been donated to the Agency. These resources provide expertise at technical meetings and expert consultations for the Agency in specific areas that help support the Agency’s initiatives.
NOTE 25: Other contributions
(expressed in euro'000s)
2018 2017
National Participation Cost 3 853 216
Safeguards agreements 1 143 990
Other Contributions 518 109
Total other contributions 5 514 1 315
Revenue from NPCs is recognized when the projects comprising the Technical Cooperation national programme have been approved by the TACC and the amounts become due to the Agency, which is generally on 1 January following the TACC meeting. Since a majority of the projects are approved as of the first year of the biennium, NPC revenue is generally higher in that year compared to the second year of the biennium. As such, 2018, being the first year of the biennium, had higher NPC revenue compared to 2017. Revenue under the heading ‘Safeguards agreements’ reflects amounts recoverable in the Regular Budget under certain safeguards agreements. Other contributions represent the drawdown of deferred revenue in respect of depreciation on leasehold improvements at the VIC funded through the Common Fund for Major Repairs and Replacements (MRRF).
NOTE 26: Revenue from exchange transactions
(expressed in euro'000s) 2018 2017
Revenue from sale of goods / use of entity's assets
Publications 453 534
Laboratory reference materials 296 261
749 795
Revenue from jointly financed services
Medical 799 791
Printing 380 415
1 179 1 206
Other miscellaneous revenue 507 625
Total revenue from exchange transactions 2 435 2 626
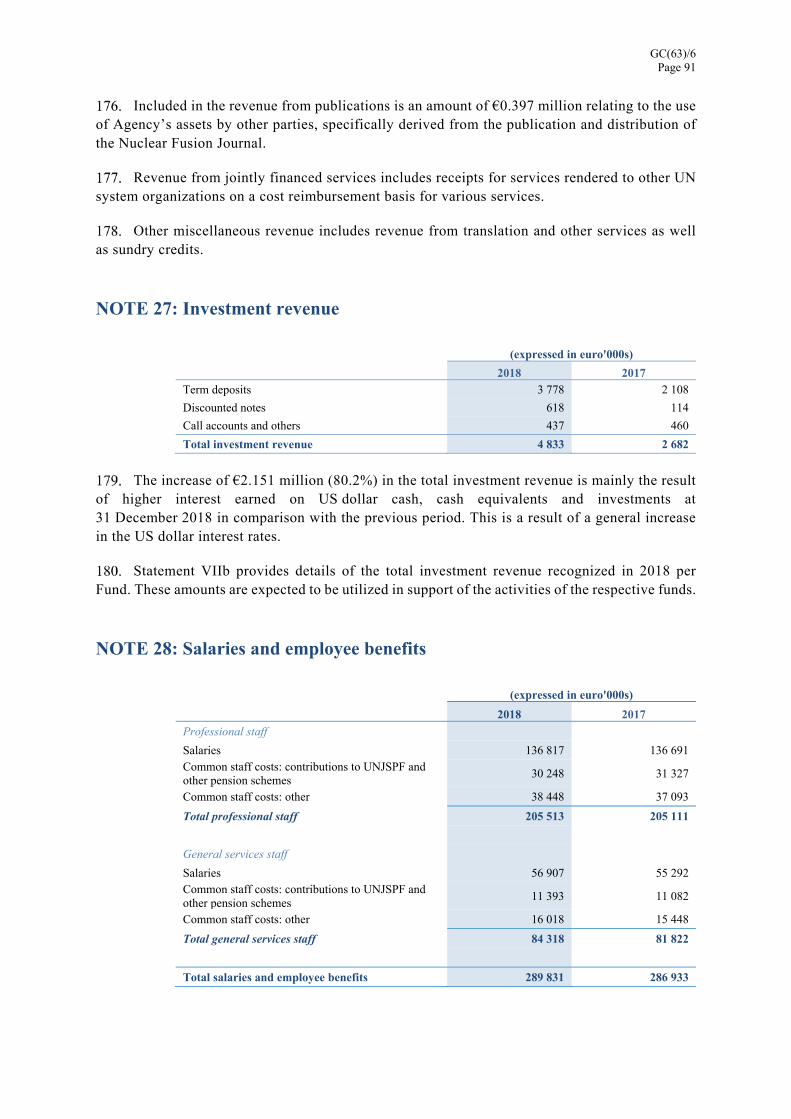
GC(63)/6 Page 91
Included in the revenue from publications is an amount of €0.397 million relating to the use of Agency’s assets by other parties, specifically derived from the publication and distribution of the Nuclear Fusion Journal.
Revenue from jointly financed services includes receipts for services rendered to other UN system organizations on a cost reimbursement basis for various services.
Other miscellaneous revenue includes revenue from translation and other services as well as sundry credits.
NOTE 27: Investment revenue
(expressed in euro'000s)
2018 2017
Term deposits 3 778 2 108
Discounted notes 618 114
Call accounts and others 437 460
Total investment revenue 4 833 2 682
The increase of €2.151 million (80.2%) in the total investment revenue is mainly the result of higher interest earned on US dollar cash, cash equivalents and investments at 31 December 2018 in comparison with the previous period. This is a result of a general increase in the US dollar interest rates.
Statement VIIb provides details of the total investment revenue recognized in 2018 per Fund. These amounts are expected to be utilized in support of the activities of the respective funds.
NOTE 28: Salaries and employee benefits
(expressed in euro'000s)
2018 2017
Professional staff
Salaries 136 817 136 691 Common staff costs: contributions to UNJSPF and other pension schemes
30 248 31 327
Common staff costs: other 38 448 37 093
Total professional staff 205 513 205 111
General services staff Salaries 56 907 55 292 Common staff costs: contributions to UNJSPF and other pension schemes
11 393 11 082
Common staff costs: other 16 018 15 448
Total general services staff 84 318 81 822
Total salaries and employee benefits 289 831 286 933

GC(63)/6 Page 92
Salaries include net base salary and applicable post-adjustment. Common staff costs: other includes insurance, staff entitlements such as home leave, family visit, education grant, etc. as well as other separation benefits.
In 2018, the staff costs remained stable with a 1% increase driven from an increase in General Services staff salary scales which was implemented with effect from the second quarter of 2018.
NOTE 29: Consultants, experts
(expressed in euro'000s)
2018 2017
Consultants and experts 14 967 15 156
Translators 1 113 800
Conference clerks 139 144
Total 16 219 16 100
Consultant expenses represent the cost of contracting consultants, experts and translators including related fees and honorarium. Total consultant and expert expenses increased slightly in 2018 compared to 2017 to €16.2 million from €16.1 million.
NOTE 30: Travel
(expressed in euro'000s)
2018 2017
Duty travel staff
Safeguards inspection and equipment maintenance 6 364 6 443
Duty travel staff 12 197 12 499
Total staff travel 18 561 18 942
Non-staff travel
Consultants, experts and meeting participants 16 002 13 600
For technical cooperation projects 10 103 9 643
Other non-staff 1 967 3 283
Total non-staff travel 28 072 26 526
Total travel expenses 46 633 45 468
Staff travel expenses are comprised mostly of the regular duty travel of staff on various missions, such as technical meetings, research coordination meetings, liaison meetings, emergency assistance, conferences/symposia and project travel.
Non-staff travel costs are the associated travel costs (including ticket costs and per diem) of the consultants, meeting participants or experts the Agency utilizes to support technical cooperation projects or attend technical meetings or conferences.

GC(63)/6 Page 93
NOTE 31: Transfers to development counterparts
(expressed in euro'000s)
2018 2017 Project inventories distributed to development counterparts
38 992 30 403
Services to development counterparts 9 850 9 200
Research and technical contracts 5 130 5 910
International Centre for Theoretical Physics funding 2 180 2 378
Other grants 265 283
Total transfers to development counterparts 56 417 48 174
Project inventories are items purchased for counterparts which are held for distribution in the ordinary course of operations. Services to development counterparts include services purchased by the Agency that will be carried out by individuals or contractors for the benefit of recipient counterparts.
The higher value of expenses for distribution of project inventories to counterparts in 2018 compared to 2017 is due to the timing of the Agency’s programmatic activities.
Research and technical contracts are awarded to institutes in Member States to perform research work or technical services consistent with the activities and mandate of the Agency.
NOTE 32: Vienna International Centre common services
(expressed in euro'000s)
2018 2017
Buildings management services 10 941 9 787
Security services 7 557 7 459
Conference services 1 075 1 389
Total Vienna International Centre common services 19 573 18 635
Building Management Services (BMS), UN Security Services and Conference Services represent the Agency’s share of expenditure of these common services controlled and being operated by other VBOs. Further details of these services may be found in Note 37.
NOTE 33: Training
(expressed in euro'000s)
2018 2017
Training of development counterparts 40 360 38 583
Training - staff 2 760 2 716
Total training 43 120 41 299
Training of development counterparts consists of stipends, tuition, travel and other training related costs.

GC(63)/6 Page 94
NOTE 34: Contractual and other services
(expressed in euro'000s)
2018 2017
Information technology contractual services 10 472 8 182
Scientific and technical contractual services 3 696 1 673
Other institutional contractual services 3 756 3 141
Building services and security non-VIC 5 029 4 195
Equipment and software maintenance 5 734 6 733
Total contractual and other services 28 687 23 924
Information technology contractual services are comprised of expenses for support of the Agency’s information systems, including AIPS and other support services.
Scientific and technical contractual services consist of activities supporting scientific research work at the Agency, such as research reports and studies. The increase in scientific and technical services is mainly due to the return of high enriched uranium materials back to the country of origin during 2018.
Other institutional contractual services are expenses related to translation, interpretation, medical and other services.
Building services and security non-VIC represents the Agency’s expenditure on the maintenance of its offices other than the IAEA Headquarters, primarily Seibersdorf, Toronto, Tokyo, New York and Geneva.
Equipment and software maintenance refer to services performed by third parties in relation to maintenance of equipment as well support for software in use.
NOTE 35: Other operating expenses
(expressed in euro'000s)
2018 2017
Supplies and materials 6 740 6 977
Purchase of minor equipment and software 6 312 3 984
Communication and transport 2 618 2 677
Leased equipment 830 1 012
Lease of premises 3 343 3 295
Representation and hospitality 699 738 Printing supplies, Safeguards spare parts and maintenance materials inventory consumption
134 80
Increase/(decrease) in provisions and allowances 2 296 3 216
Other operating expenses 2 591 3 120
Other miscellaneous expenses 1 765 1 793
Total other operating expenses 27 328 26 892

GC(63)/6 Page 95
Supplies and materials mainly comprise of scientific and technical supplies, and also include office and communication materials and supplies.
Communication and transport relate to costs for telephone, mail and transport of goods.
Purchase of minor equipment and software relates to the expenses incurred on purchase of items of equipment and software that do not meet the capitalization criteria.
All current commercial leases of equipment and premises were classified as operational leases.
Other operating expenses primarily relate to general laboratory utility costs. Other miscellaneous expenses mainly include the Agency’s contributions to UN system jointly funded activities, insurance and bank charges.
NOTE 36: Net gains/ (losses)
(expressed in euro'000s)
2018 2017
Unrealized foreign exchange gains/(losses) 9 824 (35 299)
Realized foreign exchange gains/(losses) 161 (3 446)
Gains/(losses) on sale or disposal of property, plant & equipment
22 (1 426)
Total gains / (losses) 10 007 (40 171)
Net unrealized foreign gains in 2018 were primarily due to the revaluation of the Agency’s cash, cash equivalent and investment holdings in US dollars, and the related appreciation of the US dollar vis-à-vis the euro, the functional currency of the Agency, during this period.
NOTE 37: Interests in other entities
Jointly funded activities
Joint FAO/IAEA Division
The Joint Division of Nuclear Techniques in Food and Agriculture was established to operate in areas of common interest between the Agency and the FAO, to avoid duplication of activities and promote synergy. As such, the Joint Division implements a Programme drawn up biennially in consultation between the two organizations. The operations and governance of the Joint Division are established by the Revised Arrangements between the Directors General of FAO and IAEA for the Joint FAO/IAEA Division of Nuclear Techniques in Food and Agriculture (the ‘Arrangements’). The Arrangements establish a binding arrangement whereby the two organizations are committed to undertake an activity that is subject to joint control. The Joint Division is not considered to be structured as a separate vehicle for the purposes of IPSAS 37 and is consequently accounted for as a Joint Operation.
Assessed contributions from Member States are the major source of revenue for the Joint Division. A total of €11.464 million of the assessed budget funding of the Joint Division was

GC(63)/6 Page 96
provided by the Agency and a total of USD3.545 million was provided by FAO. Any extra-budgetary funds that are made available to either FAO or IAEA for the purpose of the Joint Division are reported in the financial statements of the respective organization. In fact, the agency received extrabudgetary funds amounting to €3.021 million in regards of the operation of joint division. IAEA and FAO also recognize their respective shares of expenses related to the Joint Division. Staff costs are one of the major components of the Joint Division expenses. The agency spent EUR 7.460 million on staff costs and related employee benefits and EUR 7.250 million on non-staff costs during 2018. The Joint Division operates with a team of about 115 scientists, technical experts and support personnel divided among offices, sections and laboratories. The staff members of the Joint Division are employees of either one or the other of the two organizations. Staff costs and related employee benefit liabilities are recognized in the financial statements of the organization which employs the staff member. In 2018, FAO employed 9 staff at professional level and funded 20 general staff positions, laboratory technicians, admin staff and information assistants. Major global trends that continue to frame agricultural development include rising food demand, persistent food insecurity, malnutrition and the impact of climate change on agricultural production. Increasing demands from Member States for assistance in meeting the challenges in these areas, including support in the achievement of their relevant SDGs, will guide the Food and Agriculture Programme during 2018–2019. The Programme will expand its important work addressing the impacts of climate change on food and agriculture through the use of nuclear technology and strengthen its biosecurity efforts to address various transboundary animal and plant diseases that potentially pose serious risks to people and their livelihoods.
Abdus Salam International Centre for Theoretical Physics at Trieste (ICTP)
The Abdus Salam International Centre for Theoretical Physics at Trieste (ICTP) was established in 1964. The ICTP operates under a tripartite agreement between the Agency, UNESCO and the Italian Government. The ICTP is controlled by UNESCO as a specialized science department supporting its program (a Category 1 institute). The Agency, through its relationship with the ICTP, obtains increased access to scientists and technologies from the Agency’s Member States in the fields of nuclear science and fundamental research. This increased access comes through activities such as training, fellowships and other joint events. The Agency has significant influence in relation to the ICTP through its representation on the Steering Committee which governs the ICTP, along with the material funding it provides, which is recognized as an expense in the Statement of Financial Performance. However, the ICTP has no formal ownership structure, dissolution provisions or other means of enabling any interest the Agency may have in the ICTP to be reliably measured. Accordingly, contributions by the Agency are outside the scope of IPSAS 36 and no accounting interest in ICTP can be recognized.
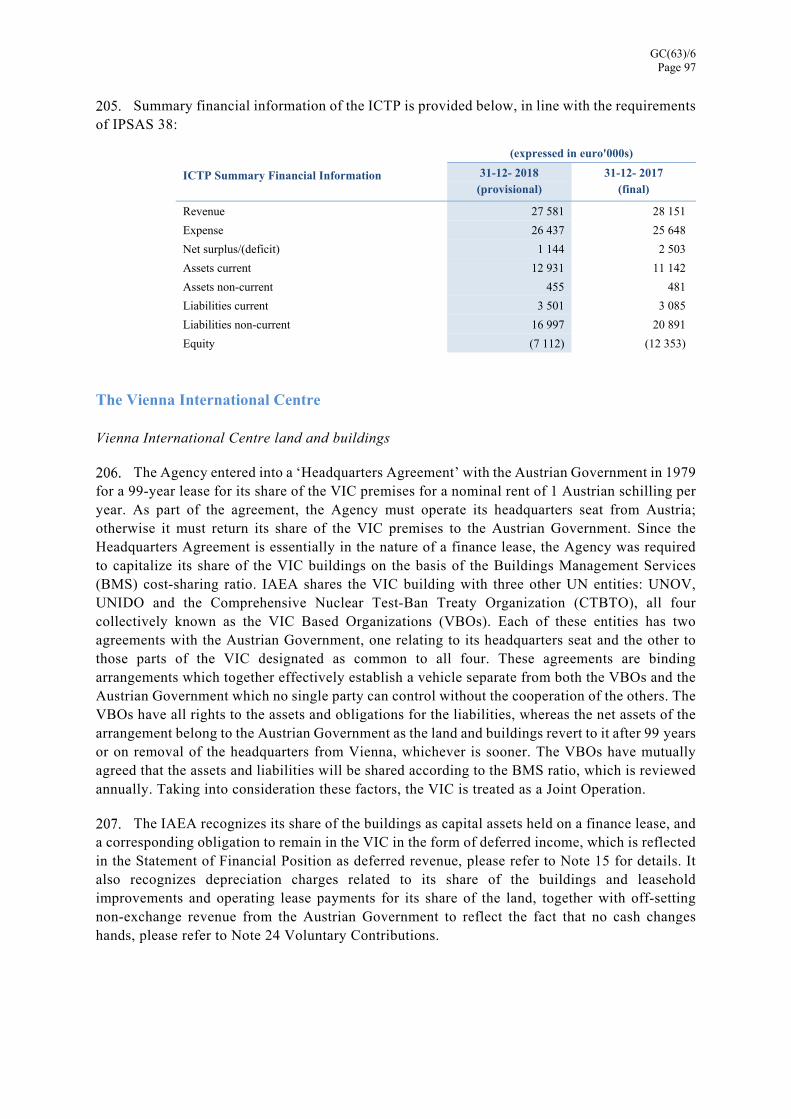
GC(63)/6 Page 97
Summary financial information of the ICTP is provided below, in line with the requirements of IPSAS 38:
(expressed in euro'000s)
ICTP Summary Financial Information 31-12- 2018 31-12- 2017
(provisional) (final)
Revenue 27 581 28 151
Expense 26 437 25 648
Net surplus/(deficit) 1 144 2 503
Assets current 12 931 11 142
Assets non-current 455 481
Liabilities current 3 501 3 085
Liabilities non-current 16 997 20 891
Equity (7 112) (12 353)
The Vienna International Centre
Vienna International Centre land and buildings
The Agency entered into a ‘Headquarters Agreement’ with the Austrian Government in 1979 for a 99-year lease for its share of the VIC premises for a nominal rent of 1 Austrian schilling per year. As part of the agreement, the Agency must operate its headquarters seat from Austria; otherwise it must return its share of the VIC premises to the Austrian Government. Since the Headquarters Agreement is essentially in the nature of a finance lease, the Agency was required to capitalize its share of the VIC buildings on the basis of the Buildings Management Services (BMS) cost-sharing ratio. IAEA shares the VIC building with three other UN entities: UNOV, UNIDO and the Comprehensive Nuclear Test-Ban Treaty Organization (CTBTO), all four collectively known as the VIC Based Organizations (VBOs). Each of these entities has two agreements with the Austrian Government, one relating to its headquarters seat and the other to those parts of the VIC designated as common to all four. These agreements are binding arrangements which together effectively establish a vehicle separate from both the VBOs and the Austrian Government which no single party can control without the cooperation of the others. The VBOs have all rights to the assets and obligations for the liabilities, whereas the net assets of the arrangement belong to the Austrian Government as the land and buildings revert to it after 99 years or on removal of the headquarters from Vienna, whichever is sooner. The VBOs have mutually agreed that the assets and liabilities will be shared according to the BMS ratio, which is reviewed annually. Taking into consideration these factors, the VIC is treated as a Joint Operation.
The IAEA recognizes its share of the buildings as capital assets held on a finance lease, and a corresponding obligation to remain in the VIC in the form of deferred income, which is reflected in the Statement of Financial Position as deferred revenue, please refer to Note 15 for details. It also recognizes depreciation charges related to its share of the buildings and leasehold improvements and operating lease payments for its share of the land, together with off-setting non-exchange revenue from the Austrian Government to reflect the fact that no cash changes hands, please refer to Note 24 Voluntary Contributions.

GC(63)/6 Page 98
Major Repairs and Replacements Fund
This Fund is a joint arrangement between the Austrian Government, which owns half of the Fund, and the VBOs, which jointly own the remainder. It operates under the terms of the Agreement between the International Atomic Energy Agency, the United Nations and the Republic of Austria regarding the establishment and administration of a common fund for financing major repairs and replacements at their headquarters at the Vienna International Centre, signed on 19 January 1981 and amended through an Exchange of Letters on 24 January and 14 February 2002. Its purpose is to finance agreed programmes of work to maintain and enhance the facilities at the VIC. It is established under the terms of an agreement between the five parties which establishes that “authority over the common Fund shall be vested jointly in the parties”. Most of the output of the Fund takes the form of leasehold improvements to the VIC, which is capitalized as parts of the building, and the remainder constitutes minor works that are expensed jointly by the VBOs. Since the Fund gains the entirety of its income from the five participants and the four VBOs consume the totality of its output in agreed proportions, it is appropriate to account for it as a Joint Operation. Accordingly, the Agency recognizes its share of the assets and liabilities, revenues and expenses, consolidated in proportion to the BMS ratio (54.823% for 2018).
Summary financial information for the MRRF is provided below, in line with the requirements of IPSAS 38:
(expressed in euro'000s)
MRRF Summary Financial Information 31-12-2018 31-12-2017
(provisional) (final)
Revenue 4 686 3 525
Expense 3 852 1 955
Net surplus/(deficit) 834 1 570
Assets current 13 294 11 294
Assets non-current - -
Liabilities current 1 880 714
Liabilities non-current - -
Equity 11 414 10 580
The Agency provided funding to MRRF of €1.286 million in 2018 and €0.972 million in 2017. These funds represent the Agency’s share towards its annual budgetary needs and unexpected major repairs and replacements which were not included in the agreed investment plan. The Agency’s share of the works capitalized as part of the VIC is recognized in the statement of financial position, and its share of other expenditures is consolidated into the statement of financial performance.
Vienna International Centre Common Services
Controlled entities
The VIC Medical Service is provided by the Agency, either by its own staff or by organizations contracted by it. The repayments by the other VBOs are apportioned on the basis of headcount employed by the various organizations, and it is also available to other individuals in the event of a medical emergency in the VIC. The service was organized in-house primarily to meet the particular medical needs of the Agency to provide regular medical examinations of the

GC(63)/6 Page 99
field inspectors exposed to specific health risks and radiation workers. The Medical Service is an integral part of the Agency and is operated in accordance with its rules and regulations. No mechanism of advisory and coordinating committees was established for the Medical Services.
The Agency also provides a printing service to other entities on a repayment basis. Users are invoiced monthly on the basis of their actual usage, according to a scale of charges. The printing service is operated as an integral part of the Agency, which employs its staff and owns its assets and liabilities.
The Agency recognizes all the costs, assets and liabilities of the services it provides, together with the revenues received from the provision of services to the other VBOs for both entities.
Other entities
UN Security Services are provided by UNOV to the VIC, and to other external entities on a repayment basis. Although the Security and Safety Service operates under the authority of the Director General of UNOV, it is also answerable to the UN Department of Safety and Security, which has overall worldwide responsibility and sets security standards. The operation is consolidated into the UN financial statements. Consequently, the Agency does not have control over the service. The Agency recognizes its contribution for the services provided by the UNOV as an expense.
UNOV provides the full range of conference services to UNIDO and to CTBTO; however, with the exception of its use of the common interpretation service, the Agency remains outside these arrangements, running its own conference services in parallel. The Agency, therefore, does not have control over these conference services. Consequently, the conference services provided by UNOV are expensed in the Agency’s financial statements as incurred.
UNIDO provides a range of maintenance and support services to the VIC through its Buildings Management Services Special Fund. The Agency advances monies to this Fund, which operates on a no gain/no loss basis, primarily to pay for its share of a variety of pass-through costs for utilities, cleaning, running repairs and routine maintenance. The Fund has no legal personality of its own, and all assets are owned by UNIDO, all contracts are issued in its name and BMS staff members are its employees. Reimbursement is calculated on the basis of floor space occupied and staff numbers employed by each of the VBOs, expressed as a percentage of total costs. Direction of the activities funded by the Special Fund is provided by the Committee on Common Services, which consists of the Heads of Administration/Management of the four VBOs, while final responsibility for the services provided lies with the Director General of UNIDO, under whose authority they are operated. Although the Special Fund has some of the characteristics of a joint arrangement, the nature of the services provided and the fact that the Agency payments are designed to reimburse costs incurred by UNIDO means that the substance of the transaction is best reflected by treating it as a service provided on a repayment basis.

GC(63)/6 Page 100
Interests in structured entities that are not consolidated
Commissary
The Commissary was established under the terms of an Exchange of Notes between the Agency and the Austrian Government dated 1 March 1972 as a common service to enable staff, their dependent families and other entitled individuals to access the privileges conferred to them by the Austrian Government allowing purchases of certain articles on a tax free basis, and the VBOs as entities receive no direct benefits. The Commissary is operated under the authority of the IAEA within the ambit of the Commissary rules and other agreements. The Commissary is financially independent of the Agency and covers its costs from revenue generated by retail sales, which it retains for itself. In the absence of any demonstrable benefits directly to the Agency or any other VBO, no VBO controls the Commissary as defined by the IPSAS standards, as all benefits are enjoyed by entitled individuals rather than the VBOs as entities. According to the dissolution provisions, any residual net assets are payable to VBOs’ staff welfare funds, except for the amount of initial investments of €0.809 million each made by the IAEA and UNIDO on 1 October 1979, which would revert to these Organizations. The initial investment of €0.809 million is recognized as an investment in common services entities.
As the Commissary is operated under the authority of the Agency, all staff of the Commissary hold the Agency employment contracts. As such, the Agency would be liable for post-employment and other long-term employment benefits of these staff members should the Commissary be unable to meet the financial obligations for such post-employment and other long-term employment benefits. As at 31 December 2018, the total amount of such post-employment and other long-term employment benefits for the staff of the Commissary was €9.365 million (2017: €8.689 million).
Summary financial information for the Commissary is provided below:
(expressed in euro'000s)
Commissary Summary Financial Information 31-12-2018 31-12-2017
(provisional) (final)
Revenue 29 047 29 080
Expense 29 413 28 885
Net surplus/(deficit) (366) 195
Asset current 16 622 16 638
Asset non-current 1 597 1 284
Liabilities current 824 814
Liabilities non-current 10 763 10 006
Equity 6 632 7 102
Catering service
The Catering Service at the VIC has been established as a self-sustaining, non-profit-making operation to provide catering services to staff and other entitled individuals at the VIC. The responsibility for managing and operating the Catering Service is assigned to UNIDO by an agreement between the UN, IAEA and UNIDO dated 31 March 1977. The Catering Service is an integral part of the UNIDO Secretariat and has no legal personality of its own. As in the case of the Commissary, the benefits from operating the Catering Service flow to the staff of the VBOs, rather than to the VBOs themselves. In case of dissolution, any residual net assets are attributable

GC(63)/6 Page 101
to VBOs’ staff welfare funds. Although they jointly sponsor the catering service, in the absence of direct benefits and rights to residual net assets, no VBO can demonstrate either control or significant influence over the Catering Service. The Agency therefore has no ownership interest in the Catering Service.
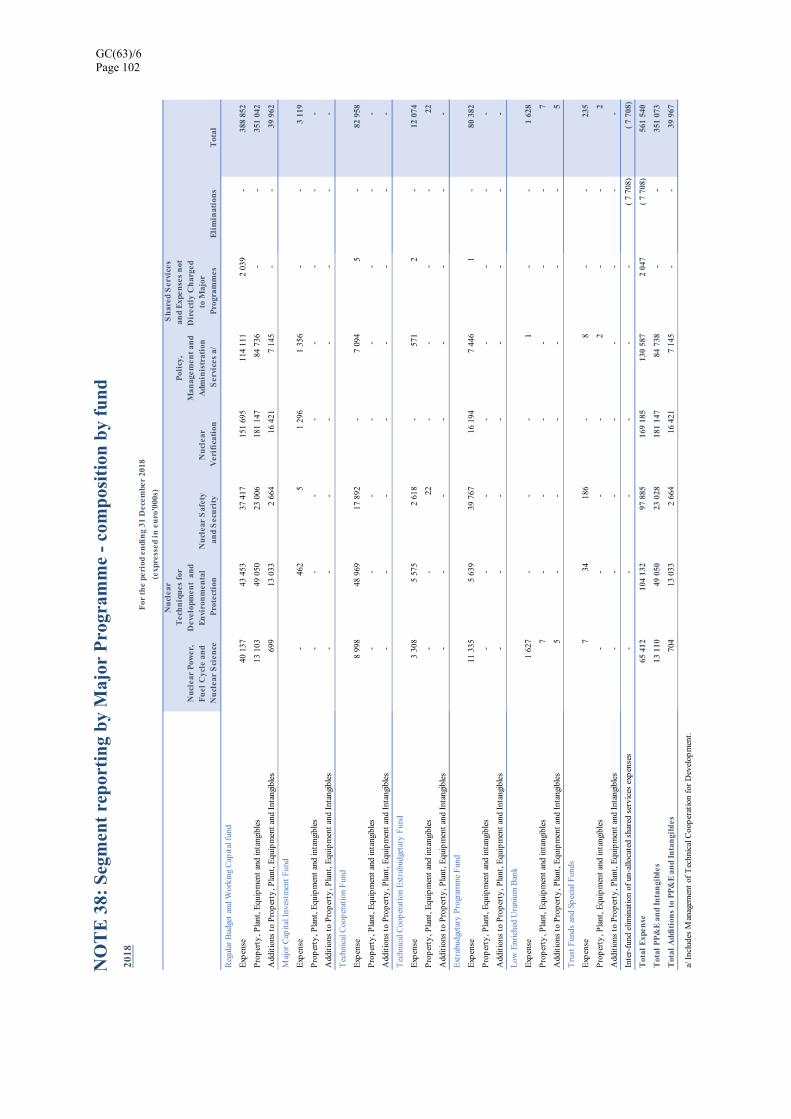
GC(63)/6 Page 102
2018
Nu
clea
r P
ower
, F
uel
Cyc
le a
nd
Nu
clea
r S
cien
ce
Nu
clea
r T
ech
niq
ues
for
D
evel
opm
ent
an
d E
nvi
ron
men
tal
Pro
tect
ion
N
ucl
ear
Saf
ety
and
Sec
uri
ty
Nu
clea
r V
erif
icat
ion
Pol
icy,
M
anag
emen
t an
d A
dmin
istr
atio
n
Ser
vice
s a/
Sh
ared
Ser
vice
s an
d E
xpen
ses
not
D
irec
tly
Ch
arge
d
to M
ajor
P
rogr
amm
es E
lim
inat
ion
s T
otal
Reg
ular
Bud
get
and
Wor
king
Cap
ital
fun
d
Exp
ense
40
137
43
453
37
417
151
695
114
111
2 0
39-
3
88 8
52
Pro
per
ty, P
lant
, Equ
ipm
ent
and
inta
ngib
les
13
103
49
050
23
006
181
147
84
736
-
-
351
042
Add
itio
ns t
o P
rop
erty
, Pla
nt, E
quip
men
t an
d In
tang
ible
s 6
99 1
3 03
3 2
664
16
421
7 1
45-
-
3
9 96
2
Maj
or C
apit
al I
nves
tmen
t F
und
Exp
ense
-
462
5 1
296
1 3
56-
-
3
119
Pro
per
ty, P
lant
, Equ
ipm
ent
and
inta
ngib
les
-
-
-
-
-
-
-
-
Add
itio
ns t
o P
rop
erty
, Pla
nt, E
quip
men
t an
d In
tang
ible
s-
-
-
-
-
-
-
-
Tec
hnic
al C
oop
erat
ion
Fun
d
Exp
ense
8 9
98 4
8 96
9 1
7 89
2-
7
094
5-
8
2 95
8
Pro
per
ty, P
lant
, Equ
ipm
ent
and
inta
ngib
les
-
-
-
-
-
-
-
-
Add
itio
ns t
o P
rop
erty
, Pla
nt, E
quip
men
t an
d In
tang
ible
s-
-
-
-
-
-
-
-
Tec
hnic
al C
oop
erat
ion
Ext
rabu
dget
ary
Fun
d
Exp
ense
3 3
08 5
575
2 6
18-
5
71 2
-
12
074
Pro
per
ty, P
lant
, Equ
ipm
ent
and
inta
ngib
les
-
-
22
-
-
-
-
22
Add
itio
ns t
o P
rop
erty
, Pla
nt, E
quip
men
t an
d In
tang
ible
s-
-
-
-
-
-
-
-
Ext
rabu
dget
ary
Pro
gram
me
Fun
d
Exp
ense
11
335
5 6
39 3
9 76
7 1
6 19
4 7
446
1-
8
0 38
2
Pro
per
ty, P
lant
, Equ
ipm
ent
and
inta
ngib
les
-
-
-
-
-
-
-
-
Add
itio
ns t
o P
rop
erty
, Pla
nt, E
quip
men
t an
d In
tang
ible
s-
-
-
-
-
-
-
-
Low
Enr
iche
d U
rani
um B
ank
Exp
ense
1 6
27-
-
-
1
-
-
1 6
28
Pro
per
ty, P
lant
, Equ
ipm
ent
and
inta
ngib
les
7-
-
-
-
-
-
7
Add
itio
ns t
o P
rop
erty
, Pla
nt, E
quip
men
t an
d In
tang
ible
s 5
-
-
-
-
-
-
5
Tru
st F
unds
and
Sp
ecia
l Fun
ds
Exp
ense
7 3
4 1
86-
8
-
-
235
Pro
per
ty, P
lant
, Equ
ipm
ent
and
inta
ngib
les
-
-
-
-
2-
-
2
Add
itio
ns t
o P
rop
erty
, Pla
nt, E
quip
men
t an
d In
tang
ible
s-
-
-
-
-
-
-
-
Inte
r-fu
nd e
limin
atio
n of
un-
allo
cate
d sh
ared
ser
vice
s ex
pen
ses
-
-
-
-
-
-
( 7
708)
( 7
708)
Tot
al E
xpen
se 6
5 41
2 1
04 1
32 9
7 88
5 1
69 1
85 1
30 5
87 2
047
( 7
708)
561
540
Tot
al P
P&
E a
nd
Inta
ngi
bles
13
110
49
050
23
028
181
147
84
738
-
-
351
073
Tot
al A
ddit
ion
s to
PP
&E
an
d In
tan
gibl
es 7
04 1
3 03
3 2
664
16
421
7 1
45-
-
3
9 96
7
a/ I
nclu
des
Man
agem
ent
of T
echn
ical
Coo
per
atio
n fo
r D
evel
opm
ent.
For
th
e pe
riod
en
din
g 31
Dec
embe
r 20
18
(exp
ress
ed i
n e
uro
'000
s)
NO
TE
38:
Seg
men
t re
por
tin
g b
y M
ajor
Pro
gram
me
- co
mp
osit
ion
by
fun
d
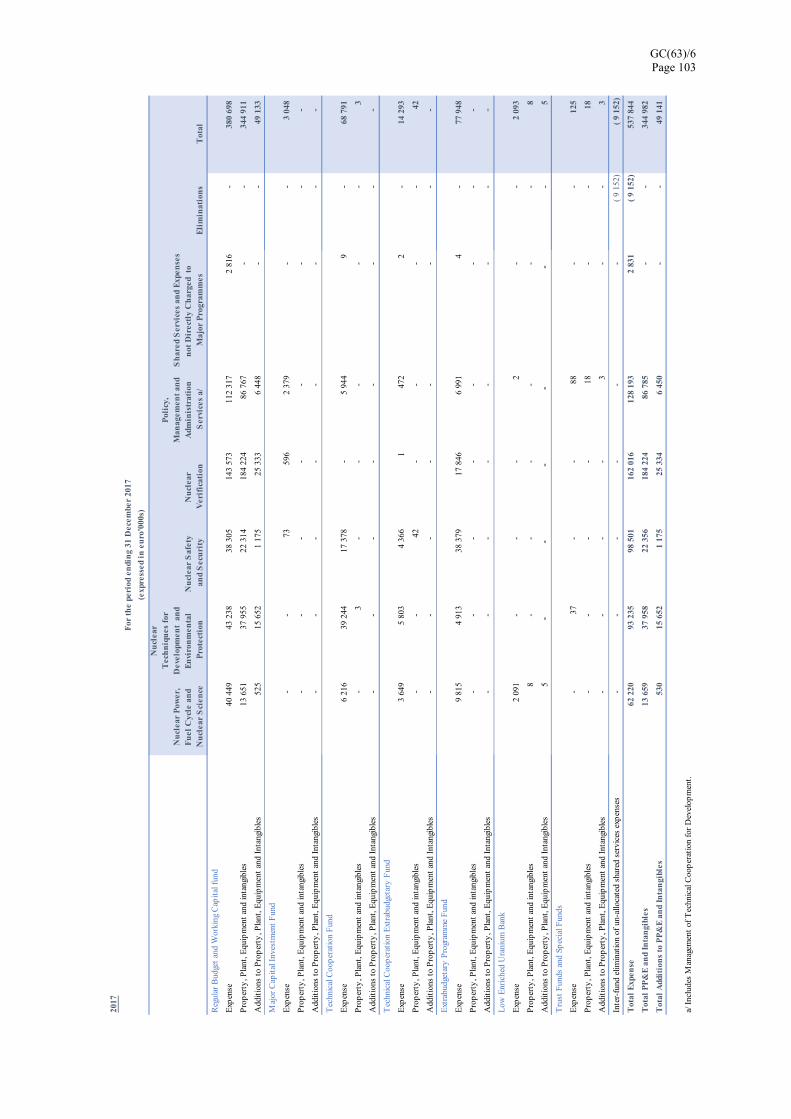
GC(63)/6 Page 103
2017
Nu
clea
r P
ower
, F
uel
Cyc
le a
nd
Nu
clea
r S
cien
ce
Nu
clea
r T
ech
niq
ues
for
D
evel
opm
ent
an
d E
nvi
ron
men
tal
Pro
tect
ion
N
ucl
ear
Saf
ety
and
Sec
uri
ty
Nu
clea
r V
erif
icat
ion
Pol
icy,
M
anag
emen
t an
d A
dmin
istr
atio
n
Ser
vice
s a/
Sh
ared
Ser
vice
s an
d E
xpen
ses
not
Dir
ectl
y C
har
ged
to
Maj
or P
rogr
amm
es E
lim
inat
ion
s T
otal
Reg
ular
Bud
get
and
Wor
king
Cap
ital
fun
d
Exp
ense
40
449
43
238
38
305
143
573
112
317
2 8
16-
3
80 6
98
Pro
per
ty, P
lant
, Equ
ipm
ent
and
inta
ngib
les
13
651
37
955
22
314
184
224
86
767
-
-
3
44 9
11
Add
itio
ns t
o P
rop
erty
, Pla
nt, E
quip
men
t an
d In
tang
ible
s 5
25 1
5 65
2 1
175
25
333
6 4
48-
-
49
133
Maj
or C
apit
al I
nves
tmen
t F
und
Exp
ense
-
-
73
596
2 3
79-
-
3 0
48
Pro
per
ty, P
lant
, Equ
ipm
ent
and
inta
ngib
les
-
-
-
-
-
-
-
-
Add
itio
ns t
o P
rop
erty
, Pla
nt, E
quip
men
t an
d In
tang
ible
s-
-
-
-
-
-
-
-
Tec
hnic
al C
oop
erat
ion
Fun
d
Exp
ense
6 2
16 3
9 24
4 1
7 37
8-
5
944
9-
6
8 79
1
Pro
per
ty, P
lant
, Equ
ipm
ent
and
inta
ngib
les
-
3-
-
-
-
-
3
Add
itio
ns t
o P
rop
erty
, Pla
nt, E
quip
men
t an
d In
tang
ible
s-
-
-
-
-
-
-
-
Tec
hnic
al C
oop
erat
ion
Ext
rabu
dget
ary
Fun
d
Exp
ense
3 6
49 5
803
4 3
66 1
472
2-
1
4 29
3
Pro
per
ty, P
lant
, Equ
ipm
ent
and
inta
ngib
les
-
-
42
-
-
-
-
4
2
Add
itio
ns t
o P
rop
erty
, Pla
nt, E
quip
men
t an
d In
tang
ible
s-
-
-
-
-
-
-
-
Ext
rabu
dget
ary
Pro
gram
me
Fun
d
Exp
ense
9 8
15 4
913
38
379
17
846
6 9
91 4
-
77
948
Pro
per
ty, P
lant
, Equ
ipm
ent
and
inta
ngib
les
-
-
-
-
-
-
-
-
Add
itio
ns t
o P
rop
erty
, Pla
nt, E
quip
men
t an
d In
tang
ible
s-
-
-
-
-
-
-
-
Low
Enr
iche
d U
rani
um B
ank
Exp
ense
2 0
91-
-
-
2
-
-
2
093
Pro
per
ty, P
lant
, Equ
ipm
ent
and
inta
ngib
les
8-
-
-
-
-
-
8
Add
itio
ns t
o P
rop
erty
, Pla
nt, E
quip
men
t an
d In
tang
ible
s 5
-
-
-
-
-
-
5
Tru
st F
unds
and
Sp
ecia
l Fun
ds
Exp
ense
-
37
-
-
88
-
-
1
25
Pro
per
ty, P
lant
, Equ
ipm
ent
and
inta
ngib
les
-
-
-
-
18
-
-
1
8
Add
itio
ns t
o P
rop
erty
, Pla
nt, E
quip
men
t an
d In
tang
ible
s-
-
-
-
3
-
-
3
Inte
r-fu
nd e
limin
atio
n of
un-
allo
cate
d sh
ared
ser
vice
s ex
pen
ses
-
-
-
-
-
-
(
9 15
2)(
9 15
2)
Tot
al E
xpen
se 6
2 22
0 9
3 23
5 9
8 50
1 1
62 0
16 1
28 1
93 2
831
( 9
152)
537
844
Tot
al P
P&
E a
nd
Inta
ngi
bles
13
659
37
958
22
356
184
224
86
785
-
-
3
44 9
82
Tot
al A
ddit
ion
s to
PP
&E
an
d In
tan
gibl
es 5
30 1
5 65
2 1
175
25
334
6 4
50-
-
49
141
a/ I
nclu
des
Man
agem
ent
of T
echn
ical
Coo
per
atio
n fo
r D
evel
opm
ent.
For
th
e pe
riod
en
din
g 31
Dec
embe
r 20
17
(exp
ress
ed i
n e
uro
'000
s)

GC(63)/6 Page 104
NOTE 39: Budget
The Regular Budget consists of an operational and a capital portion, the latter to fund major infrastructure investments. Regular Budget estimates, in accordance with the structure of the Agency’s programme of work, are presented in the six Major Programmes (MPs). MPs 1-4 are scientific and technical in nature:
MP 1 – Nuclear Power, Fuel Cycle and Nuclear Science
MP 2 – Nuclear Techniques for Development and Environmental Protection
MP 3 – Nuclear Safety and Security
MP 4 – Nuclear Verification
Other MPs provide managerial and administrative services that facilitate the work of the scientific and technical MPs:
MP 5 – Policy, Management and Administration Services
MP 6 – Management of Technical Cooperation for Development
The capital portion of the Regular Budget is a part of the MCIF. This is a Reserve Fund, established in accordance with Financial Regulation 4.06, to support major infrastructure investments that comply with the Agency’s Major Capital Investment Plan (MCIP).
NOTE 39a: Movements between original and final budgets (Regular Budget)
Each year, the General Conference approves a budget for the Agency which is allocated in appropriation sections. The Director General may incur expenditure within the limits stated in the appropriation sections and for the purposes for which they are voted. The Director General cannot make transfers between any of the appropriation sections without the prior approval of the Board of Governors. No transfers between the appropriation sections were made during 2017. The amount in each appropriation section comprises of a euro component and a US dollar component expressed in euro equivalent on the basis of the average US dollar-to-euro UNORE experienced during the budget year. Therefore, the authority granted by the General Conference, expressed in euros, can only be determined at the end of the budget year.
The table below illustrates the revaluation of the 2018 Regular Budget appropriations for 2018. The variances between the original approved budget and the final budget were due to revaluation only. There were no changes between the original and final budget for the capital portion of the 2018 Regular Budget appropriations.

GC(63)/6 Page 105
(expressed in euro '000s)
Major Programmes Original Approved
Budget a/
Revalued Final
Budget b/
Variance
MP1 - Nuclear Power, Fuel Cycle and Nuclear Science
39 844
38 990
(854)
MP2 - Nuclear Techniques for Development and Environmental Protection 40 480 39 820 (660)
MP3 - Nuclear Safety and Security 35 613 34 690 (923)
MP4 - Nuclear Verification 141 961 138 701 (3 260)
MP5 - Policy, Management and Administration Services 79 048 77 893 (1 155)
MP6 - Management of Technical Cooperation for Development 25 534 24 975 (559)
Total Agency Programmes 362 480 355 069 (7 411)
Reimbursable Work for Others
2 783
2 783
-
Total Regular Budget fund operational portion 365 263 357 852 (7 411)
a/ General Conference Resolutions GC(61)/RES/4 of September 2017 - original budget at $1/€1.
b/ Original Budget revalued at the United Nations operational average rate of exchange of €0.847 to $1
NOTE 39b: Reconciliation between actual amounts on a budget comparable basis and the cash flow statement
As required under IPSAS 24 Presentation of Budget Information in Financial Statements, the actual amounts presented on a comparable basis to the budget shall, where the financial statements and the budget are not prepared on a comparable basis, be reconciled to net cash flows from operating, investing and financing activities, identifying separately any basis, timing and entity differences. There may also be differences in formats and classification schemes adopted for presentation of financial statements and the budget.
The reconciliation between the actual amounts on a comparable basis in the Comparison of Budget and Actual Amounts and the actual amounts in the Cash Flow Statement for the period ended 31 December 2018 is presented below:

GC(63)/6 Page 106
(expressed in euro'000s)
Operational Investing Financing
Actual Net Surplus as per the Statement of Comparison of Budget and Actual Amounts a/
3 624 - -
Basis Difference (41 224) ‐ ‐
Presentation Difference 54 632 (44 961) 12
Entity Difference 31 712 (78 126) ‐
Actual Amount in the Statement of Cash Flows 48 744 (123 087) 12
a/ IPSAS 24 requires a reconciliation to be presented between the actual amounts (Actuals/Expenditure Statement Va) and the net cash flows. The reconciliation in this Note compares the variance between budget and actuals (Statement Va) and the net cash flows (Statement IV). If the literal requirement of IPSAS 24 is followed, the Agency’s revenues (substantial part of the cash flows) would appear as reconciling differences. This would distort the clarity and the ability of the readers of financial statements to draw conclusions from such presentation. The logical requirement of the Standard is to demonstrate the differences between the accounting basis used in the preparation of the budget and the accounting basis used in the financial statements. We believe that the given reconciliation achieves a fair presentation.
Basis differences capture the differences resulting from preparing the budget on a modified cash basis. In order to reconcile the budgetary results to the cash flow statement, the non-cash elements such as year-end unliquidated obligations, payments against prior-year obligations, outstanding assessed contributions as well as foreign exchange gain/loss are included as basis differences.
Timing differences occur when the budget period differs from the reporting period reflected in the financial statements. For the purposes of comparison of budget and actual amounts, there are no timing differences for the Agency.
Presentation differences are differences in the format and classification schemes in the Statement of Cash Flow and the Statement of Comparison of Budget and Actual Amounts.
Entity differences represent cash flows of Fund groups other than the Regular Budget Fund that are reported in the Financial Statements. The financial statements include results for all Fund groups.
NOTE 39c: Budget to actuals variance analysis
Excluding reimbursable work for others, €3.108 million, the Agency expended €356.154 million (obligations plus actuals) from the 2018 Regular Budget, including capital portion. The operational Regular Budget expenditure amounted to €351.445 million out of an adjusted budget of €355.069 million representing an implementation rate of 99% and thus, leaving an unencumbered balance of €3.624 million which will be carried over into 2019, the second year of the biennium, to meet approved programmatic needs.
Under the 2018 capital portion of the Regular Budget, €4.709 million were expended (obligations plus actuals) out of a budgeted amount of €8.059 million, representing an implementation rate of 58.43% and thus, leaving an unencumbered balance of €3.350 million to be carried over for the same approved projects. The unencumbered balances will continue to be used as follows:
GC(63)/6 Page 107
€0.610 million for the renovation of the Nuclear Application Laboratory – ReNuAL+ (Major Programme 2)
€0.177 million for radiation safety technical services – (Major Programme 3)
€1.008 million to develop and implement a Safeguard approach for J-MOX – (Major Programme 4)
€0.567 million for Seibersdorf Infrastructure and Common Facilities (Major Programme 5)
€0.988 million for IT infrastructure and information security investment (Major Programme 5)
NOTE 39d: Major Capital Investment Fund (MCIF)
The MCIF is a Reserve Fund established in accordance with Financial Regulation 4.06 which allows the retention (‘carryover’) of funds beyond the end of the biennium. The Director General will incur expenditures from the MCIF to implement the MCIP in compliance with the Financial Regulations and Rules.
The MCIP is a long-term plan which outlines the Agency’s major capital projects. It is a mechanism which facilitates long-term planning, allows for the accumulation and retention of funds beyond the end of a budget biennium to make them available when needed. Furthermore, it helps to ensure that appropriations are planned for and managed in a manner that the amounts requested each year are more stable and predictable.
The MCIF is reviewed by the Board in the framework of the established programme and budget approval process to determine, inter alia, the adequacy of the fund balance and the level of appropriations required for the capital Regular Budget after considering such factors as extrabudgetary contributions received or pledged for items in the MCIP, rate of implementation and adjustments to the MCIP due to changes in circumstances or prioritization.
The MCIF is funded by multiple sources as originally described in GC(53)/5, including appropriations of the capital portion of the Regular Budget, any savings from annual Regular Budget appropriations and any other source as the Board may determine.
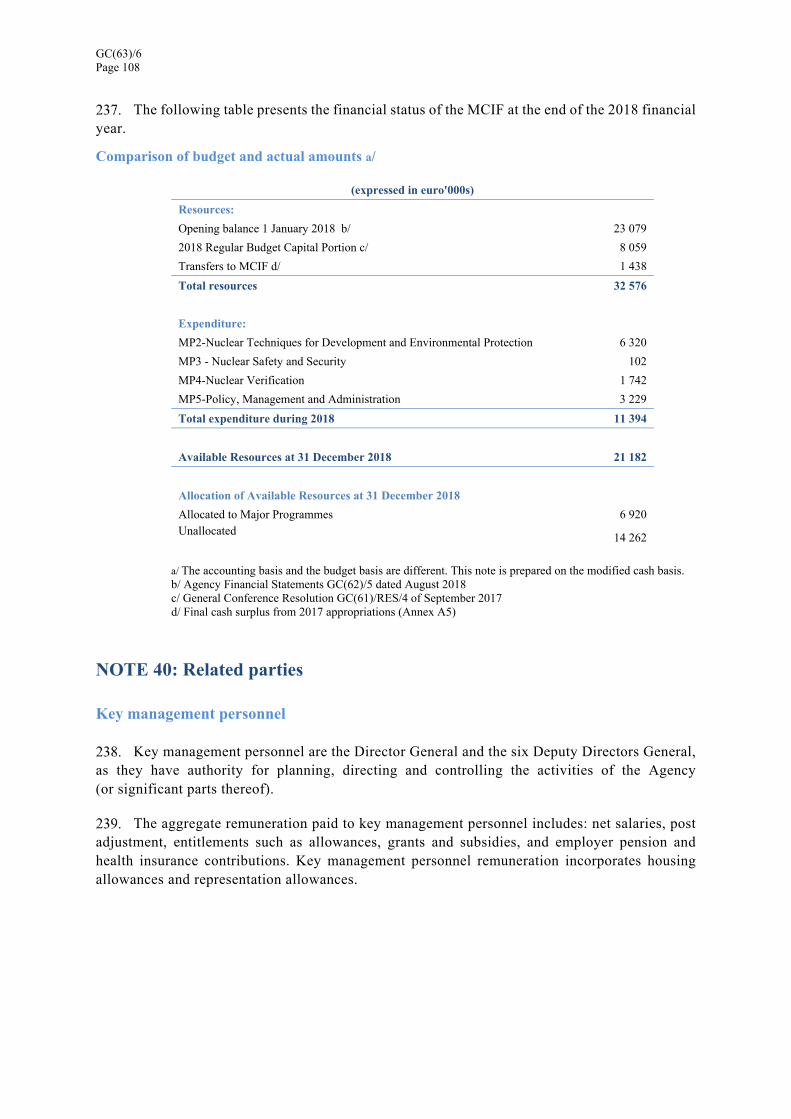
GC(63)/6 Page 108
The following table presents the financial status of the MCIF at the end of the 2018 financial year.
Comparison of budget and actual amounts a/
(expressed in euro'000s)
Resources:
Opening balance 1 January 2018 b/ 23 079
2018 Regular Budget Capital Portion c/ 8 059
Transfers to MCIF d/ 1 438
Total resources 32 576
Expenditure:
MP2-Nuclear Techniques for Development and Environmental Protection 6 320
MP3 - Nuclear Safety and Security 102
MP4-Nuclear Verification 1 742
MP5-Policy, Management and Administration 3 229
Total expenditure during 2018 11 394
Available Resources at 31 December 2018 21 182
Allocation of Available Resources at 31 December 2018
Allocated to Major Programmes 6 920 Unallocated
14 262
a/ The accounting basis and the budget basis are different. This note is prepared on the modified cash basis. b/ Agency Financial Statements GC(62)/5 dated August 2018 c/ General Conference Resolution GC(61)/RES/4 of September 2017 d/ Final cash surplus from 2017 appropriations (Annex A5)
NOTE 40: Related parties
Key management personnel
Key management personnel are the Director General and the six Deputy Directors General, as they have authority for planning, directing and controlling the activities of the Agency (or significant parts thereof).
The aggregate remuneration paid to key management personnel includes: net salaries, post adjustment, entitlements such as allowances, grants and subsidies, and employer pension and health insurance contributions. Key management personnel remuneration incorporates housing allowances and representation allowances.

GC(63)/6 Page 109
(expressed in euro'000s)
Number of Individuals
Compensation and Post
Adjustment Entitlements
Pension and
Health Plans
Total Remuneration
Outstanding Advances Against
Entitlements Outstanding
Loans
2018 8* 1 203 395 300 1 897 17
2017 7 1 215 321 310 1 846 17 -
* One member of the key management personnel separated in May 2018 and was replaced. At any point in time during 2018 there were not more than 7 key management personnel.
No close family member of the key management personnel was employed by the Agency during the year.
Advances are those made against entitlements in accordance with staff rules and regulations. Advances against entitlements are widely available to all Agency staff.
NOTE 41: Financial instruments disclosure
All financial assets and liabilities are carried at their amortized cost. Given the short-term nature of the Agency's financial assets and liabilities, their carrying value represents a reasonable estimate of their fair value. Annex A6 provides the details of all investments which include call accounts, time deposits, treasury bills and other discounted notes.
The Agency's activities expose it to credit risk, liquidity risk, currency risk, and interest rate risk. Detailed information on the Agency's management of each of these risks and the related exposures is provided in the following sections. From an overall perspective, the Agency's investment management objective prioritizes capital preservation as its primary objective, ensuring sufficient liquidity to meet cash operating requirements, and then earning a competitive rate of return on its portfolio within these constraints. Capital preservation and liquidity are emphasized over the rate of return. Currently, no investment can be longer than one year.
Credit risk management
Credit risk refers to the risk that counterparty will default on its contractual obligations resulting in a financial loss to the IAEA. The carrying value of financial assets equates to the maximum exposure to credit risk as at balance date.
To manage credit risk relating to its portfolio, the Agency has an investment policy that restricts investments to particular types of financial instruments along with investment ceilings per issuer depending on the credit quality of the issuer. With effect from 1 January 2018, the Agency implemented new Financial Instruction on Treasury Management. With the new Financial Instruction, credit risk exposure is calculated for cash, cash equivalents and investments as a percentage of total financial holdings. Before 2017, exposure was considered only for the cash equivalents and investments.

GC(63)/6 Page 110
The Agency’s credit quality on cash equivalents and investments
Carrying value and percentage of cash equivalents and investments
(expressed in euro'000s)
Credit quality a/ 31-12-2018 31-12-2017
Carrying value Percentage Carrying value Percentage
AAA 189 382 26.24% 227 992 32.50%
AA+ - - - -
AA - - - -
AA- 62 264 8.63% 19 414 2.80%
A+ 122 019 16.91% 60 051 8.50%
A 164 234 22.75% 103 998 14.80%
A- 5 974 0.83% 68 528 9.80%
BBB+ 176 039 24.39% 220 835 31.4%
non-rated 1 836 0.25% 1 562 0.2%
Total 721 748 b/ 100% 702 380 100%
a/ Credit quality is expressed as the issuer default/long-term rating, with the exception of the Bank for International Settlements (BIS). The BIS has not been rated by a rating agency; however, its debt trades at AAA levels due to the special status of this institution, which is the bank of central banks around the world. b/ 68.2% of the balance as at 31 December 2018 was denominated in euros, 31.6% was denominated in US dollars and 0.2% in other currencies (63.3%, 36.1% and 0.6%, respectively as at 31 December 2017).
The Agency has set a maximum ceiling of 70 percent for exposure with commercial banks in cash equivalents and investments as well as maximum country ceilings for exposures with commercial banks; taking into account that the minimum allowed country rating is AA-. In this regard, as at 31 December 2018, the total exposure of the Agency with commercial banks was 73.8%, which slightly exceeds the 70 percent ceiling with the main purpose of preservation of capital, minimizing the exposure to negative interest rates. The highest exposure with commercial banks in any single country was 18% in an AA country. Credit risk relating to management of accounts receivable is discussed further in Note 7. The following table gives the details of exposures to any single issuer of over 10% of the total financial Holdings (€721.7 million):
Issuer Industry Carrying value (expressed in euro'000s) 31-12-2018 31-12-2017 Carrying value Percentage Carrying value Percentage
UniCredit Bank Austria Commercial bank 176 039 24.4% 220 835 31.4%
Bank for International Settlements.
Financial Institution (central banks)
166 440 23.1% 161 960 23.1%
Total 342 479 47.5% 382 795 54.5%
Currency risk management
The Agency undertakes transactions denominated in foreign currencies and must therefore manage its exposure to exchange rate fluctuations. The Agency's general strategy for managing exchange rate risk is to ensure that revenues are received or converted in the market in the same

GC(63)/6 Page 111
currencies as anticipated expenses. The principal mechanisms being the split assessment system for the Regular Budget Fund and the cash holdings of other funds are generally being held in the expected currency of the disbursements.
Foreign currency revenue inflows are translated at differing exchange rates to the related foreign currency expense outflows which occur at a later date. The foreign exchange gains and losses associated with foreign currency holdings during the window between these inflows and outflows therefore do not represent a true economic risk to the Agency due to the currency management strategy outlined above.
The carrying amounts of the Agency's foreign currency denominated financial assets and financial liabilities translated to euro at the end of the period are set out below. Some financial assets are denominated in difficult-to-use currencies (‘illiquid currencies’) that cannot be readily converted into euro.
Total cash, deposits and other investment currency denominations
(expressed in euro'000s)
Euros US dollars Illiquid
currencies Others Total
As at 31-12-2018 492 188 227 886 1 646 28 721 748
As at 31-12-2017 444 762 253 566 3 934 117 702 379
The increase of € 19.4 million (2.8%) in total cash, cash equivalents and investments at 31 December 2018 as compared to the balance as at 31 December 2017 was mainly driven by net surplus of extrabudgetary contributions in 2018 as well as the revaluation of US dollar holdings.
Liquidity risk management
Liquidity risk refers to the risk that an entity will encounter difficulty in meeting obligations associated with financial liabilities.
Liquidity risk is generally managed on an individual fund basis. For all funds except the Regular Budget, commitments can generally only be made once funds are available and therefore liquidity risk is minimal. For the Regular Budget, the appropriation based framework for expense authorization ensures that expenses do not exceed revenue streams for any given year, while the WCF is a mechanism for providing liquidity, should issues arise around the timing of cash outflows and cash inflows (relating primarily to member state assessed contributions). The WCF provides a liquidity buffer for the Agency's regular budget of around two weeks cash-flow. It was utilized in 2018. As of end of September 2018, all cash available in the Regular Budget Fund had been fully utilized. As a result, and as foreseen in Financial regulation 7.04, €3.0 million of the Working Capital Fund was utilized to fund the Agency’s Regular Budget operations at the end of September 2018. Payments of outstanding Assessed Contributions were received from a number of Member States at the beginning of October 2018. As a result, the Working Capital Fund was fully replenished in early October 2018.

GC(63)/6 Page 112
Maturity analysis of the Agency’s financial liabilities and financial assets
The Agency’s financial liabilities were approximately 41.9% of financial assets as at 31 December 2018, against 41.7% as at 31 December 2017; this higher percentage is mainly due to a significant increase in employee benefits liabilities. Most of the financial liabilities are long-term in nature. The Agency’s short-term financial liabilities (due within 12 months) were 4.5% of its short-term financial assets as at 31 December 2018 (4.6% as at 31 December 2017).
As at 31 December 2018, the weighted average period to maturity of the Agency’s cash and cash equivalents and investments holdings for euro and US dollar was 48 days and 81 days, respectively (35 days and 59 days, respectively at 31 December 2017).
Interest rate risk management
The Agency seeks to earn a risk adjusted competitive market rate of return on its investment portfolio; however, as stated above, capital preservation and liquidity are to be emphasized over the rate of return. Moreover, the Agency's return on the investment portfolio as a short-term fixed income investor is subject to the general level of short-term interest rates in euros and US dollars.
The investing horizon is based upon anticipated liquidity demands plus market conditions and is limited to financial assets with a maturity period of one year or less. Within these settings, during 2018, the Agency earned an average rate of 0.11% per annum on its euro cash and investments (0.02% per annum in 2017) and an average rate of 1.89% per annum on its US dollar cash and investments (0.99% per annum in 2017). The Agency (as with any short-term fixed income investor) is exposed to changes in interest rates on floating rate financial assets and as fixed rate financial assets mature and require reinvestment.
NOTE 42: Commitments
Commitments include purchase orders and service contracts that are not delivered as at end of the reporting period. As on 31 December 2018, the Agency had commitments of €106.623 million (€102.174 million as at 31 December 2017). The details of commitments by funding source are provided below:
(expressed in euro'000s)
Fund Group 31-12-2018 31-12-2017
Regular Budget Fund and Working Capital Fund 21 078 25 441
Major Capital Investment Fund 5 779 7 247
Technical Cooperation Fund 23 328 32 513
Technical Cooperation Extrabudgetary Fund 3 852 6 228
Extrabudgetary Programme Fund 29 222 30 299
Low Enriched Uranium Bank * 23 325 437
Trust Funds and Special Funds 38 9
Total commitments 106 622 102 174
* The commitments associated with the Low Enriched Uranium (LEU) Bank include the signing of a contract in August 2018 for the purchase of LEU. As no delivery of LEU occurred during 2018, the total amount of the contract is included in the commitments shown above.

GC(63)/6 Page 113
Capital commitments
Out of the above, capital commitments were as follows:
(expressed in euro'000s)
31-12-2018 31-12-2017
Scientific and Technical Equipment 10 119 12 146
Construction Contracts 14 644 56
Communications & IT Equipment 2 018 3 598
Software 552 1 485
Security & Safety Equipment 43 194
Furniture and Fixtures 52 7
Vehicles 21 166
Total capital commitments 27 449 17 652
Operating lease commitments
The following table gives the details of the Agency’s operating leases:
(expressed in euro'000s)
31-12-2018 31-12-2017
Office facility operating leases 2 997 3 304
Other leases 1 785 2 273
Total operating lease commitments 4 782 5 577
Operating lease commitments by term
Less than one year 1 103 1 519
One to five years 2 232 2 675
Over five years 1 447 1 383
Total operating lease commitments 4 782 5 577
Office facility operating lease commitments pertain to the Agency’s offices, primarily in New York, Toronto, Geneva and Tokyo. The value of future lease commitments is lower in 2018 as compared to 2017 mainly due near future expiry of accommodation leases (Argentina, Canada and Tokyo).
Other leases primarily represent the rental of office equipment such as photocopiers, book binding and printing equipment. The decrease in the value of these commitments is primarily due to near future expiry of leases for book binding and printing systems equipment.
NOTE 43: Contingent liabilities and contingent assets
Contingent liabilities
As at 31 December 2018, there were appeal cases against the Agency with the ILOAT relating to claims of current or former staff members in which it is has been determined that it is possible, but not probable that the cases will be decided in favour of the current or former staff members. If the claimants for these unresolved cases are ultimately successful, it is estimated that the cost to the Agency could be approximately €0.375 million.

GC(63)/6 Page 114
The Agency has contingent liabilities amounting to €9.424 million related to post-employment and other long-term employment benefits for staff employed in the Commissary, all of whom hold Agency employment contracts; however, the Commissary is responsible for paying these post-employment benefits as they become due. As the Commissary continues to be a going concern with sufficient funds and ability to pay these post-employment and other long-term employment benefits, no accrual for these liabilities has been made. Please refer to Note 37 for further details.
The Agency has a potential liability related to the decommissioning and decontamination of the NML facilities in Seibersdorf. While the Agency believes it continues to have a constructive obligation for such decommissioning and decontamination, the estimate of the amounts that the Agency would ultimately incur in satisfaction of these obligations cannot be reliably measured or estimated at this time.
Contingent assets
The Agency’s contingent assets, totaling €25.241 million, consist primarily of pledges where the amount of the pledge is based on an estimate for which funds have not been received (€8.481 million), pledges received that have not yet been formally accepted by the Agency (€4.105 million), and cases where a signed contribution agreement exists but the Agency is not in a position to invoice the donor yet or receipt against the contributions is not virtually certain (€12.655 million, of which €1.282 million are subject to further parliamentary approvals from the donors).
NOTE 44: Events after the reporting date
The Agency’s reporting date is 31 December 2018. The financial statements were authorized for issuance by the Director General on 9 March 2019.
There were no significant events impacting the financial statements, favorable or unfavorable, between the reporting date and the financial statements issuance date. However, it should be noted that a payment towards to Regular Budget was received in January 2019, which impacted the estimate for the allowance for doubtful debts. As a result, the allowance account was adjusted as of reporting date.
NOTE 45: Ex-gratia payments
No ex-gratia payments have been made during the reporting period.

GC(63)/6 Page 115
Part IV
Annexes to the Financial Statements

GC(63)/6 Page 117
ANNEX A1:
AIPS Agency-wide Information System for Programme Support
ASHI After Service Health Insurance
BMS Buildings Management Services
CDMS Containment Data Management System
CIP Construction in Progress
CIRS Computerized Inspection Reporting System
CTBTO Preparatory Commission for the Comprehensive Nuclear-Test-Ban Treaty Organization
DASSTA Destructive Analysis Sample Status Tracking Services
EBF Extrabudgetary Programme Fund
FAO Food and Agriculture Organization
FAR Field Activity Reporting
GC General Conference
IAEA International Atomic Energy Agency
IAS International Accounting Standard
ICTP International Centre for Theoretical Physics
ICSC International Civil Servant Commission
IFRS International Financial Reporting Standard
ILO International Labour Organization
ILOAT International Labour Organization Administrative Tribunal
INPRO Innovative Nuclear Reactors and Fuel Cycles
IPSAS International Public Sector Accounting Standards
IT Information Technology
LEU Low Enriched Uranium
MCIF Major Capital Investment Fund
MCIP Major Capital Investment Plan
MBES Material Balance Evaluation System
MOSAIC Modernization of the Safeguards Information Technology
MP Major Programme
MRRF Major Repairs and Replacements Fund
NML Nuclear Material Laboratory, Seibersdorf
NPCs National Participation Costs
NSF Nuclear Security Fund
PP&E Property, plant and equipment
ReNuAL Renovation of the Nuclear Applications Laboratories
RBF Regular Budget Fund
SAL Seibersdorf Analytical Laboratory
SEEIS Safeguards Effectiveness and Evaluation Information System
SGIM Department of Safeguards, Division of Information Management
SIR Safeguards Implementation Report
LIST OF ACRONYMS

GC(63)/6 Page 118
SSDH State Supplied Data Handling
TACC Technical Assistance and Cooperation Committee
TCF Technical Cooperation Fund
UN United Nations
UNESCO United Nations Educational, Scientific and Cultural Organization
UNIDO United Nations Industrial Development Organization
UNJSPF United Nations Joint Staff Pension Fund
UNORE United Nations Operational Rates of Exchange
UNOV United Nations Office in Vienna
VBOs VIC Based Organizations
VIC Vienna International Centre
WCF Working Capital Fund
ANNEX A1 (continued)LIST OF ACRONYMS

GC(63)/6 Page 119
ANNEX A2
EB RB EB TC
I. Member States
Afghanistan 19 365 5 140 - - - 24 505
Albania 26 984 6 853 25 636 - 130 000 189 473
Algeria 522 814 132 781 49 822 - 57 202 762 619
Angola 32 275 8 567 - - - 40 842
Antigua and Barbuda 7 242 - 7 074 - - 14 316
Argentina 3 056 533 735 006 64 506 - - 3 856 045
Armenia 20 238 5 140 104 374 - - 129 752
Australia 8 278 233 1 926 605 - 130 737 - 10 335 575
Austria 2 550 825 593 658 - - - 3 144 483
Azerbaijan 195 634 49 686 54 832 - - 300 152
Bahamas 47 073 - 7 360 - - 54 433
Bahrain 152 080 - 22 665 - - 174 745
Bangladesh 32 275 8 567 - - - 40 842
Barbados 25 346 - 9 855 - - 35 201
Belarus 182 141 46 259 74 328 - - 302 728
Belgium 3 132 405 729 010 - 645 000 - 4 506 415
Belize 3 372 857 21 355 - - 25 584
Benin 9 683 2 570 - - - 12 253
Bolivia, Plurinational State of 37 103 9 423 27 586 - - 74 112
Bosnia and Herzegovina 40 476 10 280 32 156 - - 82 912
Botswana 43 849 11 136 31 965 - 48 020 134 970
Brazil 13 102 479 594 622 73 914 47 814 - 13 818 829
Brunei Darussalam 101 386 - 16 611 - - 117 997
Bulgaria 145 039 36 836 30 010 29 100 - 240 985
Burkina Faso 12 910 3 427 - - - 16 337
Burundi 3 227 - - - - 3 227
Cambodia 12 910 3 427 - - - 16 337
Cameroon 33 730 - 30 344 - - 64 074
Canada 10 343 188 2 407 186 - 1 871 835 - 14 622 208
Central African Republic 3 227 857 - - 4 301 8 385
Chad 16 137 1 000 - - - 17 137
Chile 1 367 960 328 954 60 981 14 518 8 640 1 781 053
China 25 705 576 6 528 529 81 745 940 495 15 865 33 272 210
Colombia 1 045 627 19 960 35 197 - - 1 100 784
Congo 21 726 - 20 765 - - 42 491
REVENUE FROM CONTRIBUTIONSFOR THE PERIOD ENDING 31 DECEMBER 2018
(expressed in euro)
Donors Regular Budget
(RB)
Technical Cooperation Fund (TCF)
National Participation
Costs (NPCs)
Extrabudgetary (EB) a/
Total

GC(63)/6 Page 120
ANNEX A2 (continued)
EB RB EB TC
Costa Rica 151 785 - 44 011 - 44 771 240 567
Côte d'Ivoire 30 358 7 570 21 565 - - 59 493
Croatia 320 435 81 382 34 797 - - 436 614
Cuba 209 126 58 590 71 032 - - 338 748
Cyprus 150 918 35 123 - - - 186 041
Czech Republic 1 179 152 283 551 7 166 - - 1 469 869
Democratic Republic of the Congo 25 820 6 853 - - 3 139 35 812
Denmark 2 068 635 481 437 - 134 409 - 2 684 481
Djibouti 3 227 857 - - - 4 084
Dominica 3 621 - 6 624 - - 10 245
Dominican Republic 148 411 74 009 22 857 - - 245 277
Ecuador 215 873 54 826 39 789 - - 310 488
Egypt 492 457 125 071 54 271 - 88 941 760 740
El Salvador 43 850 11 136 36 432 - - 91 418
Eritrea 3 227 857 - - 3 662 7 746
Estonia 121 427 30 839 23 314 10 000 - 185 580
Eswatini 7 242 1 713 15 710 - - 24 665
Ethiopia 32 275 8 567 - - 3 025 43 866
Fiji 10 863 2 570 14 827 - - 28 260
Finland 1 615 891 376 069 - 289 060 - 2 281 020
France 17 207 979 4 004 838 - 2 326 000 - 23 538 817
Gabon 56 997 - 24 856 - - 81 853
Georgia 26 984 6 853 84 008 - - 117 845
Germany 22 626 186 5 265 827 - 982 745 - 28 874 758
Ghana 50 595 12 850 60 804 - 4 195 128 444
Greece 1 640 286 194 031 - - - 1 834 317
Guatemala 91 072 42 105 52 086 - - 185 263
Guyana 7 242 - 5 372 - - 12 614
Haiti 9 683 2 570 - - - 12 253
Holy See 3 681 1 837 - - - 5 518
Honduras 26 984 6 676 31 585 - - 65 245
Hungary 552 171 132 781 - 71 000 - 755 952
Iceland 80 975 - - - - 80 975
India 2 391 451 607 365 - 35 300 - 3 034 116
Indonesia 1 635 903 211 892 47 226 34 638 49 467 1 979 126
Donors Regular Budget
(RB)
Technical Cooperation Fund (TCF)
National Participation
Costs (NPCs)
Extrabudgetary (EB) a/
Total
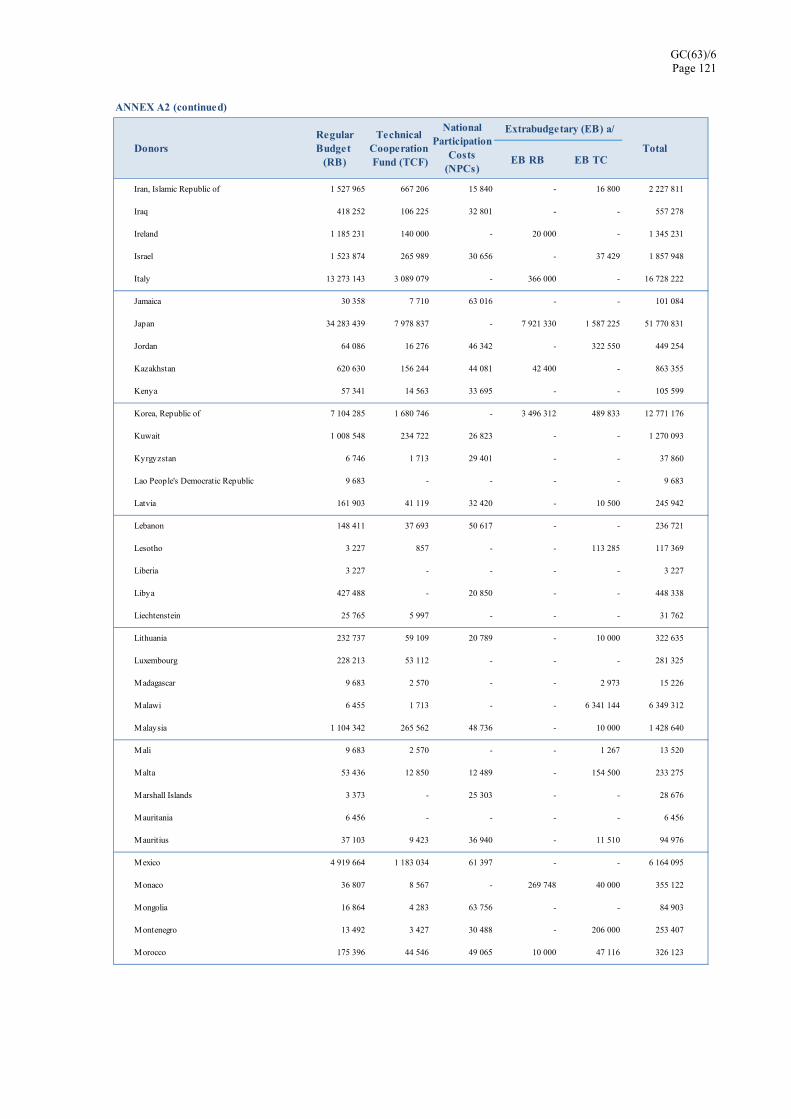
GC(63)/6 Page 121
ANNEX A2 (continued)
EB RB EB TC
Iran, Islamic Republic of 1 527 965 667 206 15 840 - 16 800 2 227 811
Iraq 418 252 106 225 32 801 - - 557 278
Ireland 1 185 231 140 000 - 20 000 - 1 345 231
Israel 1 523 874 265 989 30 656 - 37 429 1 857 948
Italy 13 273 143 3 089 079 - 366 000 - 16 728 222
Jamaica 30 358 7 710 63 016 - - 101 084
Japan 34 283 439 7 978 837 - 7 921 330 1 587 225 51 770 831
Jordan 64 086 16 276 46 342 - 322 550 449 254
Kazakhstan 620 630 156 244 44 081 42 400 - 863 355
Kenya 57 341 14 563 33 695 - - 105 599
Korea, Republic of 7 104 285 1 680 746 - 3 496 312 489 833 12 771 176
Kuwait 1 008 548 234 722 26 823 - - 1 270 093
Kyrgyzstan 6 746 1 713 29 401 - - 37 860
Lao People's Democratic Republic 9 683 - - - - 9 683
Latvia 161 903 41 119 32 420 - 10 500 245 942
Lebanon 148 411 37 693 50 617 - - 236 721
Lesotho 3 227 857 - - 113 285 117 369
Liberia 3 227 - - - - 3 227
Libya 427 488 - 20 850 - - 448 338
Liechtenstein 25 765 5 997 - - - 31 762
Lithuania 232 737 59 109 20 789 - 10 000 322 635
Luxembourg 228 213 53 112 - - - 281 325
Madagascar 9 683 2 570 - - 2 973 15 226
Malawi 6 455 1 713 - - 6 341 144 6 349 312
Malaysia 1 104 342 265 562 48 736 - 10 000 1 428 640
Mali 9 683 2 570 - - 1 267 13 520
Malta 53 436 12 850 12 489 - 154 500 233 275
Marshall Islands 3 373 - 25 303 - - 28 676
Mauritania 6 456 - - - - 6 456
Mauritius 37 103 9 423 36 940 - 11 510 94 976
Mexico 4 919 664 1 183 034 61 397 - - 6 164 095
Monaco 36 807 8 567 - 269 748 40 000 355 122
Mongolia 16 864 4 283 63 756 - - 84 903
Montenegro 13 492 3 427 30 488 - 206 000 253 407
Morocco 175 396 44 546 49 065 10 000 47 116 326 123
Extrabudgetary (EB) a/
Total Donors Regular Budget
(RB)
Technical Cooperation Fund (TCF)
National Participation
Costs (NPCs)

GC(63)/6 Page 122
ANNEX A2 (continued)
EB RB EB TC
Mozambique 12 910 3 427 - - 4 517 20 854
Myanmar 32 275 8 567 - - - 40 842
Namibia 33 730 8 567 35 257 - 30 000 107 554
Nepal 19 365 - - - - 19 365
Netherlands 5 248 889 1 221 583 - 541 030 - 7 011 502
New Zealand 949 656 - - 272 974 - 1 222 630
Nicaragua 12 910 3 427 43 117 - - 59 454
Niger 6 455 1 713 - - - 8 168
Nigeria 677 971 172 187 42 258 - 78 784 971 200
North Macedonia b/ 23 611 5 997 63 579 - - 93 187
Norway 3 007 250 699 883 - 232 062 - 3 939 195
Oman 394 683 93 375 47 902 - - 535 960
Pakistan 300 196 76 242 133 111 6 000 60 000 575 549
Palau 3 563 857 12 056 - - 16 476
Panama 111308.53 28 269 24 676 - - 164 254
Papua New Guinea 14 484 3 427 35 618 - - 53 529
Paraguay 43 850 11 136 47 486 - - 102 472
Peru 441 863 55 480 42 524 - - 539 867
Philippines 536 307 136 207 35 200 - 323 504 1 031 218
Poland 2 728 751 693 030 17 791 10 000 - 3 449 572
Portugal 1 365 095 322 957 791 25 000 - 1 713 843
Qatar 953 338 213 511 16 613 - - 1 183 462
Republic of Moldova 13 492 3 427 33 982 - - 50 901
Romania 597 020 151 627 45 081 20 000 - 813 728
Russian Federation 10935809.4 2 545 106 - 1 344 945 718 764 15 544 624
Rwanda 6 455 5 100 - - 4 503 16 058
San Marino 10 863 - - - - 10 863
Saudi Arabia 3 929 319 944 885 30 443 8 370 000 45 000 13 319 647
Senegal 16 137 3 000 - - - 19 137
Serbia 104562.61 26 556 52 717 - 150 000 333 836
Seychelles 3 563 900 24 262 - 2 093 30 818
Sierra Leone 3 227 - - - - 3 227
Singapore 1 582 766 368 360 9 639 - - 1 960 765
Slovakia 519 440 131 924 14 957 30 000 - 696 321
Slovenia 298145.38 69 389 16 249 10 000 - 393 783
South Africa 1 180 547 299 828 34 001 18 000 408 144 1 940 520
Spain 8 653 673 100 000 - 340 720 200 000 9 294 393
Sri Lanka 101 189 25 700 36 835 - - 163 724
Sudan 32274.7 8 567 - 81 000 25 205 147 047
Sweden 3386380.66 788 118 - 310 439 - 4 484 938
Extrabudgetary (EB) a/
Total Donors Regular Budget (RB) Technical
Cooperation Fund (TCF)
National Participation
Costs (NPCs)

GC(63)/6 Page 123
ANNEX A2 (continued)
EB RB EB TC
Switzerland4 037 894 940 000 - 156 218 100 000 5 234 112
Syrian Arab Republic 77 578 39 233 38 191 - - 155 002
Tajikistan 13 492 - 114 430 - - 127 922
Thailand 944437.66 239 862 38 053 - - 1 222 353
Togo 3 227 - - - - 3 227
Trinidad and Tobago 119 490 - 4 591 - - 124 081
Tunisia 91 072 23 130 37 604 - 5 324 157 130
Turkey 3 302 159 760 000 - - - 4 062 159
Turkmenistan 90524.23 - - - - 90 524
Uganda 29 049 7 710 - - 4 949 41 708
Ukraine 333 927 84 808 66 961 - - 485 696
United Arab Emirates 2 138 568 497 714 18 816 49 958 - 2 705 056
United Kingdom of Great Britain and Northern Ireland
15 805 567 3 678 454 - 5 999 958 - 25 483 978
United Republic of Tanzania 32274.74 10 067 - - - 42 342
United States of America 92 021 242 21 243 635 - 57 291 900 4 711 722 175 268 498
Uruguay 270 742 65 105 38 661 - - 374 508
Uzbekistan 74 205 18 846 97 529 - 5 000 195 580
Vanuatu 3 227 - - - - 3 227
Venezuela, Bolivarian Republic of 1851771.75 - 38 834 - - 1 890 606
Viet Nam 180 742 47 972 46 526 - - 275 240
Yemen 32 275 - - - - 32 275
Zambia 22 593 5 997 - - - 28 590
Zimbabwe 13 492 3 427 59 472 - 15 073 91 464
Sub-total 362 094 024 79 331 012 3 852 731 94 798 644 16 755 942 556 832 352 II.
New Member StatesGrenada 3 608 - - - - 3 608 Saint Vincent and the Grenadines 3 622 - - - - 3 622
Sub-total 7 230 - - - - 7 230 III.
Other DonorsEuropean Commission - - - 4 757 906 703 430 5 461 336 International Organizations - - - 216 230 129 825 346 055 Other Sources - - - 253 881 26 378 280 259
Sub-total - - - 5 228 017 859 633 6 087 650
GRAND TOTAL 362 101 254 79 331 012 3 852 731 100 026 660 17 615 575 562 927 232
a/ Excludes refunds.b/ The name "North Macedonia" replaces the former name "The former Yugoslav Republic of Macedonia".
Total Donors Regular Budget (RB) Technical
Cooperation Fund (TCF)
National Participation
Costs (NPCs)
Extrabudgetary (EB) a/

GC(63)/6 Page 124
AN
NE
X A
3
EB
RB
E
B T
C
I.M
embe
r S
tate
s
Afg
hani
stan
-
38
552
-
-
-
-
-
38
552
Alb
ania
-
-
-
-
-
-
-
-
Alg
eria
-
-
-
25
376
-
-
-
25
376
Ang
ola
-
32
440
8 5
67
-
-
-
-
41
007
Ant
igua
and
Bar
buda
-
14
476
-
1 3
06
-
-
-
15
782
Arg
entin
a
-
3
070
261
922
340
1
871
-
-
-
3
994
472
Arm
enia
-
-
-
-
-
-
-
-
Aus
tral
ia
-
-
-
-
-
-
-
-
A
ustr
ia
-
-
-
-
-
-
-
-
A
zerb
aija
n
-
-
-
-
-
-
-
-
B
aham
as
-
9
3 75
7
-
7
360
-
-
-
1
01 1
17
Bah
rain
-
-
-
-
-
-
-
-
Ban
glad
esh
-
-
-
-
-
-
-
-
Bar
bado
s
-
5
2 71
4
-
4
927
-
-
-
5
7 64
1 B
elar
us
-
-
-
-
-
-
-
-
B
elgi
um
-
-
-
-
-
7
5 00
0
-
7
5 00
0 B
eliz
e
-
-
-
-
-
-
-
-
B
enin
-
-
-
-
-
-
-
-
Bol
ivia
, Plu
rinat
iona
l Sta
te o
f
-
1
00 5
16
-
15
952
243
596
-
-
3
60 0
64
Bos
nia
and
Her
zego
vina
-
153
223
-
-
-
-
-
1
53 2
23
Bot
swan
a
-
-
-
-
-
-
-
-
B
razi
l
-
11
809
833
-
-
-
-
-
11
809
833
B
rune
i Dar
ussa
lam
-
-
21
114
-
-
-
-
21
114
Bul
garia
-
-
-
-
-
-
-
-
Bur
kina
Fas
o
-
1
17
-
-
-
-
-
117
B
urun
di
-
7
784
-
-
-
-
-
7
784
C
ambo
dia
-
-
-
-
-
-
-
-
Cam
eroo
n
-
1
43 3
99
-
15
574
-
-
-
158
973
C
anad
a
-
-
-
-
-
9
159
-
9
159
C
entr
al A
fric
an R
epub
lic
-
5
455
-
-
-
-
-
5
455
C
had
-
14
032
1 0
00
-
-
-
-
15
032
Chi
le
-
1
146
931
-
-
-
-
-
1 14
6 93
1 C
hina
-
-
-
-
-
-
-
-
Col
ombi
a
-
2
077
832
-
-
-
8 1
80
-
2 08
6 01
2 C
ongo
1
52
59
736
-
-
-
-
-
59
888
Cos
ta R
ica
-
147
362
-
-
-
-
-
1
47 3
62
Côt
e d'
Ivoi
re
-
5
6 38
2
-
-
-
-
-
5
6 38
2 C
roat
ia
-
-
-
-
-
-
-
-
C
uba
-
427
272
-
3
6 35
4
-
-
-
4
63 6
26
Cyp
rus
-
-
-
-
-
-
-
-
STA
TU
S O
F O
UT
STA
ND
ING
CO
NT
RIB
UT
ION
SFO
R T
HE
PE
RIO
D E
ND
ING
31
DE
CE
MB
ER
201
8(e
xpre
ssed
in e
uros
)
Don
ors
Wor
king
Cap
ital
Fund
(WC
F)
Reg
ular
Bud
get
(RB
)
Ext
rabu
dget
ary
(EB
)
Tot
al
Tec
hnic
al
Coo
pera
tion
Fund
(T
CF)
Nat
iona
l Pa
rtic
ipat
ion
Cos
ts (N
PCs)
Ass
esse
d Pr
ogra
mm
e C
osts
(A
PC
s)

GC(63)/6 Page 125
AN
NE
X A
3 (c
onti
nued
)
EB
RB
E
B T
C
Cze
ch R
epub
lic
-
-
-
-
-
-
-
-
D
emoc
rati
c R
epub
lic o
f th
e C
ongo
-
-
-
-
-
-
-
-
Den
mar
k
-
-
-
-
-
-
-
-
D
jibou
ti
-
-
-
-
-
-
-
-
D
omin
ica
-
-
-
13
054
-
-
-
13
054
Dom
inic
an R
epub
lic 3
194
1
982
666
-
-
179
240
-
-
2
165
100
Ecu
ador
-
216
988
5
4 82
6 1
020
-
-
-
2
72 8
34
Egy
pt
-
-
-
-
-
-
-
-
El S
alva
dor
1 1
32
875
116
-
3
0 07
2 1
0 90
0
-
-
9
17 2
20
Eri
trea
-
-
-
-
-
-
-
-
Est
onia
-
-
-
-
-
-
-
-
Esw
atin
i
-
8
901
-
7
855
-
-
-
1
6 75
6 E
thio
pia
-
-
-
-
-
-
-
-
Fiji
-
10
920
-
6 2
31
-
-
-
17
151
Fin
land
-
-
-
-
-
-
-
-
Fra
nce
-
-
-
-
-
-
-
-
Gab
on
-
4
02 8
46
-
32
785
-
-
-
435
631
G
eorg
ia
-
-
-
-
-
-
-
-
G
erm
any
-
-
-
-
-
-
-
-
Gha
na
-
-
-
3
6 68
5
-
-
-
3
6 68
5 G
reec
e
-
-
-
-
-
-
-
-
G
uate
mal
a
-
5
20 2
48
-
8 7
85
128
350
-
-
6
57 3
83
Guy
ana
304
2
1 49
7
-
5
372
-
-
-
2
7 17
3 H
aiti
-
533
-
-
-
-
-
5
33
Hol
y S
ee
-
-
-
-
-
-
-
-
H
ondu
ras
-
-
-
-
-
-
-
-
Hun
gary
-
-
-
-
-
30
000
-
30
000
Icel
and
-
-
-
-
-
-
-
-
Indi
a
-
-
-
-
-
-
-
-
In
done
sia
-
-
-
-
-
-
-
-
Iran
, Isl
amic
Rep
ublic
of
-
2 47
8 75
7
-
-
-
-
-
2
478
757
Iraq
-
678
089
-
-
-
-
-
6
78 0
89
Irel
and
-
-
-
-
-
-
-
-
Isra
el
-
-
-
-
-
-
-
-
It
aly
-
-
-
-
-
90
000
-
90
000
Jam
aica
-
-
-
7 4
24
-
-
-
7 4
24
Jap
an
-
-
-
-
-
8
75 0
38
-
875
038
Jo
rdan
-
64
417
-
-
-
-
-
64
417
Kaz
akhs
tan
-
-
-
-
-
-
-
-
Ken
ya
-
-
-
-
-
-
-
-
Kor
ea, R
epub
lic o
f
-
-
-
-
-
-
-
-
K
uwai
t
-
-
7
45
56
-
-
-
801
K
yrg
yzs
tan
-
-
-
-
-
-
-
-
Lao
Peo
ple
's D
emoc
rati
c R
epub
lic
-
9
733
-
-
-
-
-
9
733
L
atvi
a
-
-
-
-
-
-
-
-
Don
ors
Wor
kin
g C
apit
al
Fun
d (W
CF
) R
egul
ar B
udge
t (R
B)
Tec
hnic
al
Coo
pera
tion
Fun
d (T
CF
)
Nat
iona
l P
arti
cipa
tion
C
osts
(N
PC
s)
Ass
esse
d P
rogr
amm
e C
osts
(A
PC
s)
Ext
rabu
dget
ary
(EB
)
Tot
al
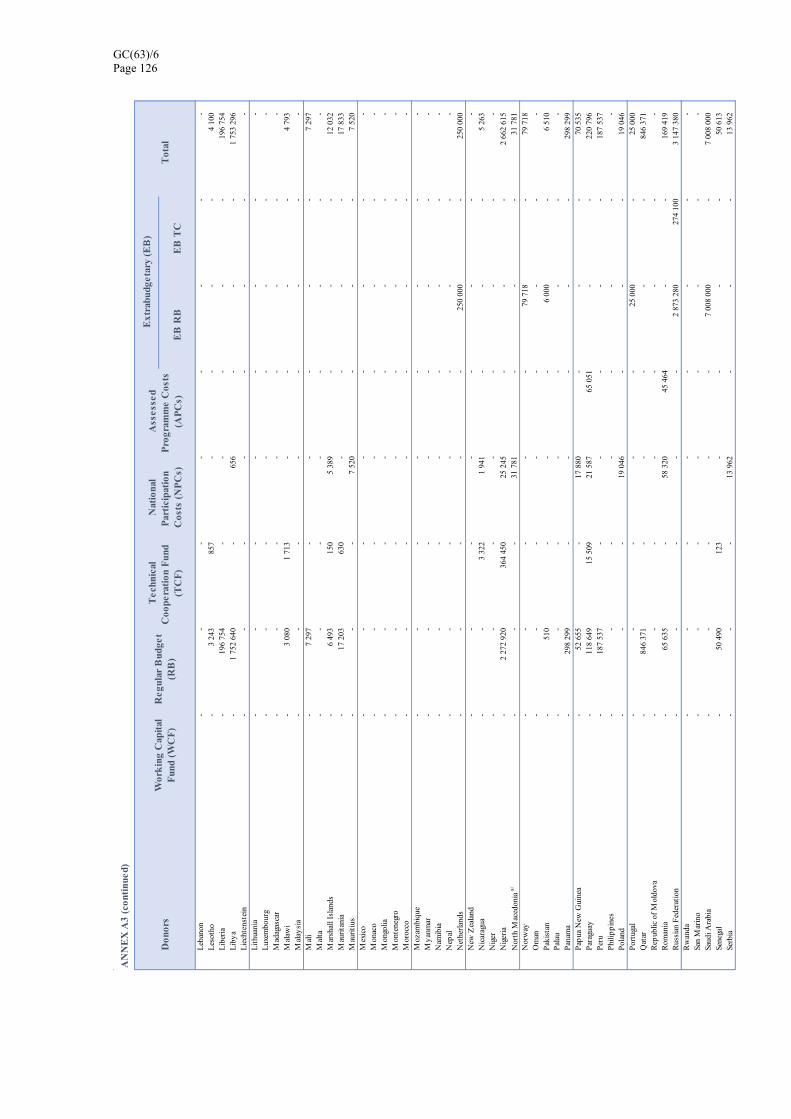
GC(63)/6 Page 126
AN
NE
X A
3 (c
onti
nued
)
EB
RB
E
B T
C
Leb
anon
-
-
-
-
-
-
-
-
Les
otho
-
3 2
43
857
-
-
-
-
4
100
L
iber
ia
-
1
96 7
54
-
-
-
-
-
196
754
L
iby
a
-
1
752
640
-
656
-
-
-
1
753
296
Lie
chte
nste
in
-
-
-
-
-
-
-
-
L
ithu
ania
-
-
-
-
-
-
-
-
Lux
embo
urg
-
-
-
-
-
-
-
-
Mad
agas
car
-
-
-
-
-
-
-
-
Mal
awi
-
3 0
80
1 7
13
-
-
-
-
4 7
93
Mal
aysi
a
-
-
-
-
-
-
-
-
M
ali
-
7 2
97
-
-
-
-
-
7 2
97
Mal
ta
-
-
-
-
-
-
-
-
M
arsh
all I
slan
ds
-
6
493
1
50
5 3
89
-
-
-
12
032
Mau
rita
nia
-
17
203
630
-
-
-
-
1
7 83
3 M
auri
tius
-
-
-
7 5
20
-
-
-
7 5
20
Mex
ico
-
-
-
-
-
-
-
-
Mon
aco
-
-
-
-
-
-
-
-
Mon
golia
-
-
-
-
-
-
-
-
Mon
tene
gro
-
-
-
-
-
-
-
-
Mor
occo
-
-
-
-
-
-
-
-
Moz
ambi
que
-
-
-
-
-
-
-
-
My
anm
ar
-
-
-
-
-
-
-
-
N
amib
ia
-
-
-
-
-
-
-
-
N
epal
-
-
-
-
-
-
-
-
Net
herl
ands
-
-
-
-
-
250
000
-
2
50 0
00
New
Zea
land
-
-
-
-
-
-
-
-
Nic
arag
ua
-
-
3
322
1
941
-
-
-
5
263
N
iger
-
-
-
-
-
-
-
-
Nig
eria
-
2 27
2 92
0 3
64 4
50
25
245
-
-
-
2 66
2 61
5
Nor
th M
aced
onia
a/
-
-
-
3
1 78
1
-
-
-
3
1 78
1 N
orw
ay
-
-
-
-
-
7
9 71
8
-
7
9 71
8 O
man
-
-
-
-
-
-
-
-
Pak
ista
n
-
5
10
-
-
-
6 0
00
-
6 5
10
Pal
au
-
-
-
-
-
-
-
-
P
anam
a
-
2
98 2
99
-
-
-
-
-
298
299
P
apua
New
Gui
nea
-
52
655
-
17
880
-
-
-
70
535
Par
agua
y
-
1
18 6
49
15
509
21
587
65
051
-
-
220
796
P
eru
-
187
537
-
-
-
-
-
1
87 5
37
Phi
lipp
ines
-
-
-
-
-
-
-
-
Pol
and
-
-
-
19
046
-
-
-
19
046
Por
tuga
l
-
-
-
-
-
2
5 00
0
-
2
5 00
0 Q
atar
-
846
371
-
-
-
-
-
8
46 3
71
Rep
ublic
of
Mol
dova
-
-
-
-
-
-
-
-
Rom
ania
-
65
635
-
58
320
45
464
-
-
169
419
R
ussi
an F
eder
atio
n
-
-
-
-
-
2
873
280
274
100
3
147
380
Rw
anda
-
-
-
-
-
-
-
-
San
Mar
ino
-
-
-
-
-
-
-
-
Saud
i Ara
bia
-
-
-
-
-
7 00
8 00
0
-
7
008
000
Sene
gal
-
50
490
123
-
-
-
-
5
0 61
3 Se
rbia
-
-
-
13
962
-
-
-
13
962
Don
ors
Wor
kin
g C
apit
al
Fun
d (W
CF
) R
egul
ar B
udge
t (R
B)
Tec
hnic
al
Coo
pera
tion
Fun
d (T
CF
)
Ass
esse
d P
rogr
amm
e C
osts
(A
PC
s)
Ext
rabu
dget
ary
(EB
)
Tot
al
Nat
iona
l P
arti
cipa
tion
C
osts
(N
PC
s)
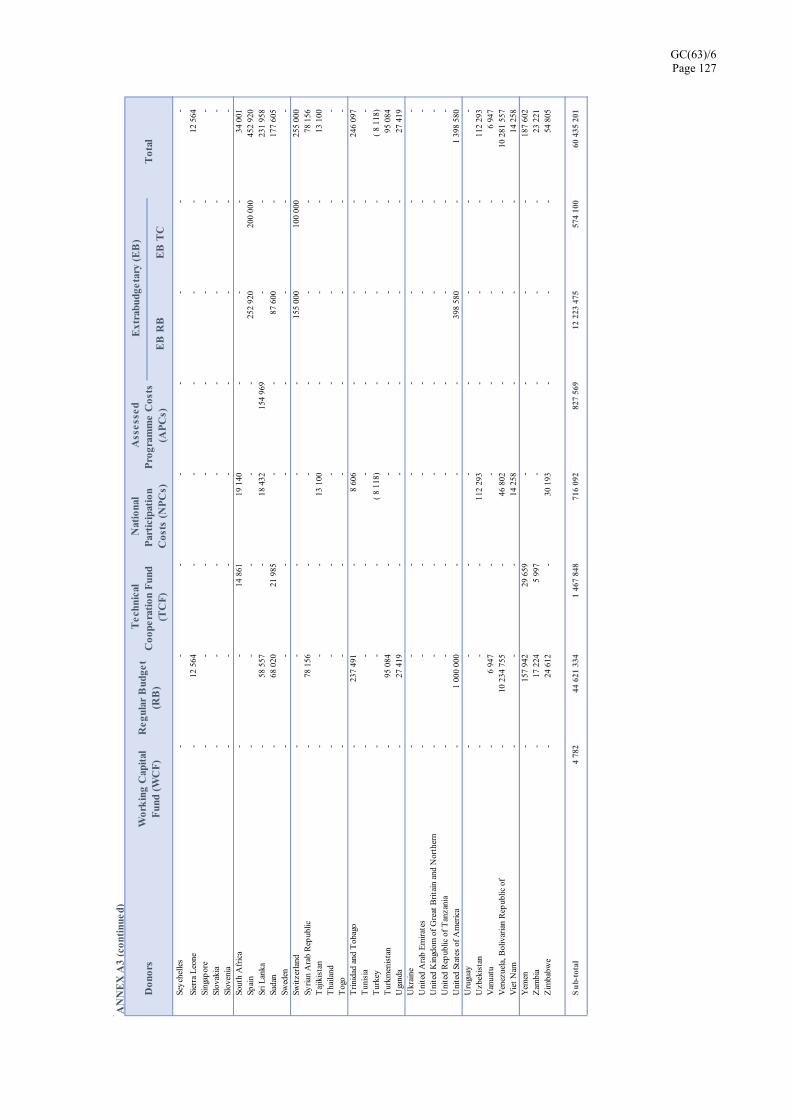
GC(63)/6 Page 127
AN
NE
X A
3 (c
onti
nued
)
EB
RB
E
B T
C
Sey
chel
les
-
-
-
-
-
-
-
-
Sier
ra L
eone
-
12
564
-
-
-
-
-
12
564
Sing
apor
e
-
-
-
-
-
-
-
-
Sl
ovak
ia
-
-
-
-
-
-
-
-
Sl
oven
ia
-
-
-
-
-
-
-
-
So
uth
Afr
ica
-
-
14
861
19
140
-
-
-
34
001
Spai
n
-
-
-
-
-
2
52 9
20
200
000
4
52 9
20
Sri L
anka
-
58
557
-
18
432
154
969
-
-
2
31 9
58
Suda
n
-
6
8 02
0 2
1 98
5
-
-
8
7 60
0
-
1
77 6
05
Swed
en
-
-
-
-
-
-
-
-
Sw
itze
rlan
d
-
-
-
-
-
1
55 0
00
100
000
2
55 0
00
Syri
an A
rab
Rep
ublic
-
78
156
-
-
-
-
-
78
156
Taj
ikis
tan
-
-
-
13
100
-
-
-
13
100
Tha
iland
-
-
-
-
-
-
-
-
Tog
o
-
-
-
-
-
-
-
-
T
rini
dad
and
Tob
ago
-
237
491
-
8
606
-
-
-
2
46 0
97
Tun
isia
-
-
-
-
-
-
-
-
Tur
key
-
-
-
( 8
118)
-
-
-
( 8
118)
Tur
kmen
ista
n
-
9
5 08
4
-
-
-
-
-
9
5 08
4 U
gand
a
-
2
7 41
9
-
-
-
-
-
2
7 41
9 U
krai
ne
-
-
-
-
-
-
-
-
U
nite
d A
rab
Em
irat
es
-
-
-
-
-
-
-
-
U
nite
d K
ingd
om o
f G
reat
Bri
tain
and
Nor
ther
n
-
-
-
-
-
-
-
-
U
nite
d R
epub
lic o
f T
anza
nia
-
-
-
-
-
-
-
-
Uni
ted
Stat
es o
f A
mer
ica
-
1 00
0 00
0
-
-
-
3
98 5
80
-
1 39
8 58
0 U
rugu
ay
-
-
-
-
-
-
-
-
U
zbek
ista
n
-
-
-
1
12 2
93
-
-
-
112
293
V
anua
tu
-
6
947
-
-
-
-
-
6
947
V
enez
uela
, Bol
ivar
ian
Rep
ublic
of
-
10 2
34 7
55
-
46
802
-
-
-
10 2
81 5
57
Vie
t N
am
-
-
-
1
4 25
8
-
-
-
1
4 25
8 Y
emen
-
157
942
2
9 65
9
-
-
-
-
1
87 6
02
Zam
bia
-
17
224
5 9
97
-
-
-
-
23
221
Zim
babw
e
-
2
4 61
2
-
3
0 19
3
-
-
-
5
4 80
5
Su
b-to
tal
4 7
82
44 6
21 3
34
1 46
7 84
8 7
16 0
92
827
569
12
223
475
5
74 1
00
60 4
35 2
01
Don
ors
Wor
kin
g C
apit
al
Fun
d (W
CF
) R
egul
ar B
udge
t (R
B)
Tec
hnic
al
Coo
pera
tion
Fun
d (T
CF
)
Nat
iona
l P
arti
cipa
tion
C
osts
(N
PC
s)
Ass
esse
d P
rogr
amm
e C
osts
(A
PC
s)
Ext
rabu
dget
ary
(EB
) T
otal

GC(63)/6 Page 128
AN
NE
X A
3 (c
onti
nued
)
EB
RB
E
B T
C
II.
New
Mem
ber
Sta
tes
Gre
nada
152
3
640
-
-
-
-
-
3
792
Sa
int
Vin
cent
and
the
Gre
nadi
nes
152
7
239
-
-
-
-
-
7
391
Su
b-to
tal
304
1
0 87
9
-
-
-
-
-
1
1 18
3
III.
For
mer
Mem
ber
Sta
tes
Kor
ea, D
emoc
rati
c P
eop
le's
Rep
ublic
of
-
128
576
2
5 96
0
-
3
4 78
8
-
-
1
89 3
24
Su
b-to
tal
-
128
576
2
5 96
0
-
3
4 78
8
-
-
1
89 3
24
IV.
Oth
er D
onor
s
Eur
opea
n C
omm
issi
on
-
-
-
-
-
1
700
000
-
1 70
0 00
0 In
tern
atio
nal O
rgan
izat
ions
-
-
-
-
-
28
307
-
28
307
Oth
er S
ourc
es
-
-
-
-
-
1
7 52
0
-
1
7 52
0
Su
b-to
tal
-
-
-
-
-
1 74
5 82
7
-
1
745
827
GR
AN
D T
OT
AL
5 0
86
44 7
60 7
89
1 49
3 80
9 7
16 0
92
862
357
13
969
302
5
74 1
00
62 3
81 5
35
a/ T
he n
ame
"Nor
th M
aced
onia
" re
pla
ces
the
form
er n
ame
"The
for
mer
Yug
osla
v R
epub
lic o
f M
aced
onia
".
Don
ors
Wor
kin
g C
apit
al
Fun
d (W
CF
) R
egul
ar B
udge
t (R
B)
Tec
hnic
al
Coo
pera
tion
Fun
d (T
CF
)
Nat
iona
l P
arti
cipa
tion
C
osts
(N
PC
s)
Ass
esse
d P
rogr
amm
e C
osts
(A
PC
s)
Ext
rabu
dget
ary
(EB
)
Tot
al
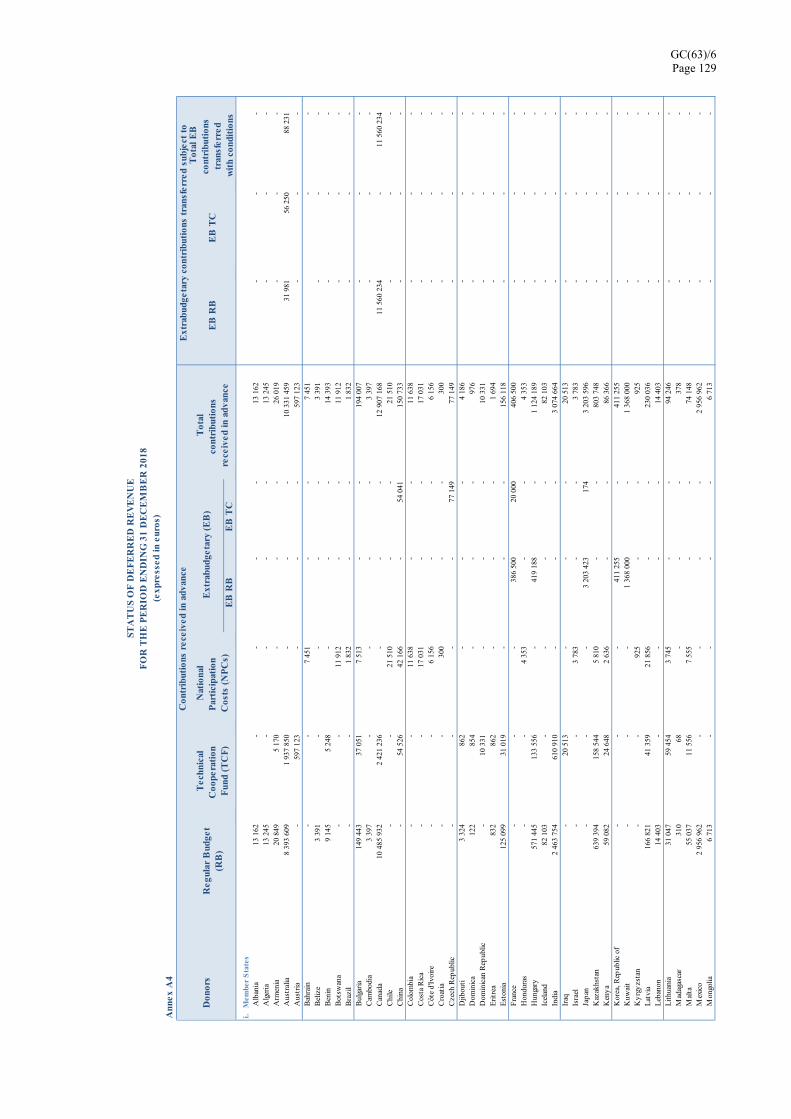
GC(63)/6 Page 129
EB
RB
E
B T
C
i.M
embe
r S
tate
s A
lban
ia
13
162
-
-
-
-
13
162
-
-
-
Alg
eria
1
3 24
5
-
-
-
-
1
3 24
5
-
-
-
A
rmen
ia
20
849
5 1
70
-
-
-
2
6 01
9
-
-
-
A
ustr
alia
8
393
609
1 93
7 85
0
-
-
-
10 3
31 4
59
31
981
56
250
88
231
Aus
tria
-
597
123
-
-
-
597
123
-
-
-
B
ahra
in
-
-
7 4
51
-
-
7 4
51
-
-
B
eliz
e 3
391
-
-
-
-
3
391
-
-
-
B
enin
9
145
5
248
-
-
-
14
393
-
-
-
Bot
swan
a
-
-
1
1 91
2
-
-
1
1 91
2
-
-
-
B
razi
l
-
-
1
832
-
-
1
832
-
-
-
B
ulga
ria
149
443
3
7 05
1 7
513
-
-
1
94 0
07
-
-
-
Cam
bodi
a 3
397
-
-
-
-
3
397
-
-
-
C
anad
a 10
485
932
2
421
236
-
-
-
12
907
168
11
560
234
-
11 5
60 2
34
Chi
le
-
-
21
510
-
-
21
510
-
-
-
Chi
na
-
5
4 52
6 4
2 16
6
-
54
041
150
733
-
-
-
C
olom
bia
-
-
11
638
-
-
11
638
-
-
-
Cos
ta R
ica
-
-
17
031
-
-
17
031
-
-
-
Côt
e d'
Ivoi
re
-
-
6 1
56
-
-
6 1
56
-
-
-
Cro
atia
-
-
3
00
-
-
300
-
-
-
C
zech
Rep
ublic
-
-
-
-
7
7 14
9 7
7 14
9
-
-
-
D
jibou
ti
3 3
24
862
-
-
-
4 1
86
-
-
-
Dom
inic
a 1
22
854
-
-
-
976
-
-
-
D
omin
ican
Rep
ublic
-
10
331
-
-
-
1
0 33
1
-
-
-
E
ritr
ea
832
8
62
-
-
-
1
694
-
-
-
E
ston
ia
125
099
3
1 01
9
-
-
-
156
118
-
-
-
F
ranc
e
-
-
-
386
500
2
0 00
0 4
06 5
00
-
-
-
Hon
dura
s
-
-
4
353
-
-
4
353
-
-
-
H
unga
ry
571
445
1
33 5
56
-
4
19 1
88
-
1
124
189
-
-
-
Ice
land
8
2 10
3
-
-
-
-
8
2 10
3
-
-
-
I
ndia
2
463
754
610
910
-
-
-
3 07
4 66
4
-
-
-
I
raq
-
2
0 51
3
-
-
-
20
513
-
-
-
Isr
ael
-
-
3 7
83
-
-
3 7
83
-
-
-
Jap
an
-
-
-
3
203
423
174
3
203
596
-
-
-
Kaz
akhs
tan
639
394
1
58 5
44
5 8
10
-
-
803
748
-
-
-
K
eny
a 5
9 08
2 2
4 64
8 2
636
-
-
8
6 36
6
-
-
-
K
orea
, Rep
ublic
of
-
-
-
4
11 2
55
-
4
11 2
55
-
-
-
Kuw
ait
-
-
-
1
368
000
-
1
368
000
-
-
-
Ky
rgy
zsta
n
-
-
9
25
-
-
925
-
-
-
L
atvi
a 1
66 8
21
41
359
21
856
-
-
230
036
-
-
-
L
eban
on
14
403
-
-
-
-
14
403
-
-
-
Lit
huan
ia
31
047
59
454
3 7
45
-
-
94
246
-
-
-
Mad
agas
car
310
6
8
-
-
-
378
-
-
-
M
alta
5
5 03
7 1
1 55
6 7
555
-
-
7
4 14
8
-
-
-
M
exic
o 2
956
962
-
-
-
-
2 95
6 96
2
-
-
-
M
ongo
lia
6 7
13
-
-
-
-
6 7
13
-
-
-
Tot
al E
B
cont
ribu
tion
s tr
ansf
erre
d w
ith
cond
itio
ns
Tot
al
cont
ribu
tion
s re
ceiv
ed in
adv
ance
E
B R
B
EB
TC
STA
TU
S O
F D
EF
ER
RE
D R
EV
EN
UE
FO
R T
HE
PE
RIO
D E
ND
ING
31
DE
CE
MB
ER
201
8(e
xpre
ssed
in e
uros
)A
nnex
A4
Don
ors
Con
trib
utio
ns r
ecei
ved
in a
dvan
ce
Ext
rabu
dget
ary
cont
ribu
tion
s tr
ansf
erre
d su
bjec
t to
Reg
ular
Bud
get
(RB
)
Tec
hnic
al
Coo
pera
tion
F
und
(TC
F)
Nat
iona
l P
arti
cipa
tion
C
osts
(N
PC
s)
Ext
rabu
dget
ary
(EB
)

GC(63)/6 Page 130
EB
RB
E
B T
C
Mon
tene
gro
17
377
4 3
09
-
-
-
2
1 68
6
-
-
-
Mor
occo
-
-
7 6
20
-
-
7 6
20
-
-
-
M
ozam
biqu
e 6
08
-
-
-
-
608
-
-
-
Nam
ibia
-
-
-
-
9 6
69
9 6
69
-
-
-
N
ethe
rland
s5
322
054
1 22
8 71
2
-
-
1
26 2
60
6 67
7 02
6
-
-
-
New
Zea
land
962
894
-
-
-
-
9
62 8
94
-
-
-
N
iger
-
1
723
-
-
-
1 7
23
-
-
-
N
orw
ay
-
-
-
-
-
-
6
37 2
22
-
6
37 2
22
Om
an 4
01 8
01
93
920
328
-
-
4
96 0
49
-
-
-
Pa
kist
an
-
-
6
807
-
-
6
807
-
-
-
Pala
u 1
6 60
2
-
-
-
-
1
6 60
2
-
-
-
Pana
ma
-
8
78
5 2
95
-
-
6 1
72
-
-
-
Pe
ru
-
-
1
5 63
8
-
-
1
5 63
8
-
-
-
Phili
ppin
es
-
-
-
-
4
400
4
400
-
-
-
Port
ugal
7 3
42
-
-
-
-
7 3
42
-
-
-
R
epub
lic o
f Mol
dova
1 6
29
-
-
-
-
1 6
29
-
-
-
R
wan
da 6
454
-
-
-
-
6
454
-
-
-
Saud
i Ara
bia
488
439
-
-
-
-
4
88 4
39
-
-
-
Si
ngap
ore
1 60
3 96
6 3
70 5
10
2 3
92
-
-
1 97
6 86
8
-
-
-
Slov
akia
290
000
-
-
-
-
2
90 0
00
-
-
-
Sl
oven
ia 2
66 4
94
69
794
2 2
50
-
-
338
538
-
-
-
Spai
n8
769
377
-
-
-
-
8 76
9 37
7
-
-
-
Swed
en
-
-
-
192
864
-
192
864
3
60 7
85
192
123
5
52 9
08
Tha
iland
963
351
2
10 6
02
-
3
6 94
1
-
1 21
0 89
4
-
-
-
Tog
o 5
816
-
-
-
-
5
816
-
-
-
Tur
key
-
-
3 1
24
-
-
3 1
24
-
-
-
U
krai
ne 3
44 0
22
85
303
996
-
-
4
30 3
21
-
-
-
U
nite
d A
rab
Emira
tes
-
-
984
-
-
9
84
-
-
-
U
nite
d K
ingd
om o
f Gre
at B
ritai
n 16
023
703
3
699
924
-
-
-
19
723
627
-
-
-
Uni
ted
Rep
ublic
of T
anza
nia
701
-
-
-
13
839
14
540
-
-
-
U
nite
d St
ates
of A
mer
ica
-
-
-
10
274
349
-
10 2
74 3
49
-
-
-
U
rugu
ay 1
1 56
0
-
-
-
-
1
1 56
0
-
-
-
Uzb
ekis
tan
36
022
-
-
-
5
0 00
0 8
6 02
2
-
-
-
Sub
-tot
al61
808
830
11
928
415
2
23 6
06
16 2
92 5
20
355
532
90
608
902
12
590
222
2
48 3
73
12 8
38 5
95
ii.
Oth
er D
onor
s
Euro
pean
Com
mis
sion
-
-
-
-
-
-
29 9
25 1
19
350
960
30
276
079
In
tern
atio
nal O
rgan
izat
ions
-
-
-
2
43 6
49
-
2
43 6
49
-
-
-
O
ther
Sou
rces
-
-
-
3
500
-
3 5
00
-
-
-
Sub
-tot
al
-
-
-
247
149
-
247
149
29
925
119
3
50 9
60
30 2
76 0
79
GR
AN
D T
OT
AL
61 8
08 8
30
11 9
28 4
15
223
606
16
539
668
3
55 5
32
90 8
56 0
51
42 5
15 3
41
599
333
43
114
674
EB
RB
E
B T
C
Tot
al E
B
cont
ribu
tion
s
Ann
ex A
4 (c
onti
nued
)
Don
ors
Con
trib
utio
ns r
ecei
ved
in a
dvan
ce
Ext
rabu
dget
ary
cont
ribu
tion
s tr
ansf
erre
d su
bjec
t to
R
egul
ar B
udge
t (R
B)
Tec
hnic
al
Coo
pera
tion
N
atio
nal
Par
tici
pati
on
Ext
rabu
dget
ary
(EB
) T
otal
co
ntri
buti
ons
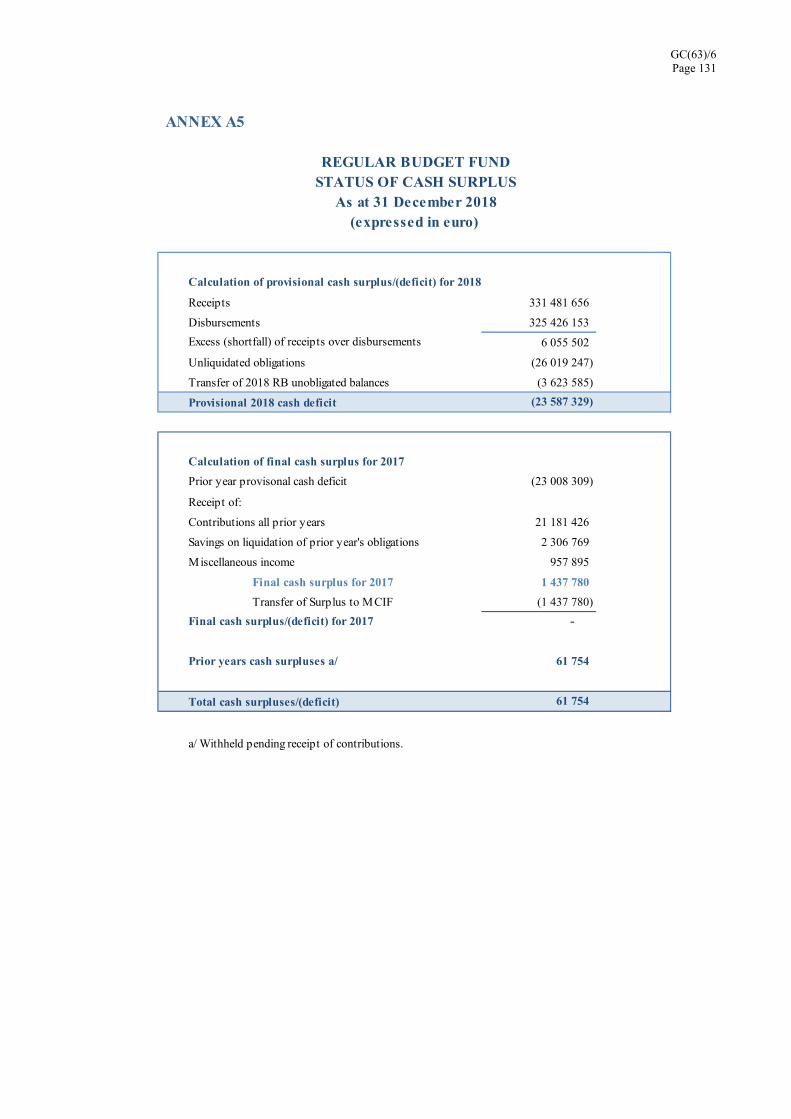
GC(63)/6 Page 131
Calculation of provisional cash surplus/(deficit) for 2018
Receipts 331 481 656
Disbursements 325 426 153
Excess (shortfall) of receipts over disbursements 6 055 502
Unliquidated obligations (26 019 247)
Transfer of 2018 RB unobligated balances (3 623 585)
Provisional 2018 cash deficit (23 587 329)
Calculation of final cash surplus for 2017
Prior year provisonal cash deficit (23 008 309)
Receipt of:
Contributions all prior years 21 181 426
Savings on liquidation of prior year's obligations 2 306 769
Miscellaneous income 957 895
Final cash surplus for 2017 1 437 780
Transfer of Surplus to MCIF (1 437 780)
Final cash surplus/(deficit) for 2017 -
Prior years cash surpluses a/ 61 754
Total cash surpluses/(deficit) 61 754
a/ Withheld pending receipt of contributions.
ANNEX A5
REGULAR BUDGET FUND STATUS OF CASH SURPLUS
As at 31 December 2018 (expressed in euro)

GC(63)/6 Page 132
ANNEX A6
Euro Denominated Cash Equivalents and Investments
Type of IssuerType of Instrument
Carrying Value Yield per annum
(%)Original
Investment dateMaturity date
Commercial Time Deposit 30 000 .00 2018-04-09 2019-04-09Commercial Time Deposit 15 000 .05 2018-05-30 2019-02-28Commercial Time Deposit 20 000 .00 2018-07-27 2019-04-29Commercial Time Deposit 30 000 .09 2018-08-24 2019-08-26Commercial Time Deposit 20 000 .00 2018-08-31 2019-08-30Commercial Time Deposit 15 000 .10 2018-11-30 2019-12-02Commercial Call account 65 000 .35 Commercial Call account 65 000 .29
260 000
54%
US Dollar Denominated Cash Equivalents and Investments (Euro equivalent)
Type of Issuer Type of Instrumen Carrying ValueYield per annum
(%)iginal Investment d Maturity date
Supranational Time Deposit 52 560 2.30 2018-05-07 2019-03-07Supranational Time Deposit 45 552 2.30 2018-05-07 2019-03-07Supranational Time Deposit 13 140 2.30 2018-08-29 2019-01-29Supranational Time Deposit 4 380 2.26 2018-09-05 2019-01-07Supranational Time Deposit 8 760 2.41 2018-09-19 2019-02-19Supranational Time Deposit 8 760 2.45 2018-09-19 2019-03-19Supranational Time Deposit 6 132 2.59 2018-09-27 2019-06-27Supranational Time Deposit 8 760 2.67 2018-10-31 2019-07-31Supranational Time Deposit 4 380 2.62 2018-12-13 2019-01-14Supranational Time Deposit 10 512 2.52 2018-12-19 2019-01-22Supranational Time Deposit 3 504 2.55 2018-12-21 2019-01-14Supranational T-Bills/Discounted 10 458 2.44 2018-06-15 2019-05-13Supranational T-Bills/Discounted 12 484 2.45 2018-06-15 2019-05-15Commerical Time Deposit 8 322 2.51 2018-04-11 2019-04-11Commerical Time Deposit 8 760 2.70 2018-07-27 2019-04-29Commerical Time Deposit 8 760 2.71 2018-08-31 2019-08-30Commerical Call Account 0.3 Commerical Call Account 3 154
218 378
46%
478 378 Total Euro Equivalent Cash
STATEMENT OF INVESTMENTS AS AT 31 DECEMBER 2018(expressed in euro'000s)
Euro Denominated Cash Equivalents and Investments as Percent of Total
Total Euro Denominated Cash Equivalents and Investments
Total US Dollar Denominated Cash Equivalents and Investments
US Dollar Denominated Cash Equivalents and Investments as Percent of Total
GC(63)/6 Page 133
Part V
Report of the External Auditor on the audit of the Financial Statements of the International Atomic Energy Agency for the year ended 31 December 2018

GC(63)/6 Page 135
Audit Report on the International Atomic Energy Agency (IAEA)
in respect of Financial Matters of Financial Audit Results and Performance Audit on Management of The Agency Procurement and Publications 2018
The Audit Board of the Republic of Indonesia

GC(63)/6 Page 136
TABLES OF CONTENTS
EXECUTIVE SUMMARY .................................................................................................................. 139
INTRODUCTION ................................................................................................................................ 140
FINANCIAL OVERVIEW .................................................................................................................. 141
AUDIT OPINION ................................................................................................................................ 144
DETAILED AUDIT FINDINGS ......................................................................................................... 145
FINANCIAL MATTERS ........................................................................................................145
MANAGEMENT OF THE AGENCY PROCUREMENT .....................................................161
MANAGEMENT OF THE AGENCY PUBLICATION ........................................................170
OTHER MATTERS ............................................................................................................................. 180
RESPONSE TO PAST EXTERNAL AUDITORS’ RECOMMENDATIONS ................................... 181
ACKNOWLEDGEMENT ................................................................................................................... 181
ANNEX I ............................................................................................................................................. 182

GC(63)/6 Page 137
LIST OF TABLES
Table 1. The Agency's Financial Holding in Commercial Banks ........................................................ 149
Table 2. The Agency's Financial Holdings in Bank Austria ................................................................ 149
Table 3. The Agency's Financial Holdings in Countries with Rating Below AA- ............................... 149
Table 4. IAEA Regular Budget and Working Capital Fund Financial Performance ........................... 150
Table 5. IAEA Outstanding Contribution Year 2016-2018 ................................................................. 151
Table 6. Quarterly Regular Budget in 2018 ......................................................................................... 152
Table 7. The Outstanding Research Contracts Reports ........................................................................ 160
Table 8. Detail of Write-Offs ............................................................................................................... 181
Figure 1. ASHI Outstanding Receivables for Retirees ......................................................................... 154
Figure 2. Unsettled Travel Claim ......................................................................................................... 159
Figure 3. Number of Capital Non-Expendable Assets Purchased via LVP ......................................... 161
Figure 4. Supplier's Performance Feedback Process ............................................................................ 169
Figure 5. Process Flow of Safety Standards Development .................................................................. 171
Figure 6. SPESS Management System ................................................................................................ 172
Figure 7. The Central Role of NSS-OUI Platform in the Revision and Publication Process ............... 174
LIST OF FIGURES

GC(63)/6 Page 139
EXECUTIVE SUMMARY Financial Audit Results
In our opinion, the financial statements of the International Atomic Energy Agency (IAEA) present fairly, in all material respects, the financial position as at 31 December 2018 and its financial performance and cashflows for the year then ended in accordance with IPSAS.
We also identified inter alia financial matters to be considered to further strengthen accountability. Thus, we recommend the Agency improve its corporate anti-fraud policy to promote an ethical organizational culture as well as update and review the IPSAS Policy Manual and the Financial Instructions regularly to better respond to an uncertain and unpredictable environment.
Performance Audit Observations
We identified that the Agency has developed systems and processes to support its procurement and publication management in accordance with the Result-Based Management Frameworks, but there are some areas requiring further attention to enhance its effectiveness. Therefore, we recommend the Agency:
• build a more intensive coordination with Member States to enhance their awareness of the importance of MSs’ solid support and strong commitment to ensure a timely, efficient, and effective procurement process and delivery, and with counterparts to participate in data collection to the extent practicable with respect to the adoption and use of IAEA Safety Standards;
• explore enhancements to AIPS for generating an early warning system to enhance the management of procurement deliveries;
• clearly communicate to all relevant stakeholders the parameters taken into account when prioritising manuscripts and assigning work within the Publishing Section;
• develop a system to record suppliers’ performance in a more comprehensive manner and to monitor and facilitate the evaluation of the supplier’s performance; and
• continue to identify initiatives and develop strategies for efficiency improvement throughout the whole process of publications management as well as to address the under-resourced editing services at the high level of the Agency management.
The Importance of This Audit
The IAEA generated €585.03 million of revenues and recognized €561.54 million of expense in fiscal year 2018. The Agency also managed assets and liabilities of €1,174.17 million and €593.56 million respectively.
Accordingly, the Audit Board of the Republic of Indonesia (BPK) presents this report as a result of auditing the Agency’s financial statements as at and for the period ended 31 December 2018.
BPK also conducted a performance audit on the chosen key areas, i.e. Management of Agency Procurement and Publications.
In conducting the audit of financial statements and the performance audit, we were guided by the International Standards on Auditing (ISAs) and the International Standards of Supreme Audit Institutions (ISSAIs) respectively.
Audit Objectives
The financial audit objective was to provide the Agency with an independent assurance that the financial statements as a whole are free from material misstatement, whether due to fraud or errors and in accordance with International Public Sector Accounting Standards (IPSAS).
With respect to the performance audit, the objective was to enhance the effectiveness of IAEA’s procurement and publication management so as to improve the services to Member States; and whether the processes are in accordance with the Result-Based Management Frameworks.

GC(63)/6 Page 140
INTRODUCTION
1. By appointment of the General Conference, the Audit Board of the Republic of Indonesia (BPK) has been entrusted with the responsibility of auditing the Agency’s financial statements for the financial years 2018 to 2019 in accordance with Financial Regulations 12.01 (Article XII) and the Additional Terms of Reference governing the External Audit set out in the Annex to these Regulations. BPK made such observations as deemed necessary in relation to the financial consequences of prevailing administrative practices in accordance/compliance with paragraph 5 of the Additional Terms of Reference governing the External Audit.
2. Our audit was conducted in conformity with the applicable International Standards on Auditing (ISA) and International Standards of Supreme Audit Institutions (ISSAI), as adopted by the Panel of External Auditors of the United Nations, the Specialized Agencies and the International Atomic Energy Agency.
3. According to the requirements of ISA, the main objective of the audit was to enable the auditor to express an opinion on whether expenditure recorded for the year had been incurred for the purposes approved by General Conference; whether revenue and expenses were properly classified and recorded in accordance with Financial Regulations; and whether the financial statements present a fair view of the financial position as at 31 December 2018. This includes the correctness of year-end balances of all IAEA funds as detailed in IAEA accounts. In addition, the ISSAI provide guidance on the conduct of performance audits. The main audit objective of the performance audit was to enhance the effectiveness of IAEA’s procurement and publication management so as to improve the services to Member States; and whether the processes are in accordance with the Result-Based Management Frameworks
4. The audit involved discussions with key managers of the Subprogrammes and sections concerned; review of related documents; review of policy, processes and procedures; seeking information and clarifications from the management through information requests, audit queries; and providing audit observations and recommendations.
5. The selection of Subprogrammes to be examined involved the application of a number of factors. These included the level of alignment with priorities described in the Programme and Budget 2016-2017 and 2018-2019 (the Blue Book), the Agency’s synergies, efficiency-related concerns, budget significance, management risks, previous audits, potential impacts, and current management’s considerations. As a result, we selected:
the Management of Agency Procurement, in which the audit scope covers procurements conducted by Office of Procurement Services (MTPS) during the period of 1 January 2017 to 30 June 2018 in respect of the Division of Nuclear Security (NSNS) and the Technical Cooperation Department (TC);
the Management of Agency Publications, in which the audit scope covers the Development of Safety Standards within the Department of Nuclear Safety and Security and Nuclear Energy Series within the Divisions of Nuclear Power (NENP) and Nuclear Fuel Cycle and Waste Technology (NEFW) during the period of 1 January 2017 to June 2018;
6. The purpose of this Audit Report is to communicate the audit result to the Agency and those charged with governance, as well as other stakeholders. Important findings arising from the audit procedures performed were, after detailed discussions with the responsible management, conveyed through Management Letters. The more significant of these findings, appropriately aggregated, have been incorporated in this report, after duly considering management’s final responses and action plans for implementation of the recommendations.

GC(63)/6 Page 141
FINANCIAL OVERVIEW
Adoption of IPSAS
7. The agency carries out its mandate within a result-based framework ensuring effectiveness, accountability and transparency. This framework needs to be supported by high quality financial reporting and management information. Financial statements prepared under IPSAS are a key enabler to allow the Agency to deliver its mandate in an improved manner. The adoption of IPSAS represents a best management practice and is expected to lead to greater harmonization in the presentation of financial statements between UN system organizations and better comparability of financial statements with other international organizations and national governments. Financial Statements prepared in accordance with IPSAS provide greater insight into the actual assets, liabilities, revenues and expenses of the Agency. This is the eighth year since the adoption of IPSAS by the Agency in 2011.
Fund Accounting and Segment Reporting
8. A Fund is a self-balancing accounting entity established to account for the transactions of a specified purpose or objective. Funds are segregated for the purpose of conducting specific activities or attaining certain objectives in accordance with special regulations, restrictions or limitations. The financial statements are prepared on a fund accounting basis, showing at the end of the period the consolidated position of all funds. Fund balances represent the accumulated residual of revenue and expenses. The financial statements contain segment reporting providing information on the Agency’s activities on both major programme basis and source of funding basis. The Agency’s six major programmes namely (i) Nuclear Power, Fuel Cycle and Nuclear Science; (ii) Nuclear Techniques for Development and Environmental Protection; (iii) Nuclear Safety and Security; (iv)Nuclear Verification; (v) Policy, Management and Administration Services; and (vi) Management of Technical Cooperation for Development are financed through the Agency’s fund groups. The Funds have been established on the basis of resolutions passed by the General Conference and are administered in accordance with the Financial Regulations adopted by the Board of Governors and Financial Rules issued by the Director General. Each Fund has differing parameters about how the revenue can be utilized.
Budgetary Performance
9. The Programme and Budget of the Agency focuses on the Regular Budget Fund and the related appropriations approved by Member States. The components of the Regular Budget include the Operational Regular Budget and Capital Regular Budget. The Agency attained the rates of budget implementation of 99.00% and 58.02% respectively in these components.
Summary of Financial Performance
10. The Regular Budget Group, including the Regular Budget Fund, Working Capital Fund and Major Capital Investment Fund (RBF, WCF and MCIF, respectively) experienced an IPSAS basis net deficit of €11.68 million for 2018. The Technical Cooperation Fund (TCF) recorded net surpluses of €2.00 million. This surplus is lower than 2017’s surplus primarily resulting from a higher amount of contributions received in 2017 that were in excess of Member State specific target. The Extrabudgetary Fund (EBF) and Technical Cooperation Extrabudgetary Fund (TC-EB) recorded net surpluses of €31.75 million and €6.69 million, respectively, for 2018. The net surpluses were primarily due to the increasing timing differences between revenue recognition for IPSAS purposes and the full financial implementation of the related activities. The surplus realized in the LEU Bank Fund (LEU) of

GC(63)/6 Page 142
€4.96 million for 2018 was driven largely by the appreciation of the US dollar against the euro on the US dollar funds held by the LEU Bank Fund.
Revenue Analysis
11. Total revenue in 2018 was €585.03 million, which represented a 0.43% decrease as compared to 2017 (€587.53 million). The decrease was mainly due to the decrease in revenue from assessed contributions and voluntary contributions by €1.57 million and €7.09 million, respectively. In contrast, revenue from other contributions and investments increased by €4.20 million and €2.15 million, respectively.
Expense Analysis
12. There was 4.41% increase in expenses in 2018 (€561.54 million) as compared to 2017 (€537.84 million). Salaries and employee benefits (€289.83 million) accounted for 51.61% of Agency’s expenses and has shown an increase of €2.90 million from 2017. The second largest component was travel (€46.63 million) which represented 8.30% of the expenses in 2018. Transfer to development counterparts has shown an increase of €8.24 million from 2017. Other operating expenses at €27.34 million have shown an increase of €0.44 million as compared to 2017.
Financial Position
13. The overall financial position of the Agency continues to be quite healthy as at 31 December 2018. This financial health can be seen in the following key indicators:
The overall net assets value, calculated as total assets less total liabilities, is €580.60 million;
The value of current assets is approximately five times the value of current liabilities. This signifies that the Agency has sufficient resources to cover its liabilities expected to come due in the upcoming 12 months.
14. As at 31 December 2018, the total cash, cash equivalents and investments balances represent 61.47% of the Agency’s total assets. This signifies that the Agency’s liquid assets are sufficient to meet the Agency’s requirements.
15. The significant areas of change in the Agency’s financial position in 2018 from 2017 are the following:
Current assets increased by €29.6 million mainly due to the increase in the overall amount of investments, primarily in the Technical Cooperation Fund and Extrabudgetary Fund;
Non-current assets increased by €4.94 million related primarily to Property, plant, & equipment, in particular related to assets under construction; and
Total liabilities increased by €4.07 million mainly due to an increase in the Agency’s employee benefit liabilities. Although the changes in financial assumptions resulted in actuarial gains for ASHI, this gain was offset by the introduction of age grading in determining medical trend rates in line with best practices, which resulted in a net actuarial loss in 2018 of €1.47 million that drive the increase in liabilities.

GC(63)/6 Page 143
16. In 2018 the Agency experienced an overall increase in net assets, from €550.09 million to €580.61 million, which was primarily driven by the increase in total assets of €34.58 million which more than offset the net increase in liabilities by €4.07 million.
Cash, Cash Equivalents and Investments
17. In 2018, the cash, cash equivalents and investments balances increased by €19.37 million (or 2.76%) to €721.75 million at 31 December 2018. This increase was as a result of net surplus of the year in the Extrabudgetary Programme Fund. The appreciation of the US Dollar against the euro on the US dollar amounts held by the LEU Bank Fund and the Technical Cooperation Fund, contributed to a total increase in the euro value of cash and investment in these funds, which increased by €3.78 million (3.22%) and €5.34 million (4.76%) respectively.
18. Of the total cash, cash equivalent and investments of €721.75 million, 69.01% was held in the EBF, the LEU Bank Fund and the Technical Cooperation Extrabudgetary Fund and are therefore earmarked for specific activities.
19. As at the end of 2018, 68.19% of the total cash, cash equivalents and investments were denominated in euro while 31.57% were denominated in US dollars, with the remaining 0.2% denominated in other currencies. Interest rates on euro denominated investments remained near zero in 2018; however, interest rates in US dollar denominated investments increased during the year. Based upon the mix of currencies in the Agency’s cash equivalents and investments portfolio, the overall return achieved on the Agency’s cash equivalents and investments increased during 2018.
Accounts Receivables
20. Overall, the total net receivables from non-exchange transactions increased by €8.51 million to €50.94 million at 31 December 2018. The main components of this balance are receivables from assessed contributions (€35.37 million), voluntary contributions receivable (€14.28 million), and other receivables (€1.29 million).
21. The increase experienced in 2018 is mainly driven by the increase in assessed contributions receivable. During 2018, the rate of collection of assessed contributions decreased from 93.17% to 92.79%, which resulted in an increase of outstanding assessed contributions aged less than one year of €1.25 million. In addition, the contributions in arrears more than one year increased by €3.26 million.
22. The increase in the net amount of outstanding voluntary contributions receivable of 60.43%, from €8.90 million to €14.28 million resulted from the decrease in the collection in 2018 of a number of significant contributions pledged and accepted in 2018.
Property, Plant and Equipment
23. Buildings and Leasehold Improvements continue to account for the largest component of the net book value of Property, Plant and Equipment (PP&E).
24. The total net book value of PP&E increased by €7.64 million (2.75%). Among the factors contributing to this increase are the following:
Approximately half of the additions to PP&E, which totalled €28.83 million in 2018, relate to assets under construction pertaining to the ReNuAL project (€8.06 million) and the

GC(63)/6 Page 144
Inspection Equipment and Communication and IT Equipment pending installation or assembly (€6.44 million).
The remaining additions to PP&E during the year were experienced in all other asset categories, with the largest components in Communication and IT Equipment (€3.84 million) and Laboratory equipment (€3.75 million).
These additions were offset by depreciation expense of €21.09 million
25. As at 31 December 2018, the balance of PP&E under construction was primarily comprised of €26.10 million related to the ReNuAL project.
Intangible Assets
26. The net carrying amount of Intangible Assets at 31 December 2018 was €65.64 million which decreased from €67.19 million in 2017. The principal driver for the decrease in the carrying value of Intangible Assets during 2018 is the amortization of MOSAIC project that were still under development in previous reporting periods but went live towards end of 2017 and beginning 2018. During 2018, total costs of €9.21 million were added to the value of internally developed software, of which €3.34 million related to MOSAIC and €5.87 million related to other internally developed software projects.
Risk Management
27. The financial statements prepared in accordance with IPSAS provide details of how the Agency manages its financial risk, including credit risk, market risk (foreign currency exchange and interest rate) and liquidity risk. From an overall perspective, the Agency’s investment management prioritizes capital preservation as its primary objective, ensuring sufficient liquidity to meet cash operating requirements, and then earning a competitive rate of return on its portfolio within these constraints.
AUDIT OPINION
28. According to the terms of Reference for the External Auditor, we are required to express an opinion on the IAEA financial statements for the financial period ended 31 December 2018. Audit of the financial statements for the financial year 2018 revealed no weaknesses or errors which we considered material to the accuracy, completeness and validity of the financial statements as whole. Accordingly, we have placed an unqualified opinion on the Agency’s financial statements for the financial year ended 31 December 2018.

GC(63)/6 Page 145
DETAILED AUDIT FINDINGS
FINANCIAL MATTERS
A. Anti-Fraud Policy
29. The IAEA has established a whistle-blower policy to facilitate the confidential reporting of suspected fraud, corruption or misconduct and to protect whistle-blowers against identity disclosure and retaliation. Anyone with information indicating possible fraud, corruption or misconduct is urged to report the information as stated in that policy.
30. The whistle-blower policy is established to provide the means for staff members, persons engaged under Part II Section 11 of the Administrative Manual (AM.II/11-Personnel other than staff members) and external persons to report fraud, corruption, or other forms of misconduct, and to protect them against identity disclosure and retaliation for making such reports or for cooperating with audits and investigations.
31. The Joint Inspection Unit (JIU) has published some reports related to fraud control in UN agencies, such as Fraud Prevention, Detection and Response in United Nations System Organizations (JIU/REP/2016/4) and Review of Whistle-blower Policies and Practices in United Nations System Organizations (JIU/REP/2018/4).
32. The IAEA whistle-blower policy extends its applicability to external parties such as vendors and provides details on how external persons can report, what they can report, and how reporting is handled. As a best practice, to mitigate disruptions to the whistle-blower’s career, IAEA’s whistle-blower policy also outlines measures to relocate the alleged retaliator, including temporary reassignment, transfer or placement on special leave.
33. The IAEA already has some related policies such as anti-fraud governance, procurement and vendor sanction, financial/asset management, staff conduct, whistle-blower/protection against retaliation policy, investigations and disciplinary measure. However, JIU reports are also concerned about the lack of corporate anti-fraud policy or anti-fraud framework in the IAEA. In particular, the JIU points out that there is a lack of clear definition of roles, responsibilities and accountabilities or a lack of clear guidance on how to operationalize the policy. Based on JIU/REP/2018/4, as of 31 December 2018, there were 15 UN system organizations that already have issued a corporate anti-fraud policy. Some of those agencies have developed their corporate anti-fraud policy for years, such as the International Trade Center (ITC). ITC developed the “ITC Anti-Fraud and Anti-Corruption Policy” in 2007.
34. The IAEA should consider developing its corporate anti-fraud policy which will enable the Agency to have controls that are able to prevent fraud from occurring, detect it as soon as it happens, and respond effectively to fraud incidents when they occur as an integrated holistic approach. Even though progress has been made in drafting such policy in 2018, the policy is yet to be finalized and approved.
GC(63)/6 Page 146
Recommendation 1
We recommend that the Agency develop its corporate anti-fraud policy as it supports the Agency’s commitment to promoting an organizational culture that does not tolerate fraud and places an emphasis on accountability and integrity.
The Agency agreed with the recommendation.
B. IPSAS Policy Manual
Inventory of Low Enriched Uranium (LEU)
35. In December 2010, the IAEA Board of Governors decided to establish the IAEA Low Enriched Uranium (LEU) Bank as an assurance of supply mechanism of last resort for Member States that are experiencing a supply disruption of LEU to a nuclear power plant due to exceptional circumstances impacting availability and/or transfer and is unable to secure LEU from the commercial market, State-to-State arrangements, or by any other such means. Owned and controlled by the IAEA, the LEU Bank will be a physical reserve of up to 90 metric tons of LEU suitable to make fuel for a typical light water reactor. The IAEA LEU Bank will be located at the Ulba Metallurgical Plant in Ust-Kamenogorsk, Kazakhstan.
36. In August 2018, the Agency signed a contract for the acquisition of LEU for the IAEA LEU Bank and its implementation is underway.
37. A Member State faced with exceptional circumstances or unable to secure LEU from the commercial market or by any other means, may request a supply. The IAEA Director General will determine whether the request meets the criteria approved by the IAEA Board of Governors and will keep the IAEA Board of Governors informed throughout the entire process.
38. The IAEA’s 2018 Financial Statements, on Note 42: Commitments, disclosed that the commitments from the LEU Bank fund group as of 31 December 2018 amounted to €23.3 million, including the contract which was signed in August 2018 for the acquisition of LEU. Although, the purchase of the LEU was not realized in 2018, the total amount of the contract was included in the commitments.
39. The Agency has not updated its IPSAS Policy Manual on LEU inventory. Considering the large amounts of funds involved and the importance of LEU, we are of the opinion that the Agency needs to update its IPSAS Policy Manual to include the accounting policy and treatment related to the management of LEU inventory. IPSAS 12 - Inventories states that inventories shall be measured at the lower of cost and net realizable value.
Employee Benefit Liabilities
40. In June 2016, the International Public-Sector Accounting Standard Board (IPSASB) has published IPSAS 39 - Employee Benefits. This new standard superseded IPSAS 25 – Employee Benefits with effective date of 1 January 2018. IPSAS 39 is based on the latest revised International Accounting Standard (IAS) 19 – Employee Benefits.
41. The main differences between IPSAS 39 and IPSAS 25 are removal of an option that allowed an entity to defer the recognition of changes in the net defined benefit liability (the “corridor approach”), introduction of the net interest approach for defined benefit plans, and simplification of the requirements

GC(63)/6 Page 147
for contributions from employees or third parties to a defined benefit plan when those contributions are applied to a simple contributory plan that is linked to service. Also, in IPSAS 39, it removes the requirements for Composite Social Security Programs and amends certain disclosure requirements for defined benefit plans and multi-employer plans. Since the Agency was not following the ‘corridor approach,’ the impacts of IPSAS 39 adoption are minor and refer to: the requirement to split and disclose the Defined Benefit Obligation (DBO) for ASHI liability for active staff members and retirees and also the requirement to provide a break-down of actuarial gains and losses for all the long-term post-employment benefits in 3 components - actuarial gains and losses arising from changes in demographic assumptions, financial assumptions, and experience adjustments.
42. The updated or new IPSAS Policy Manual is used to support understanding of standard and to give guidance in transitioning to standard and preparing standard-compliant financial statements.
Recommendation 2
We recommend that the Agency update its IPSAS Policy Manual related to:
i. management of LEU inventory; and
ii. implementation of IPSAS 39 – Employee Benefits.
The Agency agreed with the recommendation and the IPSAS Policy Manual has been updated with regards to IPSAS 39.
C. Imprest Fund/Petty Cash
43. As stated in Administrative Manual V, Section 3, Financial Rules, imprest funds shall be established when the amounts to be paid are minor or when, in specific situations, the Agency cannot make timely payment by following standard procedures. Imprest funds may only be used for the purposes specified and payment made from them shall not exceed the limits authorized.
44. Also stated in the Financial Rules, Rule 110.50, DIR-MTBF has the responsibility to establish procedures for the operation of the imprest funds.
45. The current practice to control the use and replenishment of the imprest fund is as follows:
a. The staff members, using their own money, buy/pay for goods/services for the Agency;
b. They submit the receipts and request for reimbursement through petty cash request slip;
c. The cashier will check the receipts and pay the staff members, with maximum amount of €250 per bill, invoice or claim;
d. The cashier will send the request for petty cash replenishment to APS;
e. APS will replenish the petty cash based on the request;
f. MTBF establishes the schedule for annual financial closure for submission of imprest fund vouchers and replenishment requests from imprest fund holders.
46. Based on our examination of the documents on imprest fund replenishment, we identified invoices related to 2017 transactions which were replenished in 2018. From the eight replenishment documents we examined, five replenishment documents from Seibersdorf Laboratory, Safeguards, and General

GC(63)/6 Page 148
Service Units disbursed prior to 2018 amounting to €1,614.83 were included for 2018 replenishment. Those transactions were replenished and recorded as expenses in 2018 despite the fact that the transactions occurred in 2017. We also examined the January 2019 replenishment document and found that there were replenishments for 2018 disbursement amounting to €505.73.
47. The issue has been mentioned in the 2017 External Audit Report with the recommendation that the Agency should establish written guidelines regarding management of imprest fund/petty cash as a control to ensure that the replenishment of petty cash is conducted on a timely basis and only for transactions within the related accounting period.
48. MTBF adhered to the recommendation by issuing and distributing Financial Instruction No. 16 - Procedures for the operation of the Agency’s Petty Cash Funds, dated 20 November 2018. Key instructions related to cross-year reimbursement are as follows:
a. Paragraph 10, which states that requests for reimbursement from petty cash funds, supported by invoices/claims and justification of expenditure must be submitted for reimbursement within one month after the date of purchase;
b. Paragraph 15, which states that at year-end, a request for replenishment must be submitted to MTBF-APS by the stipulated deadline in the year-end closure timetable. In addition, petty cash fund holders are required to submit the confirmation of petty cash fund balance as of the last working day of the financial year.
49. This Financial Instruction does not regulate the restriction for reimbursing prior year’s expenses from imprest fund to prevent this matter from happening again.
Recommendation 3
We recommend that the Agency review its Financial Instruction No. 16 – Procedures for the operation of the Agency’s Petty Cash Funds to restrict the reimbursement of petty cash expenses from prior years.
The Agency agreed with the recommendation.
D. Investments Portfolio
50. As of 31 December 2018, the Agency’s investment amounted to €327 million. The Agency’s investment activities are regulated in the Financial Instruction 15 on Treasury Management. Based on our examination on the Agency investment portfolio, we identified the following:
The Agency holds more than 70% of its financial holding in commercial banks
51. We identified that from May until December 2018, the Agency put more than 70% of its financial holding in commercial banks as shown in Table 1 below.

GC(63)/6 Page 149
Table 1. The Agency's Financial Holding in Commercial Banks
Month Investment in Euro Percentage of Total Investment
May 520 million 72.60
June 489 million 70.70
July 531 million 72.80
August 504 million 73.30
September 467 million 71.30
October 470 million 72.00
November 489 million 72,39
December 525 million 74.25
52. These investments breached the ceiling limit defined in the Financial Instruction which states that the Agency shall not hold more than 70% of its financial holding in commercial banks whether in current accounts, short-term time deposits or call accounts.
The Agency holds more than 30% of its financial holdings in Bank Austria
53. We identified that from January until May 2018, the Agency put more than 30% of its financial holdings in Bank Austria which is one of the Agency’s operating banks as shown in Table 2 below.
Table 2. The Agency's Financial Holdings in Bank Austria
Month Investment in Euro Percentage of Total Investment
January 242 million 32.80
February 220 million 31.21
March 216 million 30.78
April 156 million 23.57
May 216 million 30.22
54. These investments breached the Financial Instruction’s ceiling limit which states that the Agency shall not hold more than 30% of its Financial Holdings in any of its Operating Banks.
The Agency made investments in a country with a rating below AA-
55. We identified that in 2018, the Agency held investments in Banks domiciled in a country that has Fitch long-term Issuer Default Ratings (IDRs) A+ or below AA- as shown in Table below.
Table 3. The Agency's Financial Holdings in Countries with Rating Below AA-
Bank Country Rating Investment in Euro Type of Investment
Bank of China (Hungarian Branch) A+ 60 million Term Deposit
Industrial and Commercial Bank of China
A+ 30 million Term Deposit
56. These investments do not align with point 6 of the Financial Instruction, Authorized Type of Financial Instrument Section which states that the Agency’s financial holdings can only be invested or held in short-term deposits/call account with commercial banks with a remaining maturity of one year or less. The commercial banks shall also be domiciled in countries with Fitch long-term IDRs of AA- or above.

GC(63)/6 Page 150
57. The treasurer, in the Investment Committee meeting on 27 June 2018, explained that the non-compliance stated in the paragraphs above was mainly driven by the inability of the Agency to invest EUR funds at a positive rate with non-commercial counterparties since the European Central Bank deposit facility rate is negative at -0.4%. The Agency decided to keep the investment at a positive rate to get a good return on investment, although this decision does not align with the current Financial Instruction on Treasury Management.
Recommendation 4
We recommend that the Agency:
i. review its Financial Instruction Treasury Management regularly; and
ii. incorporate an exception clause in the Financial Instruction as a preventive action to the uncertain and unpredictable market condition.
The Agency agreed with and has implemented the recommendations during the audit.
E. Outstanding Assessed Contributions
58. The Agency’s regular budget consists of an operational and a capital component. While the first component is used to finance ongoing operational costs, the capital component is used to finance major infrastructure investments in line with the IAEA’s major capital investment plan. This regular budget is financed by the Member States’ assessed contribution, other contribution, exchange revenue, and miscellaneous income. In 2018, 94.75% revenue for this fund was generated from assessed contributions.
59. Based on the Agency’s Financial Performance by Fund (Statement VIIb) for the last three years, we identified that the Agency experienced an increasing deficit in its Regular Budget Fund.
Table 4. IAEA Regular Budget and Working Capital Fund Financial Performance
(in euro ‘000s) Financial Performance 2016 2017 2018
Revenue 363,122 372,498 373,672 Expenses 367,321 380,698 388,852 Net gains (losses) (718) (3,648) (1,262) Net surplus/(deficit) (4,918) (11,848) (16,442)
Source: Statement VIIb.
60. In relation to this deficit condition, we have identified the following issues:
Outstanding Regular Budget
61. The current low level of Regular Budget cash balance is the result of the high level of regular budget receivables from prior years. Over the recent years, the Agency’s level of outstanding contribution tends to increase as shown in Table 5 below.

GC(63)/6 Page 151
Table 5. IAEA Outstanding Contribution Year 2016-2018
(in euro ‘000s)
2016 2017 2018
Regular Budget Receivable 32,956 40,254 44,761
Regular Budget Contribution Revenue 354,851 363,670 362,101
Receivable Percentage of the Revenue 9.28% 11.07% 12.36%
Allowance for Doubtful Accounts 5,292 7,646 9,398
62. As of 31 December 2018, the Agency’s level of regular budget receivable increased by €4.507 million from its balance at 31 December 2017. Based on Table 5 above, we also identified that from the receivable balance of €44.761 million as at 31 December 2018, €18.663 million refers to balances from prior years.
63. This increasing trend of outstanding contribution in the last three years, as shown in Table 5, poses a liquidity risk to the Agency and may affect the continuity of the Agency’s operations.
Payment Plan Agreement
64. In 2018, there were 12 Member States which lost their voting rights and one Member State that participated in the payment plan agreement but did not pay its required payment.
65. For the Member States which have lost their voting rights, the Agency will send letters to them in March 2019 informing them about the minimum payable amount to be settled to regain their voting rights. The Agency will also send reminder letters in July 2019 to urge Member States to take some actions. Finally, the Agency will send final reminder letters by email to those Member States in August 2019, three weeks before the scheduled General Conference. In addition to the reminder letters, the Agency also implements several processes and activities to encourage Member States to pay their assessed contribution. The Agency reports the status of payment and voting rights for each Member State quarterly. The Agency intensifies its communication with Member States with significant arrears to encourage them to pay its outstanding assessed contributions. However, the Agency acknowledges that several Member States may not be able to make payments due to financial challenges in their country or other specific reasons.
66. We observed that 85.71% of the Regular Budget outstanding balances refer to four Member States. One of them has an outstanding assessed contribution balance for a period of 41 years. This Member State always pays its Technical Contribution Fund which is a voluntary contribution, but never pays its outstanding assessed contribution while this contribution is mandatory.
67. Two of the other three Member States neither paid their assessed nor voluntary contributions for more than three years, while the other one has an outstanding for assessed contribution only. We have noted, however, that one Member State has made full payment for all its arrears in January 2019.
68. Related to its outstanding regular budget contributions, the above mentioned three Member States, along with other Member States which have lost their voting rights, did not enter into payment plan agreements which is a program established by the Agency to assist Member States in paying their outstanding contributions.
69. In accordance with the Agency’s accounting policies, when Member States enter into the payment plan agreement with the Agency, the Agency needs to assess the discounted amount of receivables, if material, that might impact the current value of its account receivables. This means that the Agency

GC(63)/6 Page 152
needs to calculate the discounted outstanding balance (account receivables) where it could be lower than the current value of account receivables.
Working Capital Fund
70. As stated in Financial Regulation 7.04, Working Capital Fund (WCF) is the fund used for advances in the Regular Budget Fund to finance appropriations temporarily and for other purposes authorized by the General Conference upon the recommendation of the Board. The money for the WCF shall be advanced from the Member States and made in accordance with their respective base rates of assessment as determined by the General Conference. The amount of WCF shall be approved from time to time by the General Conference also upon the recommendation of the Board.
71. For financial year 2018, the General Conference has approved a continuation of the WCF at the level of €15.2 million which is 4.16% of the Regular Budget. The level of WCF did not change from 2014 until 2018. The movement of Regular Budget cash balance in 2018 is as follows:
Table 6. Quarterly Regular Budget in 2018
(in euro ‘000s)
Quarter 1 Quarter 2 Quarter 3 Quarter 4
Regular Budget cash balance 98,100 86,300 0.00 77,500
Estimated monthly cash disbursement for the Regular Budget
30,000 30,000 30,000 30,000
Period covered by the Regular Budget cash balance 3.3 2.9 0.0 2.5
Working Capital Fund cash balance 15,210 15,210 12,210 15,100
Additional month covered by WCF cash balance 0.5 0.5 0.4 0.5
72. Based on Table 6 above, we identified that the Agency utilized the WCF for €3.0 million to finance operational expenditures due to a deficit balance in Regular Budget as at 30 September 2018. This WCF was replenished in early October 2018 since the Agency received Regular Budget contribution payments from the Member States either for current year or 2019 assessed contribution. Table 6 shows that the critical quarter in the Agency’s cash flow was in the third quarter, where the Agency had a zero Regular Budget balance. We noted that the high level of Regular Budget outstanding balance is the main cause of this zero balance, and for the last three years the outstanding balance tends to increase.
73. Although the agency can utilize its WCF, we noted that the balance of WCF is only sufficient to cover half month of the Agency’s operations. Considering the recent condition of outstanding Regular Budget, we are in the view to advise the Agency to review its WCF level. The Agency might want to consider increasing its WCF in a sufficient amount that can cover the Agency’s operations for more than half month.
The Cash Deficit Procedure
74. In 2018, the high level of outstanding Regular Budget contribution impacted the Agency’s cash flows that in September 2018, the Agency utilized its WCF due to the Regular Budget deficit balance, as mentioned above. In situations where the Agency is faced with cash liquidity issues and there are still outstanding amounts from the largest contributors, the established internal procedure provides that the Agency should prepare a letter to urge the concerned Member States to make their payments. Hence, the Agency does not have to borrow from other funds to finance its operational activities. However, there is no further procedure to resolve the cash deficit threat if the concerned Member States do not make any payment after the reminder letter.

GC(63)/6 Page 153
75. We noted that in July 2018, the Agency, due to the low level of Regular Budget cash balance, sent a reminder letter to one Member State with the largest outstanding balance. In the reminder letter, the Agency requested the Member State’s authorization to use its unalloted/unexpended balance of extrabudgetary funds in case the Member State would not be able to pay the Regular Budget’s outstanding balance timely. This request was not regulated by the Agency guidelines or procedure, although we noted that a similar request has been proposed in the GOV/2833 in 1995.
76. We acknowledge the Agency’s efforts to collect the assessed contributions from Member States in a timely manner and to settle the outstanding balances. However, we are concerned that the increasing amount of outstanding assessed contributions could affect the Agency’s functions and its financial sustainability. Furthermore, these outstanding contributions could become irrecoverable.
77. Considering the cash deficit in September 2018, and the increasing outstanding balance of Regular Budget Contribution which poses a significant liquidity risk to the Regular Budget fund, we are of the view that the Agency should prepare and have a short-term contingency procedure for handling cash deficits in the future. In line with this, the Agency has updated its internal procedure by establishing additional contingency procedures for cash deficit.
Recommendation 5
We recommended that the Agency:
i. strengthen its efforts to ensure that receivables are collected from the Member States including the use of payment plan agreement; and
ii. consider its approach to funding the regular budget fund deficit, including considering the need to change an adequate level for the WCF to meet the Agency's needs.
The Agency agreed with the recommendations.
F. Outstanding ASHI Debts of Former Staff
78. As at 31 December 2018, the Agency reported accounts receivable from exchange transactions in the amount of €6.197 million in its Financial Statements which included an overpayment to staff of €0.347 million.
79. These overpayments to staff were mostly due to excess of advances given by the Agency related to education grants and health insurance premiums. In most cases, the overpayment occurred as the Agency pays for the full After Service Health Insurance (ASHI) premiums for retirees through the After Medical Insurance Plan (AMIP) program and separately collects the corresponding share of the liability from the Agency’s retirees. Other cases relate to outstanding receivables related to pension fund contributions from staff on leave without pay (LWOP).
80. Based on our examination, we found that there were overpayments due to Agency’s payment for former staff members’ liability to third parties regarding their share of AMIP premium amounting to €0.183 million which consisted of €0.034 million through periodic benefit deduction program from UNJSPF and €0.148 million through direct advance payment for 85 former staff members. From the overpayment amount of €0.183 million, €0.142 million remained outstanding for two years and were subject to an “allowance for doubtful account” in the Agency’s 2018 Financial Statements.
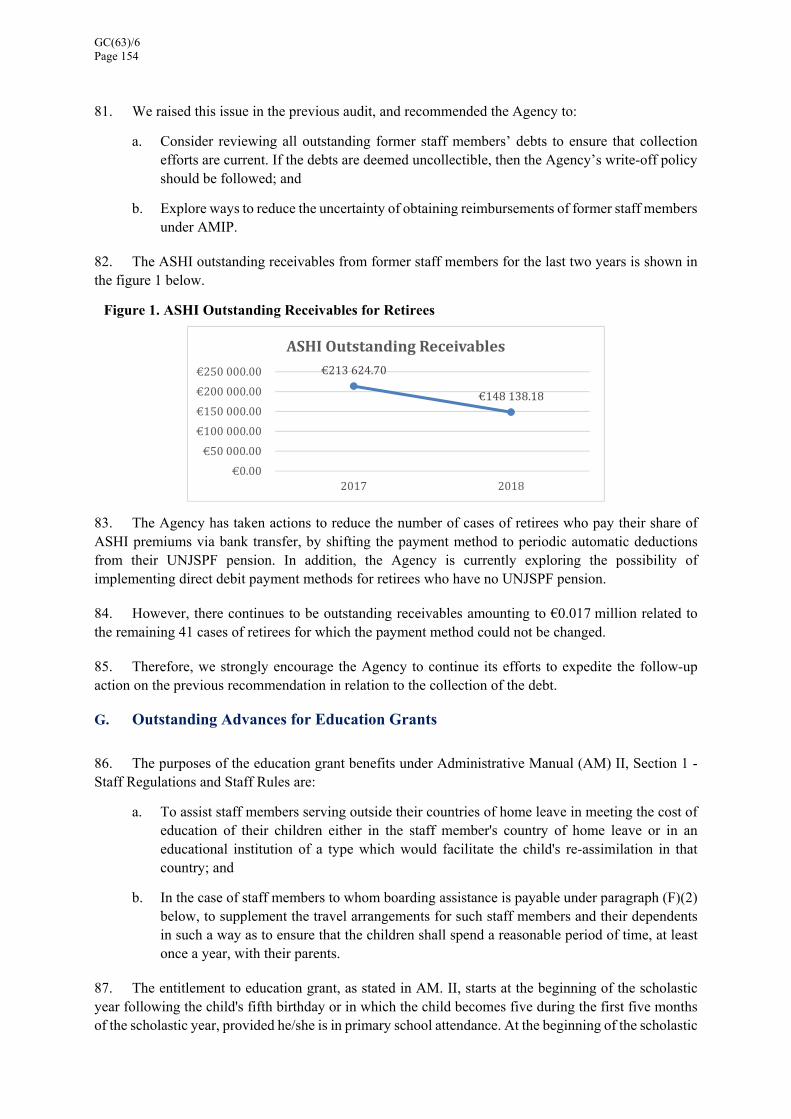
GC(63)/6 Page 154
81. We raised this issue in the previous audit, and recommended the Agency to:
a. Consider reviewing all outstanding former staff members’ debts to ensure that collection efforts are current. If the debts are deemed uncollectible, then the Agency’s write-off policy should be followed; and
b. Explore ways to reduce the uncertainty of obtaining reimbursements of former staff members under AMIP.
82. The ASHI outstanding receivables from former staff members for the last two years is shown in the figure 1 below.
Figure 1. ASHI Outstanding Receivables for Retirees
83. The Agency has taken actions to reduce the number of cases of retirees who pay their share of ASHI premiums via bank transfer, by shifting the payment method to periodic automatic deductions from their UNJSPF pension. In addition, the Agency is currently exploring the possibility of implementing direct debit payment methods for retirees who have no UNJSPF pension.
84. However, there continues to be outstanding receivables amounting to €0.017 million related to the remaining 41 cases of retirees for which the payment method could not be changed.
85. Therefore, we strongly encourage the Agency to continue its efforts to expedite the follow-up action on the previous recommendation in relation to the collection of the debt.
G. Outstanding Advances for Education Grants
86. The purposes of the education grant benefits under Administrative Manual (AM) II, Section 1 - Staff Regulations and Staff Rules are:
a. To assist staff members serving outside their countries of home leave in meeting the cost of education of their children either in the staff member's country of home leave or in an educational institution of a type which would facilitate the child's re-assimilation in that country; and
b. In the case of staff members to whom boarding assistance is payable under paragraph (F)(2) below, to supplement the travel arrangements for such staff members and their dependents in such a way as to ensure that the children shall spend a reasonable period of time, at least once a year, with their parents.
87. The entitlement to education grant, as stated in AM. II, starts at the beginning of the scholastic year following the child's fifth birthday or in which the child becomes five during the first five months of the scholastic year, provided he/she is in primary school attendance. At the beginning of the scholastic
€213 624.70
€148 138.18
€0.00
€50 000.00
€100 000.00
€150 000.00
€200 000.00
€250 000.00
2017 2018
ASHIOutstandingReceivables

GC(63)/6 Page 155
year, the staff member may request an education grant advance with documentary evidence of registration of the child at a school or university and of the costs foreseen. At the end of the scholastic year, the staff member needs to submit an education grant claim to settle the advance received. Advances and claims are submitted electronically in AIPS.
88. The claim must be accompanied by written evidence from the educational institution of the child's attendance, education costs and the specific amounts paid by the staff member.
89. As of 31 December 2018, the outstanding advances for education grant amounted to €4.859 million. This includes six advances for education grant which have been outstanding since 2016 amounting to €0.061 million.
90. The Agency has sent reminders to concerned staff members to claim and settle the education grant advances, but the Agency has not received the claims as of 2018. AM. II/1, Rule 5.01.8 – Claims for Past Entitlements states that payments or other benefits which a staff member, although not entitled to, has received in good faith, may be reclaimed by the Agency only within two years from the date on which such payment was made or such benefits were granted. The Agency might lose its right to reclaim the advances in such situations where it is ascertained that the staff member was not entitled to the education grant benefit for the whole scholastic year. We have received confirmation from the Agency that no further advances regarding education grant are made to staff who have not submitted previous education grant claims, and in the event of separation, the final salary will be on hold until all outstanding advances are settled.
Recommendation 6
We recommend that the Agency continue its efforts to remind the education grant recipients to claim and settle the long outstanding advances.
The Agency agreed with the recommendation
H. Clearing and Suspense Account – UNDP Transactions
91. As of 31 December 2018, the total advance payments to UNDP amounted to a net balance of €0.777 million.
92. As a control, a reconciliation process between AP invoices in AIPS and the Service Clearing Account (SCA) Report sent monthly by UNDP was done. The SCA Report contains transactions processed by UNDP, i.e. funds received from IAEA which have been transferred to the final recipient. Based on our analysis of the account, the balance consists of not only transactions from 2018, but also transactions from 2016 and 2017 amounting to €0.034 million. Moreover, analysis on the reconciliation of January 2019 showed open transactions which were carried over from 2018 amounting to €0.444 million.
Recommendation 7
We recommend that the Agency enhance its efforts to ensure that long outstanding items relating to prior years on the UNDP accounts are cleared at year end.
The Agency agreed with the recommendation.
GC(63)/6 Page 156
I. Appraisal on Consultant and Expert’s Performance
93. Statement of Financial Performance for the year ended 31 December 2018 presents the balance of Consultants and Experts of €16.219 million. This amount reflects the expenses incurred to pay consultants and experts engaged by the Agency under the Special Service Agreement (SSA).
94. Management of consultant engagement is regulated in AM II, section 11, Personnel Other than Staff Members. As stated in AM, the authority to engage personnel and to determine the terms and conditions of their engagement has been delegated to the Director, Division of Human Resources (DIR-MTHR). Furthermore, the hiring department is responsible for preparing a Specification of Requirements for the assignment of the consultant. The hiring department is also responsible for recruiting the consultants.
95. MTHR is responsible for providing advice on the suitability of candidates with regards to their assignment and their fee range and to prepare the contract once consultants have been decided to be engaged by the Agency. Direct performance monitoring is under the responsibility of the hiring department, while MTHR has a responsibility to review the performance assessment of the consultant. In addition, MTHR states that no payment is made until the hiring manager confirms the delivery.
96. Based on our examination, we identified issues regarding the management of consultants and experts as follows:
The Agency does not have electronic monitoring system of consultant and expert performance
97. Administrative Manual II, Section 11, Annex 2, paragraph 22 states that the performance of consultants engaged for one month or more must be recorded in the Consultant Work Completion Review module in HRConnect.
98. We found that HRConnect is no longer used by the Agency since 2015 and the Agency does not have a new system yet to replace the HRConnect. The Agency’s current practice in monitoring the performance of consultants and experts is using a manual report which is developed by each hiring department since there is no template for the report. Manual reports contain deliverables to achieve and days used to complete the tasks, although the AM requires the hiring department to enter the information of the consultant performance in the electronic HR platform. In addition to that, the AM still mentions the HRConnect even though it is no longer used.
Evaluation of performance of consultants is currently not considered a requirement for payment
99. Regarding the payment, the AM states that monthly fees are obtained by multiplying the daily fee by 21 working days. The amount of working days can be derived from AIPS TALMS. For consultants who work from home, the hiring departments will calculate the working days based on consultants’ statement. The amount of working days is then multiplied by the daily rate which is calculated by dividing the total fee stated in the contract by the total expected working days.
100. The AM also states that the hiring manager shall prepare a Specification of Requirements for the assignment of the consultant, in accordance with the applicable template. The Specification of Requirements should be clear and comprehensive as it serves as the basic document for the identification of qualified candidates, determination of fees, the certification that services were rendered or activities performed satisfactorily, and authorization of payment of fees.

GC(63)/6 Page 157
101. In practice, the payment of the consultants is only based on consultants’ working days. We are in the view of that each stage payment should also be based on the proof of the achievement of the tasks within certain period, not only based on days. While there is no centralized process in place to monitor the performance of consultants before payment is made, the hiring manager is expected to check the deliverables before payment is approved.
Recommendation 8
We recommend that the Agency enhance its efforts to explore the possibility of developing an electronic process or system to track the performance level.
The Agency agreed with the recommendation.
J. Travel Cancellation
Duty Travel
102. During 2018, the Agency has processed travel for 32,374 travellers, for both staff and non-staff through the Travel Request and Claim (TRAC) system.
103. The Agency has engaged American Express (AMEX) as its Travel Management Company (TMC) whose main role is to make bookings and issue tickets based on travel authorizations. The TMC is also available to advise on visa requirements, to provide a weekend and after-hours emergency telephone service for changing or obtaining flight, train, hotel or rental car reservations in connection with duty travel, to provide discounted, negotiated non-refundable and penalty air fares for the duty period to the extent possible in accordance with the Lowest Logical Fare (LLF), and to book rental cars. In 2018, the Agency paid €22.845 million to AMEX for arranging travels.
104. We examined all cancelled travels in TRAC and identified 613 travels which are cancelled after the tickets were issued. Those cancelled travels include travel with TRAC status of “cancelled” and “offer-received”. TRAC with status “cancelled” refers to travel which is declared cancelled by the travel arranger, whereas TRAC with status “offer received” refers to travel which is ended as the traveller received the travel option offer from TMC. Observation on TRAC with status of “offer received” shows that some travel arrangers fail to update the status of 272 TRAC to “cancelled” despite the fact that the travellers failed to conduct the travel.
105. Analysis of the cancelled travels reveals that the agency spent €0.746 million on ticket costs including TMC fee and received a refund of €0.433 million which represents 58.01% of the total ticket cost of cancelled travels. Hence, the cancelled travels cost the Agency the amount of €0.313 million or 41.99% of the total ticket cost of cancelled travels.
106. Review of the cancellation reason showed that travels were cancelled due to various reasons. However, 135 travellers/travel arrangers failed to provide reason of the cancelled travels.
Participants to Agency’s Events
107. The Agency processed travels, for both staff and non-staff, through the Travel Request and Claim (TRAC) system. As for non-staff travel, the IAEA division or office organizing the travel may provide the travellers with transportation, daily subsistence allowance (DSA) and a contingency allowance.

GC(63)/6 Page 158
108. Administrative Manual II, Section 9, Appendix C, Point E number (1) states that if travel is postponed or cancelled, the organizing IAEA division or office shall notify the TMC in case of ticket cancellation or refund.
109. The AM also states that if travel is cancelled and a lump sum was already paid by the IAEA, the corresponding amount shall be reimbursed by the traveller. However, if the cancellation is made by the IAEA and the traveller has already incurred some expenses, the expenses may be deducted from the amount of the lump sum to be reimbursed to the IAEA.
110. Based on the analysis of cancelled travels, we identified 2,792 cancelled travels in 2018, 706 of which were non-staff travels. We examined all cancelled travels for non-staff and found that allowances paid to 116 travellers amounting €0.108 million and $0.036 million have not been recovered as of reporting date.
111. For these unrecovered DSA, the related department has requested the concerned participants to return the DSA. Until the end of the audit period, these DSA advances were still unrecovered.
112. This issue was also raised in 2017 with the recommendation to document the cancellation reasons and to ensure that the lump sum paid to the cancelled participants are recovered. We reiterate our previous recommendation and encourage the Agency to expedite the follow-up action on this recommendation.
K. Submission of Duty Travel Claims
113. We examined settlement of travel claims as of 20 February 2019 and identified 46 travels remained unsettled for more than 90 days after the completion of the duty travels. The net advance disbursement for those travels amounted to €0.080 million (€0.082 million – €0.002 million) have not been recovered.
114. Travel claim settlement includes a process which involves and relies on travellers and claim verifiers. There were 46 travellers with net advances of €0.080 million who have not settled their claims.
115. From May 2018, the Agency already implemented salary deduction for staff members who failed to settle his/her duty travel on 90 days after the completion of the duty travels. The salary deduction amounted to €0.088 million for 62 duty travels in 2018. However, we noticed that 12 travels with total advances of €0.019 million which are mentioned in the previous audit remained unsettled.
116. We raised similar issues in 2016 and 2017 and recommended the Agency to apply salary deduction for the unclaimed travel for more than 90 days. The trend of unsettled claims is presented in Figure 2 below.

GC(63)/6 Page 159
Figure 2. Unsettled Travel Claim
117. The Agency needs to settle 38 unclaimed travels with net advance of €0.072 million. This net advance includes improvement in the funding issue for 17 travellers amounting to €0.025 million and improvement in the verification process for 21 travels amounting to €0.047 million.
118. While we recognize that the measures implemented in 2018 helped reduce the number of unsettled travel claims, we continue to reiterate our previous recommendation in relation to salary deduction of unsettled travel documents.
Recommendation 9
We recommend that the Agency encourage the related claim verifiers to process the claims in a timely manner.
The Agency agreed with the recommendation.
L. Outstanding Reports of Coordinated Research Agreements
119. Administrative Manual IX, Section 6, Programme of Coordinated Research Activities (CRA), paragraph 15 states that annual progress reports and a final report must be submitted to the Agency by all contract and agreement holders. These reports are reviewed by Research Contracts Administration Section (NACA) and evaluated by the responsible Project Officer. In relation to this, paragraph 20 states that the Head of NACA has responsibility among others to maintain records of progress reports of each research, technical and doctoral contract and research agreement, and to inform and remind those concerned when such reports are due.
120. Research contracts state that the contractor shall provide the IAEA with the following reports concerning the implementation of the Research Project:
a. Progress reports: The contractor shall send annual progress reports to the IAEA. The first progress report shall be sent to the IAEA not later than twelve (12) months after entry into force of the Contract pursuant to Article 19 (“Entry into Force and Duration”). Any subsequent annual progress reports shall be sent not later than 12 months after the submission of the first progress report.
b. Final report: The final report shall be sent to the IAEA thirty (30) days after completion of the Research Project, or by the date agreed by the Parties.

GC(63)/6 Page 160
121. Based on analysis of research contract database as of 1 March 2019, the Agency has 1,596 active research contracts, 54 of which do not have reports for more than a year as shown in Table 7 below.
Table 7. The Outstanding Research Contracts Reports
Year of the Last Report Received Number of Contracts
2015 1
2016 9
2017 44
Total 54
122. However, on June 2018, NACA launched new features on CRA Online. One of the new features is related to report due date. With this feature, the project officer could input the duration (in months) after which the report is due. The input duration will be used to calculate report due dates once the contract has been signed. Once the report due date was set, the project officer will receive the system-generated report due notification. The project officer can decide which further action needs to be taken. Since the feature was launched only in the middle of 2018, there were contracts before June 2018 which are without the report due dates.
Recommendation 10
We recommend the Agency to enhance the monitoring system of the research contract to ensure that all reports have been submitted by researchers.
The Agency agreed with the recommendation.
M. Capital Non-Expendable Assets Purchased using Low-Value Purchasing
123. Low Value Purchasing (LVP) procedure is an activity to procure goods and services with values below €3,000 per transaction. The Procurement Authority is delegated to specified staff members who make purchases using a Purchasing Card or by direct charge.
124. As per AM VI, Section 4 – Low Value Purchasing, paragraph 40, one of the unauthorized and/or inappropriate uses of Procurement Authority and the Purchasing Card is the purchase of capital non-expendable assets.
125. We examined the LVP Log Report and Fixed Asset Details Report as of 31 December 2018 and identified 38 items of capital non-expendable assets purchased via LVP with a total aggregate cost of €25,103.00. These assets consisted of 26 items amounting to €18,024.61 and 12 items amounting to €7,078.39, managed by the Department of Management and the Department of Safeguards, respectively.
126. This issue has been mentioned in the 2016 and 2017 Audit Reports with the recommendation to implement measures to improve internal controls, seeking to avoid the use of LVP to purchase goods and services which are not allowed to be purchased via LVP. Based on our inquiries with the Office of Procurement Service (MTPS) and two purchasers, it is known that the most probable cause of this recurrent matter is the uncertainty of what items are considered as capital non-expendable assets at the time of purchase. In order to prevent this matter from reoccurring, MTPS has engaged in an extensive training campaign on the LVP programme and ethics and is regularly auditing LVP transactions. According to MTPS, AIPS LVP report was also enhanced to allow a more targeted MTPS review of LVP transactions. As a result of this compensating measures and controls, the number of capital

GC(63)/6 Page 161
non-expendable assets purchased via LVP decreased from 215 items in 2017 to 38 items in 2018 as shown in Figure 3 below. The training and audits will continue as part of the standard administration of the LVP programme, and thus the recommendation was considered implemented.
Figure 3. Number of Capital Non-Expendable Assets Purchased via LVP
127. Furthermore, MTPS has already planned to introduce additional LVP item code(s) in AIPS to capture the purchases in a similar manner as done through standard MTPS purchase orders. This plan is expected to be completed in 2019, together with appropriate changes in the relevant section of the Administrative Manual.
MANAGEMENT OF THE AGENCY PROCUREMENT
BACKGROUND
128. As the international centre for cooperation in the nuclear field, the IAEA (the Agency) works with its Member States and multiple partners worldwide to promote the safe, secure and peaceful use of nuclear technologies. As set out in its Statute, to support its activities the Agency may arrange for the supply of any materials, services, equipment, and facilities necessary for the project by one or more members or may itself undertake to provide any or all of these directly, taking into consideration the wishes of the member or members making the request. The arrangement of such supply is done through project management and may involve a procurement process.
129. The Office of Procurement Services (MTPS) is an office under the Department of Management (MT) that leads the procurement activities of the Agency. The Director of MTPS (DIR-MTPS) is responsible and accountable for the procurement function in the Agency. DIR-MTPS may delegate procurement authority to other Agency staff, by the relevant Rules as referenced in the relevant Table of Authority.
130. MTPS procures goods and services in support of the IAEA's mandate for delivery to counterparts in Member States throughout Africa, Asia, Europe, and Latin America, and for delivery to the IAEA's Headquarters in Vienna, Austria, and its field laboratories and offices. There is a broad range of goods and services purchase by the Agency, either to maintain operations at IAEA headquarters, such as office equipment and supplies, facilities management services, information and communication technology or to support agency’s field projects in Member States.
131. The procurement of goods, services and/or works in the Agency may involve any of the technical departments in the Agency. The process consists of a series of steps mostly done through the Agency-wide Information System for Programme Support (AIPS). AIPS is used to enter requisitions

GC(63)/6 Page 162
and to authorize a budget allotment for those requisitions. It is also used to issue solicitations and purchase orders (PO) and to enter receipt dates pertaining to goods readiness/shipment/delivery, processing of invoices, and asset management information against the items procured. System-wise, the process starts with a requisition from the requesting division and ends when the PO is finally closed. However, there are other procurement matters such as planning, communication, commitment and awareness of every stakeholder, and the evaluation process that need to be considered to ensure the achievement of efficient and effective procurement processes.
132. Our audit scope covered procurements conducted by MTPS during the period of 1 January 2017 to 30 June 2018 in respect of Nuclear Security Division (NSNS) and Technical Cooperation Department (TC). The principal researchable question for this theme was: “To what extent does the Agency have an effective procurement management to support the Agency's activities?” and cascaded into the following three researchable questions:
a. Has the Agency effectively planned its procurement?
b. To what extent has the Agency effectively monitored contract implementation?
c. Has an effective evaluation of procurement process been in place?
133. The audit was performed by focusing on selected samples of procurement transactions including regular and field procurements.
AUDIT FINDINGS
134. From January 2017 to June 2018 there were 1,625 procurement transactions undertaken amounting to €51,877,673 related to NSNS, a division under the Department of Nuclear Safety and Security, and TC. Analysis on 19 out of the 1,625 transactions amounting to €7,073,421 shows that:
a. the duration between requisition submission to PO issuance varies from 0 to 598 days;
b. the duration of late delivery (comparing the contracted delivery date to the actual delivery date or at least 30 June 2018 for the unclosed POs varies from 39 to 375 days.
135. It is confirmed that some of those items experienced a late delivery to the end-user. During procurement process, if there are issues in delivering the items, the Agency will try to resolve them e.g. by communicating intensively with the relevant stakeholders, such as the freight forwarder, supplier and recipient. There were no complaints recorded from the recipient or user since the ultimate goal of the delivery process is to have the arrival and utilization of the items by the recipient. However, if the items are delivered on schedule, the receiver can utilize or have benefit from them much sooner and the related project can perform as planned.
A. Requisition Establishment in the Procurement Planning Phase
136. The planning phase of a procurement process plays an important role in the achievement of procurement objective as well as part of success factor of a project. It consists of several activities such as developing procurement forecasting, formulating technical specification as part of a requisition, and budget estimation. For example, during the design phase of a TC project and the establishment of Divisions’ procurement forecasting, MTPS has designated teams who can take part in the forecasting activities (annual procurement plans) and may identify the possibility of common needs that may occur in different projects for consolidation of requirements to achieve the best value for money objective.

GC(63)/6 Page 163
137. Some challenges have been identified in the writing of technical specifications as part of requisition submission. To address this, MTPS has conducted several training sessions on the formulation of technical specification, aiming to assist technical officers in developing technical specifications to the standards required to ensure fair, transparent and effective competition. Additionally, MTPS has initiated a project to build a technical specification library to provide examples and indicative template of specifications for generic goods and services.
138. Our observation on the requisition establishment shows the following condition:
Prolonged Process of Technical Specification Establishment
139. The formulation of technical specification, when applicable, is the first point in the procurement process. It is necessary to develop technical specification that ensures fair, transparent and effective competition. Having technical specifications meeting these requirements already at the outset of the requisition will assist to expedite the starting of the bidding process that will eventually influence the achievement of the programmatic goal and objective.
140. As the technical department submits a requisition, MTPS reviews the technical specification and may return it to the technical departments with comments. The technical officer (TO) is required to revise the technical specification in accordance with and/or in consideration of MTPS’ comments. If the comments are substantial and/or require more analysis involving member state/counterpart, the revision and exchanges might be a lengthy process.
141. This back and forth review process from the submission of requisition until the finalization of a procurement plan, when applicable, preparation of bidding documentation and until the solicitation is issued, will impact the timeframe of procurement process. The sample analysis of 13 POs indicated that the average duration from requisition submission until publishing the request for quotation (RFQ) or request for proposal (RFP), is 98 days, with a range of 3 to 303 days. However, since the specification review process is conducted outside the system (AIPS), there are no records to track and monitor the status of the technical specification review. Therefore, it is difficult to identify which phase caused the delay, the parties that hold responsibilities for the delay, and action to be taken to expedite the issuance of the RFP/RFQ. Additionally, lessons learned from best practice of shortest duration cannot be utilized.
Recommendation 11
We recommend that the Agency:
i. improve the AIPS by providing a feature enabling users to monitor the status of requisition review process; and
ii. require the Technical Departments to increase MTPS involvement in the initial planning/development of technical specification before the submission of requisition to accelerate the issuance of the solicitation process.
The Agency agreed with the recommendation.
Determination of The Need-By Date of a Procurement
142. In AIPS, technical officer/requestor is required to identify the need-by date of the goods and services that are planned to be procured. The need-by date should reflect the specific date by when the contract/purchase order/agreement should be in place or by when the goods/services/works are required and may serve as the estimated time of delivery or completion of the contracting process. Thus, it needs to be accurate and reliable.

GC(63)/6 Page 164
143. In practice, the need-by date in the requisition is set by default in AIPS to 90 days from requisition creation date, which represents the average time by when the bidding, evaluation and selection process should be completed in a standard, straight forward procurement. The TO/requestors can change the date manually otherwise the relevant default date remains. Moreover, in order to accurately capture urgent requirements and understand any urgent request that needs to be prioritized, MTPS has introduced tips in AIPS instructing the Requisition Preparer to provide relevant information/justification and the specific required need-by date in the Note to Buyer field.
144. Sample testing of six NSNS requisitions showed that the need-by date was set by a default system, indicating that the requestor did not identify a specific need-by date on the requisition. Furthermore, the need-by date and contracted delivery dates were not aligned in these samples. Mostly, the contracted delivery dates exceeded the need-by dates, which may suggest that the goods were not delivered in time as needed by the users but this cannot be concluded from the system data since the need-by date was defaulted by the system. This condition is also a common practice in TC projects where the establishment of the need-by date in the requisition does not affect the determination of date of delivery. The technical departments as the requestor need to formulate an accurate and reliable need-by date of a procurement that will help communicate the urgency of procurement for time-sensitive projects. The need-by date should consider the duration of the bidding process, supplier’s lead time and delivery time estimation by, for example, using data from global freight forwarder on the average delivery time needed for similar items per country.
145. By communicating the sense of urgency of specific procurement, MTPS will be able to prioritize on that particular procurement and allocate its resources to meet the technical divisions procurement needs, in which case, the realistic need-by date data can be utilized as selection criteria in the bidding process. We are of the opinion that the technical departments need to encourage their requestors or technical officers to be aware of the importance of the need-by date of a procurement and to communicate MTPS, for those urgent cases, accurate and realistic date in the requisition submission.
Recommendation 12
We recommend that the Agency:
i. formulate a more accurate AIPS default need-by date of a procurement by utilizing the available data on the current average duration of the procurement process and delivery time; and
ii. encourage, through MTPS, requestors to identify in the requisition justifiable circumstances that would grant consideration of a realistic earlier or later need-by date.
The Agency agreed with the recommendation.
B. The Procurement Delivery Process
146. The Agency mainly uses its contracted Global Freight Forwarding (GFF) services to deliver field procurements. It is required to provide comprehensive delivery services until the goods are received by the consignee. The services include, but are not limited to, ensuring the export (if applicable) and import compliance, coordinating with suppliers, proper packaging, as well as coordinating with other stakeholders (UNDP, counterpart, and relevant ministries in countries of destination) to obtain the authorization to ship also referred to as “greenlight”.
147. The GFF provides the Agency with a tracking system, quarterly report of procurement timeline, invoice reports, as well as a log of issues concerning procurement delivery. Analysis on the processes

GC(63)/6 Page 165
of greenlight and handover based on this report, shows that three regions (Africa, Americas, and Asia Pacific) have a longer process period compared to the other two regions (Oceania and Europe).
148. In these processes, the GFF is responsible for coordinating with the supplier, counterpart, customs authority and other related stakeholders. Apart from that, the Member States commitment and readiness to facilitate the delivery of the goods also affects the preparation and approval of the necessary documents, including charges resulted from the process.
149. Further analysis revealed that the process of preparing the necessary document substantially contributes to the lengthiness of procurement delivery process. In one of the TC Projects, we found that it took more than seven months to get customs clearance due to the Member State’s process.
150. Incomplete shipping documentation also contributes in this lengthy process. In some cases, we found that the GFF mistakenly entered institution name in the request for custom exemption and had not yet processed the custom clearance. In other cases, the GFF filled in incorrect information on the paper, thus sometimes they had to restart the custom clearance process all over again.
151. This lengthy process can potentially cause unplanned costs emerging from customs charges or excessive storage charges. We identified that during the period of 2017 until first quarter of 2018, the Agency had to pay more than €148,000 to the GFF for customs at destination (which includes customs clearance fee, customs inspection and, when applicable, customs duties). The GFF contract allows them to charge the Agency for customs clearence fee, customs inspection and customs duties, the latter, as may be authorized by the IAEA.
152. We are of the opinion that, with solid support from Member States, the custom duties charges are possible to be minimized since the items are for non-profit purposes and procured upon Member States needs. Also, with such solid support from Member States, the timeframe for the IAEA (through UNDP or the end-user, as and when appropriate) obtaining the tax exemption to enable duty free importation and the customs clearance process, may be shortened.
153. The GFF is also required to provide the related supporting documents for any of the above charges which shall be available on their web-based real time portal for tracking shipments. While this requirement is clearly stated in its contract, it did not thoroughly upload the supporting documents for costs charged to IAEA. Our observation on five POs with the status closed/finally closed invoiced by the GFF to the Agency shows that the supporting documents of these POs were not uploaded to the portal. We believe that the availability of a complete supporting documents in the portal could be useful in evaluating shipment/delivery for provision of goods and services, for example analysis of customs at destination costs since, according to the Statement of Work (SoW), the Agency has the right to deny such costs.
154. Additionally, we also observe that the Agency experiences a difficulty in systematically identifying any unplanned cost emerging from the lengthiness of the delivery process. The GFF invoice report does not breakdown charges resulted from long delays in the process. The Agency has to find the information on a case by case basis. The presence of systematic information will help the Agency evaluate the delivery process so as to mitigate and reduce issues in future projects.
GC(63)/6 Page 166
Recommendation 13
We recommend that the Agency:
i. through the Technical Departments, with the support of MTPS, build a more intensive coordination with Member States to enhance their awareness of the importance of MSs’ solid support and strong commitment in ensuring a timely, effective and efficient procurement process and delivery;
ii. consider the possibility of collaborating with Customs related international organization to benefit from their knowledge to enhance the approach to resolve customs issues;
iii. require MTPS to improve the invoicing report from the GFF to obtain a sufficient and clearly identifiable level of breakdown of charges related to unplanned cost emerged from delays and to utilize the information gained as a lesson learned for continual improvement; and
iv. through MTPS, request the GFF to ensure that the complete documentation is properly uploaded in a timely manner in the record-keeping system of shipping documents.
The Agency agreed with the recommendation.
C. The Utilization of the Agency-Wide Information System for Programme Support
(AIPS)
155. In 2011, the IAEA began implementing AIPS as an Enterprise Resource Planning (ERP)which covers planning, finance, procurement, project management, human resources and administration. Most of procurement activities are done through AIPS. The Agency’s Administrative Manuals (AM) states that AIPS is used to enter requisitions and to authorize budget allotment for those requisitions. It is also used to issue solicitations and Purchase Orders (PO) and to enter receipt dates pertaining to goods readiness/shipment/delivery, processing of invoices, and asset management information against the items requisitioned.
156. Our analysis on the procurement documents and discussion with procurement related staffs revealed that there are some system challenges, as follows:
Notification Email
157. Currently the AIPS provides a feature to notify that a procurement exceeds its contracted delivery date (delay notifications). Two weeks after a contracted delivery date is past due, AIPS will automatically generate an email to respective PO parties/stakeholders (e.g. requestor/TO, PMO, end-user and the supplier) notifying that the delivery is behind the schedule. This email will continue being sent every two weeks until the goods are receipted in the system by the responsible receipting unit(s) after obtaining proof of delivery. This feature can also serve as an early warning system if it generates such email sooner, before a PO reaches its contracted delivery date.
Actual Procurement Timeline
158. The AIPS provides a significant amount of dates relating to the procurement process, which can be utilized as a tool to monitor the procurement activities. However, to some extent, these dates are insufficient to generate a reliable measurement of the procurement processes since they do not always reflect the actual delivery time. The delivery dates entered into AIPS derive from the receipt dates which, due to system accounting setup, are limited to the month during which the receipt is entered and thus in

GC(63)/6 Page 167
most of the cases this will not allow the capture of the actual receipt date of the procured items, if entered at a later date.
159. In addition to AIPS, the Agency can access the GFF tracking system to monitor and update the goods shipping status. The GFF also provides, upon request, a detailed report on procurement delivery timelines per country. Accessing the system and producing such report is limited to a single transaction at a time. The MTPS manages multiple transactions simultaneously and needs the report for those transactions at any time. Thus, relying on the GFF system to monitor procurement timeline alone would unlikely resolve the issue of monitoring. We are of the opinion that the presence of a reliable information on the procurement timeline in AIPS will improve the accuracy and sustainability of procurement monitoring and evaluation.
Discrepancies in PO dates
160. Our observation found that the delivery date on POs is the same as or precedes the PO issuance date. It is stated that this condition is happening due to several reasons such as limitations of the system that does not allow any revisions, in case of error, after PO approval or the nature of the obligation. For example: a PO is issued for internal obligation only, for the payment of routine activity or on-going services where the PO did not reflect a particular “delivery” date as the services did not have a fixed delivery date (i.e. electricity, maintenance, telephone). Another example: if the buyer mistakenly entered the currency or the supplier in the PO and the PO has been approved, the system will not allow them to revise the PO, in which case, the buyer must issue a new PO to replace the original one. Ideally there should be a linkage between the old and the new PO so as to ease tracking the changing log. However, the AIPS does not provide an automatic link between those POs.
Recommendation 14
We recommend that the Agency:
i. explore enhancements to AIPS for generating an early warning system to enhance the management of deliveries seeking to reduce the cases of delayed deliveries and providing accurate receipt and delivery data; and
ii. enhance the PO issuance process starting from the preparation and approval process so as to minimize human error, and by resolving the issue of discrepancies between the date of delivery and PO issuance date.
The Agency agreed with the recommendation.
D. The Need of a Comprehensive Supplier Performance Database
161. Selected suppliers are presumed to be capable in providing goods and services that meet the requirements of the Agency in terms of quality, quantity, and timeliness. At the time of the audit report, the Agency has not established a supplier performance database as required by the Administrative Manual (AM). Performance issues are handled on a case-by-case basis.
162. The Agency currently has 6495 active suppliers (vendors) registered in AIPS. For every procurement above €25,000 MTPS must identify in the procurement plan how supplier’s performance will be measured. The most common Key Performance Indicator (KPI) used is “delivery on time within price”. In other cases, bidders may be asked to submit proposed KPIs as part of their technical proposal to be considered in the technical/commercial evaluation. Such requests are made on a case-by-case basis depending on the requirement, value, complexity and strategic importance. KPIs may also be prescribed

GC(63)/6 Page 168
by the Agency. The KPIs are for the relevant contract. However, suppliers are not requested to include the suppliers’ KPIs achievement from previous contracts with the Agency (if there is any). This suggests that the TO and the buyer during the technical/commercial evaluation may be uninformed about suppliers’ past IAEA KPIs achievements/ratings.
163. The Agency stores all documentation of procurement process, including correspondences between stakeholders in the document hosting site named ROAD. The data is sorted based on project/PO number. Currently MTPS may find out about a supplier’s past performance by reviewing this documentation. Reviewing potential suppliers’ past performances through manually retrieving the data from the ROAD and analyzing their recent performance could be an alternative to the comprehensive supplier database. However, such effort is time consuming and has limitations since the completeness of data recorded in ROAD may not always be up-to-date. We are of the opinion that the limitations of the ongoing supplier performance evaluation could be detrimental for the aim of procurement activities. Also, managing 6495 active suppliers (vendors) could be a very challenging task if done manually. Hence, it is imperative for the Agency to develop a comprehensive supplier performance database to ease the Agency in monitoring and tracking their performance.
Recommendation 15
We recommend that the Agency require MTPS to develop a system to record suppliers’ performance in a more comprehensive manner and to maintain a supplier performance database to monitor and facilitate the evaluation of the supplier’s performance.
The Agency agreed with the recommendation.
E. Clear Roles and Responsibilities in the Procurement Process
164. The Agency has established procurement roles and responsibilities in the AM and put into the Agency wide practice. Nonetheless, the current roles and responsibilities established in the AM do not define the further detailed description of task for each officer. Based on our observation, there are some gaps in current practice that increase the risk of unnecessary prolonged delay in the process of procuring goods and services. Two examples below illustrate the issue:
Early involvement of MTPS in the planning phase of projects
165. The detailed delivery transactions information and the statistics for the goods shipped by the GFF, is available, and in particular, MTPS may request such information related to deliveries to a particular country. This data from GFF is beneficial in planning the field procurement since it provides information on which particular recipient countries that have had problems with customs clearance. TOs and PMOs can use the data to encourage the respective counterparts to actively monitor the custom clearance process during the planning stage of the projects. In addition, early involvement of MTPS in the planning stage of projects will enable them to make timely assessments on the complexity of the procurement and will help them appropriately allocate the resources. The ideal condition above has not been put into practice. There is an information gap between MTPS and TC regarding the data from GFF. The ongoing practice regarding the data from GFF has been that the MTPS may obtain the country report only if requested. On the other hand, the TO is waiting for MTPS to share the Bollore data.

GC(63)/6 Page 169
The Dissemination of and Feedback on The Supplier Performance
166. The process of supplier’s performance feedback is depicted in the following figure:
Figure 4. Supplier's Performance Feedback Process
167. At the time of audit report, the Agency has not established a supplier performance database. This database would serve as a tool to monitor the suppliers’ performance and a reference in evaluating a supplier’s past performance during the bidding process. Due to the absence of this database, in evaluation and selection stage, the Agency may evaluate a supplier’s past performance by reviewing a number of supplier’s past POs supported with relevant documents and, as relevant, by requesting in the “Special Instructions to Bidders for Preparation of the Proposal” that bidders specifically provide information on past performance including under previous IAEA orders as part of the Technical Proposal. The IAEA may contact the references provided by the bidder to request information about contract performance.
168. This method requires substantiated feedback on supplier performance from all involved stakeholders. However, there currently is no mechanism enabling MTPS to collect such substantiated and comprehensive feedback on a systematic basis. According to NSNS, this may be partially due to the fact that roles and responsibilities related to the provision of feedback, on supplier performance, are not clearly defined. However, in good procurement practices it can be expected that the parties implementing the project (PMOs, TOs) are in the unique position to assess performance of suppliers (delivery on time, performance in accordance with technical documents, provision of deliverables, attendance to meetings).
Recommendation 16
We recommend that the Agency through MTPS further clarify and disseminate roles and responsibilities of parties engaged in the procurement process.
The Agency agreed with the recommendation.
Technical & Commercial Evaluation
(bidding process)
Deliveries of goods and services
Feedback on the
performance of suppliers
Updating the supplier's
performance database

GC(63)/6 Page 170
MANAGEMENT OF THE AGENCY PUBLICATION
BACKGROUND
169. Publications are instrumental to the achievement of the IAEA objectives as they are a principal means for disseminating the results of the work carried out in its scientific and technical programmes, and for disseminating the integrated, comprehensive Safety Standards issued according to the IAEA’s Statute. For technical departments, Agency publications are an important way to inform of their activities and are seen as major outputs from all the technical programmes.
170. The Agency publishes a diverse range of publications such as the coordinated Safety Standards that are managed as a comprehensive, interdependent suite of publications that provide Member State consensus recommendations and dedicated edited topical series such as the Nuclear Energy Series. In addition to this the IAEA also produces the TECDOC Series which report on many aspects of the IAEA’s work but are not required to be of the same quality as the fully edited Series, due to the expectation that the information included will have a shorter life-span or require more frequent updates than fully edited series.
171. The Publishing Policy states that the objectives of the Agency’s publishing activities are to “serve the needs and interests of Member States, as reflected in the biennial results-based programme and the feedback received from Member States” and “ensure the widest possible dissemination of information and to do this in a timely, cost-effective and efficient manner…”.
172. The publishing process typically begins with the inception of an idea for a publication as a project output within a Division. In most Departments a document review committee considers the proposal and decides whether a publication is warranted and how it should proceed. After a document is prepared and receives the proper Divisional sign-offs as well as the approval of the document review committee, the author fills out a proposal form and submits it with the manuscript to the Publications Committee (PC) for review.
173. Once the document receives PC approval, it is passed to the Publishing Section (PS) for editing, layout and proofreading. After the proofs of the manuscript are signed off by the author and the editor, it is posted onto the web and processed for printing. Following a number of printing steps, the published product is released for distribution and sale, if appropriate. Publishing and printing work have also been undertaken by external contractors, as appropriate. Considering this workflow, both the technical departments and PS are integral parts of the publishing process that should work collaboratively.
174. Our audit covered the planning, monitoring, and evaluation activities of publications management as an integrated process within the Agency. The principal researchable question for this audit particularly in regard to management of the Agency publications was: “To what extent does the Agency have an effective publication management to support the Agency’s objectives?” and cascaded into the following three researchable questions:
a. Has the Agency effectively planned its publication?
b. To what extent has the Agency effectively monitored the publication process?
c. Has an effective evaluation of the publication process been in place?
The audit was performed by focusing on selected samples of publications including Safety Standards and Nuclear Energy Series.
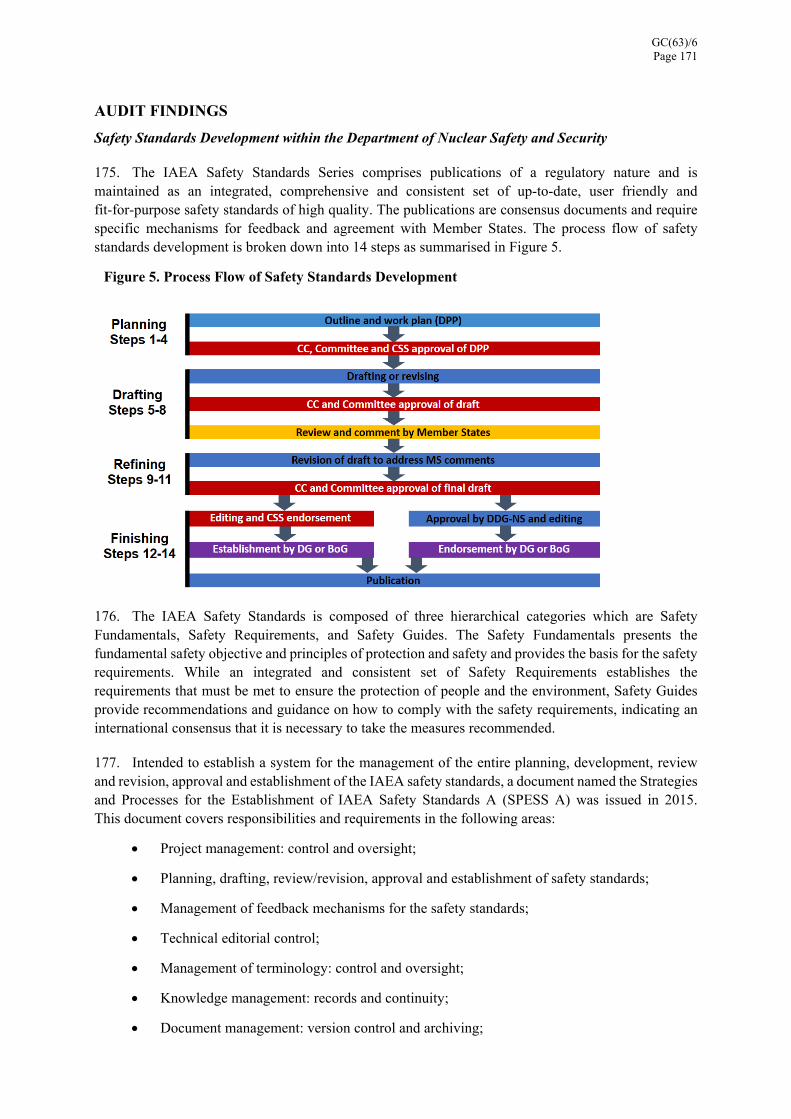
GC(63)/6 Page 171
AUDIT FINDINGS
Safety Standards Development within the Department of Nuclear Safety and Security
175. The IAEA Safety Standards Series comprises publications of a regulatory nature and is maintained as an integrated, comprehensive and consistent set of up-to-date, user friendly and fit-for-purpose safety standards of high quality. The publications are consensus documents and require specific mechanisms for feedback and agreement with Member States. The process flow of safety standards development is broken down into 14 steps as summarised in Figure 5.
Figure 5. Process Flow of Safety Standards Development
176. The IAEA Safety Standards is composed of three hierarchical categories which are Safety Fundamentals, Safety Requirements, and Safety Guides. The Safety Fundamentals presents the fundamental safety objective and principles of protection and safety and provides the basis for the safety requirements. While an integrated and consistent set of Safety Requirements establishes the requirements that must be met to ensure the protection of people and the environment, Safety Guides provide recommendations and guidance on how to comply with the safety requirements, indicating an international consensus that it is necessary to take the measures recommended.
177. Intended to establish a system for the management of the entire planning, development, review and revision, approval and establishment of the IAEA safety standards, a document named the Strategies and Processes for the Establishment of IAEA Safety Standards A (SPESS A) was issued in 2015. This document covers responsibilities and requirements in the following areas:
Project management: control and oversight;
Planning, drafting, review/revision, approval and establishment of safety standards;
Management of feedback mechanisms for the safety standards;
Technical editorial control;
Management of terminology: control and oversight;
Knowledge management: records and continuity;
Document management: version control and archiving;

GC(63)/6 Page 172
Cooperation: consultation and collaboration.
178. The document is accompanied by a separate SPESS B, C, D, E, and F as described in Figure 6.
Figure 6. SPESS Management System
179. Our analysis on the development process of Safety Standards found some areas that could be improved by the Agency, as follows:
Performance Indicators for the Assessment of SPESS Application
180. As mentioned in the SPESS A, the implementation of the system of strategies and processes should be periodically assessed by the Secretariat. An assessment should be conducted every three to five years as an input to the review/revision cycle. The Deputy Director General initiates the process through the establishment of an assessment team. For that purpose, the document also recommends the development of performance indicators to be reviewed through the implementation of SPESS.
181. We observed that NS Department has not formulated specified performance indicators in support of a systematic assessment and review process on the implementation of strategies and processes outlined in the SPESS A. The performance indicators and SPESS implementation assessment are useful for the continual improvement of the safety standards management and ensuring the full implementation of this quality management system.

GC(63)/6 Page 173
Recommendation 17
We recommend that the Agency:
i. intensify an assessment and review process of the implementation of SPESS, reporting on the results periodically; and
ii. consider formalizing relevant performance indicators to assist in assessment of the implementation of SPESS.
The Agency agreed with the recommendation.
Implementation of Effective Feedback Mechanisms through Nuclear Safety Standards-Online User Interface (NSS-OUI)
182. The SPESS A advocates a more efficient approach for the review, revision, and publication of the safety standards with the following objectives:
To ensure that the review and revision of published standards is based on a systematic feedback collection and analysis process;
To ensure that any revision of the safety standards or part of the safety standards is justified by the above-mentioned feedback process, therefore also ensuring stability of the parts of the standards that remain valid;
To maintain the technical consistency among the standards through management of the standards as a complete collection rather than by individual management of individual standards;
To enhance semantic consistency through systematic use of harmonized terminology;
To ensure the completeness of the collection through a systematic top-down development approach complemented by topical gap analyses; and
To support harmonized use and application of the safety standards by enhancing their user-friendliness and by providing tools for user to easily navigate within the whole collection.
183. To support the implementation of this approach and as part of the knowledge and content management system throughout the review and revision process of safety standards publications, the Agency has invested to develop a new IT platform named Nuclear Safety Standards-Online User Interface (NSS-OUI). The basic elements of this platform, as described in Figure 7, include, among others:
Central feedback mechanism to collect and retrieve feedback (both by publication and by topical areas) at any time and from anywhere;
Access and browse the content of the safety and security related Series of publications;
Browse Overarching Requirements and then navigate top-down or across the Series using references and additional explicit relationship notes;
Browse Overall Recommendations for Nuclear Security and SSR-6, and then navigate top-down or across the Series using references and additional explicit relationship notes;

GC(63)/6 Page 174
Possibility to link to relevant TECDOCs, Safety Reports and EPR Series, or even to import their introduction with tagging to make them also searchable;
Possibility to link to relevant e-learning tools;
Advanced search capability with four ontologies (topical areas, type of facilities and activities, target audience, lifetime);
Relationship search capability (search all implicit relationship);
Mechanism to easily update the explicit relationships;
Mechanism to import new or revised standards while keeping access to previous versions.
Figure 7. The Central Role of NSS-OUI Platform in the Revision and Publication Process
184. The development status of the platform has covered the following features:
All Safety Standards available and tagged;
Advanced topical search, with also a "search the search criteria" tool and capability to expand all branches to search directly into the ontology;
New relationship search display, more user-friendly;
New html version of the Safety Glossary available, complying with the W3C KOS standards and ISO 25964. Glossary relationship ready for semi-automatic tagging to import as metadata the definitions and associated information notes for defined terms used in the text of the publications; and
Mechanism to start revision processes in place.
185. Having been supported with the aforementioned basic elements, including a central feedback mechanism, the NSS-OUI platform is still in the early stages of accumulating feedback for the safety standards that are available in the system. Currently, each division within NS Departments still uses manual records of feedback resulted from committee meetings, safety review missions, Technical Cooperation activities, and other sources to be analysed when reviewing and proposing revision for the published safety standards. Due to the current process there is a potential to lose knowledge upon staff
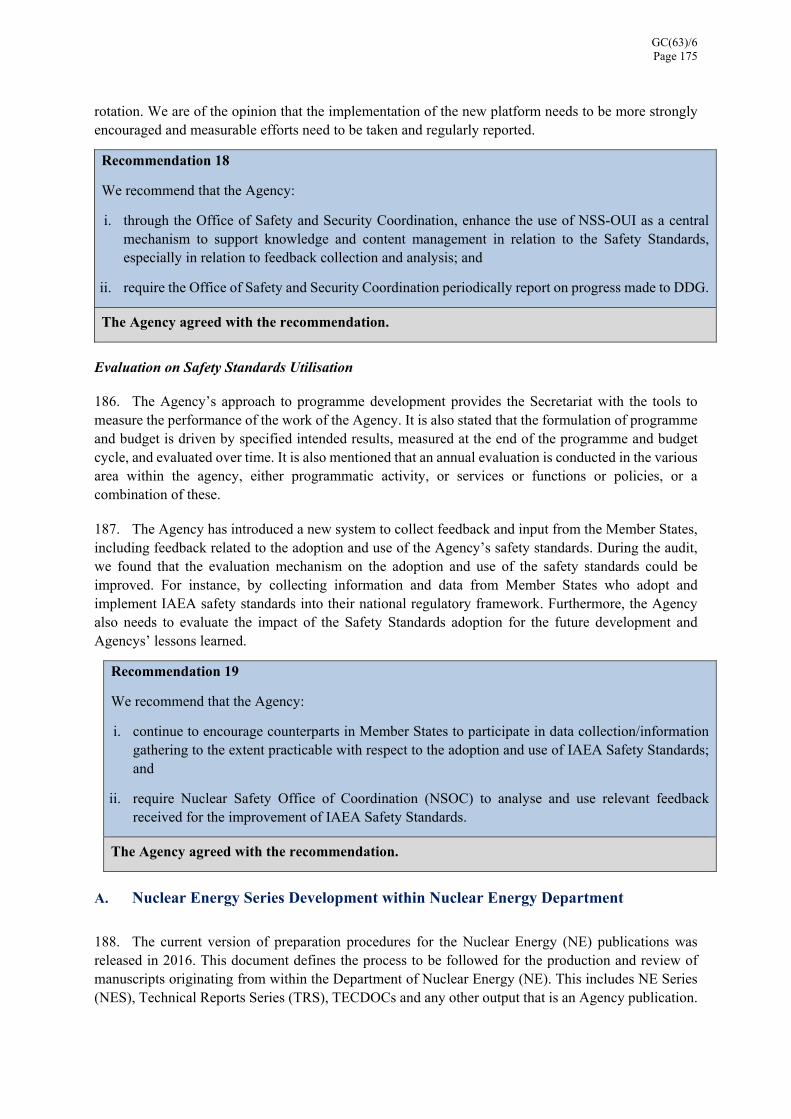
GC(63)/6 Page 175
rotation. We are of the opinion that the implementation of the new platform needs to be more strongly encouraged and measurable efforts need to be taken and regularly reported.
Recommendation 18
We recommend that the Agency:
i. through the Office of Safety and Security Coordination, enhance the use of NSS-OUI as a central mechanism to support knowledge and content management in relation to the Safety Standards, especially in relation to feedback collection and analysis; and
ii. require the Office of Safety and Security Coordination periodically report on progress made to DDG.
The Agency agreed with the recommendation.
Evaluation on Safety Standards Utilisation
186. The Agency’s approach to programme development provides the Secretariat with the tools to measure the performance of the work of the Agency. It is also stated that the formulation of programme and budget is driven by specified intended results, measured at the end of the programme and budget cycle, and evaluated over time. It is also mentioned that an annual evaluation is conducted in the various area within the agency, either programmatic activity, or services or functions or policies, or a combination of these.
187. The Agency has introduced a new system to collect feedback and input from the Member States, including feedback related to the adoption and use of the Agency’s safety standards. During the audit, we found that the evaluation mechanism on the adoption and use of the safety standards could be improved. For instance, by collecting information and data from Member States who adopt and implement IAEA safety standards into their national regulatory framework. Furthermore, the Agency also needs to evaluate the impact of the Safety Standards adoption for the future development and Agencys’ lessons learned.
Recommendation 19
We recommend that the Agency:
i. continue to encourage counterparts in Member States to participate in data collection/information gathering to the extent practicable with respect to the adoption and use of IAEA Safety Standards; and
ii. require Nuclear Safety Office of Coordination (NSOC) to analyse and use relevant feedback received for the improvement of IAEA Safety Standards.
The Agency agreed with the recommendation.
A. Nuclear Energy Series Development within Nuclear Energy Department
188. The current version of preparation procedures for the Nuclear Energy (NE) publications was released in 2016. This document defines the process to be followed for the production and review of manuscripts originating from within the Department of Nuclear Energy (NE). This includes NE Series (NES), Technical Reports Series (TRS), TECDOCs and any other output that is an Agency publication.

GC(63)/6 Page 176
189. The NE publications process is broken down by the six-phased key milestones, as follows:
Phase 1 - Document Coordination Team (DCT) approval of the Document Preparation Profile (DPP);
Phase 2 - Development of content and supporting data; drafting of manuscript;
Phase 3 - DCT approval of the draft manuscript;
Phase 4 - Publications Committee (PC) approval of the draft manuscript;
Phase 5 – Editing and Production; and
Phase 6 – Publication issued.
190. The process described in the document is intended to ensure that individual responsibility is clearly assigned at each step of the process. It is noted that as of January 2013, Advanced Publishing Advice (APA) provided by MTCD Publishing must be completed before submission to the Publications Committee (PC). NE Series documents receive editing, but other sort of publications such as TECDOCs and Proceedings need to be ‘camera ready’ or ready to ‘go to press’ from a technical standpoint, prior to submission to the PC.
191. In addition, a document titled NE Series Pilot Project for External Review of NES Publications was issued in 2016. The new process described in the document will work primarily by enabling NES document review via at least one Technical Meeting (TM)—returning the final draft document to TM participants for comment—and allowing any Member State that expresses interest, via the proper channel i.e. the Permanent Mission, to provide written comments on a document prior to finalizing it for publication.
192. Our analysis on the development process of NE Series found some areas that could be improved by the Agency, as follows:
Integrated Tracking System of NE Series Development
193. Concerning the key milestones of the preparation of NE publications, the first three phases relate to the manuscript preparation within the NE Department, while the following phases, after a manuscript has been approved by the PC, relate to the editing and production workflow within the Publishing Section.
194. The Publishing Section has a publications database which is accessed by the Publishing Section through customised data interfaces including editing and production. The database records the description of individual publications with a unique record created for each with a reference PC number. Information recorded includes title, series name, the originating division, scientific secretary, number of pages and the processing dates related to milestones from the date of the first PC meeting until the publication issued. Information from these databases can also be accessed through an intranet application, Manuscript Monitor, that allows technical departments to track the status of ongoing publications after PC approval.
195. Currently, the NE Department is initiating a new system to collect feedback from contributors and support the review process during the development of publication draft. The SharePoint platform was tailored from Nuclear Safety Standards-Online User Interface (NSS-OUI) of the NS Department. In addition, a centralized database hosted on share point displays the progress of the manuscript preparation from DPP to Publication. Despite the mentioned system, internally within the NE Department there is no centralised database that allows the management to track single publication ideas

GC(63)/6 Page 177
prior to DPP. We are of the opinion that such an integrated tracking system is necessary particularly as a basis for monitoring the progress of manuscript preparation within the department, complementing information of the publication status in the following process within PS as provided in the Manuscript Monitor.
Recommendation 20
We recommend that the Agency continue developing and implement the centralised database as a basis for monitoring the progress of manuscript preparation within the NE Department.
The Agency agreed with the recommendation.
Addressing Plagiarism Issues at the Beginning of Manuscript Development
196. Once the Document Preparation Proposal (DPP) has been approved by the Document Coordination Team (DCT), the assigned Scientific Secretary (SciSec) schedules consultancies and technical meetings, engages consultant as necessary to finalise the draft manuscript. The NES procedures also mention that the SciSec should request and receive, as early as possible, advice on the requirements of publishing at the Agency from the NE Publications Officer while writing the draft manuscript; and provide the draft document to the Publications Officer to run the plagiarism scanner to ensure original work and proper citation.
197. However, while the participants contribute any part of the draft manuscript, it is possible that they may have published this work previously or will publish during the development of the publication, sometimes contrary to the terms of the agreement with the Agency. Eventually, this would pose a new plagiarism issue to the SciSec in the originating division when the NE draft manuscript enters the editing process in the MTCD-Publishing Section (PS).
198. It was highlighted that for a report there was a challenge with overlapping text and obtaining permissions required for published material. Some of the materials were already published, requiring additional time and work for the SciSec to resolve the issues. As a result, the editing process was more complicated and took longer than usual.
199. Furthermore, based on document analysis, we found that citation issues were already raised by Publication Committee in April 2015 nevertheless other citation issues were detected during pre-editing stage in November 2015. The SciSec explained that responses were made but due to a lot of changes on the draft, it required months to finalize the editing process. The SciSec noted that whilst they work to resolve copyright issues, it is also dependent on the information received from the contributors as stated in the IAEA Admin Manual.
200. It was also explained that the longer the process takes for a publication, the higher the possibility that contributors may have published outside by the time the Agency publication is produced. The SciSec has to address the issue by communicating with individual contributors to revise the related part of the draft manuscript. However, in some cases the SciSec fails to contact the respective authors. Thus, it leaves two options to the SciSec either to revise by himself or herself if the revision is minor, or delete the particular part if the majority of text has been published under copyright elsewhere.
201. Addressing copyright or plagiarism issues at this late stage could cause delay to the overall publishing process and may jeopardize the quality and completeness of the IAEA publication if it is necessary to delete any text covered by third party copyright. Nevertheless, providing sufficient information about the Agency requirement on copyright infringement issues as early as possible while

GC(63)/6 Page 178
writing the draft, as mentioned in the NES procedures, is expected to raise the awareness of the respective contributors so that would prevent the emergence of this issue in the later stages of publication process.
202. One measure that has been initiated by the Publishing Section is presenting information to participants in consultancies or technical meetings about the Agency rules and regulations relating to writing a publication including how to address plagiarism and copyright issues should be considered more widely. These activities have been performed based on the invitation of the originating division and depend on the availability of staff within the PS. We are of the opinion that this sort of presentation needs to be put in all initial consultancies meeting agenda, or providing the SciSec with the relevant supports materials including Frequently Asked Questions to be delivered before the meeting if the respective staff in PS is not available.
Recommendation 21
We recommend that the Agency, through the Publishing Section, continue including support information such as Frequently Asked Questions for the presentation to be delivered by the respective Scientific Secretary in the initial consultancies meeting.
The Agency agreed with the recommendation.
Proper Handover of Publication Information from/to Scientific Secretary
203. During audit observation and interviews, we found that the handover mechanism in place is not implemented consistently. When a staff member leaves, occasionally unfinished documents need to be finalized by the new staff member. Although documentation compilation is archived on IAEA internal repositories of information, some evidence of ineffectively managed knowledge transfer to bridge information gap from previous staff to new ones was identified. We also observed that document handover from predecessors can be informal, which may leave successors with not enough detailed information about the outputs to be delivered.
204. As set out in the IAEA’s “Administrative Manual Part II Section 1” outlining the staff regulations and staff rules, those professional-level staff members are normally subject to seven-year maximum years of service. This rotation policy allows the Agency to have a continuous influx of fresh knowledge and experience at all levels. However, the knowledge and expertise acquired during work at the Agency are potentially lost along with the staff changes.
205. According to Guidelines on Programme Performance IAEA October 2015, the purpose of programme implementation monitoring is to determine the extent to which planned tasks have been implemented and the planned outputs have been delivered. Monitoring is concerned with identifying what was done and detecting any deviations from what was planned. The management and Member States assume that what has been planned will occur and therefore prioritize deviations from what was planned.
206. Our observation on the development of NE Series in a particular topic revealed that during the writing process there were a number of factors that introduced delays to the process including several support staff changes and challenges in resolving copyright and permission issues.

GC(63)/6 Page 179
Recommendation 22
We recommend that the Agency consider developing a knowledge transfer mechanism regarding development of publications to ensure proper handover during staff turnover.
The Agency agreed with the recommendation.
B. Publishing Management within the MTCD-Publishing Section
207. In terms of structure, the Publishing Section in the IAEA is under the Division of Conference and Document Services (MTCD) in the Department of Management. The Section is responsible for all publishing activities of the Agency and consists of three operational Units covering editing, production and dissemination. It publishes publications produced as outputs of the technical programmes in accordance with the decisions of the Publications Committee (PC) and the established distribution, pricing and sales policy.
208. The PC reviews individual scientific and technical manuscripts submitted for consideration as an official Agency publication. The PC ensures that a proposed publication meets the high standards expected for all Agency publications, that the necessary procedures have been followed in its preparation and that the publishing guidelines issued by MTCD have been observed. The PC may approve a manuscript for publication, refer it back to the originating Division for revision or reject it.
209. The Section arranges for editing and preparation of manuscripts in accordance with the Agency style manual, including layout, proofreading, corrections to camera-ready manuscripts, redrawing of illustrations, preparation of cover designs and release of publications for printing and web publication. The Section also has responsibility for the distribution, mailing or shipping, storage and marketing and sales of the publications.
210. Our analysis on the publishing process found some areas within the MTCD – Publishing Section that could be improved by the Agency, as follows:
The Capacity of Internal Editorial Resources in Processing the Draft Manuscript of Publications
211. Considering the whole process of publications within the Agency, all draft manuscripts (other than TECDOCs and TECDOC-like) prepared by each originating division will enter the queue for editing services following the PC approval. Because for technical departments publications are an important way to inform Member States and the public of their activities and are seen as major outputs from all the technical programmes by which their performance is measured, each originating division expects their submitted manuscript to be processed by the MTCD Publishing Section.
212. Over the past two years, internal editorial resource has fluctuated between three and six full time editors. As of September 2018, there are three full time editors in post, one vacancy and one temporary editor on a one-year post. Provided with the existing editorial resources, 39 titles of publications are in the queue waiting to be assigned to editors. The Head of Publication Section stated that the MTCD-PS makes a priority list for the queueing publications by considering several factors including:
DG prioritization
Capacity/number of in-house editors and their current workloads;
Prioritization by DDG/ DIR via IOM;
PC approval date;

GC(63)/6 Page 180
Size and complexity of manuscript;
Quality of manuscript;
Prioritization by technical department SH (where SH is responsible for multiple manuscripts);
Series type and subject area (only certain types of content sent to freelancers);
Fixed deadlines (GC, Conference, Major IAEA initiative); and
Other commitments (Editing Unit also edits, and in some cases acts as the project manager for, a number of recurring publications such as the Annual Report, CNPP, CCNP, RDS-1, RDS-2 and OPEX).
213. To help clear the backlog of manuscripts and initiate a new process for editing and publishing Safety Standards, from September 2017 to September 2018, the Nuclear Safety (NS) Department provided funding for an additional editor position. However, that resource is no longer available.
214. We observed that the current number of Agency manuscripts in the queue for assignment to an editor that were approved six, or more, months ago shows that the existing capacity of editorial resources within the PS surely cannot balance the number of publications entering the workflow.
215. We consider that three issues need to be highlighted at this point in addressing the problem. Firstly, the rules for prioritisation need to be clearly communicated to all relevant stakeholders in the Agency so that implementation of fair mechanism can be assured. The second is encouragement of initiatives and development of strategies for efficiency improvement throughout the whole process of publications management particularly related to the editing process. Thirdly, the under-resourced editing services need to be addressed at the high level of the Agency management considering that the existence of bottleneck within the publication’s workflow will decrease the overall Agency capacity in the dissemination of its programmatic outputs.
Recommendation 23
We recommend that the Agency:
i. clearly communicate to all relevant stakeholders, with supporting documentation, the parameters taken into account when prioritising manuscripts and assigning work within the Publishing Section;
ii. continue to identify initiatives and develop strategies for efficiency improvement throughout the whole process of publications management particularly related to the editing process; and
iii. address the under-resourced editing services at the high level of the Agency management.
The Agency agreed with the recommendation.
OTHER MATTERS
Cases of Fraud and Presumptive Fraud
216. The management reported to us that although areas for improvement in internal control exist, the Office of Internal Oversight Services (OIOS) in 2018 found evidence of one case proven fraud. This proven fraud related to travel claim and has financial impact amounting to €1,941.00.

GC(63)/6 Page 181
217. OIOS is also investigating two cases of presumptive fraud against the Agency and as at 31 December 2018, these allegations are still under investigation.
Write-offs
218. Receivables amounting to €30,820.29 were written off in 2018. This write-off includes the following:
Table 8. Detail of Write-Offs
No Item Description Amount Written Off (in Euro)
1 Payroll Receivables irrecoverable 6,083.85
2 Agency’s Laboratory sales invoice 21,250.00
3 Agency’s Publications sales invoices 43.12
4 Private Long-Distance Call Charges 3,443.32
Total 30,820.29
Loss Equipment
219. According to AIPS records in 2018, there were 18 capitalized assets costing €16,959.00 with net book value of €2,390.85 and two expensed type assets with acquisition cost amounting to €1,331.50 which were declared lost.
Ex-Gratia Payments
220. No ex-gratia payments have been made during 2018.
RESPONSE TO PAST EXTERNAL AUDITORS’ RECOMMENDATION
221. Response of Management indicating action taken on the past External Auditor’s recommendations is given in Annex I.
ACKNOWLEDGEMENT We wish to record our appreciation for the cooperation and assistance extended by the Director General and staff of the International Atomic Energy Agency during our audit.
(signed)
Prof. Dr. Moermahadi Soerja Djanegara, CA, CPA The Chair of the Audit Board of
the Republic of Indonesia
External Auditor
Jakarta, Indonesia
28 March 2019
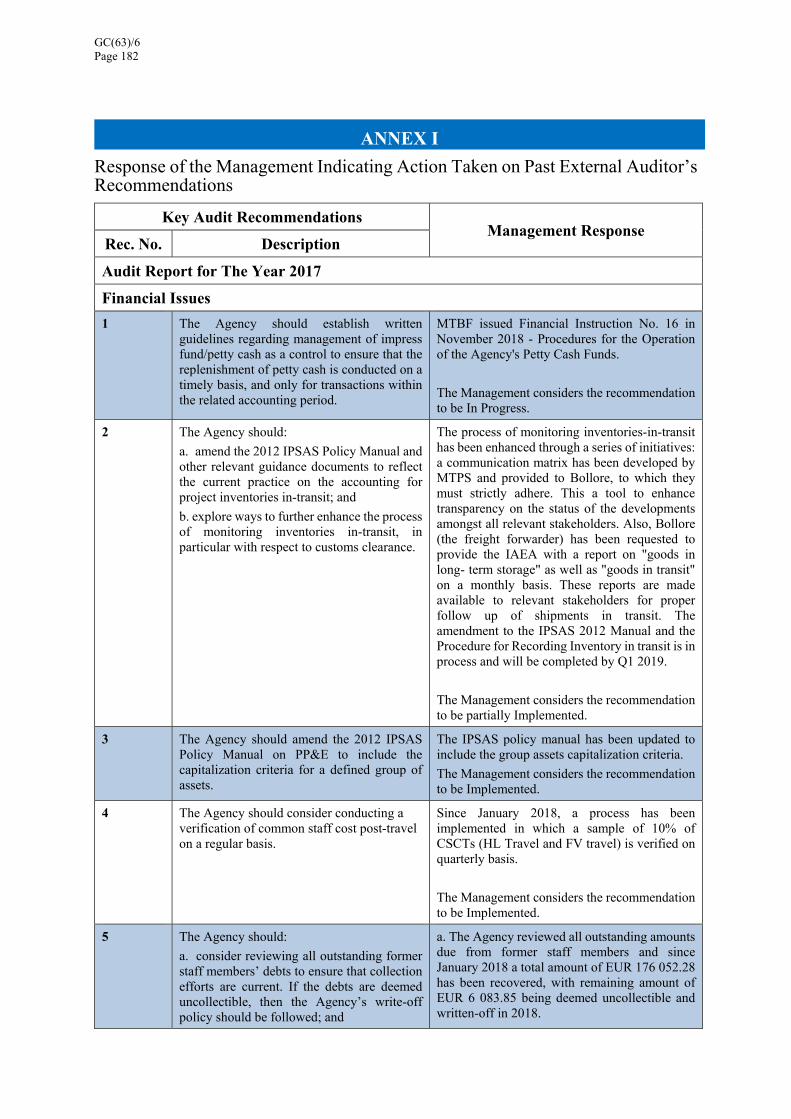
GC(63)/6 Page 182
ANNEX I
Response of the Management Indicating Action Taken on Past External Auditor’s Recommendations
Key Audit Recommendations Management Response
Rec. No. Description
Audit Report for The Year 2017
Financial Issues
1 The Agency should establish written guidelines regarding management of impress fund/petty cash as a control to ensure that the replenishment of petty cash is conducted on a timely basis, and only for transactions within the related accounting period.
MTBF issued Financial Instruction No. 16 in November 2018 - Procedures for the Operation of the Agency's Petty Cash Funds.
The Management considers the recommendation to be In Progress.
2 The Agency should:
a. amend the 2012 IPSAS Policy Manual and other relevant guidance documents to reflect the current practice on the accounting for project inventories in-transit; and
b. explore ways to further enhance the process of monitoring inventories in-transit, in particular with respect to customs clearance.
The process of monitoring inventories-in-transit has been enhanced through a series of initiatives: a communication matrix has been developed by MTPS and provided to Bollore, to which they must strictly adhere. This a tool to enhance transparency on the status of the developments amongst all relevant stakeholders. Also, Bollore (the freight forwarder) has been requested to provide the IAEA with a report on "goods in long- term storage" as well as "goods in transit" on a monthly basis. These reports are made available to relevant stakeholders for proper follow up of shipments in transit. The amendment to the IPSAS 2012 Manual and the Procedure for Recording Inventory in transit is in process and will be completed by Q1 2019.
The Management considers the recommendation to be partially Implemented.
3 The Agency should amend the 2012 IPSAS Policy Manual on PP&E to include the capitalization criteria for a defined group of assets.
The IPSAS policy manual has been updated to include the group assets capitalization criteria.
The Management considers the recommendation to be Implemented.
4 The Agency should consider conducting a verification of common staff cost post-travel on a regular basis.
Since January 2018, a process has been implemented in which a sample of 10% of CSCTs (HL Travel and FV travel) is verified on quarterly basis.
The Management considers the recommendation to be Implemented.
5 The Agency should:
a. consider reviewing all outstanding former staff members’ debts to ensure that collection efforts are current. If the debts are deemed uncollectible, then the Agency’s write-off policy should be followed; and
a. The Agency reviewed all outstanding amounts due from former staff members and since January 2018 a total amount of EUR 176 052.28 has been recovered, with remaining amount of EUR 6 083.85 being deemed uncollectible and written-off in 2018.

GC(63)/6 Page 183
Key Audit Recommendations Management Response
Rec. No. Description b. explore ways to reduce the uncertainty of obtaining reimbursements of former staff members under AMIP.
b. The Agency has taken actions to reduce the number of former staff who pay directly to the Agency by shifting the payment to periodic automatic deductions from their UNJSPF pension. In addition, the Agency is currently under discussions with its bank to set up payment of the AMIP premiums from the former staff members by bank direct debit.
The Management considers the recommendation to be in Progress.
6 The Agency should:
a. document the cancellation reasons for duty travel and make them available upon request; and
b. ensure that the lump sums paid to the remaining meeting participants are recovered.
a. Documentation of the cancellation reasons in AIPS for duty travel is still being discussed; An AIPS Change request has been raised in Dec 2018 to require that a cancellation reason is entered whenever a TRAC is cancelled.
b. Out of the EUR 10 696 paid to the remaining participants, an amount of EUR 4 150 has been recovered. Continue efforts to recover the amounts due from the meeting participants
The Management considers the recommendation to be in Progress.
7 The Agency should include more detailed disclosures related to the FAO Joint Division in connection with IPSAS 37: Joint Arrangements.
Additional disclosures for the FAO Joint Division are being incorporated into the Agency's Financial Statements for 2018
The Management considers the recommendation to be in Progress.
Spent Fuel
8 The Agency should:
i. implement an interconnected Risk Management process at Agency-wide and project level to allow the Subprogramme management to improve its work plan by including therein operational risk identification, and risk mitigation planning in a visible and trackable manner;
ii. analyze the results of the Review of Selected Management Systems in the Departments of NA and NE (a risk assessment pilot) and determine the next steps that could include implementing further operational risk mitigation for all Major Programmes.
For the Agency risk management process, efforts were undertaken to bring it to the next stage of maturity. A number of possible solutions to strengthen the risk management process and its linkage with RBM were piloted with OIOS and the Departments for NA and NE. To lay the foundations for this pilot, a number of tools and methodologies – a harmonized risk catalogue, a risk ownership map, an inventory of control types and a ‘risk and control’ matrix template – were developed in accordance with industry standards tailored to the specificities of the Agency and validated with the main Departmental stakeholders.
The Management considers the recommendation to be in Progress.
9 The Agency should:
i. improve mechanisms to monitor the achievement of Subprogramme outputs and outcomes, that includes:
Regular performance monitoring is provided in the framework of the mid-term and final programme performance assessment once a year. The results framework developed during

GC(63)/6 Page 184
Key Audit Recommendations Management Response
Rec. No. Description • developing a plan for specific monitoring activities;
• overcoming the limitations of the current information systems by providing an enabling project management environment and toolkit; and
• improving the feedback mechanism to enable increased participation from Member States in data collection/information gathering to the extent practicable for the purpose of outcome monitoring.
ii. improve the assessment process so as to ensure the achievement of the Agency’s objectives and mandate, by:
• ensuring the parameters that have been entered in Hyperion are accurate, informative and comprehensive; and the achievements are well supported by documentation;
• enhancing the follow up implementation from lessons learned of the assessment process.
programme planning provides the relevant tool for this process as it provides data on indicators, baselines and targets. In addition, managers are encouraged to develop workplans, including an M&E plan. There are several tools available to lay out a work plan. A basic workplan matrix which can be adapted to specific needs is provided during the RBM training. The workplan can also be adapted to host the actual performance data (in addition to capturing it in Hyperion). A good example of a workplan is the NE integrated Work Plan (IWP) developed to support Member States embarking on nuclear power programmes in establishing their nuclear infrastructure. Another good example is the MT quarterly review. All relevant project management tools are provided and explained as part of the regular RBM training. In addition, a manager’s handbook is planned to be developed in the course of 2019. A fundamental aspect of monitoring in the Agency is to collect on a regular basis the relevant information that reflects progress, the actual resource utilisation and schedule. At Programme level in particular, data may come from a combination of sources, including, for instance, data from national systems. NEFW for example has established a systematic procedure to collect, via feedback sheets distributed during meetings, information from Member States on outcomes of NEFW’s activities. When collecting and recording performance data, Departments are encouraged to e.g. use triangulation (i.e. collection of same/ similar data from several sources/ via different methods) to ensure the accuracy of the data. Variations are recorded and reported to Management and, if necessary, to Member States. Departments are also aware of the importance of retaining data about estimated and actuals throughout the whole implementation process so as to obtain lessons and good practices which are systematically fed into the planning cycle. The lessons from the 2016/17 performance assessment and 2018/19 implementation for example formed the basis for planning the 2020/21 programme and budget.
The Management considers the recommendation to be Implemented
Radio-Isotope Hydrology
10 The Agency should improve its documentation of detailed information of IHL equipment to enable management to analyze how long the equipment will operate at its best condition with respect to its actual utilization
A complete inventory of laboratory equipment, date of purchase, and its operational and functional status is now maintained electronically on an ongoing basis by Mr. Kainz.

GC(63)/6 Page 185
Key Audit Recommendations Management Response
Rec. No. Description rate, and what action is needed when it reaches its maximum operational useful life.
The Management considers the recommendation to be Implemented.
11 The Agency should develop and implement a maintenance program for the IHL equipment and maintain an organized and reliable maintenance records to improve the effectiveness of regular and major maintenance practices.
With respect to implementation of a maintenance programme, an annual maintenance week, generally in December of each year, has been implemented to allow for planned service for major instruments.
Additionally, all instruments now have physical maintenance and operational logbooks located at each instrument. The instrument specific service schedules have been integrated into these logbooks and the service is now documented by appropriate staff.
The Management considers the recommendation to be Implemented.
12 For continual improvement of routine activities, the Agency should monitor and evaluate efficiency gained through the measurement of sample backlog by optimizing the utilization of the available data in the system.
The TRIMS database software was recently modified to report sample backlog queue and the estimated sample completion rate sorted by procedure and priority.
The Management considers the recommendation to be Implemented.
Safeguards Analytical Laboratories
13 The Agency should confirm a definite LG-SIMS replacement strategy in the near future, while coordinating the plan with relevant parties, as the lack of confirmed decision poses risks to SGAS’s operation sustainability.
An external advisory group, "Friends of SAL (FOS)", was organized in support of SGAS’ long-term sustainability. As a result, SGAS has established a document, "long-term sustainability plan for capital equipment" with a special focus on a timely replacement of its LG-SIMS. This plan was shared with FOS and FOS provided a number of recommendations.
Further investigations and evaluations in response to the FOS’s recommendations led SGAS management to recommend going forward with the sustainability plan as developed by an external consultant is the most effective path forward to ensure the Department's strategic mission of its independent verification of nuclear activities can be met objectively and in a timely fashion.
The Management considers the recommendation to be in Progress.
14 The Agency should consider to further develop the knowledge management and transfer strategies to capture and transfer tacit knowledge including technical skills and expertise attached to the work performed by each specialist within the Safeguards analytical laboratories.
SGAS follows the IAEA Department of Safeguards procedure for knowledge retention and transfer for planned staff separations, under the guidance of the Division for Concepts and Planning. In addition, SGAS is considering additional mechanisms for transfer of specific technical knowledge on a case-by-case basis. A first example of this was the retirement in 2018

GC(63)/6 Page 186
Key Audit Recommendations Management Response
Rec. No. Description of the leader of the Micro-particle Analysis Team of the ESL. In this case the staff member concentrated in her last months on a holistic examination of microparticle analysis for SG, incorporating her expert knowledge in the field, to produce a report for the Team and the Director of her findings from her experience with the ESL.
The Management considers the recommendation to be Implemented.
Technical Cooperation
15 The Agency should:
i. improve the LFM development process by incorporating unfunded components in the assumption and risk column in order to better estimate if the project would produce the intended result;
ii. improve the proposal review process of TC projects with footnote a/ components by analysing the possibility of making footnote a/ components with low funding certainty as standalone footnote a/ projects.
For the TCP 2020-21, the project design template was updated and the Risk Management section now includes explicit reference to footnote/a. Under the section on "Risk Management" the guidance now reads: "Describe potential risks that could affect or hamper overall project implementation, their likelihood of happening, and ways to mitigate/manage them. Risks are not under the control of the project team but should be identified, with proposed mitigation measures in case they occur. Examples are changes in national policies/priorities, institutional restructuring, reallocation of resources and/or budget reduction. The latter also includes the shift of a significant component of the project budget into a footnote-a/ component."
The Management considers the recommendation to be in Progress.
16 The Agency should seek alternative means to overcome issues related to old open POs, including monitoring the implementation of Plateau 4 to address the management needs in regards to monitoring open POs requiring final settlement.
TC has created a specialized Dashboard report titled Project and PO report in OBIEE. The TCFIMS section runs this report twice a year identifying all open purchase orders and further segmenting the purchase orders by APMA (buyer). All purchase orders that TCFIMS can tell were fully delivered and paid we finally close. All purchase orders requiring further review are sent to the APMA for identification of status. Two follow-ups by TCFIMS are done to ensure a response.
The Management considers the recommendation to be Implemented.
Audit Report for The Year 2016
Financial Issues
1 The Agency should amend the 2012 Agency’s Policy Manual and Administrative Manual, Part VI, Section 2, Paragraph 8 to reflect the approved changes in useful lives of PPE and intangible assets.
There is an ongoing comprehensive review and update of the AM which is being carried out by the Division of General Services, which is expected to be completed in the course of 2019.

GC(63)/6 Page 187
Key Audit Recommendations Management Response
Rec. No. Description
The Management considers the recommendation to be in Progress.
2 The Agency should:
i. incorporate risks mitigation in employing third party service providers in the Agency-level governance; and
ii. consider performing tests to ensure that all findings related to weaknesses in AIPS application and database level from previous audits have been appropriately addressed.
i. MTIT is working with stakeholders throughout the IAEA to implement an Information Security Management Systems (ISMS). Among other things, the ISMS will define the standards to mitigate risks while employing third party service providers at an agency-level of governance. The ISMS policy and standards have been approved directionally at a leadership level and the submission the changes to the Admin Manual is expected shortly.
ii. AIPS team along with the relevant IAEA stakeholders went through a detailed analysis and remediation activity to ensure that the Segregation of Duties principle both in application and database access is followed. All necessary actions have been taken for the implementation.
The Management considers the recommendation to be in Progress.
3 The Agency enhance its effort to request the related Banks to provide monthly bank statements, and update the balance accordingly.
Bank Statements for the two subject banks were already received in 2018 with no significant reconciling items identified.
The Management considers the recommendation to be Implemented.
4 The Agency should implement measures to improve internal controls, seeking to avoid the use of LVP to purchase goods and services not allowed to be purchased via LVP.
Following previous recommendations, the following measures have been implemented as requested to improve internal controls on the use of LVP for purchase of goods not allowed to be purchased via LVP: the Office of Procurement Services has engaged in an extensive training campaign on the LVP programme and ethics. Moreover, all relevant information, tips and training material are available to all staff on InSite. MTBF has been also providing support in the identification whether an item is capital non-expendable assets prior to purchase as communicated by requestors to ensure compliance.
The Management considers the recommendation to be Implemented.
6 The Agency should:
i. continue to refine and improve the quality of the Human Resource data and certain estimates and assumptions made for calculation of the actuarial liability for Post-employment Benefits - Defined Benefit Plans.
MTBF worked together with MTHR and the AIPS team to implement improvements at the level of the source HR data for the determination of the actuarial liability for Post-employment benefits. In addition the considerations regarding entitlements of staff members with non-Agency insurance plans are revised on annual basis to

GC(63)/6 Page 188
Key Audit Recommendations Management Response
Rec. No. Description ii. further analyse the possible entitlements for staff members who currently have non-Agency insurance plans.
iii. consider to enhance the employee benefits report provided to the actuaries to describe reasons for exclusion of staff members from the calculation of Post-employment Benefits, in particular those that currently are enrolled directly with the Agency insurance scheme.
determine any possible changes in status and its impact on the liability. Finally, MTBF supports the basis data for the actuarial calculations through the use and combination of different HR reports.
The Management considers the recommendation to be Implemented.
7 The Agency enforce Paragraphs 72 and 79 of “the Administrative Manual, Part II, Section 9” related to salary deduction of travel advance when a duty travel claim is not submitted in a timely manner.
In March 2018, the Agency implemented an automated notification feature in AIPS which sends reminders to staff members to submit travel claims on a timely basis. After a first and second reminder, staff were informed with a third and final reminder that in the event a staff member fails to submit a travel claim after 90 days following the completion of the duty travel, any travel advance paid may be deducted in full from his/her monthly salary.
Up until October 2018, more than 50 salary deductions amounting to EUR 69 437.93 have been made to fully recover duty travel advances paid. As at 31 December, 2018, the number of staff travel claims which are more than 90 days following the completion of duty travel has reduced significantly to only 5 cases amounting to EUR 10 000. Of these 5 cases, 2 claims were submitted and processed January 2019 and the remaining 3 are being processed for salary deductions.
The Management considers the recommendation to be Implemented.
Nuclear Information
8 The Agency to seek sufficient resources to further improve existing collaboration and increase the number of members. This should include:
(i) finalizing the INLN Practical Arrangement initiative;
(ii) increasing the outreach and promotion of activities while improving efficiency and sustainability in maintaining the commitment of members so as to steer the INLN towards a distributed and coordinated nuclear library community; and
(iii) improving the INLN directory through consultation among members so as to provide a single point of access to nuclear information services
During 2018, the Agency has implemented a number of outreach and promotional activities, as well as implemented some usability enhancements, including:
(i) Social media Google-based forum established
(ii) Member directory updated
(iii) New INLN webpage created as part of the Library website
(iv) INIS Library website transferred to IAEA Drupal-based platform
(v) Meeting with INLN members organized during the INIS Liaison Officers Meeting in October 2018.
Management considers the recommendation to be In Progress.
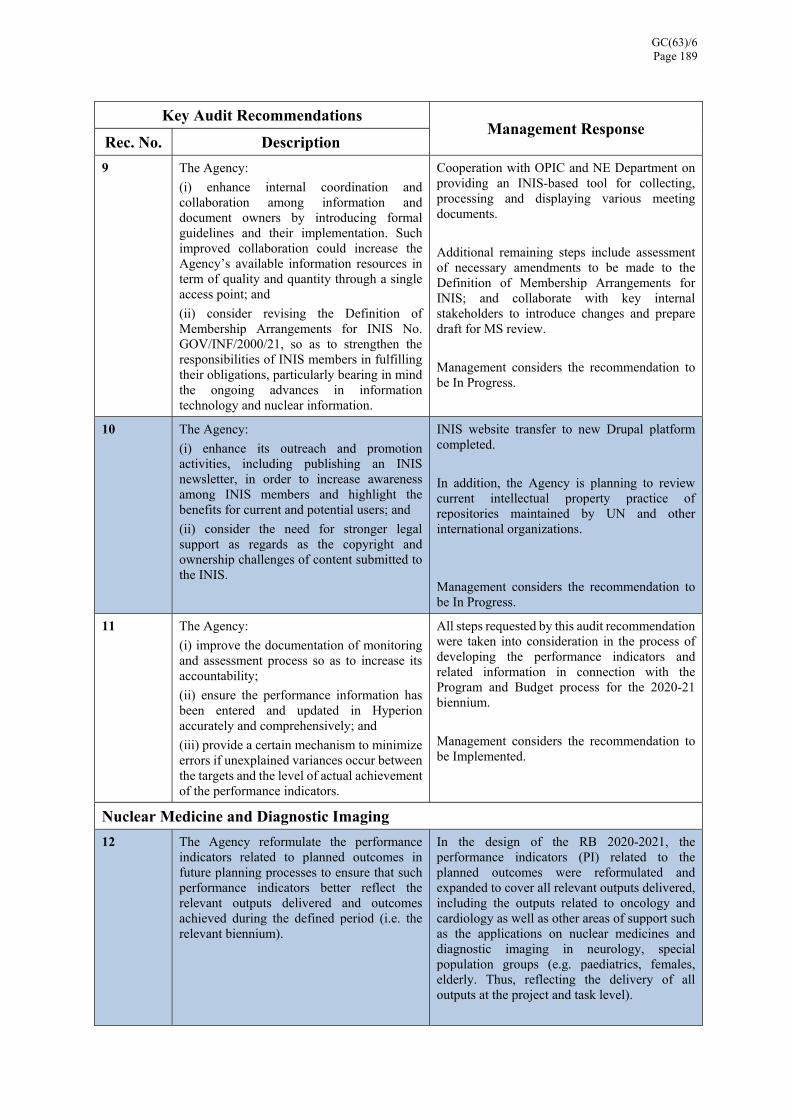
GC(63)/6 Page 189
Key Audit Recommendations Management Response
Rec. No. Description
9 The Agency:
(i) enhance internal coordination and collaboration among information and document owners by introducing formal guidelines and their implementation. Such improved collaboration could increase the Agency’s available information resources in term of quality and quantity through a single access point; and
(ii) consider revising the Definition of Membership Arrangements for INIS No. GOV/INF/2000/21, so as to strengthen the responsibilities of INIS members in fulfilling their obligations, particularly bearing in mind the ongoing advances in information technology and nuclear information.
Cooperation with OPIC and NE Department on providing an INIS-based tool for collecting, processing and displaying various meeting documents.
Additional remaining steps include assessment of necessary amendments to be made to the Definition of Membership Arrangements for INIS; and collaborate with key internal stakeholders to introduce changes and prepare draft for MS review.
Management considers the recommendation to be In Progress.
10 The Agency:
(i) enhance its outreach and promotion activities, including publishing an INIS newsletter, in order to increase awareness among INIS members and highlight the benefits for current and potential users; and
(ii) consider the need for stronger legal support as regards as the copyright and ownership challenges of content submitted to the INIS.
INIS website transfer to new Drupal platform completed.
In addition, the Agency is planning to review current intellectual property practice of repositories maintained by UN and other international organizations.
Management considers the recommendation to be In Progress.
11 The Agency:
(i) improve the documentation of monitoring and assessment process so as to increase its accountability;
(ii) ensure the performance information has been entered and updated in Hyperion accurately and comprehensively; and
(iii) provide a certain mechanism to minimize errors if unexplained variances occur between the targets and the level of actual achievement of the performance indicators.
All steps requested by this audit recommendation were taken into consideration in the process of developing the performance indicators and related information in connection with the Program and Budget process for the 2020-21 biennium.
Management considers the recommendation to be Implemented.
Nuclear Medicine and Diagnostic Imaging
12 The Agency reformulate the performance indicators related to planned outcomes in future planning processes to ensure that such performance indicators better reflect the relevant outputs delivered and outcomes achieved during the defined period (i.e. the relevant biennium).
In the design of the RB 2020-2021, the performance indicators (PI) related to the planned outcomes were reformulated and expanded to cover all relevant outputs delivered, including the outputs related to oncology and cardiology as well as other areas of support such as the applications on nuclear medicines and diagnostic imaging in neurology, special population groups (e.g. paediatrics, females, elderly. Thus, reflecting the delivery of all outputs at the project and task level).

GC(63)/6 Page 190
Key Audit Recommendations Management Response
Rec. No. Description Management considers the recommendation to be Implemented.
13 In accordance with the Agency Guidelines and RBA framework, the Agency consider, where appropriate, including an element of measurability when reporting on the planning and assessment of project outputs.
The 2016-2017 end-of-cycle report included numerical data of the established performance indicators. The report of specific numerical data will be maintained in future reports. The data records are kept for transparency and traceability purposes.
Management considers the recommendation to be Implemented.
14 To improve the contemporaneous documentation and validation of performance indicator measurement, the Agency should record the data verification process and justifications used in obtaining the figures for baselines and target indicators, and for their achievements.
The detailed and recorded collection of data for each task implemented by the sub-programme has been established as a regular process in the 2.2.2 sub-programme. The compilation of all data is documented in a comprehensive, easy-to-use, graphic report, which includes all the key activities undertaken by NMDI to achieve the specific outcomes in one calendar year.
The data collected was used for the end of cycle report 2016-2017 and will continue to be used for subsequent repots.
Management considers the recommendation to be Implemented.
Radiation Safety and Monitoring
16 The Agency:
(i) streamline the process of developing and publishing the IAEA Safety Standards on Occupational Radiation Protection so as to accelerate and reduce the time needed for their approval and publication, while continuing to maintain the development of high-quality standards; and
(ii) enhance and accelerate the planning phase of developing safety standards by incorporating rational risks and assumptions so as to better predict with more accurate timeframe for developing standards and guidelines.
The revised process was utilized for a number of publications. Examples include: the Safety Guide on Occupational Radiation Protection, which was published in October 2018; the Safety Report on Occupational Radiation Protection in Uranium Mining and Processing Industries, which is at the last stage for publication; and the DPP for the TECDOC on the prospective cancer risk assessment for occupationally exposed workers, which was prepared.
Management considers the recommendation to be In Progress.
17 The Agency:
(i) improve Hyperion so as to enhance the lessons learned and the assessment process. This would involve the addition of an explanatory field to cover situation where changes in task outputs occur;
(ii) ensure the performance information has been entered and updated in Hyperion accurately and comprehensively; and
(iii) provide a certain mechanism to minimize errors if unexplained variances occur between
Through the process of preparation of the P&B 2020-21, all the lessons learned were implemented and the Hyperion entries were prepared accordingly (to be actual, up-to-date, measurable, and implementable under the budget proposed).
Management considers the recommendation to be Implemented.
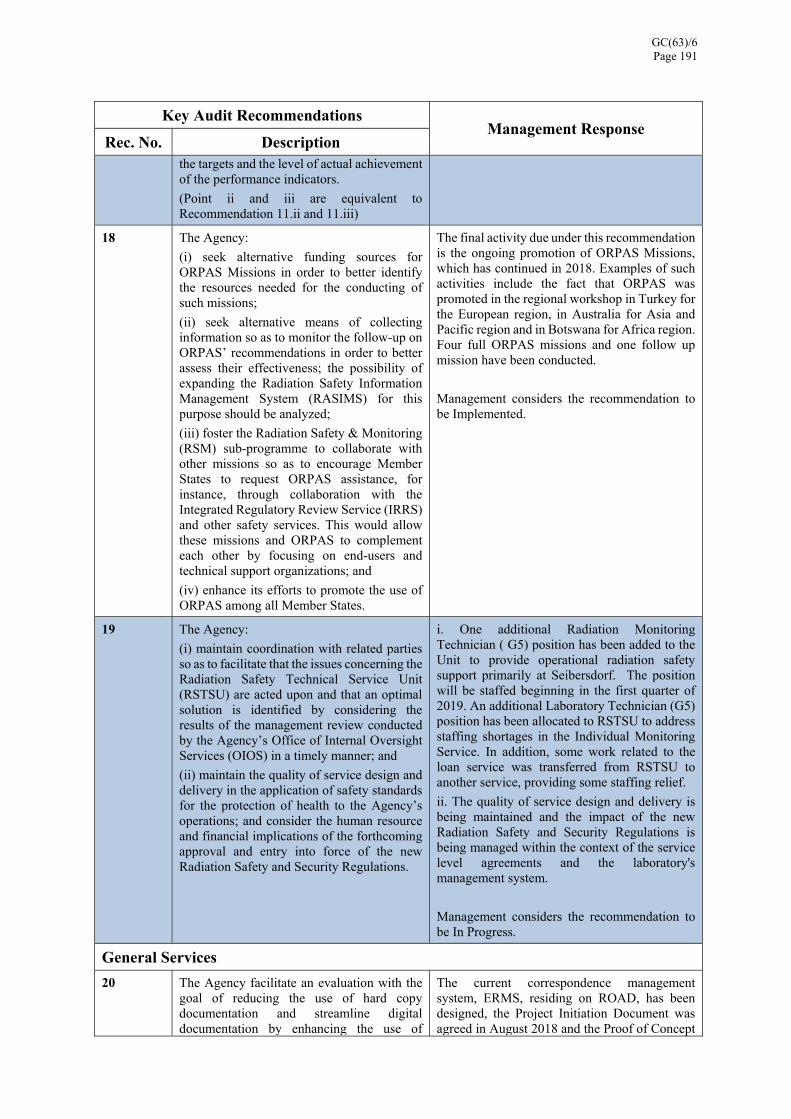
GC(63)/6 Page 191
Key Audit Recommendations Management Response
Rec. No. Description the targets and the level of actual achievement of the performance indicators.
(Point ii and iii are equivalent to Recommendation 11.ii and 11.iii)
18 The Agency:
(i) seek alternative funding sources for ORPAS Missions in order to better identify the resources needed for the conducting of such missions;
(ii) seek alternative means of collecting information so as to monitor the follow-up on ORPAS’ recommendations in order to better assess their effectiveness; the possibility of expanding the Radiation Safety Information Management System (RASIMS) for this purpose should be analyzed;
(iii) foster the Radiation Safety & Monitoring (RSM) sub-programme to collaborate with other missions so as to encourage Member States to request ORPAS assistance, for instance, through collaboration with the Integrated Regulatory Review Service (IRRS) and other safety services. This would allow these missions and ORPAS to complement each other by focusing on end-users and technical support organizations; and
(iv) enhance its efforts to promote the use of ORPAS among all Member States.
The final activity due under this recommendation is the ongoing promotion of ORPAS Missions, which has continued in 2018. Examples of such activities include the fact that ORPAS was promoted in the regional workshop in Turkey for the European region, in Australia for Asia and Pacific region and in Botswana for Africa region. Four full ORPAS missions and one follow up mission have been conducted.
Management considers the recommendation to be Implemented.
19 The Agency:
(i) maintain coordination with related parties so as to facilitate that the issues concerning the Radiation Safety Technical Service Unit (RSTSU) are acted upon and that an optimal solution is identified by considering the results of the management review conducted by the Agency’s Office of Internal Oversight Services (OIOS) in a timely manner; and
(ii) maintain the quality of service design and delivery in the application of safety standards for the protection of health to the Agency’s operations; and consider the human resource and financial implications of the forthcoming approval and entry into force of the new Radiation Safety and Security Regulations.
i. One additional Radiation Monitoring Technician ( G5) position has been added to the Unit to provide operational radiation safety support primarily at Seibersdorf. The position will be staffed beginning in the first quarter of 2019. An additional Laboratory Technician (G5) position has been allocated to RSTSU to address staffing shortages in the Individual Monitoring Service. In addition, some work related to the loan service was transferred from RSTSU to another service, providing some staffing relief.
ii. The quality of service design and delivery is being maintained and the impact of the new Radiation Safety and Security Regulations is being managed within the context of the service level agreements and the laboratory's management system.
Management considers the recommendation to be In Progress.
General Services
20 The Agency facilitate an evaluation with the goal of reducing the use of hard copy documentation and streamline digital documentation by enhancing the use of
The current correspondence management system, ERMS, residing on ROAD, has been designed, the Project Initiation Document was agreed in August 2018 and the Proof of Concept

GC(63)/6 Page 192
Key Audit Recommendations Management Response
Rec. No. Description electronic correspondence whenever and wherever feasible, initiating digitization programmes to make hard copy records retrievable, and reducing internal paper correspondence. In this regard, the Agency should use the results of such an evaluation to enhance and accelerate the innovation stage for developing paperless correspondence if the report shows that potential cost efficiencies at the operational level can be achieved.
will be available soon. The new system will entail new business processes and the full digitization of hard copies, it will include new system architecture and a new approach to capture and distribute correspondence. One final factor to consider is the future of ROAD, currently ROAD contains all the official correspondence and legacy Agency records, its decommissioning is foreseen in the next couple of years.
Management considers the recommendation to be In Progress.
21 The Agency use the cost efficiencies gained, in respect of the Recommendation 20, to improve the records services by focusing on Records Management Advisory Services that would minimize the workload at the archival stage. Furthermore, proper records management services, using Generally Accepted Recordkeeping Principles, for all of the Agency’s records should start with an inventory of records, and an evaluation of the current retention policies and their revision, along with the Agency File Plan.
The ARMs Records Advisory Service is fully functional in 2018: it has well defined KPIs and performance metrics, regularly reported to the division. The new training programme has been developed, the E-learning site is planned to be completed in Q1 2019. Two major policy documents have been produced for clearance: the MT Records Retention Schedule Policy and a similar document for SG, both are to be approved shortly.
Management considers the recommendation to be In Progress.
22 The Agency explores the opportunity to build its capacities in digital archives management and preservation. This could include establishing a digital repository for long-term preservation, an electronic catalogue for retrieval purposes, and introducing an archival management system to make the archival life cycle more transparent and better documented.
In 2018 the Digital Asset Management System (DAMS) to publish digital content online was procured. In cooperation with OPIC the first batch of content went online in December 2018 and the first quarter of March 2019. The Archival Management System, which serves as the catalogue to Agency records, was fully configured by December 2018, with final training, UAT and data migration to be done in the first half of 2019.
Management considers the recommendation to be In Progress.
23 The Agency review its current level of video conferencing and take steps to increase its use to substitute for face-to-face meetings where practical
Since the introduction of Video Conference services in 2002 and WebEx Services in 2014, there has been a steady increase in the use of these services in the Agency.
Although the decisions pertaining to the modalities of conducting meetings and conferences are made at a program level by respective departments, considering all appropriate conditions required for the meeting, MTGS and MTIT have taken steps to make the services readily accessible to all staff. Additionally, there is a demonstrated effort to show efficiencies in program delivery through the use of online platforms to replace face to face meetings as has been incorporated in the

GC(63)/6 Page 193
Key Audit Recommendations Management Response
Rec. No. Description Agency's Programme and Budget documents over the past biennia.
Management considers the recommendation to be Implemented.
Audit Report for The Year 2015
Financial Issues
1 The Agency may adopt a codified accountability policy in a defined timeframe to achieve best results.
The Agency's Accountability Framework was developed and issued in July 2018.
The Management considers the recommendation to be Implemented.
Programme on Nuclear Sciences
24 The Agency may consider putting in place mechanism to ensure adherence to the timeframe for publication of CRP reports.
Recruitment of the Publication Officer post in NE is still on-going. The temporary position was terminated, and the relevant tasks have been carried out by NE DDGO staff ensuring continuity of the process. A new temporary position for 6 months was advertised in the meanwhile the recruitment is finalized. Agreement with MTCD was sought to ensure early APA service provided to Scientific Secretaries and assistance in addressing the copyrights and permission issues at early stage of development of a publication (during relevant CS meetings) which is expected to streamline the internal publication process. MTCD has launched a Publications Resource Pack to support Scientific Secretaries managing CRP publications. As of October 2018 presentations on publication planning were being introduced at consultancy meetings and bespoke training/ support information is being provided when requested, within the resources available.
The Management considers the recommendation to be in Progress.
27 The Agency may continue its efforts to strengthen existing RR networks and coalitions.
Two International Centres based on Research Reactors (ICERR) were designated in 2017 and the network of ICERRs (ICERRNet) was established. The Internet Reactor Laboratory (IRL) project was developed in the Asia Pacific region and African region. The 14th edition of the EERRI course was conducted. Regional RR Schools was conducted in Vietnam and Thailand and Malaysia and Indonesia. Activities to support thematical networks and coalitions continued, also in cooperation with TC Department within the framework of Regional TC projects.

GC(63)/6 Page 194
Key Audit Recommendations Management Response
Rec. No. Description The Management considers the recommendation to be in Progress.
30 The Agency may monitor gender participation in each task undertaken within the sub programmes.
All efforts have been made to strengthen gender balance by giving preference to women candidates in all tasks performed.
Pilot project for gender mainstreaming is being launched at Agency level and NE Department/MP1 is actively participating.
The Management considers the recommendation to be in Progress.
Audit Report for The Year 2014
Financial Issues
3 The Agency may consider the implementation of a long-term funding strategy for meeting the employee liabilities adequately over a period of time.
The Agency has developed a proposal to be presented to Member States with respect to appropriate mechanisms for funding the Agency's ASHI liability.
The Management considers the recommendation to be in Progress.
Procurements of Safeguards Department
13 b) The Agency may frame explicit guidelines regarding elements constituting Best Value for Money (BVM) for different category of procurements.
The review of the Procurement Governance was halted pending the results of the 2017 OIOS and 2018 external audit on procurement management and performance, respectively. The Management Letter from the external auditors was received at the end of October 2018. The OIOS audit started in December 2017 with the exit meeting held in November 2018.
Pending finalization of the review of the procurement governance for its completion as soon as possible in 2019.
The Management considers the recommendation to be in Progress.
c) Changes to the extant provisions/structures may be simultaneously updated in the Administrative Manual after taking due approvals.
The review of the Procurement Governance was halted pending the results of the 2017 OIOS and 2018 external audit on procurement management and performance, respectively. The Management Letter from the external auditors was received at the end of October 2018. The OIOS audit started in December 2017 with the exit meeting held in November 2018.
Pending finalization of the review of the procurement governance for its completion as soon as possible in 2019.

GC(63)/6 Page 195
Key Audit Recommendations Management Response
Rec. No. Description
The Management considers the recommendation to be in Progress.
16 The Agency may consider framing guidance regarding the composition (number & grade of members) of the evaluation teams and include details of team members of the evaluation team in the Procurement Plans.
The review of the Procurement Governance was halted pending the results of the 2017 OIOS and 2018 external audit on procurement management and performance, respectively. The Management Letter from the external auditors was received at the end of October 2018. The OIOS audit started in December 2017 with the exit meeting held in November 2018.
Pending finalization of the review of the procurement governance for its completion as soon as possible in 2019.
The Management considers the recommendation to be in Progress.
17 a) The Agency may issue appropriate guidance to Procurement Review Committee (PRC) regarding recording the justification for their findings, particularly in cases where the PRC finding against a condition is ‘No’.
The review of the Procurement Governance was halted pending the results of the 2017 OIOS and 2018 external audit on procurement management and performance, respectively. The Management Letter from the external auditors was received at the end of October 2018. The OIOS audit started in December 2017 with the exit meeting held in November 2018.
Pending finalization of the review of the procurement governance for its completion as soon as possible in 2019.
The Management considers the recommendation to be in Progress.
c) The Agency may extend the definition of critical procurement to amendments to contracts for the purpose of referral to the PRC.
The review of the Procurement Governance was halted pending the results of the 2017 OIOS and 2018 external audit on procurement management and performance, respectively. The Management Letter from the external auditors was received at the end of October 2018. The OIOS audit started in December 2017 with the exit meeting held in November 2018.
Pending finalization of the review of the procurement governance for its completion as soon as possible in 2019.
The Management considers the recommendation to be in Progress.

GC(63)/6 Page 196
Key Audit Recommendations Management Response
Rec. No. Description
Safety of Nuclear Installations
21 b) The Agency may incorporate a follow up mission as part of the SEED mission package as is the case with OSART missions.
The revised draft SEED guidelines, incorporating follow-up missions has received further internal clearances and has been submitted to the Publications Committee.
The Management considers the recommendation to be in Progress.
24 a) The Agency may closely examine the results of Nuclear Safety Review 2013 regarding some of the safety standards not being adhered to by Member States, so as to gain an understanding of what actions might be needed to better assist Member States.
The final step of the recommendation implementation - the publication of Safety Guides GSG-12 (ExDS472): Organisation, Management and Staffing of a Regulatory Body for Safety and GSG-13 (ExDS473): Functions and Processes of the Regulatory Body for Safety was completed during 2018.
The Management considers the recommendation to be Implemented.
Information Technology
32 b) To improve internal control system in MTIT, there may be an explicit guideline specifying authority levels for approval of ICT procedures, their classification, process of communication to relevant staff, periodicity of updating and methodical storing
MTIT is working with stakeholders throughout the IAEA to implement an Information Security Management System (ISMS). The ISMS will define authority levels for approvals of standards and guidelines and IAEA-wide classification procedures. It is expected that guideline specifying authority levels for approval of ICT procedures, their classification, process of communication to relevant staff, periodicity of updating and methodical storing will be defined in the ISMS project. The ISMS policy and standards have been approved directionally at a leadership level and the submission the changes to the Admin Manual is expected shortly.
The Management considers the recommendation to be in Progress.
34 Information Security Policy may be updated to make it comprehensive and current in tune with the present day IT operating environment and in line with the requirements of ISO 27000 series standards adopted by the Agency.
MTIT is working with stakeholders throughout the IAEA to implement an Information Security Management System (ISMS). The ISMS policy and standards have been approved directionally at a leadership level and the submission the changes to the Admin Manual is expected shortly.
The Management considers the recommendation to be in Progress.
36 a) Information security roles and responsibilities across the Agency for remote access may be defined and allocated.
These recommendations have been incorporated into the comprehensive Agency-wide information security risk assessment and associated roadmap. A key component of this project is the creation of the ISMS. The ISMS

GC(63)/6 Page 197
Key Audit Recommendations Management Response
Rec. No. Description policy and standards have been approved directionally at a leadership level and the submission the changes to the Admin Manual is expected shortly.
The Management considers the recommendation to be in Progress.
b) Security awareness training commensurate with Information security roles and responsibilities may be carried out to cover maximum number of staff and areas, including remote access and electronic messaging.
The first round of Information Security Awareness training was completed in 2018.
This training program will continue and expand in 2019 to address remote access and electronic messaging.
The Management considers the recommendation to be in Progress
37 a) Classification and access control procedures may be strengthened and synchronised.
MTIT is working with stakeholders throughout the IAEA to implement an Information Security Management Systems (ISMS). The ISMS policy and standards have been approved directionally at a leadership level and we expect to submit the changes to the Admin Manual before the end of Q4 2018. Once these changes are implemented, additional standards and procedures go into effect regarding this recommendation including the Information Classification Standard, Access Control Standard, Information Classification Procedure, and Information Handling Procedure.
The Management considers the recommendation to be in Progress
b) Remote access security plans and identity management systems may be urgently finalised in view of their Agency wide applicability.
Remote Access - MTIT is working with stakeholders throughout the IAEA to implement an Information Security Management Systems (ISMS). The ISMS policy and standards have been approved directionally at a leadership level and changes to the Admin Manual are expected. Once the changes are implemented, additional standards and procedures go into effect regarding this recommendation including the Access Control Standard and User Account Management Procedures which address Remote Access Plans.
Identity Management - Implementing the Identity Management solution has been on hold due to a lack of budget being available to operate and maintain a solution at this time.
The Management considers the recommendation to be in Progress

GC(63)/6 Page 198
Key Audit Recommendations Management Response
Rec. No. Description
39 a) The Agency may take urgent steps to put in place the incident management system containing crisis management plan, business continuity plans and disaster recovery for the Agency ICT systems at the Vienna International Centre (VIC) and all other Agency locations.
The implementation of Disaster Recovery for AIPS is complete.
The Management considers the recommendation to be implemented
b) Consolidated IT disaster recovery plans for MTIT, Safeguards and AIPS may be prepared providing for recovery of IT assets after disruption at VIC and all other Agency locations in line with predefined recovery point and recovery time objectives.
The implementation of Disaster Recovery for AIPS is complete.
The Management considers the recommendation to be implemented
Audit Report for The Year 2013
Human Resource Management Issues
11 (i) Consultants may be engaged only in those areas where Agency has no or limited expertise and knowledge; or to supplement staff resources for specific projects.
(ii) A provision for knowledge transfer may be added so that the Agency is not dependant on particular consultants repetitively or for a longer duration. The need for appropriate succession management and knowledge transfer to the regular staff of the Agency should also be assessed and suitable measures taken.
(iii) Engaging former staff and retirees as consultants may be reviewed with the goal of ensuring that thorough succession planning is put in place so that the departure of a regular staff member does not leave a skill gap in the Agency. The Management may ensure that staff who are approaching retirement complete their assignments before retiring, to reduce the need for consultants.
(iv) Upper age limit of consultants should be strictly adhered to except in rare cases with the approval of Director General.
The Agency has promulgated a Corporate Knowledge Management (CKM) policy, terms of reference and guidelines. In this context, an interdepartmental steering group for CKM was established to enable each department to capture and maintain explicit and tacit knowledge from staff, including retiring, moving or departing staff.
Furthermore, knowledge sharing and learning is one of the Agency's functional competencies which has been integrated into staff's job descriptions, strengthening the focus on Agency wide CKM. Monitoring and assessment through the IAEA's performance appraisal system started early together with the 2018 performance cycle. In addition, IT collaboration solutions (document depositories, SharePoint, etc) enabling more efficient capturing, retention and communication of information is being further communicated together with classroom led and online training materials (Lynda.com).
Management considers the recommendation to be In Progress.
Safeguards
20 The Department may consider formalizing the departmental procedures for Training Needs Analysis to better capture competencies and processes applied in the Department and to optimize staff management for effective safeguards implementation, and the data base maintained by the training section may be improved upon to make it more useful for the Department.
A determination has been made that the existing Learning Management System (LMS) needs to be replaced as it is no longer maintained and updating it to meet Safeguards needs would not be an efficient approach. The Agency is currently pursuing the Oracle product OLM (new product) since it seems to make more sense, will be more administratively feasible and cost effective and will ensure the solution meets both Safeguards' and rest of IAEA’s requirements.

GC(63)/6 Page 199
Key Audit Recommendations Management Response
Rec. No. Description Management considers the recommendation to be In Progress.
AIPS Project
25 A benefit assessment study may be conducted to identify the impact of AIPS business processes on staffing requirement.
As planned, a review of the AIPS project and its benefits was performed and reported to Member States in GOV/INF/2018/4 “Report on the Implementation of the Agency-wide Information System for Programme Support (AIPS)”. The document outlines the extent to which the overall objectives defined at the outset have been achieved and highlights key improvement and efficiency gains.
Management considers the recommendation to be Implemented.
27 A clear roadmap for legacy applications currently in use may be prepared in the light of experience gained from AIPS implementation and communicated to all internal stakeholders.
A roadmap for retirement for the remaining legacy applications for Plateaus 1 and 2 has been developed and signed off by the CIO and business owners.
The roadmaps for retiring the legacy applications for Plateaus 3 and 4 will be developed and signed off by business owners in 2019.
Management considers the recommendation to be In Progress.
Audit Report for The Year 2012
Nuclear Safety & Security
38 The databases should be peer reviewed by teams from staff members from Sections other than the ones maintaining the databases. The OIOS may also be requested to evaluate and examine the databases.
NS has requested OIOS to include the evaluation of the NS databases in its 2019 work plan.
Management considers the recommendation to be In Progress.
Laboratory Activities at Seibersdorf and Monaco
45 NAEL needs to revise the action plan that had emerged from the internal gap analysis of June 2010 and fix fresh milestones in line with the goal of obtaining accreditation by the second quarter of 2014.
Application for Accreditation was submitted in Dec 2017 to Accreditation body in Austria (including all requested documentation).
Management considers the recommendation to be In Progress.
53 The identified short-term solution of solidification of liquid wastes may be pursued by the SGAS with prescribed timelines. As a long-term solution, efforts must continue for seeking support of member states for disposal of the radioactive waste produced by the NML.
Although one Member State withdrew its previous offer to accept a significant amount of Pu-based legacy materials, a second Member State has expressed interest and SGAS is now providing technical details. Separately, efforts continue to open up disposal channels for routine U-based wastes, most notably with facilities in two Member States that have been reliable

GC(63)/6 Page 200
Key Audit Recommendations Management Response
Rec. No. Description partners in the past. New mechanisms are also being explored, including procurement and diplomatic channels.
Management considers the recommendation to be In Progress.
Audit Report for The Year 2011
Financial Issues
6 Introduce a Statement of Internal Control: Introduce a Statement of Internal Control as part of the financial statements.
The Agency's Accountability Framework was developed and issued in July 2018. The Internal Control Framework concepts are being incorporated in the Agency's Risk Management Guidelines, which are currently under review and update. Upon completion and implementation of the updated Risk Management Guidelines, the timeline for issuance of the Statement of Internal Control will be revisited.
The Management considers the recommendation to be in Progress.
7 In connection with the issuance of an annual Statement on Internal Control, ensure processes are in place to review, document and assure the effectiveness of the internal control system.
The Agency's Accountability Framework was developed and issued in July 2018. The Internal Control Framework concepts are being incorporated in the Agency's Risk Management Guidelines, which are currently under review and update. Upon completion and implementation of the updated Risk Management Guidelines, the timeline for issuance of the Statement of Internal Control will be revisited.
The Management considers the recommendation to be in Progress
8 In connection with the issuance of an annual Statement on Internal Control, accountability on the part of individual managers should be clear - this can be achieved by clear delegation of authority throughout the organization.
The Agency's Accountability Framework was developed and issued in July 2018. The Internal Control Framework concepts are being incorporated in the Agency's Risk Management Guidelines, which are currently under review and update. Upon completion and implementation of the updated Risk Management Guidelines, the timeline for issuance of the Statement of Internal Control will be revisited.
The Management considers the recommendation to be in Progress.

Printed by theInternational Atomic Energy Agency
July 2019
The Agency’s Financial Statements for 2018
19-0
2561
E