the aggregate demand for treasury debt -...
TRANSCRIPT

The Aggregate Demand for Treasury DebtAuthor(s): Arvind Krishnamurthy and Annette Vissing-JorgensenReviewed work(s):Source: Journal of Political Economy, Vol. 120, No. 2 (April 2012), pp. 233-267Published by: The University of Chicago PressStable URL: http://www.jstor.org/stable/10.1086/666526 .
Accessed: 01/01/2013 11:09
Your use of the JSTOR archive indicates your acceptance of the Terms & Conditions of Use, available at .http://www.jstor.org/page/info/about/policies/terms.jsp
.JSTOR is a not-for-profit service that helps scholars, researchers, and students discover, use, and build upon a wide range ofcontent in a trusted digital archive. We use information technology and tools to increase productivity and facilitate new formsof scholarship. For more information about JSTOR, please contact [email protected].
.
The University of Chicago Press is collaborating with JSTOR to digitize, preserve and extend access to Journalof Political Economy.
http://www.jstor.org
This content downloaded on Tue, 1 Jan 2013 11:09:48 AMAll use subject to JSTOR Terms and Conditions

233
[ Journal of Political Economy, 2012, vol. 120, no. 2]� 2012 by The University of Chicago. All rights reserved. 0022-3808/2012/12002-0002$10.00
The Aggregate Demand for Treasury Debt
Arvind KrishnamurthyNorthwestern University and National Bureau of Economic Research
Annette Vissing-JorgensenNorthwestern University, National Bureau of Economic Research, and Centre for Economic PolicyResearch
Investors value the liquidity and safety of US Treasuries. We documentthis by showing that changes in Treasury supply have large effects ona variety of yield spreads. As a result, Treasury yields are reduced by73 basis points, on average, from 1926 to 2008. Both the liquidity andsafety attributes of Treasuries are driving this phenomenon. We doc-ument this by analyzing the spread between assets with different li-quidity (but similar safety) and those with different safety (but similarliquidity). The low yield on Treasuries due to their extreme safety andliquidity suggests that Treasuries in important respects are similar tomoney.
We thank many colleagues and participants at talks at University of California, LosAngeles, University of Chicago, Columbia University, Dartmouth, Michigan State Univer-sity, University of Michigan, Massachusetts Institute of Technology, Northwestern Univer-sity, Princeton University, Queen’s University, University of Texas–Austin, University ofSouth Carolina, Yale University, Board of Governors of the Federal Reserve, the FederalReserve Bank of New York, NBER Asset Pricing meeting, NBER Monetary Economicsmeeting, NBER Economic Fluctuations and Growth meeting, Western Finance Association,Duke–University of North Carolina Asset Pricing conference, University of Michigan MitsuiLife Symposium on Financial Markets, London School of Economics–Paul Woolley Centreconference, Moody’s Analytics, University of British Columbia Winter Finance Conference,and Department of the Treasury for comments. Josh Davis, Chang Joo Lee, and ByronScott provided research assistance. We thank Moody’s Analytics (formerly Moody’s KMV)for providing its expected default frequency credit measure, Michael Fleming and KennethKuttner for data on P2-rated commercial paper, and Henning Bohn for debt/GDP data.
This content downloaded on Tue, 1 Jan 2013 11:09:48 AMAll use subject to JSTOR Terms and Conditions
234 journal of political economy
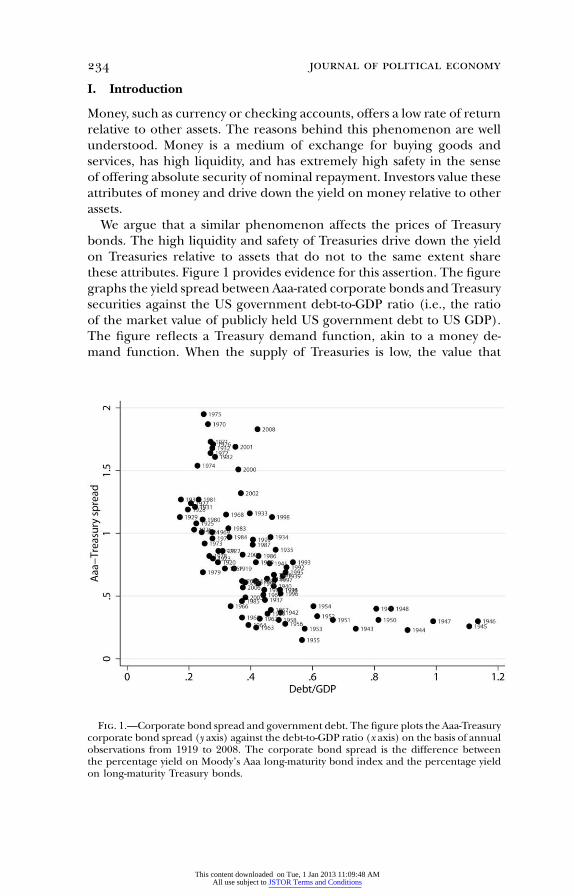
Fig. 1.—Corporate bond spread and government debt. The figure plots the Aaa-Treasurycorporate bond spread (y axis) against the debt-to-GDP ratio (x axis) on the basis of annualobservations from 1919 to 2008. The corporate bond spread is the difference betweenthe percentage yield on Moody’s Aaa long-maturity bond index and the percentage yieldon long-maturity Treasury bonds.
I. Introduction
Money, such as currency or checking accounts, offers a low rate of returnrelative to other assets. The reasons behind this phenomenon are wellunderstood. Money is a medium of exchange for buying goods andservices, has high liquidity, and has extremely high safety in the senseof offering absolute security of nominal repayment. Investors value theseattributes of money and drive down the yield on money relative to otherassets.
We argue that a similar phenomenon affects the prices of Treasurybonds. The high liquidity and safety of Treasuries drive down the yieldon Treasuries relative to assets that do not to the same extent sharethese attributes. Figure 1 provides evidence for this assertion. The figuregraphs the yield spread between Aaa-rated corporate bonds and Treasurysecurities against the US government debt-to-GDP ratio (i.e., the ratioof the market value of publicly held US government debt to US GDP).The figure reflects a Treasury demand function, akin to a money de-mand function. When the supply of Treasuries is low, the value that
This content downloaded on Tue, 1 Jan 2013 11:09:48 AMAll use subject to JSTOR Terms and Conditions

aggregate demand for treasury debt 235
investors assign to the liquidity and safety attributes offered by Treasuries(referred to below as the Treasury convenience yield) is high. As a result,the yield on Treasuries is low relative to the yield on the Aaa corporatebonds, which offer less liquidity and safety. The opposite applies whenthe supply of Treasuries is high. We present detailed econometric evi-dence of the relation reflected in figure 1 using several alternative yieldspread measures and controlling for corporate bond default risk.
We further show that it is the liquidity and safety attributes of Trea-suries that drive investors’ high valuation of Treasuries. We examine theyield spread between a pair of assets that are different only in terms oftheir liquidity, as well as the yield spread between a pair of assets thatare different only in terms of their safety. Under the hypothesis thatliquidity and safety are priced attributes, the yield spread between thesepairs of assets should reflect the equilibrium price of liquidity/safety.We show that changes in Treasury supply affect each of these yieldspreads. The results indicate that Treasuries offer liquidity and safetyso that changes in the supply of Treasuries separately change the equi-librium prices of liquidity and safety.
We compute that the value investors have paid on average over ourmain sample for 1926–2008 for the liquidity and safety attributes ofTreasuries is 73 basis points per year, of which at most 46 basis pointsare for liquidity and at least 27 basis points for safety. Our findings implythat the government collects seigniorage from the liquidity and safetyattributes of Treasuries, and we compute that the government has savedinterest costs of about 0.25 percent of GDP per year because of investors’demand for Treasuries. This figure is comparable in magnitude to thetraditional notion of seigniorage, which stems from the public’s will-ingness to hold fiat money at zero interest. We compute that the latterseigniorage is also around 0.25 percent of GDP per year. Our resultsalso indicate that Treasury interest rates are not an appropriate bench-mark for “riskless” rates. Cost of capital computations using the capitalasset pricing model should use a higher riskless rate than the Treasuryrate; a company with a beta of zero cannot raise funds at the Treasuryrate. In addition, the equity premium measured relative to Treasuryrates will partly be driven by the liquidity and safety of Treasuries.
Relation to literature.—Longstaff, Mithal, and Neis (2005) use defaultrisk as estimated from the price of credit default swaps to measure thecomponent of the spread between corporate and Treasury yields thatis due to default considerations. They find a large unexplained non-default component. This finding is in keeping with many papers in thecorporate bond pricing literature. Compared to the prior literature, thenovelty of our work is to offer more direct evidence of the existence ofa nondefault component by documenting that the amount of Treasuriesoutstanding is a key driver of the nondefault component of the cor-
This content downloaded on Tue, 1 Jan 2013 11:09:48 AMAll use subject to JSTOR Terms and Conditions

236 journal of political economy
porate bond spread. Furthermore, our paper shows that the nondefaultcomponent is driven by the liquidity and safety attributes of Treasurybonds.
We are aware of only a few papers in the literature that have noteda relation between the supply of government debt and interest ratespreads. Cortes (2003) documents a relation between Treasury supplyand swap spreads over the period 1994–2003. Longstaff (2004) docu-ments a relation between the supply of Treasury debt and the spreadbetween Refcorp bonds and Treasury bonds over the period 1991–2001.Relative to these papers, we study a much longer sample, provide atheoretical basis to study the relation, use several approaches to ruleout that the relation could be driven by time-varying default risk, anddecompose the Treasury convenience yield into a liquidity and safetycomponent.
There is also a literature that seeks to examine whether the relativesupplies of long- and short-term Treasury debt have an effect on theterm structure of Treasury yields. Early work in this literature was mo-tivated by the 1962–64 “operation twist,” in which the government triedto flatten the term structure by shortening the average maturity of gov-ernment debt (see, e.g., Modigliani and Sutch 1966). More recently,Reinhart and Sack (2000) show that the projected government deficitis positively related to the slope of the Treasury yield curve, suggestingthat this is evidence of a supply effect. More systematic evidence of arelative supply effect is provided by Greenwood and Vayanos (2010),who examine data for 1952–2005 and show that the relative supply oflong and short Treasuries is related to the slope of the yield curve.Krishnamurthy and Vissing-Jorgensen (2011) study the Federal Reservequantitative easing policies in 2008–11 whereby the supply of long-termTreasuries was reduced. Using an event study methodology, they showthat long-term Treasury yields fell relative to short-term yields and at-tribute this to demand for extremely safe assets of specific maturities.These papers suggest that supply effects affect the relative yields of longand short Treasuries and are complementary to our study.
In macroeconomics, there is a large literature exploring the Ricardianequivalence proposition (Barro 1974), that the financing choices of thegovernment used to fund a given stream of government expendituresare irrelevant for equilibrium quantities and prices. One implication ofthe Ricardian equivalence proposition is that the size of governmentdebt has no causal effect on interest rates. Despite a large amount ofresearch devoted to studying this topic, there is yet no clear consensuson the effects of debt on interest rates (see, e.g., the survey by Elmendorfand Mankiw [1999]). We identify an effect on the spread between gov-ernment interest rates and corporate interest rates. It is possible thatRicardian equivalence fails in a way in which government debt has an
This content downloaded on Tue, 1 Jan 2013 11:09:48 AMAll use subject to JSTOR Terms and Conditions

aggregate demand for treasury debt 237
effect on the general level of interest rates, both corporate and govern-ment. Since we focus on spreads, we are unable to isolate such an effect.From an empirical standpoint, the advantage of focusing on spreadsrather than on the level of interest rates is that the spread measure isunaffected by other shocks (such as changes in expected inflation) thataffect the level of interest rates and complicate inference. We also bypassendogeneity issues stemming from government behavior since it is un-likely that the government chooses debt levels on the basis of the cor-porate bond spread.
This paper is laid out as follows. Section II lays out a theoreticalframework to relate the demand for the attributes offered by Treasuriesto the price of Treasuries relative to other assets. The section developsa series of predictions of the theory. We test each of the theoreticalpredictions in Section III. The paper also includes appendices providingdetails on the data construction and the mathematical derivations.
II. Theoretical Framework
We articulate our theory by modifying a standard representative agentasset-pricing model to include a term whereby agents derive utility di-rectly from holdings of a “convenience” asset. The modification is alongthe lines of Sidrauski (1967), which considers a model in which agentsderive utility from their holdings of money. The representative agentmaximizes
�
tE bu(C ). (1)� ttp1
Suppose that is the sum of an endowment of plus “convenience”C ct t
benefits:AC p c � n(v , GDP; y). (2)t t t t t
The benefits are a function of the real holdings of convenience assets,. One example that we elaborate on below is that the functionAv n(7)t
captures the notion that holding more Treasury securities reduces coststhat would otherwise be incurred by transacting in a less liquid securitysuch as corporate bonds.1 The argument is the market value of theAvt
agent’s real holdings of convenience assets, which include both Trea-suries, , and any other private-sector assets, , that provide servicesT Pv vt t
similar to Treasuries:
1 To be more precise, we can define , where the functionAC p c � cost(v , GDP ; y )t t t t t
reflects costs that will be incurred by holding less liquid securities. When morecost(7)Treasuries are held, these costs are reduced. This is just a renormalization relative to ourdefining a benefit function that is increasing in . The important aspect of theAn(7) vt
modeling is that .AdC /dv 1 0t t
This content downloaded on Tue, 1 Jan 2013 11:09:48 AMAll use subject to JSTOR Terms and Conditions

238 journal of political economyA T P Pv p v � k v . (3)t t t
The constant measures the convenience services provided by thePkprivate-sector assets relative to Treasuries. The term in the convenienceyt
function is a preference shock that affects how much utility is derivedfrom convenience assets. An example of such a shock is a “flight toquality” as during a financial crisis, where investors may temporarilyincrease their valuation of convenience assets such as Treasuries. Theincome of the agent is , which is measured in real terms.GDPt
We assume that the convenience function is homogeneous of degreeone in and . This captures the idea that liquidity benefits doubleAGDP vt t
if both income and convenience assets double. Thus defineAvt Av ; y GDP { n(v , GDP; y). (4)t t t t t( )GDPt
We assume that the convenience function is increasing in , butAv /GDPt t
the marginal convenience benefit is decreasing in and has theAv /GDPt t
property . That is, holding more conve-′ Alim v (v /GDP; y) p 0Av /GDP r� t t tt t
nience assets reduces the marginal value of an extra unit of convenienceassets. Furthermore, this marginal value approaches zero if the agentis holding a large amount of convenience assets.
Let us next consider what underlies our reduced-form conveniencefunction . We argue that Treasuries are valued for their liquidity andv(7)safety. Papers such as Vayanos and Vila (1999) and Rocheteau (2009)show how the superior liquidity of an asset will lead investors to pay ahigher price for that asset. Under these theories, an increase in theholding of liquid assets will lower the marginal liquidity service providedby any liquid asset. That is, our earlier assumption that the marginalconvenience, , is decreasing in is a natural outcome of these′ Av (7) v /GDPt t
models. We refer to these theories as describing a liquidity attribute.A second benefit of Treasuries is that they are widely believed to
provide absolute certainty of nominal repayment. Under some theories,this safety attribute can drive a convenience yield that is declining inthe supply of safe assets.
Consider short-term Treasuries, such as 3- or 6-month maturity bills,which carry negligible price risk. Suppose that some investors face costsof understanding investment in risky assets, as in the literature on limitedparticipation of investors in the stock market (Vissing-Jorgensen 2003).These investors will have a unique demand for riskless assets, drivingup the price of riskless assets. In addition, in many limited participationmodels, expanding the stock of riskless assets reduces risk premia andraises riskless rates (see Gomes and Michaelides 2008). Another expla-nation for safety demand stems from the use of Treasuries as collateralin many financial transactions. Gorton (2010) notes that there is a sub-stantial demand for collateral for purposes of mitigating counterparty
This content downloaded on Tue, 1 Jan 2013 11:09:48 AMAll use subject to JSTOR Terms and Conditions

aggregate demand for treasury debt 239
risk in derivatives and settlement systems. The collateral in these trans-actions is required to be extremely safe, thus also driving the demandfor a safety attribute. Bansal and Coleman (1996) argue that commercialbanks and money market funds use Treasuries to back checkable de-posits. Treasuries thus inherit some of the medium of exchange con-venience of money, lowering the yield on Treasuries. In this explanation,it is again the safety of Treasuries that makes them good backing forchecking accounts. We will offer empirical evidence that the safety at-tribute of Treasuries is one of the drivers of the convenience yield.However, we will not distinguish further whether the underlying driverof safety demand is due to limited participation, collateral, or the check-backing explanations.
The safety explanation for low Treasury yields is distinct from thatsuggested by any of the standard representative agent model explana-tions of high risk premia in asset markets. This literature has demon-strated how altering the preferences of a representative agent to featurehigh risk aversion can produce low riskless interest rates and high riskpremia. Thus, in the representative agent model there will be a negativerelation between the price of a bond and its default risk. However, thequantity of convenience assets is unrelated to asset prices in the rep-resentative agent model. A way to think about how safety demand worksis that the relation between price and default risk is very steep near zerodefault risk, over and above the negative relation implied by the rep-resentative agent model. Furthermore, the slope of this curve near zerodefault risk decreases in Treasury supply. This latter prediction generatesa negative relation between the corporate Treasury bond spread andTreasury supply (at a given level of corporate bond default risk) and ishow to distinguish the safety explanation from a standard risk-basedexplanation (fig. 1 in Krishnamurthy and Vissing-Jorgensen [2011] il-lustrates this relation).
The safety attribute may also apply to long-term Treasuries, such as30-year bonds, which carry significant price risk because of interest ratevolatility. Here, the limited participation, collateral usage, or check-back-ing explanations are unlikely to be relevant. Instead, Greenwood andVayanos (2010) suggest that investors such as defined-benefit pensionfunds have a special demand for certain long-term payoffs to back long-term nominal obligations. The same motive may apply to insurancecompanies that write long-term policies. Furthermore, Chalmers (1998)describes how long-term Treasury bonds are posted as collateral by mu-nicipalities to secure their own long-term borrowings. Broadly, this ex-planation is similar to the preferred habitat hypothesis of the termstructure of interest rates (Modigliani and Sutch 1966), under whichinvestors are hypothesized to prefer certain maturities of bonds, but
This content downloaded on Tue, 1 Jan 2013 11:09:48 AMAll use subject to JSTOR Terms and Conditions

240 journal of political economy
applied only (or to a larger extent) to extremely safe bonds. We referto these theories as describing a long-term safety attribute.
We can represent these different theoretical rationales for conve-nience in our specification of . Denote as the stock of long-T,longv(7) vt
term Treasury bonds and as the stock of short-term TreasuriesT,shortvt
( ). Also define as the stock of non-Treasury liquidT T,long T,short P,liqv p v � v vt t t t
assets, as the stock of non-Treasury short-term safe assets, andP,short-safevt
as the stock of non-Treasury long-term safe assets. Suppose thatP,long-safevt
total convenience on short-term Treasuries can be written as the sumof two convenience components:
T liq P,liqv � k vt t liqv (7) p v ; yT,short liq t( )GDPt (5)T,short short-safe P,short-safev � k vt t short-safe� v ; y .short-safe t( )GDPt
Similarly, we can specify the convenience on long-term Treasuries asT liq P,liqv � k vt t liqv (7) p v ; yT,long liq t( )GDPt (6)
T,long long-safe P,long-safev � k vt t long-safe� v ; y .long-safe t( )GDPt
The constants, , , and , measure the convenience thatliq short-safe long-safek k kthe private-sector assets offer relative to Treasuries.
Our specification emphasizes that the safety attributes may differacross short- and long-term assets and thus lead to a difference in con-venience value in long-term assets relative to short-term assets. In con-trast, our specification assumes that both long- and short-term Treasuriesoffer equal liquidity services. The empirical literature has documentedthe existence of significant liquidity premia on both long-term and short-term Treasuries (Amihud and Mendelson 1991; Krishnamurthy 2002;Longstaff 2004). Consistent with the results from Longstaff, who studiesliquidity premia on both long-term and short-term (3 months andlonger) Treasuries, we make the assumption that long- and short-termTreasuries are equally liquid.
A. Spreads and Supply
We derive pricing expressions for short- and long-term bonds based onthese different specifications of convenience. As we describe below, de-composing the convenience in the manner above also yields empiricaltests of the existence of priced safety and liquidity attributes. Beforedescribing these tests, let us turn to asset pricing. We initially derivepredictions of the convenience yield theory that do not distinguish be-
This content downloaded on Tue, 1 Jan 2013 11:09:48 AMAll use subject to JSTOR Terms and Conditions

aggregate demand for treasury debt 241
tween the liquidity and safety motives. We then turn to predictionsimplied by each of these separate motives. In terms of the frameworkabove, our initial set of predictions implicitly assume that both vT,long
and are functions only of (as opposed to functions of both totalTv vT,short t
Treasury supply and short- or long-term Treasury supply). This will bethe case if long and short Treasury supply moves in parallel (and if thedemand shocks are perfectly correlated) or if only a liquidity motive ispresent. We relax this assumption later.
Denote the price level at date t as . If the agent buys a zero-couponQ t
nominal Treasury bond for a nominal price , his real holdings riseT AP vt t
by .2 The first-order condition for Treasury bond holdings is thenTP /Qt t
T T TP P Pt t�1 t′ ′ ′ A ′� u (C ) � bE u (C ) � v (v /GDP, y)u (C ) p 0. (7)t t t�1 t t t t[ ]Q Q Qt t�1 t
Define the pricing kernel for nominal payoffs as′u (C ) Qt�1 tM p b (8)t�1 ′u (C ) Qt t�1
so thatT T T ′ AP p E [M P ] � P v (v /GDP; y) ⇒t t t�1 t�1 t t t t (9)
TE [M P ]t t�1 t�1TP p .t ′ A1 � v (v /GDP; y)t t t
This expression indicates that a positive marginal value of convenience,, raises the price of Treasuries, .′ Tv (7) Pt
Let us next derive pricing expressions for a zero-coupon corporatebond that offers no convenience services. Suppose that the corporatebond may default next period with probability and in default paysl t
, where measures the amount of losses suffered in default1 � L Lt�1 t�1
(and is a random variable). If the bond does not default, it is worth. Then, since the bond offers no convenience, its price satisfiesCPt�1
CP p l E [M (1 � L )FDefault]t t t t�1 t�1 (10)C� (1 � l )E [M P FNo Default].t t t�1 t�1
In our empirical work we estimate the convenience demand by′v (7)relating to two different measures of the price difference betweenTvt
and , short-maturity yield spreads between corporate and TreasuryC TP Pt t
bonds and long-maturity yield spreads. We now derive expressions foreach of these price measures and compare them. For simplicity, we focusour derivations on continuously compounded yields.
2 We derive pricing expressions for zero-coupon Treasury and corporate bonds. In ourempirical work, we examine coupon bonds and assume that the impact of Treasury supplyon coupon bond spreads is qualitatively similar.
This content downloaded on Tue, 1 Jan 2013 11:09:48 AMAll use subject to JSTOR Terms and Conditions

242 journal of political economy
Consider first the case of one-period bonds. For such bonds, CP pt�1
. ThenTP p 1t�1
TE [M P ]T ′ At t�1 t�1�i T v (v /GDP ;y )t t t te p P p ≈ e E [M ]. (11)t t t�1′ A1 � v (v /GDP; y)t t t
For the corporate bond, define as a random variable that is equalL̃t�1
to zero if there is no default and equal to if there is default. ThenLt�1
C�i C ˜ ˜te p P p E [M ] � E [M ]E [L ] � Cov [M , L ]t t t�1 t t�1 t t�1 t t�1 t�1
˜�l E [L ]�Cov [M , L ]/E [M ]t t t�1 t t�1 t�1 t t�1≈ e E [M ].t t�1
We thus have the following prediction.Prediction 1 (Impact of Treasury supply on short-term spreads). The
one-period yield spread between corporate and Treasury bonds is relatedto the stock of Treasuries as follows:
T P Pv � k vt tC T ′S { i � i p v ; y � l E [L ]t,1 t t t t t t�1( )GDPt (12)
˜� Cov [M , L ]/E [M ].t t�1 t�1 t t�1
The yield spread reflects the sum of three terms: the convenience yieldon Treasuries, the expected default on the corporate bond, and a riskpremium associated with the covariance between default and the pricingkernel. Assuming that , is declining in . Con-′′ T P Pv (7) ! 0 S (v � k v )/GDPt,1 t t t
sider next the relationship between and . ProjectT PS v /GDP v/GDPt,1 t t t t
linearly on , so that , whereT P Tv /GDP v/GDP p a � a v /GDP � errort t t t 0 1 t t t
the is uncorrelated with . ThenTerror v /GDPt t t
T P P P P T P(v � k v )/GDP p k a � (1 � k a )v /GDP � k error .t t t 0 1 t t t
If , then is declining in . The latter condition willP T1 � k a 1 0 S v /GDP1 t,1 t t
be satisfied if , that is, unless the private sector reduces itsPa 1 �1/k1
supply of substitutes by more (in effective terms, ) than theP Pk v/GDPt t
increase in the Treasury supply. �We verify the prediction of the convenience model that an increase
in causes the yield spread to fall. Our regressions of the yieldTv /GDPt t
spread on recover ratherT ′ P P Tv /GDP v (7){1 � k [�(v/GDP)/�(v /GDP)]}t t t t t t
than because of the private-sector reaction to changes in Treasury′v (7)supply. In order to recover , we further need knowledge of and′ Pv (7) k
. We do not explore that in this paper because forP T�(v/GDP)/�(v /GDP)t t t t
most questions of interest, it is more important to know ′v (7){1 �rather than .P P T ′k [�(v/GDP)/�(v /GDP)]} v (7)t t t t
Note that it is possible that Treasury supply reacts accommodating todemand shocks ( ) or to increases in corporate default risk. This willyt
bias the relation between spreads and Treasury supply toward findinga positive relation, the opposite of the causal negative relation from
This content downloaded on Tue, 1 Jan 2013 11:09:48 AMAll use subject to JSTOR Terms and Conditions

aggregate demand for treasury debt 243
Treasury supply to spreads. However, we view it as unlikely that overallTreasury supply reacts substantially to demand shocks or changes in therisk of corporate bonds. The more plausible reaction involves the pri-vate-sector supply or the government’s supply of particular maturities.
Let us next consider multiperiod bonds. Define the t-period yieldson corporate and Treasury bonds as
1 1T T C Ci p � ln P and i p � ln P . (13)t,t t t,t tt t
The spread between these bonds is .C TS p i � it,t t,t t,t
Consider again the derivation for corporate bonds. Our derivationfor multiperiod bonds closely follows Duffie and Singleton (1999), re-flecting the standard practice in the corporate bond pricing literature.Suppose that the event of default or no default is nonsystematic (i.e.,uncorrelated with ). Then, we can drop the conditioning on de-Mt�1
fault/no default and rewrite (10) as
C CP p E [M (l (1 � L ) � (1 � l )P )]. (14)t t t�1 t t�1 t t�1
Assume that we can write the expected present value of the paymentin default as
CE [M (1 � L )] p E [M P ](1 � D ) (15)t t�1 t�1 t t�1 t�1 t
for a suitable process .3 This is Duffie and Singleton’s “recovery ofDt
market value” assumption. Then
C C �l D Ct tP p [l (1 � D ) � (1 � l )]E [M P ] ≈ e E [M P ]. (16)t t t t t t�1 t�1 t t�1 t�1
Note that the term is a function of and , which embodyCP D lt�1 t�1 t�1
changes in future default expectations such as downgrades. For high-grade corporate bonds, which are the focus of our study, almost all ofthe default-related risk is of this form rather than in terms of the bondsdefaulting between t and . In our setup, the latter default-relatedt � 1risk may be correlated with and carry a risk premium. Thus, ourMt�1
restriction that the default event in the next period is nonsystematic isnot a substantively important restriction but does help to simplify ourpricing expressions.
Prediction 2 (Impact of Treasury supply on long-term spreads). Theyield spread between t-period corporate and Treasury bonds is relatedto the stock of Treasuries as follows:
3 Note that in expression (15), the left-hand-side expectation is conditioning on default,whereas the right-hand-side expectation is conditioning on no default. However, giventhe assumption that the default event is nonsystematic, we can drop the conditioning.
This content downloaded on Tue, 1 Jan 2013 11:09:48 AMAll use subject to JSTOR Terms and Conditions

244 journal of political economyt�t�1 t�t�11 1′ AS p E [v (v /GDP; y)] � E [l D ]� �t,t t j j j t j j
t tjpt jpt (17)t�t�1 1
� Cov (m , R ),� t j�1 j�1tjpt
where ( ) is the log pric-′ ′m p log M p log b[u (C )/u (C )](Q /Q )j�1 j�1 j�1 j j j�1
ing kernel, and is the one-period excess return of corporate bondsR j�1
over Treasury bonds. Assuming that , is declining in′′ Tv (7) ! 0 S (v �t,t t
. As long as increases with , increases in Trea-P P A Tk v )/GDP v /GDP v /GDPt t j t j t
sury supply lower the spread, . �St,t
The derivation of this spread expression is in Appendix A. The der-ivation assumes that all relevant variables, including and changes inmt
the corporate and Treasury bond yields, are normally distributed.The spread reflects three terms: (1) the expected average Treasury
convenience benefit over the next t periods, (2) the expected averageamount of default, and (3) a risk premium that depends on the co-variance between the pricing kernel and the excess return on corporateover Treasury bonds.
Let us compare the short-term and long-term spread expressions.Note that shocks to both and have an impact on the short-Av /GDP yt t t
term spread. The impact of these shocks on the long-term spread de-pends on the persistence of the shocks. In the data, a flight to quality(liquidity and safety) shock ( ) is likely to be short lived and shouldyt
primarily affect short-term spreads. The debt-to-GDP ratio is quite per-sistent so that shocks to will have a significant impact on bothAv /GDPt t
short- and long-term spreads. This logic tells us that the convenienceyield as embodied in the long-term spread is primarily driven by
, whereas variability in the short-term spread will partly be drivenAv /GDPt t
by .4 This is an advantage of using the long-term spread and data onyt
to estimate convenience yields. On the other hand, the cor-Av /GDPt t
porate bonds we use to construct the short-term spread are closer to
4 Here is a simple case to formalize these points. Suppose that the convenience yieldfunction is
′ A Av (v /GDP ; y ) p b � b log (v /GDP ) � logy .t t t 0 1 t t t
Here, we have written the demand shock, , to enter additively in the convenience yieldyt
and assumed a log convenience yield function, as we do in most of our empirical tests.The short-term spread equally reflects a supply term and a demand termAb log (v /GDP )1 t t
. Suppose that is AR(1) with coefficient r and that is independentAlogy log (v /GDP ) logyt t t t
and identically distributed (i.i.d.) with mean zero. Then it is easy to verify that the con-venience yield component of the long-term spread is
t�t�1 1 1 logyt′ A A 2 t�1…E [v (v /GDP ; y )] p b � b log (v /GDP )(1 � r � r � � r ) � .� t j j j 0 1 t tt t tjpt
If we take years (the maturity for the long spread in our study) andt p 20 r p 0.95(consistent with data on the debt-to-GDP ratio), then the supply coefficient (1 � r �
is 0.64 and the demand coefficient is 0.05.2 t�1…r � � r )(1/t) 1/t
This content downloaded on Tue, 1 Jan 2013 11:09:48 AMAll use subject to JSTOR Terms and Conditions

aggregate demand for treasury debt 245
default free. The corporate bonds used in the long-term spread carrygreater default risk. Thus, the results based on the long-term spreadare more sensitive to precise controls for default risk.
B. Liquidity and Safety Attributes
We now reintroduce the different liquidity and safety attributes of Trea-suries and consider how one can test if these attributes are priced.Following equations (5) and (6), long- and short-term assets should beexpected to have different convenience yields. To be precise, let usreconsider the short- and long-term spread expression. The short-termspread reflects liquidity and short-term safety:
T liq P,liqv � k vt t′ liqS p v ; yt,1 liq t( )GDPt
T,short short-safe P,short-safev � k vt t′ short-safe� v ; y (18)short-safe t( )GDPt
˜� l E [L ] � Cov [M , L ]/E [M ].t t t�1 t t�1 t�1 t t�1
The long-term spread (the spread for large t) reflects the expectedliquidity and long-term safety attributes over the term of the bond:
t�t�1 T liq P,liq1 v � k vj j′ P,liqS p E v ; y�t,t t liq j( )[t GDPjpt j
T,long long-safe P,long-safev � k vj j′ long�safe� v ; y (19)long-safe j( )]GDPj
t�t�1 t�t�11 1� E [l D ] � Cov (m , R ).� �t j j t j�1 j�1
t tjpt jpt
We consider pairs of assets that have either similar liquidity and dif-ferent safety or similar safety and different liquidity. The yield spreadbetween these assets reflects only the price of liquidity or the price ofsafety. We can then test whether the price of the attribute captured bythe yield spread changes with the relevant supply of Treasuries.
Consider first the spread between P2- and P1-rated commercial paper.The former has a higher default risk than the latter. The assets are short-term but similarly illiquid as we document in the next section. Thus theP2-P1 spread purely reflects the value of short-term safety convenience.
Prediction 3 (Impact of Treasury supply on the price of short-termsafety). Consider that P2- and P1-rated commercial paper are equallyliquid (i.e., ) but that . Then, the spread be-liq liq short-safe short-safek p k k 1 kP 2 P1 P1 P 2
tween these bond yields is related to the stock of short-term Treasuries
This content downloaded on Tue, 1 Jan 2013 11:09:48 AMAll use subject to JSTOR Terms and Conditions

246 journal of political economy
as follows:P 2-P1 short-safe short-safeS p (k � k )t,1 P1 P 2
T,short short-safe P,short-safev � k vt t′ short-safe# v ; yshort-safe t( )GDPt (20)
� l E [L ] � l E [L ]t,P 2 t t�1,P 2 t,P1 t t�1,P1
˜ ˜� Cov [M , L � L ]/E [M ].t t�1 t�1,P 2 t�1,P1 t t�1
If short-term safety is a priced attribute and Treasuries have this attribute,then increases in the supply of short-term Treasuries will lower P 2-P1St,1
(as long as increases in ). �T,short short-safe P,short-safe T,short[v � k v ]/GDP v /GDPt t t t t
In terms of the estimation, the P2-P1 spread is directly a function ofthe supply of short-term convenience assets. There is extensive evidencethat both the private sector and the Treasury actively manage the ma-turity structure of debt. To get around any endogeneity issues stemmingfrom this behavior, we use instrumental variables (IV) regressions, using
as an instrument for (a similar comment appliesT T,shortv /GDP v /GDPt t t t
for testing prediction 4 below).Next consider a similar prediction but based on the spread between
two long-term corporate bonds.Prediction 4 (Impact of Treasury supply on the price of long-term
safety). Take two long-term corporate bonds, an Aaa-rated bond anda Baa-rated bond. Consider that these bonds are equally liquid (i.e.,
but that . Then, the spread between theseliq liq long-safe long-safek p k ) k 1 kAaa Baa Aaa Baa
bond yields is related to the stock of long-term Treasuries as follows:Baa-Aaa long-safe long-safeS p (k � k )t,t Aaa Baa
t�t�1 T,long long-safe P,long-safe1 v � k vj j′ long-safe# E v ; y� t long-safe j( )[ ]t GDPjpt j (21)
t�t�1
Baa Baa Aaa Aaa� E [l D � l D ]� t j j j jjpt
t�t�1 1 Baa-Aaa� Cov (m , R ).� t j�1 j�1tjpt
If long-term safety is a priced attribute and Treasuries have this attribute,then increases in the supply of long-term Treasuries will lower Baa-AaaSt,t
(as long as increases in ). �T,long long-safe P,long-safe T,long[v � k v ]/GDP v /GDPt t t t t
A similar comparison, but now getting at the liquidity attribute, ismade through the following prediction.
Prediction 5 (Impact of Treasury supply on the price of liquid-ity). Consider a one-period Treasury bond that offers one unit of li-
This content downloaded on Tue, 1 Jan 2013 11:09:48 AMAll use subject to JSTOR Terms and Conditions

aggregate demand for treasury debt 247
quidity and is default free. Consider also a Federal Deposit InsuranceCorporation (FDIC) insured bank deposit that is default free but offersonly units of liquidity. Then, the one-period spread between theseliqk ! 1bonds is related to the stock of Treasuries as follows:
T liq P,liqv � k vt tFDIC FDIC T liq ′ liqS p i � i p (1 � k )v ; y . (22)t,1 t t liq t( )GDPt
If liquidity is a priced attribute and Treasuries have this attribute, thenincreases in the supply of Treasuries will lower (as long asFDIC TS [v �t,1 t
increases in ). �liq P,liq Tk v ]/GDP v /GDPt t t t
III. Evidence
Details on the data construction for each table as well as the sourcesfor all variables used in our regressions are in Appendix B. The re-gressions all use data at an annual frequency and for as long a periodas is feasible given the variables included in the regression.
A. Impact of Treasury Supply on Spreads
Predictions 1 and 2 state that under the convenience yield hypothesis,increases in Treasury supply should reduce short spreads and longspreads. Table 1 presents regressions confirming these predictions.
The key explanatory variable in the regressions reported in the tablesis the log of debt/GDP, where debt/GDP is the market value of theoutstanding stock of US Treasuries divided by US GDP. The measureof government debt corresponds to what is referred to as publicly helddebt. It includes debt held by the Federal Reserve but excludes debtheld by other parts of the government such as the Social Security TrustFund. Our results do not change appreciably if we exclude the holdingsof the Federal Reserve. The debt measure is as of the end of the gov-ernment’s fiscal year, that is, the end of June up to and including 1976and the end of September from 1977 on. Statistics on government debtare typically reported in face value terms, whereas we are interested inthe market value of debt.5 Appendix B details how we adjust face valuesto come up with the market value of debt.
The theoretical measure of convenience yield (convenience benefit)is , where includes both Treasury debt and private-sector′ A Av (v /GDP) vt t t
convenience assets. Predictions 1 and 2 are that the convenience yieldis declining in . As we have noted, as long as private-sectorAv /GDPt t
convenience asset supplies do not change more than one for one (in
5 Doepke and Schneider (2006) encounter the same issue in studying how inflationaffects the market value of debt. They offer a procedure to compute market values ofdebt.
This content downloaded on Tue, 1 Jan 2013 11:09:48 AMAll use subject to JSTOR Terms and Conditions

TA
BL
E1
Impa
cto
fT
reas
ury
Supp
lyo
nB
on
dSp
read
s:L
og
Spec
ifica
tio
n
A.
Aaa
-Tre
asu
ryB
.B
aa-T
reas
ury
C.
CP-
Bil
lsD
.C
PP2-
Bil
ls
1919
–200
8(1
)19
69–2
008
(2)
1926
–200
8(3
)19
69–2
008
(4)
1926
–200
8(5
)19
20–2
008
(6)
1969
–200
8(7
)19
26–2
008
(8)
1974
–200
7(9
)
Log
(deb
t/G
DP)
�.7
46[�
4.36
]�
.870
[�2.
78]
�.8
00[�
5.12
]�
1.66
2[�
3.96
]�
1.30
9[�
7.55
]�
.730
[�4.
42]
�.9
61[�
2.08
]�
.554
[�3.
56]
�1.
958
[�3.
97]
ED
F1.
040
[3.5
1]1.
453
[3.2
1].1
26[.
24]
.040
[.08
]Vo
lati
lity
1.31
3[1
.93]
6.34
4[6
.81]
1.90
2[2
.28]
Slop
e.0
58[1
.26]
.081
[1.8
9].2
21[2
.88]
.312
[4.6
9]�
.102
[�1.
09]
�.0
83[�
1.39
]�
.10
[�1.
10]
Inte
rcep
t.1
09[.
62]
.118
[.35
].0
77[.
49]
.377
[.84
].7
37[4
.33]
.095
[.57
]�
.200
[�.4
0].2
27[1
.48]
�.8
49[�
1.66
]2
R.4
49.5
99.5
73.5
77.6
90.2
26.1
84.2
58.2
87r
.604
.460
.552
.171
.013
.175
�.0
22.0
16.0
74O
bser
vati
ons
9040
8340
8389
4083
34
No
te.—
Th
ede
pen
den
tva
riab
les
are
lon
g-an
dsh
ort-t
erm
yiel
dsp
read
sbe
twee
nco
rpor
ate
and
Trea
sury
bon
ds,b
oth
mea
sure
din
perc
enta
geun
its.
Inde
pen
den
tva
riab
les
are
the
log
ofth
era
tio
ofth
em
arke
tva
lue
ofTr
easu
ryde
btou
tsta
ndi
ng
toU
SG
DP
and
con
trol
sfo
rth
ede
faul
tri
skan
dde
faul
tris
kpr
emiu
mon
corp
orat
ebo
nds
.ED
Fis
the
expe
cted
defa
ultf
requ
ency
for
corp
orat
ebo
nds
.Vol
atili
tyis
the
ann
ualiz
edst
anda
rdde
viat
ion
ofw
eekl
ylo
gst
ock
retu
rns
onth
eS&
P50
0in
dex.
Slop
eis
the
slop
eof
the
Trea
sury
yiel
dcu
rve
mea
sure
das
the
spre
adbe
twee
nth
e10
-yea
rTr
easu
ryyi
eld
and
the
3-m
onth
Trea
sury
yiel
d.A
ppen
dix
Bpr
ovid
esth
epr
ecis
ede
fin
itio
ns
ofal
lva
riab
les.
ED
F,vo
lati
lity,
and
slop
eco
ntr
ols
are
dem
ean
ed.
Reg
ress
ion
sar
ees
tim
ated
byO
LS.
Th
est
anda
rder
rors
are
adju
sted
assu
min
gth
ater
rors
are
AR
(1).
We
use
the
Box
-Je
nki
ns
met
hod
olog
yfo
rid
enti
fyin
gth
eer
ror
stru
ctur
e.r
den
otes
the
firs
t-ord
erau
toco
rrel
atio
nof
the
erro
rte
rms.
t-sta
tist
ics
are
inbr
acke
ts.
This content downloaded on Tue, 1 Jan 2013 11:09:48 AMAll use subject to JSTOR Terms and Conditions

aggregate demand for treasury debt 249
the opposite direction) in response to changes in Treasury debt, we canverify predictions 1 and 2 by examining the impact of changes in Trea-sury debt on price measures. The regression coefficient on Treasurydebt should be interpreted as reflecting the effect, net of the private-sector supply response, of a change in Treasury debt on the Treasuryconvenience yield.
1. Long-Term Spreads
In table 1, the Treasury debt variable is the logarithm of the debt-to-GDP ratio, and the dependent variable in each regression is a bondyield spread measured in percentage terms. Panels A and B presentresults for long-term spreads, namely, the spread between long-term Aaa-rated corporate bonds and long-term Treasuries (panel A) and thespread between long-term Baa-rated corporate bonds and long-termTreasuries (panel B). We use the log functional form because it providesa good fit and requires estimation of only one parameter. A drawbackwith the log function is that it does not asymptote to zero as debt-to-GDP rises. We estimate an alternative functional form with the asymptoteproperty in Section III.C.
The regressions in table 1 are estimated using ordinary least squares(OLS). We report t-statistics adjusting the standard errors assuming anAR(1) error structure. The AR(1) structure is motivated by a standardBox-Jenkins analysis of the autocorrelation function and partial auto-correlation function of the error terms. The first-order autocorrelationsare included in the table. Serial correlation is pronounced only in thelong-term spread regressions of panel A. For consistency across columns,we use the AR(1) adjustment in all columns though it makes little dif-ference except in panel A, where t-statistics based on “standard” OLSstandard errors (assuming an i.i.d. error term) would be substantiallylarger than those presented. An alternative to OLS estimation with anAR(1) standard error adjustment would be to use generalized leastsquares (GLS) estimation. However, we suspect that log(debt/GDP) isnot a perfect measure of the convenience state variable in the long-term spread regressions, . It is likely that thet�t�1 ′ A� (1/t)E [v (v /GDP; y)]t j j jjpt
private-sector expectations of this sum involve variables other than thecurrent debt-to-GDP ratio (notably information about the likely devel-opment of the government budget). If so, then debt-to-GDP is measuredwith error implying downward bias in the impact of Treasury supply onspreads (under standard assumptions about the measurement error).GLS estimation would be more affected by the measurement error issue.To see this, suppose that the error autocorrelation was close to one.Then GLS would effectively transform the data to run a first-differenceregression. While in levels the variance of log(debt/GDP) is likely to
This content downloaded on Tue, 1 Jan 2013 11:09:48 AMAll use subject to JSTOR Terms and Conditions

250 journal of political economy
be large relative to that of the measurement error, in first differencesthis will not be the case since the high persistence of log(debt/GDP)means that the volatility of its first difference is low (a formal MonteCarlo study of this issue is available on request). These considerationslead us to present OLS regressions with standard errors adjusted forthe serial correlation. We emphasize that our OLS regression coefficientsare likely to be conservative, understating the impact of Treasury supplyon convenience yields.6
The coefficient of �0.746 in column 1 of table 1 implies that a de-crease of one standard deviation in debt-to-GDP from its mean value of0.439 to 0.243 increases the convenience yield component of the Aaa-Treasury spread by as much as 0.44 percent (44 basis points).
Default risk is an important component of the bond spreads. In col-umns 2 and 3 we show that the impact of Treasury supply on the Aaa-Treasury spread is robust to including default controls. Moody’s Inves-tors Service (2005) estimates, on the basis of data from 1920–2004, thatthe default rate on Aaa-rated bonds over a 10-year period is around 1percent, whereas for Baa bonds this default rate is 8 percent. In column2, we control for default risk using a default measure computed byMoody’s Analytics, which is the current industry standard in calculatingdefault probabilities for corporate bond pricing. Its computation isbased on Merton (1974), which treats the debt of a firm as a risklessasset minus a put option on the firm’s assets. Using capital structureinformation and Merton’s option decomposition of capital structure,Moody’s infers the firm’s asset value and asset value volatility. This in-formation allows it to compute the distance to default on debt (i.e.,moneyness of the put option). Using historical default information ina nonlinear regression, Moody’s estimates how distance-to-default trans-lates into default probabilities. We use the median expected defaultfrequency (EDF) credit measure reported by Moody’s Analytics for largefirms (defined as firms with book value of assets 1 $300 million ininflation-adjusted dollars). The EDF credit measure is available from1969 to 2008. The results in column 2 show that the EDF credit measureis informative. Crucially, the coefficient on log(debt/GDP) remainshighly significant and of roughly the same magnitude as in other spe-
6 A standard solution to the bias problem would be an IV approach. If the error termwas serially uncorrelated, one could use lagged values of log(debt/GDP) as the instrumentfor log(debt/GDP). With serially correlated errors one should lag the instrument farenough to avoid correlation between the instrument and the error term. We find thatthe coefficient on log(debt/GDP) is larger in IV estimations and keeps increasing as theinstrument is lagged further. This suggests that the measurement error concern is relevantbut that it is unclear how far to lag the instrument and therefore more conservative toreport only OLS results.
This content downloaded on Tue, 1 Jan 2013 11:09:48 AMAll use subject to JSTOR Terms and Conditions

aggregate demand for treasury debt 251
cifications.7 The EDF measure is available only back to 1969, whereaswe would like a default measure that goes back to 1926. Because theEDF measure is option pricing based, the key input into the measureis stock return volatility. Thus for the longer sample we use stock returnvolatility. We measure the weekly returns on the value-weighted Standard& Poors index based on daily returns. As the volatility measure for agiven year, we compute the standard deviation of the weekly log returnsover the year leading up to the end of the government fiscal year (thedate of the debt-to-GDP observation). We annualize this standard de-viation by multiplying by the square root of 52. Over the 40 years forwhich we have both EDF data and stock market volatility estimates, thecorrelation of these two default measures is .76. This provides strongsupport for the use of stock market volatility as a default control overthe full sample. Column 3 presents results using the stock return vol-atility measure. Volatility is significantly related to the spread, but thecoefficient on log(debt/GDP) is roughly the same as in previous spec-ifications. Furthermore, the economic effects of changes in the defaultrisk measures on the Aaa-Treasury spread are modest compared to theeffect of Treasury supply. A one-standard-deviation increase in the EDFincreases the Aaa-Treasury spread by 23 basis points whereas a one-standard-deviation increase in stock return volatility increases it by 10basis points.
The regressions in columns 2 and 3 include the slope of the yieldcurve as a further control. We measure the slope as the spread betweenthe 10-year Treasury yield and the 3-month Treasury yield (slope). Theslope of the yield curve is a measure of the state of the business cycle.It is known to predict the excess returns on stocks and may also pickup time-varying risk premia on corporate bonds. For example, if inves-tors are more risk averse in a recession, when the slope is high, theywill demand a higher risk premium to hold corporate bonds. Thus, theslope of the yield curve serves as a measure of variation in the riskpremium component of the bond spread, that is, the term involving
in prediction 2. We also note that to the extent that corporateCov (7)t
default risk is likely to vary with the business cycle, the slope variable
7 Another issue that arises in interpreting the long-term spread regressions is callability.Duffee (1998) points out that the Moody’s Aaa index includes callable corporate bonds.Thus, the Aaa-Treasury spread may also reflect an interest rate option. Duffee proxies forthe moneyness of the call option using the level of interest rates and shows that yieldspreads vary significantly with the level of interest rates. Following this approach, we haveinvestigated adding levels of short- and long-term Treasury yields as explanatory variablesin our long-term spread regressions and have found that it has no appreciable effects onthe coefficient on log(debt/GDP). A further issue that affects spreads between corporatebonds and Treasuries is that Treasuries are exempt from state taxes but corporate bondstypically are not. We have run regressions that include a control for the state tax effecton the spread (the product of the average state tax rate and the Aaa yield) and find thatour results are largely unchanged.
This content downloaded on Tue, 1 Jan 2013 11:09:48 AMAll use subject to JSTOR Terms and Conditions

252 journal of political economy
can furthermore help control for the expected default in the yieldspread.
For the results for the Baa-Treasury spread in panel B, the coefficienton log(debt/GDP) in column 5 is considerably higher than the coef-ficient in column 3 for the Aaa-Treasury spread and implies that a de-crease of one standard deviation in debt-to-GDP from its mean value of0.439 to 0.243 increases the convenience yield component of the Baa-Treasury spread by 0.77 percent (77 basis points). The difference inresults between panels A and B suggests that Aaa bonds offer someconvenience services of Treasuries and thus that the Baa-Treasury spreadis more appropriate for capturing the full effect of Treasury supply onthe Treasury convenience yield. We present further evidence for thisinterpretation in table 2 below.
2. Short-Term Spreads
Panels C and D of table 1 are based on short-term bond spreads, withpanel C showing results for the spread between the highest-rated com-mercial paper (CP) and Treasury bills, both of 3-month maturity, andpanel D focusing on the spread between lower-grade commercial paper(A2/P2-rated paper) and Treasury bills. The shorter time period is usedin column 9 because yields for lower-grade commercial paper are avail-able only starting in 1974.8
Short- and long-term spreads may contain different convenience at-tributes, so we should not expect the coefficients on log(debt/GDP) tobe the same across the different maturities. Nonetheless, the regressionsfor short-term spreads show that the effects of changes in Treasury supplyon short-term spreads have magnitudes fairly similar to that of the effecton long-term spreads. Consistent with the results for long-term spreads,the higher coefficient in panel D than in panel C is also indicative thatthe high-grade commercial paper in panel C (like the Aaa-rated long-term bonds in panel A) has some convenience attributes.
It is important to note that our evidence on the spread betweencommercial paper and Treasury bills is less likely to be affected by issuesof omitted expected default or default risk premium controls than theevidence on the Aaa-Treasury spread. This is the case because historicaldefault rates on the highest-rated commercial paper (A1/P1) are verylow, with literally zero defaults during the period 1972–2000 for whichMoody’s Investors Service (2000) provides data on commercial paper
8 When analyzing lower-grade commercial paper yields, we drop 2008. This year is adramatic outlier in terms of the lower-grade commercial paper yield, likely because ofincreased default risk. Since our EDF default control, which pertains to corporate bonds,may not be as good a control for default risk for commercial paper as for corporate bonds,we drop 2008 in our analysis of lower-grade commercial paper.
This content downloaded on Tue, 1 Jan 2013 11:09:48 AMAll use subject to JSTOR Terms and Conditions

aggregate demand for treasury debt 253
defaults. This latter observation can also explain why the default controlsare statistically not different from zero in the commercial paper re-gressions in columns 7 and 9. Over a 3-month period, a highly ratedfirm may run into financial difficulties and be downgraded but is un-likely to enter bankruptcy.
B. Evidence for the Existence of Priced Liquidity and Safety Attributes
We next test predictions 3–5 that the convenience yield on Treasuriesis a reflection of two priced attributes: liquidity and safety. We considerpairs of assets with different liquidity but similar safety or with differentsafety but similar liquidity. Table 2 presents the results.
Columns 1 and 2 of table 2 present evidence for the existence of aunique demand for long-term safe assets leading to a positive conve-nience price of the long-term safety attribute. The dependent variableis the spread between Baa and Aaa corporate bonds. Baa bonds carrymore default risk than Aaa bonds but are similarly illiquid. Chen, Les-mond, and Wei (2007) study corporate bond liquidity in a large sampleof corporate bonds over the period 1995–2003 and report that thespread between bid and ask prices (as a percentage of the price) onAaa corporate bonds averaged 52 basis points whereas it averaged 59basis points on the Baa corporate bonds. These spreads compare toabout 10–20 basis points for Treasury bonds (calculated on the basis oftypical dollar spreads of two to three 32nds per $100 face value accordingto Longstaff [2004]). Thus any convenience yield as measured in theBaa-Aaa spread can reflect only the price of the long-term safety attributeas opposed to a liquidity effect. Column 1 shows that an increase inTreasury supply leads to a decrease in the Baa-Aaa spread, confirmingthe existence of a priced long-term safety attribute driven by Treasurysupply. Theory suggests that the supply of long-term safe assets ratherthan the total supply of Treasuries should drive the price of long-termsafety. In column 2, we present results using the supply of long-termTreasury debt, measured as the supply of Treasuries with greater than10 years’ remaining maturity divided by GDP. Since the maturity struc-ture of government debt is likely to be endogenous, we instrument thelong-term supply by powers of debt/GDP. The first stage of the IV re-gression is not reported for brevity but shows a highly significant relationbetween total debt and the measure of long-term debt. The coefficientof �0.304 means that a one-standard-deviation decrease in the supplyof long-term Treasuries (as a ratio to GDP) from its mean value of 0.079to 0.021 raises the price of long-term safety by 40 basis points.
Columns 3 and 4 present evidence for the existence of a priced short-term safety attribute driven by Treasury supply. The dependent variableis the spread between 3-month A2/P2-rated and A1/P1-rated commer-
This content downloaded on Tue, 1 Jan 2013 11:09:48 AMAll use subject to JSTOR Terms and Conditions

TABLE 2Impact of Treasury Supply on the Price of Safety and the Price of Liquidity
A. Price of Safety B. Price of LiquidityBaa-AaaS P2-P1S FDIC-insuredCDs–BillsS Time/SavingsAccounts–BillsS
1926–2008(1)
1926–2008(2)
1974–2007(3)
1974–2007(4)
1984–2008(5)
1935–65(6)
Log(debt/GDP)
�.510[�3.45]
�.888[�4.34]
�1.884[�1.71]
�.690[�2.57]
Log(debt 1 10-year matur-ity/GDP)*
�.304[�2.44]
Log(debt ≤ 1-year matur-ity/GDP)*
�1.462[�2.84]
Volatility 5.031[6.47]
6.232[6.65]
EDF .074[.35]
.019[.07]
Slope .232[4.20]
.211[3.29]
.014[.42]
.055[1.13]
.101[.88]
1.181[10.04]
Constant .660[4.54]
.264[.74]
�.508[�2.39]
�2.679[�2.47]
�1.486[�1.52]
�.170[�.95]
Observations 83 83 34 34 25 312R .600 .497 .233 .898
Estimationmethod OLS IV OLS IV OLS OLS
Error term AR(1) AR(1) AR(1) AR(1) AR(1) AR(1)
Note.—The dependent variables are the spread between Baa-rated corporate bondsand Aaa-rated bonds (cols. 1 and 2), the spread between A2/P2-rated and A1/P1-ratedcommercial paper (cols. 3 and 4), the spread between the interest rate on FDIC-insured6-month CDs and 6-month Treasury bills (col. 5), and the spread between the averageinterest rate paid by banks on time and savings deposits and 6-month Treasury bills (col.6). Independent variables are the log of the ratio of the market value of Treasury debtoutstanding to US GDP, the log of the ratio of the market value of Treasury debt withremaining maturity greater than 10 years to US GDP, the log of the ratio of the marketvalue of Treasury debt with remaining maturity less than 1 year to US GDP, the annualizedstandard deviation of weekly log stock returns on the S&P 500 index (volatility), theexpected default frequency for corporate bonds (EDF), and the slope of the Treasuryyield curve measured as the spread between the 10-year Treasury yield and the 3-monthTreasury yield in cols. 1–4 and as the spread between the 10-year Treasury yield and the6-month Treasury yield in cols. 5 and 6. Appendix B provides the precise definitions ofall variables. EDF, volatility, and slope controls are demeaned. Regressions are estimatedby OLS or instrumental variables (two-stage least squares), where we use instruments debt/GDP, (debt/GDP)2, and (debt/GDP)3, as indicated. The standard errors are adjustedassuming that errors are AR(1). We use the Box-Jenkins methodology for identifying theerror structure. t-statistics are in brackets.
* Instrumented by (debt/GDP), (debt/GDP)2, and (debt/GDP)3.
This content downloaded on Tue, 1 Jan 2013 11:09:48 AMAll use subject to JSTOR Terms and Conditions

aggregate demand for treasury debt 255
cial paper. Over a 3-month period, on the basis of data from 1972 to2000, Moody’s Investors Service (2000) estimates that the default prob-ability on A2/P2 paper is 0.02 percent and is 0 percent for A1/P1 paper.Thus there is a (small) difference in the safety of these short-term assets.As for liquidity, there is little secondary market trading activity in com-mercial paper of any rating. On the basis of data from 1998 to 2003,Covitz and Downing (2007) report that most of the commercial paperactivity is in terms of new issuance. Secondary market transactions ac-count for only about 8 percent of daily market trading activity by facevalue. Using trading volume as a proxy for liquidity and EDF, and creditrating and stock volatility as proxies for credit risk, Covitz and Downingfind that, in the cross section of commercial paper, liquidity differencesexplain very little of the variation in rates. Thus, any convenience yieldas measured in the P2-P1 spread reflects the price of the short-termsafety attribute. In column 3 we use total Treasury supply, and column4 presents an IV regression, where the supply measure is of Treasurieswith maturity less than 1 year divided by GDP. The results in bothcolumns 3 and 4 confirm the existence of a significant price of short-term safety. The coefficient of �1.462 in column 4 means that a one-standard-deviation decrease in the supply of short-term Treasuries (asa ratio to GDP) from its mean value of 0.124 to 0.104 raises the priceof short-term safety by 26 basis points.
Columns 5 and 6 present evidence for the existence of a priced li-quidity attribute of Treasuries, comparing assets with similar safety butdifferent liquidity. The dependent variable in column 5 is the spreadbetween the interest rate customers receive on 6-month FDIC-insuredcertificates of deposit (CDs) and 6-month Treasury bills. We start theCD series in 1984, corresponding to the phasing out of Regulation Q(see Gilbert 1986). Given FDIC insurance, any convenience yield doc-umented via Treasury supply affecting this spread can reflect only aliquidity attribute. The supply variable in the regression is the totalsupply of Treasuries since all Treasuries carry the liquidity attribute. Theimpact of Treasury supply on the CD-Treasury spread confirms the ex-istence of a significant price of liquidity over the 1984–2008 period. Toobtain evidence going back further, column 6 uses data on the spreadbetween the average interest rate paid on time and savings deposits andTreasury bill rates. Since interest rate ceilings set by Regulation Q werebinding at various points during the period from 1966 until their phase-out in the mid-1980s (see again Gilbert 1986), we focus on data from1934—the first year of FDIC insurance—to 1965 (we do not have CDrate data from this earlier period). The interest rate on time and savingsdeposits is less ideal than the CD rate because FDIC insurance does notapply to large deposits, so the interest rate on time and savings depositsreflects a mix of insured accounts and noninsured accounts. The FDIC
This content downloaded on Tue, 1 Jan 2013 11:09:48 AMAll use subject to JSTOR Terms and Conditions

256 journal of political economy
reports that insurance applied to approximately half of all deposits atcommercial banks over the period 1934–65 (FDIC 1984). As a result,there is a slight difference in the safety of the average time and savingsdeposit and of Treasuries.9 In addition, the time and savings depositsare an amalgam of deposits with different maturities, making it moredifficult to maturity match the series to Treasuries. We match it to 6-month Treasuries and include a slope control to deal with the maturitymismatch. Subject to these qualifiers, the evidence in column 6 of animpact of Treasury supply on the interest rate spread between time andsavings deposits and Treasuries provides further support that investorsvalue liquidity with Treasury supply driving the price of liquidity.10
We can gauge the magnitude of the liquidity effect in two differentways. First, note that the deposits in column 6 include very short-termsavings accounts that are quite liquid. That is, the spread in column 6reflects the difference between a very liquid Treasury and a liquid bankaccount, so that the spread reflects an underestimate of how muchTreasury yields are reduced by the liquidity attribute of Treasuries. Thespread in column 5 is a more pure read on the liquidity impact onTreasury yields, although the sample is quite short. The coefficient of�1.884 means that a one-standard-deviation decrease in the supply ofTreasuries (as a ratio to GDP) from its mean value of 0.439 to 0.243raises the price of liquidity by 111 basis points. A second estimate ofthe impact of Treasury supply on the price of liquidity comes from theregression in table 1, column 7, which is the high-grade CP spreadregression for 1969–2008. Considering the spread between CP and Trea-sury bills also deals with concerns that the spread between insured CDrates and Treasury bills partly reflects intermediation costs or retail de-posit effects. We have noted that data from 1972 on indicate that therehas never been a default on high-grade CP. The coefficient on thedefault controls in that regression is also small and statistically not dif-ferent from zero. Using this spread as a measure of liquidity, we findthat a one-standard-deviation decrease in the supply of Treasuries (as aratio to GDP) from its mean value of 0.439 to 0.243 raises the price ofliquidity by 57 basis points.
C. Quantifying the Convenience Yield
We next turn to quantifying the level of the convenience yield. Resultsfrom the log specification pin down the derivative of the convenience
9 Including the fraction of deposits that are insured as a control does not affect theresults, and this variable is not a significant determinant of the spread.
10 Note that we focus on time and savings account deposit rates. Checking deposits,and not time and savings deposits, are conventionally thought to provide a medium ofexchange attribute.
This content downloaded on Tue, 1 Jan 2013 11:09:48 AMAll use subject to JSTOR Terms and Conditions

aggregate demand for treasury debt 257
TABLE 3Impact of Treasury Supply on Bond Spreads: Piecewise-Linear Specification
A. Aaa-Treasury B. Baa-Treasury
1919–2008(1)
1926–2008(2)
1919–2008(3)
1926–2008(4)
b0 .319[1.80]
.347[2.55]
1.019[1.94]
1.200[7.68]
b1 2.590[4.06]
3.075[5.17]
4.309[2.64]
4.952[6.76]
b2 .584[7.02]
.548[9.74]
.626[4.22]
.546[12.92]
Volatility 1.206[1.93]
6.215[6.98]
Slope .096[2.43]
.334[5.07]
2R .479 .618 .290 .704Observations 90 83 90 83
Note.—This table estimates a piecewise-linear specification for the relation betweenTreasury supply and bond spreads. The function estimated is b � b # max [b �0 1 2
. The dependent variables are long-term yield spreads between corporatedebt/GDP, 0]and Treasury bonds, measured in percentage units. Independent variables are the ratioof the market value of Treasury debt outstanding to US GDP and controls for the defaultrisk and default risk premium on corporate bonds. Volatility is the annualized standarddeviation of weekly log stock returns on the S&P 500 index. Slope is the slope of theTreasury yield curve measured as the spread between the 10-year Treasury yield and the3-month Treasury yield. Appendix B provides the precise definitions of all variables. Vol-atility and slope are demeaned. Regressions are estimated by nonlinear least squares. Thestandard errors are adjusted assuming that errors are AR(1). We use the Box-Jenkinsmethodology for identifying the error structure. t-statistics are in brackets.
yield with respect to Treasury supply but do not pin down the level ofthe convenience yield as a function of Treasury supply. Theory suggeststhat the value of convenience should go to zero given sufficient con-venience assets. Imposing this asymptote property allows us to quantifythe level of the convenience yield, since the convenience yield at some
given an estimated relation between spreads and Treasury supply ofTvt
is simply (i.e., the distance between theT Tf(v /GDP) f(v /GDP) � f(�)t t
predicted spread and the estimated asymptote).The log function does not have the asymptote property. Table 3 re-
ports results in which we model the convenience yield with a functionthat is piecewise linear in Treasury supply, .b max [b � debt/GDP, 0]1 2
Visually, the piecewise linear function appears to be a good fit of therelation as depicted in figure 1. Indeed, the ’s for the piecewise linear2Rfunction rise a bit relative to the log function. Regressions are estimatedby nonlinear least squares. As in table 1, the standard errors are adjustedassuming that the error term is AR(1).
The term is the convenience yield on long-b max [b � debt/GDP, 0]1 2
This content downloaded on Tue, 1 Jan 2013 11:09:48 AMAll use subject to JSTOR Terms and Conditions

258 journal of political economy
term Treasury debt as a function of the debt-to-GDP ratio. Consider theestimates from column 4 for the Baa-Treasury spread. We can evaluatethe convenience yield function at historical values of the debt-to-GDPratio from 1926 to 2008 and average these numbers to come up withthe average value of the convenience yield over our sample. This com-putation gives 73 basis points.11 The Baa-Treasury spread reflects bothlong-term safety and liquidity. We have argued that the Baa-Aaa spreadis driven only by long-term safety, whereas the Aaa-Treasury spread isprimarily driven by liquidity given the low default rate on Aaa bonds.To provide a sense of the relative magnitudes of the safety and liquidityconvenience components, we make the simplifying assumption that theAaa-Treasury spread reflects only liquidity whereas the Baa-Aaa spreadreflects only safety. On the basis of the Aaa-Treasury estimates of column2, the average liquidity convenience is 46 basis points. This numbershould be interpreted as an upper bound for liquidity convenience sincethe Aaa-Treasury spread does contain some safety convenience as well(since Aaa bonds are not quite as safe as Treasuries). Further, subtracting46 from 73 gives us that safety convenience is worth 27 basis points onaverage (a lower bound since Aaa’s do carry some default risk).
Are these estimates plausible on the basis of the existing literature?Consider liquidity first. Figure 1 in Krishnamurthy (2002) documentsthat the yield spread between the on-the-run liquid 30-year Treasurybond and the off-the-run less liquid 30-year Treasury bond was 12 basispoints on February 9, 2001. In price terms, if the modified duration ofthe bonds is taken to be 12 years, the on-the-run bond was priced at
11 There is an important caveat in interpreting the piecewise-linear estimates. The es-timates of (the intercept) and (the kink point) are heavily affected by observationsb b0 2
in the right tail of fig. 1 (i.e., high debt-to-GDP ratios). These high ratios occur only duringthe 1940s and 1950s, so the parameter estimates are influenced by the idiosyncrasies ofthe war period. In an effort to help finance the war debt at low interest rates, the FederalReserve committed to purchasing long-term Treasury bonds at a floor below prevailingmarket prices, thereby inducing long-term Treasury rates to be lower than market forceswould have otherwise dictated. As events played out, the Federal Reserve did not in factaccumulate many long-term Treasuries, but even so, the commitment to a floor shouldbe expected to affect prices. As a result, our estimates of are biased upward—implyingb0
that our above estimate of an average Treasury convenience yield of 73 basis points isconservative—and estimates of are biased downward. The Federal Reserve intervenedb2
much more strongly in the Treasury bill market. Policy at the time effectively allowedcommercial banks to carry Treasury bills as interest-bearing reserves because the FederalReserve allowed banks to freely exchange Treasury bills for reserves at a fixed price. Inaddition, beginning in 1943, the Federal Reserve directly purchased a large share of newlyissued Treasury bills, whereas long-term bonds were held by a variety of investors. TheFederal Reserve directly held 72 percent of total Treasury bills outstanding in 1944. SeeWicker (1969) for further details on all of these points. We present piecewise-linear re-gressions for the long-term spreads, subject to the caveat noted above, but we do notpresent results for the short-term spreads on grounds that they are likely largely unin-formative about convenience yields. We also note, as can be seen from cols. 2, 4, 7, and9 in table 1, that our main results about the impact of Treasury supply on yields hold forsubsamples that do not include the war period.
This content downloaded on Tue, 1 Jan 2013 11:09:48 AMAll use subject to JSTOR Terms and Conditions
aggregate demand for treasury debt 259
1.44 percent over the off-the-run bond. Krishnamurthy notes that thisdifference will converge to a price premium of 0.36 percentage pointsover the next 9 months. Thus, the annualized liquidity convenienceyield on the on-the-run bond was 144 basis points (p[1.44 � 0.36] #
).12 This computation demonstrates that liquidity premia[12/9] # 100on Treasury bonds are indeed quite large. Our estimate, which is roughlyone-third of that from the on-the-run bond, likely arises from the factthat we measure a liquidity premium on all Treasuries and not only theexceptionally liquid on-the-run bond.
Consider long-term safety next. Longstaff et al. (2005) study the pric-ing of corporate bonds relative to Treasury bonds, using informationfrom the credit default swap market to pin down the default compo-nent.13 As with most papers in the literature, their paper finds that thereis a substantial nondefault component in the corporate bond spreads.Their estimates put the average nondefault component at 65 basispoints, which is in line with our overall convenience yield estimates.Most relevant for the safety premium, they find that the nondefaultcomponent is about 50 basis points for Aaa- and Aa-rated bonds andabout 70 basis points for lower-rated bonds. Thus the premium due tosafety for the Aaa bond is 20 basis points, which is similar to our estimateof 27 basis points.
IV. Conclusion
Investors value the liquidity and safety attributes of Treasuries. We doc-ument this by showing that changes in Treasury supply have large effectson a variety of yield spreads. Evaluated on the basis of the Baa-Treasuryspread (for long-term bonds), a one-standard-deviation reduction inTreasury supply (starting from mean supply) lowers Treasury yields by77 basis points relative to corporate bond yields. The effects based onthe CPP2-bills spread (for short-term bonds) have roughly similarmagnitudes.
By studying pairs of assets with similar liquidity but different safety(higher- and lower-grade corporate bonds and commercial paper) or
12 It is a coincidence that the 1.44 percent price premium and the 144 basis pointconvenience yield are the same numbers in the example. For the sample studied inKrishnamurthy (2002) for 1990–99, the paper finds that the on-the-run/off-the-run yieldspread converges at the rate of 3.2 basis points per 90 days (table 6, col. 1), which translatesto an annualized liquidity convenience yield of 156 basis points (p12 # 3.2 #
).[365/90]13 In the piecewise-linear regressions, the constant term is the average default com-b0
ponent of the spread, since the EDF, volatility, and slope controls in the regressions aredemeaned. Consider col. 4 for the Baa-Treasury spread. This regression indicates that
is 1.200, which is within the range of estimates from the corporate bond price literatureb0
of the default component of Baa bonds (see Longstaff et al. 2005).
This content downloaded on Tue, 1 Jan 2013 11:09:48 AMAll use subject to JSTOR Terms and Conditions
260 journal of political economy
with similar safety but different liquidity (FDIC-insured CDs and Trea-sury bills), we document that changes in Treasury supply drive both theequilibrium price of safety and the equilibrium price of liquidity. Thisimplies that Treasuries carry both a safety and a liquidity attribute. Usinga piecewise-linear specification, we estimate that the average conve-nience yield on long-term Treasuries over the period 1926–2008 is 73basis points, of which at most 46 basis points are driven by the liquidityof Treasuries and at least 27 basis points by the safety of Treasuries.
One way of putting these basis point estimates in perspective is tocompute the seigniorage the government collects from being able tofinance the US federal debt with securities that offer convenience ben-efits. The historical average debt-to-GDP ratio is 0.439. At this debt-to-GDP, the convenience yield from the Baa-Treasury piecewise linear spec-ification in column 4 of table 3 evaluates to 53 basis points. Multiplyingthese numbers together gives seigniorage of 0.23 percent of GDP. Al-ternatively, if we evaluate the convenience yield at each of the debt-to-GDP ratios in our sample, multiplying by that debt-to-GDP ratio andthen averaging, we find that average seigniorage is also 0.23 percent ofGDP.14 For comparison, consider the seigniorage that the governmentderives from households’ willingness to hold fiat money at no interest.The monetary base at the end of 2007, prior to the Federal Reserve’squantitative easing experiment, was $825 billion, corresponding to 6percent of GDP. Suppose that the federal government had to repurchasethe monetary base by issuing Treasury bills and that these Treasury billshad a 4 percent nominal yield. Then the annual interest expense ofthis additional debt would be percent of GDP per year.4 # 0.06 p 0.24Together, these calculations suggest that the total benefit from the con-venience yield on Treasuries is large and that the seigniorage to thegovernment from being able to finance the current level of debt withsecurities that have a convenience yield has the same order of magnitudeas the seigniorage resulting from the public’s willingness to hold fiatmoney at no interest.
Our results have many implications for asset pricing. Since Treasurydebt carries a convenience yield, the common practice of identifyingthe Treasury interest rate with models’ riskless interest rate is incorrect.We have argued that the observed price of a one-period Treasury is
(implying an interest rate ofT ′ A TP p E [M ]/[1 � v (v /GDP; y)] i ≈t t t�1 t t t t
). The Treasury interest rate is lower than the “true”′� ln E [M ] � v (7)t t�1
riskless interest rate. In order to recover the true riskless rate from the
14 These computations implicitly assume that the convenience yield for short Treasuriesis similar to that for long Treasuries. Owing to the wartime interventions noted above, wecannot estimate the level of the convenience yield for short Treasuries using the kinkedspecification. However, we found quite similar sensitivity of long and short spreads tochanges in debt/GDP in table 1, suggesting that this may be a reasonable assumption.
This content downloaded on Tue, 1 Jan 2013 11:09:48 AMAll use subject to JSTOR Terms and Conditions
aggregate demand for treasury debt 261
data (the rate that can meaningfully be compared to the riskless ratefrom a model that ignores the convenience benefits of Treasuries), onehas to estimate the convenience yield and adjust Treasury rates by thisconvenience yield. Our estimated demand curves may be used to mea-sure the convenience yield and make the adjustment. The literature hasfound that the high spread between corporate bond rates and Treasuryrates, and the high equity premium, measured as the average excessstock market return over Treasury bill rates, are hard to reconcile onthe basis of standard factors. Accounting for a true riskless rate that ishigher than the Treasury rate can go part of the way toward reconcilingthese findings.
Appendix A
Derivation for Prediction 2
We rewrite (9), using the approximation that , so that the return′′ �v (7)1 � v (7) ≈ efrom t to on holding Treasury bonds satisfiest � 1
′ Av (v /GDP ;y ) T Tt t t1 p e E [M P /P ]t t�1 t�1 t (A1)T T ′ A�(t�1)i �ti �v (v /GDP ;y )t�1,t�1 t,t t t tp E [M e ].t t�1
Likewise, for corporate bonds, rewriting (16), we findC C�l D C C �(t�1)i �ti �l Dt t t�1,t�1 t,t t t1 p e E [M P /P ] p E [M e ]. (A2)t t�1 t�1 t t t�1
The excess return on corporate bonds over Treasury bonds isC TP Pt�1 t�1R p � ≈ �(t � 1)S � tS .t�1 t�1,t�1 t,tC TP Pt t
We log-linearize to make the approximation. We make the following compu-tations to arrive at an expression for the spread . We assume that isS Mt,t t�1
lognormally distributed (where ) and that all interest rates are normallym { ln Mdistributed. Then, it is straightforward to rewrite (A1) as
1′ A T1 p exp {v (v /GDP; y) � E [m ] � Var (m ) � (t � 1)E [i ]t t t t t�1 t t�1 t t�1,t�12
1T 2 T T T� ti � (t � 1) Var (i ) �Cov [m , (t � 1)i � ti ]}t,t t t�1,t�1 t t�1 t�1,t�1 t,t2
and rewrite (A2) as
1 C1 p exp {�l D � E[m ] � Var (m ) � (t � 1)E [i ]t t t�1 t�1 t t�1,t�12
1C 2 C C C� ti � (t � 1) Var (i ) �Cov [m , (t � 1)i � ti ]}.t,t t t�1,t�1 t�1 t�1,t�1 t,t2
We take logs and subtract these last two equations. We assume that the termsinvolving and are approximately the same. That is,T CVar (i ) Var (i )t t�1,t�1 t t�1,t�1
innovations in both corporate and Treasury rates have the same variance. Then
This content downloaded on Tue, 1 Jan 2013 11:09:48 AMAll use subject to JSTOR Terms and Conditions

262 journal of political economy
1 t � 1′ A0 p [v (v /GDP; y) � l D ] � E [S ]t t t t t t t�1,t�1t t
1� S � Cov [m , (t � 1)S � tS ],t,t t t�1 t�1,t�1 t,t
t
or
1 t � 1 1′ AS p [v (v /GDP; y) � l D ] � E [S ] � Cov (m , R ).t,t t t t t t t t�1,t�1 t t�1 t�1t t t
Solving this equation recursively for , we find the expression in the text.St,t
Appendix B
Data
For all yield spreads analyzed in table 1, table 2, panel A, and table 3, we useannual observations, sampled in July of the year up to (and including) 1976and in October of each year after that.
Table 1
Aaa-Treasury yield spread: The percentage spread between Moody’s Aaa-ratedlong-maturity corporate bond yield and the yield on long-maturity Treasurybonds. The Moody’s Aaa index is constructed from a sample of long-maturity(≥ 20 years) industrial and utility bonds (industrial only from 2002 onward),available from 1919 to 2008. The yield on long-maturity Treasury bonds is theaverage yield on long-term government bonds, available from 1919 to 1999. TheTreasury bonds included are due or callable after 8 years for 1919–25, 12 yearsfor 1926–41, 15 years for 1941–51, 12 years for 1952, and 10 years for 1953–99.We use the yield on 20-year maturity Treasury bonds for 2000–2008. All threedata series are from the Federal Reserve’s FRED database (series AAA,LTGOVTBD, and GS20), with the exception that the long-term Treasury yielddata for 1919–24 are from Banking and Monetary Statistics, 1914–41, table 128.
Baa-Treasury yield spread: The percentage spread between Moody’s Baa-ratedlong-maturity corporate bond yield and the yield on long-maturity Treasurybonds. The Moody’s Baa index is constructed from a sample of long-maturity(≥ 20 years) industrial and utility bonds (industrial only from 2002 onward),available from 1919 to 2008. The Baa data series is also from the FRED database(series BAA).
CP-bills yield spread: The percentage yield spread between high-grade com-mercial paper and Treasury bills. For 1971–2008 the commercial paper yield isfrom the FRED database. For 1971–96 it is the series CP3M (the average ofoffering rates on 3-month commercial paper placed by several leading dealersfor firms whose bond rating is AA or equivalent), and for 1997–2008 the seriesCPN3M (the 3-month AA nonfinancial commercial paper rate). Prior to 1971we use the commercial paper series for prime commercial paper, 4–6-monthmaturity, from Banking and Monetary Statistics (table 12.5 for 1941–70 and table120 for 1920–40). The Treasury bill yield is for 3-month Treasury bills for 1971–
This content downloaded on Tue, 1 Jan 2013 11:09:48 AMAll use subject to JSTOR Terms and Conditions

aggregate demand for treasury debt 263
2008 (from FRED, series TB3MS), 6-month Treasury bills for 1959–70 (fromFRED, series TB6MS), and 3–6 month Treasury bills for 1920–58 from the NBERMacro History database (series m13029b for 1931–58 and series m13029a for1920–30).
CPP2-bills yield spread: The percentage yield spread between lower-grade com-mercial paper and Treasury bills. Calculated as the sum of the CP-bills yieldspread described above (i.e., high-grade commercial paper minus Treasury bills)and the yield spread between 30-day A2/P2 nonfinancial commercial paper and30-day AA nonfinancial commercial paper, with data obtained from the FederalReserve Bank of New York.15 For 1996 and 1997 we do not have data from theFederal Reserve and use data from Bloomberg (Bloomberg currently does nothave data for these two years, and our data are based on an earlier downloadfrom Bloomberg).
Debt/GDP: The supply of Treasuries scaled by GDP, at market value. Calculatedas (debt/GDP with debt at face value) # (total market value of Treasuries/totalface value of Treasuries).
The debt/GDP series (with debt at face value) is from Henning Bohn’s webpage for years 1919–2008. The debt measure includes debt held by the FederalReserve but excludes debt held by other parts of the government such as theSocial Security Trust Fund. Debt is for the end of the government’s fiscal year,that is, the end of June up to and including 1976 and the end of Septemberfrom 1977 on. GDP is for the same fiscal year.
The Center for Research in Security Prices (CRSP) Monthly US TreasuryDatabase is used to calculate the factor for translating face values to marketvalues (total market value of Treasuries/total face value of Treasuries). Thisdatabase starts in December 1925. Prior to 1949 the amounts outstanding aremissing for a lot of the Treasuries. From 1949 onward, at least 96 percent ofTreasuries in the database have values for amounts outstanding. We multiplyBohn’s debt/GDP series by the CRSP ratio of Treasury market to face value toget a series for the market value of Treasury debt/GDP. Over the period 1949–2008, the correlation between debt/GDP at face value and debt/GDP at marketvalue is .996, and the means and standard deviations of the two series are verysimilar. Prior to 1949, one can still calculate the ratio of Treasury market to facevalue for the set bonds in the CRSP database for which the data are available.This set is somewhat skewed toward better coverage of long maturities. We getsimilar results whether we use debt/GDP at face value and debt/GDP at marketvalue in the pre-1949 period. We report the results that use the market debt/GDP series.
Prior to 1926 the CRSP database is not available, and we therefore do notmake the market value adjustment. In general, over the 1926–2008 period ourresults throughout the paper are very similar whether the market value adjust-ment is made or not.
Volatility: Annualized standard deviation of weekly log stock returns on theS&P 500 index. We calculate weekly returns on the value-weighted S&P indexon the basis of daily returns obtained from CRSP. As the volatility measure fora given year, we compute the standard deviation of the weekly log returns over
15 We thank Kenneth Kuttner and Michael Fleming for help in obtaining these data.
This content downloaded on Tue, 1 Jan 2013 11:09:48 AMAll use subject to JSTOR Terms and Conditions

264 journal of political economy
the year leading up to the end of the government’s fiscal year. We annualizethe standard deviation of weekly log returns by multiplying by the square rootof 52.
EDF: Expected default frequency for nonfinancial corporate bonds. The dataare obtained from Moody’s Analytics. We use the median EDF credit measurereported by Moody’s Analytics for large nonfinancial firms (defined as firmswith a book value of assets 1 $300 million in inflation-adjusted dollars). TheEDF credit measure is available from 1969 to 2008. We use annual observations,sampled in July of the year up to (and including) 1976 and in October of eachyear after that.
Slope: Slope of the Treasury yield curve measured as the spread between the10-year Treasury yield and the 3-month Treasury yield. The interest rate onTreasuries with 10-year maturity is from FRED for 1953–2008 (series GS10).Prior to 1953 we use series m13033a (1926–41) and m13033b (1942–52) fromthe NBER Macro History Database, with both these series referring to the yieldon long-term Treasuries. The interest rate on Treasuries with 3-month maturityis from FRED for 1934–2008 (series TB3MS) and from the NBER Macro Historydatabase prior to that (series m13029a for 1926–33, referring to 3–6-monthTreasuries). We use annual observations, sampled in July of the year up to (andincluding) 1976 and in October of each year after that.
In all tables, volatility, EDF and slope variables are demeaned.
Table 2, Panel A
Baa-Aaa yield spread: The percentage yield spread between Moody’s Baa-ratedlong-maturity bond yield and Moody’s Aaa-rated long-maturity bond yield. Bothseries are described under table 1 above.
A2/P2-A1/P1 yield spread: The yield spread between 30-day A2/P2 nonfinancialcommercial paper and 30-day AA nonfinancial commercial paper, with dataobtained from the Federal Reserve Bank of New York and Bloomberg (as de-scribed under table 1).
(Debt 1 10 year maturity)/GDP: The ratio of Treasury debt with more than 10years’ remaining maturity to GDP. For 1949–2008 the amount of Treasury debtis at market value and is calculated using the CRSP Monthly US Treasury Da-tabase. For 1926–48 the amount of Treasury debt is at face value and is obtainedfrom Banking and Monetary Statistics 1914–41, table 147, and Banking andMonetary Statistics 1941–70 (table 13.5A minus table 13.5B).
(Debt ≤ 1 year maturity)/GDP: The ratio of Treasury debt with a year or less ofremaining maturity to GDP. For 1949–2008 the amount of Treasury debt is atmarket value and is calculated using the CRSP Monthly US Treasury Database(we use this series only in col. 2, which is based on data from 1974 onward).
For the above two variables, the data for GDP used are from Henning Bohn’sweb page.
Debt/GDP, volatility, slope: As for table 1.
This content downloaded on Tue, 1 Jan 2013 11:09:48 AMAll use subject to JSTOR Terms and Conditions

aggregate demand for treasury debt 265
Table 2, Panel B
(FDIC-insured CDs)–bills yield spread: The percentage yield spread between theyield on 6-month certificates of deposit and Treasury bills. The CD yields arethe national average rates obtainable by depositors on small-denomination (andthus FDIC-insured) CDs of 6-month maturity, where small denomination meansthe account opening minimum. The rates are from Bank Rate Monitor and areobtained from the New York Times for 1984–97 and from Bloomberg for 1998–2008 (ticker ILSFNAVG) and are as of the end of September. The Treasury billyield used is the yield on 6-month bills obtained from FRED (series TB6MS),as of September.
(Time and savings accounts)–bills yield spread: The percentage yield spread be-tween time and savings accounts and Treasury bills. We estimate the yield ontime and savings accounts using data from FDIC Historical Statistics on Banking,tables CB06 and CB15. Specifically, we divide the total annual interest on depositsin domestic offices by the sum of savings and time deposits in domestic offices(using averages of beginning- and end-of-year values for the deposits). The FDICseries is available from 1935 onward. We compare this yield series to the yieldon 6-month Treasuries, with data obtained from FRED (series TB6MS) from1959 on and from the NBER Macro History database prior to that (seriesm13029b for 1935–58, referring to 3–6-month Treasuries). Since the yield ontime and savings accounts is an annual average, we use the annual calendar yearaverage of 6-month monthly Treasury bill rates for comparison.
Slope: Slope of the Treasury yield curve measured as the spread between the10-year Treasury yield and the 6-month Treasury yield. The interest rate onTreasuries with 10-year maturity is defined as in the slope variable used in table1. The interest rate on Treasuries with 6-month maturity is from FRED for 1959–2008 (series TB6MS) and from the NBER Macro History database prior to that(series m13029b, referring to 3–6-month Treasuries). The slope variable in col-umn 5 is based on September values to match the timing of the left-hand-sidevariable. The slope variable in column 6 is (annual calendar year average of 10-year monthly yields) � (annual calendar year average of 6-month monthlyyields), in order to match the timing of the dependent variable, which is acalendar year average.
Debt/GDP: As for table 1.Table 3: Same data as for table 1.
References
Amihud, Yakov, and Haim Mendelson. 1991. “Liquidity, Maturity, and the Yieldson U.S. Treasury Securities.” J. Finance 46 (September): 31–53.
Bansal, Ravi, and John Wilbur Coleman II. 1996. “A Monetary Explanation ofthe Equity Premium, Term Premium, and Risk-Free Rate Puzzles.” J.P.E. 104(December): 1135–71.
Barro, Robert J. 1974. “Are Government Bonds Net Wealth?” J.P.E. 82 (Decem-ber): 1095–1117.
Chalmers, John M. 1998. “Default Risk Cannot Explain the Muni Puzzle: Evi-dence from Municipal Bonds That Are Secured by U.S. Treasury Obligations.”Rev. Financial Studies 11 (April): 281–308.
This content downloaded on Tue, 1 Jan 2013 11:09:48 AMAll use subject to JSTOR Terms and Conditions

266 journal of political economy
Chen, Long, David Lesmond, and Jason Wei. 2007. “Corporate Yield Spreadsand Bond Liquidity.” J. Finance 62 (February): 119–49.
Cortes, Fabio. 2003. “Understanding and Modelling Swap Spreads.” Bank ofEngland Q. Bull. 43 (Winter): 407–16
Covitz, Dan, and Chris Downing. 2007. “Liquidity or Credit Risk? The Deter-minants of Very Short-Term Corporate Yield Spreads.” J. Finance 62 (May):2303–28.
Doepke, Matthias, and Martin Schneider. 2006. “Inflation and the Redistributionof Nominal Wealth.” J.P.E. 114 (December): 1069–97.
Duffee, Gregory R. 1998. “The Relation between Treasury Yields and CorporateBond Yield Spreads.” J. Finance 53 (December): 2225–41.
Duffie, Darrell, and Kenneth J. Singleton. 1999. “Modeling Term Structures ofDefaultable Bonds.” Rev. Financial Studies 12 (October): 687–720.
Elmendorf, Douglas W., and N. Gregory Mankiw. 1999. “Government Debt.” InHandbook of Macroeconomics, edited by John B. Taylor and Michael Woodford,chap. 25. Amsterdam: Elsevier Sci.
FDIC (Federal Deposit Insurance Corporation). 1984. The First Fifty Years: AHistory of the FDIC, 1933–1983. Washington, DC: FDIC.
Gilbert, R. Alton. 1986. “Requiem for Regulation Q: What It Did and Why ItPassed Away.” Fed. Reserve Bank St. Louis Rev. 68 (February): 22–37.
Gomes, Francisco, and Alexander Michaelides. 2008. “Asset Pricing with LimitedRisk Sharing and Heterogeneous Agents.” Rev. Financial Studies 21 (January):415–48.
Gorton, Gary. 2010. Slapped by the Invisible Hand: The Panic of 2007. Oxford:Oxford Univ. Press.
Greenwood, Robin, and Dimitri Vayanos. 2010. “Bond Supply and Excess BondReturns.” Working paper, Harvard Bus. School.
Krishnamurthy, Arvind. 2002. “The Bond/Old-Bond Spread.” J. Financial Econ.66 (December): 463–506.
Krishnamurthy, Arvind, and Annette Vissing-Jorgensen. 2011. “The Effects ofQuantitative Easing on Interest Rates: Channels and Implications for Policy.”Brookings Papers Econ. Activity 2011 (Fall): 215–65.
Longstaff, Francis. 2004. “The Flight-to-Liquidity Premium in U.S. Treasury BondPrices.” J. Bus. 77 (July): 511–26.
Longstaff, Francis, Sanjay Mithal, and Eric Neis. 2005. “Corporate Yields Spreads:Default Risk or Liquidity? New Evidence from the Credit-Default Swap Mar-ket.” J. Finance 60 (October): 2213–53.
Merton, Robert. 1974. “On the Pricing of Corporate Debt: The Risk Structureof Interest Rates.” J. Finance 29 (May): 449–70.
Modigliani, Franco, and Richard Sutch. 1966. “Innovations in Interest Rate Pol-icy.” A.E.R. Papers and Proc. 56 (May): 178–97.
Moody’s Investors Service. 2000. “Commercial Paper Defaults and Rating Tran-sitions, 1972–2000.” Moody’s Investors Service, New York.
———. 2005. “Default and Recovery Rates of Corporate Bond Issuers, 1920–2004.” Moody’s Investors Service, New York.
Reinhart, Vincent, and Brian P. Sack. 2000. “The Economic Consequences ofDisappearing Government Debt.” Brookings Papers Econ. Activity 2000 (Fall):163–220.
Rocheteau, Guillaume. 2009. “A Monetary Approach to Asset Liquidity.” Workingpaper, Univ. California, Irvine.
Sidrauski, Miguel. 1967. “Rational Choice and Patterns of Growth in a MonetaryEconomy.” A.E.R. Papers and Proc. 57 (May): 534–44.
This content downloaded on Tue, 1 Jan 2013 11:09:48 AMAll use subject to JSTOR Terms and Conditions

aggregate demand for treasury debt 267
Vayanos, Dimitri, and Jean-Luc Vila. 1999. “Equilibrium Interest Rate and Li-quidity Premium with Transaction Costs.” Econ. Theory 13 (May): 509–39.
Vissing-Jorgensen, Annette. 2003. “Perspectives on Behavioral Finance: Does‘Irrationality’ Disappear with Wealth? Evidence from Expectations and Ac-tions.” NBER Macroeconomics Ann. 18:139–208.
Wicker, Elmus. 1969. “World War II Policy of Fixing a Pattern of Interest Rates.”J. Finance 24 (June): 447–58.
This content downloaded on Tue, 1 Jan 2013 11:09:48 AMAll use subject to JSTOR Terms and Conditions