the agri-business market scan for uganda...this agri-business market scan aimed at generating...
TRANSCRIPT

1 | P a g e
THE AGRI-BUSINESS MARKET SCAN FOR UGANDA
DRAFT II
February, 2016

2 | P a g e
A study financed by
The Embassy of the Kingdom of the Netherlands
in Uganda
Implemented by
Strategic Advisory and Research Company (SARC)
Justine Namaalwa Jjumba (PhD) (Principal Investigator) Matthew Lubuulwa
RItah Kigonya Daniel Ikaaba

3 | P a g e
THE FOREWORD [We are requesting for a foreword from the Embassy]
4 | P a g e
THE EXECUTIVE SUMMARY The Dutch government has designated Uganda as a transitional country where the focus is on promoting aid and aid to trade programmes. Under the Multi Annual Strategic Plan (MASP 2014-17) for the Embassy of the Kingdom of the Netherlands (EKN), EKN intends to deepen its support to food security and economic cooperation activities. It is envisaged that Dutch Agri-business activities need to be deepened in the Ugandan economy to boost the economic cooperation agenda. This Agri-business Market Scan aimed at generating reliable and updated Agri-business information to facilitate Trade and Investments in Uganda, in the East African Community, and between Uganda and the Netherlands.
This agribusiness market scan was commissioned with the intent of acting as a market intelligence tool to inform Dutch businesses of the existing opportunities and challenges in agriculture and agribusiness in Uganda. This was to be achieved through providing an agri-trade and investment opportunity and constraint analysis for entry, growth and survival in Uganda’s Agri-business sector. The information documented here was generated through indepth review of available literature and stakeholder consultations in the respective sectors, sub-sectors, institutions, farmer organistions/co-operatives as well as individual investors.
The agribusiness sector includes the whole chain of activities from production, processing, transportation and marketing (local, regional and international) of the different crop and livestock products. The sector accounted for about 26 percent of the rebased GDP data for 2013/14, employs roughly 60 percent of the labour force and has continued to greatly contribute to the national exports (formal and informal) with a total contributions rising from 48.7 percent in 2010 to 54.1 percent in 2015. Coffee has continued as the major export, followed by Fish (and its products), Tobacco, Maize and Tea. The extent of value addition and agro-processing in the sector varies for the different products but with significant levels of activity in the traditional cash crops especially coffee and tea. Coffee is by far the biggest crop value chain with the biggest share of the crop subsector.
With regards to marketing, Uganda enjoys access to regional (EAC, COMESA, South-Sudan) and international markets, mainly the EU and Asia. Generally, the agribusiness sector is facilitated by several factors including the conducive business environment enhanced by supportive policy and legal frameworks (at national, regional and international level), institutional support in the areas of registration, licencing and regulation, improved access to agri-inputs and agri-finance, as well as the general infrastructural development. On the other hand, the sector is mainly constrained by several trade and non-trade barriers, insufficient marketing logistics, lack of access to modern production technology, high transaction costs due to poor road infrastructure, lack of adequate processing capacity, prohibitively high costs of capital, high levels of corruption, inefficient agricultural input markets and lack of proper quality control and regulation. However, agribusiness has gained prominence due to the Government’s initiative to pursue private sector led growth with deliberate efforts to improving the business environment as evident in the National Development Plan-II (NDP-II) and other development agendas. This

5 | P a g e
has resulted into growth in both domestic and cross border trade, with the potential benefits likely to be realised depending on the ability of the agri-food chain actors to penetrate new markets and take advantage of opportunities for expansion through mergers and acquisitions, new joint ventures and strategic alliances. One of the key strategic alliances is the Dutch Agri-business sector, whose investment opportunities have been cited in various enterprises with the top ranking including coffee, Tea, Oil seed crops (Sunflower and Soya bean), Potatoes, horticultural crops (vegetables), Diary, Poultry and Fish; while the medium ranking enterprises include Cassava, Rice, Maize and Beef. For each of these specific enterprises, there are varying investment opportunities including agri-services especially agri-inputs (quality seed, fertilisers, pesticides), logistics ( warehouses and silos for grains and coffee on one hand and cold chains for horticulture, diary and fish products) and agro-processing machinery.

6 | P a g e
The Glossary
Agriculture This term is used to describe crops, livestock, poultry and fishing activities
Constant prices Refers to the prices of a commodity corrected for changes in relation to a base year
Current Prices Refers to the price of a stock, currency or a commodity indicated at a given moment in time
Formal Exports Exports that are formally recorded at the customs borders
Formal Trade Refers to trade that is officially recorded at the customs borders
Informal Exports Exports that are not formally recorded at the custom borders
Informal Trade Refers to trade that goes unrecorded at the borders
Market Prices Refers to the price of a commodity when sold in a given market
Non-traditional exports
Refers to commodities other than traditional exports (Coffee, Cotton, Tea, and Tobacco) that have recently featured in Uganda’s export trade
Traditional Exports
Long-term export cash crops introduced to Uganda long time ago. That is Coffee, Cotton, Tea and Tobacco

7 | P a g e
ACRONYMS
ACF Agricultural Credit Facility ACP/EU African, Caribbean and Pacific-European Union AEATREC Agricultural Engineering and Appropriate Technology Research Centre AGOA African Growth and Opportunity Act ASYCUDA Automated System for Customs Data AU African Union BCI Business Climate Index BoU Bank of Uganda CAIIP Community Agricultural Infrastructure Improvement Programme CBA Commodity Based Approach CBR Central Bank Rate CDO Cotton Development Organisation COMESA Common Market for Eastern and Southern Africa DDA Dairy Development Authority DRC Democratic Republic of Congo EAC East African Community EAC-CU East African Community Customs Union EBA Everything But Arms EKN Embassy of the Kingdom of the Netherlands EIB European Investment Bank EU European Union FAO Food and Agricultural Organisation FFB Fresh Fruit Bunches FOT Free on Truck FY Financial Year GDP Gross Domestic Product GoU Government of Uganda GSP Generalised System of Preferences HQCF High Quality Cassava Flour HORTEXA Horticultural Exporters Association of Uganda HMO Health Membership Organisation ICSID International Center for Settlement of Investment Disputes IFAD International Fund for Agricultural Development IPPC International Plant Protection Convention IRA Insurance Regulatory Authority ISO International Standards Organisation KOPGT Kalangala Oil Palm Growers Trust LDCs Low Developing Countries MAAIF Ministry of Agriculture, Animal Industry and Fisheries MATIP Markets and Agriculture Trade Improvement Project

8 | P a g e
MIGA Multilateral Investment Guarantee Agency MLHUD Ministry of Lands, Housing and Urban Development MSCL Microfinance Support Centre Limited MTIC Ministry of Trade, Industry and Cooperatives MWA Mobile Weather Alerts NAGRIC National Animal Genetics Resources Centre NAADS NARO National Agriculture Research Organisation NDA National Drug Authority NDP National Development Plan NSQP National Standards and Quality Policy NSSF National Social Security Fund NTBs Non Tax Barriers OPIC Overseas Private Investment Corporation OPUL Oil Palm Uganda Limited OWC Operation Wealth Creation PROFIRA Project for Financial Inclusion in Rural Areas PVoC Pre-Export Verification of Conformity QSIP Quality Infrastructure and Standards Programme RVO Netherlands Enterprise Agency SACCOs Savings and Credit Cooperatives SADC South African Development Community SPS Sanitary and Phytosanitary UAE United Arab Emirate UBOS Uganda Bureau Of Statistics UEPB Uganda Export Promotion Board UFEA Uganda Flowers and Exporters Association UIA Uganda Investment Authority UIRI Uganda Industrial Research Institute UNBS Uganda National Bureau of Standards UNCST Uganda National Council for Science and Technology UNDP United Nations Development Programme UOSPA Uganda Oil Seed Processors Association URA Uganda Revenue Authority URSB Uganda Registration Services Bureau USAID United States Agency for International Development UWRSA Uganda Warehouse Receipt System Authority VODP Vegetable Oil Development Project WFP World Food Programme WTO World Trade Organisation
9 | P a g e
Table of Contents
THE FOREWORD .................................................................................................................................... 3
THE EXECUTIVE SUMMARY ................................................................................................................ 4
1.0 INTRODUCTION .............................................................................................................................. 13
1.1. Overview ......................................................................................................................... 13
1.2. Strategic Priorities for EKN Food Security and Agribusiness Development in Uganda 14
2.0 OVERVIEW OF THE AGRIBUSINESS SECTOR ....................................................................... 15
2.1. The National Outlook on Agricultural Production ...................................................... 15
2.2. Agro-processing and Marketing ..................................................................................... 17
2.3. The National Outlook on Exports .................................................................................. 18
2.4. The Institutional and Legal frameworks ........................................................................ 19
2.5. The Comparative Advantage for Uganda in Agribusiness ............................................ 19
2.6. The Future of the sector ................................................................................................ 20
3.0 PRODUCTION AND MARKETING OF AGRICULTURAL PRODUCTS ........................................ 22
3.3 The Traditional Cash Crops ............................................................................................... 22
3.3.1 Coffee .............................................................................................................................. 22
3.2.2 Cotton ............................................................................................................................ 26
3.2.3 Tea .................................................................................................................................. 28
3.2.3 Tobacco .......................................................................................................................... 30
3.3 Non-Traditional Cash Crops................................................................................................. 31
3.3.1 Maize ............................................................................................................................... 31
3.3.2 Cassava ............................................................................................................................ 33
3.3.3 Potatoes ......................................................................................................................... 37
3.3.4 Rice ................................................................................................................................ 38
3.3.5 Cocoa ............................................................................................................................. 40
3.3.6 Vanilla ............................................................................................................................ 42
3.3.7 Oilseed Crops ................................................................................................................ 43
3.3.8 Flowers ........................................................................................................................... 47
Fortunately, there are several institutions that are providing support to the sub sector (Appendix 6). The support includes finances, research information, supply of chemicals, advocacy, licencing, regulation and monitoring. ................................................................. 50
3.3.9 Horticultural Crops ....................................................................................................... 50
3.4 The Cross-cutting Challenges and Opportunities in the crop sector ................................. 51
3.4 The Livestock Sub-sector .................................................................................................. 52
Caption 9: The Indigenous and exotic cattle breeds ............................................................ 54
3.4.1 Export of Live Animals and Meat Products .................................................................. 54
3.4.2 Diary Production ........................................................................................................... 55

10 | P a g e
3.4.3 Hides and Skins ............................................................................................................. 56
3.4.4 Inputs for the Livestock sector ..................................................................................... 57
3.4.4 Poultry ........................................................................................................................... 57
Caption 10: Animal feed mill at Biyinzika Poultry International ........................................ 58
Caption 11: Pelleted chicken feed at Biyinzika Poultry International .................................. 58
3.5 Fish and Fish Products .....................................................................................................................58
4.0 FACTORS INFLUENCING UGANDA’S AGRIBUSINESS POTENTIAL ................................... 62
4.1 The Business Environment ............................................................................................ 62
4.2 Development plans, Policies and Legal Frameworks ................................................... 63
4.2.1 The National Development Plans and Legal frameworks ........................................ 63
4.2.2 The National Legal and regulatory frameworks.................................................... 64
4.2.3 The regional frameworks ........................................................................................... 65
4.2.4 Global trade and trade related agreements ........................................................... 65
4.3 Existence of Internal and External Markets .................................................................. 66
4.3.1 The Internal Markets ................................................................................................. 66
4.3.2 The Regional Market Integration .............................................................................. 67
4.3.3 The Global markets .................................................................................................... 68
4.4 Trade and Investment Licensing, and Regulations ...................................................... 68
4.5 Agri-inputs ..................................................................................................................... 69
4.5.1 Planting Materials, Fertilisers and Pesticides ............................................................ 69
4.5.2 Land ........................................................................................................................ 70
4.5.3 Agro-Machinery .......................................................................................................... 71
4.6 Agri-Financing .................................................................................................................... 71
4.6.1 The Banking Services ..................................................................................................... 71
4.6.2 The Agricultural Credit Facility (ACF) ........................................................................ 72
4.6.3 The Microfinance Support Centre ............................................................................... 72
4.6.4 The Project for Financial Inclusion in Rural Areas ..................................................... 73
4.6.5 Agriculture Insurance ................................................................................................... 73
4.7 Infrastructural Development ......................................................................................... 73
4.8 The Trade and Non-Trade Barriers ............................................................................... 74
4.9 Sanitary and Phytosanitary Services ............................................................................. 75
4.9.1 Food safety, quality standards and associated infrastructure....................................... 76
4.10 Logistics .......................................................................................................................... 76
4.11 Meteorological Services ................................................................................................. 78
4.12 Science, Technology and Innovations ........................................................................... 78
5.0 THE AGRI-BUSINESS OPTIONS FOR TRADE AND INVESTMENT WITH THE DUTCH ... 79
6.0 THE SYNTHESIS ......................................................................................................................... 83

11 | P a g e
List of Tables Table 2: Uganda’s Exports for the period 2010-2014 (in percentages) ........................................... 18 Table 3: Regional Coffee acreage by variety by end 2014 ................................................................ 22 Table 4: Major destinations for Uganda coffee exports .................................................................. 24 Table 4: Cocoa seedlings planted, Production/Exports and earnings in US$ .............................. 41 Table 6: Export of sunflower oil by quantity and country of destination (2012-2013) ................. 44 Table 7: Export of sunflower cake by quantity and country of destination (2012-2013) .............. 45 Table 7: Performance statistics of flower exports ............................................................................ 48 Table 8: Proportionate share of the total flower export values ..................................................... 49 Table 9: The Global Flower Exports 2001-2012 ................................................................................. 49 Table 10: Number of other Livestock and their Products, 2010-2014............................................. 54 Table 11: Value of Uganda’s dairy exports to selected countries (2011-13) ..................................... 55 Table 12: Proportionate share of Export values for Hides and Skins ............................................. 56 Table 13: Poultry numbers in millions by breed (2010-2014) .......................................................... 57 Table 14: Values of fish exported to the major destinations (2010 to 2015) .................................. 59 Table 15: Proportionate share of the Value of Fish exports to EAC ............................................... 60 Table 16: Doing Business Indicators for Uganda compared to other East African countries ..... 62 Table 17: Scoring of the Agricultural Enterprises for Dutch Investment opportunities ............. 80 Table 18: Investment opportunities for the priority Agribusiness ................................................. 81 Table 19: Major agro-machinery trade opportunities in Uganda .................................................. 82
List of Figures Figure 1: Production trends for traditional cash crops (2010-2014) ............................................... 16 Figure 2: Trends for production of other major other crops (2010-2014) ..................................... 17 Figure 3: Percentage share (of total value exports) of the Traditional Cash Crops 2005 & 2015 19 Figure 4: Coffee Production trends in the EAC region (2003-2013)............................................... 22 Figure 5: Uganda Coffee Production, Export and Local Consumption (2000-2015) .................... 23 Figure 6: A SWOT Analysis: Coffee Value Chain ............................................................................ 25 Figure 7: Trends of Cotton Production, Export and Domestic Consumption (2000-2015) ........ 27 Figure 8: A SWOT Analysis: Cotton Value Chain ........................................................................... 28 Figure 9: Tea Production and Exports (2000-2014) ......................................................................... 29 Figure 10: A SWOT Analysis: Tea Value Chain ................................................................................ 30 Figure 11: Production and Export Volumes for Tobacco (2000-2015) ............................................ 31 Figure 12: Trends of Maize Production, Exports and Domestic Consumption (2000-2015) ....... 32 Figure 13: The situation analysis for the Maize Enterprise ............................................................. 33 Figure 14: Cassava Production (2008-2014) ...................................................................................... 34 Figure 15: A situation analysis for the Cassava value chain ............................................................ 36 Figure 16: Potatoe Production (2008-2014) ...................................................................................... 37 Figure 17: Trends of Rice Production, Domestic Consumption, Exports and Imports (2000-2015) ...................................................................................................................................................... 39 Figure 18: SWOT analysis of the Rice sub-sector ............................................................................ 40 Figure 19: Cocoa production/Exports (2000-2014) .......................................................................... 41 Figure 20: A situation analysis for Cocoa ......................................................................................... 42

12 | P a g e
Figure 21: Vanilla production/Exports (2000-2014) .................................................................. 43 Figure 22: Production trends for Oilseed Crops (2003-2013) ......................................................... 44 Figure 23: VODP FFB production and prices by 30th June 2015 .................................................... 46 Figure 24: Volumes of Hides Exported (2000-2010) ........................................................................ 56 Figure 25: A SWOT Analysis for the Poultry sub-sector ................................................................. 58 Figure 26: The Production and Export of Fish and Fish Products (2000-2010) ........................... 59
List of Captions Caption 1: Kyagalanyi Coffee Processing Plant, Namanve .............................................................. 23 Caption 2: Coffee ready for export at Banyankole Kweterena Growers’ Union, Mbarara .......... 23 Caption 3: Marketing of Cotton in Kasese ....................................................................................... 27 Caption 4: Harvested cassava bulked at a road side ready for transportation to urban centres 35 Caption 5: Cassava flour on sale in local Supermarkets ................................................................. 35 Caption 6: Potatoe collection centre for marketing in Kabale ...................................................... 37 Caption 7: A Vanilla plantation ......................................................................................................... 43 Caption 8: The Flower Farms ............................................................................................................ 48 Caption 9: The Indigenous and exotic cattle breeds ....................................................................... 54 Caption 10: Animal feed mill at Biyinzika Poultry International .................................................. 58 Caption 11: Pelleted chicken feed at Biyinzika Poultry International ............................................ 58 Caption 12: Some of the Fish and fish products ............................................................................... 59
List of Appendices Appendix 1: Exports of Agricultural products by percentage share, 2010-2014 ............................ 88 Appendix 2: Major destinations for Uganda coffee exports ........................................................... 89 Appendix 3: Coffee Export Performance by Individual Companies in December 2015 ............... 90 Appendix 4: Actors in the Uganda Cotton Value Chain ................................................................. 91 Appendix 5: The Tea Processors/Exporters ..................................................................................... 92 Appendix 4: Map showing cassava growing and trading areas in Uganda ................................... 93 Appendix 5: The Top 10 Vanilla producing countries for the year 2015 ....................................... 94 Appendix 6: Institutions that Support the Flower Industry in Uganda ........................................ 94 Appendix 7: Major Dairy Processors in Uganda .............................................................................. 95 Appendix 8: Sector specific policies and legislations ...................................................................... 96

13 | P a g e
1.0 INTRODUCTION
1.1. Overview
Africa is largely agrarian, with an economy that is underpinned by resource-driven growth with a large and expanding informal sector. For the past 15 years, Africa has posted average economic growth rates of over 5 percent with rapid population growth rates of 2.5 percent, offering a promise of a large emerging consumer market as well as an unprecedented labour force that—if leveraged—can provide significant growth opportunities. Unfortunately, the consistently high growth economic rates have not translated into improved welfare for the population. Nearly one out of two Africans continue to live in extreme poverty, and income inequality on the continent remains among the highest in the world. In addition, productivity levels across sectors—from agriculture to manufacturing and services—productivity levels remain low. It is therefore necessary to raise productivity across all sectors of the economy to achieve higher growth and create quality employment, and turn observed progress into sustainable and inclusive growth. Agriculture and agribusiness remain key viable pathways to attaining the much sought but elusive sustainable economic transformation. Whereas rural to urban migration is a growing challenge, 70 per cent of the African population is still rural and depends on agriculture for daily sustenance. Therefore, growth in this sector is necessary for long-term sustainable development as well as critical for meeting growing global demand for food. Indeed, the World Bank estimates that by 2030 agriculture and agribusiness together could develop into a US$ 1 trillion industry in Sub-Saharan Africa (IFC, 2013).
Within the East African Community (EAC), the contribution of agriculture and agribusiness to food security is increasingly becoming important as the population increases. With a total EAC population estimated at 120 million, all governments are grappling with implementation of sustainable and inclusive economic growth . The region, diverse in terms of agro-ecological conditions presents several opportunities and challenges for agriculture and agribusiness. Uganda has a comparative advantage in food production with a potential of becoming the food basket of the region. It is therefore not surprising that East Africa is seen by many as a one of the emerging frontiers of agriculture and agribusiness evidenced by the increasing number of global companies and investors seeking to set up operations in the region. Additionally, a fast tracked Common Market Protocol under the EAC has guaranteed investors of a large market comprising of over 500 million consumers1, with free movement products and services, and integration of factors of production
1 Including consumers in Non EAC countries located in the great Lakes region

14 | P a g e
Majority of Uganda’s trade activities are agro-based. Uganda’s trade policy is liberal and facilitates several interventions which seek to transform the Country into a dynamic and competitive trade actor in the regional and international markets. Further, Uganda has several commodity-specific policies that enhance production, productivity, agro-processing, agro-input markets and agribusiness in general. Increased access to local, regional and global markets has created a pull factor on local agricultural production, thus causing a shift from subsistence to market-oriented production. However, this is constrained by limitations in technology, capital, knowledge and skills among others. The Embassy of the Kingdom of Netherlands (EKN) Uganda implements a four year Multi-Annual Strategic Plan (2014-17) that seeks to address some of the limitations through linking Uganda to Dutch businesses.
1.2. Strategic Priorities for EKN Food Security and Agribusiness Development in Uganda
The Netherlands government designated Uganda a transitional country where the focus is to promote “aid and aid to trade”. The food security programme acts as an entry point for Dutch agribusinesses to provide the much needed agro-transformational technology, expertise and know-how, agro-finance, sustainable energy solutions, agro-processing and agro-logisitics, that are necessary for transforming Uganda’s agriculture and agribusiness. In order to achieve the desired goal, EKN has set out three strategic priorities namely;
• Promote Dutch Agribusiness Investments in Uganda: From 2015, EKN has been focusing on fairly commercialised agricultural clusters with a high potential for business. The clusters are expected to contribute to reducing poverty, stimulate inclusive agricultural transformation and agribusiness with the Netherlands.
• Support Business Enabling services: The Dutch embassy, Kampala supports initiatives that directly help to improve the business enabling environment
• Enhancing bilateral business facilitation for more trade and investments from the Netherlands to Uganda in agro: technology, logistics, machinery and sustainable energy.
To achieve the strategic priorities, the Netherlands Enterprise Agency (RVO) and the EKN Kampala commissioned an agribusiness market scan to generate updated and reliable agri-business information to facilitate Trade and Investments between Uganda and the Netherlands. This scan builds on the agribusiness market scan for Uganda published in 2012 (Ref!!!!). It provides an agri-trade and investment opportunity and constraint analysis for entry, growth and survival in Uganda’s Agri-business sector. The specific tasks articulated include; (1) Providing an overview of the status of Agri-business in Uganda; (2) Highlighting Uganda’s key Agri-business trade partners

15 | P a g e
(global and regional) and the volumes of trade; (3) Showing the impact of the regional EAC Integration on Agri-business in Uganda; (4) Highlighting the factors that influence Uganda’s Agri-business potential on the local, regional and international markets; and (5) Identifying the strategic priorities for Agri-business in Uganda clearly indicating Uganda’s value chains that offer a good fit with the Dutch market.
2.0 OVERVIEW OF THE AGRIBUSINESS SECTOR
The agribusiness sector includes the whole chain of activities from production, processing, transportation and marketing of the different produce. The agricultural products are categorised into the crop and livestock subsectors, where the crop subsector is further subdivided into cash and food crops. The importance of the agribusiness sector has grown significantly as agricultural development strategies have shifted from a pure production-oriented approach to a broader based systems approach involving agro-food chain coordination, value creation and institutional setting under which chains operate (FAO, 2013). This is confirmed by the rebased GDP data for 2013/14 using 2009/10 as a base year which indicates that Uganda’s agricultural sector grew fastest by sector contribution to GDP at 26 percent up from 24 percent on the back of increasing value addition (UBOS, 2015). This growth among other factors confirms a consistently growing agribusiness subsector catalysed by growing demand driven by the private sector.
This section provides a national outlook on the sector with specific emphasis on production, agro-processing, marketing, the institutional and legal frameworks, strategic position for the country and the future of the sector.
2.1. The National Outlook on Agricultural Production
Uganda’s agricultural subsectors include crops and livestock with the crop subsector further categorised into cash and food crops. Cash crop growing activities include coffee, cotton, tea, tobacco (as traditional cash crops) and the non-traditional cash crops include; cocoa, vanilla, sugarcane, oil palm and horticultural products such as flowers. Cash crops contributed 1.7 percent to total GDP at current prices in 2014/15 compared to 1.6 percent in 2013/14 (UBOS, 2015a). Coffee is by far the biggest crop value chain with the biggest share of the crop subsector.
The cash crop sub-sector, although very important for export revenues relies heavily on old production methods with minimal intensified production. However, due to ample rains, relatively fertile soils and cheap labour, production is still relatively high although productivity has been declining over the years. Yields at farm level are well below those at the research stations implying that farm level productivity is far below

16 | P a g e
the attainable potential and that there is much room for improvement. Figure 1 provides the production trends for the traditional cash crops are provided for the period 2010-2014.
Figure 1: Production trends for traditional cash crops (2010-2014)
Source: UBOS, 2015
Some of the non-traditional cash crops include vanilla, cocoa beans, sunflower, sugarcane, flowers and other horticultural crops. In addition to the cash crops, there are other crops that serve as both food and cash crops. These crops were reported to have contributed 11.5 percent to total GDP at current prices in FY 2014/15 compared to 12.7 percent in FY 2013/14 (UBOS, 2015a). Bananas, maize, cassava, sweet potatoes and beans recorded the highest volumes produced over time. The production trends for the different crops for the period 2010-2014 are presented in Figure 2. Uganda’s agricultural production is more diversified when compared to other countries in the EAC region. The country has capacity to grow many food crops including cereals, legumes, horticultural and tubers such as potatoes, yams and cassava. This gives an opportunity to farmers to produce a variety of crops for both home consumption and sale.
020,00040,00060,00080,000
100,000120,000140,000160,000180,000
Prod
uctio
n (t
onne
s)
Cash crop
2010
2011
2012
2013
2014

17 | P a g e
Figure 2: Trends for production of other major other crops (2010-2014)
Source: UBOS 2015
In the livestock sub-sector, the major animals include cattle, goats, sheep, pigs, fish and poultry (UBOS, 2015a). For the cattle, there are three major breeds, the indigenous, exotic and cross breeds. The indigenous constitutes 93 percent of the national herd and is by far the least productive. Exotic breeds account for 7 percent of the national herd and 52 percent of the total milk recorded in the country.
Uganda has two main sources of fish; natural fresh water bodies and fish farms (Aquaculture). Fish catch from water bodies has continued to rise overtime increasing from 408,066 to 461,726 tonnes in 2010 and 2014 respectively. Lakes, Victoria and Albert take the largest share of the national fish catch contributing about 86% of the total catch. A significant amount of fish is reared by fish farmers; unfortunately statistics were not readily available. Fish farming is increasing due to high demand and declining fish levels in natural water bodies. The poultry value chain in Uganda comprises a number of different types of birds including chicken, turkeys, ducks, geese, ostriches and pigeons. In 2014, the total poultry population in Uganda was estimated at 45 million, with indigenous breeds accounting for 88 percent of the total population (UBOS, 2015). According to the livestock market scan, chicken account for 95 percent of all poultry reared in Uganda (EKN, 2012), and therefore have the most significant economic impact. The chicken population is categorized into two distinct breeds: the ‘local’ indigenous and exotic.
2.2. Agro-processing and Marketing
The structure and conduct of Uganda’s agricultural sector reflects the dominance of subsistence farming and prevalence of small and medium scale cottage industries
0500
1,0001,5002,0002,5003,0003,5004,0004,5005,000
2010
2011
2012
2013
2014

18 | P a g e
based on use of out-dated production and processing technologies. The extent of commercialisation for any agricultural value chain is strongly linked to existing demand, processing capacity and quality standards. For most of the crops produced, the products are traded predominantly in primary form with minimal value addition. Consequently, agribusiness is predominantly in raw or dry low quality unprocessed products. There are a few medium and large scale agro-industries focusing on internal, regional and international markets. The reported economic growth 6-7 percent over the past decade (MFPED, 2014) has resulted in increased demand for both processed and non-processed food products.
2.3. The National Outlook on Exports
The value of Uganda exports over the period 2010-2015 indicated that the agricultural sector had continued to greatly contribute to the formal and informal exports, with a proportionate share rising from 48.7 percent in 2010 to 54.1 percent in 2015 (Table 1). Within the agricultural sector, coffee has continued to stand out as the major export, followed by fish (and its products), tobacco, maize and tea (Appendix 1).
Table 1: Uganda’s Exports for the period 2010-2014 (in percentages)
2010 2011 2012 2013 2014 2015 Total Uganda Exports (in US$ million)
2,163.9 2,519.1 2,810.5 2,828.7 2,724.8 2,650.9
Formal Exports ( %Share) 75.6 85.9 83.9 85.1 84.8 84.7 Informal Cross Border Trade ( percent Share)
24.4 14.1 16.1 14.9 15.2 15.3
Agricultural Sector ( percent Share) 48.7 54.6 49.6 51.7 53.6 54.1 Formal Exports 40.9 49.6 42.9 45.7 47.0 48.3 Informal Cross Border Trade 7.8 5.0 6.7 6.0 6.6 5.8 Agricultural Sub-components ( percent Share)
Traditional Cash Crops 20.4 27.5 20.5 23.2 21.3 21.7 Non-Traditional Cash crops 9.6 9.0 11.1 11.5 13.3 15.3 Fish and its products 8.1 6.8 5.7 5.0 6.3 6.1 Edible Fats and Oil 2.3 2.6 2.2 2.3 2.7 2.3 Sugar 2.9 3.3 4.5 3.1 2.7 2.4 Hides and Skins 0.8 1.3 1.5 2.3 2.7 2.4 Flowers 2.2 2.1 1.9 2.0 2.1 1.9 Other agricultural commodities 2.6 1.9 2.4 2.3 2.6 2.0
Source: BoU, 2016
With specific consideration of the traditional cash crops (coffee, tea, tobacco and cotton), coffee’s contribution to agricultural exports has continued to rise while the percentage contribution of cotton greatly reduced by the year 2015 (Figure 3).

19 | P a g e
Figure 3: Percentage share (of total value exports) of the Traditional Cash Crops 2005 & 2015
BoU (2016a)
The most outstanding pitfall of Uganda’s export sector is the primary form of her export commodities. The lack of dynamism in processing has resulted in Uganda’s export basket being dominated by primary products (around 85 percent), which has made the export sector vulnerable to fluctuations in world market prices and the vagaries of weather. This undermines any potential gains that Uganda’s export sector stands to benefit from the results of the 10th WTO Ministerial Conference (held in Nairobi towards the end 2015), that eliminated all forms of export subsidies for farm exports, an outcome which all developing countries with a potential future in agro-business should embrace.
2.4. The Institutional and Legal frameworks
The Government of Uganda recognises the potential benefits of supporting agricultural and agribusiness and has put in place several policies geared at improving production, productivity and competitiveness of the sector. The overall goal is to capitalise on Uganda’s comparative advantage in food production in the region. For example, in order to facilitate the emergence and growth of enterprise agriculture, Government, through the Ministry of Agriculture, Animal Industry and Fisheries (MAAIF) adopted the Commodity Based Approach (CBA) to increase agricultural production and productivity MoFPED (2014). Under this approach, investments are channelled to the development of value chains of 12 prioritized commodities namely: maize, beans, rice, bananas, cassava, cattle, meat, fish, coffee, tea, fruits and vegetables.
2.5. The Comparative Advantage for Uganda in Agribusiness
Uganda has a comparative advantage in food production. With the EAC, Uganda has the biggest size of arable land standing at 68 percent, while Kenya has 9.1 percent, Burundi 3.6 percent, Rwanda 48.4 percent and Tanzania 10.2 percent. Three-quarters
62% 14%
12%
11% Year 2005 (275.1 US$ millions)
Coffee Cotton Tea Tobacco
70% 4%
12% 15%
Year 2015 (578.9 US$ millions)
Coffee Cotton Tea Tobacco

20 | P a g e
of the land in Kenya is semi-arid, and not suitable for agricultural production due to frequent droughts. Although endowed with many high production zones, Tanzania’s land is predominantly semi-arid. Additionally, Uganda is endowed with water resources (rivers and lakes) that can be utilized for irrigation. Further, flexibility in production is facilitated by favourable rainfall patterns compared to other countries in the region.
Uganda’s location at the centre of the Great Lakes region and in the EAC offers access to a vast regional market. According to the Diagnostic Trade Integration Study (WorldBank, 2006), Uganda has the potential to expand her production and export of staple foods to the region. Exploiting this potential will increase employment opportunities along several value chains and help reduce poverty within the country (Joughin, 2014). In the 2016 World Bank Doing Business report, Uganda ranks 122nd out of 189 countries (up from 135th rank in 2015).
2.6. The Future of the sector
To-date, GoU emphasises improving the business environment to facilitate easy flow of goods and services in both internal and external markets. Uganda’s Vision 20402 aspires to transform Uganda’s agricultural sector and make it more productive, profitable and competitive. Further, the National Development Plan-II (NDP-II)3 aims at increasing sustainable production, productivity and value addition in key growth opportunities; increasing the stock and quality of strategic infrastructure to accelerate the country‘s competitiveness; enhancing human capital development; and strengthening mechanisms for quality, effective and efficient service delivery. The plan proposes government support and investments in twelve agricultural value chains with specific emphasis on strengthening agricultural research, promoting extension services, technology adoption at the farm level, increasing access to and effective use of critical farm inputs, promoting sustainable land use and soil management, increasing access to agricultural finance with specific options for women farmers, and strengthening agricultural institutions for effective coordination and service delivery. Furthermore, the plan is keen on promoting potential leverage points for entry of various players and key stakeholders to do business.
It is anticipated that Uganda’s agribusiness sector will continue to grow as both internal and external markets expand. Targeted actions by both the Government of Uganda and the private sector at rectifying existing market and policy failures will stimulate more business. The GoU continues to demonstrate commitment to pursuing a private sector-led strategy that addresses constraints that slow down investment in "http://english.rvo.n l/home/about-rvo

21 | P a g e
agriculture. GoU continues to pursue and support public private partnerships in areas of high opportunity with quick gains, but where the private sector on its own lacks adequate capacity (MAAIF, 2010).
However, the growth of agribusiness in Uganda is largely constrained by over reliance on comparative advantage rather than competitiveness. The productivity of the sector is still low due to lack of economies of scale and several market and policy constraints. The other factors affecting agribusiness in Uganda include; limited access to modern production technology, high transaction costs due to poor road infrastructure, inadequate processing capacity, poor logistical management, prohibitively high costs of capital, high levels of corruption, inefficient agricultural input markets and inefficient implementation and enforcement of quality control and regulatory frameworks.
The above challenges notwithstanding, agribusiness has gained prominence since the Government of Uganda (GoU) started pursuing export led growth policies4 under structural adjustment programmes that included trade liberalisation, privatisation, introduction of incentive regimes, abolition of export taxes, investment guarantees, externalisation of funds and setting up of an autonomous Investment Authority. Investments in agribusiness receive special incentives including: duty-free tax import of plant and machinery; training, research and development expenditures are tax exempt; and capital allowance on plant and machinery of up to 50-70percent (UIA, 2015).
Despite several policy provisions, Government of Uganda’s spending on agriculture has continued to decline despite the sector being a key pillar of the economy. Between financial years 2006/07 -2012/13, agricultural sector funding declined by 15% and the trend has not changed to-date which is contrary to the 2003 Maputo declaration that recommended a 10 per cent annual spending on agriculture which Uganda has never met. Low public expenditure on agriculture has a negative effect on agricultural research, formulation and implementation of quality control and regulation standards, and dampens the environment among others for agribusiness in the country.
The Government of Uganda (GoU) continues to demonstrate commitment to pursuing a private sector-led strategy that addresses constraints that slow down investment in agriculture. This is timely given the expanding internal and external markets as a result of increasing population and incomes. Rectifying existing market and policy failures is more important now than ever before. Combined interventions by government and the private sector are implemented with a major goal of maximising agribusiness engagements.

22 | P a g e
3.0 PRODUCTION AND MARKETING OF AGRICULTURAL PRODUCTS
3.3 The Traditional Cash Crops
3.3.1 Coffee
Coffee is Uganda’s leading agricultural export and major foreign exchange earner providing income for over 1.5 million households. In the East African Community, Uganda is the biggest coffee producer accounting for 63 percent of the total regional coffee production (Figure 4).
Figure 4: Coffee Production trends in the EAC region (2003-2013)
Source: EAC Secretariat, 2014
Over half a million Ugandans are engaged in coffee production (Nandudu, 2014).Robusta and Arabica coffee are the varieties of coffee grown in Uganda, with the former grown mainly in low lands and the latter grown mainly in mountainous areas. The regional coffee production levels for the period 2008/9 (Table 2) depicted that In order to overcome the cotton wilt disease, which is among the greatest factors affecting coffee production in the country, new and resistant varieties of Arabica coffee have been introduced by the National Coffee Research Institute (NaCORI). However, these are still at the multiplication stage in a number of nurseries.
Table 2: Regional Coffee acreage by variety by end 2014
Region Arabica Robusta Central 136,247 Eastern 51,292 26,417 Northern 9,097 10,789 Western 21,222 58,551 South-West 9,015 31,277
Source: UCDA,
0
50
100
150
200
250
2003 2004 2005 2006 2007 2008 2009 2010 2011 2012 2013Prod
uctio
n '0
00 to
nnes
Year
Burundi
Tanzania
Uganda
Kenya
Rwanda

23 | P a g e
The production, consumption and export of coffee for the last 15 years has been increasing with intermittent drops (Figure 5). Over 98 percent of Uganda’s coffee is exported. The level of domestic consumption is low partly due to the lack of a coffee-drinking culture.
Figure 5: Uganda Coffee Production, Export and Local Consumption (2000-2015)
Source: USDA, 2015
The competitiveness of this sub-sector as evidenced by the growing production, productivity, exports and high numbers of actors in the value chain. For example, by the end of 2015, the sub-sector had 14 coffee roasters, 41 major coffee exporting companies (Appendix 3), 32 export grading plants and 395 primary processors (e.g. Caption 1 and Caption 2) (UCDA, 2015b).
Caption 1: Kyagalanyi Coffee Processing Plant, Namanve
Caption 2: Coffee ready for export at Banyankole Kweterena Growers’ Union, Mbarara
The major destinations for Uganda coffee exports include the European Union and Sudan among others (Table 4 and Appendix 2)
50
550
1050
1550
2050
2550
3050
3550
4050
2000
2001
2002
2003
2004
2005
2006
2007
2008
2009
2010
2011
2012
2013
2014
2015
1000
60K
g Ba
gs
Year
Production
Exports
DomesticConsumption

24 | P a g e
Table 3: Major destinations for Uganda coffee exports
Destination 60 Kilo Bags Percent Market
Share by Feb 2015 Destination Position held in January, 2015
European Union 208,051 71.6 1 Sudan 36,250 12.5 2 USA 9,645 3.3 3 Switzerland 7,812 2.7 8 Singapore 4,868 1.7 4 Korea 4,676 1.6 10 Isreal 3,520 1.2
Japan 2,770 1.0 5 Source: UCDA (2015a)
The global demand for coffee continues to grow as indicated by global consumption statistics which indicated an increase to 149.8 million bags in 2014, an annual growth rate of 2.4 percent over the last 4 years on account of a higher than expected demand from the European Union estimated at 42.4 million bags.
High demand for Uganda’s coffee has increased returns to actors in this value chain and increased competitiveness within this subsector. Due to its social and economic importance, Coffee production, processing and marketing is guided by a well laid out National Coffee Policy5. It defines clear-cut interventions required for scaling up performance and development of the coffee value chain. It has provided a solid foundation for enactment of supportive legal and regulatory frameworks desirable for a suitable enabling environment for growth of the coffee sub-sector.
5 It defines clear-cut interventions required for scaling up performance and development of the coffee value chain. It has provided a solid foundation for enactment of supportive legal and regulatory frameworks desirable for a suitable enabling environment for growth of the coffee sub-sector. See www.agriculture.go.ug/Regulations/258

25 | P a g e
Despite the several positive achievements in the coffee subsector various challenges and unexploited opportunities do exist as revealed in the SWOT analysis (Figure 6).
Figure 6: A SWOT Analysis: Coffee Value Chain
Strengths: Weaknesses: • Two coffee types; Arabica and Robusta
coffee with high premiums on international market because of the sweet aroma capable of a variety of products including cappuccino
• Coffee grows in most of the agro-ecological zones in Uganda
• Favorable weather conditions with bimodal rainfall patterns
• Continuous research on coffee
• Limited secondary processing in country thus reducing profitability
• Limited value addition to coffee • Inefficient quality control and inadequate
enforcement of regulations • Expensive transportation/logistics from
farmers to bulking centers/markets • Recycling/mixing of black beans by traders
and middlemen • High coffee disease burden (bacterial wilt,
coffee leaf rust and Coffee Berry Borer) capable of destroying plantations
• Limited access to affordable quality equipment
• Poor agronomic practice; post-harvest handling (drying) and mixing of black beans lowers the quality of coffee
Opportunities: Threats: • Two production seasons a year which
guarantees continuous supply • Uganda coffee Arabica has very good
intrinsic quality due to high altitude, soils and farming systems.
• The coffee sector is fully liberalized giving more economic opportunities e.g. investment in value addition (roosting, instant coffee)
• Large regional/international markets • Existence of the coffee strategy 2040
which guides investments in the subsector
• Fluctuations in coffee prices on international markets
• Poor packaging and storage facilities, harvested coffee kept inside houses where people/animals sleep and its prone to foreign odours
• High costs for organic and fair trade certification
• Declining soil fertility and expensive inputs including: seedlings, fertilizers, packaging materials, reduce yields.
• Climate variations • Large volumes of black beans with no
export value

26 | P a g e
3.2.2 Cotton
Cotton is an annual crop that is produced commercially in over 80 countries located in both the tropics and temperate climate zones (Lundbaek, 2002). Its main commercial uses are in manufacture of textile and garment, edible oil, soap and livestock feeds. In Uganda, cotton is predominantly produced in the Eastern, Northern, Lower West Nile and South Western regions. By the year 2000, the sector had recorded approximately 300, 000- 400, 000 producers (Ann and Andrew, 2000). However due to a number of constraints such as low returns, the number of cotton farmers reduced to about 250,000 households by the year 2014. Currently farmers grow only one cotton variety6 that is unique to the country with good (finer) fibre properties that are extremely favorable to spinners and have staple length of approximately 30 mm.
Cotton is a labour intensive crop especially at weeding, pesticide application and harvesting stages. Animal traction introduced into the country in the early 1900’s is widely used by cotton farmers in the main cotton producing areas for land opening. The use of tractors by small-scale farmers in general remains very limited, mainly because farmers cannot afford the technology (EKN, 2015).
Cotton was Uganda’s major export until the 1950’s when it was surpassed by coffee (Serunjogi et al., 2001). At its peak production of 465,000 bales of lint in 1969/70, cotton contributed to about 40 percent of foreign exchange earnings. The industry experienced a dramatic decline in terms of both acreage and yield from the mid 70’s to the late 80s due to political turmoil. By 1987/88, production had hit an all-time low of 11,000 bales. The textile and garment industry and other value addition industries also suffered a similar fate. The causes of decline of farm level production included lack of credit and farming inputs, lack of extension services, a poor marketing system and a run down and inefficient ginning system (LMC, 2002; Serunjogi et al., 2001).
Currently, the subsector has several actors including ginneries, processors and exporters (Appendix 4). The levels for production, export and domestic consumption for coffee are presented in Figure 7. The period 2004 and 2009 experienced a continuous fall in production. The marketing system of cotton is still a major drawback for farmers. After harvesting, the farmers either transport their seed cotton to seed buying posts operated by ginners, who buy the produce at a market price determined by the buyers who then transfer the cotton to their respective ginneries. Alternatively, transactions between farmers and the buyers are executed through agents that act as intermediaries (Caption 3) and depress the profit margins for farmers.
6 They grow a variety called Uganda Bukalasa Pedigree Albar

27 | P a g e
Figure 7: Trends of Cotton Production, Export and Domestic Consumption (2000-2015)
Source: USDA, 2015
Caption 3: Marketing of Cotton in Kasese
The greatest proportion of cotton produced is exported with only about 5 percent of the produce consumed locally by three textile factories7 and a cotton wool producing factory. The most preferred form of exporting is indirect exporting in which baled cotton is either delivered on Ex-Gin or on Free on Truck (FOT) basis to the exporting company, which then assumes ownership of the goods, completes the export formalities and physically exports the cotton. The cotton is mainly exported to India, China, Thailand, Malaysia, Indonesia and South Korea/Singapore, Switzerland and UK, where international merchants that mainly buy cotton on FOT or Free on Board basis for onward sale in major global consumer markets.
Despite the poor performance, there are several justifications for supporting the cotton and textile sub sector in Uganda guided by the existing National Textile Policy and Strategy formulated in 2008. This subsector is in dire need of retention and attraction of new investments, developing human resources with skills in clothing and textile technology, technological up-gradation and addressing market distortions
7 Southern Range Nyanza Factory, Phoenix Logistics and Fine Spinners
0
50
100
150
200
250
2000
2001
2002
2003
2004
2005
2006
2007
2008
2009
2010
2011
2012
2013
2014
2015
1000
480
lb.B
ales
Year
Production
Exports
DomesticConsumption

28 | P a g e
present in the value chain. Therefore opportunities for expanding capacity of existing firms and attraction of new investment into production on a large scale do exist. Below is a SWOT analysis of the cotton subsector (Figure 8).
Figure 8: A SWOT Analysis: Cotton Value Chain
Strengths Weaknesses • Homogeneous cotton production which
makes monitoring easy • All seed cotton is handpicked, which
better preserves the intrinsic quality of the lint
• Availability of idle infrastructure/installed processing capacity e.g. Lira Spinning Mill, African Textile Mill, Mulco, and LAP Textiles Limited
• There are several institutions8 supporting production of cotton in the country
• High transport/freight costs from production to market centres
• Lack of functional local textile industries exposes farmers to fluctuations in international market prices
• Weak cooperative movement and minimal economies of scale
• High production costs (expensive inputs; e.g fertilizers, transport etc.)
• Poor post-harvest quality control e.g. contamination with foreign matter
• Low profitability of cotton relative to other competing crops
• Underutilized and technologically aging ginneries and manufacturing plants
Opportunities Threats • Availability of land suitable for cotton
production as only 1/3 of this land has so far been cultivated
• Growing one variety of cotton eases quality control in the production phase of the crop
• New opportunities for export of apparels made in Uganda to USA markets under AGOA
• Uganda has 43 ginneries operated by 25 ginning companies.
• High cost of capital and risk of crop failure
• Prolonged dry spells which affect harvest. • Fluctuation in international cotton prices • Abandonment of cotton growing due to
low and unreliable returns to farmers • Export of unprocessed cotton • Competition with Genetically Modified
(GM) cotton embraced by some of the cotton producing countries like India.
3.2.3 Tea
Tea is grown in the Lake Victoria Crescent and lower slopes of the Rwenzori Mountains as well as above the Western Rift Valley. The major tea growing districts in Uganda are Kabarole, Bushenyi, Kanungu, Rukungiri, Mityana, Kibaale, Hoima, Kisoro, Wakiso, Mukono, Buikwe, Mbarara, and Zombo. Large tea estates are responsible for 72 percent of the tea produced in the country, while the rest of the tea is produced by out-growers. The number of out-growers has been increasing. According to Oxfam (2002), the increase in out growers is because tea is a source of income all year round, requires little investment, has a low risk of crop and there is a deliberate government effort to provide free plantlets to farmers under the NAADS and OWC.
8 Cotton Development Organisation (CDO), the National Seed Certification Service (NSCS) and Busitema University

29 | P a g e
Uganda’s tea sector is competitive as evidenced by the number of actors (Appendix 5). The production and export trends for tea since 2000 indicate continuously increasing values, especially between 2006 and 2014 (Figure 9). This is partly attributed to the growing internal, regional and international demands.
Figure 9: Tea Production and Exports (2000-2014)
Source: UBOS Statistical Abstracts
Uganda earned US$ 72 Million from exporting 63,456 tonnes of tea, cultivated on 35,194 Ha, in 2012/13 (MFPED, 2013). Tea was Uganda’s third largest agricultural export commodity by export value in 2014 contributing 3.1 percent of the total exports. By 2015, tea had dropped to the 5th position contributing 2.5 percent of total export value and overtaken by Tobacco and Maize (BoU, 2016b). The decrease in export earnings from tea is explained by falling prices for Ugandan tea on the world market as a result of decline in quality and competition from other tea producing countries. The tea produced in the country is mainly of medium quality and used to blend premium quality tea produced in Kenya. About 70 per cent of Uganda’s tea is sold through auction in Mombasa where it is often exported as Kenyan tea, and 20 per cent through direct sales, while the remainder is sold locally. The use of Kenyan middle men in export of the produce is reported among the reasons the tea is bought at a low price (Kiwanuka and Ahmed, 2012). There are several opportunities and challenges in this subsector as presented in the SWOT analysis (Figure 10).
20,000
30,000
40,000
50,000
60,000
70,000
Tons
Year
Quantity Produced Quantity Exported

30 | P a g e
Figure 10: A SWOT Analysis: Tea Value Chain
Strengths Weaknesses • Uganda has no tea export taxes, charges or
levies • The diverse agro-climatic conditions
prevailing in the tea growing areas of Uganda allow production of a wide range of teas
• Strong production base with 75 per cent of the production being accounted for by organized tea estates and outgrowers
• High cost of production mainly due to low productivity and high energy cost
• Unproductive tea seedling clones being planted due to inadequate tea research in the Country.
• Remote location of the plantations increase transaction costs for growers
o Transportation of tea over long distances to processing facilities
o Poor road infrastructure especially the access roads to the tea plantations
• Difficulties in introduction of mechanization of field operations due to topographical factors
Opportunities Threats • Availability of arable land • Increasing awareness world over as to the
health attributes of tea leading to growing demand for good quality tea and specialty tea such as organic and green tea
• Positive response by Uganda’s tea industry to improving the management of tea factories
• Increasing impact of smallholder growers
• Fluctuation in international tea prices • Technology used in withering tea requires
firewood due to unreliable electricity supply • Lack of effective regulation and coordination
of tea activities • Round-the-year production in countries such
as Sri Lanka and Vietnam. • Low cost of production of tea from Kenya,
Vietnam and Indonesia compared to Uganda
3.2.3 Tobacco
Tobacco production and processing in Uganda was until 2013 dominated by British American Tobacco (BAT) Uganda, which used to control about 93 percent of the activities, employing about 28,000 persons and purchasing tobacco from 65,000 contract farmers. In 2013, BAT closed its tobacco-processing plant in Kampala and relocated its manufacturing operations to Kenya. In 2014, a total of 25,500 Mt of Tobacco were procured registering a reduction of about 25 percent from that procured in 2013 (Figure 11).
Due to the risks tobacco production has on the producers and users of the product, tobacco is a controversial crop. Nevertheless, consumption of the crop is projected to increase over the years. Currently, Uganda Leaf Tobbaco and Mastermind Uganda Limited are the major Tobbaco buyers and processors.

31 | P a g e
Figure 11: Production and Export Volumes for Tobacco (2000-2015)
Source: UBOS Statistical Abstracts
3.3 Non-Traditional Cash Crops
Uganda is able to produce a range of non-traditional agricultural commodities for export at competitive prices due to its comparative advantage based on favourable climate, rich natural resources and available rural labour. Uganda’s non-traditional agricultural exports are instrumental in stabilising the country's balance of payments by increasing total export earnings and reducing fluctuations in revenues from traditional exports. Over the years, producers have diversified their crop portfolio from traditional crops such as coffee to non-traditional crops like vanilla, cocoa, maize, simsim, sunflower, beans, rice, potatoes, flowers and horticultural products (chillies, tomatoes & leafy vegetables).
3.3.1 Maize Commercial maize farming takes place in over 20 districts9 in Uganda. Maize is a staple food among the rural poor and highly depended on by institutions such as schools, military, police and prisons, as well as relief providing bodies such as the United Nations World Food Programme. By 2010, maize was estimated to be a direct source of livelihood to over two million households, 1,000 traders/agents and over 600 millers (UNDP, 2010). Maize production has been steadily increasing over the years with most of the production consumed locally, leaving minimal quantities for export (Figure 12). Maize is also a raw material for industrial products such as alcohol and starch.
9 Iganga, Kasese, Masindi, Kapchorwa, Mbale, Masindi, Mubende and Kasese. Mubende, Kiboga, Lira, Apac, Mbarara, Masaka, Rakai, Kyenjojo, Kabarole, Kamwenge and Hoima
0
10,000
20,000
30,000
40,000
50,000
60,000
2000
2001
2002
2003
2004
2005
2006
2007
2008
2009
2010
2011
2012
2013
2014
Tonn
es
Year
QuantityProduced

32 | P a g e
Figure 12: Trends of Maize Production, Exports and Domestic Consumption (2000-2015)
Source: USDA, 2015
The majority of maize farmers operate on a small scale and produce about 95 percent of the national maize output contributing 75 percent of the marketable surplus. Maize maize is grown under rain-fed conditions with volatile production from year to year. Use of improved seed and fertilizer is modest, but greater than for other staple food crops. Maize prices exhibit substantial intra-year seasonality, are low when the markets are flooded with maize during harvest-time and prices are high prior to the next harvest. The maize milling industry consists of hundreds of small-scale mills serving rural areas and handful of large-scale mills serving urban consumers. The maize value chain has complex marketing channels including many small-scale under-capitalized traders, minimal storage capacity, and few large trading enterprises with national and regional operations.
The growing demand for maize has created a new class of emerging medium scale commercial farmers with 0.8-2.0 ha (UNDP, 2010) but productivity remains a major challenge. Maize production is characterized by low yields and low returns to farmers mainly due to price instability. According to MAAIF (2009), the maize production potential per hectare is 6.0 Mt. However, the average production on small holder farms is 1.54 Mt/ha which is still very low. This is attributed to poor agri-input dealer networks that are unable to deliver quality and affordable seeds, inorganic fertilisers and pesticides to farmers. In addition, lack of storage is a major constraint as farmers sell off most of their surplus maize immediately after harvest which results in very low maize prices at harvest time. Further, a report by UNDP (2010) indicated that about 15 percent of the national maize output is lost due to poor post-harvest handling. An additional situation analysis of the maize subsector is presented in Figure 16.
0
500
1000
1500
2000
2500
3000
2000
2001
2002
2003
2004
2005
2006
2007
2008
2009
2010
2011
2012
2013
2014
2015
1000
MT
Year Production Exports Domestic Consumption

33 | P a g e
On the regional front, Uganda remains a key supplier of maize through both formal and informal trade channels to South Sudan, the EAC and the Eastern Democratic Republic of Congo. Although Uganda’s export capacity is estimated at between 100,000-150,000 Mt per year, only about 50 percent of this capacity is utilised due to poor penetration caused by poor market quality and unreliability of maize supply. In recognition of its poverty reduction impact as well as food security role, the Government of Uganda selected maize as one of the 10 priority crops. Figure 13: The situation analysis for the Maize Enterprise
Strengths Weaknesses
• Government and Development Partners (e.g. USAID) support the development of the maize Value chain
• Maize by-products used to produce livestock feed
• Ongoing research on maize by NARO
• Farm productivity is exceedingly low • Farmers lack cost-effective means of transporting
maize • Poor post-harvest handling processes resulting into
high levels of aflatoxins • Weak enforcement of the maize standards • Production is mainly on a small scale with low
economies of scale • Limited of storage facilities
Opportunities Threats
• Availability of improved varieties that are early maturing, high yielding, disease and drought resistant
• Maize is a key ingredient for a variety products including human food, animal feeds, ethanol and starch
• Maize is one of the priority crops in the NDP-II
• Limited availability of electricity in the rural areas to facilitate the local processing facilities
• Lack of storage facilities • Sharp seasonal fluctuations in maize prices
(particularly in remote areas) significantly reduce margins for farmers
3.3.2 Cassava
Africa’s consolidated production of cassava was estimated at 53 percent of the world production in 2010 produced by Nigeria, DRC, Angola, Ghana, Mozambique and Uganda. In Uganda, cassava is the second most important staple crop after bananas, with an annual crop with a maturity period of 6–8 months. The main cassava growing regions based on production volumes of 2008/200910 were; the eastern region (37 percent), followed by the northern region (34 percent), western (15 percent) and lastly central (14 percent). The national average cassava yield is 12.5MT/ha. Over the period 2008-2014, the cassava production trends reveal a staggering trend as shown in Figure 14.
10 Based on season two of 2008 and season one of 2009

34 | P a g e
Figure 14: Cassava Production (2008-2014)
Source: UBOS (2014 and 2015)11
Cassava trading flow can be categorized according to its major products, i.e. fresh cassava (Caption 4), dried cassava pellets/chips and cassava flour (Caption 5). In Uganda, cassava flour12 constitutes about 50 percent, dried pellets/chips (45 percent) and raw cassava (5 percent) (Afrii, 2013). The mapping of cassava and cassava products reported by UIA (year??) indicated the cassava growing areas, the markets, trading routes and areas which are famous for processing. This mapping clearly indicated the development of market linkages that connect supply to demand and support services (Appendix 4). The major regional destinations for cassava and its products include the DRC, Kenya and Rwanda.
Two of the major constraints to the development of cassava post-harvest systems are (a) the perishability of the fresh roots and (b) the presence of gynogenic compounds in cassava. Raw cassava is very bulky, perishable and only suitable for local markets. Cassava is susceptible to physiological deterioration after the roots are harvested. This means that roots greater than 48 hours old have little market value which limits the range over which fresh roots can be marketed. Deterioration can be delayed by waxing or storage in plastic bags following a fungicidal treatment.
11 The values reported in MAAIF (2010) and UBOS (2010) indicated production values for the period 2004-2010 ranging between 5.5 – 5.2 million MT. It however indicated in the Statistical Abstract that the value for 2009 was an estimate while that of 2010 was a projection. The values used here relate very well with the estimates derived during the 2008/9 Agricultural census 12 About 200,000 tonnes of cassava flour are consumed per annum in Uganda; most is traded in informal markets and negligible quantities in supermarkets.
2500
2600
2700
2800
2900
3000
3100
2008 2009 2010 2011 2012 2013 2014
'000
Ton
nes
Year

35 | P a g e
Caption 4: Harvested cassava bulked at a road side ready for transportation to urban centres
Caption 5: Cassava flour on sale in local Supermarkets
Processing cassava is important because of the perishability of the crop and constrained marketing as a result. Often cassava is chopped, dried and processed into flour to increase shelf life and facilitate longer distance marketing. Fresh cassava contains cynogenic glucosides, which creates a potential health hazard if cassava is inadequately processed. Effective processing, essentially involving root disintegration and removal of the gynogenic compounds with the water, ensures the safety of products.
One of the major challenges for cassava producers and processors is accessing markets and developing new marketable products such as High Quality Cassava Flour (HQCF); improved and more convenient versions of traditional processed products; starch, sugar syrups; livestock feed rations; bio-ethanol production; and energy drinks. HQCF is of particular interest to Uganda because it is a substitute for wheat flour in pastries and has some industrial applications (Ndossi quoted in Gwera, 2009). Incorporation of HQCF in Uganda’s baking industry can significantly boost the demand for cassava and reduce the price of bread and other cassava-based products. The industrial potential of HQCF is significant as it is the basis for extenders plywood adhesives and serves as a primary ingredient paperboard adhesives. Cassava flour is also commonly converted into sugar syrups used to produce ethyl alcohol. HQCF has the potential to completely replace imported, starch-based adhesives. Beyond these industrial uses, processed cassava holds other potential uses including sweeteners, mosquito coils, livestock feed, and brewing ingredients. Livestock feeds rely primarily on dried cassava pellets and can be used domestically or exported.
Use of processed cassava in these products, however, is highly dependent on quality and price, which relates significantly to processing efficiency and on farm yields. If cassava can be processed in a more efficient manner, domestic and regional demand can grow continuously. However, several weaknesses and threats as highlighted in the situational analysis (Figure…) threatens this transition. It is important to highlight the

36 | P a g e
Government’s investment in improving the value of cassava products. This has been through the triple helix approach where Uganda Investment Authority (UIA) interested NARO to develop high-yielding varieties that are adaptable in various agro-ecological zones. There are also recent initiatives to improve the beta-carotene and protein content of cassava as well as delaying its physiological deterioration. In addition, there are UIA interventions in the areas of farmer level productivity, Agro-inputs, Cluster13 development and support, development of business linkages along the cassava value chain, entrepreneurship skills, technical skills and training for value addition.
Figure 15: A situation analysis for the Cassava value chain
Strengths Weaknesses
• Cultivation of cassava is less labor intensive as compared to other crops
• Government’s investment in improving the value of cassava chain
Production level • Inadequate and poor quality (for some varieties)
planting material • Unattractive economies of scale (production for
processing due to competing uses for cassava) • Prevalence of diseases especially the Cassava Brown
Streak Disease (CBSD) • Post-harvest handling challenges ( shortage of
tarpaulins for drying, limited access to storage facilities, storage pests)
• Few processors to handle large quantities of raw produce
Marketing; • Transport and logistical problems (road
infrastructure) often leading to delay in delivery of produce
• Price fluctuations for cassava and related products Processing; • Small-holder level and scattered farmers making
location of agro-processing units challenging • Low quality standards of cassava products with
respect to quality demanded by the market – ethanol and flour for industrial use (breweries)
Opportunities Threats • High demand for cassava and its products
in both Uganda and the regional markets • Processing of cassava into ‘more hygienic’
chips and flour to capture for use in confectionaries
• Identified Markets for HQCF including Rural bakeries; Paperboard Industry; Animal feed industry, Breweries and the Starch-based adhesives
• Established Centre of excellence for cassava research in East & Central Africa
• Importation of starch and ethanol which may cripple investment opportunities
• Diseases outbreaks (brown streak virus and cassava mosaic disease)
• Continued importation of brewing raw materials e.g. barley

37 | P a g e
3.3.3 Potatoes
In Uganda, 60 percent of Potatoe production is in the highland areas of South Western Uganda (Kabale and Kisoro districts) and Eastern Uganda (Mbale and Sironko districts). Potatoe growing has recently extended in the areas of Kyenjonjo, Kyegegwa, Kamwenge and Mubende. In some instances, the farmers are organised into producers and/or marketing groups who engage with buyers on a contractual arrangement. The contractual farmers are expected to sort, grade, pack, and transport the potatoes to one strategic point convenient for the buyer. The contractual farmers are generally resource and information constrained which results in failure to meet the quality and production standards set by the buyers (Kyomugisha et al., 2012). The non-contractual farmers produce and sell potato to any available traders (middle men) or consumers. They however continue to complain of limited market access/ limited outlets and low prices which are also compounded by the inefficiencies along the value chain (Africa 2000 Network, 2007). The production trends showed a steady increase for the period 2008-2012, which then dropped in 2013 followed by an increase in 2014 (Figure 16). Most of the potatoe produced is marketed in raw form (Caption 6) with minimal levels of processing.
Figure 16: Potatoe Production (2008-2014)
Caption 6: Potatoe collection centre for marketing in Kabale
The country has one potatoe processing factory known as Kisoro Potatoe Processing Industries Ltd (KPPIL) which was constructed in 2011 targeting to improve cold storage chain and thus contribute to enhanced marketing of the crop. The factory has a production line for potatoe chips (French fries) with a capacity of 20 Mt daily and , the tubers are (in the initial phases) supplied by a cooperative union of more than 4,500 farmers in the Kigezi sub-region. This is expected to make significant contribution to incomes of the rural farm communities in the districts of Kisoro and Kabale and in the region beyond. The target products are a range of French fries and specialty items for the regional upscale restaurant trade and the Arab market.
120130140150160170180190
2008 2009 2010 2011 2012 2013 2014
'000
tonn
es
Year

38 | P a g e
There is another intervention by the Uganda Industrial Research Institute (UIRI14) which is operating a virtual incubation facility for potatoe processing in Kabale. This facility has a tremendous impact on grassroot farmers and small-scale entrepreneurs who are not otherwise able to set up own processing units by providing physical facilities, trained staff, technical training, business development services and marketing of finished products.
The potatoe subsector has several challenges and opportunities.
Challenges
• The chain actors generally lack sufficient knowledge, information and enough resources to help them meet quality standards and formal market specifications
• Majority of the farmers do not use high yielding seed varieties and fertilizers thus leading to low yields
• Farmers face great difficulty accessing seed in terms of quantity and quality due to high prices and limited availability. Seed used is usually home saved seeds from previous harvest, most of which is made up of local varieties
• Farmers have limited agronomic knowledge • High incidences of pests, diseases and vermin • Many areas are prone to soil exhaustion and erosion largely because of the high
terrain • Lack of storage facilities. The most common on-farm forms of storage facilities
are rooms in residential houses. Retailers and wholesale traders rent stores predominantly in trading centers where they store produce, suggesting that there are no permanent storage facilities at these levels.
Opportunities
• NARO intends to produce and make available more than 20 different varieties of potatoes to farmers seeking to diversify their crops
• Existence of KPPIL that aims at producing a distinctive brand of potato fries to capture a sustainable niche market while empowering the primary producers and, small holder farmers, to achieve higher production and improved post-harvest handling.
3.3.4 Rice Rice production in Uganda is by different categories of farmers of which the small scale farmers (with less than 2 ha) are the majority constituting about 80 percent. The small and medium scale farmers undertake low scale production operations including
14 UIRI is one of the organizations spearheading the government’s overall strategy of developing public-private partnerships (PPP), specifically in terms of enabling the industrial sector to become more vibrant, viable and competitive

39 | P a g e
limited use of fertilisers and the use of poor quality and mixed seed varieties (EPRC 2015 and MAAIF, 2009). Both upland and paddy rice varieties are grown in the country with about 70 percent of the total land suitable for rice production cultivated with upland rice. Rice has become both a major security crop as well as a cash crop in several districts in Uganda. However, unlike most crops important for food security, rice is consumed more in urban areas.
The available figures for rice production, domestic consumption, exports and imports (Figure 17) indicate that domestic consumption has overtime been way above the production levels, thus a supply demand continued to be satisfied by imports.
Figure 17: Trends of Rice Production, Domestic Consumption, Exports and Imports (2000-2015)
Source: USDA, 2015
The increase in rice production between 2005 and 2010 was mainly attributed to wide scale cultivation of upland rice, particularly the NERICA variety coupled with the lucrative prices received by the farmers (EPRC, 2015). On the consumption side, the demand for rice in Uganda (since the year 2000) has grown at an average rate of about 9.5 percent per year. This increasing demand has continued to be partially satisfied by rice imports. On the contrary, there is some level of rice exports recorded as well with the major destinations including DRC, Kenya and South Sudan.
The Uganda rice sub-sector is spearheaded by the Uganda National Rice Development Strategy 2009/10 -2017/18, which seeks to increase un-milled rice production from about 177,800 Mt in 2008 to 680,000 Mt by 2018. The strategy also seeks to increase household food production and ensure export of rice surpluses through promoting practices that increase production of high quality rice. Recent interventions by government in the rice sub-sector include construction and rehabilitation of irrigation schemes like Doho, Agoro, Mubuku, Olweny and Kiige. The East African Community’s
050
100150200250
1000
MT
Year
Production Domestic Consumption Exports Imports

40 | P a g e
Common External Tariff (CET) is the most important policy affecting rice markets in Uganda, with the CET on rice imported from outside the region set at 75 percent ad-valorem or US$200 per tonne.
The situation analysis for the rice sub-sector is presented in Figure 18.
Figure 18: SWOT analysis of the Rice sub-sector
Strengths Weaknesses • Adoption of both paddy rice and
upland rice production systems • Increased tangible benefits to
farmers leading to expansion of acreage under production
• Presence of a National Rice Development strategy/framework
• Presence of 5 irrigation schemes and the potential for more irrigation schemes
• No clear policy on rice seed production, quality assurance and marketing
• Growing of mixed rice varieties • Poor post -harvest handling practices which affect
the quality of rice (Lack of drying facilities like tarpaulins or drying yards, some farmers dry and thresh the rice on the ground)
• High cost of labour in rice farming • Inadequate knowledge in rice farming especially for
upland rice • Inadequate exploitation of rice by-products • Low grading capacity of the millers: Most of the rice
milling machines do not have the capacity to grade the rice
Opportunities Threats • The increasing local and regional
demand for rice • Presence of sufficient water for
paddy rice production due to presence of the several streams, rivers and lakes
• The common External Tariff (CET) which provides significant price incentives to rice producers
• Promoting the use of rice by-products
• Poor road infrastructure especially in areas of paddy rice growing thus affecting marketing
• High cost of rice mills with high Technical performance
• Improved seed multiplication is thin on the ground • Expensive rice seed
3.3.5 Cocoa Cocoa is another high value crop produced in Uganda. The major cocoa producing districts are Bundibugyo (67 percent), Mukono and Mayuge and over 17 other districts are engaged in the production. Anecdotal information on cocoa subsector estimates a total of 16,000 farmers engaged in the enterprise with average landholdings of 2ha, each producing on average 1,000 Kg of dry fermented beans per ha. Maximum yields from cocoa plantations are expected after 4 years though picking starts after 2 years of plantation establishment.
The Cocoa value chain has benefited from government interventions starting with certification of the nursery operators. There are two varieties being promoted by government (Upper Amazon and Trinitario) although the Amelanando variety (less yielding) is still widely grown. The government buys the seedlings from the private nursery operators and through the Operation Wealth Creation (OWC) programme

41 | P a g e
distributes them freely to the farmers. The government plan in the next 5 years is to attain a production of 50,000 Mt/year by increasing the planted acreage by 25,000 ha under the OWC. The potential area for cocoa production in Uganda is 92,000 ha (only 25,000 ha currently planted) though some of it is intercropped with other crops. Further, there is a lot of sensitisation and mobilisation for increased production, support to inter-district exchange visits and mobilisation and sensitisation on primary processing. In case of disease and pest outbreaks (which are rare) the government assists farmers to carry out mass spraying.
The total production over time has depicted an increasing trend (Table 4 and Figure 19). According to MAAIF records, the total production of cocoa in 2015 was 24,000MT which earned Uganda foreign exchange of $67.2 million with the European Union (UK, Netherlands and German) being the major destinations. Some of the actors in this value chain include ESCO, OLAM and ICUM who generally export dry beans. ICUM chocolates (an Italian entity) established facilities for primary processing in the cocoa bean producing areas and has raised the platform for quality drying. Currently, cocoa ranks 8th in terms of agricultural export earnings, contributing 2.2 percent (Appendix 1).
Table 4: Cocoa seedlings planted, Production/Exports and earnings in US$
Cocoa year*
Cocoa seedlings distributed/planted
Cocoa production/ Exports (Mts)
Value (US$ Million)
2010/11 500,000 16,478 52.72 2011/12 601,000 17,935 43.04 2012/13 1,230,471 19,430 46.60 2013/14 1,739,000 22,010 58.08 24,000 67.2 *Cocoa year ends on 31st/September Source: MAAIF (2015)
Figure 19: Cocoa production/Exports (2000-2014)
UBOS (2012/13/14/15)
05,000
10,00015,00020,00025,00030,000
Tons
Year

42 | P a g e
Uganda’s Cocoa subsector is very competitive when compared to other producers. In terms of suitability of altitude, West African producing countries lie between 0-300m above sea level and Uganda lies between 1000-1,500 m above sea level. High humidity foments conditions for disease and pest multiplication leading to high levels of agro-chemical use. Consequently, Uganda’s cocoa is organically produced although the lack of certification standards in the country makes the farmers to miss out on the organic premium prices. The situation analysis for the Cocoa subsector reveals several positives and negatives (Figure 20).
Figure 20: A situation analysis for Cocoa
Strengths Weaknesses • Cocoa has two harvesting seasons that ensure continued
supply • Uganda’s mild climate is conducive for cocoa growing
because such conditions are less suitable for pest and disease multiplication unlike in West Africa
• Minimal use of crop protection chemicals on Ugandan cocoa establishments
• Maximum yields of 1000Kg of dry beans per Ha attained only after 4 years of establishment
• Cocoa plant is ‘‘self -weeding’’ implying limited labour costs for weeding
• High yielding varieties being grown ( Upper Amazon and Trinitarion)
• High level of government involvement in the cocoa value chain through the cocoa support project under MAAIF
• Availability of certified nursery operators for seedlings
• High labour costs at harvesting • Poor post –harvest practices • Poor field agronomic management
practices by farmers • Existence of plantations with low
yielding Amelanado variety
Opportunities Threats • The perceived health benefits of cocoa and cocoa
products, thus increasing demand • Ugandan cocoa can easily qualify for organic
certification due to the limited use of crop protection chemicals
• Price and quality competitiveness of Ugandan cocoa on international market
• Few actors in various segments of the value chain from production to exportation
• Coffee which is highly grown in cocoa producing areas is an alternative host for the Verticilium wilt disease, a major disease of cocoa
• Lack of a cocoa policy constrains potential developments in this subsector.
3.3.6 Vanilla
Vanilla is a high value crop (Caption 7) grown mainly in the Lake Victoria crescent with a warm humid climate that favours good yields and excellent quality beans. Vanilla in Uganda is organically grown which accounts for the high vanillin content and aroma that makes it one of the most preferred on the world market. Uganda is among the top 10 Vanilla producing countries in the world and the top ranked in East Africa (Appendix 5).

43 | P a g e
The number of participating farmers and total acreage has continued to stagnate despite the reported increasing prices of Vanilla. “The prices of vanilla have been going up in the past five years, but low output worries importers” The Monitor Newspaper, 27th January 2016. This has resulted in decreasing production/export trends (Figure 21).
Figure 21: Vanilla production/Exports (2000-2014)
Caption 7: A Vanilla plantation Source: USDA, 2015
The crop has intermediary institutions such as Uganda National Vanilla Association (UNVA), Uganda Vanilla Growers Associations (UVGA) and trading companies such as UVAN Limited. The trading companies buy the vanilla, undertakes primary processing and then export. Vanilla exports from Uganda are majorly (50 percent) destined for the USA market followed by Canada, the UK, France and Germany (Gabre-Madhin and Vette, 2004). UVAN Ltd is also encouraging farmers to revive vanilla growing by offering incentives such as farm inputs and implements, and also organising vanilla farmer’s competition to ensure increased productivity and quality.
3.3.7 Oilseed Crops
Vegetable oil is one of the major commodities being traded regionally, thus a source of foreign exchange for the country. The subsector accumulated an export value of US$ 34.62 millions in 2015 making a contribution of about 1.4 percent of the agricultural exports in 2015 (BoU, 2016b). The demand for edible oil in Uganda was reported at 216,000 Mt/year, while the national production on average is estimated at 58,000 Mt/year with a consumption of 6.4Kg/person/year. Uganda is the second producer of edible oil in the region after Tanzania. There is available market in Rwanda and Kenya mainly for the seed cake for the developed livestock sub-sector.
050
100150200250300350400450
2000
2001
2002
2003
2004
2005
2006
2007
2008
2009
2010
2011
2012
2013
2014
Ton
s
Year

44 | P a g e
The major oil seed crops in the country are soybean, palm, sunflower, sesame and groundnuts. By 2008, 0ilseed crops were contributing 30-35 percent of the total edible oils consumed in Uganda and 10 percent of total vegetable oils export from the country (UOSPA, 2008).
Oil Seed Crops excluding Palm Oil
Growing of oilseed crops is a source of livelihood to over 4.8 million Ugandans and provides food security to over 830,000 households (VODP, 2009). Major producing areas in Uganda for oilseed crops are Lira, Gulu and the Eastern Hub comprising of Bukedea, Mbale, Tororo, etc. The processing component/industries employ over 2.7 million Ugandans. The production trends for the oil seed crops (excl. palm) indicate an increasing trend over the years (Figure 22).
Figure 22: Production trends for Oilseed Crops (2003-2013)
Source: UOSPA, 2011
The major products traded include sunflower oil and sunflower cake. Most of the sesame and groundnuts are exported as grain due to lack of processing facilities and appropriate technology. The major destinations for sunflower oil and cake and volumes traded are presented in Table 6 and Table 7. The export values for sunflower oil and cake reveal lucrative markets in the region and beyond.
Table 5: Export of sunflower oil by quantity and country of destination (2012-2013)
DESTINATION
Export quantities and proportions 2012 2013
Quantity (Kg) % of Total Quantity (Kg) % of Total
Rwanda 2,381,330 48.3 700,780 17.7 Kenya 1,668,364 33.8 2,535,412 64.0 Tanzania 643,837 13.0 0.0 Burundi 55,479 1.1 65,815 1.7
50,000
100,000
150,000
200,000
250,000
2003 2004 2005 2006 2007 2008 2009 2010 2011 2012 2013
Met
ric T
ons
Year
Sunflower
Soyabeans
Sesame
Groundnut

45 | P a g e
D.R. Congo 62,684 1.3 88,059 2.2 Sudan 97,278 2.0 162,264 4.1 Kuwait 25,758 0.5 0.0 Tanzania 386 0.0 7,828 0.2 Saudi Arabia 10 0.0 Switzerland 403,580 10.2 Total 4,935,116 3,963,748
Source: UBOS (2013)- Danny, provide full reference
Table 6: Export of sunflower cake by quantity and country of destination (2012-2013)
Quantity Exported (Kg) Destination 2012 2013 Kenya 10,239,390 4,043,710 Thailand 5,099,600 30,000 India
2,513,500
Switzerland
2,070,350 Tanzania 405,760
Rwanda 49,800 100,000 South Africa 99,334
Sudan 4,000 United States
1,395
Total 15,897,884 8,758,955 Source: UBOS (2013)
The production and processing of oilseed crops encourages rural development through enterprise diversification; cake used by fish and livestock farmers as feeds (good protein source), bees benefit from the nectar in apiary farming, soap stock use by industries for soap making, residues used as mulch and humus in citrus production, oil use as food and to some extent used as bio-diesel to run industrial machines.
The key strengths for sunflower enterprise include a bi-seasonal production which guarantees an all year round supply and encourages product diversification. With regards to Sesame, there is ongoing research pioneered by NARO and APEP aimed at obtaining high yielding varieties of sesame (I and II). Further, Sesame is increasingly used for commercial purposes such as in oil extraction, confectionaries and animal feeds, with the Netherlands as the major market for this product.
However, the sunflower enterprise experiences several challenges including; • Small-holder and scattered farmers making aggregation of the product costly
for the processors • Insufficient raw materials (grain) to saturate the market • Cultivation of a low yielding variety • Poor post –harvest handling practices leading to high losses of about 30 percent

46 | P a g e
• Low fertilizer usage15 attributed to lack of fertilizer source, the high fertilizer cost, and poor distribution of fertilizer stockists in the oilseed growing hubs
• Uganda has only one oilseed breeder based in Serere • Low Processing capacity: The current total installed capacity is 1000 Mt/day but
actual operational capacity is 400Mt/day due to; o low production (mismatch between production and processing capacity) o inefficiency in machine operation o Irregular power supply o Low yielding variety – 800-900/hectare o High postharvest losses at 30 percent
• The lack of a stand-alone policy and guidelines for the oilseed sub-sector
Palm Oil Trees
Palm production in the country is mainly in the Lake Victoria islands of Kalangala and Buvuma districts16, with a high level participation from the outgrowers. The farmers sell their produce to the aggregators, that is, Kalangala Oil Plam Growers Trust (KOPGT) and Oil Palm Uganda Limited (OPUL). The annual target for farmers in FY 2014/15 was to produce and sell 13,309 Mt of Fresh Fruit Bunches (FFB) to OPUL. By 30th June 2015, a total of 14,559 tonnes of FFB were produced and sold to OPUL at a gross value of Ug shs 5.4 billions (US$ 1.6 million). However, whereas production of FFB was generally on an increasing trend and performed above target, the price of the fruits declined in the first half of the year and rose modestly by the end of the FY (Figure 23), which negatively affected the returns to farmers (MFPED, 2015a)
Figure 23: VODP FFB production and prices by 30th June 2015
Source: MFPED (2015)
15 Sunflower requires high levels of fertiliser use and yet only 1 percent are currently using the right type and amounts of fertilisers 16 The crop was introduced in Buvuma in 2012 and the trees are yet to fruit
-
500
1,000
1,500
2,000
Jul-1
4
Aug-
14
Sep-
14
Oct
-14
Nov
-14
Dec-
14
Jan-
15
Feb-
15
Mar
-15
Apr-
15
May
-15
Jun-
15
FFB production (tonnes) FFB prices (Ugshs)

47 | P a g e
Crude oil production The crude oil is transported using a hired vessel to Jinja for refinement into fortune cooking oil where about 22 percent is realized from the fruit and the waste is used as fiber fertilizers for the oil palm plantations. Given the observed increasing trend of FFB, there was an increasing trend of crude oil production from the year 2010 to 2013, with the production rising from 4,692 metric tonnes in 2010 to an output of 19,000 metric tonnes in 2013.
The major constraints to oil palm are:
Low price of FFB associated with the outdated pricing formula and inadequate voice of farmers on the pricing committee
High costs of transporting the FFB to the mill, due to higher prices of fuel compared to the prices in Kampala
Wastage of FFB associated with the poor road network resulting in failure of KOPGT to collect the fruits from the farms. “During the rainy season when the roads are impassable, the KOPGT vehicles that are loaded with fruits get stuck for more than a day. By the time the FFB are delivered to OPUL for processing, the quality of fruits is poor resulting in high volumes of rejects” said the KOPGT General Manager
Inadequate extension services given to farmers to control pests and diseases and improve agronomy
Interrupted implementation of project due to land wrangles between the investor, landlords and Local governments
Opportunities
Newly mobilised land for production in Kalangala and Buvuma districts A lot of palm oil is imported into the country from Indonesia and Malaysia
which is an opportunity for increasing local production
3.3.8 Flowers
Commercial floriculture farming in Uganda started around 1992 as one of the non-traditional cash crops. Gabre-Madhin and Vette (2004) reported that floriculture was introduced in Uganda after the decline in volume and value of some traditional cash crops i.e. tea and cotton. According to USAID (2006), by mid-2004, Uganda’s commercial flower industry was making significant economic contribution to the country and one of the fastest growing businesses in the country. The good climatic conditions and the abundant “cheap” labour had favoured the growth of the industry. By the year 2012, about 178 hectares of land had been put under operation by the flower industry, of which 145.5 hectares was under roses, 30.5 devoted to chrysanthemums, and 2.1 hectares producing potted plants and foliage (NAPE, 2012).

48 | P a g e
Anecdotal information from the Uganda Flowers and Exporters Association (UFEA) indicated that there were 19 registered companies involved in flower growing and export activities. While three of these companies were wholly-owned subsidiaries of Dutch multinationals (Fiduga17, Wagagai, Royal Van Zanten Ltd), five of them were joint ventures by Ugandans with various foreign interests. The rest of companies were wholly owned by Ugandans. Most flower firms were located near Lake Victoria due to the favourable micro-climatic conditions, as well as in close proximity to the Entebbe International airport. The furthest flower firm from the airport is located in Ntungamo district about 300 Km southwest of Kampala.
Uganda’s floriculture exports were targeting two segments of the market: cut flowers and cuttings with emphasis on Roses and Chrysanthemums (Caption 8). The volumes exported between 2007 and 2014 have to some extent reduced for the Roses, while a slight increase is observed for the cuttings (Table 7).
Caption 8: The Flower Farms
Table 7: Performance statistics of flower exports
Year Volume of roses (tons)
Volume of cuttings (tons)
Total Value of flower exports (US$ million)
2007 5167 1392 32.05 2008 5547 1252 34.15 2009 5058 1410 30.39 2010 3947 1414 28.24 2011 4214 1550 28.41 2012 4440 2000 36.30 2013 4988 2646 46.01 2014 4759 2051 38.70
Source: UFEA
17 Fiduga is further divided into two trading subsidiaries

49 | P a g e
The Netherlands is the major destination for Uganda’s flower exports taking a share of about 85 percent of the total exports (Table 8). Other destinations include the UK, Germany, South Africa and Italy.
Table 8: Proportionate share of the total flower export values
Destination Proportionate share (%)
2010 2011 2012 2013 2014 Netherlands 83.8 82.7 84.0 85.8 85.2
UK 4.5 4.8 3.8 3.5 3.1
Germany 3.4 2.7 3.0 2.8 2.4
South Africa 3.7 4.0 3.2 2.3 2.1
Italy 0.5 1.2 0.8 1.5 1.7
Source: UEPB
Comparing the global market share, Uganda’s flower exports are reducing over time (Table 9), which has been attributed to:
• The highly competitive market with existing regional giants like Ethiopia and Kenya who diversified in other high value flowers
• The high unit cost of production (low profit margins) partially attributed to high energy costs and transport/freight costs
o Whereas flower production is heavily dependent on electricity, the electric tariff in Uganda is at US eighteen cents per kWh as compared to US six cents per kWh in Ethiopia
o Since Uganda does not have its own airlines, it has to depend on Kenya, Ethiopia, Emirates and other airlines, yet some of them have to make stop overs in some countries which affects the flowers in transit. This often leads to low prices for the Ugandan products
• Uganda has limited incentives for investors in the sector. For example, Ethiopia gazetted a very large area specifically for flower production, thus attracting investment in flowers as compared to Uganda
• Expensive inputs such as fertilizers and chemicals • Limited national/government interest and support to the flower industry • Multiple, expensive and continuously changing standards and quality
requirements • Limited investment in market research as well as trials in new varieties
Table 9: The Global Flower Exports 2001-2012
Proportionate Global exports
2000 2001 2005 2011 2012
% share for Sub-Saharan Africa 4.7% 6.1% 8.5% 9.7% 13.3%
Of which :
Kenya 75.0% 71.1% 61.1% 67.4% 48.4%

50 | P a g e
Ethiopia 0.1% 3.6% 22.2% 18.8% 43.2%
Uganda 6.0% 0.6% 0.01% 0.01% 0.01%
The above challenges are likely to affect the future of Uganda’s floriculture industry through:
• More flower firms especially the Rose firms are likely to close. In 2006, there were 22 farms of which, only 13 farms were reported to exist in 2015. Of these, 3 farms are growing roses but are also considering closing if the market situation does not improve
• Loss of foreign exchange earnings • Loss of jobs for almost 8500 employees
However, some critical areas of improvement were cited by the stakeholders including among others;
Uganda flower farmers should concentrate on flower varieties that perform well in the tropics to reduce on the competition and increase profit margins.
Government and the private partners should invest in a flower industrial park with the required infrastructure
Set up a distress fund to investigate global market changes that are beyond the control of farms but affect the industry
Pay attention to and include the industry in all agricultural programs Investment in diversifying into foliage and expanding cuttings production
Fortunately, there are several institutions that are providing support to the sub sector (Appendix 6). The support includes finances, research information, supply of chemicals, advocacy, licencing, regulation and monitoring.
3.3.9 Horticultural Crops The horticultural subsector includes fresh vegetables and fruits, as well as flowers. The specific crops (excluding flowers) include hot pepper, white garden eggs, chillies, avocadoes, pineapples and okra. Production of fresh vegetables and fruits used to be in proximity to the major airport (Entebbe International Airport) but has now extended to other places far away from the airport. The key commodities exported are the Capscums (Hot pepper Habanero Capscum, chillies, e.t.c.) and the white garden eggs. This market scan was however unable to obtain the production and/export statistics for the different crops.
The major destinations for horticultural exports include the Netherlands, Belgium, France, UAE, Sweden and the UK. The exporters formed an association known as Horticulture Exporters Association (HorTexA), which was later joined by the farmers to make it easier to address safety and quality concerns of the export markets. For sustainability of the HorTexA operations and the fresh vegetables and fruits sub-

51 | P a g e
sector, the association has registered a company (Farmex) to handle the business operations.
The Ministry of Trade, Industry and Cooperatives (MTIC) together with the Ministry of Agriculture, Animal Industry and Fisheries (MAAIF) are in charge of ensuring compliance to the sanitary and phytosanitary requirements in this subsector. While there are many challenges in ensuring compliancy to the SPS requirements and achieving the set standards for export, the responsible agents have in some instances registered some milestones. For example, in 2015, MTIC and MAIIF a two weeks self-ban (suspension) on the export of hot pepper (Habanero Capscum). This was mainly due to the presence the False Coding Moth, a pest that greatly damages the product. The purpose of the suspension was to allow re-assessment of exporters (and producers) to establish on the level of compliance and to institute measures for quality, pest and disease control at the packing house and farm-level. The self-imposed ban was also to prevent a total ban from the EU market on the export of hot pepper which would lead to a suspension for about 4 years. The self-ban brought about a reduction in export levels, which in turn led to loss of income at all levels of the value chain. However, whereas some exporters were affected, this gave them an opportunity to abide by the set standards which in turn would increase their market base and demand.
Challenges in subsector; • The demand for Ugandan fresh vegetables and fruits is increasing but the
subsector is currently unable to meet the volumes due to poor production methods
• The False coding Moth (FCM) is still a big problem for the producers • The government has failed to regulate the quality of inputs (seed, fertilizers,
pesticides and herbicides) either produced within the country or imported • The prices for the genuine inputs are exorbitant • There is lack of a quality management system within the fresh fruit and
vegetable chain • Pack house standards are basic, with limited phytosanitary protocols for the
commodities during production and packaging • Limited market research (on trends) to identify standards required by the
export markets
3.4 The Cross-cutting Challenges and Opportunities in the crop sector
While the above sections present crop/enterprise-specific challenges and opportunities, there are several cross-cutting issues. The cross cutting opportunities include;

52 | P a g e
• The conducive business environment and good political will evidenced by the government economic policy that encourages value addition to agricultural commodities
• The expanding local, regional and international markets for the different products. The growing internal demand is partially attributed to the growing populations and increasing purchasing power.
• Government’s support to value addition initiatives • Tax-free imports for agro-processing equipment • The presence of trainable labour force • Availability of arable land
The cross cutting challenges include: • Production level
o High dependence on rain-fed agriculture amidst unpredictable and unfavourable weather conditions (prolonged droughts and floods)
o Inability of farmers to access finances/credit due to high lending rates (23 to 30 percent per annum). This has to a great extent constrained their access to improved planting materials, fertilisers, pesticides and farm equipment
o High production costs (expensive inputs and transport) leading to low returns to the farmers
o Limited crop=specific extension services o Pests and diseases leading to high crop losses
• Post-harvest o Poor/ Lack of storage facilities
• Processing, Transporting and Marketing o High cost of electricity and diesel thus increasing cost of operation and
limits the adoption of small-scale processing facilities o Inefficient marketing system as reflected by low farm gate and fluctuating
commodity prices o Poor road infrastructure (especially in the rural areas/key production
centers) which curtials access to markets o Lack of farmer ogranisations (c00peratives) limits collective sales or
transportation o Limited access to reliable markets as well as market information especially
for the non-traditional cash crops
3.4 The Livestock Sub-sector
The livestock sub-sector is composed of cattle, goats, sheep, pigs, fish and poultry. The Government of Uganda has several enabling policies to guide the development and transformation of the sub-sector. The policies include The Dairy Master Plan (1993); The Dairy Industry Act (1998); The Dairy (Marketing and Processing of Milk and Milk products) Regulations (2003); The Public Health Act (1935); The Animal Diseases Act (1964), the Hides and Skins Act (1964); The Veterinary Surgeons Act (1970); The

53 | P a g e
Animal Straying Act (1964); The Animal (Prevention of Cruelty) Act (1957); The Animal Breeding Act (2000); The Cattle Grazing Act (1964);The Public Health Act (Meat and Milk Rules) (1964) and the Code of Meat inspection Uganda (1973). Other relevant laws include the Food and Drug Act (1964), the National Drug Authority Policy and Statute (1994) and the National Bureau of Standards (1993 and 1998), as well as Uganda’s international obligations (GoU, 2000).
The transformation of the sector is driven by an increasing consumer population, growing production, driven by increased productivity, growing processing capacity, growing incomes and increasing urbanization. The Dutch Embassy and Agriterra implemented a livestock market scan18 which highlighted opportunities in Uganda’s livestock sector in 2013. This agribusiness market scan reiterates the major findings including currents and emerging trends.
The total cattle population is estimated at 13.6million of which 12.7million (93.3 percent) are indigenous and 914,000 (6.7 percent) are exotic (Caption 9). The total annual milk production was 1.549billion litres in 2014 of which745 million (48 percent) litres were from indigenous breeds and 804 million (52 percent) litres were from exotic breeds. Beef production on the other hand, increased from 180,300 Mt in 2010 to 202,929 Mt in 2014. The beef subsector is dominated by low productive indigenous breeds raised under extensive management systems. The inherent features of indigenous livestock are survival rather than productivity, hence their small body size. Factors such as disease, inadequate nutrition and water scarcity coupled with low body size and low milk yield means that indigenous animals grow slowly and often attain market weights at 5 years of age or more. Most slaughtered animals are culled animals. Following the privatisation of government ranches, the population of improved cattle breeds diminished. Few farmers’ rear improved beef animals (Boran, Bonsmara, Brahman and crosses) on small scale and medium sized farms. There is need for introduction of animal breeds that mature fast and also give quality meat but all this must be accompanied by improved animal health and feeding practices.
Production for sheep, goat and pigs exhibits a slow growth rate (UBOS, 2015). Table 10 shows the population and production of meat from the selected livestock categories.
18 Reported downloaded from https://www.agriterra.org/en/stories/58053/opportunities-in-the-livestock-sector-in-uganda?page=6

54 | P a g e
Table 10: Number of other Livestock and their Products, 2010-2014
Year Livestock Numbers
(Thousands) Meat production (Mt)
Sheep Goats Pigs Goat/Mutton Pork 2010 3621 13208 3378 33,619 19,669 2011 3730 13604 3480 34,627 20,259 2012 3842 14012 3584 35,666 20,867 2013 3937 14614 3692 36,736 21,493 2014 3842 14011 3584 37,838 22,138
Source: UBOS, 2015
Caption 9: The Indigenous and exotic cattle breeds
3.4.1 Export of Live Animals and Meat Products The livestock market scan commissioned by EKN in 2012 established that export of beef to regional markets was still very low, due to failure to meet sanitary and phytosanitary standards in external markets. The number and quality of modern abattoirs is still very low, with only two operational abattoirs-Uganda Meat Industries and City Abattoirs. In rural areas, slaughter slabs are often used as abattoirs and thus compromise beef quality. Uganda lacks basic abattoirs that can be upgraded to meet international standards and requirements, a situation that has led to fewer exports of beef and beef products. Uganda’s major Beef processors, Fresh Cuts Uganda Limited used to supply regional markets in DRC, South Sudan and Somalia but lost the market due to failure to meet safety and quality requirements.
Consequently Uganda’s livestock export opportunities are related to sales of live animals and selected meat products such as loin, minced meat, and sausages and boneless. In general, the prevalence of diseases, sub-standard abattoirs and high local demand limits beef exports. Beef exports to developed markets remain unfeasible for the foreseeable future but potential for export exists to regional markets due to low production costs and competitiveness. Southern Sudan is emerging as a major destination for Uganda’s meat products. Consultations with beef sector stakeholders reveal a need for investments in appropriate infrastructure and enactment of
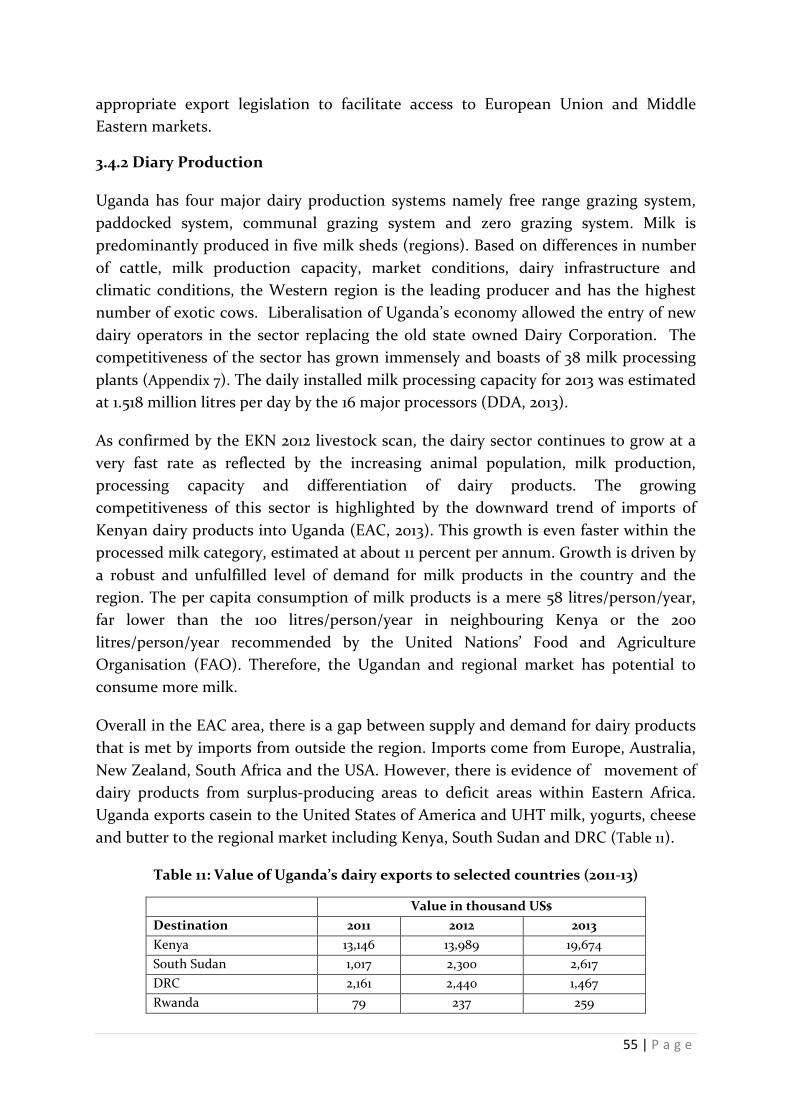
55 | P a g e
appropriate export legislation to facilitate access to European Union and Middle Eastern markets.
3.4.2 Diary Production
Uganda has four major dairy production systems namely free range grazing system, paddocked system, communal grazing system and zero grazing system. Milk is predominantly produced in five milk sheds (regions). Based on differences in number of cattle, milk production capacity, market conditions, dairy infrastructure and climatic conditions, the Western region is the leading producer and has the highest number of exotic cows. Liberalisation of Uganda’s economy allowed the entry of new dairy operators in the sector replacing the old state owned Dairy Corporation. The competitiveness of the sector has grown immensely and boasts of 38 milk processing plants (Appendix 7). The daily installed milk processing capacity for 2013 was estimated at 1.518 million litres per day by the 16 major processors (DDA, 2013).
As confirmed by the EKN 2012 livestock scan, the dairy sector continues to grow at a very fast rate as reflected by the increasing animal population, milk production, processing capacity and differentiation of dairy products. The growing competitiveness of this sector is highlighted by the downward trend of imports of Kenyan dairy products into Uganda (EAC, 2013). This growth is even faster within the processed milk category, estimated at about 11 percent per annum. Growth is driven by a robust and unfulfilled level of demand for milk products in the country and the region. The per capita consumption of milk products is a mere 58 litres/person/year, far lower than the 100 litres/person/year in neighbouring Kenya or the 200 litres/person/year recommended by the United Nations’ Food and Agriculture Organisation (FAO). Therefore, the Ugandan and regional market has potential to consume more milk.
Overall in the EAC area, there is a gap between supply and demand for dairy products that is met by imports from outside the region. Imports come from Europe, Australia, New Zealand, South Africa and the USA. However, there is evidence of movement of dairy products from surplus-producing areas to deficit areas within Eastern Africa. Uganda exports casein to the United States of America and UHT milk, yogurts, cheese and butter to the regional market including Kenya, South Sudan and DRC (Table 11).
Table 11: Value of Uganda’s dairy exports to selected countries (2011-13)
Value in thousand US$ Destination 2011 2012 2013 Kenya 13,146 13,989 19,674 South Sudan 1,017 2,300 2,617 DRC 2,161 2,440 1,467 Rwanda 79 237 259

56 | P a g e
Tanzania 457 434 527 Source: UEPB, 2014
It is evident that Uganda now has excess processing capacity which requires more investment in production systems to step up raw milk supplies. However, there are constraints relating to; Low productivity at farm level; The diary breeds are of low genetic potential coupled with poor feeding and animal health management practices; Seasonality of milk production; Poor quality milk; Infrastructural inadequacies such as poor road access to most of the high producing areas; intermittent and inadequate electricity supply, absence of cooling facilities and cold chain transportation trucks; poor quality water critical in preserving milk quality at the farm; big informal diary trade (80 percent); and subsistence methods of diary production.
3.4.3 Hides and Skins
The other key product for export is hides and skins, which are among the top 6 agricultural exports contributing 2.4 percent of the agricultural export value. The trend for volumes exported since 2000 indicate rapidly increasing volumes since 2009 (Figure 24) with Switzerland and China as some of the lead destinations (Table 12).
Figure 24: Volumes of Hides Exported (2000-2010)
Source: UBOS Statistical Abstracts
Table 12: Proportionate share of Export values for Hides and Skins
2010 2011 2012 2013 2014
Total value of Exports (Mill Us$) 17 33 41 64 73
Lead Destinations
Switzerland 10% 18% 37% 40% 37%
China 59% 39% 38% 28% 29% Italy 7% 15% 10% 9% 17% UAE 0% 0% 0% 9% 12% India 3% 6% 2% 1% 3%
0
10,000
20,000
30,000
40,000
2000
2001
2002
2003
2004
2005
2006
2007
2008
2009
2010
2011
2012
2013
2014
Tonn
es
Year

57 | P a g e
3.4.4 Inputs for the Livestock sector
• Animal feeds: The quality of imported feeds is being controlled through the Public Health Act, the Veterinary Department, UNBS and the National Drug Authority (NDA) through the relevant acts and regulatory frameworks as the country waits for enactment of a law to enforce the Policy
• Semen: imported semen must be free from any diseases and infections. The semen is mainly for upgrading purposes of the local stock. The semen mostly comes from South Africa, Kenya and other places. There are no restrictions on where the semen comes, as long as it is free from diseases.
• Veterinary medicines: anyone can import veterinary medicines, provided, that person has suitable and registered premises for storing the drugs as well as a veterinary doctor and a pharmacist to prescribe the medicines. The Commissioner responsible for veterinary services in MAAIF is the importing Authority who writes to the NDA to certify the drugs at the cost of the importer.
3.4.4 Poultry
The poultry composition estimated in the country consisted of 88 percent (of the estimated 44.6 million birds in 2014) indigenous birds (Table 13). Increasing demand for poultry products has resulted in rearing of more exotic breeds by poultry farmers due to their high productivity.
Table 13: Poultry numbers in millions by breed (2010-2014)
Year No. Birds (‘000) Egg production
Indigenous Exotic Indigenous Exotic 2010 40,350 2,850 34,834 4,879 2011 35,879 5,025 35,879 5,026 2012 36,955 5,176 36,956 5,177 2013 38,064 5,331 38,064 5,332 2014 39,206 5,492 39,206 5,492
Source: UBOS, 2015
The poultry subsector has small, medium and large-scale operators engaging in production of both the stock (birds) as well as the poultry feed. An example is the Biyinzika Poultry international (Caption 10 and Caption 11) which is a large scale enterprise. A situation analysis earlier presented in the livestock market scan is presented (Figure 25).

58 | P a g e
Caption 10: Animal feed mill at Biyinzika Poultry International
Caption 11: Pelleted chicken feed at Biyinzika Poultry International
Figure 25: A SWOT Analysis for the Poultry sub-sector
Strengths Weaknesses • Poultry requires less land than crop agriculture
and other livestock enterprises. • Poultry requires relatively smaller capital
investment in comparison to other livestock • Poultry has short generation intervals and,
therefore, quicker returns on investment. • High potential demand for poultry and poultry
products
• Constrained supply and quality of day old chicks
• Costly Feeds with seasonal fluctuations in availability and quality
• Costly veterinary drugs with constraints in quality
• Rampant outbreaks for poultry diseases
Opportunities Threats • Government support to poultry sector as
poultry is considered strategic commodity in DISP
• Human competition for inputs for the feeds • Possible outbreaks of incurable diseases like
avian influenza • Failure by authorities to enforce quality
standards in feeds production • Protectionist laws in neighboring countries
hindering export Source: EKN, 2012
3.5 Fish and Fish Products
The water bodies in Uganda are known for different types of fish with Tilapia, Nile Perch and Silver fish as the most commonly traded (Caption 12). Fish in the country is majorly from Lakes Victoria and Albert with the largest share of the catch contributing to about 86 percent of the total catch. The increase in fish catch in L.Victoria is attributed to increase in the catch of silver fish while a decrease in catch in Lakes Kyoga and Albert were attributed to the use of illegal equipment and methods of fishing (UBOS, 2015). The total fish catch has continued to rise since 2006 at 367,200 tonnes up to 461,726 tonnes by 2014 (Figure 26). L. Victoria has the highest and increasing fish catch over the years. The main export destinations include Hong Kong,

59 | P a g e
Belgium and the Netherlands (Table 14), and DRC within the African continent (Table 15).
Caption 12: Some of the Fish and fish products
Figure 26: The Production and Export of Fish and Fish Products (2000-2010)
Table 14: Values of fish exported to the major destinations (2010 to 2015)
Country Year
2010 2011 2012 2013 2014 Total export Values (in millions (US $)) 133.82 142.47 121.3 106.99 134.09 Export Values for 5 lead destinations (in millions (US $)) 64 82 80 86 98
Proportionate share of the 5 lead destinations 47% 58% 66% 80% 73%
Individual Country Share (%) Hong Kong China 25% 33% 29% 26% 35%
Belgium 36% 35% 39% 38% 26%
Netherlands 28% 18% 18% 21% 23%
UAE 4% 5% 5% 12% 9%
Israel 8% 8% 8% 4% 7% Source: BoU (2016) and UEPB
-
100,000
200,000
300,000
400,000
500,000
2000
2001
2002
2003
2004
2005
2006
2007
2008
2009
2010
2011
2012
2013
2014
Tonn
es
Year
Total FishCatch Exports

60 | P a g e
Table 15: Proportionate share of the Value of Fish exports to EAC19
Country Proportionate share
2010 2011 2013 2014 DRC 0% 67% 15% 48% Kenya 71% 0% 44% 33% Sudan 1% 31% 42% 19% Tanzania 28% 1% 0% 0%
Source: UEPB
Fish Farming
Fish farming in the country is currently practiced mainly in the districts of Wakiso, Kalangala, Buikweand Jinja under two methods, i.e. cages and ponds. Production in cages is more than in ponds, due to the ease in operations and management. The activities of fish farming are guided by the Department of Aquaculture which is responsible for guiding, promoting and supporting the aquaculture sector (fish farming) along the entire value chain from inputs to supporting market linkages as well as establishing standards/regulations. There are deliberate efforts to promote producers and/or guide investors in complying with production procedures, standards and linking with source of inputs (feed and fingerlings). The sector is however still young with about 25,000 fish farmers of whom, about 20-30 percent are large scale farmers. The average area per farmer is 1000 Sq.Metres.
Fish farming requires inputs such as fingerlings, and there are about 10 private hatcheries that operate fulltime in addition to other smaller ones. The government through MAAIF is in the process of operationalizing 4 regional hatcheries (Kajansi, Mbale, Bushenyi and Gulu). While reliable and good quality fish feed is a pre-requisite for sustaining the aquaculture industry in Uganda, fish feed is still very expensive. The major sources of fish feed protein (silver fish and soybean) have become expensive. Fish feed producers in Uganda include Ugachick Poultry Breeders, National Fisheries Research Institute Kajansi (Under NARO), IG Invest in Jinja and Ferdisult in Lugazi.
A situation analysis for the fish subsector reveals several strengths, weaknesses, opportunities and threats. While the key strengths are the presence of diverse species for export as compared to other EA countries and the looming regional and international market for fish and its products, the key threat is that there is informal trade of fish in the regional markets.
19 Most of the fish exported to the EA region is not captured because it is under informal trade

61 | P a g e
Weaknesses
• Fish catch as several fish landings are not recorded and therefore there is no reliable fish statistics in the country
• There is a limit to the quantity of fish that should be exported stipulated by the national policy to 60,000 Mt (raw material equivalent) per year. However, there is no legal instrument to enforce the policy Fish farming
• The supplied fish seed is sub-standard /poor quality and inadequate • Factory formulated feeds are expensive accounting for 60 percent of the total costs
of production • Lack of market infrastructure and market information system. There is no platform
for producers, buyers and other stakeholders to interface • There is no proper marketing channels for the fish fingerlings • The quality of fingerlings is poor due to overuse of the brood stock and concerns of
inbreeding • The feed quality for young fish is poor and expensive • High operating costs for hatcheries • The lack of investments in water harvesting exposes the fish under breeding
programs to stress especially during prolonged droughts Opportunities • Presence of the Uganda Fish Processors and Exporters Association (UFPEA), that
ensures fish quality control and modern standards of hygiene before export • Concessions offered for cage farming: An environmental impact assessment is
carried out for the investor by the National Environment Management Authority (NEMA) in collaboration with Aquaculture department
• There are several water bodies including Lakes Victoria, Albert, Kyoga, Edward and any of the demarcated 165 minor lakes with adequate depth
• In the EU, there are 10 main importers of Nile patch, and the main importers are Fiorital (Italy), Caladero (Spain), Nieterlof (Holland), Anova (Holland), and Icemark (Belgium) of which the last two have operations in Uganda
• The government’s interest in promoting acquaculture from which fish can be obtained to maintain and boost fish exports
o The aquaculture department has mapped out areas (within water bodies) that are suitable for cage farming and can be availed to investors who are able to obtain an agreement with user communities
o An average of 20sq Miles (in designated aqua parks) to be allocated to new entrants who would like to engage in commercial fish production

62 | P a g e
4.0 FACTORS INFLUENCING UGANDA’S AGRIBUSINESS POTENTIAL
This section provides an in depth review of different factors that have enabled/have a potential to enable or constrained/have a potential to constrain agribusiness development.
4.1 The Business Environment
Uganda improved at the ease of doing business ranking by World Bank from 135 (in 2015) to 122 (in 2016) out of 189 economies. The quantum leap was explained by an improvement in getting credit which moved by 86 positions from 128 to 42; and improvements in dealing with construction permits, getting electricity and resolving insolvency. Rwanda ranked best within the East African region at 62, Kenya at 108, Tanzania at 139 while Burundi was ranked 152. Table 16 provides the doing business indicators in Uganda compared to the East African countries.
Table 16: Doing Business Indicators for Uganda compared to other East African countries
Uganda Burundi Kenya Rwanda Tanzania
Indicator 2016 2015 2014 2016 2016 2016 2016
Starting a Business 168 168 162 19 151 111 129
Dealing with construction permits
161 166 162 165 149 37 126
Getting Electricity 167 172 181 185 127 118 83
Registering Property 120 125 120 94 28 12 133
Getting credit 42 128 125 174 28 2 152
Protecting minority investors
99 98 108 115 115 88 122
Paying taxes 105 101 101 111 101 48 150
Trading across boarders 128 126 163 154 131 156 180
Enforcing contracts 78 78 79 146 102 127 64
Resolving insolvency 104 106 126 145 144 72 99
Source: World Bank, 2016
Uganda made starting a business easier by introducing an online system for obtaining a trading license and by reducing business incorporation fees. In terms of access to credit, the credit bureau expanded the borrower coverage, thus improving access to credit information. On getting electricity, Uganda reduced delays for new electricity connections by deploying more customer service engineers and reducing the time needed for the inspection and meter installation.
Trading across borders was made easier by implementing the Automated System for Customs Data (ASYCUDA) World electronic system for the submission of export and

63 | P a g e
import documents. In 2015, Uganda made resolving insolvency easier by consolidating all provisions related to corporate insolvency in one law, establishing provisions on the administration of companies (reorganization), clarifying standards on the professional qualifications of insolvency practitioners and introducing provisions allowing the avoidance of undervalued transactions.
However, the country slightly declined in paying taxes, registering property and protecting minority investors. It was noted that Uganda made transferring property easier by eliminating the need to have instruments of land transfer physically embossed to certify payment of the stamp duty. The decline on this indicator was therefore a result of major improvements by other economies (WorldBank, 2016).
Besides providing infrastructure and a stable macroeconomic environment, Government through the Uganda Investment Authority (UIA), Uganda Registration Services Bureau (URSB), Uganda Revenue Authority (URA), Ministry of Lands, Housing and Urban Development (MLHUD), and Ministry of Internal Affairs provide a range of other public services in support of trade and agribusiness. These include: business registration; trade and investment licensing; trade and investment facilitation; trade and investment finance; immigration services; and industrial research and innovation support.
The major constraints affecting doing business in Uganda include; poor access to finance, corruption, high tax rates, inadequate supply of infrastructure, poor work ethic and Government bureaucracy. These constraints have hindered the growth of Uganda’s private sector. As of 2010, it was estimated that nearly 90 percent of the private sector were micro and small enterprises yet employing over 80 percent of the total workforce (GoU, 2013).
4.2 Development plans, Policies and Legal Frameworks
4.2.1 The National Development Plans and Legal frameworks
The Agricultural Sector Development Strategy and Investment Plan: This has been under implementation for the period 2010/11-2015/16, with a focus on four programmes; (i) Enhancing production and productivity, aiming at supporting Ugandans to engage in productive and profitable agricultural and agribusiness activities to ensure food security and increase household income; (ii) Significant improvements in market performance through facilitating access to high quality inputs, participation in value addition activities, expanded rural network infrastructure, improved capacity for regulation and enforcement of standards among others; (iii) providing an enabling environment involving a body of statutes, regulations and standards to remove critical constraints to private sector growth; supporting opportunities that improve market efficiency, and; improving the incentive

64 | P a g e
environment facing the private sector in the key market chains; and (iv) Development of institutions to deal with structural challenges faced under MAAIF since most of the agriculture sector challenges were compounded by institutional challenges. Support structures that were expected included the restructuring MAAIF to create an Agribusiness, and Regulatory Services Departments in each of the three ‘commodity’ directorates of Crop Resources, Animal Resources and Fisheries (MAAIF, 2010).
The National Development Plan-II: The National Development Plan-II is expected to be implemented through 2015/16 to 2019/20 financial years, seeking to leverage opportunities and honour obligations presented by emerging developments at the national, regional, and the Continental levels, as well as the global level (the Post 2015 Development Agenda). Within the agricultural sector, the plan proposes government support and investments in 12 agricultural value chains namely Cotton, Coffee, Tea, Maize, Rice, Cassava, Beans, Fish, Beef, Milk, Citrus and Bananas. The areas of particular attention will be strengthening agricultural research, implementing a single spine extension system, technology adoption at the farm level, increasing access to and effective use of critical farm inputs, promoting sustainable land use and soil management, increasing access to agricultural finance with specific options for women farmers, and strengthening agricultural institutions for effective coordination and service delivery. This is expected to lay the foundation for establishment and expansion of agro-processing in the country. The plan recognises stages along the value chains of the selected enterprises where interventions will be focused, as well as offering potential leverage points for entry of various players and key stakeholders to do business.
4.2.2 The National Legal and regulatory frameworks
Uganda has a number of policies and legislations that are directly or indirectly contributing to the development of the agribusiness sector. These include those that govern the sectors and the sub sectors such as the National Agricultural policy (2011) aimed at promoting a competitive, profitable and sustainable agricultural sector; Trade and Investment policy, National Industrial Policy (2008) with a principle focus of transforming Uganda into a modern and industrial country through adding value by processing to reduce post-harvest losses and by increasing exports of higher value products, especially from agricultural and mineral resources; Trade policy (2007) with an objective of developing and nurturing private sector competitiveness, and to support the productive sectors of the economy to trade at both domestic and international levels; National Land Policy (2013) whose third vision attribute is to shift an estimated 65 percent of peasants from subsistence to commercial agriculture to move out of poverty and attain food security using land as the major resource input. There is a multitude of sector-related legal and regulatory frameworks under implementation (Appendix 8).

65 | P a g e
Uganda has regulations managing financial flow within the country and the major ones include Bank of Uganda Act (2000); Financial institutions Act (2004); Micro Deposit taking Institutions Act (2003) and Foreign Exchange Act (2004). Uganda is also part of the International Financial system under the Basel Accord framework which implies that Uganda has a fully-fledged Financial Stability Section at Bank of Uganda, a regular Financial Stability Report about the economy and Financial sector in particular which keeps individuals in the business sector well informed about financial matters in the country. During the amendment of the Financial Institution Act (2015), the Government of Uganda introduced Islamic Banking system that follows the Islamic Shari’ah (law) which is guided by Islamic economics (Mugerwa, 2016).
4.2.3 The regional frameworks
Uganda is a member of some key regional trade groupings including the COMESA in which Uganda is among the countries in the Fee Trade Area where member countries trade on duty-free and quota free terms subject to the Rules of Origin; and the EAC. The avenues have enabled the member countries to take part in an economic integration that involves increasing Trade Corporation. Through the EAC, tariffs and customs regimes have been harmonized and free movement facilitated with a common external tariff. The EAC Customs Union (EAC-CU) liberalized intra-regional trade in goods with exemption of tariff and non-tariff barriers among the three (Kenya, Uganda and Tanzania) states and enhanced domestic, cross border and foreign investment in the Community.
4.2.4 Global trade and trade related agreements
Uganda is a signatory to a number of global trade and trade-related agreements including the African, Caribbean and Pacific- European Union (ACP/EU) Partnership Agreement (Cotonou Agreement); the World Trade Organization (WTO); and the African Union (AU). Uganda is also a beneficiary of non-reciprocal unilateral trade preferences such as Everything But Arms (EBA) by the European Union; the African Growth and Opportunity Act (AGOA) of the United States in which Uganda has duty and quota free access to both United States of America and Europe; and offers by Canada, Japan and China under the Generalized System of Preferences (GSP), all of which have offered the country improved market access opportunities into the respective markets.
Uganda is a signatory to the Convention on the Multilateral Investment Guarantee Agency (MIGA) and the International Center for Settlement of Investment Disputes (ICSID); A party to the Convention on Recognition and Enforcement of Foreign Arbitration Awards, and the Convention on the Settlement of Investment Disputes

66 | P a g e
between States and Nationals of Other States; has signed an agreement with the United States' Overseas Private Investment Corporation (OPIC). Furthermore, the Cotonou Agreement that Uganda signed in 2000 contains a continuation of the principles embodied in the Lomé Convention between the ACP States and the European Union to protect European investments in the ACP countries (Articles 75, 76, 77, and 78). Therefore Uganda is not only a favorable state for investment from the EU countries, but also offers the private sector an opportunity to access two credit lines from the European Investment Bank (EIB) under risk capital resources, and from EIB's own resources. Uganda has signed investment treaties and double taxation treaties with a number of countries such as Belgium and Luxemburg, China, Cuba, Denmark, Kenya and the Netherlands (WTO, 2006).
Uganda and other developing countries with a potential future in agri-business achieved a new positive outcome from the 10th WTO Ministerial Conference held in Nairobi at the last quarter of 2015: the elimination of all form of export subsidies for farm exports. This package offers equal opportunities for all agricultural exporters and opens up opportunities for developing countries such as Uganda, to better compete in the global market. Uganda will also benefit from the specific measures agreed in favour of LDCs. For instance Cotton originating from least developed countries, such as Uganda, is given more favourable market access by WTO members. The certification of origin for exporters from LDCs will also be simplified. Access of services and service suppliers from LDCs is given preferential treatment by WTO members until 2030 (EU, 2015).
4.3 Existence of Internal and External Markets
4.3.1 The Internal Markets Uganda has posted impressive economic growth rates averaging 6-7 percent over the past decade way above Africa’s average of 5.1 percent since 2010. This strong economic growth resulted in increased demand for both processed and non-processed food products. Further, a rapid decline in poverty rates has ensured an expanding middle class with high purchasing power. The national poverty rate declined from 24.5 to 19.7 percent in 2009/10 and 2012/2013 respectively. Even with a fast growing population, the total number of Ugandans living below the poverty line declined from 7.5 to 6.7 million over the same period. There are now almost twice as many Ugandans in the middle class (MFPED, 2014). Consequently, a dynamic agri-food sector is gradually emerging with several business growth opportunities for both local and foreign enterprises, specifically SMEs. The biggest beneficiaries of the emerging agribusiness markets are smallholder farmers (suppliers), agri-processors and consumers.

67 | P a g e
4.3.2 The Regional Market Integration
Uganda’s location at the centre of the Great Lakes region and in the EAC offers Ugandan farmers access to a regional market with over 500 million consumers. Uganda enjoys pivotal trade partnerships and a viable market with other partner states in the EAC, Southern Sudan and the COMESA. The EAC presents a common market with a population of over 150 million consumers whereas COMESA, made up of 19 member states, has a population of about 470 million consumers as part of the Free Trade Area. Recent export growth has been stimulated by demand in neighbouring countries such as South Sudan which has emerged as an important trading partner demanding food and other manufactured materials.
Although each partner country faces unique challenges, a common expanded market offers the much needed trigger effect for economic growth. For example, although EAC states suffer uneven levels of competitiveness and productivity, coupled with varying policy and market inefficiencies, the level of appetite for regional integration remains high. The partner states are already implementing an integration programme premised on the objective of deepening economic, social and political cooperation, thus seeking to achieve balanced economic growth and development in the long term. The EAC integration process is on-going with achievements of the Customs Union20 , Common Market21 and the signing of the Monetary Union Protocol. EAC Partner states reached an agreement on the policy and institutional framework for a Single Customs Territory, which was launched in January, 2014. The Single Customs Territory framework has three pillars of free circulation of goods, revenue management system and legal and institutional frameworks, each with guiding principles and respective pre-conditions for implementation.
Agriculture and agribusiness sectors are pivotal to fuelling the EAC integration since all partners states are agrarian-based economies with other upcoming sectors such as services, energy and tourism. The observed growing volumes of freer flow of capital, goods, services, skilled labour and technology are an indication that indeed market integration has the necessary catalytic effect on trade. Overall intra-EAC businesses are enjoying many benefits as a result of the economic integration. For instance there has been implementation of a single window environment that provides one “entrance” either physical or electronic, for the submission and handling of all data, and documents related to the release and clearance of international transactions. This has enhanced trade by cutting costs through reducing delays; faster clearance and release; predictable applications and
20 Charging the same import duties to allow free flow of trade, launched in January 2014 21 Imposing few or no duties on trade with one another and a common tariff on trade with other countries

68 | P a g e
explanation of rules as well as more effective and efficient deployment of resources (EAC, 2014).
4.3.3 The Global markets
Uganda’s commitment to the various international trade agreements and protocols has greatly enhanced its trade with international partners. In general, the EU remains Uganda's third largest trading partner after Asia and COMESA, with a trade volume standing at USD 823 million in the 1st three quarters of 2015. Uganda’s exports to EU account for 20 percent of the total Uganda exports. Trading in Uganda provides the opportunity for duty and quota free access into China (quota free access for over 650 products), as well as access to the USA (AGOA), Generalized System of Preferences (GSP) scheme and EU (EBA) markets.
4.4 Trade and Investment Licensing, and Regulations
Government has devoted effort to the development and promotion of a competitive and export-oriented industrial sector, and thus a range of routine public services are provided by Government in this regard. These services are aimed at promoting improved product competitiveness through strengthening quality assurance and standards development.
Uganda Investment Authority: The Uganda Investment Authority (UIA) was established under the Investment Code law of 1991 with the overall objective of attracting Local and foreign investments in Uganda by providing more favorable conditions for investment, and to provide for other related matters. The UIA therefore is responsible for providing regulations of investments including licensing investments, acquisitions of land, provision of incentives for investments (for example land for investment in particular for agro-processing) and revocation of investment licenses among others. In 2014, UIA instituted a One-Stop-Centre where investors can register their businesses and get all relevant licenses related to their business at one point. Government is also developing an integrated on line system (electronic one stop centre) that will link all the government agencies that deal with licensing business in Uganda to reduce transaction costs. In the interim, the Investment License as well as other investment needs like industrial land can be applied for online via the UIA website www.ugandainvest.go.ug.
Uganda Registration Services Bureau: The Uganda Registration Services Bureau (URSB) is mandated to among others register business names, companies, business documents, intellectual property like trademarks, patents, copyrights, utility models and designs. The activities of the agency are guided by the Trade Mark Act 2010 and Trade Mark Regulations 2012; the Trade Secrets Protection Act 2009; the Patents Act

69 | P a g e
as amended in 2002 and Patents regulations; and the Copyrights and Neighboring Act 2006.
Uganda National Bureau of Standards: The Uganda National Bureau of Standards (UNBS) is a statutory body under the Ministry of Trade, Industry and Co-operatives that is responsible for the standardization of commodities and for matters incidental and ancillary thereto, including but not limited to: formulation and promotion of the use of standards; enforcing standards in protection of public health and safety and the environment against dangerous and sub-standard products; ensuring fairness in trade and precision in industry through reliable measurement systems; and strengthening the economy of Uganda by assuring the quality of locally manufactured products to enhance the competitiveness of exports in regional and international markets. The bureau participates in harmonization of the national standards with regional bodies including the EAC, COMESA, South African Development Community (SADC) and it is accredited to the International Standards Organisation (ISO). The body carries out certification of the products using Q and S marks with the appropriate laboratories for testing the products to ensure compliance. Further, the body provides training and consultancy services which are paid for by the companies seeking for them. These trainings are usually offered to all the workers of a company so that they can know what is required of them and the company.
However, product certification by UNBS is designed as a voluntary scheme since the respective sector bodies are mandated to carryout product certification. Certification of agro-products is therefore mainly carried out by the different departments under MAAIF. The UNBS only verifies products on request especially for those who are seeking for a Q or S mark.
4.5 Agri-inputs
4.5.1 Planting Materials, Fertilisers and Pesticides
There has been a deliberate effort by government to improve agricultural productivity through the promotion of increasing use of inputs. Most of the agro- inputs are imported from United Arab Emirates (UAE), China and India. The UNBS partners with three companies (Bureau Veritas, Intertek and SGS) to carry out a Pre-export Verification to Conformity (PVoC) of standards in the countries of origin before goods are transported to Uganda (PVoC guidelines, 2015).
Nonetheless, quality, a key parameter of agricultural inputs cannot be guaranteed in existing retail supply systems of Uganda. Low quality of agricultural inputs in general is often due to a multitude of factors, including adulteration, poor storage and inappropriate handling procedures. Moreover, quality deterioration could manifest at different points in the supply chain. Evidence suggests that adulteration, by bulking

70 | P a g e
fertilizer or dyeing simple grain to look like hybrid seeds, is common. The reason smallholder farmers do not adopt fertilizer and hybrid seed is because the technologies available in local markets are simply not profitable, which ultimately hampers agricultural productivity (Bold et al., 2015). The major underlying causes of low external agriculture input use in Uganda are high transaction costs of input marketing, limited availability of breeder and foundation seeds, low participation of private traders in the input distribution system, and the high cost of financial services. The high transaction cost of input trade is due to the low volume of purchases, high transport costs and high interest rates (IFDC, 1999). The agricultural input market is therefore largely characterized by a low-quality, low-trust, and low-adoption behaviour.
In addition, agricultural research institutions have not satisfactorily maintained the breeder and foundation seed purity, and to produce enough seed to meet the demand for the public and private sectors, thus exhibiting a poor linkage between research, extension and the private sector (MAAIF and MFEPD, 2000). Breeding programs in many cases are not responsive to the farmer needs as they overplay the yield potential (Louwaars and Marrewijk, 1996; MAAIF and MFEPD, 2000). Traditionally, the private seed companies avoid marketing self-pollinated crop seeds like beans due to competition from farm-saved seeds. Private seed companies also avoid marketing seeds in remote areas because farmers in such areas cannot afford improved certified seeds (David and Kasozi, 1999). This situation has called for development of an informal seed sector that has not yet been integrated in the breeding and extension systems.
4.5.2 Land
Land is a key factor of production particularly for agribusiness. Land tenure in Uganda has evolved tremendously over the past century, resulting into four types of land tenure systems. The tenure sytems include mailo, customary, leasehold and freehold. In FY 2014/15, MLHUD gazetted and launched the National Land Policy. Through the 10 year national industrial parks development program, government planned to set up 22 industrial parks in the different regions of Uganda with effect from FY2008/09 to FY 2017/1822. The purpose of establishing the parks is to provide serviced areas (with roads, water, electricity and ICTs) for manufacturing and value addition to Ugandan made goods. Industrial parks would strengthen the Ugandan private sector to enable it play it’s expected role as the engine of the country’s economic growth and development as well as create employment.
22 UIA project profile – Development of Industrial Parks.

71 | P a g e
4.5.3 Agro-Machinery
In order to harness the use of machinery by the small holder farmers, there is an increased tendency in formulation of organized farmer groups and cooperatives which collectively purchase input and processing equipment such as tractors. These are preferred due to their efficiency and cost effectiveness as compared to the use of manual labour and ox-ploughs. The increase in large scale commercial farming being driven by the local and joint venture businesses created opportunities for increased use of machinery.
According to the Agri-machinery scan Uganda, 2015 (Netherlands, 2015), demand for both local and imported machinery is increasing with the client’s preference depending on the appropriateness of technology to suit local needs, durability, convenience (fit into the client’s specific requirement) and proximity to the source/manufacturers. The local fabrication industry is limited to the manufacture of simple machines; mainly at the processing level particularly for the grain milling, animal feeds and bakery sectors. One local fabricator (Munyegera Agro-Machinery Fabricator) in Mayuge district in Eastern Uganda supplies the Feed the future USAID funded Commodity Production Activity beneficiaries with maize shelling machinery to improve the quality of maize grains. These have low efficiency and performance; poorly designed due to lack of in-depth expertise; not energy efficient and highly prone to breakdowns. The more complex machinery that is beyond the capacity of local manufacturers is imported mainly from China, India, United Arab Emirates, Denmark, USA and the Netherlands.
4.6 Agri-Financing
The importance of financial services to the economy and the need to foster trust among providers and consumers are among the reasons governments oversee the provision of many financial services. This oversight involves licensing, regulation, monitoring and supervision of the financial institutions. Uganda’s agri-financing is largely in the hands of commercial banks, microfinance institutions and to a less extent insurance companies.
4.6.1 The Banking Services Bank of Uganda (BoU) is the Central Bank of the Republic of Uganda whose primary purpose is to foster price stability and a sound financial system. Together with other institutions, it also plays a pivotal role as a centre of excellence in upholding macroeconomic stability. By September 2015, Uganda had a total of 25 licensed commercial banks, two Development banks, three Credit Institutions and four Microfinance Deposit taking Institutions with a network of about 600 branches and 5.5 million accounts. Commercial banks hold about 80 percent of the total assets of the financial system and the National Social Security Fund (NSSF) holds the remaining

72 | P a g e
20 percent (GoU, 2015). The Savings culture in the country is still low given the big informal sector, however, mobilization of people to form savings groups, and the advent of mobile phone technology enabled banking (locally referred to as mobile money), and legal frameworks to operationalise the schemes through SACCOs and financial literacy projects is steadily increasing the level of savings and financial inclusion.
Loans to the agricultural sector (in local currency) increased by 32.4 percent from 295.0 billion shillings in June 2013 to 390.6 billion shillings in June 2014. Of the 390.6 billion shillings given out in June 2014, 61.3 percent went into agriculture processing and marketing (Crop Finance) (UBOS, 2015a). The agriculture sector benefits from both private and public funding sources. As of December 2013, private sector credit to the agriculture sector amounted to Ushs 837 billion, accounting for 11 per cent of total bank lending. Most of the agriculture lending is destined for production (42 percent) and marketing (43 percent) activities, followed by processing (14 percent) and leasing (1 percent).
However, commercial bank interest rates are high, averaging at 24 percent in June 2015 and increasing to 26 percent in the second half of 2015 partly due to the volatility of the Ugandan Shilling against the United States dollar, which necessitated an increase in the Central Bank Rate (CBR) from 14 percent in April 2015 to 17 percent during November and December 2015. The high interest rates make borrowing for agriculture very difficult.
4.6.2 The Agricultural Credit Facility (ACF)
The Agricultural Credit Facility (ACF) is managed by Bank of Uganda in partnership with Stanbic bank, Centenary bank, DFCU bank and Uganda Development Bank represents one of the Public Private Partnerships benefiting the agricultural sector with a maximum interest rate of 10 percent. The number of beneficiaries accessing the ACF increased by about 52 percent between June 2012 and June 2015 (from 154 to 318 beneficiaries) (MFPED, 2015a). More than a half of the investments (59 per cent) were in agro-processing machinery for handling tea, maize, cotton and wheat; followed by infrastructure for farm expansion (17 per cent) such as poultry and piggery units and purchase of tractors (14 percent).
4.6.3 The Microfinance Support Centre
In addition to driving the financial inclusion and financial deepening agenda within the financial sector, Government is also involved in the direct delivery of financial services through its Rural Financial Services Strategy. This is undertaken through

73 | P a g e
Microfinance Support Centre (MSCL) through its 12 zonal offices across the country; Post Bank through its 35 branches supported by 9 mobile banking vans, and Pride microfinance (MFPED, 2015b). Interest rates for agriculture loans from MSCL are capped at 14 percent.
4.6.4 The Project for Financial Inclusion in Rural Areas
In order to improve financial accessibility in the country, government of Uganda and the International Fund for Agricultural Development (IFAD) signed a US$29 million loan agreement to finance the Project for Financial Inclusion in Rural Areas (PROFIRA) in FY 2014/15 (MFPED, 2014). Loanable Funds are disbursed through the existing MSCL structures and Savings and Credit Cooperatives (SACCOs) network in rural areas during the seven year project period.
4.6.5 Agriculture Insurance The insurance sector is still dominated by non-life (57 percent) and life insurance (22 percent) segments with significant growth of health membership organization schemes (19 percent). With the changing market dynamics, insurance companies must respond to the consumer demands if they are to remain relevant. Uganda’s entire agricultural insurance potential is estimated at an excess of $150m but many players have eluded it because of the risks involved and its unpredictability. In 2013, a group of eight (8) companies launched agricultural insurance products aimed at providing risk solutions to the agriculture sector. The agricultural products introduced in the market in included weather index insurance; multi-peril insurance; greenhouse insurance; crop insurance; and single animal livestock insurance (IRA, 2013). Generally, agriculture insurance covers production and revenue risks for all commercial field crops including wheat, maize, barley, rice, tea, coffee, sugar cane, tobacco, all horticultural, floriculture, tree crops and livestock. Also, it covers farm assets and equipment including green houses and irrigation facilities against various perils such as losses due to adverse weather conditions (floods, hailstorms, drought among others), barn fire, uncontrollable pests, and theft. The sum insured can be the farmers input costs, output (expected yield) or both. However, the uptake of these insurance products is still low.
4.7 Infrastructural Development
One of the objectives highlighted in the NDP-II is to increase and improve the quality of strategic infrastructure to accelerate the countries competitiveness. The planning framework further emphasizes the continued need to reduce costs of doing business through investing in infrastructure.
Road infrastructure: The government is heavily investing in expanding and maintaining the existing road network with special emphasis on roads in agricultural

74 | P a g e
areas to ease access to markets for agricultural produce and to reduce on the costs incurred during transportation of produce by traders. Other infrastructural investments include the standard gauge railway and upgrade of strategic major national roads.
Energy infrastructure: Government investments in the energy sector include exploitation of the abundant sources of renewable energy like hydropower and geothermal power to increase on the power generation capacity. The government has also intensified on its rural electrification programme to increase access to energy by constructing various hydropower plants and extending and improving transmission lines. The total installed capacity of electricity power plants increased by 15.2 percent from 718.4 MW in 2012 to 827.5 MW in 2013 (UBOS, 2014). It is anticipated that by 2020 the power generation capacity will be 2,500 MW.
Water for production infrastructure: This intends to boost commercial agriculture and agro-industry activities. Under the Ministry of Water and Environment, the rehabilitation of irrigation schemes project 2013-2017 is a priority investment area by government which will also provide water harvesting technologies to increase water supply for irrigation purposes.
4.8 The Trade and Non-Trade Barriers
Trade barriers include any restriction imposed on the free flow of trade. However, the EAC defines the Non Tax Barriers (NTBs) as quantitative restrictions and specific limitations that act as obstacles to trade. There are several forms of NTBs including but not limited to: Import policy barriers; Standards, testing, labeling and certification requirements; Anti-dumping and countervailing measures; Export subsidies, domestic support and others. The specific trade barriers in Uganda and the East African region include Customs and administrative documentation procedures; Immigration procedures; Cumbersome inspection requirements; police road blocks; varying trade regulations among the EAC countries; varying, cumbersome and costly transiting procedures in the EAC countries; duplicated functions of agencies involved in verifying quality, quantity and dutiable value of imports and exports; and business registration and licensing.
The Business Climate Index Survey (BCI) conducted in 2008 among the EAC member states identified corruption (characterized by bribes at weighing bridges, road blocks, business registration and immigration) as the main non tax impediment to trade. The study found Burundi to have been the most corrupt; followed by Kenya, Uganda, Tanzania and Rwanda in that order. The survey however, found Uganda to have the most favorable conditions for trade; then Kenya, Rwanda, Tanzania and Burundi respectively. The signing and implementation of the EAC-CU has greatly attempted to

75 | P a g e
reduce trade barriers within the region, however, the barriers with member states and other partners still exist. The country and region at large still graples with physical infrastructure challenges including poor road network, lack of a functioning railway system, inadequate electricity supply, poor air transport system, and informal trade.
4.9 Sanitary and Phytosanitary Services
Government of Uganda has over the past years formulated policies23 aimed at protecting the lives and health of humans, animals and plants; and improving the competitiveness of Uganda’s products. Uganda is a member of a number of international organizations such as the WTO, International Plant Protection Convention (IPPC), and the World Animal Health Organization, FAO/WHO Codex Alimentarius Commission for Food Safety; whose activities relate to SPS.
Uganda is mainly engaged in trade of agricultural products, which are directly affected by SPS requirements. These requirements mainly affect the non-traditional exports (such as fish and fish products, horticultural products, flowers, cereals, fruits, et cetera), which have been growing rapidly over the last ten years as a result of Government’s policy of export diversification. The policy interventions have seen the contribution of non-traditional exports to total exports increase from 28.7 percent in 1999 to 73.2 percent in 2009. However, this growth is potentially threatened unless SPS requirements are urgently addressed. Generally, SPS enforcement is still weak due to limitations in human, technical and financial resources.
The responsibility for SPS enforcement is under the mandate of the Department of Crop Protection (in the Directorate of Crop Resources) in MAAIF. The Department has been designated a national competent authority for Phytosanitary inspection services in Uganda. All matters related to plant health, issuing of import and export phytosanitary certificates for live plant material and horticultural crops, plant pest prevention and eradication programmes. Ensuring compliance with phytosanitary requirements within specific agricultural commodity exports is done by regulatory bodies established by Statutes of Parliament. The UCDA and CDO are the statutory bodies within the coffee and cotton sub-sector respectively, while the DDA authority handles compliance within the dairy sub-sector. In the fisheries sub-sector, the mandate was transferred from UNBS and handed over to the Department of Fisheries since 2000. In other exporting sectors with no statutory bodies, compliance depends on codes of good practice enforced under appropriate producers’ or exporters’ apex associations like UFEA, HORTEXA, UVA, UTA, e.t.c. However, most of these apex
23 Such policies include the Food and Nutrition Policy(2003), National Animal Feeds Policy (2005) National Meat Policy 2003 National Trade Policy(2008), National Industrial Policy( February 2008), National Health Policy, (2009) National Drug Policy and Act (1993), and the National Agricultural Research System (NARS) among others

76 | P a g e
associations were formed primarily to lobby government for interests of their members and compliance with Phytosanitary requirements was not among their prime objectives. Further, these associations are member based (voluntary rather than mandatory) and this partly explains the weaknesses in compliance with SPS requirements.
4.9.1 Food safety, quality standards and associated infrastructure
The government of Uganda through the MTIC under the Quality Infrastructure and Standards Programme (QUISP) in collaboration with other stakeholders developed the National Standards and Quality Policy (NSQP) in 2012 with a mission ‘‘to improve Uganda’s competitiveness in the domestic, regional and international markets through production, trade and consumption of quality goods and services” (MTIC, 2012). This policy has been seen as an important step in the future of Uganda’s’ National Quality Infrastructure and the Technical Regulations Framework both of which are important parameters for the development of Uganda’s Agricultural, Industrial and Service sectors and facilitating access to foreign markets whilst at the same time ensuring that the safety of consumers, fauna, flora and the environment are not compromised.
4.10 Logistics
Logistics in agriculture is gaining more importance as it deals mainly with the smooth supply of food and other agricultural products from the producer to the final consumer. Wang Shufeng et al. (2010) asserted that modern agriculture logistics should have 12 functional elements of: procurement, supply, storage, transportation, loading and unloading, sorting, packaging, distribution, distribution processing, marketing, recycling, and information control. Recent evidence indicates that grains (cereals, pulses, oil crops etc) constitute the bulk of agricultural commodities produced and delivered to markets by smallholder farmers (The Grain Council of Uganda 2015) . It also reveals that the National capacity for grain processing (drying, cleaning and grading) is presently as low as 12 percent and the grain storage capacity at only 25 percent of national cereal production output. To address this situation, a range of measures were initiated by government and development partners, and were at varying stages of implementation by June 2015 (MFPED, 2015b). These include:
The Warehouse Receipting System and regulations through the Uganda Warehouse Receipt System Authority (UWRSA), the lead agency for the development of standardised and certified storage facilities of commodities and promotion of structured financing for commodities;

77 | P a g e
Construction of 7 urban markets under the Markets and Agriculture Trade Improvement Project (MATIP I) supported with funding from African Development Bank;
Construction of mini-storage facilities; Provision of five units of first level value addition equipment for cleaning,
grading/sorting and de-stoning; Establishment of quality control, management, grading and standardization
systems; Providing two high level processing facilities for maize; Facilitating linkage of produce to agro-processing facilities under the Community
Agricultural Infrastructure Improvement Programme (CAIIP); and Establishing and promoting the use of market information systems to facilitate
trade
In spite of the government efforts, standard agro-storage and transport facilities are still very few and located in major towns instead of production centres. Given the increasing production and productivity, and the on-going programme on rural electrification, there is a good opportunity in provision of storage facilities particularly warehouses and silos for grains and coffee on one hand and cold chains for horticulture, diary and fish products.
Freight Logistics
Freight and shipping of goods and cargo takes place to, from and within Uganda via air, land and water. Uganda’s imports come mainly from EU and Kenya, they are typically petroleum products, machinery and transportation equipment. Its exports on the other hand consist mainly of agricultural products such as coffee and tea to the EU, Middle East, Asia, Americas and neighboring countries.
The country is landlocked and relies on the port of Mombasa, Kenya, for its sea transportation needs. The country has a small port with a harbour on Lake Victoria (Port Bell) near Kampala which has immigration and customs facilities; in addition, there are ports at Entebbe (Air) and Jinja. Port Bell is used for international traffic across Lake Victoria. Cargo ships owned by Uganda Railways, though currently on a declining trend, use Port Bell to cross the lake; the ships carry railway goods wagons to Mwanza Port in Tanzania. There are 1,244km of railway in Uganda and 70,746 km of road running throughout the country. The railway network is dilapidated although arrangements for Government to invest in Standard Gauge Railway (SGR) are in advanced stages. Therefore, freight services are generally road based and costly.

78 | P a g e
There are numerous freight and shipping companies in Uganda, including global firms such as TNT, UPS, Fedex and DHL, which provide a range of clearing, forwarding and cargo-handling services. The Uganda Freight Forwarders Association (UFFA) is the leading private sector apex body with a total of 89 local and international members handling about 90% of imports and exports in the country24. Logistics management in the country is in its development stage, the sector is faced with challenges of limited skilled work force especially at strategic and tactical levels, unreliable timeliness of shipments reaching destinations on schedule, low technology usage especially tracking and tracing of consignments, and inadequate specialized logistics management equipment and systems.
4.11 Meteorological Services
Many farmers in the Country solely rely on rains for their agriculture given that the share of households practicing irrigation was as lows as 0.54 percent in 2013/14, up from 0.42 percent in 2011/12 (UBOS, 2015b). Access to quality and timely weather and climate services is therefore critical for farm production and productivity.
Besides, on-going efforts to expand the acreage of land under irrigation, Government has also been implementing measures to strengthening meteorological services, products and use in the agriculture and water sectors. In FY 2014/15, some of the public services provided by the Uganda National Metrology Authority included: i) Provision of daily national and city weather forecast as well as Mobile Weather Alerts (MWA); ii) Provision of seasonal climate forecast; and iii) Provision of disaster warnings as a way of protecting life and property.
4.12 Science, Technology and Innovations
Uganda Industrial Research Institute (UIRI) and Uganda National Council for Science and Technology (UNCST) have been at the centre of national efforts to facilitate the integration of Science, Technology and Innovation within the country’s industrialization drive. Between 2010 and 2014, a total of 160 research projects were undertaken to add value to locally produced products, more especially fruits, potatoes, peanuts, banana, honey, millet, soya, mushrooms and dairy products. Further, there is increasing collaboration between agricultural research universities and national research institutes with the private sector in the area of dissemination of new innovations and technologies. However, funding for research undertakings by government is still a limiting factor for development of new innovations.
24 http://www.ugandafreightforwarders.com/

79 | P a g e
5.0 THE AGRI-BUSINESS OPTIONS FOR TRADE AND INVESTMENT WITH THE DUTCH
This agribusiness market scan should among other objectives guide Dutch businesses in selecting a specific value chain to invest in. This report has provided an overview of the major agricultural value chains with an attempt of their situation analyses/SWOT analyses. In order to recommend particular value chains for Dutch investment, the different enterprises are compared using selected criteria (Table 17). The assessment of the enterprise is inherently subjective, but to a great extent informed by the information presented in the previous sections.
Criteria used 1. National priorities-NDP II: The strategic priorities for agribusiness in Uganda are
clearly indicated in the National Development Plan-II to be implemented through 2015/16 to 2019/20 financial years. The plan proposes government support and investments in 12 agricultural value chains namely Cotton, Coffee, Tea, Maize, Rice, Cassava, Beans, Fish, Beef, Milk, Citrus and Bananas
2. Growth Potential and competitiveness: Ability of value chain to grow in terms of production and productivity; quality and standards and satisfy existing and emerging demand
3. Domestic and regional Demand: Considers existing consumption of a selected value chain product in internal markets and by markets in neighbouring states such as EAC, COMESA and SADC.
4. International Demand: Refers to high potential or demand for a locally produced agri-product in global markets such as EU, Asia and USA
5. Economic impact- Employment: Meaningful employment opportunities created for communities by selected value chain
6. Economic impact- Income: Increased ability of selected value chain actors to earn 7. Fit with Dutch Agro-foods: The ability to create linkages with renown Dutch agro-
foods sector to enhance value chain efficiency 8. Matching with Dutch Technology: The potential to link with Dutch agri-businesses
or Dutch top sectors that have the complementary know-how and expertise to add value and create the much needed economy-wide catalytic growth effects
9. Link with EKN Food Security Program: This program focuses on increasing agricultural productivity, income generation, regional trade and investments
10. Existence of Dutch interventions along the value chain: There are Dutch interventions in the agribusiness sector characterized as level 1 (Diary, Rice, Beans and Potatoes) and level 2 (cassava and oil seed crops).
Based on these criteria, the high and medium potential enterprises were selected and the investment opportunities or business entry points highlighted for each (Table 18). Further, the potential areas for investment in the agro-machinery as presented in the Agro-machinery scan are presented as well (Table 19).

80 | P a g e
Table 17: Scoring of the Agricultural Enterprises for Dutch Investment opportunities
Agricultural Enterprise
Criteria scored
National priorities-NDP II
Growth Potential & competitiveness
Domestic & regional Demand
International Demand
Economic impact- Employment
Economic impact- Income
Fit with Dutch Agro-foods Fit with Dutch
Technology
Link with EKN FSP
Existence of Dutch interventions Total
Traditional Cash crops
Coffee 3 3 1 3 2 3 0 3 0 0 15 Cotton 3 1 1 3 1 1 0 1 0 0 8 Tea 3 3 2 3 2 3 0 2 0 0 15 Tobacco 0 1 1 3 1 2 0 0 0 0 8 Non- Traditional Cash crops
Maize 3 3 3 1 2 2 3 3 0 1 18 Cassava 3 2 3 0 2 2 3 3 1 3 19 Vanilla 2 2 1 3 1 3 2 2 0 0 14 Cocoa 2 2 1 3 1 3 3 3 0 0 16 Rice 3 3 1 3 2 3 1 3 3 0 19 Oil seed (Soya bean & Sunflower) 1 3 3 3 2 3 3 3 3 3 24 Flowers 1 3 2 3 1 3 0 0 0 2 14
Horticulture (Vegetables) 1 1 1 3 2 3 3 3 2 3
20 Potatoe 1 3 3 1 2 2 3 3 3 3 23
Livestock Sector Diary 3 3 3 2 2 3 3 3 3 3 25 Beef 3 1 3 3 2 2 2 2 1 0 16 Hides and Skins 0 3 1 3 1 1 1 1 0 0 11 Poultry 1 3 3 3 2 3 3 3 3 3 24 Fish and products 3 3 3 3 3 3 3 3 2 0 23 Scores: 0= Not relevant/No focus 1= Low 2= Medium 3= High Color Schemes: Green= High Potential enterprises Orange= Medium potential enterprises

81 | P a g e
Table 18: Investment opportunities for the priority Agribusiness
Enterprise Investment Opportunities Coffee • Primary Processing: Involves Hulling, pre-cleaning, de-stoning, size grading,
gravimetric sorting (weight and color), and bagging in jute bags of 60kgs. • Secondary Processing: Roasting, grinding, and making of instant coffee, extraction
of soluble coffee solids for domestic and international markets • Investment in wet mills to add value
Cassava • Seed multiplication as a business • Investment in mobile processing units (.Negotiations with Dutch company
DATCO already underway) • Processing of cassava into cassava products (flour and dried chips) for to export to
the regional market • Investment in commercial processing of cassava into beer and flour ( similar
projects already running in Nigeria and Mozambique) • Potential investment in starch and ethanol production25.
Seed oil crops (Sesame and Groundnuts)
• Processing facilities for vegetable oil • high yielding seed multiplication which also has good oil content ( about 48
percent) o Research and seed production of high yielding and climate resistant
varieties. 95 percent of hybrid seed is imported from South Africa • Provision of storage facilities particularly warehouses and silos for grains (cereals
and pulses) cereal Horticultural crops
• Construction of cold chain warehouses and cold chain transportation facilities • Pack houses distributed in production areas to facilitate sorting, grading and
transportation in bulk for export • Trading in inputs
Fish Farming • Factory for feeds: NAADS and OWC giving feeds and fish seed to farmers free of charge which it buys from the private sector
• Hatcheries for supply of quality fish seed • Trade opportunities in provision of fish cage frames, nets and other fittings
(locally fabricated frames are also being used) Diary • Joint ventures with the small and medium dairy processors who want to expand
their operations but are limited by financial capital, equipment, technology and expertise
• Animal breeding and supply of stock to improve milk productivity • Animal feeds processing and establishment of regional feed outlets • Investment in Milk Collection Centres and /or distribution facilities/milk supply
tankers to improve milk quality • Investment in unpackaged pasteurized milk distribution system • Investment in Integrated dairy farming/processing dairy business
Beef • Improving the beef breeds for improved offtake rates and productivity
• Service abattoirs and processing facilities that meet demands of export markets • Supply of cold chain vehicles for supply and distribution of beef products locally
and regionally • Partnership opportunities for ranching (existing ranches are characterised by low
productivity but with potential for increased stock density) • Commercial cattle fattening/feedlot system to meet existing demand locally and
regionally
25 Total national demand for ethanol for the year 2010 was 16,435MT (valued at USD 17M) and was consumed by school laboratories, hospitals and distillers. The main users of starch are the pharmaceuticals industry (53.6 percent), paperboard industries (32.5 percent), processed food (13.5 percent) and laundry (0.4 percent)

82 | P a g e
• Supply of butcher equipment • Cattle vaccines and medicines
Poultry • Commercial hatcheries for the export of day old chicks to regional markets (e.g. Rwanda) and supply to the local market where demand is higher than supply
• Commercial poultry farms • Chicken slaughter and processing facilities , animal feeds production facilities • Cold chain trucks for supply and distribution of poultry meats • Poultry vaccines and medicines • Poultry feeds, machinery, chicks, pre-mix, and technical expertise
Cocoa • Trade in cocoa pods • Primary processing and exporting of dry beans. • Processing into intermediate products: setting up a mini processing plant, buy
fresh beans, ferment and dry, carryout roasting and grinding and sell the products as cocoa paste, butter or powder
• Processing into final products like chocolates Rice • Rice processing infrastructure or technology
• Supply of Agri- machinery for land cultivation, harvesting, processing & fertilizer applicators
• Supply of Agro-inputs: fertilizers and certified/improved rice seed varieties • Promoting the use of rice by-products like husks for briquettes raw materials, use
of rice bran in animal feed production, broken rice as noodles and instant snack and processing of broken rice into rice flour and starch
Potatoe • Seed multiplication for high yielding varieties • Supply of Agro-inputs: Fertilisers and pesticides
Table 19: Major agro-machinery trade opportunities in Uganda
Sub-sector Agri Machinery Opportunity Rating
Dairy Processing machinery of Mini Dairies High
Dairy Milk Cooling tanks and centres (MCC’s) High
Land Cultivation Tractors High
Poultry Battery Cage High
Poultry Hatcheries Medium
Dairy Dairy-Dispensing Machines Medium
Dairy Dairy-Milking Machinery Medium
Horticulture Greenhouse for Vegetable Medium
Source: Agri-machinery scan Uganda, 2015

83 | P a g e
6.0 THE SYNTHESIS
The Dutch government has designated Uganda as a transitional country where the focus is on promoting aid and aid to trade programmes. Under the Multi Annual Strategic Plan (MASP 2014-17) for the Embassy of the Kingdom of the Netherlands (EKN), EKN intends to deepen its support to food security and economic cooperation activities. It is envisaged that Dutch Agri-business activities need to be deepened in the Ugandan economy to boost the economic cooperation agenda. This Agri-business Market Scan aimed at generating reliable and updated Agri-business information to facilitate Trade and Investments in Uganda, in the East African Community, and between Uganda and the Netherlands.
The agribusiness sector includes the whole chain of activities from production, processing, transportation and marketing of the different produce. The agricultural products can be categorised into the crop and livestock subsectors, where the crop subsector can further be categorised into cash and food crops. The extent of value addition and agro-processing in the sector varies for the different products but with significant levels of activity in the traditional cash crops especially coffee and tea. Coffee is by far the biggest crop value chain with the biggest share of the crop subsector. Under the livestock sector, fish and its products dominate the export share although the poultry subsector has high level of engagement by the small, medium and large scale operators.
With regards to marketing, Uganda enjoys access to regional (EAC, COMESA, South-Sudan) and international markets mainly the EU and Asia. Generally, the agribusiness sector is facilitated by several factors including the conducive business environment enhanced by supportive policy and legal frameworks (at national, regional and international level), institutional support in the areas of registration, licencing and regulation, improved access to agri-inputs and agri-finance, as well as the general infrastructural development. On the other hand, the sector is mainly constrained by several trade and non-trade barriers, insufficient marketing logistics, lack of access to modern production technology, high transaction costs due to poor road infrastructure, lack of adequate processing capacity, prohibitively high costs of capital, high levels of corruption, inefficient agricultural input markets and lack of proper quality control and regulation. Nonetheless, over the last decade, agribusiness has gained prominence due to the Government’s initiative to pursue private sector led growth with deliberate efforts to improving the business environment as evident in the National Development Plan-II (NDP-II) and other development agendas. Consequently, there is growth in both

84 | P a g e
domestic and cross border trade. As both internal and external markets for agro-based products expand in Africa, the potential benefits of agribusinesses will increase with time depending on the ability of the agri-food chain actors to penetrate new markets and take advantage of opportunities for expansion through mergers and acquisitions, new joint ventures and strategic alliances.
In order to facilitate deepening of the Dutch Agri-business activities in the Ugandan economy and to boost the economic cooperation agenda, the different enterprises were evaluated and scored based on specific criteria. The agribusiness options for trade and investment that are of interest to the Dutch could be categorised into top and medium priority/ranking. The top ranking include coffee, Tea, Oil seed crops (Sunflower and Soya bean), Potatoes, horticultural crops (vegetables), Diary, Poultry and Fish. The medium ranking enterprises include Cassava, Rice, Maize and Beef. For each of these specific enterprises, the entry points for investments were clearly articulated. In addition, there are investment opportunities in agri-services especially agri-inputs and logistics, that is, warehouses and silos for grains and coffee on one hand and cold chains for horticulture, diary and fish products, freight and handling services, packaging, marketing, and logistics information flow systems.

85 | P a g e
REFERENCES Afrii, 2013. Annual Report 2013, Africa Innovations Institute. Ann, G. and Andrew, G., 2000. Production Credit for African Small holders: Conditions for Private
Provision. Savings and Development(No. 1). Bold, T., Kaizzi, K.C., Svensson, J. and Yanagizawa-Drott, D., 2015. Low Quality, Low Returns, Low
Adoption: Evidence from the Market for Fertilizer and Hybrid Seed in Uganda, International Growth Centre (IGC).
BoU, 2016a. Composition of Exports_Values and Volumes. Bank of Uganda, Kampala. http://www.bou.or.ug/bou/rates_statistics/statistics.html.
BoU, 2016b. Statistics. In: BoU (Editor), Composition of exports. Statistics Department of Bank of Uganda, Kampala.
EAC, 2014. East African Community Facts and Figures-2014, East African Community Secretariat, Arusha, Tanzania.
EKN, 2015. Agri-Machinery Scan Uganda. Embassy of the Kingdom of the Netherlands. Kampala. EU, 2015. Uganda Trade and Economic Briefing Paper October – December 2015). FAO, 2013. Enabling Environments for Agribusiness and Agro-industries Development- Regional and
Country Persoectives. Rome. Agribusiness and Food Industries(1). Gabre-Madhin, E.Z. and Vette, H.d., 2004. Uganda Hortifloriculture Sector Study Agricultural Trade
Facilitation and Export Promotion in Sub-Saharan Africa Study. GoU, 2000. Uganda Gazzette 2000. Laws of Uganda 2000. In: U.L.I. Institute (Editor). GoU, 2013. Uganda Vision 2014. National Planning Authority, Kampala, Uganda. GoU, 2015. Second National Development Plan (NDP II) 2015/15-2019/20. In: NPA (Editor). National
Planning Authority, Kampala. IFC, 2013. IFC Annual Report 2013; The Power of Partnerships, International Finance Corporation. IRA, 2013. Annual Insurance Market Report, Insurance Regulatory Authority. Joughin, J., 2014. The Political Economy of Seed Reform in Uganda: Promoting a Regional Seed Trade
Market. Africa Trade Practice Working Paper Sereis No. 3. Kiwanuka, B. and Ahmed, M., 2012. nalysis of incentives and disincentives for tea in Uganda. ,
MAFAP, FAO, Rome. Kyomugisha, H., Mugisha, J., Katungi, E. and Kasharu, A., 2012. Economic evaluation of the potato
market chain in Uganda, Department of Agribusiness and Natural Resource Economics, Makerere University, Entebbe, Uganda.
LMC, 2002. The use of Market-based Community Risk Management Technique in Community Dependent Developing Countries: Perceptions, Opportunities, Constraints, Accessibility to Small–scale Producers.
, LMC International Limited. Lundbaek, J., 2002. Privatization of the Cotton Sub-sector in Uganda: Market Failures and
Institutional Mechanisms to Overcome these., The Royal Veterinary and Agricultural University.
MAAIF, 2010. Agriculture Sector Development Strategy and Investment Plan: 2010/11-2014/15, Minitry of Agriculture, Animal Industry and Fisheries
MFPED, 2014. Public Investments Plan (PIP) FY 2014/15-16/17, Ministry of Finance, Planning and
Economic Development, Kampala. MFPED, 2015a. Agricultural Sector Annual Monitoring Report, Financial Year 2014/15, Ministry of
Finance, Planning and Economic Development, Kampala. MFPED, 2015b. Background to the Budget FY 2015/16, Ministry of Finance, Planning and Economic
Development, Kampala. MoFPED, 2014. Improving Service Delivery in Uganda. BMAU Discussion Paper 1/4, Ministry of
Finance, Planning and Economic Development, Kampala.

86 | P a g e
MTIC, 2012. The Assessment of the Capacity Needs of SMCA Service Providers in Uganda to Support Priority Product Value Chains, Ministry of Trade, Industry and Cooperatives, Kampala.
Mugerwa, Y., 2016. Parliament Okays Islamic Banking, Daily Monitor, Kampala. Nandudu, P., 2014. As Uganda Heats Up, Pests and Disease Flourish to Attack its Top Export Crop.
Inter Press Service News Agency. NAPE, 2012. The Impacts of the Flowe Industry on Environment and Peoples Livelihoods in Uganda,
National Association of Professional Environmentalists. Netherlands, 2015. Agri-Machinery Scan (Uganda), Kindom of the Netherlands. Oxfam, 2002. The Tea Market-a background study. , Oxfam International, London. United Kingdom. Serunjogi, L.K. et al., 2001. Cotton (Gossypium Sp.). Agriculture In Uganda. Fountain Publishers Ltd,
II. UBOS, 2014. 2013/14 Annual Report, Uganda National Bureau of Standards, Kampala. UBOS, 2015a. Statistical Abstract 2015, Uganda Bureau of Statistics, Kampala. UBOS, 2015b. Uganda National Household Panel Survey, Uganda Bureau of Statistics, Kampala. UCDA, 2015a. UCDA Monthly Report for February 2015, Uganda Coffee Development Authority,
Kampala. UCDA, 2015b. Uganda National Coffee Strategy 2040 plan for 2016/17-2020/21, Uganda Coffee
Development Authority, Kampala. USAID, 2006. Building Uganda's Global Comperirivness in Agribusiness. The Ugandan Floriculture
Competitiveness Plan: 2005-2010: Uganda Strengthening the Competitivness of Private Enterprise (SCOPE), United States Agency for International Development.
Wang Shufeng, W., Liya, M. and Wei, W., 2010. Modern agriculture logistics’ function elements and its systematic operational management. Information Science and Engineering (ICISE), 2010 2nd International Conference
WorldBank, 2006. Uganda Diagnostic Trade Integration Study (DTIS), World Bank, Washington DC. WorldBank, 2016. Doing Business 2016; Measuring regulatory quality and efficiency, Washington DC. WTO, 2006. Trade Policy Review, World Trade Organisation.

87 | P a g e
The Legal instruments The Animal Diseases Act (1964) The Hides and Skins Act (1964) The Veterinary Surgeons Act (1970) The Animal Straying Act (1964) The Animal (Prevention of Cruelty) Act (1957) The Animal Breeding Act (2000) The Cattle Grazing Act (1964) The Public Health Act (Meat and Milk Rules) (1964) The Code of Meat inspection Uganda (1973) The Food and Drug Act (1964) The National Drug Authority Policy and Statute (1994) The National Bureau of Standards (1993 and 1998) Uganda’s international obligations (UIA, 2009) The Dairy Master Plan (1993) The Dairy Industry Act (1998) The Dairy (Marketing and Processing of Milk and Milk products) Regulations (2003) The Public Health Act The UNBS Standards for milk. Uganda Vision 2040 The Monetary Union Protocol (2013) The Customs Union The Common Market (2010) The Agricultural policy (2011)
The National Industrial Policy (2008) The Trade policy (2007) The National Land Policy (2013) The Bank of Uganda Act (2000) The Financial institutions Act (2004) The Amended Financial Institution Act (2015) The Micro Deposit taking Institutions Act (2003) The Foreign Exchange Act (2004) The Trade Mark Act 2010 The Trade Mark Regulations 2012 The Trade Secrets Protection Act 2009 The Patents Act as amended in 2002 The Patents regulations The Copyrights and Neighboring Act 2006 The UNBS Act, Cap 327 The Weights and Measures Act 1965 The Import Inspection and clearance regulations, 2015 The National Standards and Quality Policy (NSQP), 2012 The Food and Nutrition Policy (2003) The National Animal Feeds Policy (2005) The National Meat Policy 2003 The National Trade Policy (2008) The National Industrial Policy (February 2008) The National Health Policy, (2009) The National Drug Policy and Act (1993) The Insurance (Amendment) Act, 13, 2011
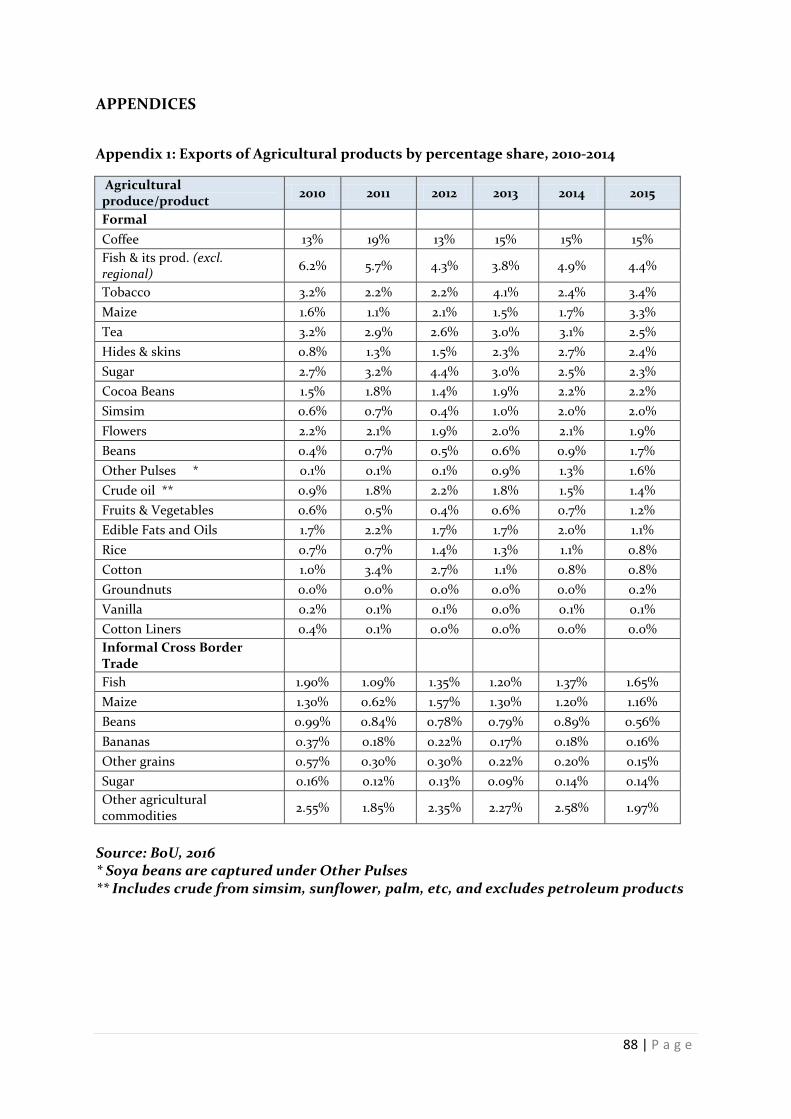
88 | P a g e
APPENDICES
Appendix 1: Exports of Agricultural products by percentage share, 2010-2014
Agricultural produce/product 2010 2011 2012 2013 2014 2015
Formal Coffee 13% 19% 13% 15% 15% 15% Fish & its prod. (excl. regional) 6.2% 5.7% 4.3% 3.8% 4.9% 4.4%
Tobacco 3.2% 2.2% 2.2% 4.1% 2.4% 3.4% Maize 1.6% 1.1% 2.1% 1.5% 1.7% 3.3% Tea 3.2% 2.9% 2.6% 3.0% 3.1% 2.5% Hides & skins 0.8% 1.3% 1.5% 2.3% 2.7% 2.4% Sugar 2.7% 3.2% 4.4% 3.0% 2.5% 2.3% Cocoa Beans 1.5% 1.8% 1.4% 1.9% 2.2% 2.2% Simsim 0.6% 0.7% 0.4% 1.0% 2.0% 2.0% Flowers 2.2% 2.1% 1.9% 2.0% 2.1% 1.9% Beans 0.4% 0.7% 0.5% 0.6% 0.9% 1.7% Other Pulses * 0.1% 0.1% 0.1% 0.9% 1.3% 1.6% Crude oil ** 0.9% 1.8% 2.2% 1.8% 1.5% 1.4% Fruits & Vegetables 0.6% 0.5% 0.4% 0.6% 0.7% 1.2% Edible Fats and Oils 1.7% 2.2% 1.7% 1.7% 2.0% 1.1% Rice 0.7% 0.7% 1.4% 1.3% 1.1% 0.8% Cotton 1.0% 3.4% 2.7% 1.1% 0.8% 0.8% Groundnuts 0.0% 0.0% 0.0% 0.0% 0.0% 0.2% Vanilla 0.2% 0.1% 0.1% 0.0% 0.1% 0.1% Cotton Liners 0.4% 0.1% 0.0% 0.0% 0.0% 0.0% Informal Cross Border Trade
Fish 1.90% 1.09% 1.35% 1.20% 1.37% 1.65% Maize 1.30% 0.62% 1.57% 1.30% 1.20% 1.16% Beans 0.99% 0.84% 0.78% 0.79% 0.89% 0.56% Bananas 0.37% 0.18% 0.22% 0.17% 0.18% 0.16% Other grains 0.57% 0.30% 0.30% 0.22% 0.20% 0.15% Sugar 0.16% 0.12% 0.13% 0.09% 0.14% 0.14% Other agricultural commodities 2.55% 1.85% 2.35% 2.27% 2.58% 1.97%
Source: BoU, 2016 * Soya beans are captured under Other Pulses ** Includes crude from simsim, sunflower, palm, etc, and excludes petroleum products
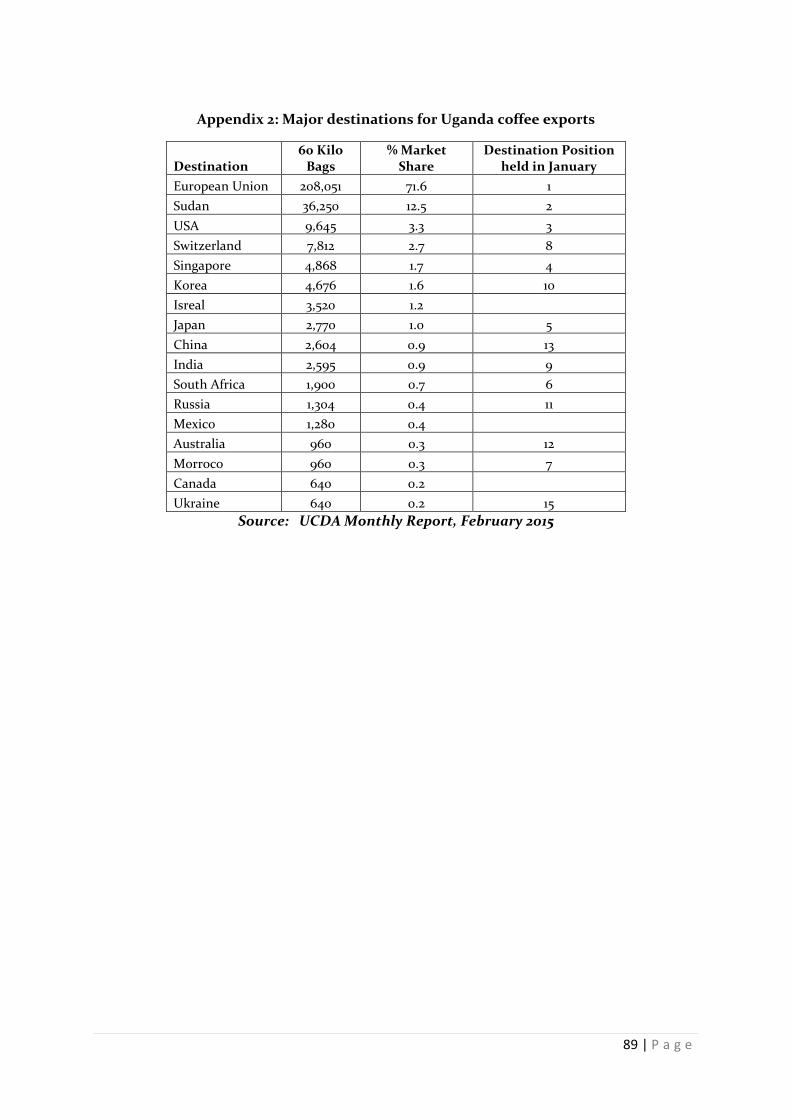
89 | P a g e
Appendix 2: Major destinations for Uganda coffee exports
Destination 60 Kilo
Bags % Market
Share Destination Position
held in January European Union 208,051 71.6 1 Sudan 36,250 12.5 2 USA 9,645 3.3 3 Switzerland 7,812 2.7 8 Singapore 4,868 1.7 4 Korea 4,676 1.6 10 Isreal 3,520 1.2
Japan 2,770 1.0 5 China 2,604 0.9 13 India 2,595 0.9 9 South Africa 1,900 0.7 6 Russia 1,304 0.4 11 Mexico 1,280 0.4
Australia 960 0.3 12 Morroco 960 0.3 7 Canada 640 0.2
Ukraine 640 0.2 15 Source: UCDA Monthly Report, February 2015

90 | P a g e
Appendix 3: Coffee Export Performance by Individual Companies in December 2015
Quantity %- age Market Share Bags Position 60kg Bags
Individual Cumulativ
e 1 Ugacof (U) Ltd 1 49,330 14.41 14.41 2 Kyagalanyi Coffee Ltd 2 39,908 11.65 26.06 3 Ideal Commodities 4 38,716 11.31 37.37 4 Olam (U) Ltd 3 31,474 9.19 46.56 5 Ibero (U) Ltd 5 27,124 7.92 54.48 6 Kampala Domestic Store 8 25,707 7.51 61.99 7 Export Trading
Company Ltd 7 16,520 4.82 66.81
8 Kawacom (U) Ltd 6 14,650 4.28 71.09 9 Ishaka Commodities Ltd 15 14,140 4.13 75.22 10 Savannah Commodities 9 14,000 4.09 79.31 11 Great Lakes Coffee Ltd 10 10,910 3.19 82.49 12 Coffee World 14 10,546 3.08 85.57 13 Besmark Coffee Ltd 11 7,324 2.14 87.71 14 Commodity Solutions 13 5,902 1.72 89.43 15 Nakana Coffee Factory 20 5,602 1.64 91.07 16 LD Commodities 19 4,259 1.24 92.31 17 Ankole Coffee Processors 17 3,958 1.16 93.47 18 Karaz Coffee Factory 26 3,945 1.15 94.62 19 Sena Indo (U) Ltd 25 3,360 0.98 95.60 20 Touton (U) Ltd - 2,520 0.74 96.34 21 Banyankole Kweterana
Coop 21 2,250 0.66 97.00
22 Risala (U) Ltd 12 2,250 0.66 97.65 23 Ankole Coffee Producers 16 1,920 0.56 98.21 24 Mbale Importers and
Exporters 24 1,310 0.38 98.60
25 Bakhisons Trading Co. Ltd
- 1,050 0.31 98.90
26 Fairlop Global Commodities
22 994 0.29 99.19
27 NUCAFE Ltd 29 640 0.19 99.38 28 Pearl Crops Ltd - 640 0.19 99.57 29 Nihacofa (U) Ltd - 520 0.15 99.72 30 Bukonzo Joint Coop
Union 27 320 0.09 99.81
31 Gumutindo Coffee Cooperative
30 320 0.09 99.91
32 Kaweri Coffee Plantation 18 320 0.09 100.00 Source: UCDA 2015.

91 | P a g e
Appendix 4: Actors in the Uganda Cotton Value Chain
COTTON GINNERIES IN UGANDA
Name LOCATION Name LOCATION Aboke Rafiki Cotton Industries Apac Kasese Nyakatonzi Growers Kasese Aduku Apac Kibuku
AJAY Kitgum East Acholi Co-Operation Union Kitgum
Arapi Teso Co-Operation Union Soroti Kiyunga Balawoli Cotton Ginnery Ltd Kamuli Ladoto Minar Trading Company Pallisa Bamunanika Ginnery Ltd Luwero Lukhonge Masaaba Cotton Co Mbale
Bugema North Bukedi Cotton Company Mbale Masindi Growers Masindi Bulumba Busoga Co-Operation Union Kamuli Mukongoro Teso Agri Base Ltd Kumi
Bulumba A Busoga Growers Co-Operation Kamuli Nakivumbi Bon Holding Iganga
Bulumba Busonga Growers Co-Operation kamuli Ngetta Busembatia Pramukh Agro Industries Iganga Nyakatonzi Kasese
Busolwe South Base Agro Industries Tororo Nyakesi South Bukedi Co-Op Ltd Tororo
Dunavant Nakasongola Olam Global Cotton Ltd Tororo Parombo Gulu Agricultural Development Company (GADC)
Pakwach South West Nile Co-Operation Nebbi
Clark Cotton(Uganda)Ltd Soroti Rhino Camp Central West Nile Union Pakwach
Co-orom West Acholi Co-Operation Union Gulu Rwenzori Cotton Ginners Kasese Dabani Minar Trading Company Busia UNACOFF Hoima Magnetic Enterprises Hoima Iki Iki Pallisa Iceme Located In Apac Apac Jaber Kabole North Bukedi Union Pallisa
COMPANIES INVOLVED IN COTTON PROCESSING EXPORTERS AND IMPORTERS OF COTTON PRODUCTS
Phoenix Logistics (U) Ltd 5th Street Industrial Area Dunavant-lint Head Quarters in Kampala 6th Street Industrial Area
Southern Range Nyanza Plot1 Yusuf Lule Road Jinja Plexus-lint Ntinda Industrial Area
African Textile Mill Pallisa Road Mbale District
Olam international-lint
Mapeera Road in Nalukolongo Industrial Area
Pearl Blankets Nakawa Industrial Area Kampala-Nakawa

92 | P a g e
Appendix 5: The Tea Processors/Exporters
Name Location Toeo and Mityana Tea Co.Ltd Mityana Toro and Mityana Tea Co. Ltd(TAMTECO)ityana Tea Co.Ltd
Mityana
Rusekere Growers Tea Factory Ltd Fortportal Rwenzori Commodities Ltd .Mukwano Tea Kampala
Namayaiba Ted Estate Ltd. Kampala
Mwera Tea (Madhvani Group of Companies) Kampala Mpanga Tea Growers Tea Factory Ltd. Fortportal
Mabale Grower Tea Factory Ltd. Fortportal Kijula Tea Estate Fortportal Kayonza Growers Tea Factory Kanungu
Eagle Holdings Ltd (EHL) Kampala
Rwenzori Highlands Tea Co. Ltd. Kampala
Dayalbhai Mandanji and Co. Ltd Fortportal
Eagle Investments Ltd Jinja James Finlay (U) Ltd. Fortportal Igara Growers Tea Factory Igara Uganda Tea Development Agency Ltd (U.T.D.A.L) Kampala Uganda Tea Cooperation Ltd. Kampala
Uganda Tea Association (U.T.A) Kampala
Rwenzori Tangawizi Tea Fortportal

93 | P a g e
Appendix 6: Map showing cassava growing and trading areas in Uganda
Source: UIA (2015)
Fresh Cassava Cassava Flour Dried Cassava Chips

94 | P a g e
Appendix 7: The Top 10 Vanilla producing countries for the year 2015
Country Vanilla Production (MT) 1 Madagascar 3,500 2 Indonesia 3,400 3 China 1,350 4 Mexico 463 5 Papua New Guinea 433 5 China 335 6 Turkey 290 7 Tonga 202 8 Uganda 170 9 French Polynesia 60 10 Comoros 42 Sources: FAOSTAT data, 2015
Appendix 8: Institutions that Support the Flower Industry in Uganda Institution Form/Nature of
Support Details
USAID Financial support Supports capacity building and research programmes to UFEA members
World Bank Financial support Supporting research on increasing exports of high value agricultural commodities; the support mainly comes from the department of Environmentally and Socially Sustainable Development Department of the World Bank Africa Region (ESSD-Africa)
Makerere university, Kawand and Kabanyolo Research institute
Research Carries out research and trials on various plant species and trains students, communities and other interested groups on carrying out new innovations and technologies
UFEA Advocacy, Quality, inputs
Umbrella organization for large scale flower farmers and exporters, it provides business development services to members and influences government policies
Uganda Horticulture & allied workers union
Advocacy, pressure group
Advocates for the safety and rights of workers in the horticulture industry
Local government Licences and monitoring
Give flower farmers licenses to operate in their areas and also get taxes and monitors their activities if they are complying with NEMA
Chemical Companies
Chemicals supply These sell chemicals and fertilizers that are used in the flower firms
MAIAF Regulating and monitoring
Regulates importation and use of chemicals that are used in agriculture through the department of crop protection and inspection
Local communities Host the farms Host the flower farms and provide labour to the flower farmers
Civil Society Organisations
Advocacy/suggests alternatives
suggest alternative views to sustainable development of the industry
URA Revenue collection Collects taxes/revenue from flower farmers Source: NAPE, 2011

95 | P a g e
Appendix 9: Major Dairy Processors in Uganda
Name of company Location Installed capacity Litres/day
Capacity utilisation Litres /day
Product range
Sameer Agriculture & Livestock Ltd. (SALL)
Kampala 550,000 375,000 Pasteurised milk, UHT, yoghurt, butter, ghee, powdered milk
G.B.K Dairy products (U) Ltd
Mbarara 96,000 50,000 Pasteurised milk, UHT, ghee
Jesa Dairy Farm Busunju 100,000 30,000 Pasteurised milk, yoghurt, butter, cream
Hillside Dairy & Agriculture Ltd.
Mbarara 40,000 3,000 Pasteurised milk, yoghurt
Birunga Dairy Kisoro 15,000 8,000 UHT Maama Omulungi Dairy Kampala 8,000 8,000 Pasteurised milk West Nile Dairies Jinja 6,000 3,000 Pasteurised milk, yoghurt,
cream, ghee NIRMA Dairy & Foods Ltd.
Entebbe 5,000 2,200 Pasteurised milk, yoghurt, cheese
Toro Dairy Cooperative Fort portal 4,000 2,000 Pasteurised milk, yoghurt MADDO Dairies Ltd. Masaka 4,000 2,500 Pasteurised, yoghurt Paramount Dairies Mbarara 3,000 2,500 cheese Family Choice Mbarara 2,000 1,200 Pasteurised milk, yoghurt,
ghee, sour butter Seasons Dairy Kayunga 5,000 4,000 Cheese Rainbow Industries Mukono 20,000 20,000 UHT, ice cream, yoghurt Pearl Dairy Mbarara 240,000 - Casein, UHT, Yoghurt,
pasteurised milk Holland Diary Kampala 10,000 10,000 Cheese (Gouda cheese) Amos Dairies Kiruhura 400,000 ( to
be increased to 2,000,000)
400,000 Anhydrous milk fat, ghee, casein and whey
Kookee Enterprises Kampala - - Cheese, cream Source: DDA 2013

96 | P a g e
Appendix 10: Sector specific policies and legislations
Coffee The National Coffee policy, 2013 Cotton The Cotton Regulations, 2005
The Cotton Development Instrument, 2004
Fisheries The National Fisheries Policy, 2004 The Draft National Policy on Fisheries Management and Development of small Fishes Fish act Chapter_197
The Fish (Aquaculture) Rules, 2003
The Fish (Beach Management) Rules, 2003 Livestock The National Meat policy, 2003
The National Policy for Delivery of Veterinary Services The National Animal Feeds Policy The Dairy Regulations 2003 Diary Development Policy Animal Disease Control Policy Animal Breeding Policy The national Veterinary Drug Policy Delivery of Veterinary Services Policy Range Land Policy The Cattle Traders Rules
Hides ,Skins and Leather Industry Hide and skin export duty act Chapter_339
Hide and skin trade act Chapter_89