the airport operator 2019 financial health report
TRANSCRIPT

1
The Airport Operator 2019 Financial Health Report
12 Jan 2021
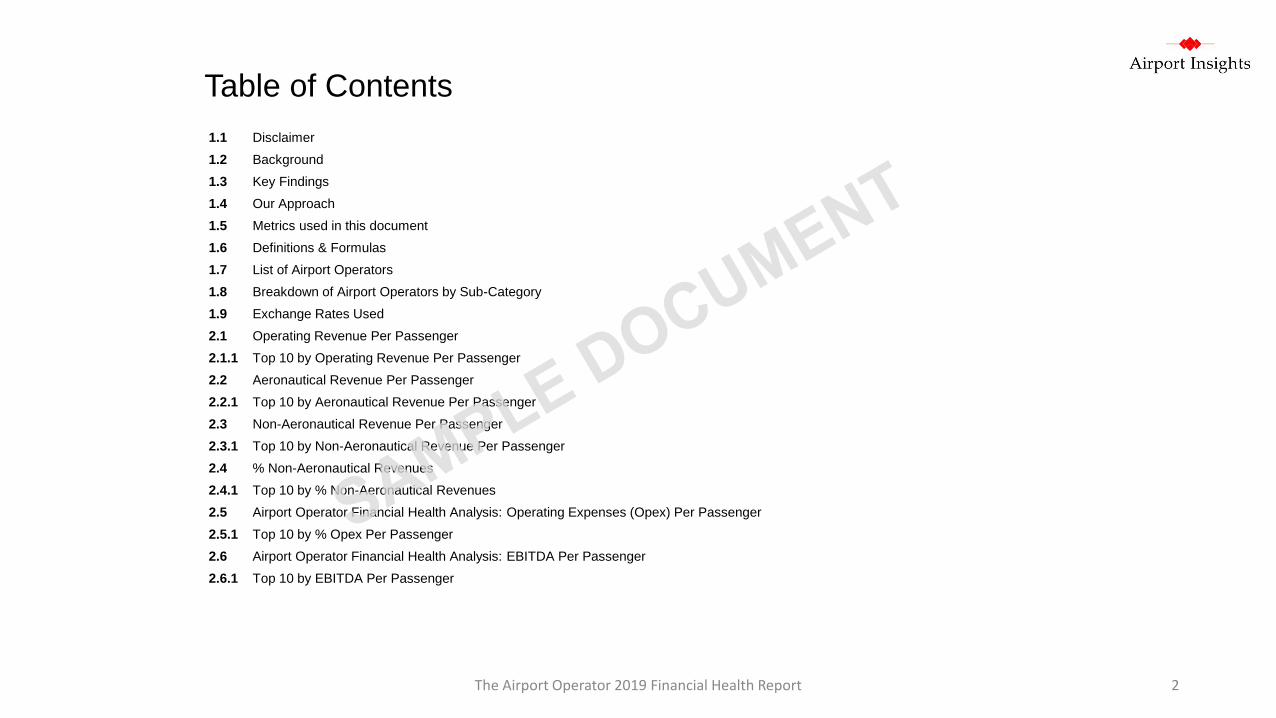
Table of Contents
2.6.1 Top 10 by EBITDA Per Passenger
2.5.1 Top 10 by % Opex Per Passenger
2.5 Airport Operator Financial Health Analysis: Operating Expenses (Opex) Per Passenger
2.4.1 Top 10 by % Non-Aeronautical Revenues
2.3.1 Top 10 by Non-Aeronautical Revenue Per Passenger
2.3 Non-Aeronautical Revenue Per Passenger
2.2.1 Top 10 by Aeronautical Revenue Per Passenger
2.2 Aeronautical Revenue Per Passenger
2.1.1 Top 10 by Operating Revenue Per Passenger
1.9 Exchange Rates Used
1.8 Breakdown of Airport Operators by Sub-Category
1.6 Definitions & Formulas
1.7 List of Airport Operators
1.3 Key Findings
1.1 Disclaimer
1.2 Background
1.4 Our Approach
1.5 Metrics used in this document
2.1 Operating Revenue Per Passenger
2.4 % Non-Aeronautical Revenues
2.6 Airport Operator Financial Health Analysis: EBITDA Per Passenger
The Airport Operator 2019 Financial Health Report 2

Table of Contents
2.8.1 Top 10 Airport Operators by EBIT Per Passenger
2.11.1 Top 10 Airport Operators by Net Margin
2.10.1 Top 10 Airport Operators by Net Profit Per Passenger
2.9.1 Top 10 Airport Operators by EBIT Margin
2.9 Airport Operator Financial Health Analysis: EBIT Margin
2.12.1 Top 10 Airport Operators by Return on Assets
2.13 Airport Operator Financial Health Analysis: Return on Capital Employed
2.13.1 Top 10 Airport Operators by Return on Capital Employed
2.14 Airport Operator Financial Health Analysis: % Cash Over Current Assets
2.14.1 Top 10 Airport Operators by % Cash over Current Assets
2.15 Airport Operator Financial Health Analysis: Cash Ratio
2.15.1 Top 10 Airport Operators by Cash Ratio
2.16 Airport Operator Financial Health Analysis: Current Ratio
2.16.1 Top 10 Airport Operators by Current Ratio
2.7 Airport Operator Financial Health Analysis: EBITDA Margin
2.7.1 Top 10 Airport Operators by EBITDA Margin
2.8 Airport Operator Financial Health Analysis: EBIT Per Passenger
2.10 Airport Operator Financial Health Analysis: Net Profit Per Passenger
2.11 Airport Operator Financial Health Analysis: Net Margin
2.12 Airport Operator Financial Health Analysis: Return on Assets
2.17 Airport Operator Financial Health Analysis: Operating Cash Flow Ratio
The Airport Operator 2019 Financial Health Report 3
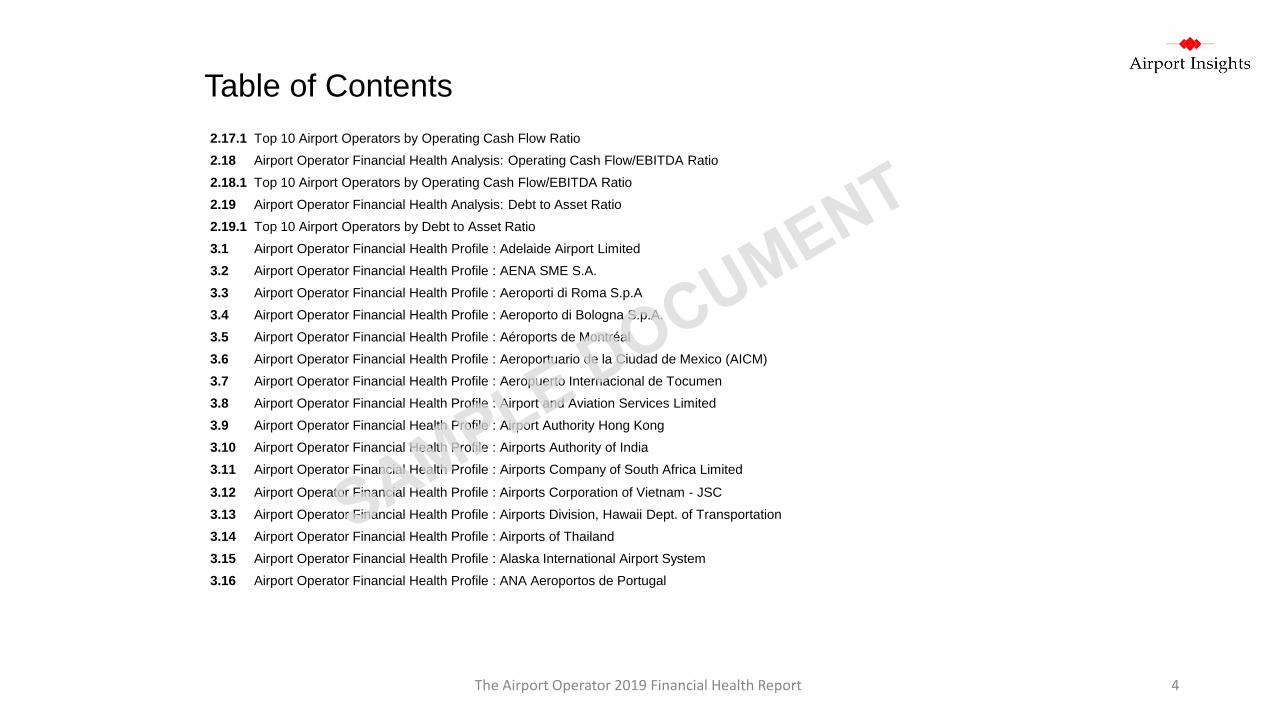
Table of Contents
2.17.1 Top 10 Airport Operators by Operating Cash Flow Ratio
2.18.1 Top 10 Airport Operators by Operating Cash Flow/EBITDA Ratio
2.19 Airport Operator Financial Health Analysis: Debt to Asset Ratio
2.19.1 Top 10 Airport Operators by Debt to Asset Ratio
3.13 Airport Operator Financial Health Profile : Airports Division, Hawaii Dept. of Transportation
3.14 Airport Operator Financial Health Profile : Airports of Thailand
3.15 Airport Operator Financial Health Profile : Alaska International Airport System
3.16 Airport Operator Financial Health Profile : ANA Aeroportos de Portugal
2.18 Airport Operator Financial Health Analysis: Operating Cash Flow/EBITDA Ratio
3.1 Airport Operator Financial Health Profile : Adelaide Airport Limited
3.2 Airport Operator Financial Health Profile : AENA SME S.A.
3.3 Airport Operator Financial Health Profile : Aeroporti di Roma S.p.A
3.4 Airport Operator Financial Health Profile : Aeroporto di Bologna S.p.A.
3.5 Airport Operator Financial Health Profile : Aéroports de Montréal
3.6 Airport Operator Financial Health Profile : Aeroportuario de la Ciudad de Mexico (AICM)
3.7 Airport Operator Financial Health Profile : Aeropuerto Internacional de Tocumen
3.8 Airport Operator Financial Health Profile : Airport and Aviation Services Limited
3.9 Airport Operator Financial Health Profile : Airport Authority Hong Kong
3.10 Airport Operator Financial Health Profile : Airports Authority of India
3.11 Airport Operator Financial Health Profile : Airports Company of South Africa Limited
3.12 Airport Operator Financial Health Profile : Airports Corporation of Vietnam - JSC
The Airport Operator 2019 Financial Health Report 4

Table of Contents
3.17 Airport Operator Financial Health Profile : Athens International Airport SA
3.18 Airport Operator Financial Health Profile : Atlanta Department of Aviation
3.19 Airport Operator Financial Health Profile : Auckland International Airport Limited
3.20 Airport Operator Financial Health Profile : Australia Pacific Airports Corporation Limited
3.21 Airport Operator Financial Health Profile : Avinor Group
3.22 Airport Operator Financial Health Profile : Beijing Capital International Airport Co,. Ltd
3.23 Airport Operator Financial Health Profile : Birmingham Airport Limited
3.24 Airport Operator Financial Health Profile : Brisbane Airport Corporation
3.25 Airport Operator Financial Health Profile : Burbank–Glendale–Pasadena Airport Authority
3.26 Airport Operator Financial Health Profile : Calgary Airport Authority
3.27 Airport Operator Financial Health Profile : Central Japan International Airport Co. Ltd
3.28 Airport Operator Financial Health Profile : Changi Airport Group (S) Pte Ltd
3.29 Airport Operator Financial Health Profile : Chicago Department of Aviation (Midway)
3.30 Airport Operator Financial Health Profile : Chicago Department of Aviation (O’Hare)
3.31 Airport Operator Financial Health Profile : Christchurch International Airport Limited
3.32 Airport Operator Financial Health Profile : City & County of Denver Department of Aviation
3.33 Airport Operator Financial Health Profile : San Francisco City & County Airport Commission
3.34 Airport Operator Financial Health Profile : Clark County Department of Aviation
3.35 Airport Operator Financial Health Profile : Clark International Airport Corporation
3.36 Airport Operator Financial Health Profile : Cochin International Airport Limited
3.37 Airport Operator Financial Health Profile : Concessionaria Aeroporto Internacional de Guarulhos SA
The Airport Operator 2019 Financial Health Report 5

Table of Contents
3.38 Airport Operator Financial Health Profile : Concessionaria Aeroporto de Calama SA
3.39 Airport Operator Financial Health Profile : Consorcio Aeroporto de Magallenes SA
3.40 Airport Operator Financial Health Profile : Charlotte Aviation Department
3.41 Airport Operator Financial Health Profile : Copenhagen Airports A/S
3.42 Airport Operator Financial Health Profile : Corporacion America Airports S.A.
3.43 Airport Operator Financial Health Profile : Delhi International Airport Limited
3.44 Airport Operator Financial Health Profile : DFW Airport Board
3.45 Airport Operator Financial Health Profile : DME Limited
3.46 Airport Operator Financial Health Profile : Edmonton Airports Authority
3.47 Airport Operator Financial Health Profile : Finavia Oyj
3.48 Airport Operator Financial Health Profile : Flughafen Munchen GmbH
3.49 Airport Operator Financial Health Profile : Flughafen Wien AG
3.50 Airport Operator Financial Health Profile : Flughafen Zurich AG
3.51 Airport Operator Financial Health Profile : Fraport AG
3.52 Airport Operator Financial Health Profile : Genève Aéroport
3.53 Airport Operator Financial Health Profile : Greater Orlando Aviation Authority
3.54 Airport Operator Financial Health Profile : Greater Toronto Airports Authority
3.55 Airport Operator Financial Health Profile : Groupe ADP (Aéroports de Paris SA)
3.56 Airport Operator Financial Health Profile : Grupo Aeroportuario del Centro Norte
3.57 Airport Operator Financial Health Profile : Grupo Aeroportuario del Pacífico
3.58 Airport Operator Financial Health Profile : Grupo Aeroportuario del Sureste
The Airport Operator 2019 Financial Health Report 6

Table of Contents
3.59 Airport Operator Financial Health Profile : A.B. Won Pat International Airport Authority, Guam
3.60 Airport Operator Financial Health Profile : Guangzhou Baiyun International Airport Co.
3.61 Airport Operator Financial Health Profile : Hainan Meilan International Airport Co. Ltd
3.62 Airport Operator Financial Health Profile : Halifax International Airport Authority
3.63 Airport Operator Financial Health Profile : Heathrow (SP) Limited
3.64 Airport Operator Financial Health Profile : Hillsborough County Aviation Authority
3.65 Airport Operator Financial Health Profile : Houston Airport System
3.66 Airport Operator Financial Health Profile : Indianapolis Airport Authority
3.67 Airport Operator Financial Health Profile : Infraero Aeroportos
3.68 Airport Operator Financial Health Profile : Inframerica Concessionaria do Aeroporto de Brasilia S.A
3.69 Airport Operator Financial Health Profile : Isavia ohf
3.70 Airport Operator Financial Health Profile : Japan Airport Terminal Company
3.71 Airport Operator Financial Health Profile : Letiště Praha
3.72 Airport Operator Financial Health Profile : Los Angeles International Airport
3.73 Airport Operator Financial Health Profile : Malaysia Airports Holdings Bhd
3.74 Airport Operator Financial Health Profile : Malta International Airport plc
3.75 Airport Operator Financial Health Profile : Manchester Airport Group
3.76 Airport Operator Financial Health Profile : Manila International Airport Authority
3.77 Airport Operator Financial Health Profile : MSP Metropolitan Airports Commission
3.78 Airport Operator Financial Health Profile : Narita International Airport Corporation
3.79 Airport Operator Financial Health Profile : Nassau Airport Development Company
The Airport Operator 2019 Financial Health Report 7

Table of Contents
3.80 Airport Operator Financial Health Profile : Nuevo Pudahuel Consortium
3.81 Airport Operator Financial Health Profile : Ottawa Cartier-MacDonald International Airport
3.82 Airport Operator Financial Health Profile : Phoenix Aviation Department
3.83 Airport Operator Financial Health Profile : Port of Seattle
3.84 Airport Operator Financial Health Profile : PT Angkasa Pura 1
3.85 Airport Operator Financial Health Profile : PT Angkasa Pura 2
3.86 Airport Operator Financial Health Profile : Royal Schiphol Group
3.87 Airport Operator Financial Health Profile : SEA Group
3.88 Airport Operator Financial Health Profile : Shanghai International Airport Co., Ltd
3.89 Airport Operator Financial Health Profile : Shenzhen Airport Co. Ltd
3.90 Airport Operator Financial Health Profile : Sheremetyevo International Airport JSC
3.91 Airport Operator Financial Health Profile : Sialkot International Airport Limited
3.92 Airport Operator Financial Health Profile : SJSC Riga International Airport
3.93 Airport Operator Financial Health Profile : Swedavia AB
3.94 Airport Operator Financial Health Profile : Sydney Airport Limited
3.95 Airport Operator Financial Health Profile : Tallin Airport Limited
3.96 Airport Operator Financial Health Profile : Toscana Aeroporti S.A.
3.97 Airport Operator Financial Health Profile : Vancouver Airport Authority
3.98 Airport Operator Financial Health Profile : Winnipeg Airports Authority
3.99 Airport Operator Financial Health Profile : Xiamen International Airport Co. Ltd
3.100 Airport Operator Financial Health Profile : Zambia Airports Corporation
The Airport Operator 2019 Financial Health Report 8

All of the information in this report is sourced from the public domain. While we endeavour to keep the information up to date and correct, we
(neither the company nor any of its employees) make no representations or warranties of any kind, express or implied, about the completeness,
accuracy, reliability or suitability of the information contained in the report for any purpose. Any reliance you place on such information is therefore
strictly at your own risk.
As the sources of the data gathered fall under different geographical territories and jurisdictions, readers will need to make considerations for
differences in terms of accounting as well as interpretations of terms.
In no event we will be liable for any loss or damage, indirect or consequential loss or damage, or any loss or damage whatsoever arising from
decisions taken based on the report findings. Every effort is made to keep the report information accurate and reliable. However, Airport Insights
takes no responsibility for, and will not be liable for any losses.
The information contained herein is not intended to be a source of advice or credit analysis with respect to the material presented, and does not
constitute investment advice.
<< Back to Table of Contents
The Airport Operator 2019 Financial Health Report 9
1.1 Disclaimer

1.2 Background
The COVID-19 pandemic has created an unprecedented disruption to the global air transport industry.
With the declines in passenger traffic, airport operators have had difficulty staying in business in 2020 as maintaining a profit as well as liquidity
has become more challenging than ever.
While the provision of financial support to every airport operator would be very much appreciated, there is a need to understand the financial
health of airport operators before the onset of the COVID-19 pandemic in order to identify the best airport managers, which should be in a better
position to navigate the airports through the crisis.
With the above context in mind, The Airport Operator 2019 Financial Heath Report provides a snapshot of the financial health of each of these 100
airport operators around the world using 19 metrics measured across four categories of Productivity and Cost Efficiency, Profitability, Liquidity and
Leverage.
These 100 airport operators together handled over 4.8 billion passengers in their 2019 financial year - before the onset of the COVID-19
pandemic.
In addition, a series of benchmarks in this report provides the reader with a detailed insight into the financial health of the 100 airport operators by
region, ownership structure as well as scale of operations.
<< Back to Table of Contents
The Airport Operator 2019 Financial Health Report 10

1.3 Key Findings
The 100 airport operators in this study handled handled over 4.8 billion passengers in their financial years ending in 2019 and generated
US$83 bil in annual operating revenues.
The average operating revenue per passenger generated by 100 airport operators in this study in FY19 was US$17.13, a 2.8% increase from
that in the previous financial year
The average aeronautical revenue generated per passenger by 90 airport operators in this study was US$9.49, a 0.5% increase from that in
the previous financial year.
The average non-aeronautical revenue generated per passenger by 90 airport operators in this study was US$8.09 a 2.5% increase from that
in the previous financial year.
The average operating cost per passenger incurred by 100 airport operators was US$12.29, a 4.5% increase from the average operating cost
per passenger in FY18.
The average earnings before interests, taxes and depreciation and amortization (EBITDA) margin for 100 airport operators was 46.4%, 2.6
percentage points lower than that in FY18.
The average earnings before interest and taxes (EBIT) per passenger generated by 100 airport operators in this study was US$4.91, a 2.7%
decline from the average EBIT per passenger in FY18.
The average return on capital employed (ROCE) for 100 airport operators was 6.8%, 0.4 percentage points lower than that in FY18.
The average current ratio achieved by 100 airport operators in this study was 1.27, 0.05 points lower than that achieved in FY18.
The average operating cash flow to EBITDA ratio achieved by 100 airport operators in this study was 0.84.
The average debt to asset ratio achieved by 100 airport operators in this study was 0.63, 0.01 points lower than that achieved in FY18.
<< Back to Table of Contents
The Airport Operator 2019 Financial Health Report 11

1.4 Our Approach
The purpose of our research has been to analyze and benchmark the financial health of airport operators in the period before the outbreak of the
global COVID-19 pandemic. We have therefore the following measures in our approach.
1. Data gathered for the 100 airport operators was for the latest financial year ending at a date in the year 2019 (31 March 2019, 31 June 2019,
31 Sept 2019 or 31 Dec 2019).
2. We measured the financial health of the airports based on 19 metrics that indicate their performance & cost efficiency, profitability, liquidity
and leverage using data from publicly available annual reports and financial statements.
3. Airports operator financial health has been compared across geographical regions, scales of operation (based on annual passenger
throughput) and ownership models.
4. We have expressed all financial figures in this document in United States dollars. For airport operators that reported their financial results in
other currencies, their financial results have been converted to United States dollars using an appropriate constant exchange rate.
5. In some cases, data has been normalized to allow for fairer comparison. Such examples include removing construction revenues from total
operating revenues and construction expenses from total operating expenses in the P&L statements of certain airport operators as these
items are not affected by passenger operations. We believe that this allows for better apple-to-apples comparison.
<< Back to Table of Contents
The Airport Operator 2019 Financial Health Report 12
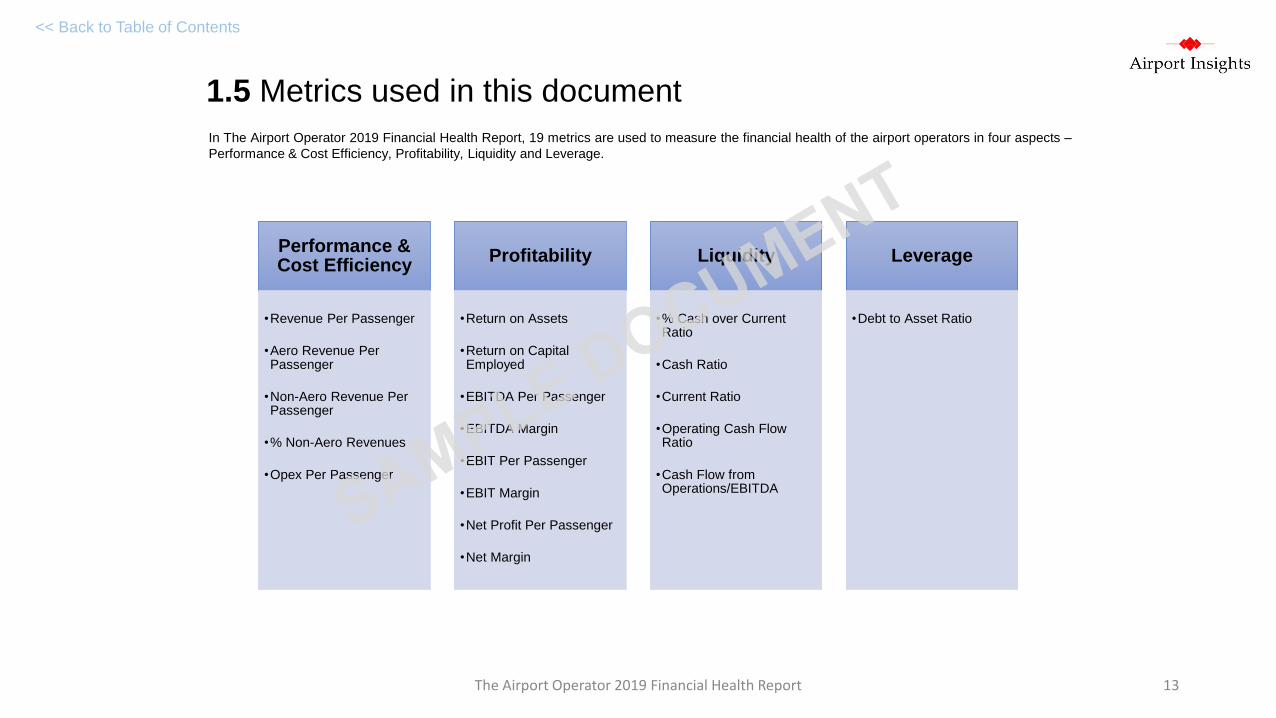
1.5 Metrics used in this document
Performance & Cost Efficiency
•Revenue Per Passenger
•Aero Revenue Per Passenger
•Non-Aero Revenue Per Passenger
•% Non-Aero Revenues
•Opex Per Passenger
Profitability
•Return on Assets
•Return on Capital Employed
•EBITDA Per Passenger
•EBITDA Margin
•EBIT Per Passenger
•EBIT Margin
•Net Profit Per Passenger
•Net Margin
Liquidity
•% Cash over Current Ratio
•Cash Ratio
•Current Ratio
•Operating Cash Flow Ratio
•Cash Flow from Operations/EBITDA
Leverage
•Debt to Asset Ratio
In The Airport Operator 2019 Financial Health Report, 19 metrics are used to measure the financial health of the airport operators in four aspects –
Performance & Cost Efficiency, Profitability, Liquidity and Leverage.
<< Back to Table of Contents
The Airport Operator 2019 Financial Health Report 13

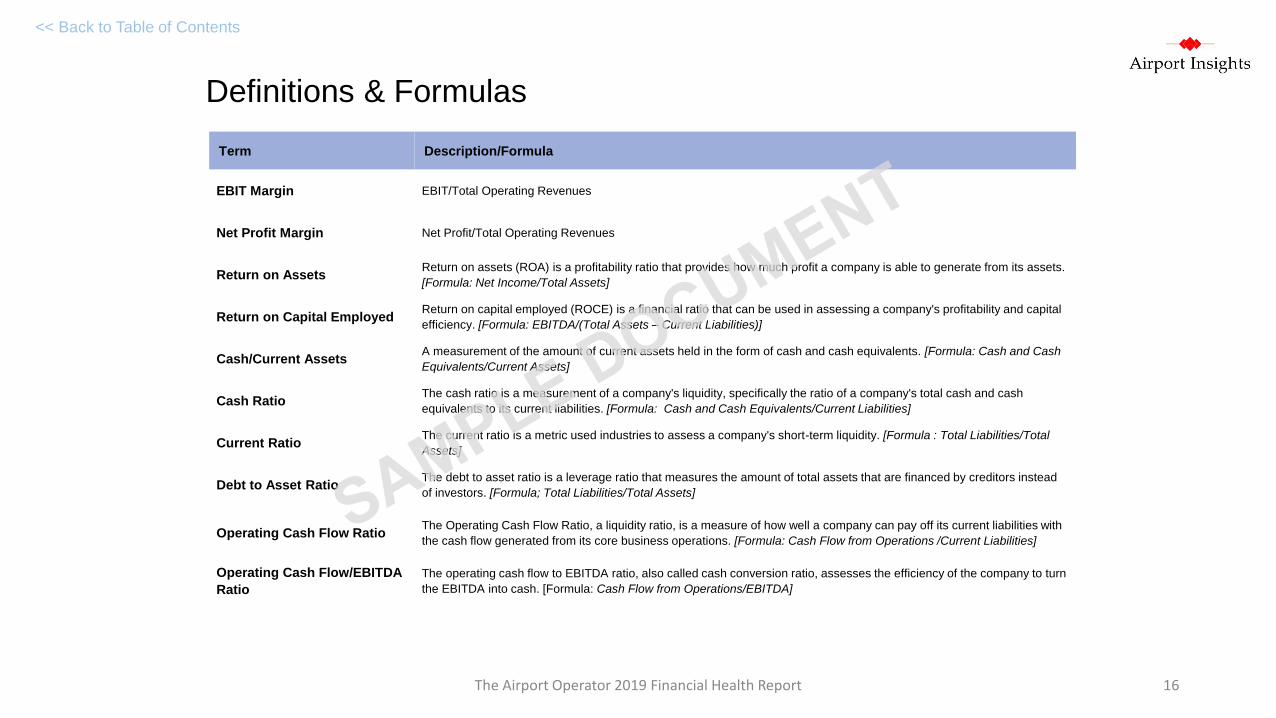
1.6 Definitions & Formulas
Term Description/Formula
Airport Operator
Entity operating the airport(s). In this study, it could refer to the specific department of the government authority running the
airport, an independent or corporatized airport operator, an airport concession operator, or a subsidiary of a larger multi-
country airport operator.
Passengers Total number of passengers (arriving and departing) including transfer passengers.
Operating Revenue Revenue obtained from airport operations.
Aeronautical Revenues
Aeronautical revenues at airports are derived mainly from services provided to aircraft such as the use of the runway,
taxiways and aprons and also ground-handling services. This category of revenues also includes revenue from passenger
service fees or airport improvement fees.
Non-Aeronautical RevenueNon-aeronautical revenues at airports are derived from the provision of services that are separate from the airport’s core
service offering.
Operating Expenses (OPEX) Costs to operate the airport on a day-to-day basis including depreciation & amortization expenses.
EBITDA Earnings before Interest, Tax, Depreciation and Amortization
EBITEarnings before Interest and Taxes. [Formula: Operating Revenue - Operating Expenses (including depreciation and
amortization)]
Net Profit The amount of accounting profit the airport operator has left over after paying off all its expenses
Cash & Cash EquivalentsCash and cash equivalents are assets that are in cash or can be converted into cash immediately. They include bank
accounts and marketable securities, which are debt securities with maturities of less than 90 days
Current AssetsCash and its other assets that are expected to be converted to cash within one year of the date appearing in the heading of
the company's balance sheet.
Total Assets Assets owned by the airport operator that have economic value whose benefits can be derived in the future.
<< Back to Table of Contents
The Airport Operator 2019 Financial Health Report 14

Definitions & Formulas
<< Back to Table of Contents
Term Description/Formula
Current Liabilities A company's short-term financial obligations that are due within one year or within a normal operating cycle
Total Liabilities The total amount of all financial obligations of a company including all creditor claims on company assets
Net Cash Flow from
OperationsAmount of cash generated from the airport operator’s day-to-day business activity
Operating Revenue Per Pax Operating Revenue/Number of Passengers.
Opex Per Pax Operating Expenses/Number of Passengers
Aero Revenue Per Pax Aero Rev/Number of passengers
Non-Aero Revenue Per Pax Non-Aero Rev/Number of passengers
% Non-Aero Rev Non-Aeronautical Revenues/Total Operating Revenues
EBITDA Per Pax EBITDA/Number of Passengers
EBIT Per Pax EBIT/Number of Passengers
Net Profit Per Pax Net Profit/Number of Passengers
EBITDA Margin EBITDA/Total Operating Revenues
The Airport Operator 2019 Financial Health Report 15
Definitions & Formulas
<< Back to Table of Contents
Term Description/Formula
EBIT Margin EBIT/Total Operating Revenues
Net Profit Margin Net Profit/Total Operating Revenues
Return on AssetsReturn on assets (ROA) is a profitability ratio that provides how much profit a company is able to generate from its assets.
[Formula: Net Income/Total Assets]
Return on Capital EmployedReturn on capital employed (ROCE) is a financial ratio that can be used in assessing a company's profitability and capital
efficiency. [Formula: EBITDA/(Total Assets – Current Liabilities)]
Cash/Current AssetsA measurement of the amount of current assets held in the form of cash and cash equivalents. [Formula: Cash and Cash
Equivalents/Current Assets]
Cash RatioThe cash ratio is a measurement of a company's liquidity, specifically the ratio of a company's total cash and cash
equivalents to its current liabilities. [Formula: Cash and Cash Equivalents/Current Liabilities]
Current RatioThe current ratio is a metric used industries to assess a company's short-term liquidity. [Formula : Total Liabilities/Total
Assets]
Debt to Asset RatioThe debt to asset ratio is a leverage ratio that measures the amount of total assets that are financed by creditors instead
of investors. [Formula; Total Liabilities/Total Assets]
Operating Cash Flow RatioThe Operating Cash Flow Ratio, a liquidity ratio, is a measure of how well a company can pay off its current liabilities with
the cash flow generated from its core business operations. [Formula: Cash Flow from Operations /Current Liabilities]
Operating Cash Flow/EBITDA
Ratio
The operating cash flow to EBITDA ratio, also called cash conversion ratio, assesses the efficiency of the company to turn
the EBITDA into cash. [Formula: Cash Flow from Operations/EBITDA]
The Airport Operator 2019 Financial Health Report 16
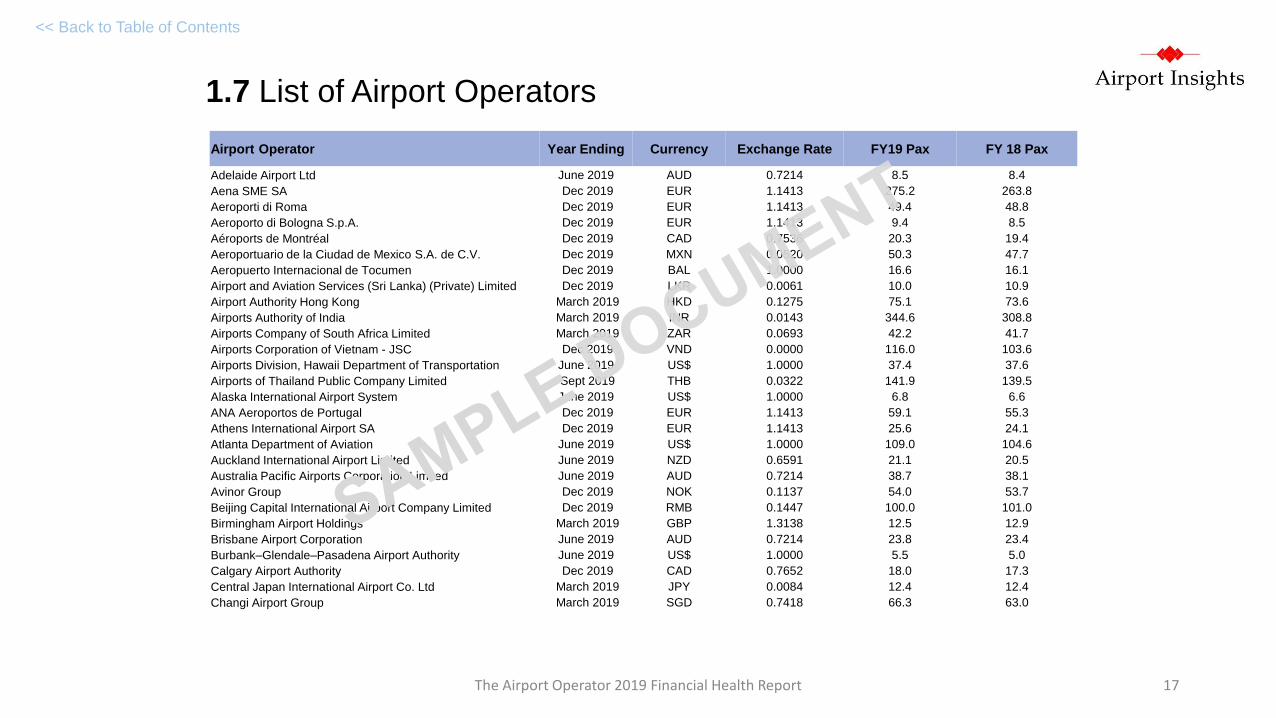
1.7 List of Airport Operators
<< Back to Table of Contents
Airport Operator Year Ending Currency Exchange Rate FY19 Pax FY 18 Pax
Adelaide Airport Ltd June 2019 AUD 0.7214 8.5 8.4
Aena SME SA Dec 2019 EUR 1.1413 275.2 263.8
Aeroporti di Roma Dec 2019 EUR 1.1413 49.4 48.8
Aeroporto di Bologna S.p.A. Dec 2019 EUR 1.1413 9.4 8.5
Aéroports de Montréal Dec 2019 CAD 0.7536 20.3 19.4
Aeroportuario de la Ciudad de Mexico S.A. de C.V. Dec 2019 MXN 0.0520 50.3 47.7
Aeropuerto Internacional de Tocumen Dec 2019 BAL 1.0000 16.6 16.1
Airport and Aviation Services (Sri Lanka) (Private) Limited Dec 2019 LKR 0.0061 10.0 10.9
Airport Authority Hong Kong March 2019 HKD 0.1275 75.1 73.6
Airports Authority of India March 2019 INR 0.0143 344.6 308.8
Airports Company of South Africa Limited March 2019 ZAR 0.0693 42.2 41.7
Airports Corporation of Vietnam - JSC Dec 2019 VND 0.0000 116.0 103.6
Airports Division, Hawaii Department of Transportation June 2019 US$ 1.0000 37.4 37.6
Airports of Thailand Public Company Limited Sept 2019 THB 0.0322 141.9 139.5
Alaska International Airport System June 2019 US$ 1.0000 6.8 6.6
ANA Aeroportos de Portugal Dec 2019 EUR 1.1413 59.1 55.3
Athens International Airport SA Dec 2019 EUR 1.1413 25.6 24.1
Atlanta Department of Aviation June 2019 US$ 1.0000 109.0 104.6
Auckland International Airport Limited June 2019 NZD 0.6591 21.1 20.5
Australia Pacific Airports Corporation Limited June 2019 AUD 0.7214 38.7 38.1
Avinor Group Dec 2019 NOK 0.1137 54.0 53.7
Beijing Capital International Airport Company Limited Dec 2019 RMB 0.1447 100.0 101.0
Birmingham Airport Holdings March 2019 GBP 1.3138 12.5 12.9
Brisbane Airport Corporation June 2019 AUD 0.7214 23.8 23.4
Burbank–Glendale–Pasadena Airport Authority June 2019 US$ 1.0000 5.5 5.0
Calgary Airport Authority Dec 2019 CAD 0.7652 18.0 17.3
Central Japan International Airport Co. Ltd March 2019 JPY 0.0084 12.4 12.4
Changi Airport Group March 2019 SGD 0.7418 66.3 63.0
The Airport Operator 2019 Financial Health Report 17

List of Airport Operators
<< Back to Table of Contents
Airport Operator Year Ending Currency Exchange Rate FY19 Pax FY 18 Pax
Charlotte Aviation Department June 2019 US$ 1.0000 47.9 46.2
Chicago Department of Aviation (Midway International) June 2019 US$ 1.0000 20.8 22.0
Chicago Department of Aviation (O'Hare International Airport) June 2019 US$ 1.0000 84.6 83.2
Christchurch International Airport Limited June 2019 NZD 0.6591 6.9 6.9
City & County of Denver Department of Aviation June 2019 US$ 1.0000 69.0 64.5
City and County of San Francisco June 2019 US$ 1.0000 57.6 57.8
Clark County Department of Aviation June 2019 US$ 1.0000 50.5 49.2
Clark International Airport Corporation Dec 2019 PHP 0.0193 4.0 2.7
Cochin Internatinal Airport Limited March 2019 INR 0.0143 10.0 10.0
Concessionaria do Aeroporto Internacional de Guarulhos SA Dec 2019 BRL 0.2860 43.0 42.8
Consorcio Aeroportuario de Calama S.A. Dec 2019 CLP 0.0014 2.3 2.0
Consorcio Aeroportuario de Magallanes S.A. Dec 2019 CLP 0.0014 1.3 1.3
Consórcio Inframérica Dec 2019 BRL 0.2860 16.7 17.9
Copenhagen Airports A/S Dec 2019 DKK 0.1499 30.3 30.3
Corporacion America S.A. Dec 2019 US$ 1.0000 83.5 81.3
Delhi International Airport Limited March 2019 INR 0.0143 69.2 65.7
DFW Airport Board Sept 2019 US$ 1.0000 73.3 69.0
DME Limited Dec 2019 RUB 0.0161 28.3 29.4
Edmonton Airports Authority Dec 2019 CAD 0.7536 8.2 8.1
Finavia Oyj Dec 2019 EUR 1.1413 26.0 25.0
Flughafen Munchen GmbH Dec 2019 EUR 1.1413 47.9 46.3
Flughafen Wien AG Dec 2019 EUR 1.1413 31.7 27.0
Flughafen Zürich AG Dec 2019 CHF 1.0065 31.5 31.1
Fraport AG Dec 2019 EUR 1.1413 122.9 121.7
Genève Aéroport Dec 2019 CHF 1.0065 17.9 17.7
Greater Orlando Aviation Authority Sept 2019 US$ 1.0000 49.8 46.9
Greater Toronto Airports Authority Dec 2019 CAD 0.7536 50.5 49.5
Groupe ADP Dec 2019 EUR 1.1413 230.5 225.0
The Airport Operator 2019 Financial Health Report 18

List of Airport Operators
<< Back to Table of Contents
Airport Operator Year Ending Currency Exchange Rate FY19 Pax FY 18 Pax
Grupo Aeroportuario del Centro Norte, S.A.B. de C.V. Dec 2019 MXN 0.0520 23.2 21.6
Grupo Aeroportuario del Pacífico, S.A.B. de C.V Dec 2019 MXN 0.0520 48.3 44.9
Grupo Aeroportuario del Sureste, S.A.B. de C.V Dec 2019 MXN 0.0520 55.7 52.3
Guam International Airport Authority Sept 2019 US$ 1.0000 3.6 3.4
Guangzhou Baiyun International Airport Co,. Ltd Dec 2019 RMB 0.1447 73.4 69.7
Hainan Meilan International Airport Co. Ltd Dec 2019 RMB 0.1447 24.2 24.1
Halifax International Airport Authority Dec 2019 CAD 0.7536 4.2 4.3
Heathrow (SP) Limited Dec 2019 GBP 1.2769 80.9 80.1
Hillsborough County Aviation Authority Sept 2019 US$ 1.0000 22.1 21.0
Houston Airport System June 2019 US$ 1.0000 59.5 55.3
Indianapolis Airport Authority Dec 2019 US$ 1.0000 9.5 9.4
Infraero Aeroportos Dec 2019 BRL 0.2860 85.7 82.7
Isavia ohf Dec 2019 ISK 0.0082 7.9 10.6
Japan Airport Terminal Company March 2019 JPY 0.0084 85.7 83.5
Letiště Praha Dec 2019 CZK 0.0436 17.8 16.7
Los Angeles International Airport June 2019 US$ 1.0000 87.9 86.6
Malaysia Airports Holdings Berhad Dec 2019 MYR 0.2416 140.6 133.2
Malta International Airport plc Dec 2019 EUR 1.1413 7.3 6.8
Manchester Airport Group March 2019 GBP 1.3138 61.8 59.5
Manila International Airport Authority Dec 2020 PHP 0.0193 47.9 45.1
Minneapolis-Saint Paul Metropolitan Airports Commission Dec 2019 US$ 1.0000 39.6 38.0
Narita International Airport Corporation March 2019 JPY 0.0084 43.2 40.9
Nassau Airport Development Co. Dec 2019 BSD 1.0000 4.1 3.7
Nuevo Pudahuel Consortium Dec 2019 CLP 0.0014 24.6 23.3
Ottawa Cartier-MacDonald International Airport Authority Dec 2019 CAD 0.7536 5.1 5.1
Phoenix Airport System June 2019 US$ 1.0000 45.6 44.4
Port of Seattle June 2019 US$ 1.0000 51.8 49.8
PT Angkasa Pura 1 Dec 2019 IDR 0.0001 77.0 90.9
The Airport Operator 2019 Financial Health Report 19

List of Airport Operators
<< Back to Table of Contents
Airport Operator Year Ending Currency Exchange Rate FY19 Pax FY 18 Pax
PT Angkasa Pura 2 Dec 2019 IDR 0.0001 90.8 111.5
Royal Schiphol Group Dec 2019 EUR 1.1413 71.7 71.1
SEA Group Dec 2019 EUR 1.1413 35.3 33.8
Shanghai International Airport Co. Ltd. Dec 2019 RMB 0.1447 76.1 74.0
Shenzhen Airport Co. Ltd Dec 2019 RMB 0.1447 52.9 49.3
Sheremetyevo Holdings LLC Dec 2019 RUB 0.0161 49.9 45.8
Sialkot International Airport Limited Dec 2019 PKR 0.0067 0.65 0.72
SJSC Riga International Airport Dec 2019 EUR 1.1413 7.8 7.1
Swedavia AB Dec 2019 SEK 0.1058 40.2 42.0
Sydney Airport Corporation Limited Dec 2019 AUD 0.6954 44.4 44.4
Tallin Airport Ltd Dec 2019 EUR 1.1413 3.3 3.0
Toscana Aeroporti S.A. Dec 2019 EUR 1.1413 8.3 8.2
Vancouver Airport Authority Dec 2019 CAD 0.7536 26.4 25.9
Winnipeg Airports Authority Dec 2019 CAD 0.7536 4.8 4.5
Xiamen International Airport Co Ltd Dec 2019 RMB 0.1447 27.4 26.6
Zambia Airports Corporation Dec 2019 ZMW 0.0716 1.81 1.92
The Airport Operator 2019 Financial Health Report 20

1.8 Breakdown of Airport Operators by Sub-Category
<< Back to Table of Contents
Count FY 19 Pax
1. Geographical Region
Asia Pacific 30 1,836
Asia Pacific (excluding Japan) 27 1,695
Australia/NZ 6 143
ASEAN (excluding Singapore) 8 618
Mainland China + HK 7 429
South Asia 5 434
Europe 28 1,445
Big 4 (UK, France, Germany, Italy) 11 934
Latin America 13 455
North America 27 1,065.7
United States 20 946.3
2. Ownership Structure
Publicly Listed 26 1,931
Partial or Full Private Ownership 24 706
Full Public Ownership 50 2,209
3. Pax Throughput
>80 mil 6 548.2
60 mil - 80 mil 7 502.4
45 mil -60 mil 12 602.6
30 mil - 45 mil 6 231.9
15 - 30 mil 16 351.6
5 - 15 mil 14 121.4
<5 mil 9 28.2
Total 100 4,845.8
Commentary
The financial health of the 100 airport operators is analyzed by
various categories and sub-categories as shown in the table across.
A few points have to be noted:
Two airport operators, Airport Company of South Africa (ACSA)
and Zambia Airports Corporation have not been included into the
analysis by geographical region as a data set of 2 is not sufficient
for the analysis of airport financial performance in the African
region.
Economic considerations have been taken into account when
identifying certain geographical regions as sub-categories. For
example, data from Singapore’s Changi Airport Group has been
excluded in the analysis for Southeast Asian airport operators
due to Singapore’s different economic status compared with the
rest of Southeast Asia.
While there are some airport operators such as Corporacion
America which operate multiple airports in more than one of the
above geographies, we have taken the assumption that the
majority of their operations are focused on one region and
therefore we have classified them as being part of the
geographical cluster where they operate most of their business.
We have identified 70 airport operators that manage only one
commercial airport and have counted only these 70 airport
operators for our analysis of financial performance by passenger
throughput.
The Airport Operator 2019 Financial Health Report 21
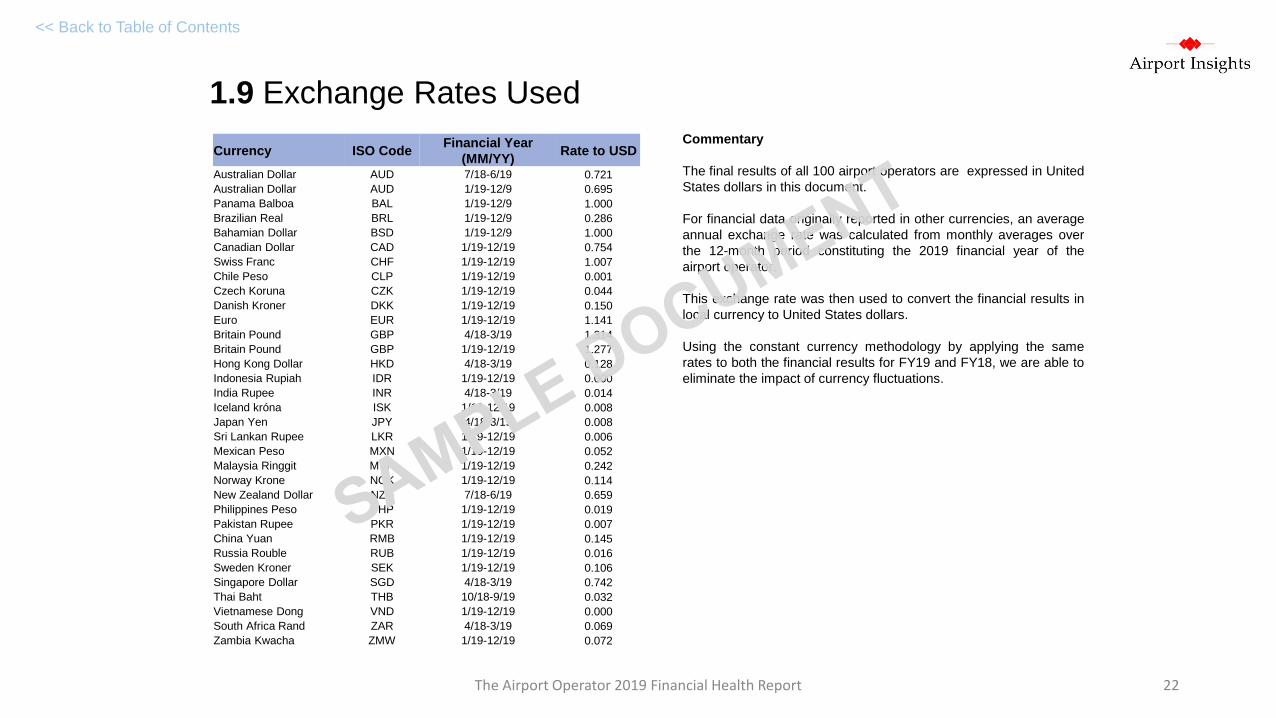
1.9 Exchange Rates Used
<< Back to Table of Contents
Commentary
The final results of all 100 airport operators are expressed in United
States dollars in this document.
For financial data originally reported in other currencies, an average
annual exchange rate was calculated from monthly averages over
the 12-month period constituting the 2019 financial year of the
airport operator.
This exchange rate was then used to convert the financial results in
local currency to United States dollars.
Using the constant currency methodology by applying the same
rates to both the financial results for FY19 and FY18, we are able to
eliminate the impact of currency fluctuations.
Currency ISO CodeFinancial Year
(MM/YY)Rate to USD
Australian Dollar AUD 7/18-6/19 0.721
Australian Dollar AUD 1/19-12/9 0.695
Panama Balboa BAL 1/19-12/9 1.000
Brazilian Real BRL 1/19-12/9 0.286
Bahamian Dollar BSD 1/19-12/9 1.000
Canadian Dollar CAD 1/19-12/19 0.754
Swiss Franc CHF 1/19-12/19 1.007
Chile Peso CLP 1/19-12/19 0.001
Czech Koruna CZK 1/19-12/19 0.044
Danish Kroner DKK 1/19-12/19 0.150
Euro EUR 1/19-12/19 1.141
Britain Pound GBP 4/18-3/19 1.314
Britain Pound GBP 1/19-12/19 1.277
Hong Kong Dollar HKD 4/18-3/19 0.128
Indonesia Rupiah IDR 1/19-12/19 0.000
India Rupee INR 4/18-3/19 0.014
Iceland króna ISK 1/19-12/19 0.008
Japan Yen JPY 4/18-3/19 0.008
Sri Lankan Rupee LKR 1/19-12/19 0.006
Mexican Peso MXN 1/19-12/19 0.052
Malaysia Ringgit MYR 1/19-12/19 0.242
Norway Krone NOK 1/19-12/19 0.114
New Zealand Dollar NZD 7/18-6/19 0.659
Philippines Peso PHP 1/19-12/19 0.019
Pakistan Rupee PKR 1/19-12/19 0.007
China Yuan RMB 1/19-12/19 0.145
Russia Rouble RUB 1/19-12/19 0.016
Sweden Kroner SEK 1/19-12/19 0.106
Singapore Dollar SGD 4/18-3/19 0.742
Thai Baht THB 10/18-9/19 0.032
Vietnamese Dong VND 1/19-12/19 0.000
South Africa Rand ZAR 4/18-3/19 0.069
Zambia Kwacha ZMW 1/19-12/19 0.072
The Airport Operator 2019 Financial Health Report 22

2.2 Aeronautical Revenue (Aero Rev) Per Passenger
<< Back to Table of Contents
Commentary
Aeronautical revenues at airports are derived mainly from services
provided to aircraft such as the use of the runway, taxiways and
aprons and also ground-handling services. This category of
revenues also includes revenue from passenger service fees or
airport improvement fees which are collected from the passengers
and paid by the airlines to the airport operators.
For FY19, the average aeronautical revenue generated per
passenger by 90 airport operators was US$9.49, a 0.5% increase
from that in the previous financial year.
In FY19, airport operators in mainland China & Hong Kong saw
average aeronautical revenue per passenger fall by -7.5 compared
to the previous year. This was due to regulatory developments on
aeronautical charges such as the abolition of the refund policy of
the Civil Aviation Development Fund in mainland China
It should also be noted due to revenues from passenger facility
charges (PFC) being classified as non-operating revenues at
airports based in the United States, this accounts for the lower
average aeronautical revenue per passenger (US$5.92) for US
airport operators.
In US$ FY19 FY18 Var
1. Geographical Region
Asia Pacific 6.57 6.58 0.0%
Asia Pacific (excluding Japan) 6.17 6.17 -0.1%
Australia/NZ 10.92 10.38 5.2%
ASEAN (excluding Singapore) 5.48 5.12 7.2%
Mainland China + HK 5.57 6.02 -7.5%
South Asia 3.19 3.35 -4.6%
Europe 13.80 13.70 0.7%
Big 4 (UK, France, Germany, Italy) 13.52 13.36 1.2%
Latin America 9.05 9.01 0.4%
North America 7.99 7.94 0.6%
United States 5.92 5.86 1.2%
2. Business Model
Publicly Listed 9.39 9.51 -1.2%
Partial or Full Private Ownership 13.71 13.45 1.9%
Full Public Ownership 8.02 7.91 1.4%
3. Pax Throughput
>80 mil 13.57 13.20 2.8%
60 mil - 80 mil 8.06 8.09 -0.3%
45 mil -60 mil 9.84 10.12 -2.8%
30 mil - 45 mil 13.62 13.82 -1.4%
15 - 30 mil 9.95 10.03 -0.7%
5 - 15 mil 7.90 7.79 1.4%
<5 mil 10.62 10.82 -1.8%
Total 9.49 9.44 0.5%Calculations based on data obtained from FY19 and FY18 Annual Reports and Financial
Statements of airport operators.
The Airport Operator 2019 Financial Health Report 23
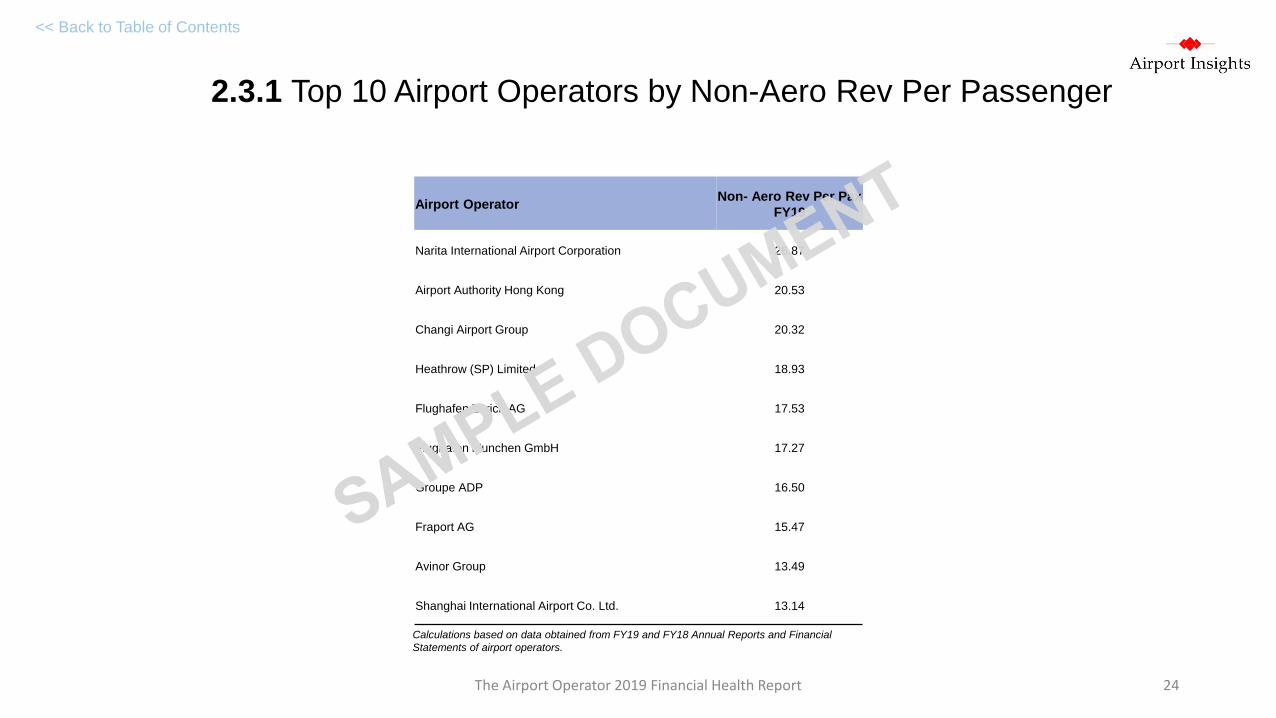
2.3.1 Top 10 Airport Operators by Non-Aero Rev Per Passenger
<< Back to Table of Contents
Airport OperatorNon- Aero Rev Per Pax
FY19
Narita International Airport Corporation 26.87
Airport Authority Hong Kong 20.53
Changi Airport Group 20.32
Heathrow (SP) Limited 18.93
Flughafen Zürich AG 17.53
Flughafen Munchen GmbH 17.27
Groupe ADP 16.50
Fraport AG 15.47
Avinor Group 13.49
Shanghai International Airport Co. Ltd. 13.14
Calculations based on data obtained from FY19 and FY18 Annual Reports and Financial
Statements of airport operators.
The Airport Operator 2019 Financial Health Report 24

2.12 Return on Assets (ROA)
<< Back to Table of Contents
Commentary
Return on assets (ROA) is a profitability ratio that provides how
much profit a company is able to generate from its assets. In other
words, return on assets (ROA) measures how efficient a company's
management is in generating earnings from economic resources or
assets on their balance sheet.
In FY19, the average return on assets (ROA) for 100 airport
operators was 4.2%, 0.1 percentage points lower than that in FY18.
The airport operators that generated the highest average ROA in
FY19 were those that:
Are based in mainland China & Hong Kong (7.8%) as well as
Southeast Asia excluding Singapore (7.2%)
Publicly-listed airport operators had a much higher ROA (6.2%) than
airport operators that have a degree of private ownership (3.9%) and
those that are fully-owned by the public sector (3.0%)
The airport operators with the lowest ROA are based in Latin
America (2.3%), North America (2.1%) and also the United States
(2.1%).
In Latin America, net losses incurred by Corporacion America and
Infraero contributed to the low ROA.
As airport operations in both Canada and the United States are
handled by the public sector, the low ROA is not unexpected.
FY19 FY18 Var
1. Geographical Region
Asia Pacific 5.6% 6.8% -1.2%
Asia Pacific (excluding Japan) 5.9% 7.2% -1.2%
Australia/NZ 3.6% 3.8% -0.2%
ASEAN (excluding Singapore) 7.2% 8.6% -1.4%
Mainland China + HK 7.8% 9.9% -2.0%
South Asia 5.5% 6.7% -1.2%
Europe 5.3% 5.0% 0.2%
Big 4 (UK, France, Germany, Italy) 4.9% 4.8% 0.0%
Latin America 2.3% 2.2% 0.1%
North America 2.1% 1.8% 0.3%
United States 2.1% 1.7% 0.4%
2. Ownership Structure
Publicly Listed 6.2% 6.3% 0.0%
Partial or Full Private Ownership 3.9% 3.7% 0.2%
Full Public Ownership 3.0% 3.3% -0.2%
3. Pax Throughput
>80 mil 2.8% 2.6% 0.2%
60 mil - 80 mil 5.1% 6.3% -1.2%
45 mil -60 mil 3.1% 2.7% 0.4%
30 mil - 45 mil 2.2% 2.5% -0.3%
15 - 30 mil 3.6% 3.8% -0.2%
5 - 15 mil 2.7% 2.4% 0.3%
<5 mil 1.7% 1.2% 0.5%
Total 4.2% 4.3% -0.1%
Calculations based on data obtained from FY19 and FY18 Annual Reports and Financial
Statements of airport operators.
The Airport Operator 2019 Financial Health Report 25

2.12.1 Top 10 Airport Operators by Return on Assets
<< Back to Table of Contents
Airport OperatorROA
FY19
Sialkot International Airport Limited 19.7%
Houston Airport System 19.3%
Consorcio Aeroportuario de Magallanes S.A. 19.0%
Grupo Aeroportuario del Centro Norte, S.A.B. de C.V. 18.7%
Aeroportuario de la Ciudad de Mexico S.A. de C.V. 17.6%
Malta International Airport plc 14.2%
Airports Corporation of Vietnam - JSC 14.1%
Shanghai International Airport Co. Ltd. 13.8%
Grupo Aeroportuario del Pacífico, S.A.B. de C.V 13.1%
Airports of Thailand Public Company Limited 12.6%
Calculations based on data obtained from FY19 and FY18 Annual Reports and Financial
Statements of airport operators.
The Airport Operator 2019 Financial Health Report 26

3.10 Airports Authority of India
<< Back to Table of Contents
In Mil US$ FY19 FY18 Var
Pax 345 309 11.6%
Oper Rev 2,024 1,858 8.9%
Aero Rev 1,173 1,110 5.7%
Non-Aero Rev 850 748 13.7%
Opex 1,495 1,219 22.6%
EBITDA 753 848 -11.3%
EBIT 528 639 -17.3%
Net Profit 325 401 -18.9%
Cash & Cash Equiv. 266 642 -58.5%
Current Assets 1,051 1,159 -9.3%
Total Assets 4,391 4,099 7.1%
Current Liabilities 1,050 745 41.0%
Total Liabilities 2,318 1,961 18.2%
Net Oper. Cash Flow 425 583 -27.1%
In US$ FY19 FY18 Var
Oper Rev Per Pax 5.87 6.02 -2.4%
Opex Per Pax 4.34 3.95 9.9%
Aero Rev Per Pax 3.40 3.60 -5.3%
Non-Aero Rev Per Pax 2.47 2.42 1.9%
% Non-Aero Rev 42.0% 40.3% 1.8%
EBITDA Per Pax 2.18 2.75 -20.5%
EBIT Per Pax 1.53 2.07 -25.9%
Net Profit Per Pax 0.94 1.30 -27.4%
EBITDA Margin 11.4% 14.9% -3.5%
EBIT Margin 8.0% 11.2% -3.2%
Net Margin 4.9% 7.1% -2.1%
Return on Assets 7.4% 9.8% -2.4%
Return on Capital Employed 15.8% 19.0% -3.2%
FY19 FY18 Var
Cash / Current Assets 0.25 0.55 -0.30
Cash Ratio 0.25 0.86 -0.61
Current Ratio 1.00 1.56 -0.56
Oper. Cash Flow Ratio 0.40 0.78 -0.38
CFO/EBITDA Ratio 0.56 0.69 -0.12
Debt to Asset Ratio 0.53 0.48 0.05
The Airports Authority of India or AAI is a statutory body working
under the Ministry of Civil Aviation, Government of India. It is
responsible for creating, upgrading, maintaining and managing
civil aviation infrastructure in India.
Data obtained from FY19 and FY18 Annual Reports and Financial Statements and converted to
US$ where required. Refer to slide titled “List of Airport Operators” for exchange rate used.
The Airport Operator 2019 Financial Health Report 27

3.27 Central Japan International Airport Co. Ltd
<< Back to Table of Contents
In US$ FY19 FY18 Var
Pax 12.4 12.4 0.0%
Oper Rev 537 493 9.0%
Aero Rev - - -
Non-Aero Rev - - -
Opex 454 418 8.7%
EBITDA 183 169 8.7%
EBIT 83 74 11.1%
Net Profit 54 46 17.8%
Cash & Cash Equiv. 205 113 80.8%
Current Assets 262 161 63.0%
Total Assets 3,827 3,729 2.6%
Current Liabilities 280 395 -29.1%
Total Liabilities 2,845 2,877 -1.1%
Net Oper. Cash Flow 170 162 4.9%
In US$ FY19 FY18 Var
Oper Rev Per Pax 43.45 39.85 9.0%
Opex Per Pax 36.76 33.83 8.7%
Aero Rev Per Pax - - -
Non-Aero Rev Per Pax - - -
% Non-Aero Rev - - -
EBITDA Per Pax 14.84 13.65 8.7%
EBIT Per Pax 6.69 6.02 11.1%
Net Profit Per Pax 4.38 3.71 17.8%
EBITDA Margin 77.5% 74.1% 3.5%
EBIT Margin 35.0% 32.7% 2.3%
Net Margin 22.9% 20.2% 2.7%
Return on Assets 1.4% 1.2% 0.2%
Return on Capital Employed 2.3% 2.2% 0.1%
FY19 FY18 Var
Cash / Current Assets 0.78 0.71 0.08
Cash Ratio 0.73 0.29 0.44
Current Ratio 0.94 0.41 0.53
Oper. Cash Flow Ratio 0.61 0.41 0.20
OCF/EBITDA Ratio 0.93 0.96 -0.03
Debt to Asset Ratio 0.74 0.77 -0.03
Central Japan International Airport Company, Ltd. is the operator
of Chubu Centrair International Airport in Japan.
It was established on May 1, 1998 was designated as a
corporate body to build and manage the airport by the Minister of
Land, Infrastructure, Transport and Tourism.
50 % of the corporation’s stock is owned by a private sector.
Data obtained from FY19 and FY18 Annual Reports and Financial Statements and converted to
US$ where required. Refer to slide titled “List of Airport Operators” for exchange rate used.
The Airport Operator 2019 Financial Health Report 28
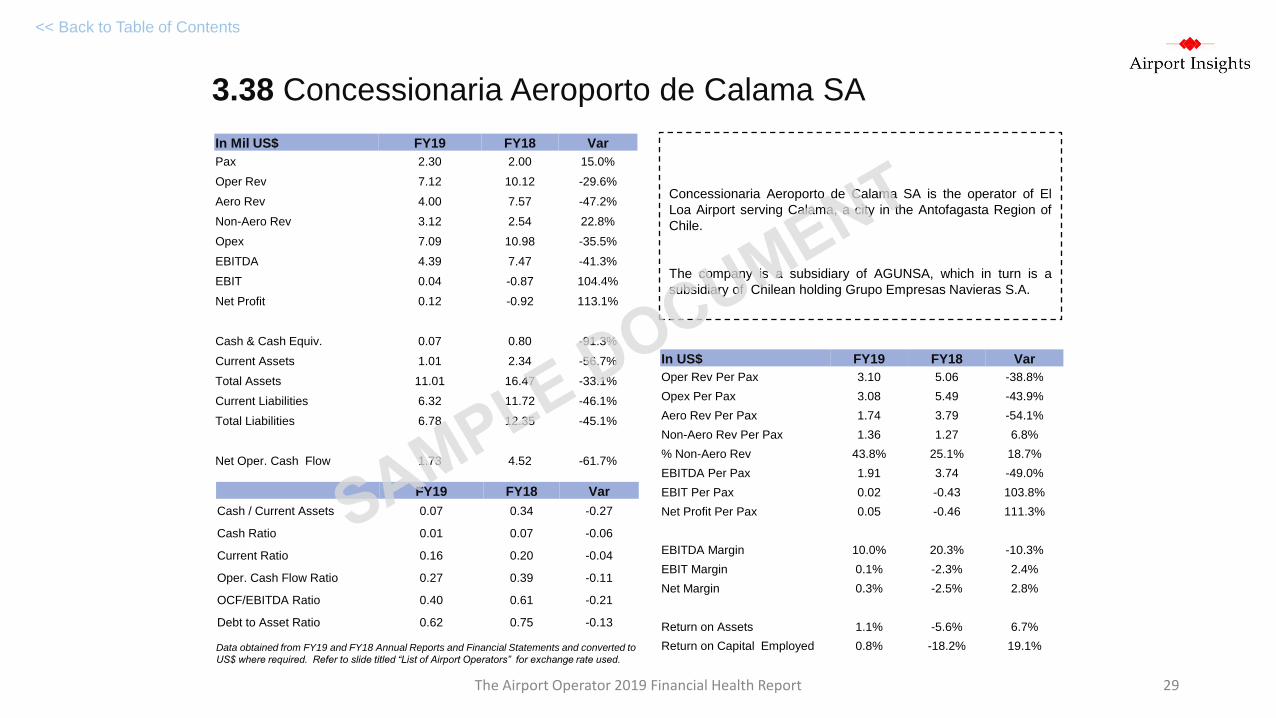
3.38 Concessionaria Aeroporto de Calama SA
<< Back to Table of Contents
In Mil US$ FY19 FY18 Var
Pax 2.30 2.00 15.0%
Oper Rev 7.12 10.12 -29.6%
Aero Rev 4.00 7.57 -47.2%
Non-Aero Rev 3.12 2.54 22.8%
Opex 7.09 10.98 -35.5%
EBITDA 4.39 7.47 -41.3%
EBIT 0.04 -0.87 104.4%
Net Profit 0.12 -0.92 113.1%
Cash & Cash Equiv. 0.07 0.80 -91.3%
Current Assets 1.01 2.34 -56.7%
Total Assets 11.01 16.47 -33.1%
Current Liabilities 6.32 11.72 -46.1%
Total Liabilities 6.78 12.35 -45.1%
Net Oper. Cash Flow 1.73 4.52 -61.7%
In US$ FY19 FY18 Var
Oper Rev Per Pax 3.10 5.06 -38.8%
Opex Per Pax 3.08 5.49 -43.9%
Aero Rev Per Pax 1.74 3.79 -54.1%
Non-Aero Rev Per Pax 1.36 1.27 6.8%
% Non-Aero Rev 43.8% 25.1% 18.7%
EBITDA Per Pax 1.91 3.74 -49.0%
EBIT Per Pax 0.02 -0.43 103.8%
Net Profit Per Pax 0.05 -0.46 111.3%
EBITDA Margin 10.0% 20.3% -10.3%
EBIT Margin 0.1% -2.3% 2.4%
Net Margin 0.3% -2.5% 2.8%
Return on Assets 1.1% -5.6% 6.7%
Return on Capital Employed 0.8% -18.2% 19.1%
FY19 FY18 Var
Cash / Current Assets 0.07 0.34 -0.27
Cash Ratio 0.01 0.07 -0.06
Current Ratio 0.16 0.20 -0.04
Oper. Cash Flow Ratio 0.27 0.39 -0.11
OCF/EBITDA Ratio 0.40 0.61 -0.21
Debt to Asset Ratio 0.62 0.75 -0.13
Concessionaria Aeroporto de Calama SA is the operator of El
Loa Airport serving Calama, a city in the Antofagasta Region of
Chile.
The company is a subsidiary of AGUNSA, which in turn is a
subsidiary of Chilean holding Grupo Empresas Navieras S.A.
Data obtained from FY19 and FY18 Annual Reports and Financial Statements and converted to
US$ where required. Refer to slide titled “List of Airport Operators” for exchange rate used.
The Airport Operator 2019 Financial Health Report 29
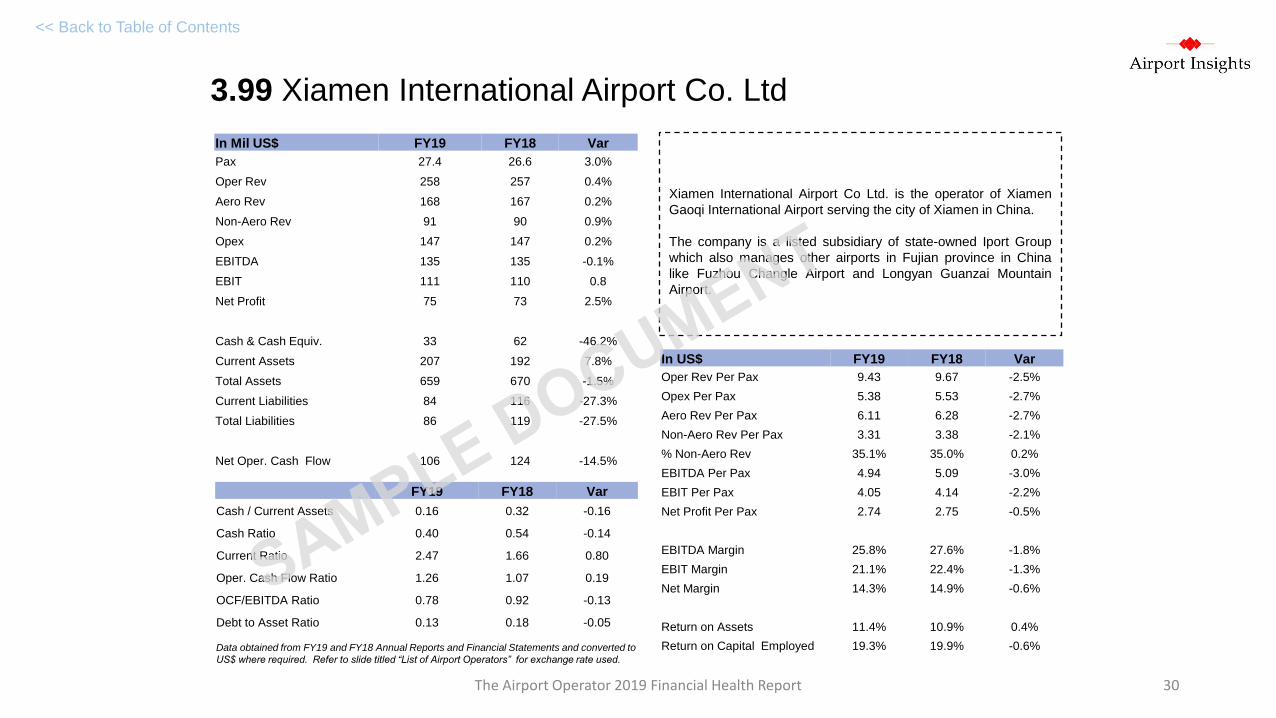
3.99 Xiamen International Airport Co. Ltd
<< Back to Table of Contents
In Mil US$ FY19 FY18 Var
Pax 27.4 26.6 3.0%
Oper Rev 258 257 0.4%
Aero Rev 168 167 0.2%
Non-Aero Rev 91 90 0.9%
Opex 147 147 0.2%
EBITDA 135 135 -0.1%
EBIT 111 110 0.8
Net Profit 75 73 2.5%
Cash & Cash Equiv. 33 62 -46.2%
Current Assets 207 192 7.8%
Total Assets 659 670 -1.5%
Current Liabilities 84 116 -27.3%
Total Liabilities 86 119 -27.5%
Net Oper. Cash Flow 106 124 -14.5%
In US$ FY19 FY18 Var
Oper Rev Per Pax 9.43 9.67 -2.5%
Opex Per Pax 5.38 5.53 -2.7%
Aero Rev Per Pax 6.11 6.28 -2.7%
Non-Aero Rev Per Pax 3.31 3.38 -2.1%
% Non-Aero Rev 35.1% 35.0% 0.2%
EBITDA Per Pax 4.94 5.09 -3.0%
EBIT Per Pax 4.05 4.14 -2.2%
Net Profit Per Pax 2.74 2.75 -0.5%
EBITDA Margin 25.8% 27.6% -1.8%
EBIT Margin 21.1% 22.4% -1.3%
Net Margin 14.3% 14.9% -0.6%
Return on Assets 11.4% 10.9% 0.4%
Return on Capital Employed 19.3% 19.9% -0.6%
FY19 FY18 Var
Cash / Current Assets 0.16 0.32 -0.16
Cash Ratio 0.40 0.54 -0.14
Current Ratio 2.47 1.66 0.80
Oper. Cash Flow Ratio 1.26 1.07 0.19
OCF/EBITDA Ratio 0.78 0.92 -0.13
Debt to Asset Ratio 0.13 0.18 -0.05
Xiamen International Airport Co Ltd. is the operator of Xiamen
Gaoqi International Airport serving the city of Xiamen in China.
The company is a listed subsidiary of state-owned Iport Group
which also manages other airports in Fujian province in China
like Fuzhou Changle Airport and Longyan Guanzai Mountain
Airport.
Data obtained from FY19 and FY18 Annual Reports and Financial Statements and converted to
US$ where required. Refer to slide titled “List of Airport Operators” for exchange rate used.
The Airport Operator 2019 Financial Health Report 30

31
1.4 About Airport Insights
The Airport Operator 2019 Financial Health Report
Airport Insights (https://www.airportinsights.com) is a provider of market , financial and competitive intelligence for airports, governments,
consultancies and investors. We utilize both primary and secondary research tools to collect the type of qualitative and quantitative data our clients
need.
For more information about our company, please email us at [email protected].