the aix group was formed in by professor gilbert 2002...
TRANSCRIPT
The Aix Group was formed in 2002 by Professor Gilbert Benhayoun, under the auspices of the Université Paul Cézanne- Aix-Marseille III in France and in coordination with Peres Center for Peace in Israel and DATA Center for Studies and Research in Palestine.
In 2015 the Aix Group, headed by its five Steering Committee members, began its sixth stage of research entitled “Politics & Economics in the Israeli-Palestinian Conflict” by tackling the following seven topics: (1) Twenty Years after Oslo and the Paris Protocol: The Protocol on Economic Relations between Israel and PLO – Analysis of its Weakness and Proposed Modifications; (2) Palestinian Economic Development: The Destructive Effect of Occupation; (3) The Economic Costs of the Conflict to Israel: The Burden and Potential Risks; (4) The Role of Economics in the Israeli-Palestinian Conflict: Analysis from Dayan's to Kerry's Economic Plan; (5) Looking Ahead – Palestinian Economy under Restrictions, Where Do We Go From Here?; (6) Alternative Strategies towards a Final Status Agreement; (7) Some Economic Aspects of the Reconstruction of Gaza.
The Aix Group held several meetings, two roundtables and ongoing consultations with Israeli, Palestinian, and international experts, academics, members of economic organizations, and officials from national governments and international institutions. The Aix Group has published this comprehensive yet concrete analysis with hope of providing key decision makers within the region and internationally with a solid basis from which to make future policy decisions. The research papers presented in this book take into account Palestinian, Israeli and international perspectives, ensuring that the research and analysis are as impartial as possible.
The Aix Group’s previous publications include the
“Economic Road Map“ (2004); “Israel and Palestine: Between Disengagement and
the Economic Road Map” (2005); “Economic
Dimensions of a Two-State Agreement between Israel
and Palestine” (2007); “Economic Dimensions of a
Two-State Agreement, vol.ll” (2010) and “The Arab Peace
Initiative and Israeli-Palestinian Peace:
The Political Economy of a New Period” (2012).
www.aixgroup.org
This book was produced with the financial assistance of the GIZ. The Contents of this publication are the sole responsibility of the Aix Groupand can under no circumstances be regarded as reflecting the position of the GIZ.
Published By
Economicsand Politics in theIsraeli PalestinianConflict
Editors: Arie ArnonSaeb Bamya
Economics and Politics in the Israeli Palestinian Conflict
AIX Group | IV
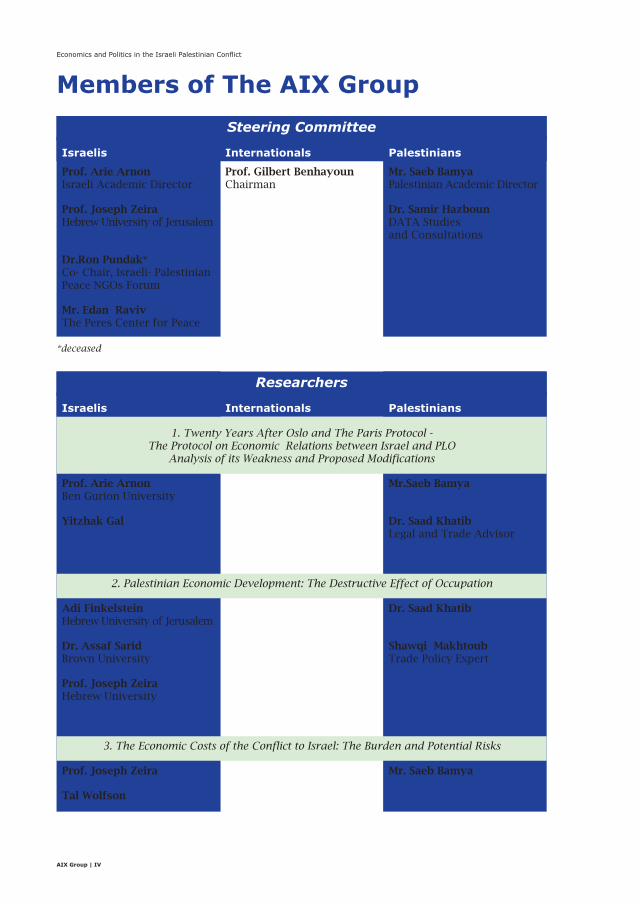
Members of The AIX Group
Steering Committee
Israelis Internationals Palestinians
Prof. Arie ArnonIsraeli Academic Director
Prof. Gilbert BenhayounChairman
Mr. Saeb BamyaPalestinian Academic Director
Prof. Joseph Zeira Hebrew University of Jerusalem
Dr. Samir HazbounDATA Studies and Consultations
Dr.Ron Pundak*Co- Chair, Israeli- Palestinian Peace NGOs Forum
Mr. Edan RavivThe Peres Center for Peace
*deceased
Researchers
Israelis Internationals Palestinians
1. Twenty Years After Oslo and The Paris Protocol -The Protocol on Economic Relations between Israel and PLO
Analysis of its Weakness and Proposed Modifications
Prof. Arie Arnon Ben Gurion University
Mr.Saeb Bamya
Yitzhak Gal Dr. Saad KhatibLegal and Trade Advisor
2. Palestinian Economic Development: The Destructive Effect of Occupation
Adi FinkelsteinHebrew University of Jerusalem
Dr. Saad Khatib
Dr. Assaf SaridBrown University
Shawqi MakhtoubTrade Policy Expert
Prof. Joseph ZeiraHebrew University
3. The Economic Costs of the Conflict to Israel: The Burden and Potential Risks
Prof. Joseph Zeira Mr. Saeb Bamya
Tal Wolfson

AIX Group | V
4. The Role of Economics in the Israeli-Palestinian Conflict: Analysis from Dayan’sto Kerry’s Economic Plan
Dr. Assaf Sarid Dr. Saad Khatib
Prof. Jimmy Weinblatt Maysa Abu Awad
Max Budovitch
5. Palestine- Israel Relations: Alternative Visions for the FutureLooking Ahead – Alternative Strategies towards a Final Status Agreement
Mr. Ilan Baruch
6. Palestine-Israel Relations: Alternative Visions For the FuturePalestinian Economy under Restrictions, Where Do We Go From Here?
Dr. Karim Nashashibi
7. Some Economic Aspects of the Reconstruction of Gaza
Prof. Arie Arnon G.E*
Adi Finkelstein Mr. Saeb Bamya
Prof. Joseph Zeira Majd Abu Obeid
Observers
Israelis Internationals Palestinians
Prof. Avi Ben-BassatHebrew University and a former Director Generalof the Ministry of Finance
Bernard PhilippeStrategic Planning, European External Action Service
Basem KhouryCEO, Pharmacare PLC
Dan CatarivasManufacturers Association of Israel
Hanan RayanCEO - PalTrade
Haggay EtkesBank of Israel
Mohammad Said Al HmaidiConsultant , B.E
Tamar HackerAdvocate, Former Advisor for the Israeli Ministry of Finance
Nisreen ShaheenCEO- Peace Works, Palestine
Yarom AriavFormer Director General of the Ministry of Finance
Sami Abu DayyehCEO- Net Tours
Tawfiq HabashMember of the Board of Directors of the Arab Chamber of Commerce & Industry, Jerusalem
Yousef DaherTourism Consultant
*In writing this paper we had important inputs from an Economist from Gaza (GE) ; for obvious reasons we use this pseudonym
The Economic Costs of the Conflict to Israel:The Burden and Potential Risks
The AIX GroupJanuary 2015
Economics and Politics in the Israeli Palestinian Conflict
AIX Group | 70
Table of ContentsExecutive Summary ......................................................................................................................... 71
1. Introduction ................................................................................................................................. 72
2. The Israeli Costs of the Wide Israeli-Arab Conflict ............................................................... 74
3. The Israeli-Palestinian Conflict and Israeli Business Cycles ................................................ 77
4. Loss of Human Capital from Conscription ............................................................................. 78
5. Additional Defense Costs .......................................................................................................... 80
5.1. Alternative Additional Costs ..................................................................................... 81
5.2. Additional Defense Costs Paid by Citizens ............................................................. 82
5.3. Defense Costs in Non-Defense Items in the Budget............................................... 82
5.4. Summary of Additional Costs ................................................................................... 83
6. The Direct Cost of Settlements ................................................................................................. 84
7. The Cost of a Potential Boycott ................................................................................................ 86
8. Potential Economic Benefits to the Conflict and to Occupation.......................................... 87
9. Summary ....................................................................................................................................... 88
Appendix........................................................................................................................................... 90
The Economic Costs of the Conflict to Israel: The Burden and Potential Risks
AIX Group | 71
Executive SummaryThis paper estimates various costs of the Israeli-Arab conflict on Israel. It begins with ob-serving that the conflict changed significantly following the peace agreement with Egypt. Before it the conflict was between conventional armies and was quite costly. After the peace, when the option of Arab war coalition against Israel practically disappeared, the conflict re-turned to its original phase, Israeli-Palestinian. Such a conflict is more between militias than between armies and it is much less costly. We show that in the previous state of the con-flicts the military costs, especially between 1967 and 1985, were so high that they almost caused fiscal collapse. Hence, any collapse of the peace with Egypt poses a great risk to the economy of Israel. The Israeli-Palestinian conflict is much less costly, but that also reduces aggregate demand in the economy, which makes it more prone to recessions. Furthermore, conflict eruptions of this conflict (like Intifadas) are long, reduce investors’ optimism, re-duce tourism, and reduce demand for consumption, as they hit populated areas. That too increases Israel’s exposure to business cycles. Indeed, while in 1950-1985 Israel experienced only two recessions, in 1985-2014 it experienced four recessions. Finally we also present new estimates for costs of the conflict in addition to the formal defense budget. These costs are on land, civil defense, security guards, and more. But the main additional cost is the loss of human capital of conscripts, due to the delay in labor and study. We show that this loss in itself can account to 4.3 percent of GDP. Overall these additional costs raise the cost of the conflict from the formal cost of 7 percent of GDP to almost 13 percent of GDP, which is around 15 percent of income.
Economics and Politics in the Israeli Palestinian Conflict
AIX Group | 72
1. IntroductionThis paper analyzes the economic costs of the Israeli-Arab conflict. Understanding the current
and the potential costs of the conflict requires a broad historical and economic analysis. Hence,
we begin with a brief history of the conflict, which focuses only on the issues that are significant
for understanding the economic aspects of this conflict. Of course, no history of this conflict
can be objective and readers usually judge carefully any such history looking for potential bi-
ases. This is not our game. We present only the elements of this story that help to explain its
economic effects on Israel. Hence, it necessarily affects the way it is told.
The Zionist settlement in Palestine began in 1882. The first waves of immigration were quite
small, but the main patterns of settlement became clear early on. The Jews avoided as much as
possible settling in existing Arab villages or towns and created separate settlements. First they
built their own villages, then neighborhoods outside towns and later separate towns. The new
immigrants were also different in their economic status, having relatively high education and
having some financial wealth, coming from European middle-class background (though from
poor countries in East Europe). The Jewish immigration and settlement began to create tensions
between the immigrants and the Palestinian population, which sometimes led to violent con-
frontations, but these were still at a personal and limited level.
Things began to change in the 1920s due to two main developments. The first one was the British
occupation of the country in 1917, which was formalized in 1922 by the Mandate given to the Brit-
ish rule by the League of Nations. The British occupation was accompanied by two conflicting prom-
ises, of national character. On the one hand was the Balfour declaration from 1917, which promised
to enable the Zionist movement to build a ‘national home to the Jewish people.’ On the other hand,
the British promised the Arab forces that helped them fight the Ottomans to help them to reach
Arab national independence. These two conflicting promises intensified the tensions in Palestine
(since then also called Eretz Yisrael). The second development was the closing of the US gates to
immigration in 1924. This left Jews in Europe and mainly in East Europe desperate, as they felt that
staying there became more dangerous by the day. Although previously the option of immigration
to Palestine, a poor and dangerous country, was viewed by them as much inferior, now they had no
choice. This changed the demography and geography of the country dramatically. In 1922, at the
first British Census, there were only 84 thousand Jews in the country, around 10 percent. After 25
years, in 1947, there were 630 thousand Jews, around a third of the population. This change im-
posed a threat on the Palestinian population that could not be ignored any longer and the conflict
between the two populations was actually unavoidable. Initially it erupted in local but coordinated
clashes in 1921 and later in 1929. These clashes were short and were quickly contained by the Brit-
ish. The clashes in 1936 were already much more intense, and continued until 1939. 1
The next round in the Jewish-Palestinian conflict began in November 1947, after the decision
of the UN to end the British Mandate and to partition the country between Jews and Arabs. At
the beginning of this round, the conflict was still taking place between militias and was fought
at local levels, but gradually the Jewish side was organizing more and more like a conventional
army. The conflict changed completely on May 15 1948, when the British left the country. First,
the Jews formed a state, Israel, and turned their previous militias into an army. Second, the
neighboring Arab states, Egypt, Trans-Jordan, Syria and to some extent Lebanon, invaded the
1. These clashes, also called the Arab Rebellion, were finally crashed by a special British force led by General Montgomery, who used extremely harsh measures. See Segev (2000).
The Economic Costs of the Conflict to Israel: The Burden and Potential Risks
AIX Group | 73
country.2 This led to the widening of the conflict, from a Jewish-Palestinian conflict into a wide
Israeli-Arab conflict. Actually it was more than a wider conflict. It turned from a conflict be-
tween militias to a fully conventional military conflict. Instead of rifles, machine guns and hand
grenades, it began to use tanks, guns and aircraft, which made the conflict much more costly.
The war ended in 1949 with the armistice agreements, but the conflict stayed on. As before,
it was dormant most of the time, but once in a while it erupted, and these eruptions became
more and more intense over time. The first one was a rather small eruption in 1956, when Israel
fought against Egypt in Sinai, allied with France and the UK. This conflict ended rather quickly
due to the joint intervention by the US and the USSR.
The second eruption was at 1967, when Israel fought against Egypt, Jordan and Syria and ended the
war controlling large territories from these countries: Sinai, Gaza, the West Bank and the Golan. This
war led to a significant intensification of the Israeli-Arab conflict, first during the war of attrition
in 1968-1970, and later the Yom Kippur War (October War) in 1973, between Israel and Egypt and
Syria. These years of intensification of the conflict were also years of spiraling military costs for
Israel (also for the neighboring Arab countries, but to a lesser extent). Actually, during the 1970s
these military costs threatened Israel’s fiscal sustainability, as shown below.
The period of intensification of the Israeli-Arab conflict came to an end in 1978-1982, with signing
of the peace agreement between Israel and Egypt and implementing it. This was a bi-lateral agree-
ment that traded peace with the territory of Sinai, but it had far reaching implications. Without
Egypt it became impossible to create an Arab military threat on Israel. Hence, the wide Israeli-Arab
conflict that began in 1948 came to an end de-facto. As a result Israel could reduce its defense costs
significantly and that also enabled the fiscal stabilization of 1985, which saved the economy from a
fiscal catastrophe. With no Arab military coalition in sight, the Palestinians were left alone and felt
that they have to conduct their struggle for independence by themselves. This started in 1987 with
the first Intifada. Thus, the conflict returned to its original form, a bi-lateral Israeli-Palestinian con-
flict. Although the two sides were organized differently, as Israel had a state and a powerful army
and the Palestinians were united under the PLO, the conflict returned in many aspects to its origin,
as a conflict of militias, of low arms use, and low costs.
The change in the pattern of the conflict in the 1980s reduced the direct economic costs, but it
had other economic effects on Israel. The main one was that Israel became much more vulner-
able to business cycles and mainly to recessions. Previous wars were costly, but they increased
aggregate demand and thus helped to avoid recessions or to make them short. The eruptions
of the Israeli-Palestinian conflict are very different from previous wars. Each is much longer,
it involves the two populations intensively, and it ends in a non-decisive way.3 Hence, these
eruptions create pessimism and reduce the demand for investment significantly. Indeed, while
before 1980 Israel suffered from two short recessions only, after 1980 it experienced already
four recessions, of which two were very long.
As mentioned above, currently the costs of the Israeli-Arab conflict are much lower. But even
if they don’t pose a fiscal threat as before 1985, these costs are still very high in international
comparison, and they pose a serious burden on Israelis. The direct costs amount to 7 percent of
GDP. But there are additional costs to the conflict which are not included in the defense budget,
2. The formal excuse was to help the Palestinians, but clearly each state wanted to carve out part, or all, of the country to itself.3. This article was written during the Gaza conflict of 2014, which fits this description quite well.
Economics and Politics in the Israeli Palestinian Conflict
AIX Group | 74
like alternative cost of conscripts, alternative use of land, security guards, civil defense costs
and more. Adding these additional costs increases total costs of defense to 12.7 percent of GDP,
which is the same as 15 percent of their income. This is a very heavy burden. The international
average of defense costs in advanced countries like Israel is 1.5 percent of GDP.
In addition to the direct and indirect costs of the conflict, there are costs involved in the specific
project of building and developing settlements in the West Bank. This cost is very well disguised in
the Israeli Statistics, but we will try to give some rough estimates based on a survey by Hever (2013).
Another potential future cost could be caused by the boycotts on Israel and on Israeli settlements
that are gaining momentum recently. We will try to estimate how serious these effects can be. The
Arab Spring that shakes the Arab world since 2011 can also have an effect on potential widening of
the Israeli-Arab conflict. We discuss that as well together with other potential conflicts in the region.
The paper is structured as follows. Section 2 describes the costs of the wide military Israe-
li-Arab conflicts and discusses the potential of its resurgence. Section 3 describes the cyclical
effects of the Israeli-Palestinian conflict. Section 4 presents an estimate to the loss of human
capital caused by conscription. Section 5 lists additional defense costs, which are not taken into
account in the official data. Section 6 presents some estimates on the costs of settlements and
Section 7 analyzes the potential costs of boycotts. Section 8 discusses some economic benefits
of the conflict to the Israeli economy and section 9 summarizes.
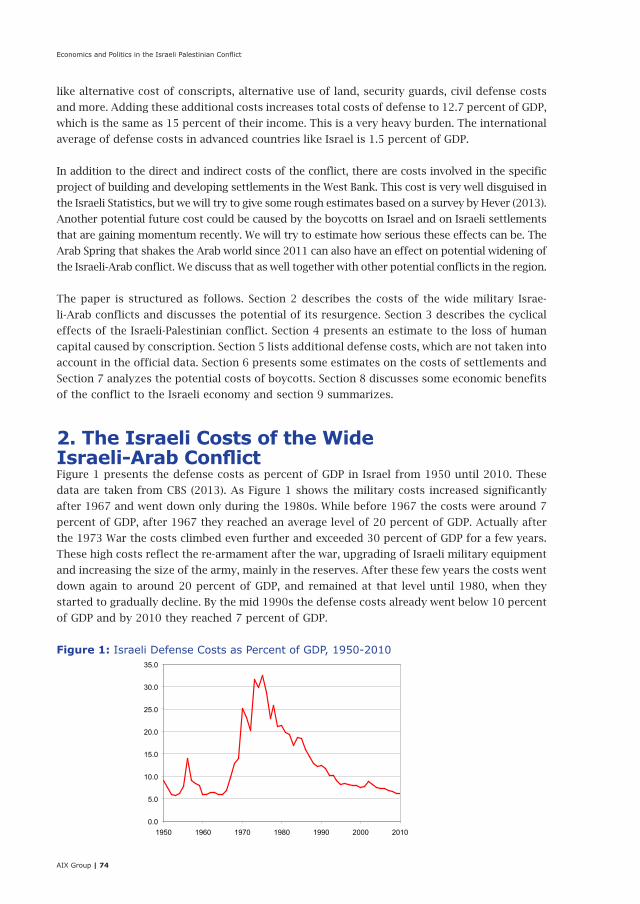
2. The Israeli Costs of the WideIsraeli-Arab ConflictFigure 1 presents the defense costs as percent of GDP in Israel from 1950 until 2010. These
data are taken from CBS (2013). As Figure 1 shows the military costs increased significantly
after 1967 and went down only during the 1980s. While before 1967 the costs were around 7
percent of GDP, after 1967 they reached an average level of 20 percent of GDP. Actually after
the 1973 War the costs climbed even further and exceeded 30 percent of GDP for a few years.
These high costs reflect the re-armament after the war, upgrading of Israeli military equipment
and increasing the size of the army, mainly in the reserves. After these few years the costs went
down again to around 20 percent of GDP, and remained at that level until 1980, when they
started to gradually decline. By the mid 1990s the defense costs already went below 10 percent
of GDP and by 2010 they reached 7 percent of GDP.
Figure 1: Israeli Defense Costs as Percent of GDP, 1950-2010
0.0
5.0
10.0
15.0
20.0
25.0
30.0
35.0
1950 1960 1970 1980 1990 2000 2010
The Economic Costs of the Conflict to Israel: The Burden and Potential Risks
AIX Group | 75
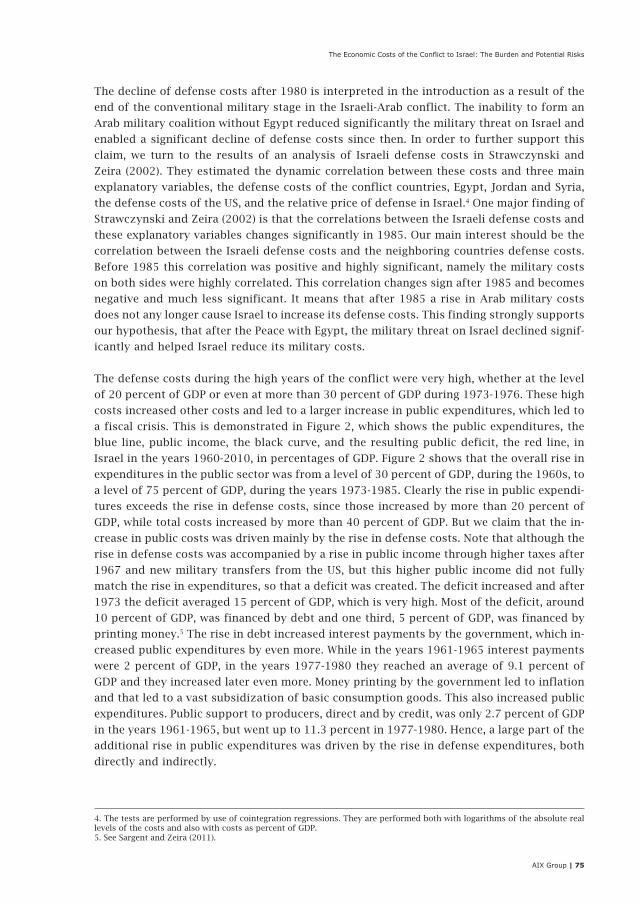
The decline of defense costs after 1980 is interpreted in the introduction as a result of the
end of the conventional military stage in the Israeli-Arab conflict. The inability to form an
Arab military coalition without Egypt reduced significantly the military threat on Israel and
enabled a significant decline of defense costs since then. In order to further support this
claim, we turn to the results of an analysis of Israeli defense costs in Strawczynski and
Zeira (2002). They estimated the dynamic correlation between these costs and three main
explanatory variables, the defense costs of the conflict countries, Egypt, Jordan and Syria,
the defense costs of the US, and the relative price of defense in Israel.4 One major finding of
Strawczynski and Zeira (2002) is that the correlations between the Israeli defense costs and
these explanatory variables changes significantly in 1985. Our main interest should be the
correlation between the Israeli defense costs and the neighboring countries defense costs.
Before 1985 this correlation was positive and highly significant, namely the military costs
on both sides were highly correlated. This correlation changes sign after 1985 and becomes
negative and much less significant. It means that after 1985 a rise in Arab military costs
does not any longer cause Israel to increase its defense costs. This finding strongly supports
our hypothesis, that after the Peace with Egypt, the military threat on Israel declined signif-
icantly and helped Israel reduce its military costs.
The defense costs during the high years of the conflict were very high, whether at the level
of 20 percent of GDP or even at more than 30 percent of GDP during 1973-1976. These high
costs increased other costs and led to a larger increase in public expenditures, which led to
a fiscal crisis. This is demonstrated in Figure 2, which shows the public expenditures, the
blue line, public income, the black curve, and the resulting public deficit, the red line, in
Israel in the years 1960-2010, in percentages of GDP. Figure 2 shows that the overall rise in
expenditures in the public sector was from a level of 30 percent of GDP, during the 1960s, to
a level of 75 percent of GDP, during the years 1973-1985. Clearly the rise in public expendi-
tures exceeds the rise in defense costs, since those increased by more than 20 percent of
GDP, while total costs increased by more than 40 percent of GDP. But we claim that the in-
crease in public costs was driven mainly by the rise in defense costs. Note that although the
rise in defense costs was accompanied by a rise in public income through higher taxes after
1967 and new military transfers from the US, but this higher public income did not fully
match the rise in expenditures, so that a deficit was created. The deficit increased and after
1973 the deficit averaged 15 percent of GDP, which is very high. Most of the deficit, around
10 percent of GDP, was financed by debt and one third, 5 percent of GDP, was financed by
printing money.5 The rise in debt increased interest payments by the government, which in-
creased public expenditures by even more. While in the years 1961-1965 interest payments
were 2 percent of GDP, in the years 1977-1980 they reached an average of 9.1 percent of
GDP and they increased later even more. Money printing by the government led to inflation
and that led to a vast subsidization of basic consumption goods. This also increased public
expenditures. Public support to producers, direct and by credit, was only 2.7 percent of GDP
in the years 1961-1965, but went up to 11.3 percent in 1977-1980. Hence, a large part of the
additional rise in public expenditures was driven by the rise in defense expenditures, both
directly and indirectly.
4. The tests are performed by use of cointegration regressions. They are performed both with logarithms of the absolute real levels of the costs and also with costs as percent of GDP.5. See Sargent and Zeira (2011).
Economics and Politics in the Israeli Palestinian Conflict
AIX Group | 76
Figure 2: Public Expenditures, Income and Deficit in Percentage of GDP: 1960-20106
Therefore, the rise in defense costs increased additional public expenditures and was the main
reason for the rise of public expenditures to more than 70 percent of GDP during the years
1973-1985 and to the rise in deficit to an average level of 15 percent of GDP during those years.
This led to a significant fiscal crisis. The public debt increased during this period and in 1984,
on the eve of the stabilization plan, the net debt reached a level of 150 percent of GDP. This is
clearly very high debt. As a result Israel began to face difficulties in borrowing abroad in 1983-
1985. But the large deficit created not only debt, but also spiraling inflation. While the rate of
inflation during the 1960s was quite low, it began to rise in the early 1970s and during the
years 1973-1978, it reached an average annual rate of 45 percent. In 1979, inflation jumped to
a higher rate and was around an annual rate of 120 percent in the years 1979-1983. In October
1983 inflation jumped to a higher annual rate of 400 percent and remained at that rate until the
stabilization in July 1985. Although the jumps in inflation in 1979 and in 1983 were caused by
severe mistakes in economic policy making, the basic cause of the inflationary process was the
budget deficit caused mainly by the defense costs.7
Hence, the intensification of the Israeli-Arab conflict after 1967 led to a significant fiscal cri-
sis. The crisis was finally solved in the stabilization plan of 1985, which was enabled mainly
by the reduction of defense costs due to the peace with Egypt. This episode shows how
dangerous economically was the Israeli-Arab conflict in its wide stage, as a military conflict
between Israel and a wide coalition of Arab states, which is fought in conventional military
warfare. This raises a serious question, on the likelihood that the current Israeli-Palestinian
conflict might again evolve into a total Israeli-Arab conflict. This question was seriously
raised when the Arab Spring erupted in 2011. One of the main significant results of the Arab
Spring has been the new voice given to the Arab masses. A possible result of this new voice
is more pressure on the leadership in Egypt and elsewhere to show greater solidarity with
the Palestinian struggle. It is hard to tell how serious such a pressure can be and whether it
can put the Israeli-Egyptian peace into serious problems. But if it does, the economic pres-
sure on Israel might rise significantly.
-30.0
-20.0
-10.0
0.0
10.0
20.0
30.0
40.0
50.0
60.0
70.0
80.0
1960 1970 1980 1990 2000 2010
6. Source: Bank of Israel Report 2011.7. The jumps in Israeli inflation are analyzed in Sussman (1992) and in Sargent and Zeira (2011).
The Economic Costs of the Conflict to Israel: The Burden and Potential Risks
AIX Group | 77
8. Source: Central Bureau of Statistics in Israel (2012).9. We have identified business cycles in Israel with the use of additional dynamic variables, like rate of growth of the business sector, rate of growth of investments, rate of unemployment, and by identifying shocks to output using an ARMA (1, 1) model.
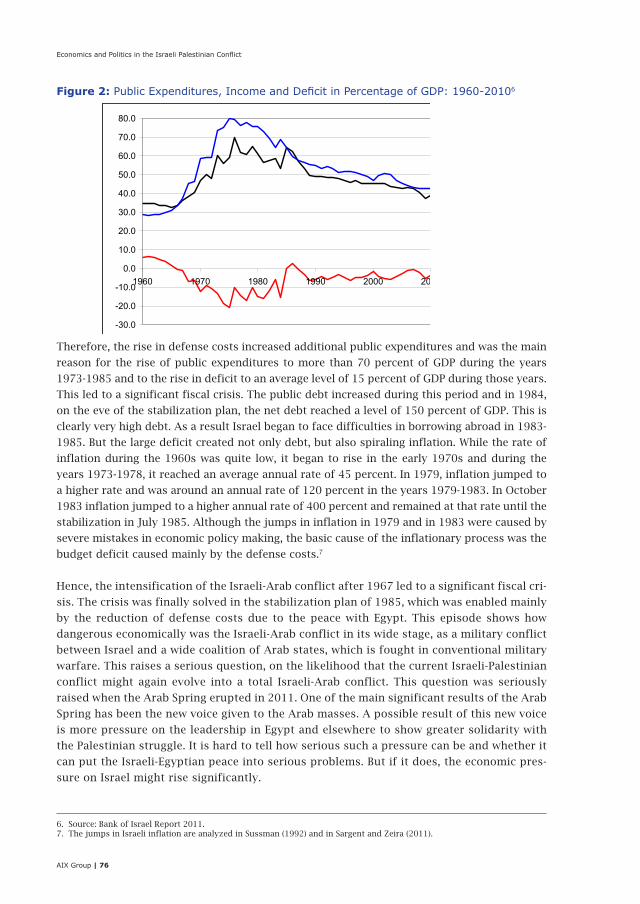
3. The Israeli-Palestinian Conflict and Israeli Business CyclesAs figure 1 shows the military costs of Israel declined sharply during the 1980s and became
much smaller afterwards. That means that the aggregate demand in the economy, namely the
sum of private consumption, public consumption, investment and net exports, was reduced as
well. That in itself made the economy more vulnerable to recessions, namely to economic fluc-
tuations, or business cycles. We know that there are a number of theories of business cycles, the
Keynesian or Neo-Keynesian theory that focuses on aggregate demand, the RBC model of Long
and Plosser (1983), among others, that focuses on shocks to productivity and supply, and the
financial theory of Bernanke and Gertler (1989) that deals mainly with financial shocks and con-
straints. Studying business cycles in Israel leads to the conclusion that most fluctuations were
of the Keynesian type and were triggered and propagated by shocks to aggregate demand. Thus,
reduction of defense costs after 1980 heralds a period of greater sensitivity to recessions, if
aggregate demand falls and defense costs do not act as automatic stabilizers. This is further ex-
acerbated by the decline in immigration, which is also a strong stimulator of aggregate demand.
Figure 3: Annual Rate of Growth of GDP in Israel: 1951-20108
Figure 3 presents the annual rate of growth of output, which enables us to identify the main
business cycles, or the main recessions, in the economic history of Israel. Note that the average
annual rate of growth of output until 1973 has been 10 percent and after 1973 it has been only
3.5 percent. We should therefore search for recessions as years in which output went down
significantly relative to these long-run trends.9 As Figure 3 indicates there were two major
recessions in the initial years of Israel, namely 1952-1953 and 1966-1967. The first recession
was caused by lack of foreign currency in the first years of the state and it ended when the
reparation agreement with Germany was signed and began to operate and when the US began
to supply some loans to the new state. The second recession began with a fiscal contraction
in 1966, when the German reparation money came to an end, and it ended in 1967 with the
outbreak of the War.
The period that followed was more stable until a severe recession began in 1989. That recession
is hard to analyze as it did not last long and it ended after one year in 1990, when the large
immigration from Ex-USSR began and started an economic boom. Our best guess is that this
-5.0
0.0
5.0
10.0
15.0
20.0
25.0
30.0
35.0
1950 1960 1970 1980 1990 2000 2010
Economics and Politics in the Israeli Palestinian Conflict
AIX Group | 78
recession, or rather beginning of recession, was triggered by the first Intifada, which began in
December 1987. The next recession was milder though longer in the years 1997-1999. This
recession had two main causes. One was the end of the investments triggered by the wave of
immigration of the early 1990s. The second was the decline in optimism from the Oslo process
after the murder of Rabin in 1995, the violence in 1996 and the rise to power of Netanyahu in
the same year. The next recession was during the years 2000-2004 and was the longest and
deepest in Israel. It was caused mainly by the second Intifada, but it also reflected a global re-
cession at the time. The last recession is in 2009, it was caused by the global financial crisis, but
it did not last long, since the Israeli banking system was relatively clean of toxic assets.
We therefore see that the first 30 years of Israel witnessed only 2 recessions, while the following
30 years witnessed 4 recessions. But the decline of defense costs was not the only cause for the
rise of vulnerability to business cycles. The Israeli-Palestinian conflict tends to push the Israeli
economy to a recession whenever it shows signs of escalation. Three of the four recessions were
caused by such escalations of the conflict: 1989, 1997-1999, and 2000-2004. Thus any escalation
of the Israeli-Palestinian conflict has an opposite cyclical effect than the conventional wars of the
past. The reason is that such eruptions are very different from the conventional wars. An erup-
tion of the Israeli-Palestinian conflict is usually protracted and continues a number of years, while
the longest conventional war lasted only three weeks. Conventional wars usually end with a clear
result, clear victory, while Israeli-Palestinian confrontations never end with a clear outcome. As a
result such confrontations increase pessimism and doubt and tend to reduce business investment.
This clearly reduces aggregate demand, which leads to recessions. Furthermore, Israeli-Palestinian
confrontations tend to hurt daily life in Israel, which reduces business activities. People go less for
shopping and as a result purchase less. This also reduces aggregate demand. We therefore deduce
that the decline of the wide conflict and the rise of the narrow Israeli-Palestinian conflict increased
significantly business cycles and especially recessions in Israel.
4. Loss of Human Capital from ConscriptionThe costs of the conflict include the formal defense budget, but also include additional costs, which
are not part of that budget, and some of them are not even budgetary. Berglas (1986) was the first
to analyze these costs. Wolfson (2010) updated the results of Berglas to the year 2008 and in this
paper we further update these results to 2011 and also change the method of calculating some of
these costs. This section and the next one present and discuss these additional costs. In this section
we deal with the main cost, which is the loss of human capital due to conscription. When young
people are recruited to serve 3 or 2 years, for men and women respectively, their contribution to
the labor market is not taken into consideration, since they do not receive a salary for their labor.10
But the economic cost of conscription is not limited to the alternative loss of labor of the conscripts
during their military service, but to the loss of human capital throughout their lifetime career. The
reason for that is that human capital tends to rise over a person’s lifetime career due to acquisition
of education, on the job training and acquisition of experience. Conscription delays this human
capital accumulation by three or two years and that increases the loss of human capital.
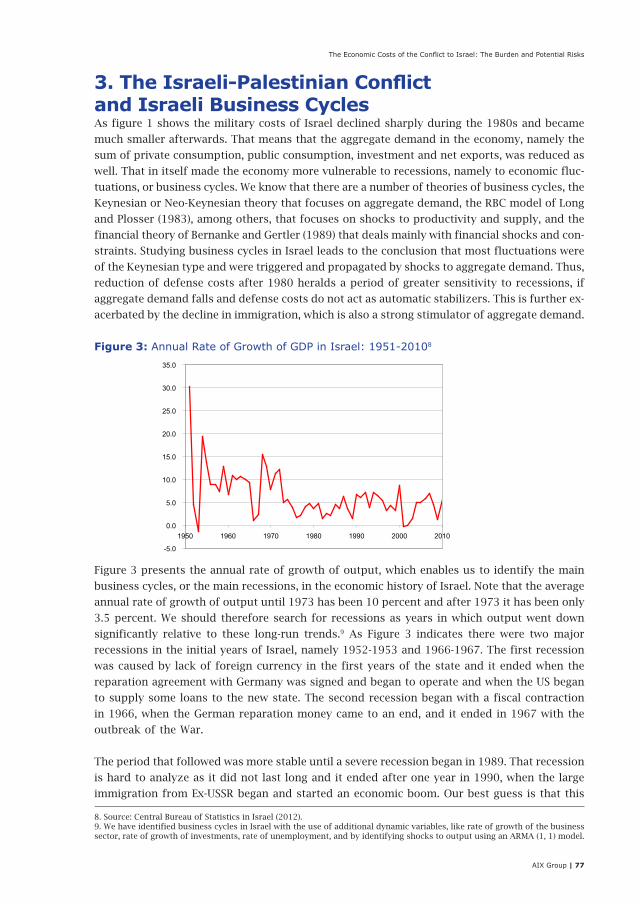
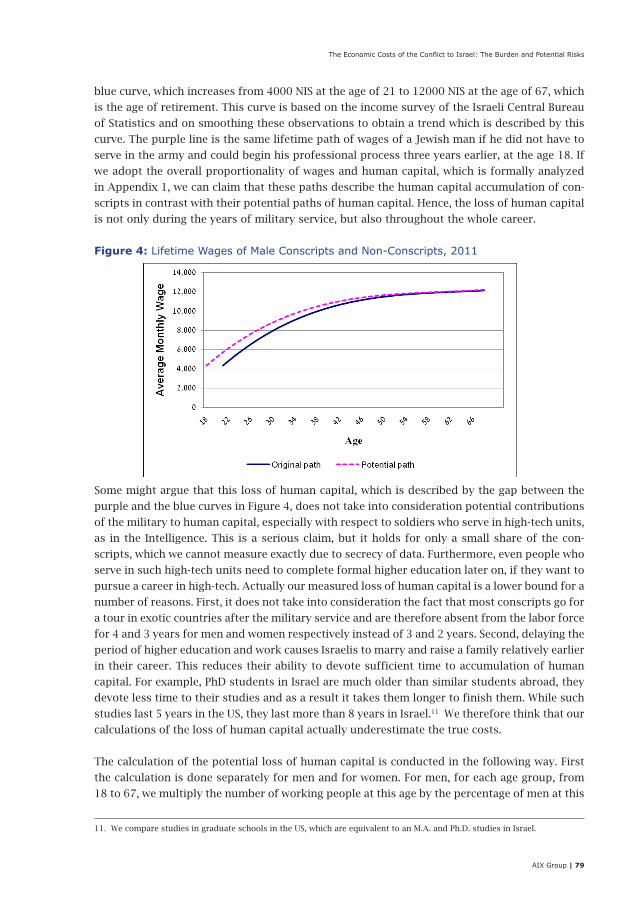
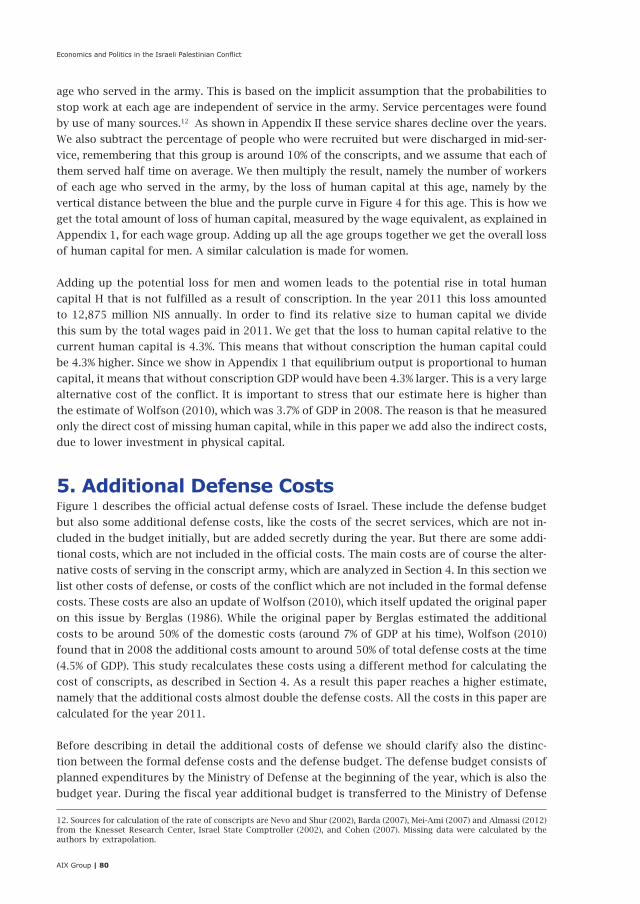
In order to demonstrate this point we use Figure 4, which describes the lifetime path of monthly
wages of average Jewish men in Israel in the year 2011. This lifetime path is described by the
10. The military salary for conscripts is very low. The monthly pay is around 500 NIS, which is around 10% of the alternative average salary at this age.
The Economic Costs of the Conflict to Israel: The Burden and Potential Risks
AIX Group | 79
11. We compare studies in graduate schools in the US, which are equivalent to an M.A. and Ph.D. studies in Israel.
blue curve, which increases from 4000 NIS at the age of 21 to 12000 NIS at the age of 67, which
is the age of retirement. This curve is based on the income survey of the Israeli Central Bureau
of Statistics and on smoothing these observations to obtain a trend which is described by this
curve. The purple line is the same lifetime path of wages of a Jewish man if he did not have to
serve in the army and could begin his professional process three years earlier, at the age 18. If
we adopt the overall proportionality of wages and human capital, which is formally analyzed
in Appendix 1, we can claim that these paths describe the human capital accumulation of con-
scripts in contrast with their potential paths of human capital. Hence, the loss of human capital
is not only during the years of military service, but also throughout the whole career.
Figure 4: Lifetime Wages of Male Conscripts and Non-Conscripts, 2011
Some might argue that this loss of human capital, which is described by the gap between the
purple and the blue curves in Figure 4, does not take into consideration potential contributions
of the military to human capital, especially with respect to soldiers who serve in high-tech units,
as in the Intelligence. This is a serious claim, but it holds for only a small share of the con-
scripts, which we cannot measure exactly due to secrecy of data. Furthermore, even people who
serve in such high-tech units need to complete formal higher education later on, if they want to
pursue a career in high-tech. Actually our measured loss of human capital is a lower bound for a
number of reasons. First, it does not take into consideration the fact that most conscripts go for
a tour in exotic countries after the military service and are therefore absent from the labor force
for 4 and 3 years for men and women respectively instead of 3 and 2 years. Second, delaying the
period of higher education and work causes Israelis to marry and raise a family relatively earlier
in their career. This reduces their ability to devote sufficient time to accumulation of human
capital. For example, PhD students in Israel are much older than similar students abroad, they
devote less time to their studies and as a result it takes them longer to finish them. While such
studies last 5 years in the US, they last more than 8 years in Israel.11 We therefore think that our
calculations of the loss of human capital actually underestimate the true costs.
The calculation of the potential loss of human capital is conducted in the following way. First
the calculation is done separately for men and for women. For men, for each age group, from
18 to 67, we multiply the number of working people at this age by the percentage of men at this
Economics and Politics in the Israeli Palestinian Conflict
AIX Group | 80
age who served in the army. This is based on the implicit assumption that the probabilities to
stop work at each age are independent of service in the army. Service percentages were found
by use of many sources.12 As shown in Appendix II these service shares decline over the years.
We also subtract the percentage of people who were recruited but were discharged in mid-ser-
vice, remembering that this group is around 10% of the conscripts, and we assume that each of
them served half time on average. We then multiply the result, namely the number of workers
of each age who served in the army, by the loss of human capital at this age, namely by the
vertical distance between the blue and the purple curve in Figure 4 for this age. This is how we
get the total amount of loss of human capital, measured by the wage equivalent, as explained in
Appendix 1, for each wage group. Adding up all the age groups together we get the overall loss
of human capital for men. A similar calculation is made for women.
Adding up the potential loss for men and women leads to the potential rise in total human
capital H that is not fulfilled as a result of conscription. In the year 2011 this loss amounted
to 12,875 million NIS annually. In order to find its relative size to human capital we divide
this sum by the total wages paid in 2011. We get that the loss to human capital relative to the
current human capital is 4.3%. This means that without conscription the human capital could
be 4.3% higher. Since we show in Appendix 1 that equilibrium output is proportional to human
capital, it means that without conscription GDP would have been 4.3% larger. This is a very large
alternative cost of the conflict. It is important to stress that our estimate here is higher than
the estimate of Wolfson (2010), which was 3.7% of GDP in 2008. The reason is that he measured
only the direct cost of missing human capital, while in this paper we add also the indirect costs,
due to lower investment in physical capital.
5. Additional Defense CostsFigure 1 describes the official actual defense costs of Israel. These include the defense budget
but also some additional defense costs, like the costs of the secret services, which are not in-
cluded in the budget initially, but are added secretly during the year. But there are some addi-
tional costs, which are not included in the official costs. The main costs are of course the alter-
native costs of serving in the conscript army, which are analyzed in Section 4. In this section we
list other costs of defense, or costs of the conflict which are not included in the formal defense
costs. These costs are also an update of Wolfson (2010), which itself updated the original paper
on this issue by Berglas (1986). While the original paper by Berglas estimated the additional
costs to be around 50% of the domestic costs (around 7% of GDP at his time), Wolfson (2010)
found that in 2008 the additional costs amount to around 50% of total defense costs at the time
(4.5% of GDP). This study recalculates these costs using a different method for calculating the
cost of conscripts, as described in Section 4. As a result this paper reaches a higher estimate,
namely that the additional costs almost double the defense costs. All the costs in this paper are
calculated for the year 2011.
Before describing in detail the additional costs of defense we should clarify also the distinc-
tion between the formal defense costs and the defense budget. The defense budget consists of
planned expenditures by the Ministry of Defense at the beginning of the year, which is also the
budget year. During the fiscal year additional budget is transferred to the Ministry of Defense
12. Sources for calculation of the rate of conscripts are Nevo and Shur (2002), Barda (2007), Mei-Ami (2007) and Almassi (2012) from the Knesset Research Center, Israel State Comptroller (2002), and Cohen (2007). Missing data were calculated by the authors by extrapolation.
The Economic Costs of the Conflict to Israel: The Burden and Potential Risks
AIX Group | 81
13. These secret services are budgeted initially in the general reserve of the budget. This budget is transferred to the Ministry of Defense during the fiscal year in a closed meeting of the committee.14. The CBS uses instead of the Pay as You Go payments the implied provisions to a pension fund, if it would have replaced the existing system. This is of course a much lower amount.15. Note that the Central Bureau of Statistics also calculates additional costs of defense, but does it in a minimal way. For com-parison they calculated total defense costs in 2011 to be only 7.7% of GDP.
by the finance committee in the Israeli Parliament (Vaadat Haksafim in the Knesset). Some of
it is for unanticipated events, mainly related to military operations of large scale. But the main
transfer finances the secret services, which do not appear in the original defense budget for
reasons of secrecy.13 In our year of reference, 2011, the gross budget of defense was 54 billion
NIS (5.8% of GDP), while the expenditure by the end of the year was 62.5 billion NIS (6.8% of
GDP). The addition is therefore significant and it reached 1 percent of GDP in 2011. Most of
this addition went to the secret services, as there were not significant military events in 2011.
Our point of reference in this section is the end of year actual defense costs, namely 6.8% of
GDP. The Central Bureau of Statistics publishes another estimate of the defense costs, which is
the one used also in Section 2 in this paper, which does not include the pension payments to
the professional army in Israel. Until recently most military personnel received a Pay as You Go
pension, which is financed by the state. The Israeli Central Bureau of Statistics does not include
these payments, which are part of the defense budget, as part of defense costs, according to
international standards.14 Hence, in 2011 the defense costs calculated by the CBS reached only
6.2% of GDP. We prefer to keep the pension costs in the overall defense costs for two main rea-
sons. First, pension is part of the wage bill and should be included. Second, military personnel
reach retirement at an early age and as a result have relatively high pension costs. Hence, all
costs listed in this section are in addition to the ex-post costs of the Ministry of Defense, namely
6.8% of GDP in 2011.
In our analysis below we list three types of additional defense costs. The first are costs that
are not traded in markets and are thus only estimated. These are mainly alternative costs, like
the cost of conscripts, alternative costs of land use, etc. The second type consists of costs that
are paid directly by the citizens, like civil defense construction and security guards. The third
type consists of costs of the conflict that appear in other budgets but not in the formal defense
budget, like the Fund for Veterans.15
5.1 Alternative Additional Costs• The first and largest of these costs is the loss of human capital due to service of
conscripts. This cost is estimated in Section 4 to be equal to 4.3% of GDP, or 39.39
billion NIS.
• Another alternative cost of defense, which does not appear in the statistics is the
use of land. Schiffer and Oren (2008) find that almost 50% of the land in Israel is
under some control of the army, some fully used as military facilities, and some of
limited access due firearms training. According to Israel State Comptroller (2010)
the army holds 39% of the land in Israel and enforces limitations on additional 40%,
which is an even higher estimate than that of Schiffer and Oren (2008). One way to
estimate the cost of using this land is the following. Following the government deci-
sion to transfer IDF camps to the Negev, the value of the evacuated areas was calcu-
lated, as some of it is in quite lucrative locations. The Finance Ministry estimated the
value of this area by 30 billion NIS, while the Ministry of Defense estimated the value
to be 90 billion NIS. Assuming that both sides exaggerate, we choose an average of
Economics and Politics in the Israeli Palestinian Conflict
AIX Group | 82
60 billion NIS. The annual rate between rent to value of land was 3.4% in 2011. Hence,
the annual cost of these areas to the military is around 2 billion NIS. We could not
find a satisfactory estimate to the cost of the other land used by the army, which is
mostly area closed for military training (Shetach Esh).
• An additional alternative cost of defense is the lost output of people who lost their
lives in the conflict, as indicated by Berglas (1986). This cost is in addition to the
payments to families of casualties. Our estimates are that as a result of the death
of soldiers in the conflict, Israel would have had additional 6,500 workers (taking
into consideration rates of participation, etc.). The alternative annual contribution
to output would be 1.8 billion NIS, using the average output per worker in 2011. A
similar calculation applies to the loss of civilians in the conflict, which amounts to
700 who would be working in 2011. This alternative cost is 200 million NIS. To that
we should add the National Insurance payments to the civilian casualties and their
families, which were half a billion NIS in 2011.
5.2. Additional Defense Costs Paid by Citizens• Most civil defense costs in Israel are born directly by the citizens. The law stipu-
lates that any new apartment built in Israel must add to it a “protected area,” namely
a room that serves as a shelter, with special security requirements.16 The cost of
construction of such a room was 100,000 NIS in 2011 and in that year 45.5 thousand
new apartments of more than 2 bedrooms were built. Hence, this cost of civil defense
for civilians in 2011 was 4.5 billion NIS.
• Another defense cost that is born by civilians is employment of security guards.
Security guards operate both in public institutions and in private businesses, mainly
since the Second Intifada, that started in 2000. The use of security guards, which dif-
fers from regular guards, started to increase after 2000 and remained high since. In
2011 there were 45 thousand workers in the sector of security, of which 39 thousand
were security guards and 6 thousands were managers. We assume that the wage paid
to security guards is the minimum wage, while the wage to managers is the average
wage in the country. According to these assumptions the overall annual cost of secu-
rity services in Israel in 2011 was 3.4 billion NIS.
5.3. Defense Costs in Non-Defense Items in the BudgetAll figures of this type are actual ex-post costs and not planned budget:17
• The cost of the Committee for Atomic Energy is 145 million NIS and is mainly for
military use. It is important to note that this is not the cost of the atomic enterprise
near Dimona, which we could not estimate.
• The cost of the Coordinator of Government Activities in the Territories (COGAT)
was 184 million NIS in 2011. This is clearly a defense related cost but it is not includ-
ed in the defense costs.
16. Before the 1990s such shelters were built per building and not per apartment. The new room shelter per each apartment is called Mamad.17. This list does not include another cost of past defense expenditures, which is interest payments on public debt that was accumulated in the 1970s and the early 1980s. As explained in Section 2 these expenditures increased debt significantly. We do not include such costs in this list because they are bygones and cannot be affected by current policies.
The Economic Costs of the Conflict to Israel: The Burden and Potential Risks
AIX Group | 83
• Civil defense costs related to defense, like protection of the population against
atomic, chemical and biological warfare, building public shelters, and building shel-
ters in the area around the Gaza Strip, have been 276 million NIS in 2011.
• Israel has a special fund that financially supports veterans after their service. The
budget of this fund is also not part of the defense budget. Its cost in 2011 was 1.6
billion NIS.
• The costs of managing and renewing emergency stocks, of food and oil, which are
coordinated by the defense system, were 201 million NIS.
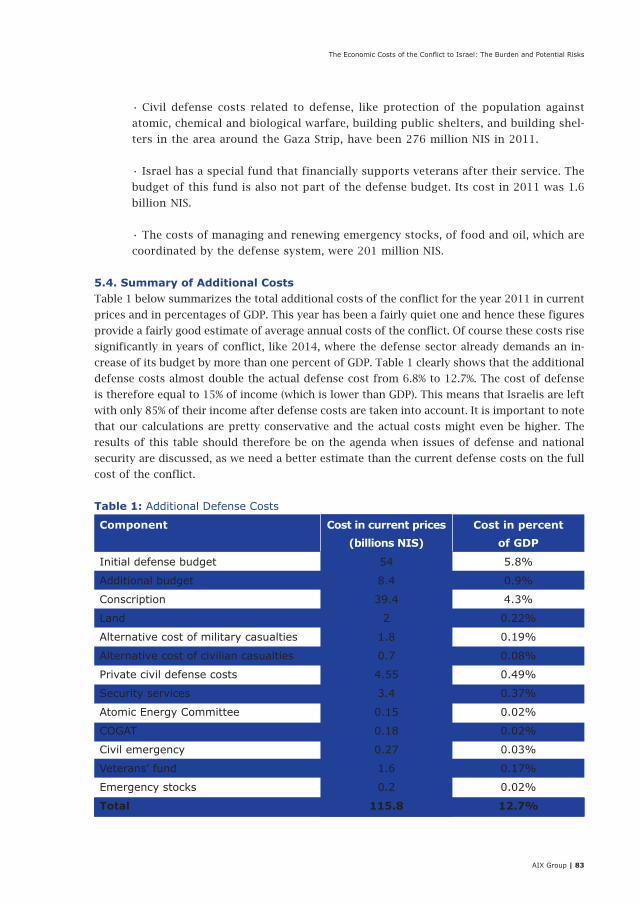
5.4. Summary of Additional CostsTable 1 below summarizes the total additional costs of the conflict for the year 2011 in current
prices and in percentages of GDP. This year has been a fairly quiet one and hence these figures
provide a fairly good estimate of average annual costs of the conflict. Of course these costs rise
significantly in years of conflict, like 2014, where the defense sector already demands an in-
crease of its budget by more than one percent of GDP. Table 1 clearly shows that the additional
defense costs almost double the actual defense cost from 6.8% to 12.7%. The cost of defense
is therefore equal to 15% of income (which is lower than GDP). This means that Israelis are left
with only 85% of their income after defense costs are taken into account. It is important to note
that our calculations are pretty conservative and the actual costs might even be higher. The
results of this table should therefore be on the agenda when issues of defense and national
security are discussed, as we need a better estimate than the current defense costs on the full
cost of the conflict.
Table 1: Additional Defense Costs
Component Cost in current prices
(billions NIS)
Cost in percent
of GDP
Initial defense budget 54 5.8%
Additional budget 8.4 0.9%
Conscription 39.4 4.3%
Land 2 0.22%
Alternative cost of military casualties 1.8 0.19%
Alternative cost of civilian casualties 0.7 0.08%
Private civil defense costs 4.55 0.49%
Security services 3.4 0.37%
Atomic Energy Committee 0.15 0.02%
COGAT 0.18 0.02%
Civil emergency 0.27 0.03%
Veterans’ fund 1.6 0.17%
Emergency stocks 0.2 0.02%
Total 115.8 12.7%
Economics and Politics in the Israeli Palestinian Conflict
AIX Group | 84
6. The Direct Costs of SettlementsIsrael began settling in the Occupied Territories already in 1967, in the Golan Heights and in
Gush Etzion (in the West Bank). The settlement activity continued since then and accelerated
over time. The number of Israelis who live on the Palestinian side of the Green Line today is
more than half a million. One can claim that the cost of the settlements is as high as the cost
of the conflict, since the settlements and the insistence of Israel to leave them within Israel,
are the main obstacle to peace. But the settlements are also a costly project in itself. Keeping
a dispersed population in hostile areas requires high expenditures: on defense, infrastructure
and supply of various public services to small communities, thus losing returns to scale. Since
labor opportunities in the settlements are scarce, a large number of settlers are employed by
the public sector and it seems that this also constitutes a significant cost. These direct costs of
the settlements are hard to measure, since the data are usually not available and the existing
statistics are not transparent.
One rare attempt to estimate the figures related to the settlements, or more precisely to the
post-1967 areas controlled by Israel, was published by the OECD (2011). The main goal of the
document was to try to clarify how the Israeli statistics can be reconciled with the OECD stand-
ards on fitting population and territory in the data. But from this document we can learn a few
things about public budgets directed to the settlements. Interestingly the document calculates
public expenditures on all post-1967 population behind the green line, and that includes also
the population of Palestinians in East Jerusalem, which are known to receive very meager ser-
vices, definitely less than the Israeli average. According to the OECD report the population that
lived in post-1967 areas in 2009 was 775 thousands people, which added 11.5 percent to the
population of pre-1967 Israel. If we subtract from this figure 265 thousand Palestinians from
East Jerusalem, we get a population of settlers (including a small number in the Golan) of 510
thousands people, which are equal to 6.8 percent of the population of Israel. According to the
calculations of the OECD, presented in Table 12 of the report, this population receives 7.4
percent of government consumption. Namely, this population receives a share of government
outlays that is larger than its actual share in the population, but the gap is not that high.
The calculations of the OECD are problematic, as they include only government consumption
but ignore many services that are supplied by the wide public sector, in addition to the central
government. These calculations also ignore excess employment of settlers in the public sector,
which is also an excessive cost. In order to get some idea on the size of this cost, note Figure
8 of the OECD report, which examines the contribution of settlers to output in general and in
various sectors. While the overall contribution of settlers to GDP is less than 4 percent, the
contribution of settlers to the sector of public administration is higher than 11 percent. This
confirms our initial guess that one of the ways the government subsidizes the settlements is by
excess employment in the public sector.
Another study that tries to measure the public spending on the settlements is a study by Hever
(2013) that tries to estimate the overall economic costs of the occupation on Israel since 1970. Hev-
er (2013) cites previous studies and estimates, mainly Svirsky (2008). Since the main problem facing
any such work is the lack of transparent data, Hever tries to estimate each type of subsidy to the set-
tlements in years in which the information is available. He then calculates the cost per settler, and
then extends the calculation for the whole period 1970-2008, based on the known number of set-
tlers in each year. He then discounts all these sums for the year 2008 in real terms (prices of 2007).
The Economic Costs of the Conflict to Israel: The Burden and Potential Risks
AIX Group | 85
Hever (2013) divides the subsidies to a number of categories:
1. Agriculture: Most agricultural investments in settlements are performed by the World
Zionist Organization, which channels government budgets to the settlements. It is
estimated that during 2000-2002 it invested 450 million NIS on settlements.
2. Education: Schools in settlements cost more per student than in pre-1967 Israel, due
to special benefits to teachers, special transportation to students and more. These
additional budgets are estimated to be 118 million NIS in 2003 alone.
3. Health: Medical services are better supplied in the settlements and also carry additional
costs such as subsidies to doctors who work there. These total additional costs reached
2.07 billion NIS until 2002.
4. Housing: Housing in the settlements is heavily subsidized. This additional subsidy
during the years 1990-1999 is estimated to be 3.4 billion NIS.
5. Industry: Industrial zones in settlements received in the years 1997-2001 an additional
sum of 280 million NIS.
6. Local Government: The settlements receive much higher supplementary budgets than
Israeli pre-1967 municipalities, estimated to be twice as high per capita. These high budgets
have survived even the recent severe cuts of government budgets to local government. The
additional support to settler municipalities during the 1990s is estimated to be 2.7 billion NIS.
7. Roads: The settlements enjoy a high quality system of roads, which are usually
Palestinian-free. A preliminary estimate of the roads built in 1993-2002 is 1.47 billion
NIS. We need to keep in mind that this was the main period of such road construction
for settlers, during the implementation of the Oslo Agreements.
8. Tax Credits: Settlers receive reductions in Income Tax automatically if they reside in
a settlement. There are a few estimates of the costs of this reduction. The most
conservative one is 1.7 billion NIS until 2003.
9. Water: Israel invested large sums in developing an advanced water system for the
settlements, which uses the Mountain Aquifer and reduces significantly the amount
of water left for the use by the Palestinians. The cost of this water infrastructure in
the years 1994-2003 was 560 million NIS.
Hever then summarizes all these subsidies after extending the calculation to the whole period
and reaches a number of accumulated 105 billion NIS in prices of 2007 during the years 1970-
2008 (in addition to pure defense costs related to the settlements, which we are counting out
here). Note that this is not a flow but a stock of accumulated costs over a long period of time.
It is equivalent to an annual stream of income of 3 billion NIS in 2007 prices. This is equivalent
to 0.5 percent of GDP. Since the settler population increases faster than the pre-1967 Israeli
population, this total subsidy is expected to rise over time.
In addition to subsidies to settlements Hever (2013) also estimates the specific defense costs
that are caused by the settlements and the occupation. These include the costs of guarding the
settlements, guarding the roads where settlers travel, manning the road blocks, suppressing
Palestinian efforts to fight the settlements and more. Hever (2013) includes in these costs also
extra policing costs, which he claims increased Police budgets by 17.3 percent over the years
1968-2008. He also includes the building of the separation wall, which cost 13 billion NIS and
the cost of the Disengagement from Gaza, which cost more than 11 billion NIS. The overall sum
of defense costs caused directly by the occupation during the years 1970-2008 is estimated to
be equal to 315 billion NIS in 2007 prices, which is very high.
Economics and Politics in the Israeli Palestinian Conflict
AIX Group | 86
7. The Cost of a Potential BoycottIn recent years the tendency to boycott contacts with Israel, with or without the settlements,
and to boycott investment in Israel or in specific areas in Israel, is gaining momentum. It re-
flects growing discontent with the continuing occupation of the Palestinian territory and grow-
ing anger at the political impasse. The scope of the boycott is still small, but it causes great anx-
iety within Israel and it seems to annoy decision makers in Israel significantly. This is definitely
a potential cost of the conflict, but it seems to be more annoying than a serious economic cost.
There are a few reasons for that.
A similar historical example is the Arab Boycott that was directed against Israel since 1948 and
that collapsed finally after the Oslo agreements in 1993. That policy included a boycott by the Arab
countries of any economic contacts with Israel and also a boycott of firms in other countries that
trade with Israel. The direct boycott did not affect Israel much, since it always viewed the Arab
markets as relatively small, which do not constitute important trading partners. But the boycott of
other firms that traded in Israel had a more significant effect. For many years Israel did not import
Coca Cola, McDonalds, Japanese cars and more. But Israel found ways to grow and develop despite
the Boycott. It found firms and countries that preferred to avoid the Boycott and traded with them.
So the historical experience shows that the economic cost of a boycott is not very high. Still, the new
boycotts differ from the old one in a very significant way, which we will explain below.
Another reason for the low ability of boycotts to create significant economic damage is the fact
that Israel’s trade and mainly Israel’s exports are highly diversified across countries. In 2010, 32
percent of Israel’s exports went to Europe, 37 percent to America (North and South), 24 percent
to Asia and 2.5 percent to Africa. Today it seems that the main pressure of boycotts is from
Europe, but if exports from Israel are so diversified, it seems that the direct economic cost is
not expected to be very high. Of course, this assessment should be taken with caution. The 2014
Gaza conflict intensified global opposition to Israel’s policies and the boycott increased. Latin
American countries led the criticism on Israel. World organization of port workers discussed a
proposal to deny service to Israeli ships. It decided against due to American pressure, but that
might change in the future and then deal a serious blow on Israel’s international trade. In other
words, such developments are hard to predict.
But there is one clear and very painful element in the current boycott, which also makes it very dif-
ferent from the old Arab Boycott. It reflects a moral indictment of Israel and its policies and thus it
casts a giant shadow on the self-esteem of Israelis. The firms that gave up to the old Arab Boycott
did so because of financial interests. The current organizations and individuals that join the boy-
cott, do it because of their own conviction, because they feel strongly about it. This is not just an
issue of trade and income, but it is an issue of morality. It therefore hurts Israelis deeply, because
like all human beings they want to believe that they are just, that they do the right thing. And now
more and more people are telling them that this is not the case. This is the main strength of the
boycott and this is why it is so dreaded in Israel. Israelis love to travel abroad, mainly to Europe. If
they walk in European cities and know that more and more of the people around them condemn
them and think that they are wrong, they will feel very bad. In our view this is the main cost of the
boycott. More than an economic cost, it carries with it a great moral burden.
While we discuss the potential effects of boycotts in Europe and other global regions, it is time to
direct our analysis to the effect of the conflict on Israel’s economic ties with another region, the
The Economic Costs of the Conflict to Israel: The Burden and Potential Risks
AIX Group | 87
Middle East. It is true that currently the Middle East is not an attractive trading partner, as it suffers
from severe obstacles to economic growth. But it is not doomed to stay like that forever, and it can
experience a transition to economic growth and development similar to China or to India nowadays.
This is possible. In that case Israel might find it very hard to create good trading relationship with
the Arab countries, especially if peace with the Palestinians is further delayed. Hostility in the Arab
countries toward Israel is high, not only due to the Israeli-Palestinian conflict, but also because Israel
is closely tied to interests of the West, which is viewed as hostile to Arab interests by many in the
region. Hostility is high also because Israel intervenes in many conflicts within the Middle East. It
supports Christians against Muslims, Sunnis against Shiites, etc. If the Arab world becomes less and
less tolerant toward Israel, even if a settlement with the Palestinians will be reached at some point,
the future of our economic relations with the region might be uncertain, which could be quite costly.
8. Potential Economic Benefitsto the Conflict and to OccupationAlthough war and occupation seem to be negative phenomena in essence, they might some-
times create economic benefits, at least to one of the sides in the conflict. In this Section, we
briefly explore this possibility, although it is clearly very hard, because much of the data are
inaccessible. Following is a list of potential economic benefits to Israel and their discussion.
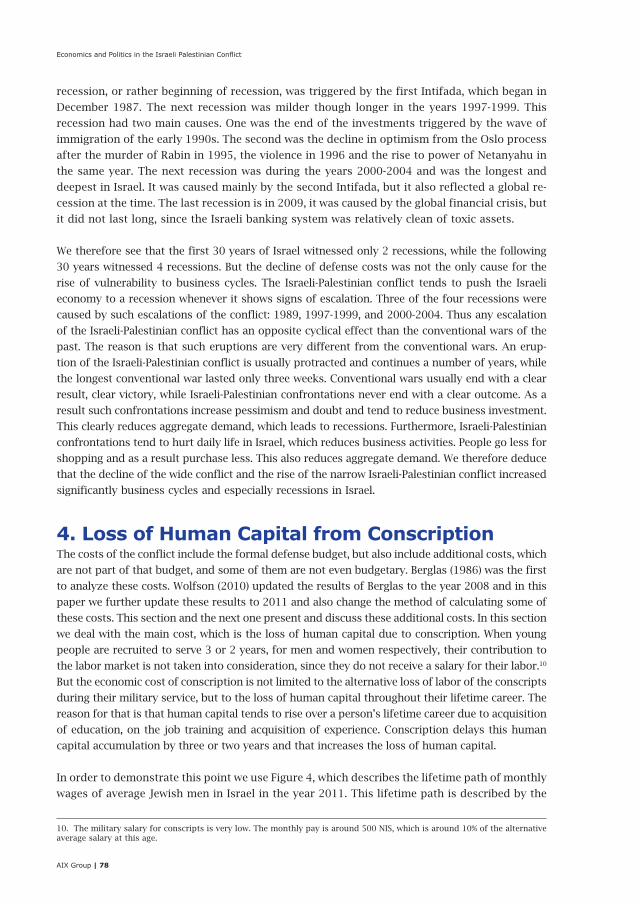
The first potential benefit to Israel is US aid. Clearly this aid, which is military mainly, would
have not arrived if Israel were not in a conflict with the Arab countries. Whether the aid is given
for Israel’s survival in its defense against its enemies, or it is given for Israel’s role as a strategic
ally in an area of vital strategic importance to the US is not for us to judge. But, we know that
the aid began to flow to Israel only after the 1967 War, which ended with a great Israeli victory,
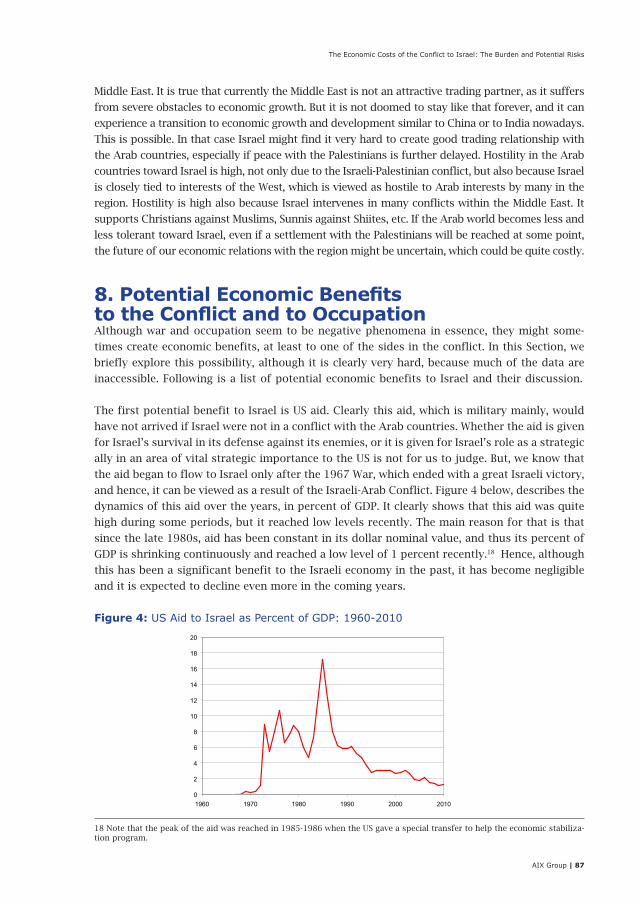
and hence, it can be viewed as a result of the Israeli-Arab Conflict. Figure 4 below, describes the
dynamics of this aid over the years, in percent of GDP. It clearly shows that this aid was quite
high during some periods, but it reached low levels recently. The main reason for that is that
since the late 1980s, aid has been constant in its dollar nominal value, and thus its percent of
GDP is shrinking continuously and reached a low level of 1 percent recently.18 Hence, although
this has been a significant benefit to the Israeli economy in the past, it has become negligible
and it is expected to decline even more in the coming years.
Figure 4: US Aid to Israel as Percent of GDP: 1960-2010
0
2
4
6
8
10
12
14
16
18
20
1960 1970 1980 1990 2000 2010
18 Note that the peak of the aid was reached in 1985-1986 when the US gave a special transfer to help the economic stabiliza-tion program.
Economics and Politics in the Israeli Palestinian Conflict
AIX Group | 88
Another potential benefit of the conflict can be Israel’s prestige in the area of defense indus-
tries. Israeli weapons, drones and similar equipment are in high demand in many countries. One
of the main reasons for that is that these weapon systems are experimented in real battle, as the
military industry advertisements stress over and over. This is clearly a benefit that is hard to
deny, but it is even harder to estimate it. The data on defense exports are usually unavailable.
Recently, the government published these data for recent years and it seems that the exports of
this industry are equal on average to 5 billion US dollars. This is equivalent to 2 percent of GDP.
Clearly, the value added of this amount, namely its contribution to output, is lower (probably
around half). But we can also ask what happens to output if the defense industry will reduce its
exports in the future, due to a reduction in the intensity of the conflict and of the Israeli pres-
tige as a weapon supplier? If the demand for one good declines, the demand for other goods
can replace it. In its short history, Israel has proved its ability to shift from declining sectors
into rising sectors fast and efficiently. Hence, it seems to us that this is not a solid benefit to the
Israeli Economy, in the sense that losing it will cause only a temporary loss due to adjustment,
but not a permanent loss.
Another potential benefit to the economy is the training of many young soldiers in technical
warfare during their mandatory service. Later on many of these conscripts find their way, after
finishing the military service, to the famous Israeli High-Tech industry (and sometimes they
even go directly to the US High-Tech industry). Indeed, such implicit subsidization has played a
decisive role in the development of the High-Tech sector in Israel. But again, such subsidization
is clearly not a pure economic benefit of the conflict, since without the conflict subsidization
of the High-Tech sector could be done through other channels and could even be more efficient
and involve fewer costs.
Finally, Hever (2013) lists a number of ways in which Israel exploited the Palestinians and gained
from the occupation. One is by collecting National Insurance payments from Palestinian work-
ers under occupation without any return on these contributions. Second, Palestinian workers
in Israel were forced to set aside a number of payments from their wages, like a ‘security tax,’
which financed monitoring them during their labor. Third, Palestinian workers in Israel paid a
fee to the Histadrut, the Israeli labor union, without receiving any services. Fourth, Israel con-
fiscated large plots of land and large amounts of resources in the West Bank and Gaza. These
resources include water, stone, agricultural production, Dead Sea minerals, oil, gas, and more.
Since Oslo much of these resources are concentrated in Area ‘C.’ Fifth, many Israeli companies
could export to the Occupied Territories low quality goods at high prices, using lack of compe-
tition from other markets. Hever estimates all these benefits over the years 1970-2008 by 40
billion NIS. This is clearly a large amount, but it was higher in the first years of occupation and
it is much lower now. It is clearly much lower than the various costs of the occupation, which
are described above. We therefore conclude that the overall financial balance of the occupation
is not positive and that it constitutes a burden rather than a source of income.
9. SummaryThis paper describes the various economic effects of the Israeli-Arab conflict, both current and po-
tential. Nowadays it is mainly the Israeli-Palestinian conflict. These costs are quite high, especially
if we add costs which are not part of the defense budget, like the alternative costs of conscription.
Such additional costs raise the average annual costs of defense from 6-7% of GDP to around 13% of
The Economic Costs of the Conflict to Israel: The Burden and Potential Risks
AIX Group | 89
GDP. This is already a large burden of defense. But defense costs might be even much higher if the
conflict expands again to a wider Israeli-Arab conflict. This could happen for example if the peace
agreement with Egypt might collapse. In that case defense costs might reach very high levels, as
experienced in the episode of increased intensity of the conflict in the years 1967 – 1981. In those
years Israel was close to fiscal bankruptcy and survived only due to the peace treaty with Egypt. An
expansion of the conflict, which might occur if the Israeli-Palestinian conflict intensifies, therefore
might raise the defense costs significantly and even raise the risk of fiscal instability.
Clearly, the high defense costs will not disappear immediately upon reaching a peace agreement
with the Palestinians. Israel will still have higher than ordinary defense costs for a long period. But
the costs are expected to decline significantly. We can use the case of the Peace with Egypt as a
guide. Within 10 years the defense costs were reduced to half, from more than 20% of GDP to less
than 10% of GDP. If a similar decline is expected for an Israeli-Palestinian peace agreement as well, it
means that defense costs, direct and indirect, will be reduced from more than 13 percent of GDP to
less than 7 percent of GDP. This is a significant decline. Furthermore, as the Israeli-Palestinian peace
will bring with it peace with all Arab countries, according to the Arab Peace Initiative, it reduces
significantly the risk for an expansion of the conflict, which is a large risk to the economy. Hence,
a final agreement with the Palestinians will benefit the Israeli Economy both directly and indirectly
by reducing potential risks.
But it is important to clarify that the figures in this paper are not the main reason why Israel should
take the extra steps required to reach a peace agreement. Such an agreement is needed mainly to
save lives. Writing this document in July-August 2014, when more than 2,000 people lost their lives,
enhanced and confirmed this point. Such a peace agreement is needed in order to stop the occupa-
tion of the Palestinian people, which affects their economy, but even more it affects their dignity
and self-respect. Such an agreement is needed in order to help Israelis treat their neighbors as
human beings with equal rights. Such an agreement is also needed in order to help the Palestinians
to treat the Israelis as human beings and not as military occupiers. Such an agreement is needed
in order to enable children on both sides to grow up free of fear and of hatred. We need such an
agreement to fulfill these essential human and moral goals. If such an agreement will also create
some economic benefits, it is a blessed addition, but it should not be the main motive for peace.
We know well that any attempt to reach a lasting agreement between the two sides, will ignite large
opposition. Both nations are required to make great concessions over parts of their joint homeland.
These concessions cannot be justified by economic benefits alone, but they can be justified by the
human and moral gains of peace.
Economics and Politics in the Israeli Palestinian Conflict
AIX Group | 90
Appendix1. Human Capital, Wages and OutputIn order to demonstrate the proportionality of human capital to wages and to output assume a
standard Cobb-Douglas production function, that describes output in the aggregate economy:
1.
In this equation Y is output, K is capital, there are N workers, indexed by j, with labor input
lj and human capital hj for each worker j. This is the most well known way to embed human
capital in the production function.
Note first that the wage of worker j is the marginal productivity of this worker which is given by:
2.
Note that does not depend on the specific worker j, it is common to all workers and it can be
defined as the wage per unit of human capital. Hence, wages are proportional to human capital
and we can infer from examination of wage the changes in human capital. This is a very well
known result in the analysis of human capital.
We next turn to calculate output in the economy.
Note that if L is the overall supply of labor, namely if , we get:
3.
where is the average human capital. Substituting in the production function (1) we get:
4.
It is important to note that human capital increases output not only directly, as shown in the
production function (4), but also indirectly through its effect on accumulation of physical cap-
ital K. Higher human capital increases the marginal productivity of capital, which raises the
incentive to invest and as a result K increases. This is the indirect effect of human capital on
output. In order to calculate it we apply the following standard equilibrium condition, which
claims that the marginal productivity of capital becomes equal to the marginal cost of capital,
namely the sum of the interest rate r and the rate of depreciation d:
5.
We assume that the interest rate is constant and so is the rate of depreciation. These are stand-
ard assumptions for a small open economy. From equation (5) we can calculate the equilibrium
level of capital and then substitute it back in equation (4). We get the following equilibrium level
of output:
6.
Hence, output is proportional to human capital. If we denote the total amount of human capital
in the economy by , we get that output is proportional to total human capital in the
economy:

The Economic Costs of the Conflict to Israel: The Burden and Potential Risks
AIX Group | 91
7.
It is clear from equation (7) that if we can raise H by some percentage, it will increase GDP or
Y by the same percentage as well. This is the basis for our calculations of the loss of human
capital and its effect on potential output in this paper.
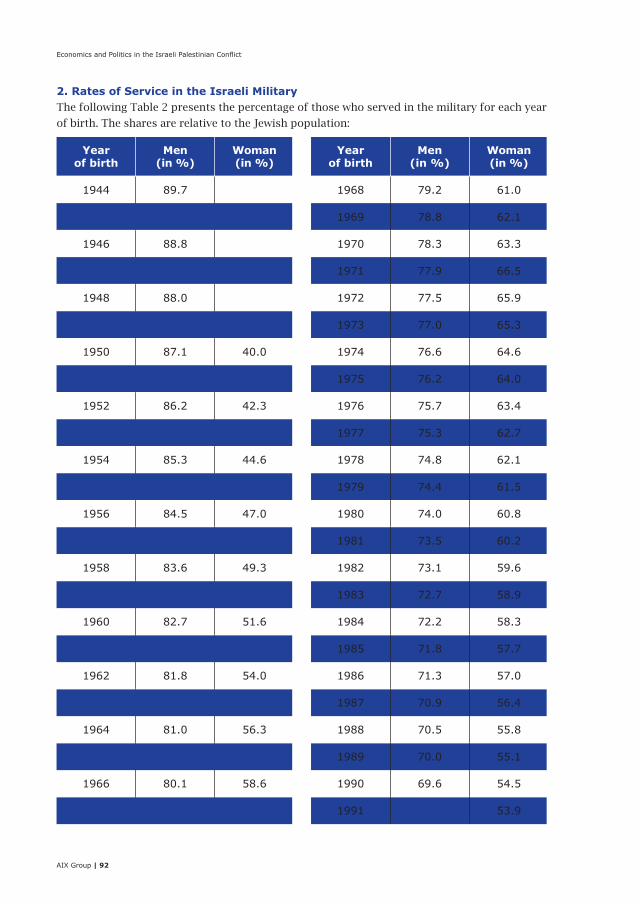
Economics and Politics in the Israeli Palestinian Conflict
AIX Group | 92
2. Rates of Service in the Israeli MilitaryThe following Table 2 presents the percentage of those who served in the military for each year
of birth. The shares are relative to the Jewish population:
Yearof birth
Men(in %)
Woman(in %)
1944 89.7
1945 89.3
1946 88.8
1947 88.4
1948 88.0
1949 87.5 38.8
1950 87.1 40.0
1951 86.6 41.2
1952 86.2 42.3
1953 85.8 43.5
1954 85.3 44.6
1955 84.9 45.8
1956 84.5 47.0
1957 84.0 48.1
1958 83.6 49.3
1959 83.1 50.5
1960 82.7 51.6
1961 82.3 52.8
1962 81.8 54.0
1963 81.4 55.1
1964 81.0 56.3
1965 80.5 57.5
1966 80.1 58.6
1967 79.6 59.8
Yearof birth
Men(in %)
Woman(in %)
1968 79.2 61.0
1969 78.8 62.1
1970 78.3 63.3
1971 77.9 66.5
1972 77.5 65.9
1973 77.0 65.3
1974 76.6 64.6
1975 76.2 64.0
1976 75.7 63.4
1977 75.3 62.7
1978 74.8 62.1
1979 74.4 61.5
1980 74.0 60.8
1981 73.5 60.2
1982 73.1 59.6
1983 72.7 58.9
1984 72.2 58.3
1985 71.8 57.7
1986 71.3 57.0
1987 70.9 56.4
1988 70.5 55.8
1989 70.0 55.1
1990 69.6 54.5
1991 53.9
The Economic Costs of the Conflict to Israel: The Burden and Potential Risks
AIX Group | 93
ReferencesAlmassi, Oriana, “Implementation of the Law for Deferment of Recruitment Yeshiva Students to
IDF (“Tal Law”),” Knesset Research and Information Center, Jerusalem, 2012 (in Hebrew).
Bank of Israel, Bank of Israel Report 2010, Jerusalem 2011.
Barda, Moshe, “Data on Recruitment to IDF Over the Years,” Knesset Research and Information
Center, Jerusalem, 2007 (in Hebrew).
Berglas, Eitan, “Defense and the Economy,” in The Israeli Economy: Maturing through Crises, ed.
By Yoram Ben-Porath, Harvard University Press, Cambridge, MA (1986), 173-191.
Bernanke, Ben and Gertler, Mark, “Agency Costs, Net Worth, and Business Fluctuations”, Amer-
ican Economic Review 79 (1989), 14-31.
Central Bureau of Statistics, Defense Expenditures in Israel, Publication No. 1513, 2013.
Central Bureau of Statistics, The Statistical Annual 2012, Jerusalem, 2012.
Cohen, Stuart, “The False “Crisis” in Military Recruitment: An IDF Red Herring,” The Begin Sadat
Center for Strategic Studies, Bar-Ilan University, 2007.
Hever, Shir, “The Economic Cost of the Occupation for Israel,” in The Impact of the Occupation
on Israeli Society, ed. By Daniel Bar-Tal and Yitzhak Schnell, Bialik Publishing, Jerusalem, (in
Hebrew), 2013, 279-309.
Israel State Comptroller, State Comptroller Report 53A, 2002 (in Hebrew).
Israel State Comptroller, State Comptroller Report 61A, 2010 (in Hebrew).
Long, John B., and Plosser, Charles I., “Real Business Cycles,” Journal of Political Economy 91
(1983), 39-69.
Mei-Ami, Neomi, “Recruitment of Yeshiva Students to IDF and The Law for Deferment of Re-
cruitment Yeshiva Students to IDF (“Tal Law”),” Knesset Research and Information Center, Je-
rusalem, 2007 (in Hebrew).
Nevo, Baruch and Shur, Yael, “The Contract between the IDF and Israeli Society; Compulsory
Service,” The Israel Democracy Institute, Jerusalem, 2002.
OECD, Study on the Geographic Coverage of Israeli Data, 2010.
Sargent, Thomas J., and Zeira, Joseph, “Israel 1983: A Bout of Unpleasant Monetarist Arithme-
tic,” Review of Economic Dynamics, 14 (2011), 419-431.
Segev, Tom, One Palestine, Complete: Jews and Arabs under the British Mandate, Macmillan,
2000.
Economics and Politics in the Israeli Palestinian Conflict
AIX Group | 94
Shiffer, Zalman and Oren, Amiram, “On Land and Security: Economic Aspects of Military Con-
trol over Land Resources in Israel,” in Harivon Lekalkala, 2008(4), 387-407 (in Hebrew).
Strawczynski, Michel, and Zeira, Joseph, “Reducing the Relative Size of Government in Israel
after 1985,” in The Israeli Economy, 1985-1998: From Government Intervention to Market Eco-
nomics, ed. By Avi Ben-Bassat, The MIT Press, Cambridge MA, 2002.
Sussman, Oren, “Financial Liberalization: The Israeli Experience,” Oxford Economic Papers 44
(1992), 387-402.
Wolfson, Tal, “The Defense Burden and the Israeli Economy: The Official Data Reconsidered,
2009,” The Maurice Falk Institute for Economic Research in Israel, Jerusalem, 2010 (in Hebrew).