the amaranth debacle - pomona college
TRANSCRIPT
WINTER 2007 THE JOURNAL OF ALTERNATIVE INVESTMENTS 91
The impact of the activities ofinvestors and speculators on financialmarkets has long been of greatinterest to academics and practi-
tioners alike.1 Since 2000, the amount of assetsmanaged by hedge funds has nearly tripled froma total of $490 billion to $1,336 billion andalthough still a small percentage of total assetsworldwide, hedge funds account for an evenlarger part of the liquidity in certain markets(HFR Industry Report [2006]). In September2006, the activities of a Connecticut hedge fundnamed Amaranth Advisors LLC2 significantlyimpacted the natural gas market. Building uplarge losses in trading natural gas futures, thestory of Amaranth bears all the hallmarks of anear miss in terms of endangering systemicfinancial stability. What happened? What wentwrong? And most importantly—perhaps—doesthis strengthen the widespread call for tighterregulation of hedge funds or the futures market?3
This article addresses these questions in moredetail. Furthermore, the article looks for answerson whether the failure of Amaranth was just“business as usual” in the natural rise and fall ofhedge funds or if standard risk managementpractice could have signalled that something wasamiss.
At least since the spectacular implosionof LTCM, hedge funds have been featuredprominently in regulators’ primary concernsabout maintaining the orderly functioning ofmarkets. Indeed, in recent years, regulators
have actively debated the merits of a moreprudent regulatory framework for hedge fundsboth in public and more private settings suchas the Basel Committee for Banking Supervi-sion.4 In the collapse of Amaranth by Sep-tember 21, 2006, the firm had lost roughly$4.35 billion or one half of its assets undermanagement as a result of its energy tradingbusiness, in particular, the funds’ activities innatural gas futures and options. These lossesoccurred in just under a month betweenAugust 31 and September 21, 2006 (assets fellfrom $9.67 billion to $5.32 billion). The fundconsequently sold its energy portfolio tradingbook to J.P. Morgan and Citadel Investmentsand liquidated the remainder of its portfolio.
Since the collapse of Amaranth in Sep-tember 2006, several authors have attemptedto understand what positions and risk levelsAmaranth was engaged in to cause such a dra-matic collapse (Chincarini [2006, 2007] andTill [2006]). Chincarini [2006, 2007] usedinformation from newspapers, CEO state-ments, and actual natural gas futures data toquantify the nature of the most likely tradesthat were made at Amaranth. That articlehypothesized that Amaranth had engaged ina short summer, long winter natural gas tradeprimarily using natural gas futures. Based onthese backward-engineered positions, the articleexamined both the market and liquidity risk ofAmaranth’s positions prior to its collapse.
The Amaranth Debacle: A Failure of Risk Measures or a Failure of Risk Management?LUDWIG B. CHINCARINI
LUDWIG B. CHINCARINI
is an assistant professor atthe Department of Eco-nomics, Pomona College inClaremont, [email protected]
IT IS
ILLEGAL T
O REPRODUCE T
HIS A
RTICLE IN
ANY F
ORMAT
Copyright © 2007
On June 25, 2007, the Committee of HomelandSecurity and Government Affairs released a documentcontaining a detailed investigation of the Amaranth scandalentitled “Excessive Speculation in the Natural Gas Mar-kets.” The U.S. Senate Permanent Subcommittee onInvestigations used its subpoena power to analyze thetrading records at the New York Mercantile Exchange(NYMEX), the Intercontinental Exchange (ICE), as wellas the trades of Amaranth and other traders. It also con-ducted numerous interviews of natural gas market par-ticipants, including natural gas traders, producers, suppliers,and hedge fund managers, as well as exchange officials,regulators, and energy market experts.
This article discusses the causes and details of thecollapse of Amaranth. It also compares the Senate find-ings of the actual positions of Amaranth with those pos-tulated in Chincarini [2006, 2007] before any publicinformation on these positions was known. The next sec-tion discusses the background of Amaranth and the nat-ural gas futures market. The following section discussesthe types of trades that Amaranth had constructed in thenatural gas futures market and compares these to thehypothesized trades in Chincarini [2006, 2007] and alsodiscusses the events in the natural gas futures market inSeptember that caused the Amaranth positions to per-form so poorly. The section after that discusses the riskmanagement aspects of Amaranth’s energy positions, fol-lowed by some conclusions.
BACKGROUND
Amaranth Advisors LLC
Amaranth Advisors LLC was a hedge fund operatingin Greenwich, CT.5 The hedge fund launched in 2000 asa multi-strategy hedge fund, but by 2005–2006 had gen-erated over 80% of its profits from energy trading. AlthoughAmaranth had several funds, the principle fund, with $7.85billion at the end of August, 2006, was the Amaranth LLCfund. This fund was structured as a multi-strategy fund thatcould invest in virtually any market without any positionlimitations. The various types of strategies included energyarbitrage and other commodities, convertible bond arbi-trage, merger arbitrage, credit arbitrage, volatility arbitrage,long-short equity, and statistical arbitrage.
Amaranth was slightly unique in terms of risk man-agement in that it had a risk manager for each tradingbook who would sit with the risk takers on the trading
desk. This was believed to be more effective at under-standing and managing risk.6 The risk group produceddaily VaR and stress reports with VaR confidence levelsof 68% and 99.99% over a 20-day period. The risk man-agement team also produced a liquidity report whichwould present positions and their volumes for eachstrategy. In addition, Amaranth maintained a certainamount of risk capital to be used for anticipated margincalls on its positions. For example, in May 2006, it had$3 billion or 30% of capital in cash for these purposes.Amaranth used several prime brokers and excess bor-rowing facilities to fund its positions.
In terms of Amaranth’s capital, about 60% camefrom funds-of-funds, about 7% from insurance companies,6% from retirement and benefit programs, 6% from high-net-worth individuals, 5% from financial institutions, 2%from endowments, and 3% was insider capital. The insidercapital was not charged management or incentive fees.Amaranth commenced operations in 2000 with approx-imately $200 million in capital, mainly provided by Palomaentities. The largest investor in Amaranth by 2006amounted to 8% of total capital. Investors could with-draw funds with the following restrictions.
1. Initial deposits had a 13-month initial lock-up with90 days required written notice.
2. After this initial lock-up period, investors couldwithdraw quarterly, in January, April, July, andOctober with 45 days written notice and a 2.5%withdrawal fee.
3. Investors could also make annual redemption of profitswith 45 days written notice.
4. Beginning in February 2005, new investors weresubject to a two-year lock-up period on capital.
Minimum investments in Amaranth were $5 million.The management fee was 1.5% and the incentive fee was20%. A high watermark was also employed.
The Event Timeline
The sequence of events of the Amaranth collapse isdepicted in Exhibit 1.
The relative riskiness of Amaranth’s energy fund canbe mapped by the volatility of its profits and losses. InMay, the fund suffered losses of $974 million, althoughover the summer, the trading of the energy portfolio wasable to recoup these losses as well as produce additional
92 THE AMARANTH DEBACLE: A FAILURE OF RISK MEASURES OR A FAILURE OF RISK MANAGEMENT? WINTER 2007
Copyright © 2007
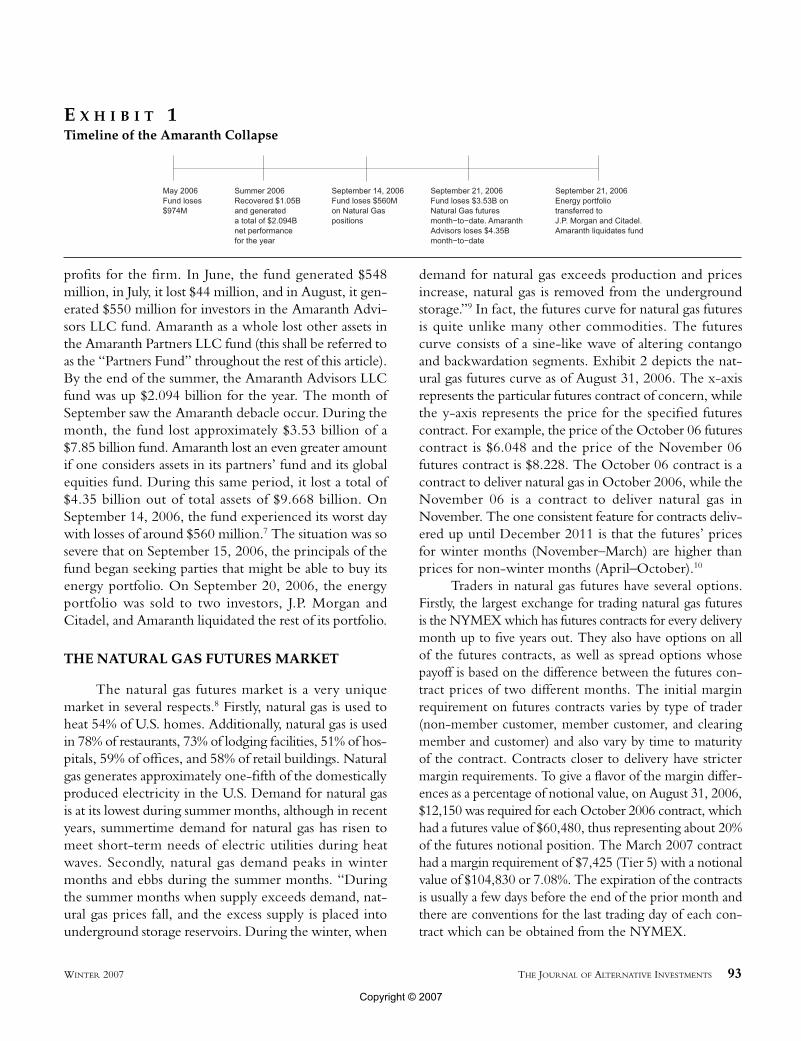
profits for the firm. In June, the fund generated $548million, in July, it lost $44 million, and in August, it gen-erated $550 million for investors in the Amaranth Advi-sors LLC fund. Amaranth as a whole lost other assets inthe Amaranth Partners LLC fund (this shall be referred toas the “Partners Fund” throughout the rest of this article).By the end of the summer, the Amaranth Advisors LLCfund was up $2.094 billion for the year. The month ofSeptember saw the Amaranth debacle occur. During themonth, the fund lost approximately $3.53 billion of a$7.85 billion fund. Amaranth lost an even greater amountif one considers assets in its partners’ fund and its globalequities fund. During this same period, it lost a total of$4.35 billion out of total assets of $9.668 billion. OnSeptember 14, 2006, the fund experienced its worst daywith losses of around $560 million.7 The situation was sosevere that on September 15, 2006, the principals of thefund began seeking parties that might be able to buy itsenergy portfolio. On September 20, 2006, the energyportfolio was sold to two investors, J.P. Morgan andCitadel, and Amaranth liquidated the rest of its portfolio.
THE NATURAL GAS FUTURES MARKET
The natural gas futures market is a very uniquemarket in several respects.8 Firstly, natural gas is used toheat 54% of U.S. homes. Additionally, natural gas is usedin 78% of restaurants, 73% of lodging facilities, 51% of hos-pitals, 59% of offices, and 58% of retail buildings. Naturalgas generates approximately one-fifth of the domesticallyproduced electricity in the U.S. Demand for natural gasis at its lowest during summer months, although in recentyears, summertime demand for natural gas has risen tomeet short-term needs of electric utilities during heatwaves. Secondly, natural gas demand peaks in wintermonths and ebbs during the summer months. “Duringthe summer months when supply exceeds demand, nat-ural gas prices fall, and the excess supply is placed intounderground storage reservoirs. During the winter, when
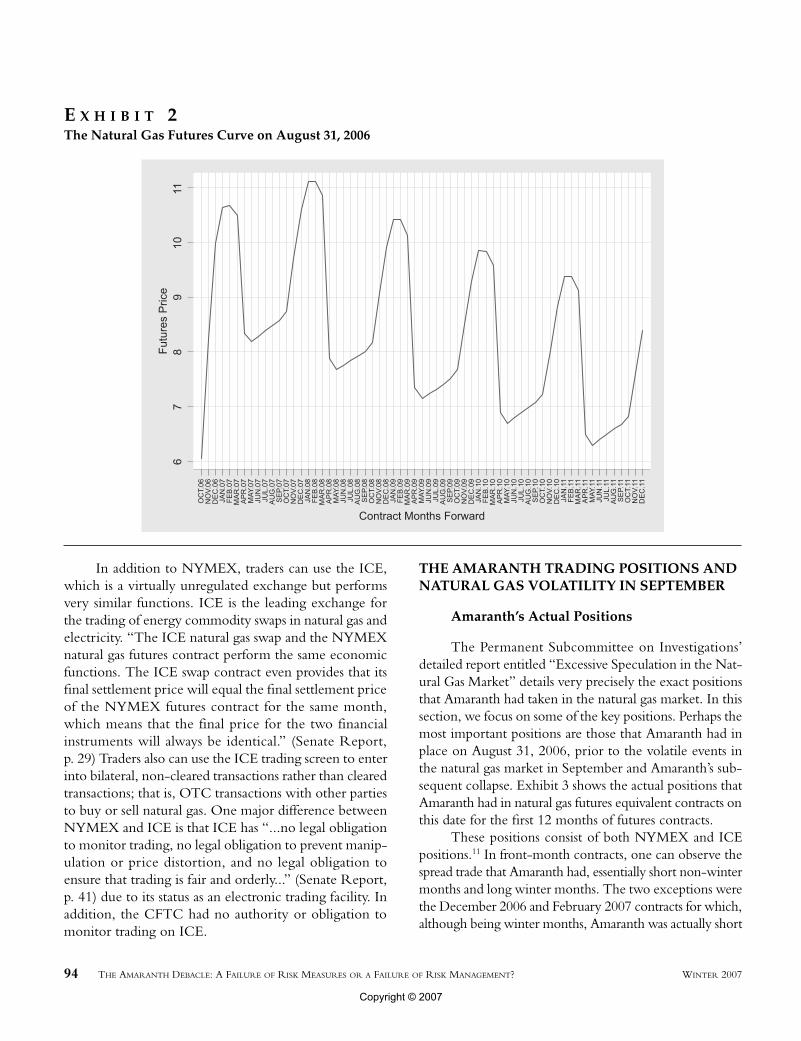
demand for natural gas exceeds production and pricesincrease, natural gas is removed from the undergroundstorage.”9 In fact, the futures curve for natural gas futuresis quite unlike many other commodities. The futurescurve consists of a sine-like wave of altering contangoand backwardation segments. Exhibit 2 depicts the nat-ural gas futures curve as of August 31, 2006. The x-axisrepresents the particular futures contract of concern, whilethe y-axis represents the price for the specified futurescontract. For example, the price of the October 06 futurescontract is $6.048 and the price of the November 06futures contract is $8.228. The October 06 contract is acontract to deliver natural gas in October 2006, while theNovember 06 is a contract to deliver natural gas inNovember. The one consistent feature for contracts deliv-ered up until December 2011 is that the futures’ pricesfor winter months (November–March) are higher thanprices for non-winter months (April–October).10
Traders in natural gas futures have several options.Firstly, the largest exchange for trading natural gas futuresis the NYMEX which has futures contracts for every deliverymonth up to five years out. They also have options on allof the futures contracts, as well as spread options whosepayoff is based on the difference between the futures con-tract prices of two different months. The initial marginrequirement on futures contracts varies by type of trader(non-member customer, member customer, and clearingmember and customer) and also vary by time to maturityof the contract. Contracts closer to delivery have strictermargin requirements. To give a flavor of the margin differ-ences as a percentage of notional value, on August 31, 2006,$12,150 was required for each October 2006 contract, whichhad a futures value of $60,480, thus representing about 20%of the futures notional position. The March 2007 contracthad a margin requirement of $7,425 (Tier 5) with a notionalvalue of $104,830 or 7.08%. The expiration of the contractsis usually a few days before the end of the prior month andthere are conventions for the last trading day of each con-tract which can be obtained from the NYMEX.
WINTER 2007 THE JOURNAL OF ALTERNATIVE INVESTMENTS 93
E X H I B I T 1Timeline of the Amaranth Collapse
Copyright © 2007
In addition to NYMEX, traders can use the ICE,which is a virtually unregulated exchange but performsvery similar functions. ICE is the leading exchange forthe trading of energy commodity swaps in natural gas andelectricity. “The ICE natural gas swap and the NYMEXnatural gas futures contract perform the same economicfunctions. The ICE swap contract even provides that itsfinal settlement price will equal the final settlement priceof the NYMEX futures contract for the same month,which means that the final price for the two financialinstruments will always be identical.” (Senate Report,p. 29) Traders also can use the ICE trading screen to enterinto bilateral, non-cleared transactions rather than clearedtransactions; that is, OTC transactions with other partiesto buy or sell natural gas. One major difference betweenNYMEX and ICE is that ICE has “...no legal obligationto monitor trading, no legal obligation to prevent manip-ulation or price distortion, and no legal obligation toensure that trading is fair and orderly...” (Senate Report,p. 41) due to its status as an electronic trading facility. Inaddition, the CFTC had no authority or obligation tomonitor trading on ICE.
THE AMARANTH TRADING POSITIONS ANDNATURAL GAS VOLATILITY IN SEPTEMBER
Amaranth’s Actual Positions
The Permanent Subcommittee on Investigations’detailed report entitled “Excessive Speculation in the Nat-ural Gas Market” details very precisely the exact positionsthat Amaranth had taken in the natural gas market. In thissection, we focus on some of the key positions. Perhaps themost important positions are those that Amaranth had inplace on August 31, 2006, prior to the volatile events inthe natural gas market in September and Amaranth’s sub-sequent collapse. Exhibit 3 shows the actual positions thatAmaranth had in natural gas futures equivalent contracts onthis date for the first 12 months of futures contracts.
These positions consist of both NYMEX and ICEpositions.11 In front-month contracts, one can observe thespread trade that Amaranth had, essentially short non-wintermonths and long winter months. The two exceptions werethe December 2006 and February 2007 contracts for which,although being winter months, Amaranth was actually short
94 THE AMARANTH DEBACLE: A FAILURE OF RISK MEASURES OR A FAILURE OF RISK MANAGEMENT? WINTER 2007
E X H I B I T 2The Natural Gas Futures Curve on August 31, 2006
Copyright © 2007
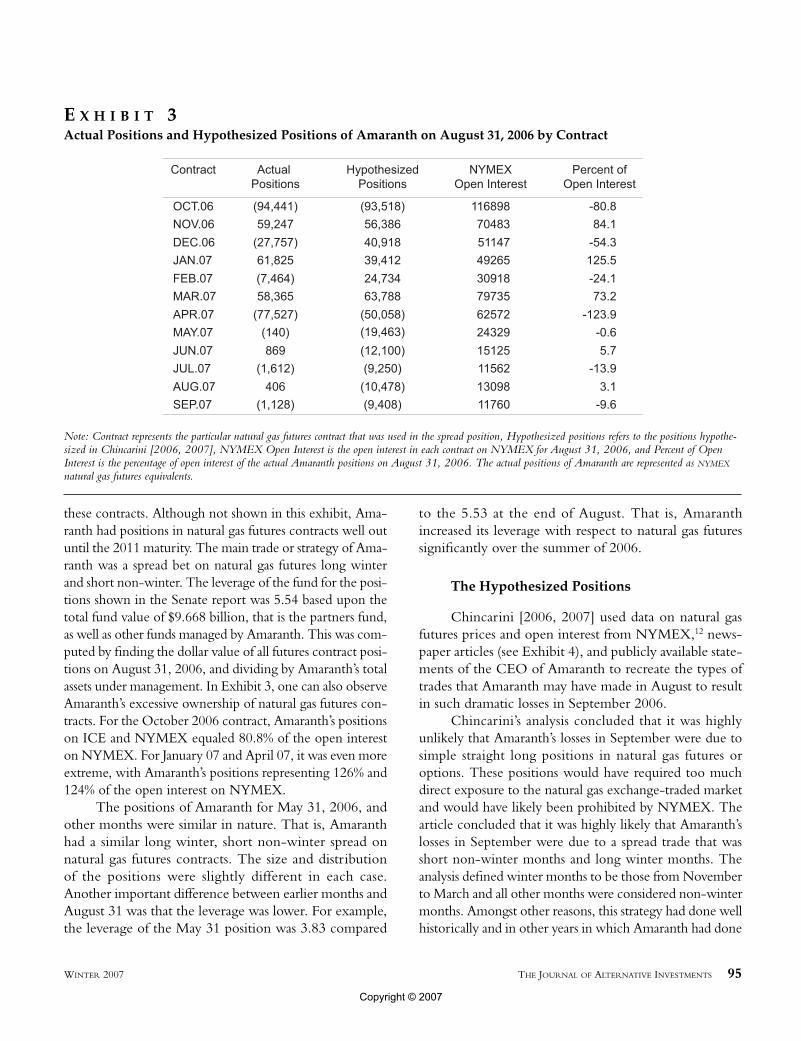
these contracts. Although not shown in this exhibit, Ama-ranth had positions in natural gas futures contracts well outuntil the 2011 maturity. The main trade or strategy of Ama-ranth was a spread bet on natural gas futures long winterand short non-winter. The leverage of the fund for the posi-tions shown in the Senate report was 5.54 based upon thetotal fund value of $9.668 billion, that is the partners fund,as well as other funds managed by Amaranth. This was com-puted by finding the dollar value of all futures contract posi-tions on August 31, 2006, and dividing by Amaranth’s totalassets under management. In Exhibit 3, one can also observeAmaranth’s excessive ownership of natural gas futures con-tracts. For the October 2006 contract, Amaranth’s positionson ICE and NYMEX equaled 80.8% of the open intereston NYMEX. For January 07 and April 07, it was even moreextreme, with Amaranth’s positions representing 126% and124% of the open interest on NYMEX.
The positions of Amaranth for May 31, 2006, andother months were similar in nature. That is, Amaranthhad a similar long winter, short non-winter spread onnatural gas futures contracts. The size and distributionof the positions were slightly different in each case.Another important difference between earlier months andAugust 31 was that the leverage was lower. For example,the leverage of the May 31 position was 3.83 compared
to the 5.53 at the end of August. That is, Amaranthincreased its leverage with respect to natural gas futuressignificantly over the summer of 2006.
The Hypothesized Positions
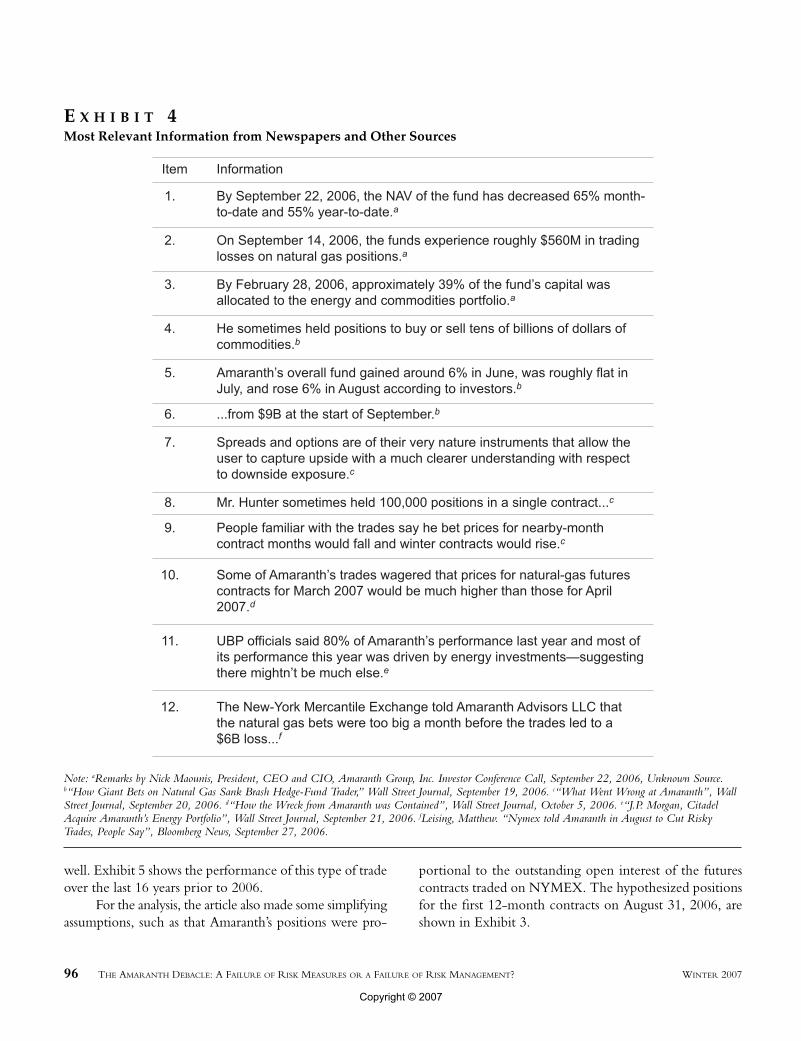
Chincarini [2006, 2007] used data on natural gasfutures prices and open interest from NYMEX,12 news-paper articles (see Exhibit 4), and publicly available state-ments of the CEO of Amaranth to recreate the types oftrades that Amaranth may have made in August to resultin such dramatic losses in September 2006.
Chincarini’s analysis concluded that it was highlyunlikely that Amaranth’s losses in September were due tosimple straight long positions in natural gas futures oroptions. These positions would have required too muchdirect exposure to the natural gas exchange-traded marketand would have likely been prohibited by NYMEX. Thearticle concluded that it was highly likely that Amaranth’slosses in September were due to a spread trade that wasshort non-winter months and long winter months. Theanalysis defined winter months to be those from Novemberto March and all other months were considered non-wintermonths. Amongst other reasons, this strategy had done wellhistorically and in other years in which Amaranth had done
WINTER 2007 THE JOURNAL OF ALTERNATIVE INVESTMENTS 95
Note: Contract represents the particular natural gas futures contract that was used in the spread position, Hypothesized positions refers to the positions hypothe-sized in Chincarini [2006, 2007], NYMEX Open Interest is the open interest in each contract on NYMEX for August 31, 2006, and Percent of OpenInterest is the percentage of open interest of the actual Amaranth positions on August 31, 2006. The actual positions of Amaranth are represented as NYMEX
natural gas futures equivalents.
E X H I B I T 3Actual Positions and Hypothesized Positions of Amaranth on August 31, 2006 by Contract
Copyright © 2007
well. Exhibit 5 shows the performance of this type of tradeover the last 16 years prior to 2006.
For the analysis, the article also made some simplifyingassumptions, such as that Amaranth’s positions were pro-
portional to the outstanding open interest of the futurescontracts traded on NYMEX. The hypothesized positionsfor the first 12-month contracts on August 31, 2006, areshown in Exhibit 3.
96 THE AMARANTH DEBACLE: A FAILURE OF RISK MEASURES OR A FAILURE OF RISK MANAGEMENT? WINTER 2007
Note: aRemarks by Nick Maounis, President, CEO and CIO, Amaranth Group, Inc. Investor Conference Call, September 22, 2006, Unknown Source.b“How Giant Bets on Natural Gas Sank Brash Hedge-Fund Trader,” Wall Street Journal, September 19, 2006. c“What Went Wrong at Amaranth”, WallStreet Journal, September 20, 2006. d“How the Wreck from Amaranth was Contained”, Wall Street Journal, October 5, 2006. e“J.P. Morgan, CitadelAcquire Amaranth’s Energy Portfolio”, Wall Street Journal, September 21, 2006. fLeising, Matthew. “Nymex told Amaranth in August to Cut RiskyTrades, People Say”, Bloomberg News, September 27, 2006.
E X H I B I T 4Most Relevant Information from Newspapers and Other Sources
Copyright © 2007
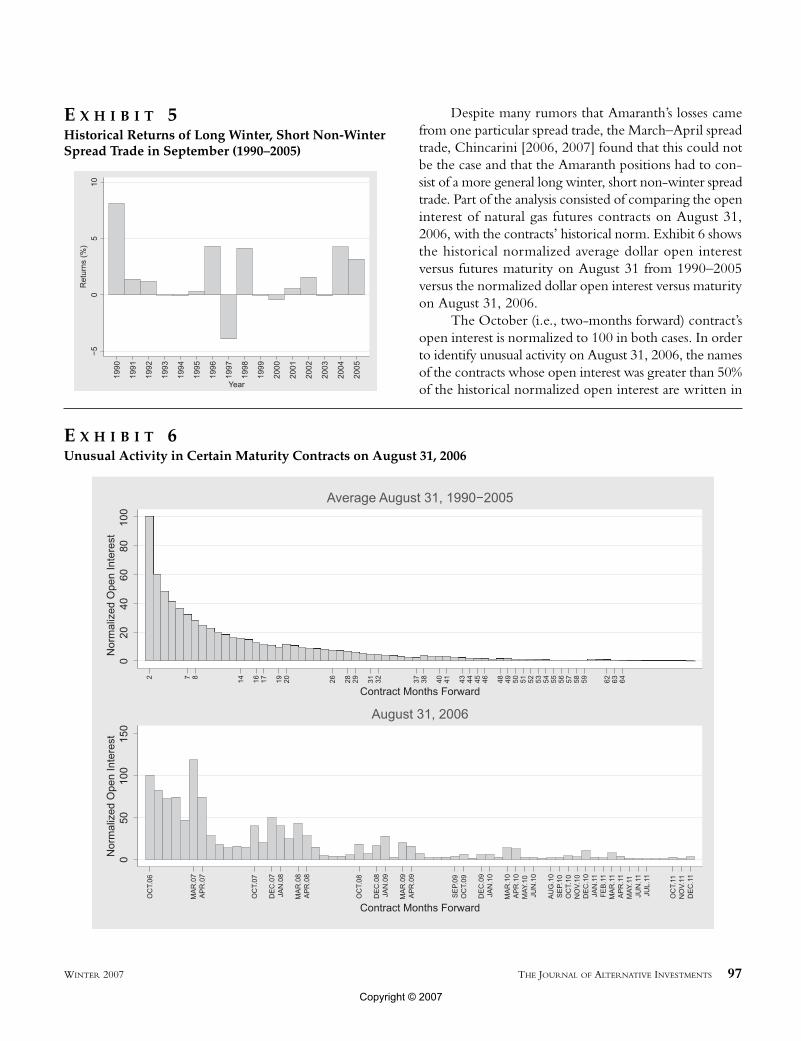
Despite many rumors that Amaranth’s losses camefrom one particular spread trade, the March–April spreadtrade, Chincarini [2006, 2007] found that this could notbe the case and that the Amaranth positions had to con-sist of a more general long winter, short non-winter spreadtrade. Part of the analysis consisted of comparing the openinterest of natural gas futures contracts on August 31,2006, with the contracts’ historical norm. Exhibit 6 showsthe historical normalized average dollar open interestversus futures maturity on August 31 from 1990–2005versus the normalized dollar open interest versus maturityon August 31, 2006.
The October (i.e., two-months forward) contract’sopen interest is normalized to 100 in both cases. In orderto identify unusual activity on August 31, 2006, the namesof the contracts whose open interest was greater than 50%of the historical normalized open interest are written in
WINTER 2007 THE JOURNAL OF ALTERNATIVE INVESTMENTS 97
E X H I B I T 5Historical Returns of Long Winter, Short Non-WinterSpread Trade in September (1990–2005)
E X H I B I T 6Unusual Activity in Certain Maturity Contracts on August 31, 2006
Copyright © 2007
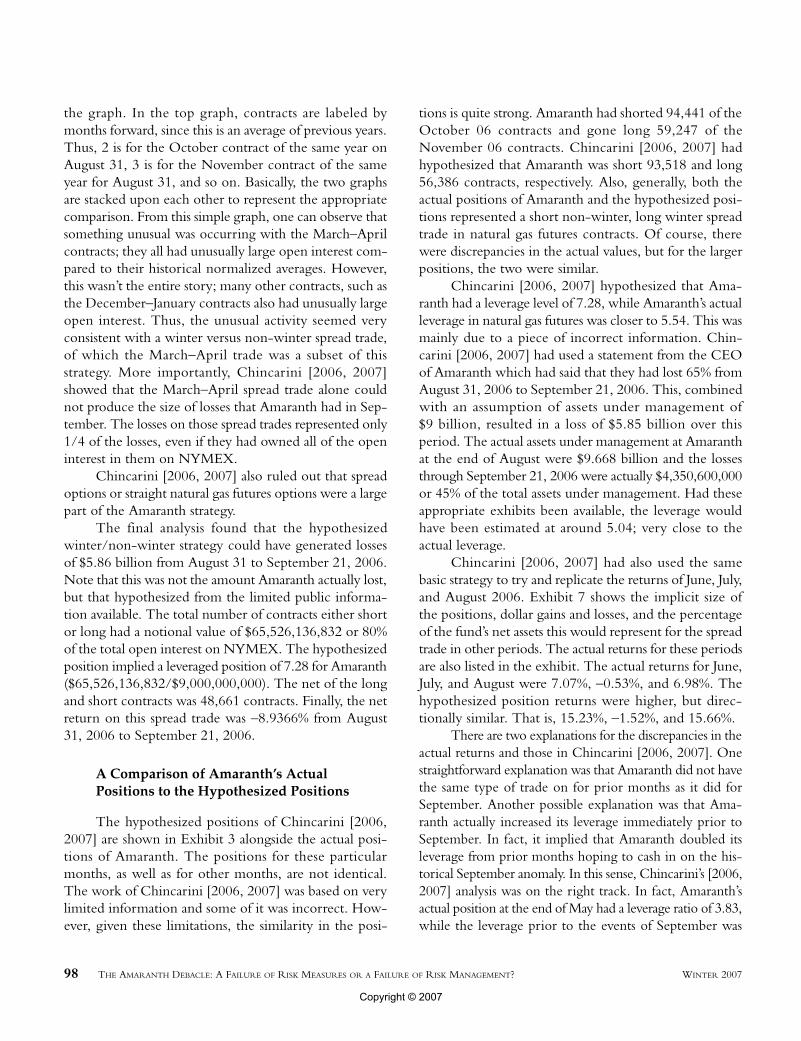
the graph. In the top graph, contracts are labeled bymonths forward, since this is an average of previous years.Thus, 2 is for the October contract of the same year onAugust 31, 3 is for the November contract of the sameyear for August 31, and so on. Basically, the two graphsare stacked upon each other to represent the appropriatecomparison. From this simple graph, one can observe thatsomething unusual was occurring with the March–Aprilcontracts; they all had unusually large open interest com-pared to their historical normalized averages. However,this wasn’t the entire story; many other contracts, such asthe December–January contracts also had unusually largeopen interest. Thus, the unusual activity seemed veryconsistent with a winter versus non-winter spread trade,of which the March–April trade was a subset of thisstrategy. More importantly, Chincarini [2006, 2007]showed that the March–April spread trade alone couldnot produce the size of losses that Amaranth had in Sep-tember. The losses on those spread trades represented only1/4 of the losses, even if they had owned all of the openinterest in them on NYMEX.
Chincarini [2006, 2007] also ruled out that spreadoptions or straight natural gas futures options were a largepart of the Amaranth strategy.
The final analysis found that the hypothesizedwinter/non-winter strategy could have generated lossesof $5.86 billion from August 31 to September 21, 2006.Note that this was not the amount Amaranth actually lost,but that hypothesized from the limited public informa-tion available. The total number of contracts either shortor long had a notional value of $65,526,136,832 or 80%of the total open interest on NYMEX. The hypothesizedposition implied a leveraged position of 7.28 for Amaranth($65,526,136,832/$9,000,000,000). The net of the longand short contracts was 48,661 contracts. Finally, the netreturn on this spread trade was –8.9366% from August31, 2006 to September 21, 2006.
A Comparison of Amaranth’s ActualPositions to the Hypothesized Positions
The hypothesized positions of Chincarini [2006,2007] are shown in Exhibit 3 alongside the actual posi-tions of Amaranth. The positions for these particularmonths, as well as for other months, are not identical.The work of Chincarini [2006, 2007] was based on verylimited information and some of it was incorrect. How-ever, given these limitations, the similarity in the posi-
tions is quite strong. Amaranth had shorted 94,441 of theOctober 06 contracts and gone long 59,247 of theNovember 06 contracts. Chincarini [2006, 2007] hadhypothesized that Amaranth was short 93,518 and long56,386 contracts, respectively. Also, generally, both theactual positions of Amaranth and the hypothesized posi-tions represented a short non-winter, long winter spreadtrade in natural gas futures contracts. Of course, therewere discrepancies in the actual values, but for the largerpositions, the two were similar.
Chincarini [2006, 2007] hypothesized that Ama-ranth had a leverage level of 7.28, while Amaranth’s actualleverage in natural gas futures was closer to 5.54. This wasmainly due to a piece of incorrect information. Chin-carini [2006, 2007] had used a statement from the CEOof Amaranth which had said that they had lost 65% fromAugust 31, 2006 to September 21, 2006. This, combinedwith an assumption of assets under management of$9 billion, resulted in a loss of $5.85 billion over thisperiod. The actual assets under management at Amaranthat the end of August were $9.668 billion and the lossesthrough September 21, 2006 were actually $4,350,600,000or 45% of the total assets under management. Had theseappropriate exhibits been available, the leverage wouldhave been estimated at around 5.04; very close to theactual leverage.
Chincarini [2006, 2007] had also used the samebasic strategy to try and replicate the returns of June, July,and August 2006. Exhibit 7 shows the implicit size ofthe positions, dollar gains and losses, and the percentageof the fund’s net assets this would represent for the spreadtrade in other periods. The actual returns for these periodsare also listed in the exhibit. The actual returns for June,July, and August were 7.07%, –0.53%, and 6.98%. Thehypothesized position returns were higher, but direc-tionally similar. That is, 15.23%, –1.52%, and 15.66%.
There are two explanations for the discrepancies in theactual returns and those in Chincarini [2006, 2007]. Onestraightforward explanation was that Amaranth did not havethe same type of trade on for prior months as it did forSeptember. Another possible explanation was that Ama-ranth actually increased its leverage immediately prior toSeptember. In fact, it implied that Amaranth doubled itsleverage from prior months hoping to cash in on the his-torical September anomaly. In this sense, Chincarini’s [2006,2007] analysis was on the right track. In fact, Amaranth’sactual position at the end of May had a leverage ratio of 3.83,while the leverage prior to the events of September was
98 THE AMARANTH DEBACLE: A FAILURE OF RISK MEASURES OR A FAILURE OF RISK MANAGEMENT? WINTER 2007
Copyright © 2007
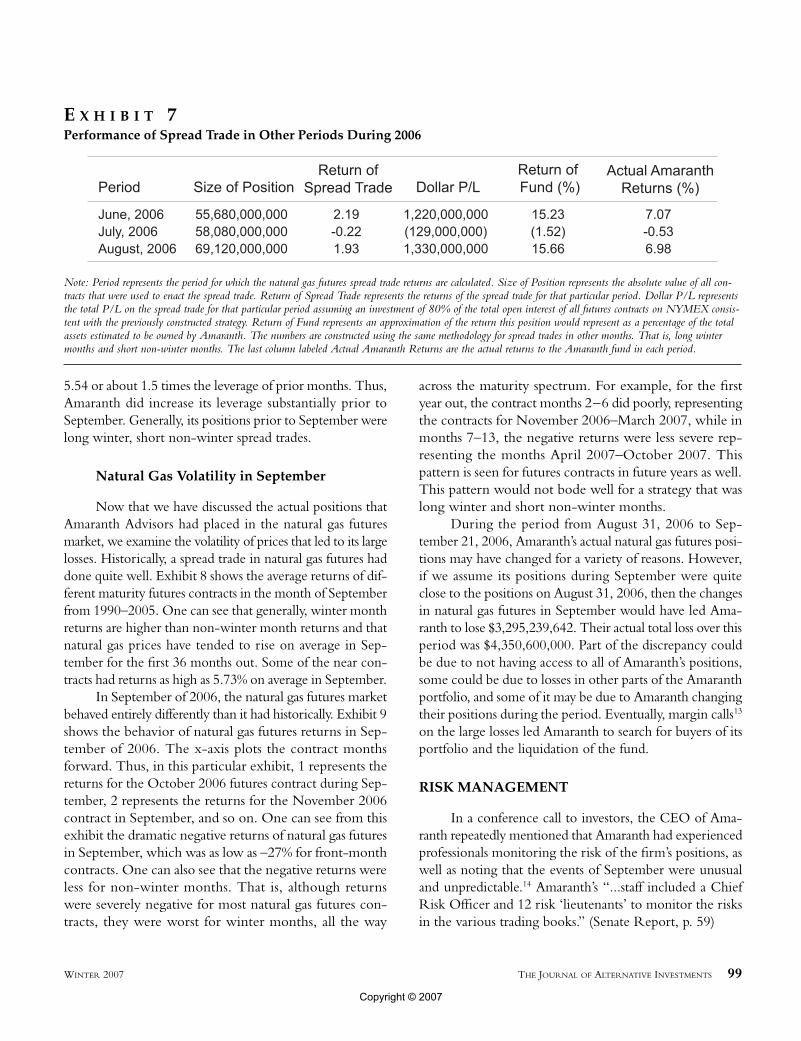
5.54 or about 1.5 times the leverage of prior months. Thus,Amaranth did increase its leverage substantially prior toSeptember. Generally, its positions prior to September werelong winter, short non-winter spread trades.
Natural Gas Volatility in September
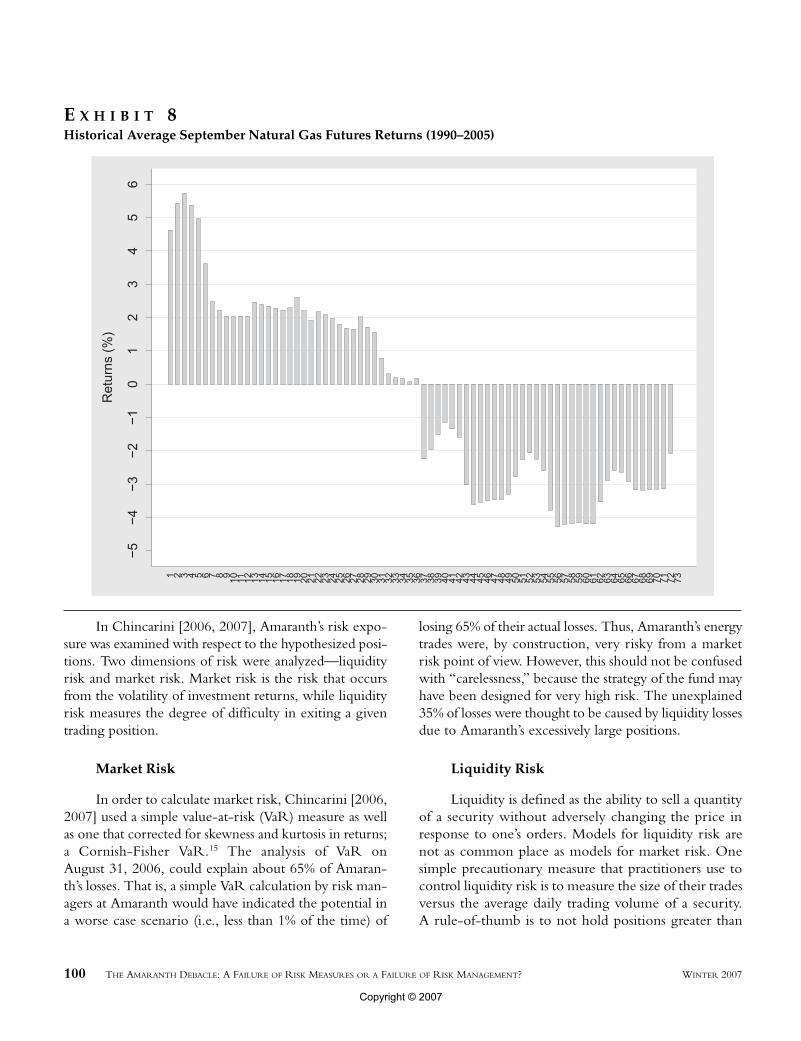
Now that we have discussed the actual positions thatAmaranth Advisors had placed in the natural gas futuresmarket, we examine the volatility of prices that led to its largelosses. Historically, a spread trade in natural gas futures haddone quite well. Exhibit 8 shows the average returns of dif-ferent maturity futures contracts in the month of Septemberfrom 1990–2005. One can see that generally, winter monthreturns are higher than non-winter month returns and thatnatural gas prices have tended to rise on average in Sep-tember for the first 36 months out. Some of the near con-tracts had returns as high as 5.73% on average in September.
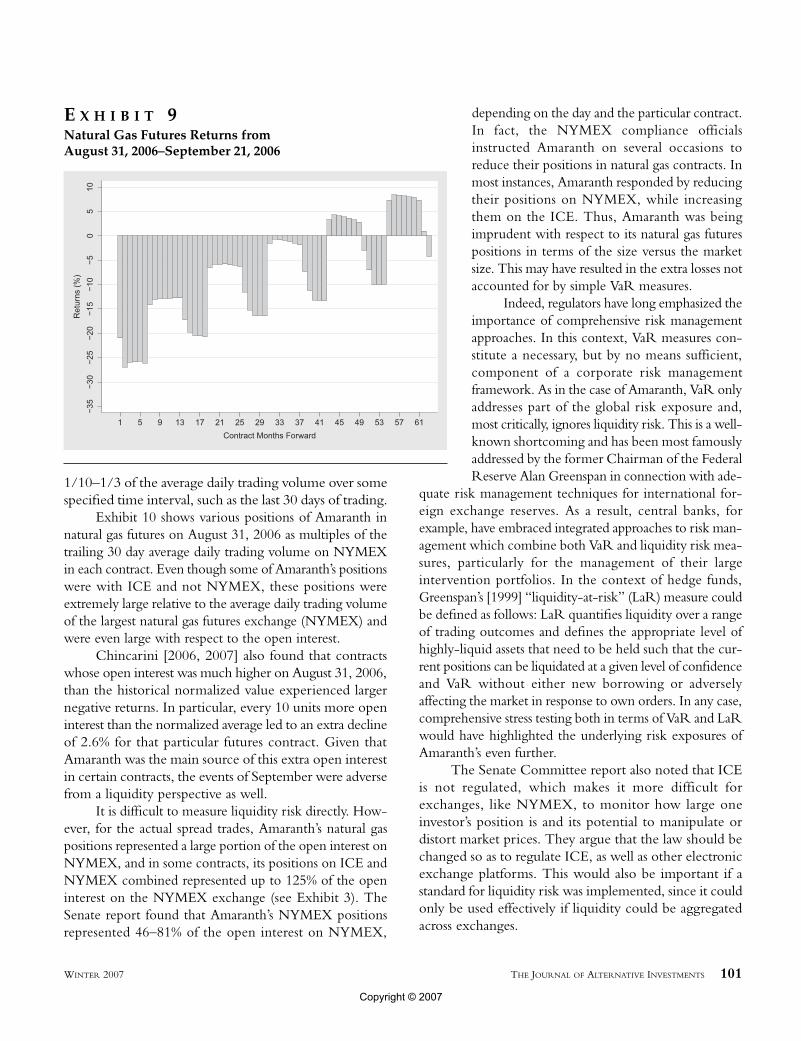
In September of 2006, the natural gas futures marketbehaved entirely differently than it had historically. Exhibit 9shows the behavior of natural gas futures returns in Sep-tember of 2006. The x-axis plots the contract monthsforward. Thus, in this particular exhibit, 1 represents thereturns for the October 2006 futures contract during Sep-tember, 2 represents the returns for the November 2006contract in September, and so on. One can see from thisexhibit the dramatic negative returns of natural gas futuresin September, which was as low as –27% for front-monthcontracts. One can also see that the negative returns wereless for non-winter months. That is, although returnswere severely negative for most natural gas futures con-tracts, they were worst for winter months, all the way
across the maturity spectrum. For example, for the firstyear out, the contract months 2–6 did poorly, representingthe contracts for November 2006–March 2007, while inmonths 7–13, the negative returns were less severe rep-resenting the months April 2007–October 2007. Thispattern is seen for futures contracts in future years as well.This pattern would not bode well for a strategy that waslong winter and short non-winter months.
During the period from August 31, 2006 to Sep-tember 21, 2006, Amaranth’s actual natural gas futures posi-tions may have changed for a variety of reasons. However,if we assume its positions during September were quiteclose to the positions on August 31, 2006, then the changesin natural gas futures in September would have led Ama-ranth to lose $3,295,239,642. Their actual total loss over thisperiod was $4,350,600,000. Part of the discrepancy couldbe due to not having access to all of Amaranth’s positions,some could be due to losses in other parts of the Amaranthportfolio, and some of it may be due to Amaranth changingtheir positions during the period. Eventually, margin calls13
on the large losses led Amaranth to search for buyers of itsportfolio and the liquidation of the fund.
RISK MANAGEMENT
In a conference call to investors, the CEO of Ama-ranth repeatedly mentioned that Amaranth had experiencedprofessionals monitoring the risk of the firm’s positions, aswell as noting that the events of September were unusualand unpredictable.14 Amaranth’s “...staff included a ChiefRisk Officer and 12 risk ‘lieutenants’ to monitor the risksin the various trading books.” (Senate Report, p. 59)
WINTER 2007 THE JOURNAL OF ALTERNATIVE INVESTMENTS 99
Note: Period represents the period for which the natural gas futures spread trade returns are calculated. Size of Position represents the absolute value of all con-tracts that were used to enact the spread trade. Return of Spread Trade represents the returns of the spread trade for that particular period. Dollar P/L representsthe total P/L on the spread trade for that particular period assuming an investment of 80% of the total open interest of all futures contracts on NYMEX consis-tent with the previously constructed strategy. Return of Fund represents an approximation of the return this position would represent as a percentage of the totalassets estimated to be owned by Amaranth. The numbers are constructed using the same methodology for spread trades in other months. That is, long wintermonths and short non-winter months. The last column labeled Actual Amaranth Returns are the actual returns to the Amaranth fund in each period.
E X H I B I T 7Performance of Spread Trade in Other Periods During 2006
Copyright © 2007
In Chincarini [2006, 2007], Amaranth’s risk expo-sure was examined with respect to the hypothesized posi-tions. Two dimensions of risk were analyzed—liquidityrisk and market risk. Market risk is the risk that occursfrom the volatility of investment returns, while liquidityrisk measures the degree of difficulty in exiting a giventrading position.
Market Risk
In order to calculate market risk, Chincarini [2006,2007] used a simple value-at-risk (VaR) measure as wellas one that corrected for skewness and kurtosis in returns;a Cornish-Fisher VaR.15 The analysis of VaR onAugust 31, 2006, could explain about 65% of Amaran-th’s losses. That is, a simple VaR calculation by risk man-agers at Amaranth would have indicated the potential ina worse case scenario (i.e., less than 1% of the time) of
losing 65% of their actual losses. Thus, Amaranth’s energytrades were, by construction, very risky from a marketrisk point of view. However, this should not be confusedwith “carelessness,” because the strategy of the fund mayhave been designed for very high risk. The unexplained35% of losses were thought to be caused by liquidity lossesdue to Amaranth’s excessively large positions.
Liquidity Risk
Liquidity is defined as the ability to sell a quantityof a security without adversely changing the price inresponse to one’s orders. Models for liquidity risk arenot as common place as models for market risk. Onesimple precautionary measure that practitioners use tocontrol liquidity risk is to measure the size of their tradesversus the average daily trading volume of a security.A rule-of-thumb is to not hold positions greater than
100 THE AMARANTH DEBACLE: A FAILURE OF RISK MEASURES OR A FAILURE OF RISK MANAGEMENT? WINTER 2007
E X H I B I T 8Historical Average September Natural Gas Futures Returns (1990–2005)
Copyright © 2007
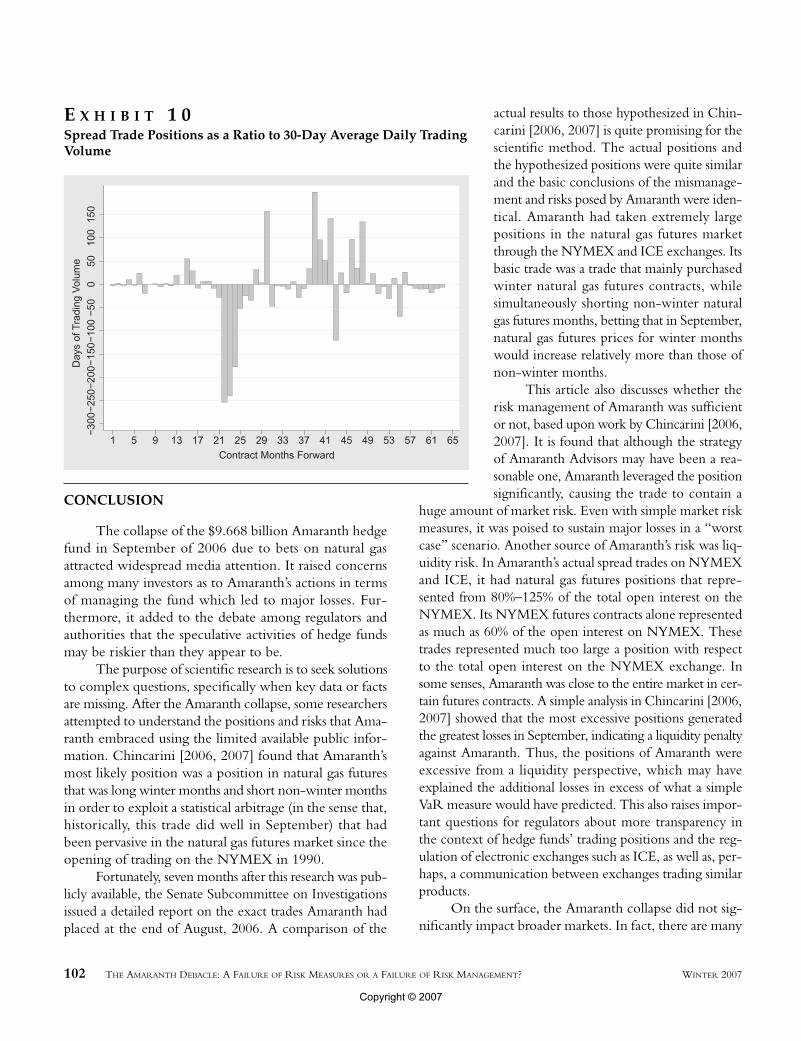
1/10–1/3 of the average daily trading volume over somespecified time interval, such as the last 30 days of trading.
Exhibit 10 shows various positions of Amaranth innatural gas futures on August 31, 2006 as multiples of thetrailing 30 day average daily trading volume on NYMEXin each contract. Even though some of Amaranth’s positionswere with ICE and not NYMEX, these positions wereextremely large relative to the average daily trading volumeof the largest natural gas futures exchange (NYMEX) andwere even large with respect to the open interest.
Chincarini [2006, 2007] also found that contractswhose open interest was much higher on August 31, 2006,than the historical normalized value experienced largernegative returns. In particular, every 10 units more openinterest than the normalized average led to an extra declineof 2.6% for that particular futures contract. Given thatAmaranth was the main source of this extra open interestin certain contracts, the events of September were adversefrom a liquidity perspective as well.
It is difficult to measure liquidity risk directly. How-ever, for the actual spread trades, Amaranth’s natural gaspositions represented a large portion of the open interest onNYMEX, and in some contracts, its positions on ICE andNYMEX combined represented up to 125% of the openinterest on the NYMEX exchange (see Exhibit 3). TheSenate report found that Amaranth’s NYMEX positionsrepresented 46–81% of the open interest on NYMEX,
depending on the day and the particular contract.In fact, the NYMEX compliance officialsinstructed Amaranth on several occasions toreduce their positions in natural gas contracts. Inmost instances, Amaranth responded by reducingtheir positions on NYMEX, while increasingthem on the ICE. Thus, Amaranth was beingimprudent with respect to its natural gas futurespositions in terms of the size versus the marketsize. This may have resulted in the extra losses notaccounted for by simple VaR measures.
Indeed, regulators have long emphasized theimportance of comprehensive risk managementapproaches. In this context, VaR measures con-stitute a necessary, but by no means sufficient,component of a corporate risk managementframework. As in the case of Amaranth, VaR onlyaddresses part of the global risk exposure and,most critically, ignores liquidity risk. This is a well-known shortcoming and has been most famouslyaddressed by the former Chairman of the FederalReserve Alan Greenspan in connection with ade-
quate risk management techniques for international for-eign exchange reserves. As a result, central banks, forexample, have embraced integrated approaches to risk man-agement which combine both VaR and liquidity risk mea-sures, particularly for the management of their largeintervention portfolios. In the context of hedge funds,Greenspan’s [1999] “liquidity-at-risk” (LaR) measure couldbe defined as follows: LaR quantifies liquidity over a rangeof trading outcomes and defines the appropriate level ofhighly-liquid assets that need to be held such that the cur-rent positions can be liquidated at a given level of confidenceand VaR without either new borrowing or adverselyaffecting the market in response to own orders. In any case,comprehensive stress testing both in terms of VaR and LaRwould have highlighted the underlying risk exposures ofAmaranth’s even further.
The Senate Committee report also noted that ICEis not regulated, which makes it more difficult forexchanges, like NYMEX, to monitor how large oneinvestor’s position is and its potential to manipulate ordistort market prices. They argue that the law should bechanged so as to regulate ICE, as well as other electronicexchange platforms. This would also be important if astandard for liquidity risk was implemented, since it couldonly be used effectively if liquidity could be aggregatedacross exchanges.
WINTER 2007 THE JOURNAL OF ALTERNATIVE INVESTMENTS 101
E X H I B I T 9Natural Gas Futures Returns from August 31, 2006–September 21, 2006
Copyright © 2007
CONCLUSION
The collapse of the $9.668 billion Amaranth hedgefund in September of 2006 due to bets on natural gasattracted widespread media attention. It raised concernsamong many investors as to Amaranth’s actions in termsof managing the fund which led to major losses. Fur-thermore, it added to the debate among regulators andauthorities that the speculative activities of hedge fundsmay be riskier than they appear to be.
The purpose of scientific research is to seek solutionsto complex questions, specifically when key data or factsare missing. After the Amaranth collapse, some researchersattempted to understand the positions and risks that Ama-ranth embraced using the limited available public infor-mation. Chincarini [2006, 2007] found that Amaranth’smost likely position was a position in natural gas futuresthat was long winter months and short non-winter monthsin order to exploit a statistical arbitrage (in the sense that,historically, this trade did well in September) that hadbeen pervasive in the natural gas futures market since theopening of trading on the NYMEX in 1990.
Fortunately, seven months after this research was pub-licly available, the Senate Subcommittee on Investigationsissued a detailed report on the exact trades Amaranth hadplaced at the end of August, 2006. A comparison of the
actual results to those hypothesized in Chin-carini [2006, 2007] is quite promising for thescientific method. The actual positions andthe hypothesized positions were quite similarand the basic conclusions of the mismanage-ment and risks posed by Amaranth were iden-tical. Amaranth had taken extremely largepositions in the natural gas futures marketthrough the NYMEX and ICE exchanges. Itsbasic trade was a trade that mainly purchasedwinter natural gas futures contracts, whilesimultaneously shorting non-winter naturalgas futures months, betting that in September,natural gas futures prices for winter monthswould increase relatively more than those ofnon-winter months.
This article also discusses whether therisk management of Amaranth was sufficientor not, based upon work by Chincarini [2006,2007]. It is found that although the strategyof Amaranth Advisors may have been a rea-sonable one, Amaranth leveraged the positionsignificantly, causing the trade to contain a
huge amount of market risk. Even with simple market riskmeasures, it was poised to sustain major losses in a “worstcase” scenario. Another source of Amaranth’s risk was liq-uidity risk. In Amaranth’s actual spread trades on NYMEXand ICE, it had natural gas futures positions that repre-sented from 80%–125% of the total open interest on theNYMEX. Its NYMEX futures contracts alone representedas much as 60% of the open interest on NYMEX. Thesetrades represented much too large a position with respectto the total open interest on the NYMEX exchange. Insome senses, Amaranth was close to the entire market in cer-tain futures contracts. A simple analysis in Chincarini [2006,2007] showed that the most excessive positions generatedthe greatest losses in September, indicating a liquidity penaltyagainst Amaranth. Thus, the positions of Amaranth wereexcessive from a liquidity perspective, which may haveexplained the additional losses in excess of what a simpleVaR measure would have predicted. This also raises impor-tant questions for regulators about more transparency inthe context of hedge funds’ trading positions and the reg-ulation of electronic exchanges such as ICE, as well as, per-haps, a communication between exchanges trading similarproducts.
On the surface, the Amaranth collapse did not sig-nificantly impact broader markets. In fact, there are many
102 THE AMARANTH DEBACLE: A FAILURE OF RISK MEASURES OR A FAILURE OF RISK MANAGEMENT? WINTER 2007
E X H I B I T 1 0Spread Trade Positions as a Ratio to 30-Day Average Daily TradingVolume
Copyright © 2007
positives in that the daily margin collection of theNYMEX worked to prevent a larger crisis. However,when security prices are diverted from their fair values dueto bubbles or market manipulation by large players, con-sumers of these products ultimately bear the burden ofan unfair distribution of income. In the natural gas markets,some of these consumers include residents, schools, hos-pitals, small businesses, local electricity plants, and others.Regulators might ask if transparency would have aidedinvestors in understanding the extent of Amaranth’s expo-sure to energy. Risk managers and regulators alike mightalso ask for standardized measures of liquidity risk, sinceliquidity risk seemed to be excessively high perhapswithout any obvious signal to risk managers at Amaranth.Finally, a supervisory board like the CFTC might berequired to have an oversight committee that has accessto positions across exchanges on similar products for amore thorough liquidity analysis. In fact, on September17, 2007, Senator Carl Levin of Michigan introduced abill to regulate electronic energy trading facilities by reg-istering with the CFTC (Levin [2007]). The bill also pro-poses to provide trading limits for energy traders that canbe monitored by the CFTC across all energy trading plat-forms and exchanges, requires that large domestic tradersof energy report their trades on foreign exchanges, anddefines precisely what constitutes an “energy tradingfacility” and an “energy commodity.”
ENDNOTES
I would like to thank Jim Riley for sparking my interestin this topic and for helpful comments. I especially thank DanBerkovitz and the Senate Subcommittee headed by SenatorCarl Levin for very useful conversations and helpful informa-tion. I also thank Guy Adami, Noel Amenc, David Bieri, RajGupta, Ed Fraim, Lionel Martellini, and everyone at the SeniorColloqium in Economics at Pomona College for helpful com-ments. I thank Scott Byrne and Joann Arena of NYMEX forsupplying data.
1While Keynes [1936] merely refers to speculators as “fore-casting the psychology of the market,” Friedman [1953] assertsthat speculation normally helps to stabilize prices rather thandestabilize them. Friedman argues that if speculative tradingtended to push prices higher when they are already high andlower when they are already low, then traders must be buyinghigh and selling low. Since such behavior is not profitable onaverage, speculative traders try to buy low and sell high instead.Such activities would be stabilizing since they tend to push pricesup when they are too low and down when they are too high.
2“Amaranth” henceforth.3In a recent speech on Amaranth, the deputy Governor
of the Sveriges Riksbanks (Nyberg [2006]) argued that suchconcerns rest on the fact that hedge funds’ activities are opaque,that they borrow substantially, and that Amaranth was specu-lative and prone to herd behavior.
4See, for example, the BCBS’ recommendations [2000].5Many thanks to Dan Berkovitz for providing the infor-
mation upon which much of this section is based.6Most of these risk officers had advanced degrees in
various fields.7The losses for September 14, 2006, are not from actual
data, but rather from statements by the CEO in September.They could be inaccurate.
8For a detailed description of the natural gas futuresmarket, see the Senate Committee report.
9See the Senate report for more details.10In this article, we divide all months into winter months
and non-winter months. We classify November, December,January, February, and March into winter months and all othermonths into non-winter months.
11The positions consist of natural gas futures contracts,swaps, and options all converted to NYMEX natural gas futuresequivalents by the Senate Subcommittee.
12ICE did not have any historical data available forpublic use.
13By September 8, 2006, margin requirements exceeded$3 billion.
14“What Brian is really, really good at is taking controlledand measured risk.” “How Giant Bets on Natural Gas SankBrash Hedge-Fund Trader,” Wall Street Journal, September 19,2006. He also said “...a series of unusual and unpredictableevents caused the Funds natural gas positions (including spreads)to incur dramatic losses while the markets provided no viablemeans of existing those positions” and “We viewed the prob-ability of market movements such as those that took place inSeptember as highly remote...” and “...we had assigned full-time, well-credentialed and experienced risk professionals tomodel and monitor our energy portfolios risk...” Remarks byNick Maounis, President, CEO and CIO, Amaranth Group, Inc.Investor Conference Call, September 22, 2006.
15Details are explained in Chincarini [2006, 2007].
REFERENCES
Basel Committee on Banking Supervision, Basel, Switzerland.“Banks Interactions with Highly Leveraged Institutions: Imple-mentation of the Basel Committees+ Sound Practices.” Paper,January 2000.
WINTER 2007 THE JOURNAL OF ALTERNATIVE INVESTMENTS 103
Copyright © 2007
Chincarini, Ludwig B. “The Amaranth Debacle: Failure ofRisk Measures or Failure of Risk Management?” Presentationat Georgetown McDonough School of Business, December 5,2006. http://faculty.msb.edu/lbc22/video_clip1.html
——. “The Amaranth Debacle: Failure of Risk Measures orFailure of Risk Management?” (April 2007) Available at SSRN:http://ssrn.com/abstract=952607.
“Excessive Speculation in the Natural Gas Market Appendix.”United States Senate Permanent Subcommittee on Investiga-tions Staff Report, June 25, 2007.
“Excessive Speculation in the Natural Gas Market.” UnitedStates Senate Permanent Subcommittee on Investigations StaffReport, June 25, 2007.
Friedman, Milton. “The Case for Flexible Exchange Rates.”Essays in Positive Economics. Chicago: University of ChicagoPress, 1953, pp. 25–42.
Greenspan, Alan. “Currency Reserves and Debt.” In RecentTrends in Reserve Management, World Bank, Washington, D.C.,April 1999.
“HFR Q3 2006 Industry Report.” HFR Industry Report,2006.
“How Giant Bets on Natural Gas Sank Brash Hedge-FundTrader.” Wall Street Journal (September 19, 2006).
“How the Wreck from Amaranth was Contained.” Wall StreetJournal (October 5, 2006).
John Maynard Keynes. The General Theory of Employment, Interestand Money, 1st ed. London: Macmillan, 1936.
“J.P. Morgan, Citadel Acquire Amaranth’s Energy Portfolio.”Wall Street Journal (September 21, 2006).
Leissing, Matthew. “Nymex told Amaranth in August to CutRisky Trades, People Say.” Bloomberg News, September 27,2006.
Levin, Carl. “To Amend the Commodity Exchange Act toclose the Enron loophole, prevent price manipulation and exces-sive speculation in the trading of energy commodities and forother purposes.” Bill S. 2058, September 17, 2007.
Maounis, Nick. “Investor Conference Call.” Amaranth Group,Inc., September 22, 2006.
Till, Hilary. “EDHEC Comments on the Amaranth Case: EarlyLessons from the Debacle.” EDHEC Working paper, 2006.
“What Went Wrong at Amaranth.” Wall Street Journal (Sep-tember 20, 2006).
To order reprints of this article, please contact Dewey Palmieri [email protected] or 212-224-3675
104 THE AMARANTH DEBACLE: A FAILURE OF RISK MEASURES OR A FAILURE OF RISK MANAGEMENT? WINTER 2007
Copyright © 2007