the amazon effect us housewares industry
TRANSCRIPT
“The Amazon Effect” series breaks down specific product groups,
compares Amazon’s performance in that category to total retail sales
(online and offline) and considers the effect Amazon has on that specific
industry as a whole. We've already explored the effect Amazon is having
on the Toys industry and the Grocery industry; in this latest edition, we
explore how Amazon has impacted the U.S. Housewares market.
Housewares: The Amazon EffectBy Nathan Rigby, VP Sales & Marketing at One Click Retail
Earlier this month, Amazon announced Q4 2016 revenues of $43.7
billion, capping off a year where Amazon was responsible for 43% of
the total U.S. ecommerce revenue and 53% of the country's YoY
ecommerce growth. The Housewares product group proved to be one
of the main drivers of Amazon's success, accounting for 15% of the
company's YoY sales growth in 2016.
Amazon Q4 2016
Housewares, including Home and Kitchen, generated almost $7
billion in sales for Amazon in 2016, a significant increase over 2015's
plus $5 billion. The majority of those sales can be accounted for by
the Home product group, which generating approximately 60% of
2016 sales, and with the Kitchen group making up the remaining
40%. But how do these figures stack up to the whole of the U.S.
Housewares market? Let's take a look.
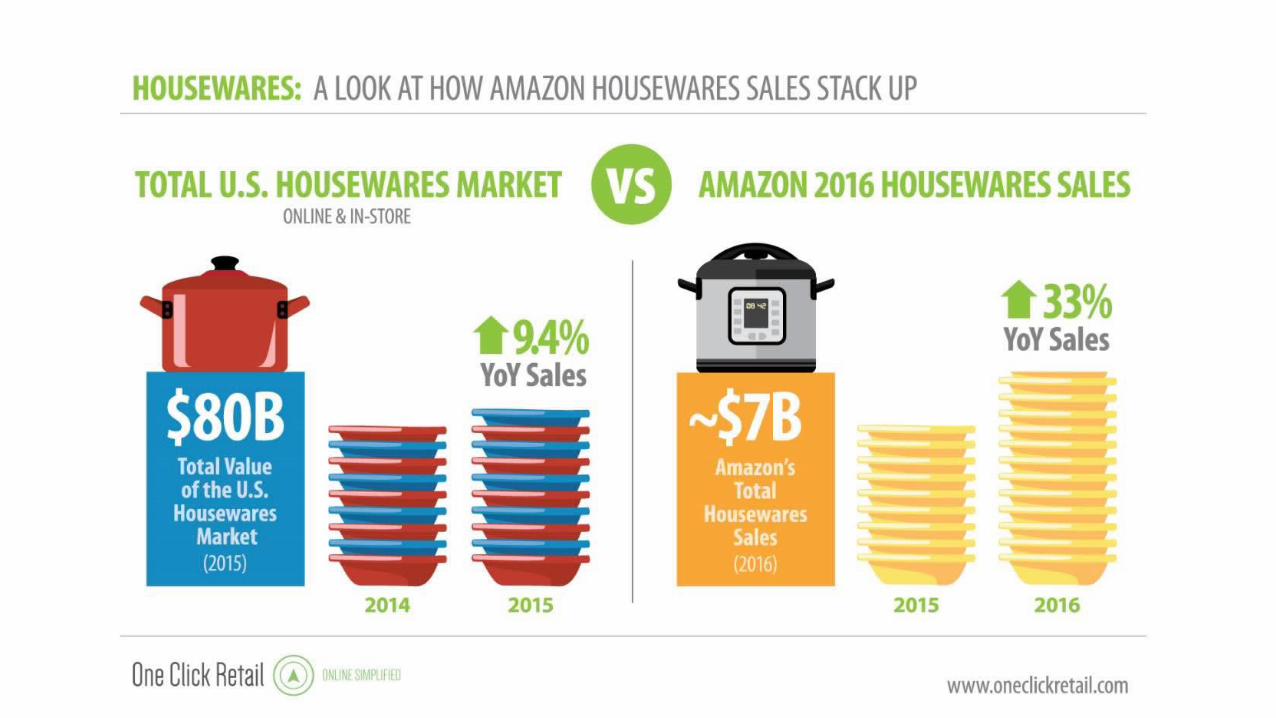
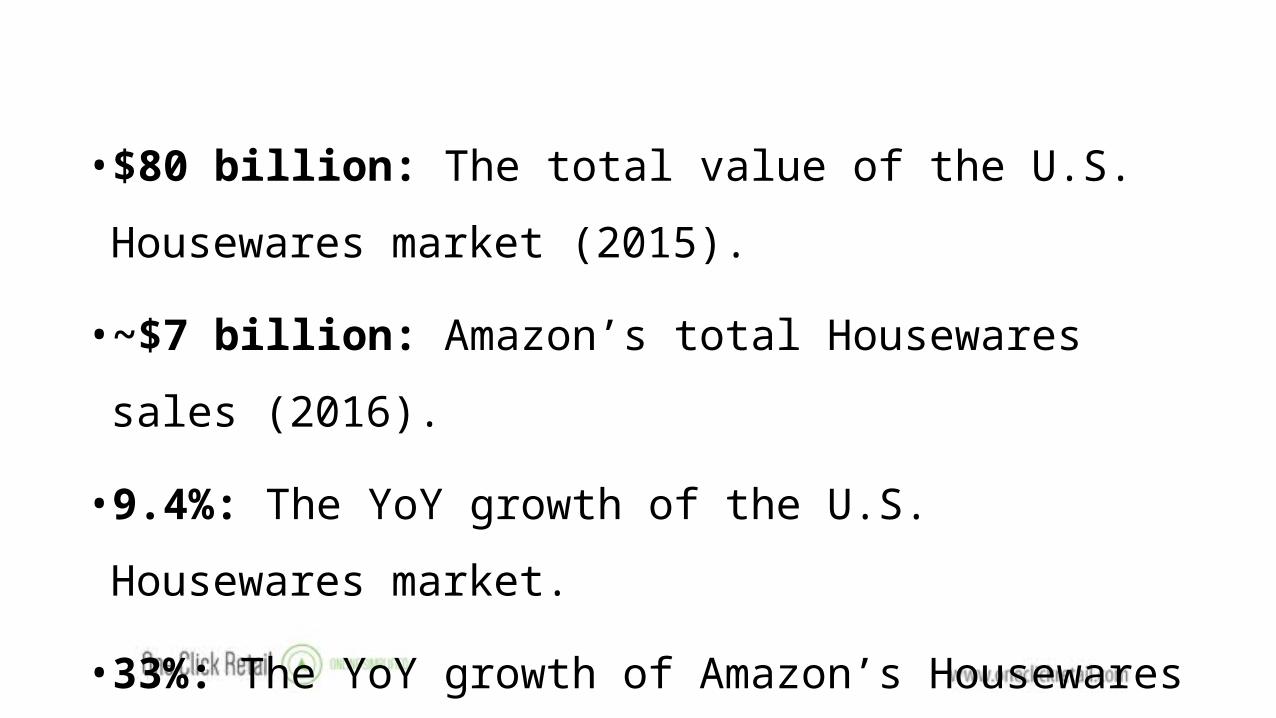
• $80 billion: The total value of the U.S. Housewares market
(2015).
• ~$7 billion: Amazon’s total Housewares sales (2016).
• 9.4%: The YoY growth of the U.S. Housewares market.
• 33%: The YoY growth of Amazon’s Housewares sales.
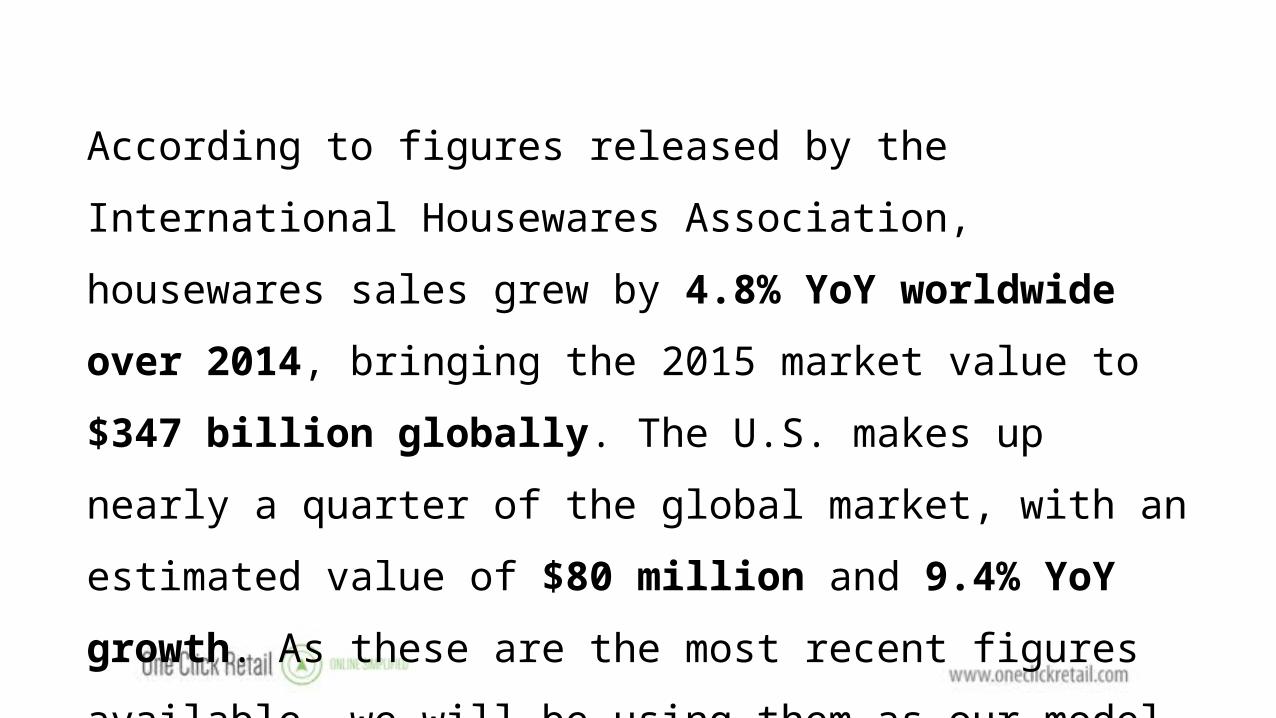
According to figures released by the International Housewares
Association, housewares sales grew by 4.8% YoY worldwide over
2014, bringing the 2015 market value to $347 billion globally. The
U.S. makes up nearly a quarter of the global market, with an
estimated value of $80 million and 9.4% YoY growth. As these are
the most recent figures available, we will be using them as our
model to compare to Amazon’s performance.
Based on these figures, Amazon’s share of the entire U.S. domestic
housewares market has climbed to 8.5%. This is a surprising fact for some, as
Amazon has not been often associated with housewares and as the Home and
Kitchen product groups are not commonly considered “eCommerce friendly.”
Housewares products tend to be large, heavy and/or awkwardly-shaped and
therefore are often challenging or expensive to ship. This just goes to show
what our Amazon Effect series has consistently proven: Amazon’s ability to
successfully compete with traditional retail across all product groups.
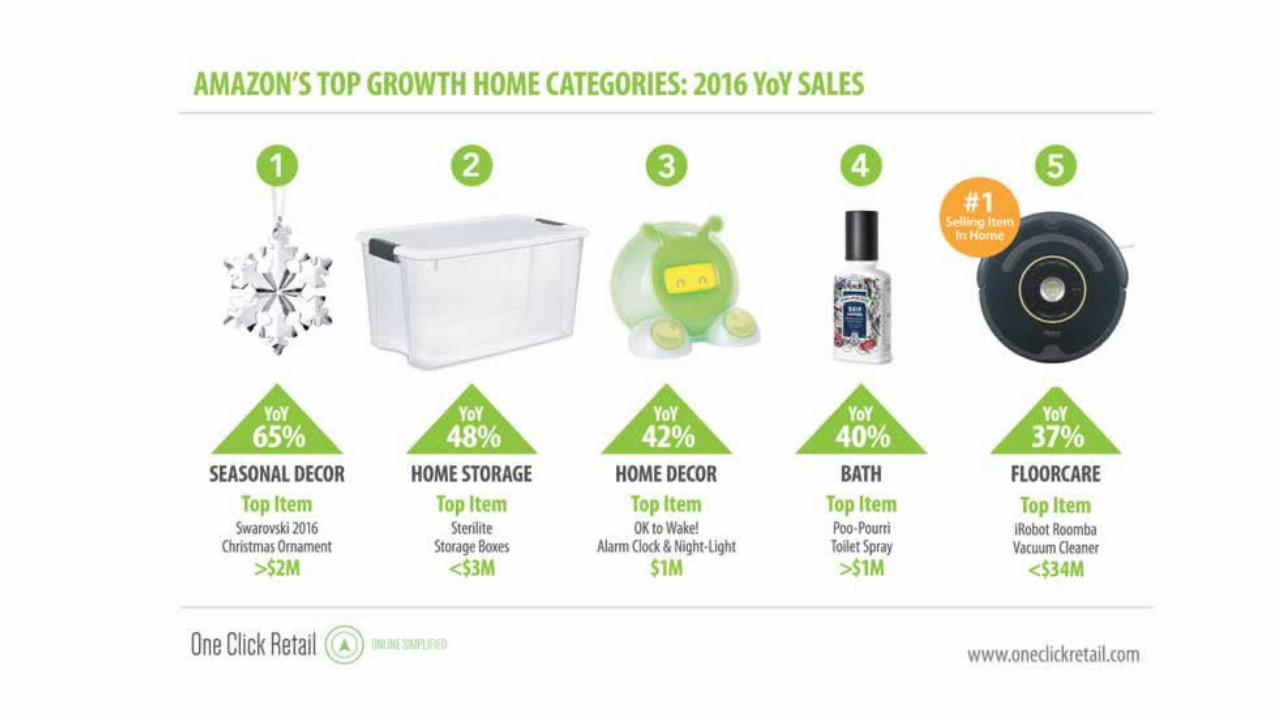
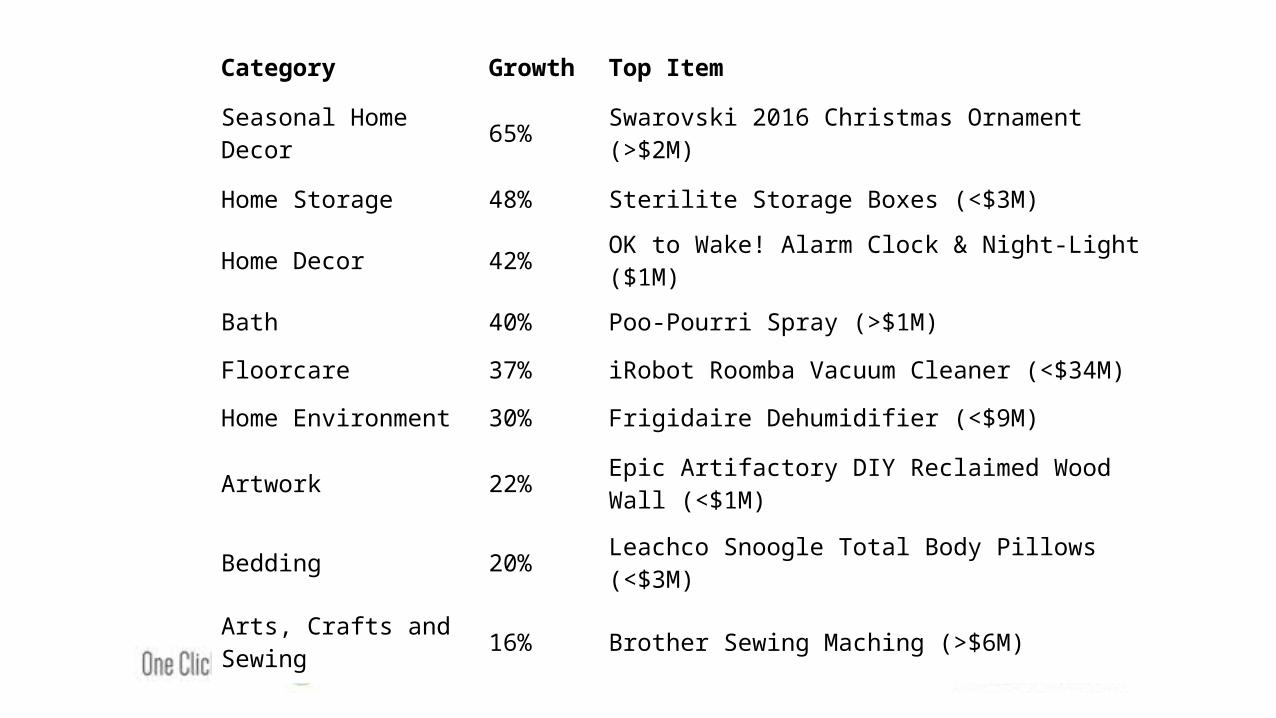
Category Growth Top Item
Seasonal Home Decor 65% Swarovski 2016 Christmas Ornament (>$2M)
Home Storage 48% Sterilite Storage Boxes (<$3M)
Home Decor 42% OK to Wake! Alarm Clock & Night-Light ($1M)
Bath 40% Poo-Pourri Spray (>$1M)
Floorcare 37% iRobot Roomba Vacuum Cleaner (<$34M)
Home Environment 30% Frigidaire Dehumidifier (<$9M)
Artwork 22% Epic Artifactory DIY Reclaimed Wood Wall (<$1M)
Bedding 20% Leachco Snoogle Total Body Pillows (<$3M)
Arts, Crafts and Sewing 16% Brother Sewing Maching (>$6M)
The biggest growth driver in the Home product group is an
example of one of the biggest trends in 2017: robotics. The
iRobot Roomba Vacuum Cleaner generated just under $34
million in sales in 2016, driving the bulk of the growth in this
category.
Growth Drivers
In another continuing trend, more and more consumers are opting
to buy mid-size appliances online, such as the Frigidaire
Dehumidifier (close to $9 million in sales) and the Brother Sewing
Machine (almost $7 million in sales). Even though high shipping
costs for these larger and heavier items might be considered a
deterrent, many consumers have decided that the expense is worth
the ease of having them delivered right to their door.
Growth Drivers
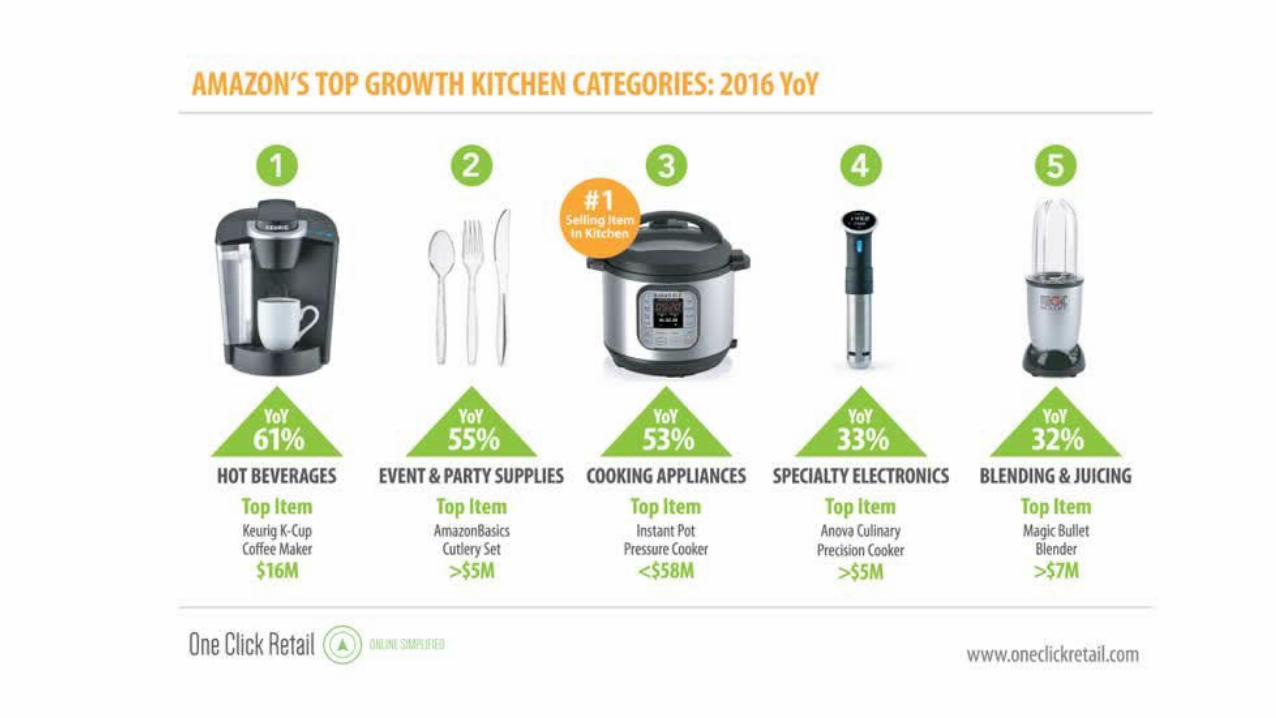
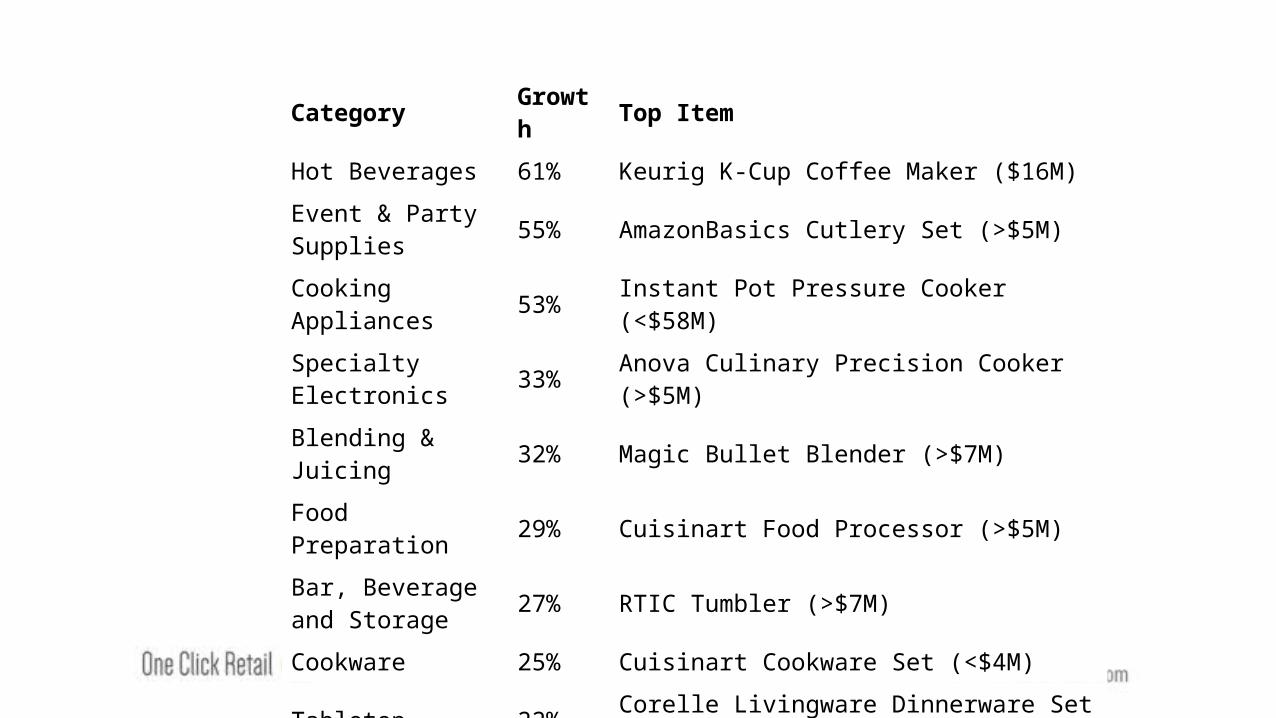
Category Growth Top ItemHot Beverages 61% Keurig K-Cup Coffee Maker ($16M)
Event & Party Supplies 55% AmazonBasics Cutlery Set (>$5M)
Cooking Appliances 53% Instant Pot Pressure Cooker (<$58M)Specialty Electronics 33% Anova Culinary Precision Cooker (>$5M)Blending & Juicing 32% Magic Bullet Blender (>$7M)Food Preparation 29% Cuisinart Food Processor (>$5M)
Bar, Beverage and Storage 27% RTIC Tumbler (>$7M)
Cookware 25% Cuisinart Cookware Set (<$4M)Tabletop 22% Corelle Livingware Dinnerware Set (<$1M)Cutlery 18% Chicago Cutlery Knife Block Set (<$3M)Bakeware 17% Nordic Ware Baker’s Half Sheet (>$1M)Cook’s Tools 11% Ozeri Pronto Digital Food Scale ($3 MM)
Today’s fast-paced culture has created a widespread consumer desire for
products that address time-saving solutions. With the average American
spending 1.1 hours per day on household activities, it is no wonder the self-
operating iRobot Roomba Vacuum Cleaner has witnessed significant growth
this year. Many of the growth drivers in the Kitchen product group are big
time-savers as well, such as the Instant Pot Pressure Cooker (almost $58
million in sales) and the Keurig K-Cup Coffee Maker ($16 million in sales).
Growth Drivers
With less time needed for housework, consumers can spend
more time entertaining guests and enjoying dinner with
family. We see this with growth drivers such as a dinnerware
set, a tumbler, and Amazon’s own private label Cutlery Set
(just over $5 million in sales), which reveal a growing trend of
sales in the Kitchen entertaining group.
Growth Drivers
Amazon’s growth rate in Housewares is three and a half times that of the total
U.S. domestic market. Much of this growth can be credited to Millennials, who
spend more than twice as much as other demographics when buying
housewares online. As more members of this influential and eCommerce-
embracing generation enter homeownership, traditional retailers who still view
online and offline as two separate channels will see sales dwindle as those who
have invested in this demographic, such as Amazon, succeed.
Key Findings
With 98% accuracy, OCR delivers the industry’s most accurate sales data to their brand
manufacturer clients selling on the world’s top eCommerce platforms. To get a glimpse of the
unique insights One Click Retail provides its customers, be sure to follow our weekly blog at
www.oneclickretail.com/insights, and following us on Twitter and LinkedIn.
One Click Retail (OCR) is a market leader in eCommerce data measurement, sales analytics and search optimization for brand manufacturers in North America, Europe and Asia. Thanks to our proprietary sales calculations that are 98.5% accurate down to the SKU level, OCR’s accuracy is unrivaled in the marketplace. The OCR Product Suite provides 1st and 3rd party business intelligence across the 30 largest retailers such as Amazon, Walmart, Target, Staples and Home Depot. The world’s top brands, such as Procter & Gamble, Panasonic, Nestle, Hamilton Beach and HP, rely on OCR insights to drive sales and profitability across eCommerce.
Founded in 2013 by eCommerce experts from Amazon, Walmart, Target, Overstock and other leading retailers, OCR was acquired in 2016 by Ascential plc (LSE: ASCL.L), a UK-based international B2B media company with a focused portfolio of market-leading events and information services products.
To learn more about how OCR can provide your brand with the competitive edge in today’s ecommerce marketplace, visit www.oneclickretail.com.
About One Click Retail