the american scenescape: amenities, scenes and the...
TRANSCRIPT

The American scenescape: amenities, scenes and thequalities of local life
Daniel Silver
Department of Sociology, The University of Toronto, 725 Spadina Avenue, Toronto, OntarioM5S 2J4, Canada, [email protected]
Received on August 31, 2010; accepted on August 17, 2011
This paper outlines a new approach to measuring local quality of place. It uses a nationaldatabase of some 500 types of local amenities to measure the local ‘scene’ in every US zipcode. It provides a brief tour through the American ‘scenescape’ at the national, regional,urban and neighbourhood levels by outlining variations in types of amenities and the valuesthey support, such as tradition, self-expression, transgression or local authenticity. And itshows that scenes with a strong self-expressive dimension promote growth and innovationwhile enhancing the economic impacts of technology clusters.
Keywords: amenities, scenes, innovation, quality of place
JEL Classifications: O2, O3, O4, R12
Introduction
With their 2009 ‘Report on the Measurement of
Economic Performance and Social Progress’,
Joseph Stiglitz, Amartya Sen and Jean-Paul
Fitoussi articulated a set of ideas in a prominent
political and policy context that had been gaining
momentum within the academic social science con-
text for some time. This is the notion that standard
measures of gross domestic product leave out im-
portant dimensions of experience that shape citi-
zens’ productivity, well-being and standards of
living, such as health, social connections, cultural
opportunities, political voice, personal security, ed-
ucation, household consumption and environmen-
tal sustainability. Stiglitz et al. (2009) and others
(such as Helliwell, 2003) have made the case for
revised production measures to be supplemented by
indicators of these other dimensions. Di Tella and
MacCulloch (2008) and Diener (2006) among
others have argued for measures such as gross
national happiness.
Though Stiglitz, Sen and Fitoussi (Stiglitz et al.
2009) stress the limitations of nationally aggregated
measures, the vast bulk of research into alterna-
tives, including their own, has been cross-national.
Mellander et al. (2010) summarize much of this
research and conclude, ‘‘Most of the research that
has anything to say about place and well-being has
focused on national differences’’. The dominant
approach has been to assess the impact of national
income on some nationally aggregated measure of
happiness (or ‘subjective well-being’) relative to
other factors, such as post-industrial values, health,
social capital or democratic politics. This leaves out
local and regional differences, which can be
� The Author 2011. Published by Oxford University Press on behalf of the Cambridge Political Economy Society. All rights reserved.For permissions, please email: [email protected]
Cambridge Journal of Regions, Economy and Society 2012, 5, 97–114
doi:10.1093/cjres/rsr028
Advance Access publication 28 September 2011
by guest on February 27, 2016http://cjres.oxfordjournals.org/
Dow
nloaded from

dramatic, making it impossible to investigate how
these differences influence domestic migration and
urban development patterns.
This paper reports on ongoing work to develop
a new perspective on how to conceptualize and
measure (some of the) variation in local qualities
of places at the neighbourhood, urban, regional and
national levels. To do so, it uses a national database
of local amenities that covers over 40,000 US zip
codes and includes over 500 types of amenities,
such as parks, art galleries, beauty shops, churches,
boutiques, ice cream stores and operas. The partic-
ular constellation of amenities in a place is treated
as indicating the local ‘scene’ or the specific aes-
thetic of a place. Quality of place, on this approach,
has much to do with this aesthetic, which defines
a place as for instance an opportunity for cultivating
personal uniqueness, celebrating connections to
friends and family or shining out glamourously. These
cultural themes and their underlying patterns of ame-
nities vary substantially across and even within cities
and regions. And these variations, as we will see,
have significant consequences for economic
growth patterns and population changes. What
emerges is an original approach to assessing and
measuring the qualitative and cultural character of
places and a set of conceptual tools that can be ap-
plied in a number of contexts.
The discussion proceeds in three major sections.
The first presents a highly compressed outline of the
‘scenes perspective’ on local quality of place. The
second provides a descriptive ‘tour’ of the American
scenescape, moving first down from national to re-
gional to urban to neighbourhood variations in
amenities and then moving back up from local to
national variations in the types of cultural attrac-
tiveness expressed by these amenities. The third
presents results of national and context-specific
regressions analysing the associations of amenities
and scenes with various measures of economic
growth and population change, controlling for core
urban development variables and covering all US
zip codes. While much of the research cited above
examines the impact of economic factors on sub-
jective well-being, this essay reverses the equation
and shows that non-economic dimensions of
experience influence economic ones such as pro-
ductivity, innovation and talent attraction.
The scenes perspective: a (very) briefintroduction
The scenes perspective
Particular mixes of amenities are often taken to indicate
the character of the local scene (Clark, 2004; Currid,
2007; Florida, 2008). Consider a place full of boutiques,
rare and second-hand book and music stores, improv
comedy houses, jazz clubs, fusion restaurants and po-
etry slam venues. Here is a scene that says ‘express
yourself!’, urging a unique outlook on existence as
a way of life. Now consider instead a scene filled with
local pubs, family diners, parks and playgrounds, com-
munity recreation centres and pizza parlours. The
ambiance here is different, suggesting neighbourly
warmth, mutual support and local connections. A
place replete with designer clothing outlets,
fashion houses, film festival venues, high-end
jewellers, fine art galleries and nightclubs paints
a different scene. Now glamour is in the air, with
shimmering scenes of beauty and grace.
Translating such intuitions about the qualitative
and cultural aspects of urban life into social science
is difficult, as is assessing the significance of varia-
tions in such expressive qualities to urban and re-
gional development. Yet, if we wish to expand our
insight into elements of regional well-being beyond
income or education, then developing methods for
comparing and measuring the extent to which pla-
ces cultivate distinct styles of life is vital. For these,
define what it means for a region to actively pro-
mote a sense of ‘being well’ and ‘living right’.
The scenes perspective was developed in order to
meet this challenge. It encourages us to characterize
places not in terms of any single item (operas, juice
bars, parks, bike paths etc.) but holistically, in terms
of the total scene created by its ongoing activities
and practices. Building on much recent work on the
cultural dimension of place (summarized in Kaufman
and Keliner 2011), the scenes perspective formu-
lates an expressive approach to comparing places
according to what they ‘say’ or ‘mean’ when
Silver
98
by guest on February 27, 2016http://cjres.oxfordjournals.org/
Dow
nloaded from

considered aesthetically, as containing amenities
for consumers in addition to firms for workers
and homes for residents.
How do we distinguish one scene from another?
Richness of meaning needs to be respected and pre-
served. We also need to rise above the single case
and compare multiple scenes, looking for what they
share and how they differ, isolating recurrent pat-
terns and significant outliers. To do so, an analytical
scheme can be helpful. We can use such a scheme
to compare places on single dimensions of sym-
bolic meaning, asking for instance whether one
place contains a scene that more strongly affirms
individual self-expression than does another. We
can investigate combinations of dimensions, look-
ing for places that, for example, join the value of
self-expression with that of glamour and neighbour-
liness. And we can then study the patterns and con-
sequences of different scene complexes in a more
systematic and comparative way.
Table 1 summarizes a paradigm for evaluating the
range of meanings that can differentiate one scene
from another. Without claiming theoretical com-
pleteness, this matrix offers significant analytic util-
ity for comparative analysis of places’ styles of life.
This schema draws on and synthesizes a large
and growing body of work on urban cultural expe-
rience in urban planning, geography and sociology
(summarized in Silver et al., 2010). Rather than
making any single dimension such as exhibitionism
or transgression the UrScene of EveryScene, this
theory of scenes proposes a multi-dimensional ap-
proach that joins elements of scenes discerned in
these and other case studies into a single compara-
tive framework.
The scenes perspective suggests that scenes may
be usefully distinguished by their specific types
of theatricality, authenticity and legitimacy. Theat-
ricality has been highlighted in much recent work,
in particular in the writings of authors like Alan
Blum (2003), Elizabeth Currid (2007) and Charles
Taylor (2007). ‘Theatricality’ here refers to, as
Taylor puts it, the styles of mutual self-display val-
ued or resisted in a scene, for instance, performing
glamourously, transgressively or in a neighbourly
way. Authenticity has been equally significant in
recent, mostly ethnographic, discussions, especially
in the work of authors like David Grazian (2003),
Sharon Zukin (2009), Richard Lloyd (2006), Japonica
Brown-Saracino (2009) and again Charles Taylor
Table 1. Symbolic dimensions of scenes.
Theatricality: styles of appearance supported or attacked by a scene
Glamourous Standing on the red carpet at Cannes gazing at the stars going by
Formal Going to the opera in a gown or white tie and tails
Transgressive Watching a performance artist pierce his skin
Neighbourly Attending a performance by the community orchestra
Exhibitionistic Watching weightlifters at Muscle Beach
Authenticity: sources of genuine identity supported or attacked by a scene
Local Savouring local fruit and meat at a farmers’ market
Ethnic Recognizing the twang of Appalachia in the Stanley Brothers’ Voices
Corporate Enjoying the real thing that is Coke or prizing Gucci bags over knock-offs
State Visiting the Gettysburg Battlefield or the White House
Rational Celebrating the power of human reason at a planetarium or before a university
library or laboratory
Legitimacy: bases of moral authority supported or attacked by a scene
Traditional Hearing Mozart performed in the Vienna State Opera or church bells
call one to worship
Utilitarian Savouring the value of efficient production at a museum of industry
Egalitarian Enjoying the democratic implications of a crafts fair or fair trade coffee
Self-expressive Hearing a jazz musician improvise a solo
Charismatic Crowding to be near Michael Jordan
The American scenescape
99
by guest on February 27, 2016http://cjres.oxfordjournals.org/
Dow
nloaded from

(2007). ‘Authenticity’ refers to what is valourized
as real rather than phony, such as the authenticity
conferred by local customs, ethnic heritage or even
a corporate brand. Legitimacy is a classic topic
from Weber to Bellah, recently joined more closely
with urban studies by research into ‘ethical con-
sumption’ practices (such as fair trade fairs, cf.
Barnett et al. 2005) as well as specific studies of
restaurant (Johnston and Baumann 2007) and
straightedge scenes (Haenfler 2004). ‘Legitimacy’
in the scenes perspective refers to the moral bases of
authority projected by a scene—for instance, one’s
own self, a charismatic leader, all of humanity
equally, utility calculations or a tradition.
According to the theory, all scenes promote
a sense of theatricality, authenticity and legitimacy
in some form, just as all fruit has some form of taste,
colour and texture. But there are many variations on
these themes (just as some fruits are sweet, red and
firm). The glamour of fashion shows and film fes-
tivals differs from the neighbourliness of commu-
nity gardens and neighbourhood diners. The self-
expressiveness of improv comedy and Do It Your-
self music venues differs from the traditionalism of
Catholic churches and historical monuments. The
localism of corner pubs and microbreweries differs
from the corporateness of Gucci outlets and flash-
ing Coca Cola signs. Each category is thus further
specified by subtypes of legitimacy, theatricality or
authenticity, as shown in Table 1. These have
proved useful in multiple research contexts, though
some settings highlight some more than others or
may require additions. Each dimension may be
affirmed or denied: resistance to corporate authen-
ticity or destruction of tradition gives certain scenes
their meaning.
Variations in scenes can be identified by deter-
mining how sets of amenities indicate specific types
of theatricality, authenticity and legitimacy, though
may other empirical indictors are possible. A given
scene may contain amenities that promote a sense
of self-expression, transgression, locality, anti-ra-
tionalism and anti-corporateness—this combination
we could call a ‘bohemian scene’. Another one might
promote neighbourliness, tradition and locality—a
more ‘communitarian scene’. Other complexes are
possible, and any set of indicators may be ‘trans-
lated’ into a complex of symbolic meanings via
this matrix. Operationally, this means coding them
in terms of the extent to which they affirm, reject or
are neutral with respect to these dimensions, as dis-
cussed below.
A national database of local amenities
This paper reports on work that uses a US national
database of amenities to measure scenes. The data-
base is comprised primarily of two sources. First is
the US Census’ zip code Business Patterns from
2001 (BIZZIP), which utilizes the North American
Industry Classification System. The census pro-
vides surprisingly useful data on both commercial
and non-commercial activities—for example, within
the category of arts, entertainment and recreation,
it differentiates between theatre companies and mu-
sical groups; between promoters of performing arts,
museums and independent artists and between fit-
ness centres and sports teams. It also includes hu-
man rights organizations, restaurants and churches.
BIZZIP is useful in that it represents the population
of amenities, not just a sample, and results from an
official accounting. Moreover, it is available at the
zip code level, a highly detailed unit of analysis.1
Yet, BIZZIP obviously has limits. Most of the
information it provides concerns more formal
organizations and is classified from an industrial
rather than a consumption perspective. And while
information about the number of restaurants, music
clubs or churches in an area is useful, this leaves out
crucial questions of what kinds of religious prac-
tice, cuisine or musical style are available. For
a greater level of differentiation, hundreds of cate-
gories from online yellow pages (YP) sources were
downloaded.2 These provide a much higher degree
of specificity, both in terms of category (Chinese
restaurants are differentiated from Mongolian res-
taurants, Catholic churches from Baptist churches,
tattoo parlours from parks and playgrounds etc.)
and in terms of geography (data are available at
the street address level, although here zip code is
the basic unit of analysis). However, the YP also
have their limits. Unlike BIZZIP, YP data are not
collected with completeness as a necessary goal and
Silver
100
by guest on February 27, 2016http://cjres.oxfordjournals.org/
Dow
nloaded from

are therefore more likely to leave some listings out,
either by accident or by design (by not listing busi-
nesses that do not have a business phone etc.).3 De-
spite these limitations, both sources provide maximal
coverage, relatively high levels of differentiation
and some standardized classification scheme.
Building measures of scenes
Though not perfect, these seem to be the best sour-
ces available for extensive research into scenes. In
order to use them as a basis for investigating scenes,
they were translated into the theory of scenes out-
lined above. Teams of coders scored all amenities
on a five-point scale, evaluating each of the amenity
categories on the basis of the extent to which its
typical practices affirm, reject or are neutral with
respect to each of the 15 dimensions of scenes.4
Referred to here as the ‘performance score’, an
average score for each of the 15 dimensions across
all the amenities in each zip code was computed.5
Analyses typically employ a normalized version of
this measure based on its z score, where the mean
value across all zip codes is subtracted and the re-
sult divided by the standard deviation. This score
indicates the average degree to which the set of
amenities in a zip code feature each of the types
of theatricality, authenticity and legitimacy. For in-
stance, the average zip code BIZZIP amenity mix in
Los Angeles (LA), Chicago and New York has a zscore on transgression of, respectively, 0.48, 0.20
and 0.45; tradition of �0.44, �0.31 and �0.42 and
on localism of �0.30, �0.23 and �0.18. No doubt
there are limits to these measures and data, but they
yield much face validity and significant construct
validity across a number of contexts (Navarro, 2010;
Silver et al., 2010), as well as surprisingly strong
results in multivariate analysis. They provide the
most powerful resource to date for extensive analysis
of USA as a ‘scenescape’ defined by the qualities of
life affirmed or denied by a place.
The American scenscape: a snapshotand brief tour
Since the scenes approach is new and unconven-
tional, we do not begin directly with the scenes
dimensions outlined in Table 1 but instead slowly
build up to them. We first chart distributions of
amenities at national, regional, urban and neigh-
bourhood levels before moving back ‘up the ladder’
through variations in the strength and correlations
of some of the scenes dimensions.
National variation in amenities
Table 2 summarizes the 25 most numerous types of
amenities contained in the US database.
Even at this level of generality, distinctive
aspects of the symbolic meanings embedded in
daily experience emerge. Food, god, health, the
law, the family and the community dominate the
list. Typical American experience is saturated with
spaces for shared food consumption, personal care
and self-presentation, worship, tending one’s gar-
den and serving one’s community. It is also full of
Table 2. The 25 most numerous amenities in the USA.
Rank Amenity Total
1 Full-service restaurants 193,262
2 Offices of lawyers 167,852
3 Religious organizations 165,984
4 Landscaping services 72,504
5 Beauty salons 71,944
6 Grocery (except convenience) 68,797
7 Child day care services 67,117
8 Pizza restaurants 57,380
9 Sports and recreation facilities 55,852
10 Auto dealers 54,822
11 Hospitals 53,656
12 Jewellers 51,376
13 Hotels 45,972
14 Custom computer programming 43,557
15 Pharmacies and drug stores 40,026
16 Bakeries retail 39,202
17 Fast food restaurants 34,672
18 Gift, novelty and souvenir stores 33,678
19 Civic and social organizations 31,711
20 Convenience stores 30,560
21 Furniture stores 29,920
22 Antique dealers 29,185
23 Beer, wine and liquor stores 28,695
24 Bookstores 26,322
25 Health clubs and gyms 25,696
Note: This table combines both YP and US Census sources.
The American scenescape
101
by guest on February 27, 2016http://cjres.oxfordjournals.org/
Dow
nloaded from

lawyers, expressing the formality and litigiousness
associated with the impersonal, egalitarian rule of
law. There are more civic and social organizations
in the USA than beer and liquor stores, confirming
once again Tocqueville’s observations about how
participatory, voluntaristic and localistic the typical
American scene is. The strong strands of individu-
alism, moralism and civic activism that Bellah et al.
(1996) noted in Habits of the Heart are present in
the national scenescape as well. As we will see
below, the self-expressive dimension emerges more
strongly at lower levels of aggregation.6
Regional variation in amenities
These national data begin to show how much in-
formation about amenities and cultural scenes can
be derived from seemingly non-cultural sources of
data such as the census of businesses or the YP.
Yet, the distribution of amenities varies consider-
ably by US regions (cf. Elazar, 1975), illustrated in
Table 3. This table shows the 10 most numerous
types of amenities listed in the YP within the South,
West, Midwest and Northeast (regions are specified
according to the US Census definitions).7
These rankings reveal strong regional differences
in the qualities of place typical of each region. First,
consider religion. In the South and Midwest, differ-
ent types of churches account for 6 of the top 25
most numerous amenities (4 of the top 10 in the
Midwest), while in the West and Northeast, they
account for just 3 of the top 25 and none of the
top 10. In the West and Northeast, there are more
bakeries, art galleries, cafes and coffee shops and
health clubs than any type of church. The availabil-
ity of artistic amenities also varies tremendously by
region. Western states contain a full 1.3 art galleries
per zip code, over double the number in the Mid-
west and South. Residents of these regions have
access to strikingly different experiences that shape
the defining qualities of day-to-day life.
These differences do not mean, however, that the
scenes of the different regions are oppositional.
There is considerable overlap. Fast food restaurants
are in the top five across all regions and in the top
two everywhere except for the denser Northeast.
Despite their differences in religion, both the West
and the South have large numbers of equestrian
centres and Mexican restaurants, while these ame-
nities are not in the top 25 in the Northeast and
Midwest. The South, West and Northeast all share
a taste for jewellery, which is in the top five for all
three (the Midwest is more reserved and less glam-
ourous: jewellers are 11th, outranked by pizza res-
taurants, bar and grill restaurants and Lutheran
churches). Nor does the strong religious orienta-
tion characteristic of the top Southern amenities
mean that Southerners do not have fun after dark.
In fact, there are more nightclubs per zip code in
the South than in any of the other regions. Quality
of place is complex and multi-dimensional.
Table 3. Top 10 YP amenities by region (mean quantity of amenities per zip code by region).
Rank South West Midwest Northeast
1 Baptist churches (2.80) Fast food restaurants (2.57) Fast food restaurants (1.96) Pizza restaurants (2.58)
2 Fast food restaurants (2.35) Cafes and coffee houses (2.3) Pizza restaurants (1.81) Jewellers (1.95)
3 New car dealers (1.62) Jewellers (2.13) Hospitals (1.61) Bakeries (1.85)
4 Hospitals (1.51) Pizza restaurants (1.84) Baptist churches (1.53) New car dealers (1.84)
5 Jewellers (1.38) New car dealers (1.75) New car dealers (1.39) Fast food restaurants (1.79)
6 Pizza restaurants (1.33) Bakeries (1.58) Bar and grill restaurants (1.35) Delis (1.43)
7 Methodist churches (1.25) Hospitals (1.41) Lutheran churches (1.16) Hospitals (1.42)
8 Bakeries (1.01) Commercial artists (1.33) Catholic churches (1.03) Antique dealers (1.29)
9 Cemeteries (0.89) Art galleries and dealers (1.30) Methodist churches (0.94) Health clubs (1.02)
10 Automobile customizing (0.76) Book stores (1.25) Bakeries (0.90) Cafes and coffee houses (1.01)
Note: regions are defined according to US Census definitions.
Silver
102
by guest on February 27, 2016http://cjres.oxfordjournals.org/
Dow
nloaded from
Urban variation in amenities
One of the founding principles of urban sociology
is that there is a distinctive form of urban experi-
ence (Simmel, 1971), what Louis Wirth called ‘ur-
banism as a way of life’ (Wirth, 2004). Major cities
often have more in common with one another than
they do with smaller cities and rural areas in their
geographic regions, and the forms of well-being
and quality of life they promote may be similar as
well. This idea should not be taken too far: Chicago
urbanism, as Edward Glaeser (2011) suggests, likely
contains more ‘Midwestern’ qualities than do New
York and LA and downtown Houston contains
many ‘Texan’ aspects absent in the other three.
To highlight how studying amenities illuminates
both the commonalities and the differences in the
qualitative character of urban experience, we now
focus on the three most populous American cit-
ies—New York, LA and Chicago.8
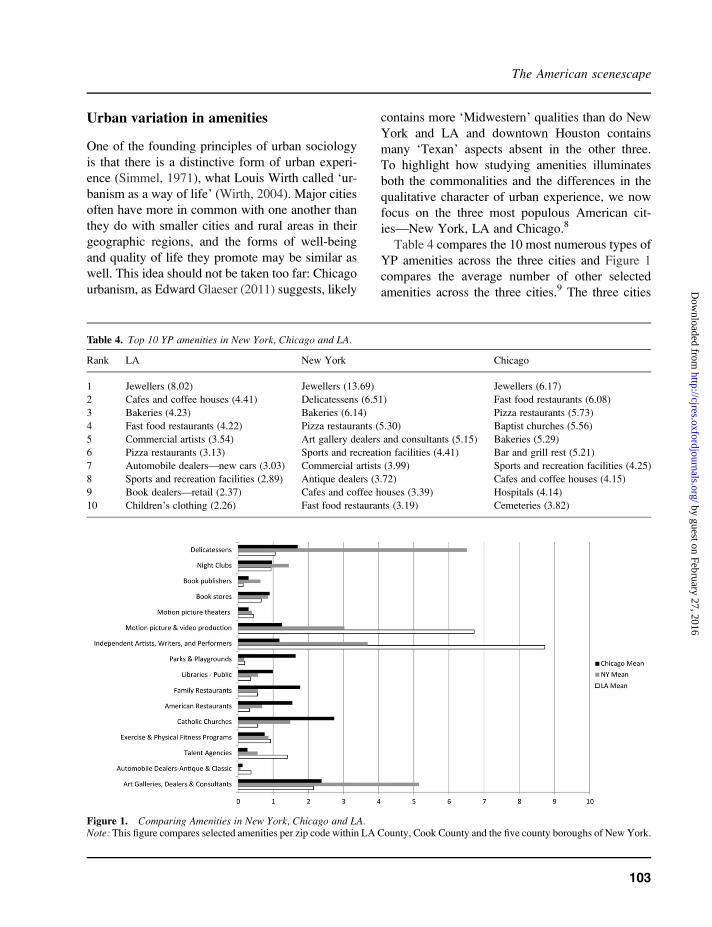
Table 4 compares the 10 most numerous types of
YP amenities across the three cities and Figure 1
compares the average number of other selected
amenities across the three cities.9 The three cities
Table 4. Top 10 YP amenities in New York, Chicago and LA.
Rank LA New York Chicago
1 Jewellers (8.02) Jewellers (13.69) Jewellers (6.17)
2 Cafes and coffee houses (4.41) Delicatessens (6.51) Fast food restaurants (6.08)
3 Bakeries (4.23) Bakeries (6.14) Pizza restaurants (5.73)
4 Fast food restaurants (4.22) Pizza restaurants (5.30) Baptist churches (5.56)
5 Commercial artists (3.54) Art gallery dealers and consultants (5.15) Bakeries (5.29)
6 Pizza restaurants (3.13) Sports and recreation facilities (4.41) Bar and grill rest (5.21)
7 Automobile dealers—new cars (3.03) Commercial artists (3.99) Sports and recreation facilities (4.25)
8 Sports and recreation facilities (2.89) Antique dealers (3.72) Cafes and coffee houses (4.15)
9 Book dealers—retail (2.37) Cafes and coffee houses (3.39) Hospitals (4.14)
10 Children’s clothing (2.26) Fast food restaurants (3.19) Cemeteries (3.82)
Figure 1. Comparing Amenities in New York, Chicago and LA.Note: This figure compares selected amenities per zip code within LA County, Cook County and the five county boroughs of New York.
The American scenescape
103
by guest on February 27, 2016http://cjres.oxfordjournals.org/
Dow
nloaded from

do, as one would expect, share many common char-
acteristics. Of the 40 most numerous types of ame-
nities in each city, 27 are shared by all three.
Yet, striking differences also emerge. Jewellers
are ranked first for all, but in New York, there are
considerably more (about 14 per zip code compared
to 8 in LA and 6 in Chicago)—a difference reflect-
ing New York’s strong position in the gem market
but also likely contributing to scenes valourizing
material abundance. In laidback LA, cafes and cof-
fee houses outnumber fast food restaurants, while in
Chicago, the reverse is true. Fast-paced New York
City contains more delis than cafes and coffee
houses. New York has the most publishing houses
and book stores; LA the least. And in New York,
one is highly likely to find a designer clothing store
or fashion designer. Chicago is a distant third on
both counts. Nightclubs abound in New York: 1.5
per zip code, compared to under 1 in LA and Chi-
cago. As do art galleries and dealers: 5.2 per zip
code, compared to roughly 2 in LA and Chicago—
Elizabeth Currid’s ‘Warhol Economy’ of Fashion,
Art and Music incarnate. New York’s amenities
paint glimmering scenes of income, intellectual
and aesthetic sophistication, constant motion and
intense urbanity. These are vital dimensions of
experiences that New York offers to those who live
and work there. But they will not show up in meas-
ures of income or average education levels.
LA’s amenities depict a different scene. Cars are
important. Auto dealers are the seventh most nu-
merous amenity in LA, which has significantly
more classic car dealers than Chicago or New York
does. There are numerous cafes (almost 4.5 per zip
code) for hanging out, as well as many artists (com-
mercial artists are 5th). Indeed, in LA, there are
more independent artists, writers and performers
per zip code than churches! With the 1.5 talent
agencies per zip code (23rd in LA, not in the top
40 in New York or Chicago), aspiring stars are
always on the scene. The 0.43 body art studios
and 0.93 physical fitness programs per zip code
suggest other ways of being noticed. And there
are the movies. LA has the most film studios, but
it also has the most movie theatres of the three. The
LA scenescape is filled with cars, stars, bodies and
cafes, and these amenity mixes help us to measure
and quantify main elements of the city’s distinctive
feel and to take account of that feel in modelling
urban development.
The scene suggested by Chicago’s amenities is
still different. It is first a Midwestern scenescape of
god, country, community and family. Chicago is
filled with churches. Baptist churches are 4th in
Chicago while no church is in the top 10 in New
York or LA. And unlike any other major US city,
Chicago is distinctly Catholic: there are 2.7 Catho-
lic churches per zip code in Chicago (0.6 in LA. and
1.5 in New York). Chicago also contains high con-
centrations relative to New York and LA of family
restaurants, American restaurants, ice cream shops,
bar and grill restaurants, public libraries, cemeteries
and parks. Yet, these scenes are joined by a New
Chicago. Cafes and coffee houses rank 9th, com-
mercial artists rank 13th, health clubs 16th and art
galleries and dealers 17th, and there are more cus-
tom computer programmers per zip code in
Chicago than in either New York or LA. Chicago’s
scenescape combines its Midwest accent on tra-
dition, neighbourliness and local authenticity with
newer amenities more characteristic of what Richard
Lloyd calls ‘neo-bohemia’, where cafe and gallery
culture mix with commerce and technology (Lloyd,
2006). Here is a way both to quantify the distinctive
feel of Chicago—a wholesome and neighbourly
Midwest scene plus a strong knowledge econo-
my—and also a basis for assessing whether the qual-
ity of life it creates contributes to Chicago’s success.
Local variation in amenities
Even if regions and cities offer rich diversity, life is
lived at the street level. Yet, quantitative studies of
amenities and scenes typically report results at the
city or higher level. For instance, Florida’s (2002)
‘bohemian index’ measures artists per capita in
metropolitan areas. But if we move down to zip
codes, we discover more dramatic variations.
One way to highlight the limits of considering
individual amenities without the context of the
scene is to look at one amenity, body art and pierc-
ing studios. Consider the extent to which the scene
surrounding such studios varies. Table 5 compares
Silver
104
by guest on February 27, 2016http://cjres.oxfordjournals.org/
Dow
nloaded from

the top 10 amenities in four of the US zip codes
with the highest total number of body art and pierc-
ing studios nationally.10 The zip code 02118 is in
downtown Boston, in the ethnically diverse, gay
friendly and culturally active South End neighbour-
hood. The zip code 70806 is in downtown Baton
Rouge and includes the historic Capitol Heights
neighbourhood. The zip code 92109 includes San
Diego’s Pacific Beach neighbourhood replete with
surfers, nightlife and singles. The zip code 30338 is
in Dunwoody, Georgia, on the suburban fringes of
Atlanta.
While these four neighbourhoods are national
leaders on the same amenity, the overall scene is
strikingly different in each. We look first at differ-
ences in their surrounding amenities; below more
specifically at how they express different cultural
themes.
� South End, Boston, contains 15 body art and
piercing studios but even more graphic artists,
numerous seafood restaurants, many cafes, an-
tique dealers and fine artists, together with a few
designer clothing stores and nightclubs.
� By contrast, in Capitol Heights, Baton Rouge,
churches surround the body art studios. This
zip code features nearly twice as many Baptist
Churches as body art studios, as well as several
Full Gospel churches, family restaurants and
ice cream parlours. This mix includes not only
the body art studios but also significant num-
bers of tattoo parlours and nightclubs (more
than in South End, Boston) as well as a few
modelling agencies and dance companies.
These are scenes of sin and redemption, night
and day.
� San Diego’s Pacific Beach features fewer arts
amenities than South End and more sports and
recreation centres, tattoo parlours, health clubs,
cafes and nightclubs. It also has numerous fast
food restaurants, many yacht clubs and an array
of amenities from diverse ethnic traditions, like
yoga studios, Mexican restaurants, Italian res-
taurants, Thai restaurants, Indonesian restaurants,
martial arts clubs and Creole restaurants. Here,
we find a strong beach party scene with multiple
ethnically themed amenities together with the
standardized culture of McDonalds and the elite
culture of the yacht club.
� In Atlanta’s Dunwoody, the body art studios are
surrounded by a suburban scene of fast food res-
taurants, gyms, pizza, Italian restaurants, dance
Table 5. Amenity profiles in four zip codes with the most body art and piercing studios in the USA—amenity (total).
South End, Boston 02118 Capitol Heights, Baton Rouge 70806 Pacific Beach, San Diego 92109 Duwoody, Atlanta 30338
Commercial and
graphic artists (17)
Baptist churches (25) Sports and recreation
facilities (23)
Fast food restaurants (13)
Body art and piercing (15) Hospitals (16) Tattoos (19) Body art and piercing (11)
Seafood restaurants (14) Antique dealers (15) Health clubs and gyms (18) Jewellers (7)
Baptist churches (12) Body art and piercing (13) Auto dealers (17) Health clubs and gyms (6)
Pizza restaurants (12) Jewellers (12) Pizza restaurants (17) Sports and recreation
facilities (6)
Bakeries retail (9) Sports and recreation
facilities (8)
Boat and yacht charters, rental
and leasing (14)
Coffee and tea shops (5)
Cafes (8) Bookstores (8) Cigar, cigarette and
tobacco dealers (14)
Methodist churches (5)
Antique dealers (6) Auto dealers (7) Mexican restaurants (13) Dance companies (5)
Fine art artists (6) Health clubs and gyms (7) Bar and grill restaurants (12) Exercise and fitness classes
and instruction (5)
Coffee and tea shops (12)
Fast food restaurants (12)
Note: These are approximately the top 10 amenity types for each zip code. The lists were cut-off at the point where the total zip codesincluding ties came closest to 10.
The American scenescape
105
by guest on February 27, 2016http://cjres.oxfordjournals.org/
Dow
nloaded from

companies and coffee shops—a mix where the
body art seems almost out of place.
These divergent mixes would escape us if we con-
sidered only rankings of the body art studios. Gen-
erally, ranking neighbourhoods on just one or a few
amenities fails to capture the qualitative dimensions
of a place’s characteristic practices and activities.
We need tools more explicitly designed to meet this
challenge. Enter scenes.
From amenities to scenes
Neither national rankings of localities nor atomistic
focus on single amenities capture the lifestyle or
feel of a place. The language above on amenity
mixes and their symbolic meanings hints in a more
holistic direction. To better capture the range of
qualitative experiences embedded in places, we
therefore shift our attention from individual ameni-
ties to the 15 cultural themes outlined in Table 1.
The performance score measures of the 15 di-
mensions summarize the huge amounts of cultural
information from the amenities database into a man-
ageable set of indexes. Consider again the symbolic
meanings attached to those four zip codes with the
most body art and piercing studios.
Figure 2 shows YP performance z scores of se-
lected scenes dimensions—that is, each zip code is
scored relative to the national average (which is 0).
The scenes measures permit intelligible compari-
sons of what would otherwise be a cacophonous
jumble of amenities. For instance, we can see
clearly that these four places promote considerably
more transgressive styles of appearance than does
the typical American scene. But we also see con-
siderable differences among the four:
� Pacific Beach, San Diego, paints the most trans-
gressive overall scene, though it ranked third on
body art and piercing studios. It also has the
lowest egalitarian score and features corporate-
ness and ethnicity the most of the four, mixing
these with informality, exhibitionism and glam-
our to make a kind of ‘entertainment zone’ scene.
� By contrast, while the Capitol Heights, Baton
Rouge, scene also projects transgressiveness,
glamour and exhibitionism, its nearby churches
and other amenities add tradition, formality,
Figure 2. Scenes dimensions at the neighbourhood level.Note: This figure shows z scores of selected performance scores for four zip codes with the most body art and piercing studios in USA.They show the strength of these scenes dimensions in these places relative to the national average (scored 0). The strong differences ineach zip code’s overall scene profile illustrate how no single amenity and no single dimension defines the total scene.
Silver
106
by guest on February 27, 2016http://cjres.oxfordjournals.org/
Dow
nloaded from
neighbourliness, locality and charisma (while
Pacific Beach is a more informal beach scene).
� The Dunwoody, Atlanta, scene scores show how
distinct it is from the others. Its profile is more
mall than beach: it ranks below the national av-
erage on neighbourliness, formality, local au-
thenticity and exhibitionism. Its utilitarian and
corporate style joins with fewer opportunities
for glamour, self-expression and exhibitionism.
� Finally, the South End, Boston, scene has the
highest score on glamour, which, together with
strong levels of self-expression and transgression
and relatively low score on corporateness and
utilitarianism, suggests a more independent and
alternative scene; its low neighbourliness and lo-
calism indicates its more cosmopolitan feel.
To be sure, personal inspections of these scenes
could bring out further details. So could inspecting
the hundreds of individual amenities generating
these scenes performance scores. Yet, considerable
details about their qualitative profiles can still be
gleaned and rapidly summarized with these scene
concepts, measures and data, paving the way for
large-scale comparative analysis of variations in
local styles of life.
Urban variation in scenes
The scene measures also reveal meaning at the met-
ropolitan level. Figure 3 shows z scores of the mean
BIZZIP performance scores of all zip codes within
LA County, Cook County and the five county bor-
oughs of New York. They again show the strength
of these scene dimensions in these cities relative to
the national average (scored 0).
These measures highlight similarities of the
scenes in the three largest metropolitan areas. De-
spite dramatically different geographies, immigrant
groups, political cultures and economic specialties,
the three overall scene profiles are remarkably sim-
ilar, relative to the country as a whole. Compared to
the average US zip code, scenes in these three cities
affirm self-expression and utility over tradition and
egalitarianism. They encourage transgressive,
glamourous and formal styles of mutual display
more than neighbourliness. And they root authen-
ticity in reason, the state and the corporate brand
more than in locality. Urbanism as a way of life
and the ‘metropolitan’ form of existence (Simmel,
1971) continue in the late modern city, as more
abstract, formal, distanced social relations are
linked with heightened individualism and weaker
primordial ties.
The scenes measures also efficiently highlight
striking differences in symbolic meanings expressed
by the three cities’ amenities. For instance, LA
scenes have more self-expression and glamour than
do the other cities; they are also less intellectual.
New York scenes affirm more strongly an identity
based on the power of the intellect and stamp of the
corporate brand; they appeal to efficiency and mate-
rial success and promote formality. Chicago scenes
encourage the greatest levels of neighbourliness and
tradition. Similar demographic patterns are here me-
diated by different cultural settings, which in turn
might well account for divergent economic and po-
litical outcomes that would be otherwise difficult to
capture. Scenes measures help to consolidate and
quantify the cultural character of cities.
Regional variation in scenes
The scenes measures also help to capture key re-
gional cultural differences. The Figure 4 maps
of BIZZIP performance scores illustrate the dif-
ferences.
Scenes in the Northeast and West are more self-
expressive, while those in the South and Midwest
refer more to tradition. Scenes in the South and
Midwest express more neighbourliness, while North-
eastern and especially Western scenes manifest more
transgression.
Relationships between dimensions also vary con-
siderably across the regions. For instance, the more
glamourous scenes in the South are also more likely
to promote tradition than are the glamourous scenes
in the other regions. The correlation between glam-
our and tradition in the South is 0.3 but only 0.01
and 0.06 in the Northeast and West, respectively.
This registers the legacy of the more genteel, fami-
listic and local Southern scenes, where beauty salons
and tailors prepare for Sunday’s best and coming out
The American scenescape
107
by guest on February 27, 2016http://cjres.oxfordjournals.org/
Dow
nloaded from

parties more than media-oriented haute couture and
film openings.
The scenes scores compile the cultural infor-
mation contained in the amenities database into
relatively precise measures of key symbolic dimen-
sions of regions. These all have much face validity
and are consistent with recent urban scholarship.
These data and measures allow us to document and
analyse such patterns systematically.
Do scenes make a difference for localeconomic well-being?
More subtle descriptions of other localities can
enhance the more classic geographic and demo-
graphic descriptive reports that regularly come from
the census and are featured in the media. But the
scenes approach also provides a sharper focus on
many current economic processes than more tradi-
tional economic and demographic indicators can.
To this end, Silver et al. (2011) present detailed
summaries of dozens of regression results, analy-
sing the relationship between many dimensions of
scenes and numerous indictors of economic well-
being in reference to and controlling for a host
of variables, such as education, population, income,
rents, race, cultural industry clusters, commuting
times, weather and more. Since the present essay
is more illustrative, it highlights just a few key results,
suggesting how others may add one or more scenes
variables to analyses on many different topics.
Figure 5 shows standardized regression coeffi-
cients for nine outcomes regressed on self-expressive
scenes: three types of patents; growth in population,
income and employment; change in median rents
and change in college graduate and postgraduate
population. The bars show results for self-expression
within a model that includes a ‘core’ set of control
variables: population, rent, education, crime, party
voting, race, arts industry clusters and the first fac-
tor of a principal components analysis on the 15
dimensions of scenes.11
Self-expression shows significant associations
across a wide range of outcomes. Scenes oriented
towards self-expression are positively associated
Figure 3. Metropolitan variation in scenes.Note: This figure shows z scores of the mean performance scores of all zip codes in LA County, Cook County and the five countyboroughs of New York. They show the strength of these scenes dimensions in these cities relative to the national average (scored 0).
Silver
108
by guest on February 27, 2016http://cjres.oxfordjournals.org/
Dow
nloaded from

with changes in eight of nine measures of eco-
nomic innovation and growth. Of the dozens of
variables analysed (over 40), none other showed
such a broad-based set of positive relationships,
including education, arts jobs and other creative
occupations such as research and technology (change
in college graduates is the closest). Arts and R&D
employment in particular showed mostly insig-
nificant or negative impacts in the full model.
Other variables (not shown) such as weather, com-
muting time or social climate show decidedly weaker
and more mixed results than self-expressive scenes do.
Economic well-being thus seems strongly related
to local opportunities for self-expression. Controlling
for other variables, such places tend to generate
more patents, create jobs and increase their shares of
college graduates. Multiple mechanisms may be at
work, both direct and indirect. Self-expressive scenes
may cultivate skills and talents in the cultural and
creative economy. They may also drive migration pat-
terns, drawing talented persons and new businesses.12
One indication of the fact that self-expressive
scenes may enhance creative work is given in
Figure 6. It deconstructs the widely discussed idea
of clusters as development vehicles, as stressed by
Michael Porter (2000) and others.
Figure 6 summarizes regression results for clus-
ters of technology jobs within quintiles of self-
expressive scenes. That is, the national file was split
into five groups based on their self-expression per-
formance scores. Technology job concentration was
then analysed within each quintile.
Figure 4. Regional differences in scenes dimensions.Note: This figure shows regional variations in selected performance scores. Lighter shades indicate counties in lower quintiles (of self-expression etc.); darker shades indicate higher quintiles.
The American scenescape
109
by guest on February 27, 2016http://cjres.oxfordjournals.org/
Dow
nloaded from

In a near linear fashion, the association between
technology clusters and many outcomes becomes
increasingly positive as we move from the least to
the most self-expressive scenes. That is, technology
industry clusters are associated with growth and in-
novation more when they are located amidst ameni-
ties that promote self-expression. Absent location in
such scenes, that association is negligible. Quality of
life enhances quality of work in measurable ways.
This contextual consequence becomes clearer
by comparing national results to quintile results.
Nationally, technology jobs are positively related
to patent concentration, job growth, population
growth and human capital gains, but not signifi-
cantly related to changes in rents and income. These
connections are strongly mediated by the self-
expressiveness of the surrounding scene. The
positive relationship between technology industry
clusters and entertainment and technology patents
occurs only within the two most self-expressive
quintiles. The positive and significant relationship
between technology and college graduate gains
exists only in the upper three quintiles, and the
magnitude of the coefficient increases fairly line-
arly. Technology jobs and general job growth are
only significantly related within the most self-
expressive quintile. The association with popula-
tion growth and postgraduate gains is significant
only in the two most self-expressive quintiles.
Technology clusters may play a part in the new
urban economy, but the scene in which those clus-
ters are situated mediates that role. A city may con-
tain large concentrations of technological work, but
without self-expressive scenes, they may not attract
the most highly trained workers and the spillover
effects noted by many geographers may not occur.
Approaches that analyse standard production and
employment variables will miss these powerful con-
tributions of scenes to the economic health of places.
Conclusion
The interaction between scenes and other standard
economic development variables offers one strategic
site for further analysis. Urban economists have
analysed amenities for several decades, but they
have generally used them atomistically—one or a
few at a time. The innovation implicit in the scenes
approach is to combine hundreds of such amenities
and to assign weights to all of them to generate
scenes measures for each US zip code. These
scenes have direct consequences for many pro-
cesses. They also measure contexts that transform
the operations of other variables, as we saw in the
case of self-expressive scenes and technology
Figure 5. Self-expression is a key factor in local economicgrowth.Note: In Figures 5 and 6, bars show the impact via thestandardized regression coefficients for scenes that promote self-expression on nine dependent variables (EntP etc.). Whiskersindicate the 95% confidence interval for each coefficient. Thus,if the whiskers do not cross (or touch) the horizontal line at zero,the results are statistically significant. From left to right,dependent variables are log entertainment patents per capita,log other patents per capita, log high-tech patents per capita,log proportional change in total employment (1994–2001), logproportional change in population (1990–2000), proportionalchange in per capita income (1990–2000), proportional changein gross rent (1990–2000), difference in proportion of collegegraduates (1990–2000) and difference in proportion ofindividuals with postgraduate degrees (1990–2000). These areclassic least squares multiple regression point estimates. Controlvariables are summarized in the appendix: population, rent,education, crime, party voting, race, arts industry clusters andthe first factor of a principal components analysis on the 15dimensions of scenes. Subsequent analysis (not reported here)of an expanded model that included some 20 controls revealedsubstantively similar results.
Silver
110
by guest on February 27, 2016http://cjres.oxfordjournals.org/
Dow
nloaded from

clusters. Other research shows that the socioeco-
nomic gains that accrue to walkable neighbour-
hoods are enhanced if they are located in
neighbourly and locally oriented scenes (Silver
et al., 2011 detail evidence for this connection).
Scenes measures can thus enhance connections
among other aspects of regional well-being. Other
work in progress shows strong connections be-
tween variations in the strength and type of scenes
and variations in social trust (Da Silva et al., 2010),
political engagement and activism (Knudsen and
Clark, 2009) and psychological dimensions. More
generally, we might even proffer that as consump-
tion, taste and lifestyle grow more socially salient,
in at least some scenes, production functions esti-
mated omitting scenes variables will be underspe-
cified. To be sure, scenes should not replace classic
variables stressed by past work on urban and re-
gional processes. But the scenes perspective adds
new tools to the social science tool kit.
Figure 6. Technology clusters impact local economic growth more strongly in self-expressive scenes.Note: This figure shows the impact via the standardized regression coefficients of technology clusters on two types of patents, jobgrowth, population growth, change in college graduates and change in postgraduates. The full model was repeated across nationalquintiles of self-expressive scenes. See the note to Figure 5 for more details on the variables in the model. The appendix details howtechnology clusters are measured.
The American scenescape
111
by guest on February 27, 2016http://cjres.oxfordjournals.org/
Dow
nloaded from

Endnotes
1 Selection criteria are further discussed in Silver et al.
(2010).2 PageRaptor software was used to download the catego-
ries in 2006 from yellowpages.com. Though the kind of
amenities present may change year over year, an analysis
of BIZZIP data showed a less than 1% total change in any
scene measure based on the overall local set of amenities,
from 1998 to 2004. This was despite an increase in the
total number of amenities of interest of over 7%.3 Furthermore, unlike BIZZIP data, where there is an
established and documented rationale for the classifica-
tion system, there is no such information available for YP
data. Individual businesses usually select their categories
from a preset list.4 The coding process required many detailed and fine
judgements and tests for validity and reliability. Coders
applied a dichotomous decision tree to each category
based on operational definitions of the scenes dimen-
sions. The general strategy was to use the coding process
to add operational detail about each dimension. Intercor-
relations among coders’ results were computed almost
weekly, and if they fell below 0.8, the teams would meet,
discuss and add more conceptual consistency in writing
with more detail about how and what to code, to make the
criteria as explicit and consistent as possible for any fu-
ture coder/analysts to use or recode differently. Though
it is possible to quibble with any individual decision, the
final scores are relatively stable with respect to any single
amenity. Removing even the most numerous types of
amenities changes them very little. The appendix, avail-
able at www.utsc.utoronto.ca/;dsilver/CJRES_Appendix.
pdf, includes illustrative selections of amenities used to
indicate each of the dimensions of theatricality, authentic-
ity and legitimacy.5 We compute separate scores for each source, BIZZIP
and YP. These scores are in general substantively sim-
ilar, though they sometimes differ based on the fact that
BIZZIP contains broader coverage but coarser catego-
ries while YP is the opposite. YP is thus often more
appropriate for comparing smaller sets of more distinc-
tive zip codes and BIZZIP for national analysis of larger
units. Since the purpose here is to illustrate the utility of
the general scenes approach, the present paper does not
detail differences in the two measures (the methodolog-
ical chapter of a book on scenes does, available from the
author upon request).
6 Other features of the national distribution of amenities
emerge when we look not at the most numerous but rather
at the most concentrated amenities, in particular the clus-
tering of some art scenes in major cities. For instance,
among the top 50 zip codes for ‘independent artists, writers
and performers’, not one besides Nashville’s 37212 comes
from outside the New York City or the LA area, and one
must scroll down to number 72 to find the next non-
New York/LA zip code, Santa Fe, NM. Musical groups
and performers, though also concentrated in New York
and LA, do include more variation in the top 50, with
for instance Nashville zip codes holding the number 1
and 3 positions and zip codes in Branson, Boston and
San Francisco holding, respectively, the 21st, 28th and
32nd positions (for more on the geography of musicians,
see Florida et al., 2010).7 The more extensive figures referred to in the text can be
consulted at http://www.utsc.utoronto.ca/;dsilver/CJRES_
Expanded_Tables.pdf.8 ’New York’ is defined here as the five county boroughs;
‘LA’ as LA County and ‘Chicago’ as Cook County.9 More detailed rankings can again be found at http://
www.utsc.utoronto.ca/;dsilver/CJRES_Expanded_Ta-
bles.pdf.10 More detailed rankings are available at http://www.utsc.
utoronto.ca/;dsilver/CJRES_Expanded_Tables.pdf.11 This factor divides the scenescape along its strongest
division, between ‘urbane’ dimensions that are more
impersonal, universalistic and individualistic (corporate,
state, rational, utilitarian, glamourous and transgressive)
and ‘communitarian’ dimensions that are more personal
and particular (traditional, neighbourly and charismatic).
Controlling for this factor allows us to isolate specific
dimensions (like self-expression) net of this most generic
aspect of the US scenescape. All variables used in the
model are described in more detail in the appendix, at
http://www.utsc.utoronto.ca/;dsilver/CJRES_Appen-
dix.pdf.12 Multiple causal pathways are likely at work. People may
move to places with higher average education levels or
rents (due to networking or signalling effects), and scenes
may then emerge to support these tastes, subsequently
taking on a life of their own. Further analysis shows that
places with increasing college graduate populations and
higher densities tend to have more self-expressive scenes.
But such factors explain a small share of the variance in
scenes. The connection between scenes and urban devel-
opment does not seem to be a function of density, income
Silver
112
by guest on February 27, 2016http://cjres.oxfordjournals.org/
Dow
nloaded from

or college graduate population, as controlling for these
does not reduce the impact of scenes. Once a scene is there,
the quality of life it creates matters in its own right. Further
work is needed to isolate distinct causal processes.
Acknowledgements
The author thanks Terry Nichols Clark, Benjamin Schatz
and Christopher Graziul for helpful comments and tech-
nical assistance and gratefully acknowledges the support
of the Cultural Policy Center at the University of Chicago
and Urban Innovation Analysis.
References
Barnett, C. et al. (2005) Consuming ethics: articulating
the subjects and spaces of ethical consumption. Anti-pode, 37: 23–45.
Bellah, R. et al. (1996) Habits of the Heart. Berkeley:
University of California Press.Blum, A. (2003) The Imaginative Structure of the City.
Montreal: McGill-Queen’s University Press.Brown-Saracino, J. (2009) A Neighborhood That NeverChanges: Gentrification, Social Preservation, and theSearch for Authenticity. Chicago: University of Chi-
cago Press.Clark, T. N. ed. (2004) The City as an Entertainment Ma-chine. Research in Urban Policy 9. Boston: Elsevier Ltd.
Currid, E. (2007) The Warhol Economy: How Fashion,Art and Music Drive New York City. Princeton: Prince-
ton University Press.Da Silva, F., Clark, T. and Cabacxo, S. (2010) The Rise ofCulture: How and Why Arts Participation PromotesDemocratic Politics. Paper presented at the International
Sociological Association World Congress, Gotheburg,
Sweden.Diener, E. (2006) Guidelines for national indicators of
subjective well-being and ill-being. Applied Researchin Quality of Life, 1: 151–157.
Di Tella, R. and MacCulloch, R. (2008) Gross national
happiness as an answer to the easterlin paradox. Jour-nal of Development Economics, 86: 22–42.
Elazar, D. (1975) The American cultural matrix, In Daniel, J.
E., Zikmund, J. II. (ed.) The Ecology of American Polit-ical Culture, pp. 13–42. New York: Thomas Y. Crowell.
Fischer, C. S. (1975) Toward a subcultural theory of urban-
ism. American Journal of Sociology, 80: 1319–1341.Fischer, C. (1995) The subcultural theory of urbanism:
a twentieth year assessment. American Journal ofSociology, 101: 543–577.
Florida, R. (2002) The Rise of the Creative Class. New
York, NY: Basic Books.
Florida, R. (2008) Who’s Your City?: How the CreativeEconomy Is Making Where to Live the Most ImportantDecision of Your Life. New York: Basic Books.
Florida, R., Mellander, C. and Stolarick, K. (2010) Musicscenes to music clusters: the economic geography ofmusic in the U.S., 1970-2000. Environment and Plan-ning A, 42: 785–804.
Glaeser, E. (2011) The Triumph of the City. New York:Penguin Press.
Grazian, D. (2003) Blue Chicago: The Search for Authen-ticity in Urban Blues Clubs. Chicago: University ofChicago Press.
Haenfler, R. (2004) Rethinking subcultural resistance:core values of the straight edge movement. Journalof Contemporary Ethnography, 33: 406–436.
Helliwell, J. (2003) ‘‘How’s life? Combining individualand national variables to explain subjective well-being.Economic Modelling, 20: 331–360.
Johnston, J. and Baumann, S. (2007) Democracy vesusdistinction: a study of omnivorousness in gourmetfood writing. American Journal of Sociology, 113:165–204.
Kaufman, J. and Keliner, M. (2011) The re-accomplishmentof place in twentieth century Vermont and New Hamp-shire: history repeats itself, until it doesn’t. Theory andSociety, 40: 119–154.
Knudsen, B. and Clark, T. N. (2009) The Local Ecologyof New Social Movements. Paper presented at theAmerican Political Science Association Annual Meet-ing. Toronto.
Lloyd, R. (2006) Neo-bohemia: Art and Commerce in thePostindustrial City. New York: Routledge.
Mellander, C., Florida, R. and Rentfrow, P. J. (2010) Socio-economic Structure and Happiness. Martin Prosperity In-stitute Working Paper Series. Available online at: http://research.martinprosperity.org/2010/03/socioeconomic-structures-and-happiness/ [Accessed 9 September2011]
Navarro, C. J. (2010) The Cultural Dimensions of Cities(Scenes Project in Spain). Paper presented at the In-ternational Sociological Association World Congress,Gotheburg, Sweden. RC03.
Porter, M. E. (2000) Location, competition and economicdevelopment: local clusters in a global economy. Eco-nomic Development Quarterly, 14: 15–34.
Silver, D., Clark, T. and Graziul, C. (2011) Scenes, in-novation and urban development. In David Anderson,Ake Andersson, and Charlotta Mellander (ed.) Hand-book of Creative Cities. Cheltenham: Edward Elgar.
Silver, D., Clark, T. N. and Navarro, C. J. (2010) Scenes:Social Context in an Age of Contingency. SocialForces, 88: 2293–2324.
Simmel, G. (1971) The metropolis and mental life. InLevine D. N. (ed.) On Individuality and Social Forms:
The American scenescape
113
by guest on February 27, 2016http://cjres.oxfordjournals.org/
Dow
nloaded from

Selected Writings. Chicago, IL: University of ChicagoPress.
Stiglitz, J. E., Sen, A. and Fitoussi, J.-P. (2009) Report bythe Commission on the Measurement of Economic Per-formance and Social Progress. Retrieved from TheCommission on the Measurement of Economic Perfor-mance and Social Progress website. Available onlineat: http://www.stiglitz-sen-fitoussi.fr/en/index.htm[Accessed 9 September 2011].
Taylor, C. (2007) A Secular Age. Cambridge, MA: Bel-knap Press of Harvard University Press.
Wirth, L. (2004) ‘‘Urbanism as a Way of Life: The Cityand Contemporary Civilization’’ as featured in Me-tropolis: Center and Symbol of Our Time. New York:New York University Press.
Zukin, S. (2009) Naked City: The Death and Life ofAuthentic Urban Places. New York: Oxford Univer-sity Press.
Silver
114
by guest on February 27, 2016http://cjres.oxfordjournals.org/
Dow
nloaded from