the analytics of things - creating new value from ...the analytics of things - creating new value...
TRANSCRIPT

Copyright © SAS Inst itute Inc. A l l r ights reserved.
The Analytics of Things - Creating new value from industrial IoT data SAS Forum Moscow
Christoph Hartmann, Principal Industry Consultant, SAS

Copyright © SAS Inst itute Inc. A l l r ights reserved. Picture: © by chensiyuan (CC BY-SA 4.0)

Copyright © SAS Inst itute Inc. A l l r ights reserved.
Copyright © SAS Inst itute Inc. A l l r ights reserved.
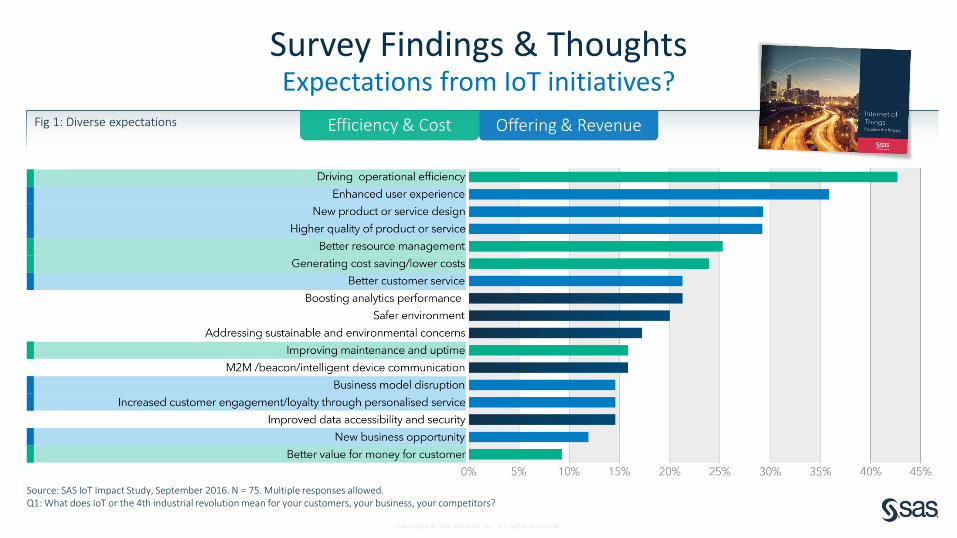
Survey Findings & ThoughtsExpectations from IoT initiatives?
Source: SAS IoT Impact Study, September 2016. N = 75. Multiple responses allowed. Q1: What does IoT or the 4th industrial revolution mean for your customers, your business, your competitors?
Fig 1: Diverse expectations Efficiency & Cost Offering & Revenue

Copyright © SAS Inst itute Inc. A l l r ights reserved.
IoT DataIntelligent Data Management
Streaming Analytics Execution
Deploy
AutomatedResponse
The IoT Analytics LifecycleLatency, data volumes, connectivity
DeployETLData
Alerts / Reports / Decisioning
Data Storage
Copyright © SAS Inst itute Inc. A l l r ights reserved.
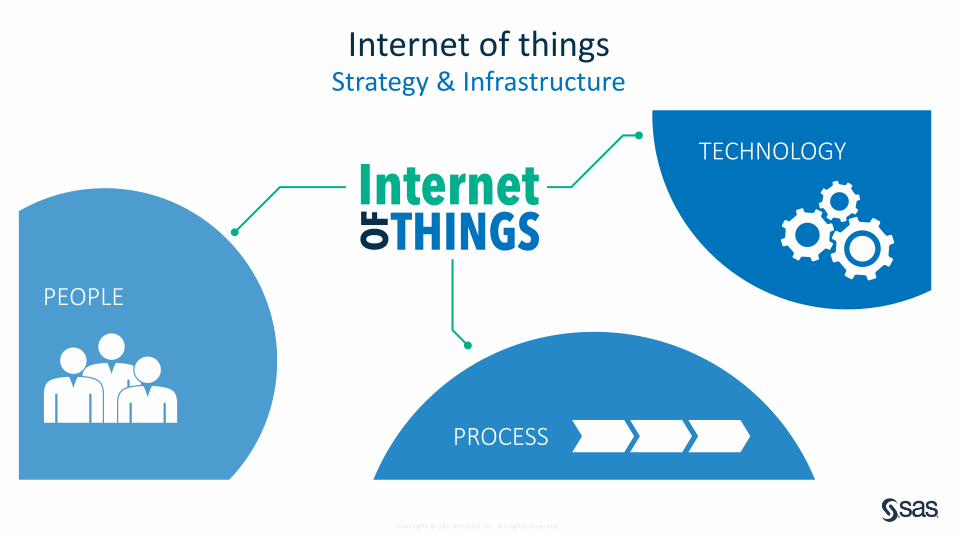
PEOPLE
PROCESS
TECHNOLOGY
Internet of thingsStrategy & Infrastructure

Copyright © SAS Inst itute Inc. A l l r ights reserved.
Internet of things – use casesTire manufacturer

Copyright © SAS Inst itute Inc. A l l r ights reserved.
Tire manufacturerProduction Quality Analytics
Rubber Mix
Cord Manf.
Bead Manf.
Tire Building
Vulcanisation
Finish
Final Quality Inspection
Shipping to Factory
Target is to enable Engineers to drive sustainable Quality and Productivity Improvements
Visual Inspection
X-Ray
Uniformity Balance Geometry
Over-Inspection
Support Tire Production end-to-end: Mixing, Preparation, Building, Curing, Final Finish…

Company Conf ident ia l – For Internal Use OnlyCopyright © SAS Inst itute Inc. A l l r ights reserved.
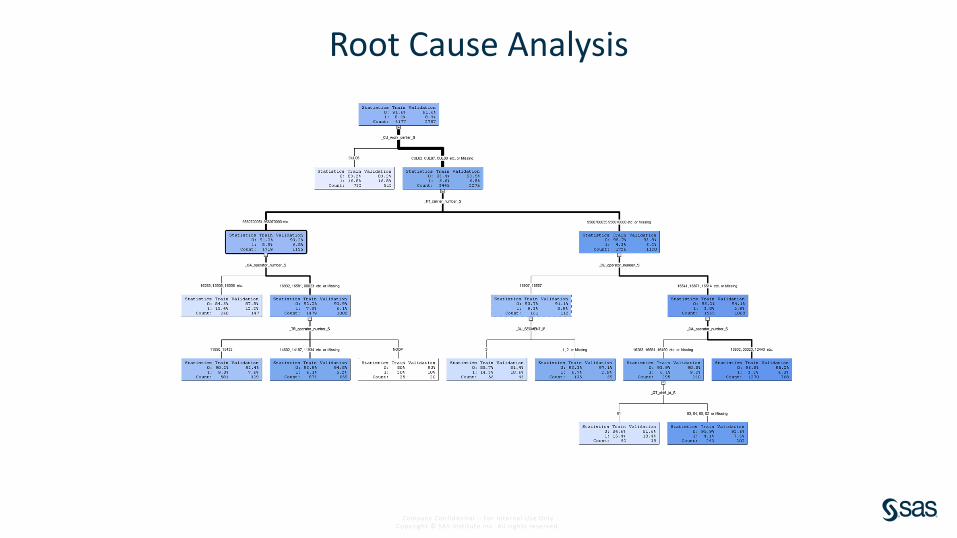
Root Cause Analysis
The How`s :
• Data Integration into analytical production centric data model
• Reporting
• Identify Quality drivers
• Root Cause Analysis
• Incident Management
Variable Name
Imp
ort
ance
0
0,2
0,4
0,6
0,8
1,0
Company Conf ident ia l – For Internal Use OnlyCopyright © SAS Inst itute Inc. A l l r ights reserved.
Root Cause Analysis

Company Conf ident ia l – For Internal Use OnlyCopyright © SAS Inst itute Inc. A l l r ights reserved.
Root Cause Analysis
Example Rule 1
Rule affects 240 tires (~5.8% of the training data set, 4177 tires)
If Curing Cavity {2, 5, 7, 8}AND Tread Carrier Number {9560700051, 9560700032, 9560700030,
9560700021, 9560700028, 9560700052, 9560700029, 9560700011, 9560700025, 9560700004, 9560700010, 9560700060, 9560700012, 956070003}
AND Carcass Operator Number {16283, 13305, 16336, 16710,16481, 16369}
THEN Probability of NOT passing first TU check increases by factor ~𝟐ule affects 240 tires (~5.8% of the training data set, 4177 tires)

Company Conf ident ia l – For Internal Use OnlyCopyright © SAS Inst itute Inc. A l l r ights reserved.
Root Cause Analysis
Example Rule 2
If Curing Cavity {2, 5, 7, 8}AND Tread Carrier Number {9560700035, 9560700005, 9560700040, 9560700009, 9560700018, 9560700020, 9560700001, 9560700017, 9560700002, 9560700034, 9560700022, 9560700023, 9560700041, 956070000}AND Curing Operator Number {16541, 16871, 16514, 16897,
16559, 12482, 16872, 16210, 15830, 16397, 16870 }AND Carcass Operator Number {16932, 00023, 12443, 09758,
16336, 15836, 16844, 16356, 16313}THEN Probability of NOT passing first TU check
decreases by factor ~𝟑
Rule affects 1270 tires (~30.4% of the training data set, 4177 tires)
Copyright © SAS Inst itute Inc. A l l r ights reserved.
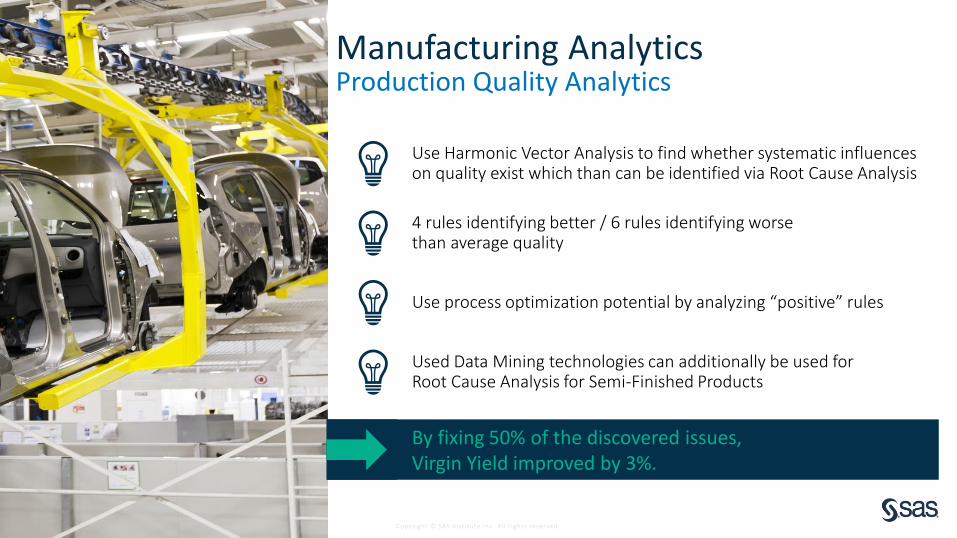
Use Harmonic Vector Analysis to find whether systematic influences on quality exist which than can be identified via Root Cause Analysis
4 rules identifying better / 6 rules identifying worse than average quality
Use process optimization potential by analyzing “positive” rules
Used Data Mining technologies can additionally be used for Root Cause Analysis for Semi-Finished Products
Production Quality Analytics Production Quality Analytics
Manufacturing Analytics
By fixing 50% of the discovered issues, Virgin Yield improved by 3%.

Copyright © SAS Inst itute Inc. A l l r ights reserved.
Internet of things – use casesHealthcare

Copyright © SAS Inst itute Inc. A l l r ights reserved.
Large German medical device manufacturerPredictive maintenance of computer tomography scanners
15,000 devices,
20,000 event codes per day,raw data
Thousands of predictive modelsfor failures
Challenge: Predict component failures5 to 10 day in advance : >70% accuracyand <20% false alarms
Impact on operational processes

Copyright © SAS Inst itute Inc. A l l r ights reserved.
11 Product types
25Sensor types
7 Different locations
1925Predictive Models
Complexity of analytical challengesPredictive maintenance of computer tomography scanners

Copyright © SAS Inst itute Inc. A l l r ights reserved.
Need for automization and flexible deployment
Complexity of analytical challengesPredictive maintenance of computer tomography scanners
11 Product types
25Sensor types
7 Different locations
1925Predictive Models

Copyright © SAS Inst itute Inc. A l l r ights reserved.
Internet of things – use casesTransportation

Copyright © SAS Inst itute Inc. A l l r ights reserved.
Navistar
“SAS software’s user-friendly interface allows analysts with light pro-gramming skills to spear-head interesting analytical projects and predictive models. Meanwhile, strong programmers are free to write their own code. This flexibility provides an edge that is unique to SAS.”
Gyasi K. DappaDirector of Data Science
BUSINESS ISSUE
• Predict component failure before it occurs
• Prevent hazardous customer breakdowns on the road
SOLUTION
• Outfit every vehicle in the fleet with sensors
• Integrate advanced analytics across multiple data sources, including Hadoop
• Provide a “one-stop shop” for analysts to query, process, profile and analyze data
• Analyze a constant stream of multidimensional data from Vehicles including engine and fault codes
• Leverage sensor data to prioritize maintenance needs and prevent breakdowns
RESULTS

Copyright © SAS Inst itute Inc. A l l r ights reserved.
Internet of things – use casesTelco

Copyright © SAS Inst itute Inc. A l l r ights reserved.
For One-to-One Customer Use Only
Telefonica/O2 Communications
Business Issue
• Improve cross-sell and up-sell ability to customers, in the context of data monetization, while leveraging existing SAS® infrastructure.• Improve availability of customer information based on the network data.
• Enable offering fulfillment (e.g., price, volume, validity of offer).
• Utilize real-time campaigns in order to be more relevant to customers.
Solution
• SAS® Event Stream Processing Engine, SAS® Real-Time Decision Manager, SAS® Visual Analytics
Expected Results
• Create, execute, monitor and optimize contextual marketing campaigns.
• With this more targeted, customized communication, TelefónicaGermany hopes to achieve considerable increases in revenues from its existing customer base and realize a project ROI in two months.
“With SAS, we will be able to generate greater revenues and a highly improved customer experience with our current customer base. SAS will enable us to act in real time, which we have not been able to do before.”
Andreas Walter
Head of CI Telefonica Germany

Copyright © SAS Inst itute Inc. A l l r ights reserved.
Internet of things – use casesOil&Gas

Copyright © SAS Inst itute Inc. A l l r ights reserved.
For One-to-One Customer Use Only
Petronas Oil & Gas
Business Issue• Too many siloes and overlapping data sources.• Lack of data transparency.• Error-prone manual reporting from the regions, fields and
platforms.Solution• SAS® Event Stream Processing EngineExpected Results
• Consolidate and provide informed updates on offshore data collection for all production sharing contracts (PSCs)—gaining a single, accurate view of current national production through analysis of a variety of data: production, health, safety and environment (HSE),wells and operations.
• Carry out gas nomination and production planning activities more effectively and efficiently. From a common platform, users can better plan short- and medium-term objectives without the conflicts of production numbers and availability.

Copyright © SAS Inst itute Inc. A l l r ights reserved.
Internet of ThingsRecommendation
Copyright © SAS Inst itute Inc. A l l r ights reserved.
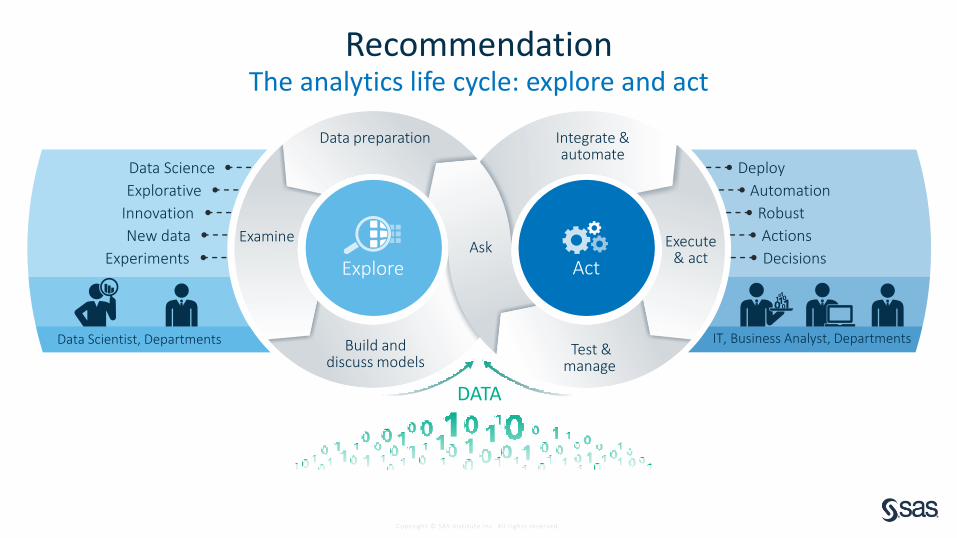
The analytics life cycle: explore and actRecommendation
Explore Act
Data preparation
Examine
Build and discuss models
Integrate & automate
Execute & act
Test & manage
Ask
IT, Business Analyst, Departments
Robust
Automation
Actions
Decisions
Deploy
Experiments
Data Science
New data
Innovation
Explorative
Data Scientist, Departments
DATA

Copyright © SAS Inst itute Inc. A l l r ights reserved.
Internet of ThingsMore on Iot
sas.com/iotebook
DownloadSurvey
First movers interviews
