the annual meeting of the rsai – the israeli branch, tel-aviv university, january 10, 2010...
TRANSCRIPT

The Annual Meeting of the RSAI – The Israeli Branch, Tel-Aviv University, January 10, 2010
Development and estimation of a semi-compensatory residential choice model with a flexible error structure
Sigal Kaplan, Shlomo Bekhor, Yoram ShiftanFaculty of Civil and Environmental Engineering, Technion

Motivation
When faced with
many
alternatives,
people apply a
sequence of non-
compensatory
heuristics
followed by a
compensatory
evaluation
(Payne , 1976).

• are mostly Multinomial logit• necessitate exogenous choice set formation• choice set formation independent of individual
characteristics
Motivation
Semi-compensatory models:• are based on Manski’s (1977) formula
• have 2J-1 theoretical choice sets for J alternatives• are estimated only for a few alternatives• involve thresholds that are independent of individual
characteristics• do not account for correlation patterns and population
heterogeneity
Residential choice models:
q qqS G
P i G P i S P S G
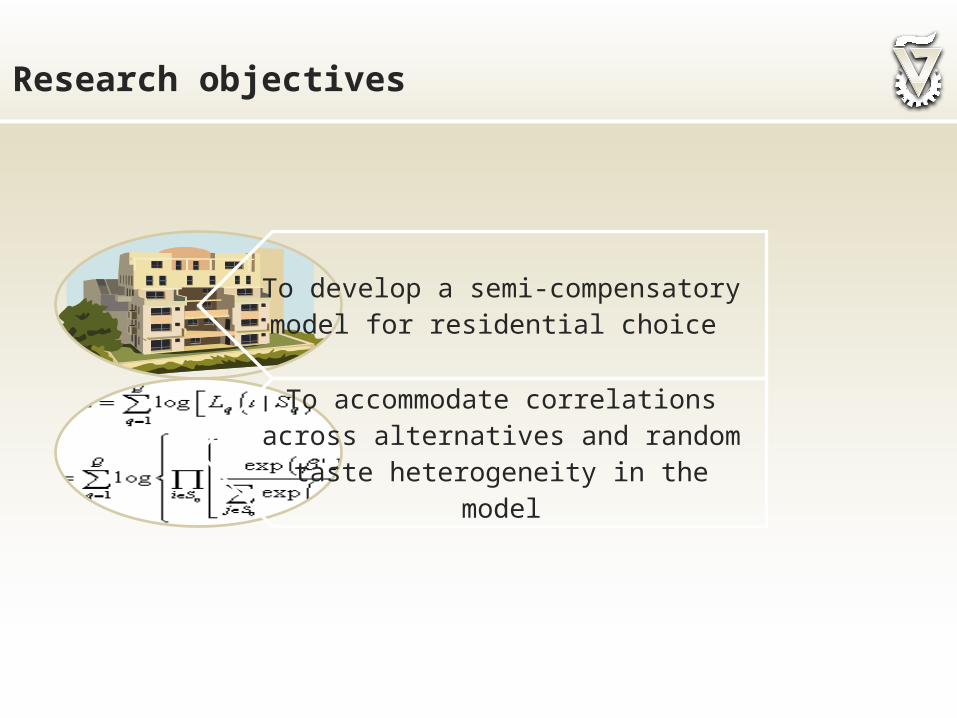
Research objectives
To develop a semi-compensatory model for residential choice
To accommodate correlations across alternatives and random taste
heterogeneity in the model
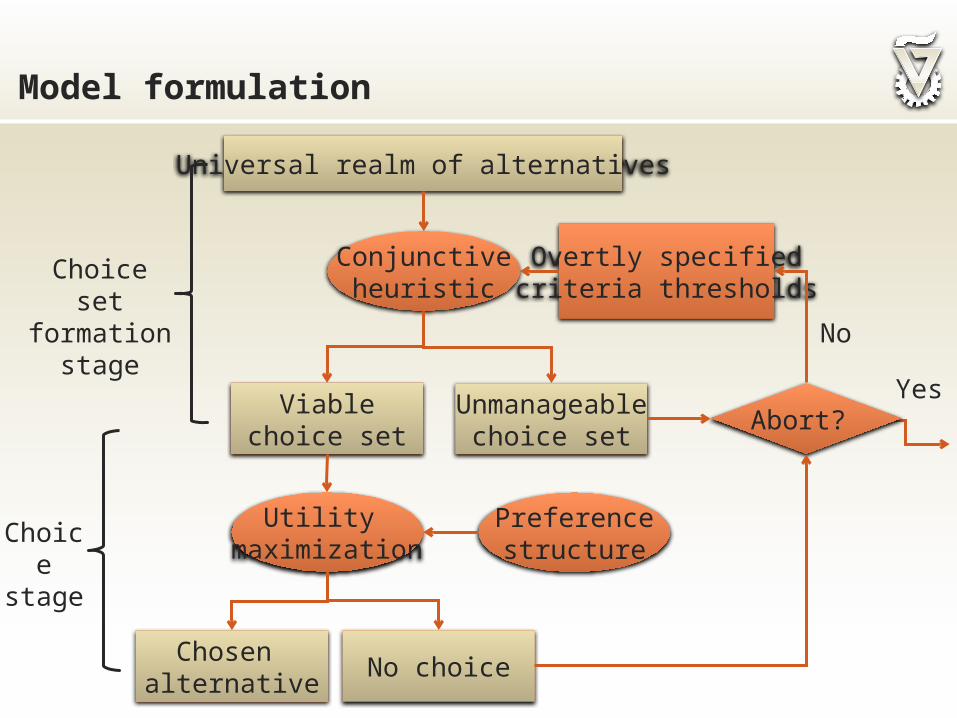
Model formulation
Universal realm of alternatives
Chosen alternative
Viable choice set
Preferencestructure
Utility maximization
Unmanageablechoice set
No choice
Overtly specified criteria thresholds
Conjunctiveheuristic
Abort?
No
Yes
Choice set formation
stage
Choice
stage

Model formulation
Observed choice i Observed choice set S
| | |q q q q qP i G P i S P S G
Proposed model:
Nested logit or random coefficients logit
Multidimensional mixed ordered-response model
Observed combination of criteria thresholds
that yield the choice set S

Model formulation
MMOP-NL model:
1
111
1
' /' /
,
11
' /
1 ,
' '1 1 1 1 1 11
1
1
e e
, , , ln
e
...
...
qir
j ri r
q r
sq
j s
q s
k m q
q Kqk
d
XX
Q j S j B
k k sNq i S
X
l j S j B
M d
q q m q qmm
m
LL
Z Z
' '
1
1 1, ,
k m qK
KKk
M d
K Kq Kq m K Kq Kqm
K q Kq q Kq
Z Z
d d
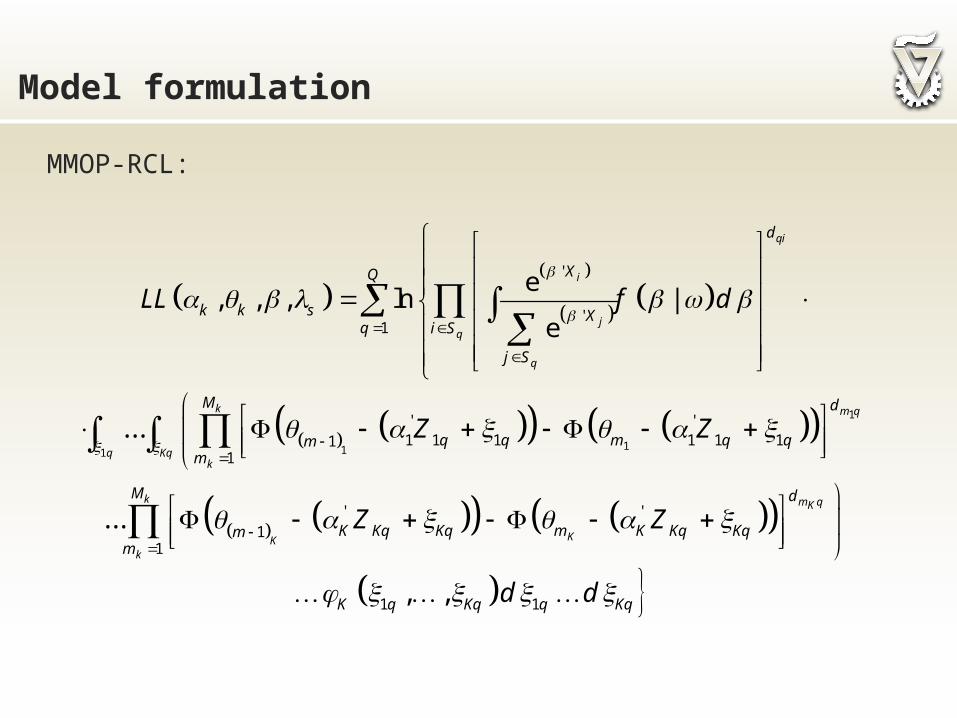
Model formulation
MMOP-RCL:
1
111
'
'1
' '1 1 1 1 1 11
1
' '1
1
1
e, , , ln |
e
...
...
, ,
qi
i
jq
q
k m q
q Kqk
k m qK
KKk
d
XQ
k k s Xq i S
j S
M d
q q m q qmm
M d
K Kq Kq m K Kq Kqmm
K q
LL f d
Z Z
Z Z
1Kq q Kqd d

Empirical context
Positive• Demand for public
transport• Revitalization of
city center• Local economic
growth• Local employment
generationNegative• Demand for
private cars• Formation of
seasonal communities
• Competition with low income groups in the rental market
Regional impact of students:

Survey design
Product: rental apartments
Population: Technion’s studentsSurvey type: stated preference
Survey duration: 1 month
Survey method: web-based
Incentive: 23 prizes ($1000) Technion campus
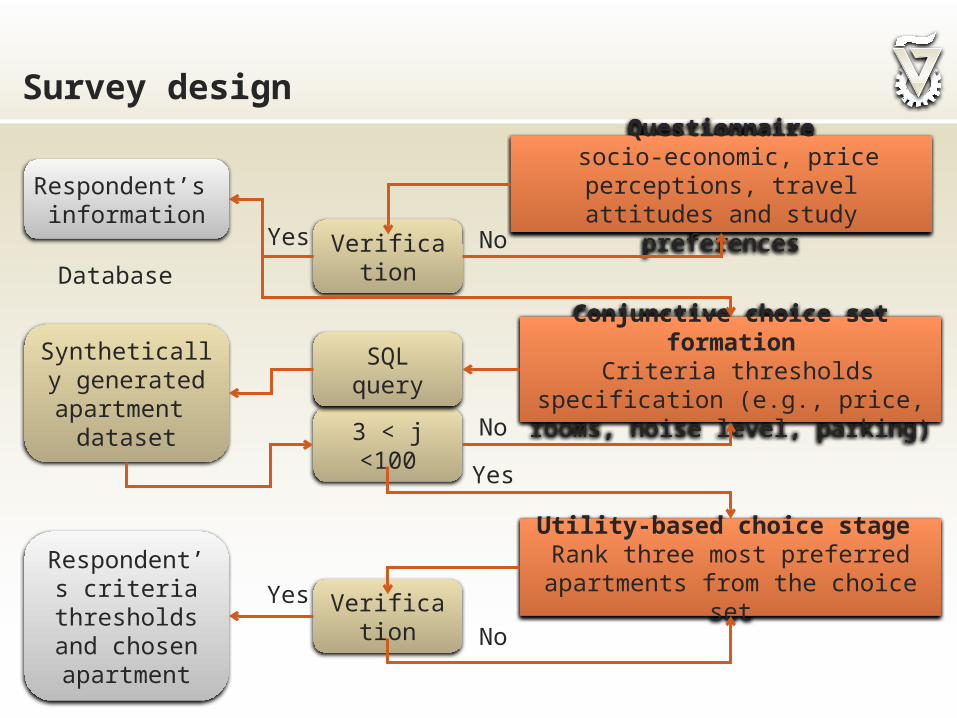
Survey design
Utility-based choice stage Rank three most preferred
apartments from the choice set
Conjunctive choice set formation
Criteria thresholds specification (e.g., price, rooms, noise level,
parking)
Questionnaire socio-economic, price
perceptions, travel attitudes and study preferences
Questionnaire socio-economic, price
perceptions, travel attitudes and study preferences
Conjunctive choice set formation
Criteria thresholds specification (e.g., price, rooms, noise level,
parking)
Utility-based choice stage Rank three most preferred
apartments from the choice set
Verification
No
No
Yes
Respondent’s criteria
thresholds and chosen apartment
Synthetically generated apartment
dataset 3 < j <100
Verification
Yes
SQL query
Yes
No
Database
Respondent’s information

Survey design

Model specification
Three criteria are represented in the estimated model:• apartment sharing• neighborhood • monthly rent price
Universal realm of alternatives: 200 apartments
• adjacent to campus with little employment or leisure• far from campus with leisure activities, shopping and jobs
Explanatory variables:
• personal characteristics • apartment attributes
Nested structure: floor numberTaste variation: renovation status, view and security bars.

Model estimation results
Variable descriptionest. t-stat. est. t-stat. est. t-stat.
Married 1.823 8.88 1.823 8.88 1.822 8.86Male -0.775 -5.85 -0.775 -5.83 -0.773 -5.83Age (years) 0.026 2.75 0.026 2.75 0.026 2.74Daily car availability 0.537 3.91 0.537 3.91 0.539 3.92Daily trip frequency to campus -0.635 -5.04 -0.634 -5.04 -0.633 -5.02Study on-campus for better communication -0.155 -3.95 -0.155 -3.95 -0.154 -3.93$ 750 - 1000 0.756 3.71 0.756 3.70 0.753 3.69$1000 - 1750 0.931 5.18 0.930 5.18 0.93 5.17Roommates -0.918 -5.13 -0.918 -5.13 -0.922 -5.15Alone 1.073 4.47 1.073 4.46 1.07 4.45Spouse 1.354 8.25 1.353 8.24 1.351 8.22Haifa suburbs -0.851 -2.96 -0.851 -2.96 -0.852 -2.96Haifa outskirts -1.266 -6.59 -1.267 -6.59 -1.265 -6.59
Price-quality ratio consciousness (factor) -0.395 -7.55 -0.395 -7.54 -0.395 -7.53Age (years) 0.055 4.37 0.055 4.36 0.055 4.36Daily car availability 0.696 5.51 0.696 5.50 0.698 5.51Medical campus 0.774 3.40 0.774 3.40 0.776 3.40$ 750 - 1500 0.637 4.26 0.637 4.25 0.636 4.23> $1500 0.995 5.76 0.995 5.76 0.994 5.75Part-time job -0.558 -3.46 -0.558 -3.46 -0.558 -3.45Difference in job opportunities 0.113 3.36 0.113 3.36 0.113 3.36Difference in green space availability 0.299 7.33 0.299 7.32 0.299 7.30Study on-campus to improve efficiency (factor) -0.187 -5.68 -0.188 -5.68 -0.188 -5.68Daily trip frequency to campus -0.461 -3.74 -0.461 -3.74 -0.460 -3.74
MMOP-MNL MMOP-NL MMOP-RCL
Apartment sharing threshold
Location threshold

Model estimation results
Variable descriptionest. t-stat. est. t-stat. est. t-stat.
Married 0.928 7.30 0.928 7.29 0.926 7.28Male -0.393 -4.87 -0.393 -4.86 -0.393 -4.85Age (years) 0.052 3.82 0.052 3.81 0.052 3.81$ 500-750 0.362 3.51 0.361 3.51 0.361 3.5$ 750-1500 0.854 7.05 0.853 7.04 0.853 7.02Part-time job 0.148 1.76 0.149 1.77 0.148 1.76Daily car availability 0.337 3.61 0.337 3.61 0.337 3.61Price-knowledge (factor) 0.160 6.07 0.160 6.07 0.161 6.06> 4 apartment changes -0.547 -3.24 -0.548 -3.24 -0.547 -3.24Daily trip frequency to campus -0.533 -5.82 -0.533 -5.80 -0.533 -5.79currently reside with roommates -0.330 -2.72 -0.330 -2.71 -0.329 -2.70currently reside with alone/parents 0.258 2.13 0.258 2.12 0.260 2.13currently reside with spouse 0.847 6.63 0.847 6.62 0.847 6.62Haifa – upper class neighborhoods 0.210 1.74 0.210 1.73 0.208 1.72Center of Israel 0.754 6.52 0.755 6.53 0.754 6.52Non-motorized modes preference (factor) -0.038 -1.66 -0.038 -1.66 -0.038 -1.66Travel minimization preference (factor) -0.083 -3.12 -0.083 -3.11 -0.083 -3.09Cut-off point 200 a - - - - - -
250 -0.295 -0.70 -0.296 -0.71 -0.297 -0.71350 0.330 0.79 0.329 0.78 0.328 0.78350 0.735 1.75 0.733 1.74 0.732 1.74400 1.051 2.49 1.049 2.49 1.048 2.48450 1.691 3.99 1.689 3.98 1.688 3.97500 2.353 5.54 2.351 5.53 2.349 5.52550 3.239 7.61 3.236 7.59 3.232 7.59600 3.583 8.39 3.580 8.38 3.577 8.37650 4.115 9.66 4.111 9.64 4.108 9.63700 4.328 10.14 4.325 10.13 4.321 10.12
MMOP-MNL MMOP-NL MMOP-RCL
Price threshold

Model estimation results
Rent price and neighborhood 0.415 fixed 0.415 fixed 0.415 fixedRent price and apartment sharing 0.674 fixed 0.674 fixed 0.674 fixedNeighborhood and apartment sharing 0.313 fixed 0.313 fixed 0.313 fixed
Rent price (monthly) -0.001 -2.04 -0.001 -2.19 -0.001 -2.62Number of rooms 0.584 12.00 0.453 8.81 0.634 12.04Number of roommates -0.394 -4.64 -0.364 -5.03 -0.363 -3.76Walking time to campus -0.083 -15.95 -0.062 -10.55 -0.089 -15.91Quiet apartment 1.475 25. 90 1.134 11.52 1.507 24.3Parking 0.298 4.43 0.257 4.70 0.346 4.89Floor -0.071 -3.09 -0.073 -2.78 -0.067 -2.74Smoking allowed -0.385 -5.16 -0.31 -5.05 -0.412 -5.26Security bars (mean) 0.185 3.63 0.104 2.51 0.209 3.58Security bars (standard deviation) - - - - 0.213 0.23Stunning view (mean) 0.377 6.65 0.267 4.79 -1.369 -1.71Stunning view (standard deviation) - - - - 4.517 3.02Renovated (mean) 0.565 9.49 0.468 7.88 0.356 2.82Renovated (standard deviation) - - - - 2.19 4.70Air conditioner 0.290 5.01 0.223 4.77 0.321 5.27Solar water heater 0.442 5.43 0.348 5.30 0.453 5.36λ1 Non ground floor apartment - - 0.802 14.19 - -λ2 Ground floor apartment - - 0.638 8.30 - -Number of observationsNumber of parametersLog-likelihood at zeroLog-likelihood at estimatesMcFadden’s adjusted R2 0.473
Correlation across thresholds
Utility function
189368 70 71
-20431.414-10710.708 -10700.996 -10692.686
0.472 0.473
-20431.414 -20431.414
1893 1893
Conclusions
The model estimation results shows the importance of incorporating a flexible error structure into semi-compensatory models
The proposed model is a viable option for real-world applications and it can be readily incorporated within activity-based models and joint residential and transportation models.
The proposed semi-compensatory model:
• is applicable to large universal realms• includes a probabilistic choice set formation dependent on
individual characteristics• includes a flexible error structure

Thank you!
The Annual Meeting of the RSAI – The Israeli branch, Tel-Aviv University, January 10, 2010