the antecedents and consequences of … logistic regression with state fixed-effects, ... chapter 1...
TRANSCRIPT

THE ANTECEDENTS AND CONSEQUENCES
OF PUBLIC HOSPITAL PRIVATIZATION
by
ZO-HARIVOLOLONA RAMAMONJIARIVELO
ROBERT WEECH-MALDONADO, COMMITTEE CHAIR
LARRY HEARLD
NIR MENACHEMI
MICHAEL MORRISEY
STEPHEN O’CONNOR
A DISSERTATION
Submitted to the graduate faculty of The University of Alabama at Birmingham,
in partial fulfillment of the requirements of the degree of
Doctor of Philosophy
BIRMINGHAM, ALABAMA
2012

Copyright by
Zo-Harivololona Ramamonjiarivelo
2012

iii
THE ANTECEDENTS AND CONSEQUENCES
OF PUBLIC HOSPITAL PRIVATIZATION
ZO-HARIVOLOLONA RAMAMONJIARIVELO
PH.D. PROGRAM IN ADMINISTRATION-HEALTH SERVICES
ABSTRACT
The purpose of this study was to explore the antecedents and consequences of
public hospital privatization with special attention to financial distress and financial
performance. A national sample of public hospitals using secondary longitudinal data
from 1997 to 2009 was used in this study. Data set from the American Hospital
Association, the Area Resource File, the Medicare Cost Report and the Local Area
Unemployment Statistics were merged to test the hypotheses pertaining to each research
question.
Based on the resource dependence theory, both environmental variables and
organizational variables were included in the analyses. This study adopted the Altman Z-
score method to assess public hospital financial distress. Fixed-effects logistic regression,
random-effects logistic regression with state fixed-effects, and fixed-effects linear
regression were used in this study.
Key findings indicated that environmental variable HMO penetration was
positively associated with the odds of public hospital financial distress. Organizational
variables hospital size, participation in a health network, and outpatient mix were
significantly and negatively associated with the odds of experiencing financial distress.
Membership of a multihospital system was significantly and positively associated with
the odds of experiencing financial distress. Additional findings suggested financial

iv
distress increased the odds of privatization and privatization improved financial
performance in terms of operating margin and total margin. In addition, findings
suggested privatization to public for-profit status resulted in better financial performance
compared to privatization to public-not-for-profit status.
Keywords: public hospital, privatization, financial distress, financial performance,
resource

v
DEDICATION
This dissertation is dedicated to God Almighty, Father, Son, and Holy Spirit, who
has been the source of all the strength, knowledge, ability, and resources that I needed to
pursue my education and complete this study. This dissertation is also dedicated to my
beloved and wonderful parents, my mother Honorine Ramahefarivelo and my late father
Paul Rakotomamonjy, who both sacrificed to raise and educate their children.

vi
ACKNOWLEDGMENTS
I could not have completed this dissertation alone. It has taken the support and
contribution of many scholars, namely my dissertation chair, Dr. Robert Weech-
Maldonado, and the members of my dissertation committee, Dr. Larry Hearld, Dr. Nir
Menachemi, Dr. Michael Morrisey, and Dr. Stephen O‘Connor. I could never thank Dr.
Weech-Maldonado enough for his contributions to this study. Dr. Weech-Maldonado
freely gave his time, expertise, support, and never-ending patience. Dr. Weech-
Maldonado is a wonderful role model with respect to scholarship, mentorship, kindness,
and humility.
I also would like to express my most sincere appreciation to the members of my
dissertation committee whose areas of expertise I came to depend on. I convey my
heartfelt thanks to Dr. Larry Hearld for spending invaluable time and effort reading and
editing my dissertation and showing me how to clearly and logically express my ideas. In
addition, Dr. Hearld provided advice and guidance with respect to the choice of
appropriate methods that matched the structure of the data used in this study. I also
extend my sincere gratitude to Dr. Nir Menachemi who has been an exceptional mentor
and role model. He not only helped me to find a dissertation topic, but also has been
gracious enough to assist me whenever I need help. I also appreciate Dr. Menachemi‘s
relentless encouragement to complete this dissertation.

vii
I would like to express my deep appreciation to Dr. Michael Morrisey whose
expertise in economics and experience with the American Hospital Association were vital
assets for this study. Dr. Morrisey‘s enthusiasm with respect to the dissertation topic was
contagious and his contribution to the careful choice of the variables needed for this study
was monumental. I also would like to state my profound gratitude to Dr. Stephen
O‘Connor for all his contributions. Dr. O‘Connor spent time reading and editing my
dissertation and his knowledge and expertise on health care organizations were priceless.
The contributions of other scholars deserve my deepest gratitude. I am deeply
indebted to Dr. Rohit Pradhan for his expertise on Medicare Cost Report and Area
Resource File. Dr. Pradhan guided me through the data collection, data cleaning, and data
analysis processes. I am also thankful to Mr. Josué Patien Epané for his help in data
collection and data cleaning processes, and for teaching me Statistical Analysis System
(SAS).
The help and support of my colleagues, friends and family merit my sincere
appreciation. I express my heartfelt thanks to Dr. DeLawnia Comer-Hagans, Dr.
Anantachai Panjamapirom, Dr. Gouri Gupte, Dr. Shamly Austin, Mr. Bob and Becka
Montgomery, Mr. Bill and Martha Allen, Mr. Corky and Greta Clark, Ms. Susan Elmore,
and Ms. Carolyn King for being my faithful and unconditional cheer leaders. In addition,
I acknowledge Dr. Comer-Hagan‘s help in editing this dissertation. Last but not least, I
express my sincere gratitude to my mother, brothers and sister for their love and support.

viii
TABLE OF CONTENTS
Page
ABSTRACT………………………………………………………………………...……iii
DEDICTATION………………………………………..……………………………...….v
ACKNOWLEDGMENTS………………………………………………………...…...…vi
TABLE OF CONTENTS……………………………………………………………… viii
LIST OF TABLES……………………………...……………………………………..…xii
LIST OF FIGURE……………………………………….………………………...……xiv
CHAPTER
1 INTRODUCTION……………………………………………………………….….......1
The Ownership Structure of U.S. Hospitals………………………………………….……3
Historical Perspective on Public Hospitals……………………………………….……….6
Public Hospitals Before and During the 19th
Century .............................................6
Public Hospitals During the 20th
Century and Beyond ............................................8
Rationale for the Study…………………….…………………………………………….14
2 REVIEW OF LITERATURE ........................................................................................19
Literature Review……...…………………………………………………………………19
Privatization of public hospitals and other healthcare organizations ....................20
The antecedents of healthcare organizations conversion
from public to for-profit status ..................................................................23
The antecedents of healthcare organizations conversion
from public to not-for-profit status ............................................................25
The consequences of ownership conversion
from public to for-profit status on financial performance. ........................26
The consequences of ownership conversion
from public to not-for-profit status on financial performance. ..................27
Conceptual Framework and Hypotheses……………………………………………...…28

ix
Theoretical Background ........................................................................................ 28
Resource dependence theory. ....................................................................29
The Environment ...................................................................................................35
Environmental munificence .......................................................................36
Environmental dynamism ..........................................................................36
Environmental complexity. ........................................................................37
Financial Performance .......................................................................................... 39
The association between environmental munificence
and financial performance........................................................................ 40
The association between environmental dynamism
and financial performance. ....................................................................…42
The association between environmental complexity
and financial performance. ........................................................................43
The association between organizational size
and financial performance. ........................................................................45
The association between teaching status
and financial performance. ........................................................................46
The association between financial performance
and privatization. .......................................................................................48
The impact of privatization on hospital
financial performance. ...............................................................................49
3 RESEARCH METHODOLOGY…….……………...…………………………………….53
Research Design ....................................................................................................54
Data Sources................................................................................................................................55
Population and Sample ..........................................................................................56
Variables and their Operationalization ..................................................................58
Question 1: What are the organizational and environmental
factors associated with financial distress of public hospitals? ...................58
Question 2. Is financial distress associated with public
hospitals privatization? ............................................................................. 69
Question 3. Does privatization lead to a better financial
performance? ............................................................................................74
Analysis .................................................................................................................77

x
Potentially endogenous variables. .............................................................80
Models ...................................................................................................................80
Models for operating margin. ....................................................................81
Models for total margin. ............................................................................81
4 RESULTS……………...………………………………………………………………86
Results from Research Question 1 .........................................................................86
Results of fixed-effects logistic regressions. .............................................96
Results from Research Question 2 .........................................................................98
Results from Research Question 3 .......................................................................108
Results of hypothesis 7. ...........................................................................118
Results of Hypothesis 8 ...........................................................................123
Conclusion ...............................................................................................130
5 DISCUSSION……………………….………….……………………………………...……………134
Discussion of Findings from Research Question 1 ..............................................134
Findings from Hypothesis 1 .....................................................................135
Findings from Hypothesis 2 .....................................................................136
Findings from Hypothesis 3 .....................................................................136
Findings from Hypothesis 4 .....................................................................137
Findings from Hypothesis 5 .....................................................................137
Discussion of Findings from Research Question 2 ............................................. 140
Discussion of Findings from Research Question 3 ............................................. 142
Managerial and Policy Implications ....................................................................144
Limitations of the Study ......................................................................................147
Directions for Future Research ......................................................................…..148

xi
Conclusion .......................................................................................................... 159
LIST OF REFERENCES .................................................................................................150
APPENDIX A……………………………………………………………………………………….…164
IRB APPROVAL…………………………………………………………………………………...…172

xii
LIST OF TABLES
Table Page
1.1 Trends in Number of Hospitals and Hospital Beds by Ownership Type…………….12
3.1 Number of Hospitals per Year in the Master Data File………………………...........57
3.2 Normalization of Operating Margin………………………….……………………...79
3.3 Normalization of Total Margin………………………………………………………79
3.4 Summary of Variables Conceptual Definitions,
Operational Definitions, References and Data Sources …........................................82
4.1 Descriptive Analysis of all Variables………………………………………………..87
4.2 Independent Samples t-test on Dependent Variable
―Financial Distress‖…………...……………………………………………….……..90
4.3 Cross-tabulation and Pearson Chi-Square Test on
Dependent variable ―Financial Distress‖………………………...…………………..92
4.4 Pearson Correlation Matrix of Independent Variables………………………………93
4.5 Results of Fixed-effects Logistic Regression………………………………………..97
4.6 Descriptive Analysis of all Variables……..……………..……………………….….99
4.7 Independent Samples t-Tests on Dependent Variable Privatization…………….….102
4.8 Chi-square Test on Dependent Variable ―Privatization‖…………………………...103
4.9 Pearson Correlation Matrix Research Question 2…………………………………..104
4.10 Results of Random-effects Logistic Regression with State Fixed-Effects………..107
4.11 Descriptive Statistics on the Operating Margin Data Set…………………………109
4.12 Independent Samples t-Tests on Operating Margin……………………………….111

xiii
4.13 Correlation Matrix of Data Set for Operating Margin…………………………….112
4.14 Descriptive Statistics of total Margin Data………………………………………..114
4.15 Independent Samples t-Tests on Total Margin……………………………………116
4.16 Correlation Matrix Variables for Total Margin Data Set…………………….……117
4.17 Results of Fixed-effects Linear Regression on Operating Margin First
Hypothesis…………………………………………………………………………119
4.18 Results of Fixed-effects Linear Regression on
Total Margin First Hypothesis ………………….……………….…………………120
4.19 Operating Margin by Ownership Type………………...……...…….…………….124
4.20 Total Margin by Ownership Type…………...…………...……………...………..125
4.21 Results of Fixed-Effects Linear Regressions on Operating Margin-
Second Hypothesis…………………………………………………...….………...126
4.22 Results of Fixed-Effects Linear Regression on Total Margin -
Second Hypothesis…………………………………………………………………127
4.23 Summary of Findings from Hypothesis Testing…...……………………………...132
4.24 Summary of Findings for Each Research Question………...……………………..133

xiv
LIST OF FIGURE
Figure Page
1.1 Conceptual Framework………………………………………………………………34

1
CHAPTER 1
INTRODUCTION
In the past few decades there have been significant numbers of hospital ownership
status conversions. Ownership status conversion refers to any transactions that result in
the change of an organization‘s ownership status (Anderson, Allred, & Sloan, 2003;
Goodstein & Boecker, 1991; Hall & Conover, 2006; Needleman, 1999). Such
transactions can be performed either at the interorganizational or organizational level.
Interorganizational transactions resulting in ownership status change include merger,
sale, lease, or joint venture, among others; such transactions involve the transfer of
ownership from one organization to another (Anderson, et al., 2003; Goodstein &
Boecker, 1991; Legnini et al., 1999; Needleman, 1999).
Change in ownership status can also involve a single organization; the
management team or the board of directors purchases the organization‘s assets through a
leveraged buyout (Gray, Smelser, & Baltes, 2001) or the organization directly applies for
ownership conversion with legal authorities, but such transaction is not very common in
healthcare settings (Cutler & Horwitz, 1997; Needleman, 1999). An ownership
conversion is called privatization when it involves the conversion of an organization from
public to either private for-profit or private not-for-profit status (Wessel, 1995).
While hospital ownership conversion has occurred in various ways, from private
not-for-profit (NFP) to private for-profit (FP) or government (Gov), from FP to NFP or
Gov, and from Gov to FP or NFP, conversions from NFP to FP have been the focus of

2
most prior research (Burns, Shah, Frank, & Powell, 2009). Additionally, previous studies
have found that financial distress is the major factor leading to conversion but these
studies did not explore the reasons for financial distress (Amirkhanyan, 2007; Bovbjerg,
Held, & Pauly, 1987; Bovbjerg, Marsteller, & Ullman, 2000; Burns et al., 2009; Legnini
et al., 1999; Sloan, Ostermann, & Conover, 2003; Sloan, Taylor Jr, & Conover, 2000). A
more comprehensive study that investigates both the determinants and outcomes of
public hospitals ownership conversion will help stakeholders to pay close attention to
these factors so as to prevent financial distress and give empirical evidence whether
ownership conversion is the best way to turn the financial situation around. The purpose
of this study is to investigate the antecedents and consequences of the privatization of
non-federal general public hospitals. This study will attempt to answer the following
research questions:
1. What are the organizational and environmental factors associated with
financial distress of public hospitals?
2. Does financial distress precede public hospital privatization?
3. Does privatization lead to better financial performance?
The following three sections will discuss: (1) the ownership structure of U.S. hospitals,
(2) the historical perspective on U.S. public hospitals, (3) the rationale for the study.
3
The Ownership Structure of U.S. Hospitals
Hospitals are categorized by ownership status: government hospitals (Gov),
private not-for-profit hospitals (NFP), and private for-profit or investor-owned hospitals
(FP). Government hospitals are classified into two categories: federal hospitals that are
totally under the control and administration of the federal government such as the
Veterans‘ Affairs; and public hospitals that are under the administration of a city, county,
tax district, or state (Gapenski, 2004). The hospital‘s ownership status determines its
primary mission and sources of funding.
The principal mission of public hospitals is to provide healthcare for the indigent,
the needy and the uninsured and serve the community; they act as the ―provider of last
resort‖ or ―safety net‖ for the community. In addition, public hospitals are expected to
provide expensive and specialized healthcare services that private hospitals would not
deliver. Such services include neonatal intensive care, psychiatric treatments, burn care,
and trauma care. In addition, public hospitals play a major role in providing medical
education and clinical research (Andrulis, 1997; Bovbjerg et al., 1987; Brown, 1983;
Fishman, 1997).
Public hospitals obtain their capital in the form of governmental grants given by
the city, the county, or the state and excess revenue over costs from previous years. These
grants are business, property and personal income taxes collected from residents and
local businesses. While public hospitals are not allowed to raise capital through the sale
of stocks, they are allowed to sell tax-exempt bonds. In addition, public hospitals do not
pay property or corporate income tax and they are not allowed to share excess revenue
over costs among individuals (Gapenski, 2004).

4
Private not-for-profit hospitals are charitable entities under 501 (c) (3)
classification of the Internal Revenue Code. The main purpose of private not-for-profit
hospitals is to serve the community through the provision of quality healthcare, medical
education and research (Gray, 1986). Not-for-profit hospitals raise their capital from tax-
deductible contributions from philanthropists, tax-exempt bonds, and excess revenue over
costs, and governmental grants. As charities, not-for-profit hospitals do not pay property,
sales and corporate income taxes. In return, they are expected to provide charity care,
uncompensated care, and other community benefits such as the provision of preventive
care and healthcare education to the community. Even if not-for-profit hospitals do not
seek profit, they need to maintain good financial status to fulfill their mission (Gapenski,
2004).
Like public hospitals, not-for-profit hospitals are not authorized to raise capital
from the sale of stock and they are not allowed to share excess revenue over costs among
contributors. Excess revenue over costs should be reinvested in the hospital.
Furthermore, the proceeds from the sale of the hospital should not be distributed among
donors; they should be invested in a foundation that will serve the community. Not-for-
profit hospitals are allowed to pursue growth strategies (Clark, 1980; Gray, 1997; Gray,
1986; Gray, 1986; Marsteller, Bovbjerg, & Nichols, 1998).
For-profit hospitals are owned by shareholders. Their primary purpose is to
maximize shareholders wealth. For-profit hospitals raise capital by selling stocks to
investors, issuing bonds, and reinvesting retained earnings in the hospital‘s account. In
return, they pay property, sales, and income tax. For-profit hospitals are allowed to share
dividends among shareholders and shareholders have the right to divide the proceeds

5
from the sale of the hospitals (Gray, 1997; Gray, 1986; Marsteller, et al., 1998; Gapenski,
2004).
Regardless of ownership type, financial capital is one of the key resources of
every hospital. Hospitals require financial capital to support their operations, growth, and
survival. In addition to capital, hospitals also require other resources such as human
resources, medical equipments and technology, knowledge and reliable information to
adequately deliver quality healthcare. Lack of financial and other resources might induce
hospitals to engage in some strategic moves such as merger, sale, joint venture,
diversification, or ownership conversion. Such strategic change might help hospitals find
an alternative supply of resources and better access to knowledge and technology.
Comparing the three types of ownership, public hospitals carry the heaviest
burden in serving the community (Walker, 2005) and yet they have the least flexibility
regarding the ability to raise capital; they totally rely on the availability of funds from
government entities. However, the availability of funds depends on many factors such as
the capability of the residents and businesses to pay property and income taxes which is
contingent on the economic situation. During economic prosperity, government entities
might have more funds to give to public hospitals, but during an economic crisis, such
funds may deplete very quickly. Besides, the decision of the government to distribute tax
income among other public entities such as schools, public transportation, the post office,
and the armed forces might reduce the amount of capital granted to public hospitals
(Andrulis, 1997; Bovbjerg et al., 1987; Brown, 1983; Sataline, 2010).
Furthermore, unlike private hospitals, public hospital managers do not have the
freedom and the flexibility to decide and implement strategic change that would improve
6
the hospital‘s operation and enhance their financial situation. Public hospitals generally
operate under heavy bureaucracy and burdensome political pressure; politicians have the
power to decide on the strategic direction public hospitals should pursue (Siegel, 1996).
Regardless, all three types of hospitals have contributed to health care delivery in the
U.S; they all have their weaknesses and strengths. The next section presents a historical
perspective on public hospitals.
Historical Perspective on Public Hospitals
This section is divided into two sections: (1) public hospitals before and during
the 19th
century and (2) public hospitals during the 20th
century and beyond.
Public Hospitals Before and During the 19th
Century
The majority of public hospitals emerged from almshouses, but some were built
from scratch (Dowling, 1982). Almshouses were shelters for those in need of social
support such as the homeless, the drunkard, the mentally impaired, the outlaws, as well as
those with chronic illnesses. The provision of social, mental and physical support for the
needy was a practice from Great Britain that the immigrants wanted to carry on in the US
(Friedman, 1987). Almshouses were charitable organizations that were financially
supported by the local government; they were not-for-profit (Shi & Singh, 2004).
Since almshouses opened their doors to everyone in need without distinction, they
were not effective in providing the specific needs of their residents. Therefore,
specialized institutions such as orphanages, mental asylums and jails were established to
take care of people with specific social needs. Those with medical conditions remained in
7
the almshouse. Due to the stigma associated with the almshouse as the shelter for the
lowest class of the population, only the poor-sick stayed in the almshouses (Friedman,
1987). Those who could afford to pay for physicians preferred to be treated at home
(Starr, 1982). Thus, almshouses implicitly became the hospitals for the destitute.
Philadelphia General Hospital, founded in 1732, was the first public hospital that
emerged from almshouse status. It expanded, became successful, and acquired a
worldwide reputation in treating the sick as well as providing medical education and
research (Rosenberg, 1982). In 1736, New York City Almshouse morphed into Bellevue
Hospital and Charity Hospital in New Orleans was founded the same year (Rosenberg,
1982; NAPH, 2011). Due to the rapid growth of cities, most of the first public hospitals
were built in cities.
The growth of the population, the improvement in the quality of care, the progress
in medical education, and the professionalization of nursing served as catalysts to the
growth of public hospitals. Hospital use intensified due to the discovery of anesthesia by
William Thomas Green Morton in 1846, the discovery of antisepsis by Sir Joseph Lister
in 1867, and the discovery of x-rays by Wilhelm Rontgen in 1896 (McEachern, 1936;
Starr, 1982). The number of beds of all public hospitals increased from 12,000 in 1873 to
25,000 in 1889 (Dowling, 1982). Public hospitals became the largest hospitals relative to
the private ones and they totally relied on public funding. While public hospitals were
involved in training physicians and nurses they kept their primary mission which was
treating the very poor-sick (Starr, 1982). That mission stained the image of public
hospitals as they became undesirable for those who could afford better and more
expensive care (Dowling, 1982).
8
Public Hospitals During the 20th
Century and Beyond
The 20th
century experienced the fastest growth in hospital industry. This was
primarily due to population growth, increased confidence in hospital services, the
expansion of nursing and medical education and the professionalization of health
administration.
Despite this rapid expansion, the government felt the need to build more hospitals
firstly to care for the wounded soldiers of World War II and to provide additional care for
the communities. The Hospital Survey and Construction Act called the ―Hill-Burton Act‖
was signed in 1946 to authorize the issue of Federal grants, loans and loan guarantees for
hospital construction and health centers at states and community levels. Only public and
not-for-profit hospitals qualified for the Hill-Burton funds and the recipients of the funds
were expected to provide a certain amount of uncompensated care for 20 years
(Department of Health and Human Services, 1992). Since the Hill- Burton Act required
the provision of a certain amount of uncompensated care, for-profit hospitals did not
qualify for the program because the provision of uncompensated care was not the primary
purpose of for-profit hospitals.
Thus, the funding from the Hill-Burton Act enhanced the growth of public
hospitals even more. The recipients of the Hill-Burton funds were more competitive
relative to for-profit hospitals; they attracted more patients because they could offer
services at lower prices or free of charge for those who could not pay (Starr, 1982). The
number of public hospitals grew from 785 in 1946 to 1453 in 1965 (Friedman, 1987).
9
During the 20th century, the federal government did not only build more hospitals
and invest in healthcare education and research, but also provided access to healthcare to
the elderly and those who could not afford to pay. To provide better access to healthcare
for the retired and low income individuals, the government adopted Medicare and
Medicaid programs in 1965. The funding of these two programs, based on fee-for-
service, increased health care utilization and triggered escalating healthcare expenditures
(Starr, 1982). Under a fee-for-service plan, health care providers were reimbursed based
on the amount of services provided. Thus the plan encouraged providers to give as much
clinical care possible as to enhance revenue. In addition to the concern over raising
healthcare expenditures, there were growing concerns over the quality of care,
inefficiency, lack of access to care in rural areas, overcapacity, oversupply of physicians
and overspecialization (Starr, 1982). Consequently, in 1970, the government drew the
country‘s attention to the ―crisis in healthcare‖.
Among all hospitals, public hospitals were the most entrenched in crisis relative
to private hospitals as they were burdened with politics, depleted revenues and shrinking
government funding. They could not afford to renovate their buildings and were not able
to purchase updated medical equipment (Dowling, 1982).
Both the federal and state governments adopted some measures to reverse the
situation. Such measures included the Certificate of Needs (CON) laws and the
implementation of Medicare Prospective Payment System (PPS) in 1983. CON laws
provide legislation that individual states can adopt to restrict the building of new
constructions and curb overcapacity. States that adopted CON laws required health care

10
organizations to apply for an authorization to build or expand a facility. New York State
adopted the first CON law in 1964 (Stevens, 1989).
Medicare PPS was enacted by the Tax Equity and Fiscal Responsibility Act
(TEFRA) of 1982. With this law, the federal government took the initiative to impose
rates on services rendered to Medicare enrollees based on the Diagnosis-Related Groups
(DRGs) system. This system of payment combined all the services needed to treat a
certain disease; Medicare set the amount it paid for that particular bundle of services.
Medicare enrollees that belong to the same diagnosis group are charged the same rate.
Thus, a hospital benefits if its costs are below the PPS rate; it operates at a loss if its costs
are above the PPS rate (Shi & Singh, 2004).
In addition, the healthcare crisis has opened the opportunity to the emergence of
managed care organizations such as health maintenance organizations (HMO) as major
players in the healthcare industry. In order to control cost and utilization, HMOs provide
health insurance and contract with hospitals for the health care delivery of their enrollees.
Through tight control of consumption of specialized services by the systematic use of
primary care providers, health care utilization review, and strong negotiation on health
services costs, HMOs were successful in controlling healthcare expenditures during the
1980s.
Public hospitals have faced fierce competition with private hospitals. Private
hospitals are more attractive to the higher income population; as a result, the majority of
patients that public hospitals serve are low income people, the uninsured and the
underinsured. While private hospitals are more desirable than public hospitals, they

11
cannot provide all the services that public hospitals offer such as specialized tertiary
services including trauma care, HIV/AIDS treatments, and substance abuse rehabilitation
(Dowling, 1982). Furthermore, private hospitals prefer ―dumping‖ their uninsured
patients on public hospitals rather than treating them (Friedman, 1987). Thus, public
hospitals have coined themselves as ―safety net hospitals‖ as they serve the most
vulnerable population and provide critical services for critical needs (NAHP, 2011).
Since public hospitals have operated in an environment with fiscal pressure and
fierce competition coupled with an increasing number of uninsured and underinsured,
most of them have been in financial distress. Some of them could not survive and were
closed and some converted into private status. For example, the first public hospital,
Philadelphia General Hospital closed in 1976. A decreasing trend in the number of public
hospitals was noticed in the mid-1980s. The number of public hospitals decreased by
14 % between 1985 and 1995 (Legnini et al., 1999). Between 1980 and 2007 a total of
686 public hospitals converted into private status (Burns et al., 2009; Needleman,
Chollet, & Lamphere, 1997; Thorpe, Florence, & Sieber, 2000). Table 1.1 illustrates the
trends in the numbers of hospitals and hospital beds by ownership status from 1975 to
2008 (Department of Health and Human Services, 2011).

12
Table 1.1
Trends in Number of Hospitals and Hospital Beds by Ownership Type
Number of hospitals
and number of beds
by ownership type
1975 1980 1990 1995 2000 2006 2007 2008
Number of Hospitals
All hospitals 7,156 6,965 6,649 6,291 5,810 5,747 5,708 5,815
Nonfederal 1 6,774 6,606 6,312 5,992 5,565 5,526 5,495 5,602
Federal 382 359 337 299 245 221 213 213
Community2 5,875 5,830 5,384 5,194 4,915 4,927 4,897 5,010
Not-for-profit 3,339 3,322 3,191 3,092 3,003 2,919 2,913 2,923
For profit 775 730 749 752 749 889 873 982
State-Local
government 1,761 1,778 1,444 1,350 1,163 1,119 1,111 1,105
Number of Beds
All hospitals 1,465,828 1,364,516 1,213,327 1,080,061 983,628 947,412 945,199 9,5045
Nonfederal1 1,333,882 1,247,188 1,115,072 1,003,522 930,561 900,721 899,455 905053
Federal2 131,946 117,328 98,255 77,079 53,067 46,691 45,744 45,992
Community 941,844 988,387 927,360 872,736 823,560 802,658 800,892 808,069
Not-for-profit 658,195 692,459 656,755 609,729 582,988 559,216 553,748 556,651
For-Profit 73,495 87,033 101,377 105,737 109,883 115,337 115,742 120,887
State-Local
government 210,154 208,895 169,228 157,270 130,689 128,105 131,402 130,531
Source: Health, United States, 2010, page 372 (DHHS, 2011) 1 The category of nonfederal hospitals comprises psychiatric, tuberculosis and other respiratory diseases hospitals, and
long-term and short-term general and other special hospitals 2 Community hospitals are nonfederal short-term general and special hospitals whose facilities and services are
available to the public.
The information in Table 1.1 does not explicitly show how many hospitals
merged, got acquired, changed ownership or closed, but the numbers suggest one of these
strategies (Weil, 2011). For example, the decrease in the number of all hospitals from
7,156 in 1975 to 5,815 in 2008 suggests either hospital closures or mergers. The number
of all federal, nonfederal and community hospitals decreased between 1975 and 2008
except for the number of for-profit hospitals which increased from 775 (13% of all
community hospitals) to 982 (20%) between 1975 and 2008. This increase suggests the
growth of for-profit hospitals either through ownership change or entry of start-up
13
hospitals. The number of state-local government hospitals declined from 1,761 (30% of
all community hospitals) to 1,105 (22%) between the same period of time (DHHS, 2011).
Additionally, the capacity of hospitals measured as the number of beds also
demonstrates a decreasing trend for all federal, nonfederal and community hospitals
except for for-profit hospitals, which increased from 73,495 beds (8% of all community
hospital beds) to 120,887 beds (15%) between 1975 and 2008. The number of beds
owned by state-local government community hospitals decreased from 210,145 (22% of
all community hospital beds) to 130,531 (16%).
The history of public hospitals, has demonstrated that environmental factors such
as technology, war, population growth, government regulations and funding, economy,
advance in science, and competition have played a major role in the evolution of public
hospitals.
Government regulations can impose rules on but also allow flexibility for
healthcare organizations. Freedom of ownership status conversion is one of the
flexibilities granted to health care organizations. This freedom has permitted
organizations to solve organizational problems, pursue new opportunities, access
resources, or survive in a dynamic and competitive healthcare environment. The next
section discusses the rationale for the study.

14
Rationale for the Study
The purpose of this study is to investigate the impact of organizational and
environmental factors on public hospitals‘ financial distress, the impact of distress on
public hospitals‘ privatization, and the effect of public hospitals‘ privatization on
financial performance based on the resource dependence theory. This study focuses on
community public hospitals and does not include federal public hospitals like Veterans
Affairs. Since federal public hospitals operate in a different environment with special
rules and regulations and serve special populations such as the military, including them in
the study might bias the results.
The findings from the review of hospital ownership conversion literature revealed
that despite the different types of ownership conversion, the majority of the literature
studied hospital conversion from not-for-profit to for profit status or vice-versa. More
precisely, the number of hospital conversions from public ownership to private-not-for-
profit status slightly exceeded the number of hospital conversions from not-for-profit to
for-profit status between 1991 and 1997 and yet empirical studies on privatization of
public hospitals have been scarce (Burns et al., 2009). Nevertheless, the privatization of
public hospitals deserves greater attention given their major role in the life of the
community and the whole society.
Studying public hospitals is timely given their major role as safety net providers
to the community. The responsibility of public hospitals in providing care to the needy is
mostly needed during economic downturn when many people lose their jobs and
consequently their health insurance coverage and yet, public hospital funding decreases
the most during economic crisis. As of 2009, there were 51 million uninsured individuals

15
in U.S., representing a 10% increase from 2008 (U.S. Census Bureau, 2009). The
uninsured have imposed an additional strain in the operating environment of public
hospitals. Public hospitals members of the National Association of Public Hospitals and
Health Systems (NAPH), which represent 2% of all acute care hospitals, reported that
31% of their outpatient visits and 18% of their inpatient services were delivered to the
uninsured (NPHHI, 2009). More precisely, NAPH members provided 27% and 19% of
their total inpatient and outpatient services ($115 billion) to Medicaid patients and the
uninsured, respectively (NPHHI, 2009). Furthermore, 16% of their operating costs were
uncompensated relative to 6% of costs for all hospitals in the U.S.; in 2009, NAPH
members delivered 20% of all uncompensated care nationwide (NPHHI, 2009).
Given their public status, public hospitals are also expected to deliver expensive
and unprofitable tertiary services that private hospitals do not provide (Anderson,
Boumbulian & Pickens, 2004). The NAPH reported that specialty care provided by its
members represented 56% of all visits (NPHHI, 2009). Besides, public hospitals offer
substantial medical education and clinical research (Andrulis, 1997; Bovbjerg et al.,
1987; Brown, 1983; Fishman, 1997). While NAPH members represent only 2% of all
acute care hospitals, they provide medical training to more than 19,000 full-time
equivalent (FTE) medical and dental residents, representing 23% of all residents in acute
facilities (NPHHI, 2009).They also offer emergency relief in case of man-made or natural
disasters .
Despite the fact that public hospitals hold an important role in healthcare delivery,
they have faced the most challenging environment. Public hospitals have been struggling
to stay competitive while trying to overcome financial difficulties due to reduced

16
government funding and fiscal constraints, an increasing number of uninsured patients,
escalating healthcare costs, and pressure for efficiency. Moreover, public hospitals have
had a hard time competing for Medicare managed care contracts (Brown, 1983; Sataline,
2010; Siegel, 1996).
In summary, public hospitals have taken on the responsibilities that private
hospitals deem too costly and unprofitable to undertake (Andrulis, 1997). Therefore, lack
of access to adequate capital and expertise, intensifying competition, decreasing
operating income, and increasing expenditures and social burden have deeply affected the
financial situation of many public hospitals and as a result that they have experienced
financial distress (Bazzoli & Andes, 1995; Falik, 1983). Conceptually, a hospital is in
financial distress when it experiences a severe financial crisis that leads to radical
changes such as a merger, a reduction in the number of services, a diversification into
services unrelated to previous ones, an ownership conversion, a bankruptcy declaration
(Langabeer, 2006; Trussel & Patrick, 2010). Public hospitals have adopted these kinds of
survival strategies or exited the market (Bazzoli & Andes, 1995; Brown, 1983; Sataline,
2010).
Statistics have shown the declining trend in the number of public hospitals due to
either closure or privatization as demonstrated in Table 1. Privatization has been
considered the alternative solution to closure. Keeping the hospital open, under private
ownership, might preserve some access to healthcare for the community, ensure some
continuation of medical education and research, safeguard the access to emergency care
in case of national disaster and preserve some jobs. Privatization might turn the hospital
around and boost its financial health. Closure of a public hospital might result in a loss of

17
community benefits. Given the importance of public hospitals in healthcare delivery and
education, it is worth providing empirical evidence on why public hospitals privatize and
whether privatization has improved hospitals‘ outcomes (Sebelius, Frieden, & Sondik,
2010).
While previous studies on public hospitals privatization suggested poor financial
performance as the major factor leading to privatization, they did not investigate the
factors leading to poor financial performance. This study will investigate the
determinants of financial distress, then explore whether financial distress precedes
privatization and finally, examine whether privatization results in enhanced financial
condition.
This study fills the gap in the hospital ownership conversion literature by
empirically investigating both the antecedents and outcomes of public hospitals‘
privatization. Moreover, this study contributes to research based on the following points.
First, this study is more comprehensive compared to previous ones as it is based on a
national sample and covers thirteen years of data from 1997 to 2009. Second, it
contributes to knowledge by providing empirical evidence on three associations: the
impact of organizational and environmental factors on public hospitals financial distress,
the consequences of financial distress on public ownership status and the effects of
privatization on financial performance. A longitudinal study that follows the same
hospital over a certain number of years permits causal inference with respect to the
research questions that this study attempts to answer.
18
Third, studying public hospitals as a separate entity helps find more reliable and
helpful results for policy making. Prior studies on ownership conversion combined both
public hospitals and not-for profit hospitals into one category (Picone, Chou & Sloan,
2002; Shen, 2002, 2003; Sloan, 2002); the results from such studies might be biased since
public hospitals have a different operating environment than private not-for-profit
hospitals such as lack of access to private funding, heavy political constraints and
bureaucracy, lack of managerial flexibility and a heavier social burden.
Fourth, providing evidence on the outcomes of privatization and knowing whether
conversion from public to private for-profit status or from public to private not-for-profit
status results in a better outcome can help stakeholders make sound decisions based on
scientific evidence. Sixth, this is the first empirical study on public hospitals‘
privatization that applies a theoretical framework. Applying the resource dependence
theory will add value to extant literature as the majority of prior studies on ownership
conversion did not use theories; they did not examine the logical associations between the
main variables of interest. Theoretical frameworks are important because they serve as a
guide. They help researchers include other concepts and variables that might have been
overlooked. Moreover, theories are valuable tools for scientific research; they assist
researchers in logically and systematically explaining and predicting a phenomenon.
Furthermore, a study that includes a theoretical framework contributes to science as the
study tests the predicting strength of the theory (Hunt, 2002).

19
CHAPTER 2
REVIEW OF LITERATURE
This chapter contains two major sections: Section 1 includes the literature review
and section 2 includes the conceptual framework and hypotheses.
Literature Review
This section presents a review of the empirical studies on the antecedents and
consequences of ownership conversion of public hospitals. The search of the extant
literature was conducted by entering the phrases: ―ownership conversion‖, ―determinants
of ownership conversion‖, ―privatization of public hospitals‖, ―conversion of public
hospitals into private hospitals‖, ―consequences of privatization‖, and ―privatization‖ in
the following data bases: ABI Inform, JSTOR, Pubmed, Science Direct, Springer Link,
Web of Knowledge, Wiley Interscience, Business Source Premier, and Google Scholar,
respectively. Additionally, the reference list at the back of each article was checked
whether previously published relevant articles were cited.
In most cases, an organization changes ownership status through a transaction
with another organization of different ownership type. Such transactions include merger,
sale, lease, or joint venture (Anderson, Allred, & Sloan, 2003; Goodstein & Boecker,
1991; Hall & Conover, 2006; Needleman, 1999). An organization can directly change its

20
ownership status by filling out legal documents; a conversion that involves a single
organization rarely occurs in the healthcare setting (Cutler & Horwitz, 1997; Needleman,
1999). Public hospitals conversion into private not-for-profit or private for-profit status is
also called privatization of public hospitals (Legnini et al., 1999).
Ownership conversion is a dynamic phenomenon; a hospital might change
ownership status more than once in its lifetime (Burns et al., 2009; Cutler & Horwitz,
2000). Some healthcare organizations other than public hospitals such as public nursing
homes, have converted into private for-profit or private not-for-profit status
(Amirkhanyan, 2008; Amirkhanyan, 2007).
This literature review has four major sections: (1) the antecedents of public
healthcare organizations conversion into private for-profit status, (2) the antecedents of
public healthcare organizations conversion into private not-for-profit status, (3) the
consequences of public healthcare organizations conversions into private for-profit status
on financial performance, (4) the consequences of public healthcare organization
conversions into private not-for-profit status on financial performance.
Privatization of public hospitals and other healthcare organizations
As discussed in the previous chapter, public hospitals have been coined as the
―providers of last resort‖ or ―safety net hospitals‖ (Andrulis, 1997; Bovbjerg et al., 1987).
Public hospitals are mandated to provide healthcare services to everyone regardless of
health insurance status or ability to pay (Anderson, Boumbulian & Pickens, 2004) and yet
the expectations on public hospitals have been higher than that of private hospitals.

21
Public hospitals have been required to provide more charity care than private hospitals
and yet the funding from local or state government has diminished; they have lost
Medicaid patients to private hospitals and have had an increasing number of uninsured
and underinsured patients (Legnini et al., 1999). Public hospitals have been the providers
of expensive and tertiary services that private hospitals would not deliver. In addition,
public hospitals have played a major role in the provision of medical education. Medical
education enables hospitals to provide highly specialized care. While private hospitals
have also provided medical education, public teaching hospitals have been the major
providers of such highly specialized care freely to those unable to pay (Andrulis, 1997;
Bovbjerg, et al., 1987; Brown, 1983, Legnini et al., 1999). Moreover, public hospitals
have not been able to successfully compete for managed care contracts and they have no
freedom to raise capital, make major employee recruitment decision, and initiate
important strategic decisions to turn the financial performance of the hospital around.
All these factors have contributed to the financial crisis that most public hospitals
have been facing (Brown, 1983; Sataline, 2010). Consequently, public hospitals have
been motivated to change ownership status for financial stability and access to capital,
better patient mix, higher efficiency, and freedom from politics and public constraints.
Additionally, a hospital with budget deficit may change ownership status because the
local or state government cannot afford to financially support it anymore; therefore, it
becomes a financial burden to the community. Becoming private will set a public hospital
free from relying on tax income, which dramatically depletes during an economic crisis.
Becoming private also removes the public expectation of serving a large percentage of
low income population and providing costly tertiary services. Accordingly, handing the
22
operation of the hospital over to private entities through sale or joint ventures would
financially and fiscally relieve the community from social and fiscal burden (Burns et al.,
2009; Legnini et al., 1999; Sloan, Taylor Jr, & Conover, 2000; Needleman et al., 1997).
Furthermore, privatization has reflected the trend of public entities handing the
task of serving the public over to private entities (Sloan, et al., 2000). On the other hand,
privatization has been one of the long-term strategies for survival of public hospitals.
Likewise, privatization has also occurred in the nursing home industry (Amirkhanyan,
2007; Amirkhanyan, 2008).
The proponents of privatization of public hospitals argued that non-federal public
hospitals are the least efficient compared to private hospitals (Burgess & Wilson, 1996;
Coyne, Richards, Short, Shultz & Singh, 2009). Therefore, privatization helps hospitals
to be more efficient (Desai, Lukas, & Young, 2000) and save money (Bovbjerg et al.,
2000). Besides, privatization relieves the government from fiscal pressure and it enhances
tax revenue, specifically for privatization into for-profit status since for-profit hospitals
pay property and corporate income taxes (Gapenski, 2004). Moreover, privatization
releases public hospitals from the grip of politics and bureaucracy; and it offers hospitals
more freedom and flexibility in decision making (Bovbjerg, et al., 2000; Siegel, 1996).
Additionally, privatization offers hospitals better access to capital which may
result in the acquisition of updated technology, recruitment of capable managers and
clinical staff and restoration of infrastructure (Burgess & Wilson, 1996; Desai et al.,
2000; Siegel, 1996; Wessel, 1995), and improved healthcare quality (Bovbjerg, et al.,
2000). Some people argued that, in addition to public hospitals, private not-for-profit
hospitals have also acted as safety net providers for the community. Therefore,

23
privatizing public hospitals into not-for-profit hospitals will not alter the provision of
uncompensated care (Bovbjerg et al., 2000).
The opponents of privatization are concerned about the possible loss of access to
care for the indigent as the converted hospitals might not be committed to serving the
poor anymore; research has demonstrated that privatization decreased the level of
uncompensated care delivered to the needy (Thorpe et al., 2000; Desai et al., 2000).They
argued that only public hospitals are committed to the genuine ―open door‖ policy that
unconditionally ensures access to good care for everyone (Bovbjerg, et al., 2000; Desai,
et al., 2000). Conversion of public hospitals into for-profit status has raised concern that
the converted hospital will shut down expensive services and might eventually close the
hospital if it does not exhibit sound financial performance (Sataline, 2010).
The antecedents of healthcare organizations conversion from public to for-
profit status. To my knowledge, one quantitative study (Sloan et. al, 2003) and four case
studies investigated the antecedents of hospital ownership conversion from public to for-
profits status ( Bovbjerg et al., 2000; Burns et al., 2009; Legnini et al., 1999; Sloan, et al.,
2000) and another quantitative study examined the antecedents of nursing homes
privatization (Amirkhanyan, 2007). Sloan et al. (2003) combined public hospitals and
not-for-profit hospitals in one category and explored the antecedents of conversions as
well as mergers and closures; Amirkhanyan (2007) did not distinguish between
conversion from public to for-profit status and conversion from public to not-for-profit
status. Both the studies on hospitals and nursing homes demonstrated that some
environmental factors and organizational factors influenced this type of conversion.

24
The environmental factors that were associated with hospital conversion from not-
for-profit or public status into for-profit status included: low percentage of elderly people
in the population, high competition among hospitals, lower unemployment rate, high
percentage of HMO enrollment, and low per capita income (Sloan, et al., 2003). Higher
unemployment rate was associated with higher probability of closure (Sloan, et al., 2003).
The environmental factors that significantly affected public nursing homes conversion
into for-profit status included: low percentage of elderly people in the population, high
competition among nursing homes, high number of privatized nursing home facilities in
the county and fewer number of nursing homes owned by counties within the state
(Amirkhanyan, 2007).
The organizational factors that significantly affected ownership status were
financial condition, capacity and utilization. Low operating margin and high debt-to-
asset ratio increased the probability of not-for-profit and public hospital conversion into
for-profit status (Sloan, et al., 2003). Furthermore, the case studies on conversion of
public hospitals into for-profit status suggested current financial distress or anticipated
financial crisis, operating inefficiency, changing healthcare environment that has resulted
in higher competition for managed care contracts, decrease in Medicare and Medicaid
reimbursement, lack of access to capital needed for infrastructure renovation,
unwillingness of political leaders to increase tax rates for higher tax revenue that would
financially support public hospitals, inadequate reimbursement system, cumbersome
purchasing and recruitment processes, lack of flexibility in adopting competitive
strategies, and prevention of hospital closure, as the major reasons for hospital
privatization (Bovbjerg et al., 2000; Burns et al., 2009; Legnini et al., 1999; Sloan et al.,

25
2000). Besides, the study on nursing homes found that nursing homes with lower
occupancy rate, fewer beds, higher number of nursing staff hours per resident days, and
older infrastructure, were more likely to privatize and facilities affiliated with hospitals
were less likely to privatize (Amirkhanyan, 2007).
While Sloan et al. (2003) included financial variables such as operating margin
and debt-to-capitalization ratio as factors leading to ownership conversion; they did not
use the Altman z-score method to measure hospitals‘ financial conditions. A hospital
might have high operating margin and high debt-to-capitalization ratio at the same time;
it is difficult to determine whether the hospital is in good or bad financial condition. The
Altman Z-score that combines four financial ratios into one discriminant equation is a
better measure of financial condition than operating margin and debt-to-asset ratio as it
has a cut-off score that determines whether the organization is in financial distress or not.
The antecedents of healthcare organizations conversion from public to not-
for-profit status. The choice of not-for-profit instead of for-profit status reflects the
willingness of the public hospital to pursue its current mission which is to provide quality
care and serve the community without a profit motive. This choice might also suggest
that public hospitals avoid the takeover of a for-profit hospital. A for-profit buyer might
be tempted to close the facility to reduce competition among its own hospitals located in
the public hospital‘s area (Burns et al., 2009). Quantitative empirical studies of the
antecedents of ownership conversion from public to not-for-profit status have been
scarce.

26
Most of the reasons for converting from public to not-for-profit status, found in
case studies, were quite similar to the reasons for converting from public to for-profit
status including financial hardships and operating losses, increased competition and
inability to compete for managed care and other third-party payers contracts,
apprehension of funding reduction from Medicaid reimbursement and disproportionate
share hospital funding, delayed reimbursement, need for access to capital, freedom for
public governance constraints , and strong pressure for tax relief ( Bovbjerg, et al., 2000;
Burns et al., 2009; Legnini et al., 1999; Sloan et al., 2003; Sloan et al., 2000).
The consequences of ownership conversion from public to for-profit status on
financial performance. Four studies investigated the consequences of conversion from
public to for-profit status on hospitals financial performance (Thorpe et al., 2000; Shen
2003; Picone et al., 2002; Sloan, Taylor & Conover, 2000). The first three studies used
panel data of national samples of acute care hospitals and investigated more than one type
of ownership conversions (Thorpe et al., 2000; Shen 2003; Picone et al., 2002) and the
last study of Sloan, Taylor and Conover (2000) was a case study of 10 hospitals located
in Tennessee, North Carolina and South Carolina. Thorpe, Florence and Sieber (2000)
isolated public hospitals as a single entity; (Shen 2003 & Picone et al., 2002) combined
public hospitals and private not-for-profit hospitals into one category. The effects of
conversion from public to for-profit status on total margin and profit margin were mixed;
there was no significant change in total margin after conversion (Thorpe et al., 2000), but
Shen (2003) and Picone et al., (2002) found that total margin and operating margin
increased after conversion, respectively.

27
The findings regarding the effect of conversion on operating costs were
consistent; cost per admission decreased (Thorpe et al., 2000) and operating costs per
discharge decreased (Shen, 2003). Sloan, Taylor and Conover (2000) explored the
impact of conversion on internal rate of return relative and cost of capital and found
mixed results. One hospital‘s internal rate of return exceeded the cost of capital by 3.14
percentage points over 30 years and another hospital‘s rate of return was lower than the
costs of capital after conversion.
The consequences of ownership conversion from public to not-for-profit
status on financial performance. Three studies investigated the impact of conversion
from public to not-for-profit status on financial performance in terms of operating cost,
efficiency and internal rate of return (Shen, 2003; Sloan, Taylor Jr, & Conover, 2000;
Anonymous). Similar to the conversion from public to for-profit hospitals, operating
costs declined after conversion from public to not-for-profit status (Shen, 2003). The
study on the impact of conversion on operating efficiency found that efficiency was
enhanced after conversion (Anonymous). The case study that examined the impact of
conversion on internal rate of return found that one public hospital that converted into
not-for-profit status posted 253% internal rate of return relative to 4.71% cost of capital
after conversion(Sloan, Taylor Jr, & Conover, 2000).
The paucity of empirical studies on privatization of healthcare organizations and
mixed results has left a gap in the literature. This gap is evidenced by the lack of
empirical studies on the antecedents of public hospitals conversion into not-for-profit

28
status. Additionally, only one empirical study investigated the antecedents of public
hospitals‘ conversion into for-profit status and one single study explored the antecedents
of privatization of nursing homes. Overall, poor financial performance and increased
competition were found to be the major factors leading to privatization and privatization
resulted in improved financial performance and enhanced efficiency.
As stated earlier, these studies have some limitations as they did not apply some
theoretical frameworks; as a result, they omitted key environmental variables such as
excess capacity, number of active physicians in the county, and variables that measure
the level of environmental dynamism; these variables can affects organizational financial
performance. This study addresses these limitations. Table 2 in Appendix A presents the
summary of the methods and variables of the studies reviewed in this chapter.
Conceptual Framework and Hypotheses
Theoretical Background
As previously mentioned, the healthcare environment has shaped the healthcare
system in the U.S. Since the purpose of this study is to investigate the impact of
organizational and environmental factors on public hospitals‘ financial distress, the
impact of financial distress on public hospitals‘ privatization, and the effect of
privatization on financial performance, applying an organizational theory that takes the
environment into consideration is deemed appropriate for this study. The resource
dependence theory is one of the organizational theories that consider the environment as
a major determinant of an organization‘s strategic behavior. The following section

29
discusses the resource dependence theory and how it has been applied in previous
empirical studies.
Resource dependence theory. Every organization needs resources to fulfill its
vision, complete its mission and reach its goals. An organization has great challenges to
stay competitive if it does not possess adequate and sufficient resources. The resource
dependence theory (RDT) posits that ―the key to organizational survival is the ability to
acquire and maintain resources‖ (Pfeffer & Salancik, 1978, p.2). Therefore, resources are
crucial for the organization‘s life and yet they are scarce and not equally distributed
across organizations. Resource scarcity imposes constraints to the organizations (Aldrich
& Pfeffer, 1976). Constraints prevent organizations from reaching their objectives.
Consequently, organizations compete to acquire these resources.
Resources are viewed as the inputs that organizations need to produce outputs
and the environment refers to the ―organization‘s source of inputs and sink of outputs‖
(Pennings & Tripathi, 1978, p.172). In other words, the focal organization‘s environment
includes other entities from which it acquires resources and to which it sells products and
services. This definition implies that organizations are neither self-sufficient nor self-
reliant; they cannot acquire all the resources they need from within and they cannot
consume their own products and services (Stearns, Hoffman, & Heide, 1987). However,
the continuous availability of resources is uncertain. Uncertainty is one of the
characteristics of the environment and it refers to the fluctuation of resource availability
and the magnitude of challenges the organization has to face to acquire key resources

30
(Ulrich & Barney, 1984). Thus, scarcity of resources, combined with their uncertain
supply, makes resource acquisition a critical element to organizational survival.
An organization depends on other organizations to ensure continuous exchange of
resources. However, dependence on other organizations for resources implies lack of
independence and lack of power; those who possess resources have power over those
who do not have them (Galaskiewicz, 1985; Pfeffer, 2005; Pfeffer & Salancik, 1978).
The level of dependence on resources depends on how widely available and how
important the resource is to the organization (Jacobs, 1974). Accordingly, dependence is
defined as ―the product of the importance of a given input or output of the organization
and the extent to which it is controlled by a relatively few organizations‖ (Pfeffer &
Salancik, 1978, p.51). More specifically, an organization‘s dependence on a resource is
not critical to its survival unless it is a key resource and only a few suppliers possess it.
For example, even if physicians are important to a hospital, the hospital‘s dependence on
physicians is not that crucial if the hospital can hire physicians from many medical
schools and other hospitals. And if only one organization supplies magnetic resonance
imaging devices (MRI) but the hospital prefers to use computer tomography scans (CT
scan), then the hospital‘s dependence on MRI equipment is not imperative to the
hospital‘s survival.
Since an organization‘s possession and control of resources implies power,
organizations have to adopt various strategic moves to acquire and control resources
(Ulrich & Barney, 1984). Mergers and acquisitions, vertical or horizontal integration,
establishment of interorganizational coalitions, differentiations, and recruitment of board
members who can facilitate access to resources, are among the various strategic moves
31
that organizations adopt to reduce dependence on and increase control over resources
(Aldrich & Pfeffer, 1976; Pfeffer, 2005; Pfeffer & Salancik, 1978; Sofaer & Myrtle,
1991). Thus, resource dependence theory seeks to explain and predict the impact of the
environment and resource availability on an organization‘s behavior; consequently this
behavior can change the structure of the environment. For example, mergers,
acquisitions, and vertical and horizontal integrations may result in higher market
concentration.
The major assumptions of the RDT can be summarized as follows: (a)
organizations seek to maximize their power and independence from other organizations
by acquiring critical resources, (b) the environment imposes constraints on the
organizations as it does not possess all the required resources to sustain all organizations
and the supply of these scarce resources is uncertain, (c) organizations can survive in
their environment as long as they obtain continuous access to resources, (d) organizations
are capable of changing the environment; the various strategic moves that organizations
undertake to ensure resource acquisition will change environmental condition (Aldrich &
Pfeffer, 1976; Pfeffer, 2005; Ulrich & Barney, 1984).
RDT is a suitable theory that can explain why hospitals change ownership status
because ownership status is based on fiscal and legal requirements. Since previous
studies revealed that the major cause of ownership conversion is poor financial
performance, RDT might help explain why some public hospitals have poor financial
performance and consequently convert into private status. Public hospitals might seek
conversion because the government does not have enough financial resources to support a
hospital operating at a deficit.
32
Previous studies suggested that the unwillingness of the community and
politicians to financially support a public hospital operating at a loss, which has become a
heavy fiscal burden to the community, is one of the reasons for a public hospital‘s
conversion (Bovbjerg et al., 2000). Some other studies suggested the inability of public
hospitals to hire human resources with adequate capabilities and competencies as one of
the reasons for conversion (Burns et al., 2009). In other words, public hospitals change
ownership because the alternative type of ownership has more resources or offers easier
access to resources. As a result of the improved access to resources through conversion,
converting hospitals might be able to regain their financial health and stay competitive.
Moreover, converting hospitals might get resources other than financial capital if they
change ownership. For example, a public hospital will have more autonomy to acquire
advanced technology and hire capable managers and medical staff if it privatizes.
RDT has been applied in several empirical studies of various industries of
healthcare organizations. Given the importance of the environment in RDT, these studies
included both environmental and organizational factors as determinants of various
strategic moves such as adoption of innovation in clinical practices (Zinn, Weech, &
Brannon, 1998), delivery of specialized care (Banaszak-Holl, Zinn, & Mor, 1996;
Campbell & Alexander, 2005; Goldberg & Mick, 2010; Weech-Maldonado, Qaseem, &
Mkanta, 2009; Zinn, et al., 1998), improvement of clinical practice (Alexander & Wells,
2008; Starkey, Weech-Maldonado & Mor, 2005; Zinn, Weimer, Spector, & Mukanel.,
2010), increased participation in health care delivery (Zakus, 1998), engaging in strategic
partnership ( Alexander & Morrisey, 1989; McKinney, Morrissey & Kaluzny, 1993;
Zinn, Mor, Castle, Intrator, & Brannon, 1999), community orientation (Proenca, Rosko,

33
& Zinn, 2000), and diversification into new services unrelated to previous ones
(Alexander, D'Aunno, & Succi, 1996a, 1996b). In addition, RDT has been applied to
explain the composition and function of hospital board members (Pfeffer, 1973); the
board of directors functions as boundary spanner that helps organizations to acquire
resources.
The studies mentioned above demonstrated that RDT has strong capabilities in
explaining an organization‘s strategic behavior. The reviews of the literature on resource
dependence theory confirmed this finding (Davis & Cobb, 2009; Nienhuser, 2008).
Interestingly, since the major reason for public hospital privatization is to obtain easier
access to resources such as financial resources, human resources as well as updated
technology and since better access to resources is expected to enhance financial
performance, the resource dependence theory has never been applied to the study of the
antecedents of public hospitals financial performance, their privatizations and the
consequences of privatization on financial performance. Based on the resource
dependence theory, this study is conducted using the conceptual framework illustrated in
Figure 1.1.

34
Figure 1.1 Conceptual Framework
The conceptual framework in Figure 1.1 illustrates the associations between
environmental factors and public hospital financial distress, the associations between
organizational factors and public hospital financial distress, the effect financial distress
has on public hospital privatization, and the impact of privatization on subsequent
financial performance. For the scope of this study, the major environmental factors of
interest include environmental munificence, environmental dynamism and environmental
complexity. The main organizational factors of interest include hospital size and hospital
teaching status.
The bold arrows in Figure 1.1 represent the associations between the independent
variables of interest and the dependent variable as stated in the hypotheses presented in
the following section. The dotted arrows represent the associations between the control
variables and the dependent variables. In other words, the main independent variables of
interest such as environmental factors and organizational factors that are associated with

35
financial distress become control variables in the study of the impact of financial distress
on privatization. Likewise, the environmental factors and organizational factors act as
control variables in the study of the impact of privatization on financial performance.
The following section discusses the components of the environment, the
associations between the concepts as depicted in Figure 1, and the hypotheses.
The Environment
The components of the environment that directly affect an organization‘s
operations and performance are called the task environment (Dill, 1958). The task
environment is comprised of customers including retailers and wholesalers; suppliers of
inputs such as human, natural and financial resources, and infrastructure; competitors for
customers and inputs; and regulatory bodies (Dill, 1958). Prior studies have attempted to
conceptualize the environment into several dimensions (Duncan, 1972; Emery & Trist,
1965; Aldrich, 1979; Mintzberg, 1979; Child, 1972; Thompson, 1976). Dess and Beard
(1984) combined the six dimensions of the task environment from Aldrich‗s study and
reduced them into three dimensions so as to represent all the different dimensions
conceptualized from previous studies (Aldrich, 1979; Dess & Beard, 1984). These
dimensions are environmental munificence, environmental dynamism and environmental
complexity (Dess & Beard, 1984). Sharfman and Dean (1991) performed additional
studies to elaborate the measurement of these three dimensions (Sharfman & Dean Jr,
1991).

36
These three environmental dimensions have become the most widely used
dimensions in empirical studies. Besides, they are the most appropriate for this study as
they were conceptualized based on the resource dependence theory (Boyd, 1990; Dess &
Beard, 1984; Dess & Rasheed, 1991) and they have helped the literature understand the
impact of the environment on organizational performance.
Environmental munificence. Environmental munificence refers to the
availability of resources in the task environment to support the needs and growth of all
the organizations operating in a specific industry; resources can be scarce or abundant.
Scarcity of resources makes it more difficult for organizations to survive and it affects
their performance. Munificence has been operationalized as per-capita income, overall
population growth, growth rate of the elderly population, growth in total sales growth in
total employment, and number of physicians in the county (Alexander, et al., 1996a;
1996b; Dess & Beard, 1984; Margarethe & Bantel, 1993; Trinh & Begun, 1999).
Environmental dynamism. Environmental dynamism refers to the degree of
stability or instability of the environment; it is the extent to which the events in the
environment are unpredictable and change occurs rapidly (Begun & Kaissi, 2004; Child,
1972; Dess & Beard, 1985; Keats & Hitt, 1988). Moreover, an environment becomes
dynamic when there is high speed of technological change and fast growth in the size and
number of all the organizations operating in the same industry (Kotha & Nair, 1995;
Simerly & Li, 2000).
37
Environmental dynamism has been measured as the fluctuation of total sales and
instability of total unemployment (Boyd, 1990; Dess & Beard, 1984) or the volatility in
industry sales and operating income (Keats & Hitt, 1988). In studies of healthcare
organizations, environmental dynamism has been measured subjectively through the
survey of management teams in terms of how they perceive the changes in the
environment (Kumar, Subramanian, & Strandholm, 2002). Other studies used objective
measures such as HMO penetration, changes in employment rate, changes in poverty
level and changes in population size (Menachemi, Mazurenko, Kazley, Diana, & Ford,
2012; Menachemi, Shin, Ford, & Yu, 2011), and the coefficient of variation of total
admissions to the county‘s community hospitals over a moving three-year period (Lee
and Alexander, 1999).
Environmental complexity. Environmental complexity refers to the
heterogeneity and homogeneity of the environment (Begun & Kaissi, 2004; Dess &
Beard, 1984; Dill, 1958); it is defined as the product of the number of components in the
task environment and the number of factors in each task environment component
(Duncan, 1972). For example, healthcare organizations interact with different
components of the task environment such as suppliers, third party payers, patients,
regulatory agencies, teaching universities and nursing schools, and the community. Each
of these components in the task environment comprises various factors. Suppliers include
suppliers of medical equipment, suppliers of prescription drugs and suppliers of
information technology. Third party payers include Medicare, Medicaid, private health
insurance, and health maintenance organizations. Therefore, when we multiply the

38
number of components with the number of factors, we know the degree of complexity of
the environment. A higher number indicates a complex environment; a lower number
indicates a simple environment.
In addition, the interaction between these different components of the
environment increases complexity. For example, the implementation of Medicare part D
that provides prescription coverage for Medicare enrollees makes the environment more
complex because it involves the hospital, the patient, Medicare and pharmaceutical
companies (Begun & Kaissi, 2004). Begun and Kaissi (2004) assumed the healthcare
environment has been highly complex.
Environmental complexity has been measured as the extent of wage and wealth
distribution within a Metropolitan statistical area (Stearns et al., 1987), or the diversity of
products (Dess & Beard, 1984). Other studies used market concentration to
operationalize complexity. These studies argued that highly concentrated markets are less
complex because they have fewer competitors and highly competitive markets are more
complex because they have a larger number of competitors (Boyd, 1990; Keats & Hitt,
1988).
Studies in healthcare settings have measured environmental complexity
subjectively and objectively. Subjective measures include the perceived intensity of
competition ( in terms of level of health maintenance organizations (HMO) penetration in
the market, Herfindahl Hirschman Index (HHI) (Kim, 2010; Weech-Maldonado et al.,
2009), excess capacity (Weech-Maldonado, et al., 2009), number of hospitals in the
county (Trinh & Begun, 1999), the geographic distance between two hospitals
(Alexander, et al., 1996a, 1996b), and the state of malpractice crisis (Menachemi, et al.,

39
2012). Other studies also have suggested that urban areas are more complex than rural
areas since organizations operating in urban areas interact with a higher number of
entities in their task environment than organizations operating in rural areas (Dansky,
Milliron, & Gamm, 1996). In addition, hospitals operating in rural areas are less complex
since they have fewer competitors relative to hospitals operating in urban areas
(Alexander, et al., 1996a, 1996b).
Financial Performance
Financial performance is one of the dimensions of organizational performance.
Performance refers to the extent to which an organization achieves certain objectives that
are measurable (Lenz, 1980). Thus, financial performance can be measured in terms of
economic growth and profitability, solvency or availability of cash, efficiency, revenue,
capital structure and asset utilization (Coyne et al., 2009; Das, 2009; Molinari,
Alexander, Morlock, & Lyles, 1995; Pink, et al., 2005). As previously mentioned, the
worst financial performance that leads an organization to the brink of bankruptcy or
closure refers to financial distress (Langabeer, 2006).
The following section will discuss the hypotheses based on the empirical
literature that investigated the associations between environmental munificence,
environmental dynamism and environmental complexity and financial performance,
respectively; the associations between organizational factors, namely: hospital size,
hospital affiliation with a medical school, hospital participation in hospital network, and
hospital operation under contract management and financial performance, respectively;

40
the association between financial performance and privatization; and the effect of
privatization on financial performance; as depicted in Figure 1.
The association between environmental munificence and financial
performance. Several empirical studies have demonstrated that environmental
munificence is positively associated with performance. These studies found that firms
operating in more munificence environments exhibited superior performance in terms of
growth and profitability relative to those operating in an environment with scarce
resources (Baum & Wally, 2003; Capon, Farley, & Hoenig, 1990; Davies & Walters,
2004; Fuentes-Fuentes, Albacete-Saez, Llorens-Montes, 2004; Goll & Rasheed, 2004;
Goll & Rasheed, 1997; Jogaratnam, Tse, & Olsen, 1999; Kotha & Nair, 1995; Pelham,
1999).
The positive association between environmental munificence and financial
performance has exhibited strong empirical evidence as demonstrated in the results from
the meta-analysis of 88 studies published between 1929 and 1987 on the determinants of
financial performance. The results indicated that environmental munificence, in terms of
industry growth, had a positive impact on firms‘ financial performance (Capon, et al.,
1990).
Some empirical studies in the healthcare environment have examined the
association between environmental munificence and financial performance. Kim (2010)
investigated the factors affecting financial distress among not-for-profit hospitals. The
findings suggested that environmental scarcity, in terms of high unemployment rate,

41
increased the probability of financial distress among hospitals located in a Metropolitan
Statistical Area (MSA) (Kim, 2010).
Likewise, Friedman and Shortell (1988) suggested that environmental
munificence, measured as deflated family income, was positively associated with hospital
operating margin and net income margin (Friedman & Shortell, 1988). Additionally,
munificence, in terms of higher percentage of people aged 65 or older, was found to have
a positive association with financial performance (Brecher & Nesbitt, 1985; Friedman &
Shortell, 1988).
Organizations operating in a munificent environment tend to exhibit high
financial performance because the abundance of resources makes them cheaper to
acquire and easy access to resources results in less organizational strain; organizations
can spend most of their efforts increasing productivity instead of spending additional
resources to acquire other resources. For example, it is cheaper to hire physicians and
nurses during high unemployment rate but they become expensive when few of them are
unemployed. Cheaper inputs results in less expenses and accordingly higher income.
Furthermore, resources such as a population with a higher per capita income and
a higher number of insured positively impacts provider financial performance because
this type of population can afford to pay for healthcare expenses. As a result, providers
have less uncompensated care, can charge higher prices for the services, and receive
timely reimbursement. Therefore, it is hypothesized that environmental munificence is
associated with better financial performance.

42
Hypothesis 1: Public hospitals operating in a more munificent environment are
less likely to experience financial distress than public hospitals
operating in a less munificent environment.
The association between environmental dynamism and financial
performance. Several studies have investigated the association between environmental
dynamism on organizational performance. These studies have demonstrated that firms
operating in a more dynamic environment exhibited poor performance compared to those
operating in a more stable environment (Anand & Ward, 2004; Baum & Wally, 2003;
Goll & Rasheed, 2004; Goll & Rasheed, 1997; Keats & Hitt, 1988; Pelham, 1999; de
Hoogh et al., 2004).
Hospitals have been operating in a dynamic environment (Begun & Kaissi, 2004).
The dynamism of the environment causes difficulty in planning and acquiring resources
because of high incidence of change; organizations do not know what might occur on a
daily basis and yet they will be surprised if they do not plan in advance. If they plan in
advance, the resources spent in planning might be wasted if their plans do not fit the
emerging environment. Furthermore, the fluctuation of resource supply due to
environmental change makes it difficult to acquire resources. As discussed in the
previous section, when resources are scarce they are expensive and expensive resources
deplete income. For example, economic recession results in unpredicted and dramatic job
loss; and job loss leads to loss of income and health insurance. People who are
unemployed and uninsured are not able to pay for health services. Consequently,
providers experience inflated uncompensated care, shrinking revenue and increased
43
deficit. Thus, operating in a dynamic environment is more difficult and it affects
organizational outcome. Therefore, it is hypothesized that a dynamic environment has a
negative impact on financial performance.
Hypothesis 2: Public hospitals operating in a more dynamic environment are
more likely to experience financial distress than public hospitals
operating in a more stable environment.
The association between environmental complexity and financial
performance. The negative association between environmental complexity, in terms of
industry, and financial performance has been widely confirmed according to the findings
from the meta-analysis on the determinants of financial performance. This study found
that high industry concentration was positively associated with financial performance. In
other words, an environment with low industry concentration or a more competitive and
complex environment was associated with poor financial performance (Capon, et al.,
1990).
Some empirical studies that investigated the association between environmental
complexity and financial performance indicated that high complexity was associated with
poor financial performance (Kim, 2010; Friedman & Shortell, 1998; Brecher & Nesbitt,
1985). Kim (2010) found that high environmental complexity, in terms of industry
concentration and HMO penetration, was associated with financial distress among
hospitals in Metropolitan Statistical Areas (Kim, 2010). Similarly, Friedman and Shortell
(1988) suggested that a complex environment with higher competition from nursing
homes and other hospitals was negatively associated with hospital profitability.

44
Additionally, the findings from the study of not-for-profit hospitals in New York State
and New York City revealed that higher competition was associated with poor financial
performance (Brecher & Nesbitt, 1985).
The studies mentioned above have associated environmental complexity with
high competition. When there are many organizations, in the same industry, that compete
for the same key resources, it is more difficult to acquire these resources as they become
scarce. As discussed previously, scarce resources are expensive; they lead to higher
expenses and consequently negative financial outcome. Additionally, competing for
scarce key resources means that organizations have to spend other resources such as time
and human resources to obtain these key resources. Such resources could have been used
to increase the organization‘s efficiency and productivity if the environment was less
competitive; fewer organizations would need the same key resources.
Furthermore, operating in a complex environment is more challenging as it
requires complex production, complex information processing, and complex decision
making that increases the intensive use of organizational resources and reduces
efficiency. Besides, operating in a complex environment implies that the focal
organization has to interact with a large number of other organizations, which requires
additional consumption of resources. Therefore, it is hypothesized that a complex
environment is negatively associated with financial performance.
Hypothesis 3: Public hospitals operating in a more complex environment are
more likely to experience financial distress than public hospitals
operating in a less complex environment.

45
The association between organizational size and financial performance. The
size of the organization has been determined to have a positive association with
organizational performance. Larger organizations are more competitive since they can
reduce escalating costs through their capability of realizing economies of scale (Hall &
Weiss, 1967). Moreover, large firms have substantial financial capital that enables them
to invest in more profitable business and increase their total profits as well as their return
on investment (Baumol, 1967; Hall & Weiss, 1967). Additionally, large organizations
are able to accumulate slack resources (Sharfman, Wolf, Chase, & Tansik, 1988). Slack
resources refer to extra resources, such as financial reserves and inventory that firms can
put aside, to initiate changes in order to meet future environmental challenges (Sharfman
et al., 1988; Wan & Yiu, 2009; Dawley, Hoffman, & Brockman, 2003). Therefore, large
organizations are better equipped to face the environment than smaller organizations.
Larger organizations are more competitive as they can have access to
resources more cheaply and easily than smaller organizations; they have bargaining
power over suppliers as they purchase large quantities of supplies (Porter, 1985).
Bargaining power results in cheaper supplies and consequently lower costs and higher
financial performance. Several studies have demonstrated that firm size is positively
associated with firm performance (Dawley et al., 2003; Hall & Weiss, 1967; Goll &
Rasheed, 2004; Kotha & Nair, 1995; McNamara, Luce, & Tompson, 2002; Simerly & Li,
2000; Wan & Yiu, 2009).
The size of the hospital, usually measured as the number of hospital beds is an
important characteristic of a hospital as it reflects its competitive strengths and market
share. Similar to larger corporations, larger hospitals are more competitive relative to

46
smaller ones since they can achieve economies of scale (Hall & Weiss, 1967). Some
empirical studies showed evidence that hospital size was associated with superior
financial performance. Brecher and Nesbitt (1985) investigated the major factors
associated with financial situations of not-for-profit hospitals in New York State and New
York City. Their findings suggested that hospital size was associated with higher
operating margin and return on assets. Similarly, Kim (2010) explored the factors
associated with financial distress of not-for-profit hospitals; the findings suggested that
larger hospitals located in non-Metropolitan Statistical Areas were less likely to be in
financial distress in term of cash flow (Kim, 2010). Likewise, larger hospitals were less
likely to file bankruptcy in a study that examined the factors associated with hospitals
filing bankruptcy (Landry & Landry III, 2009). Therefore, it is hypothesized that smaller
public hospitals have higher risk of being in financial distress than larger public hospitals.
Hypothesis 4: Larger public hospitals are less likely to experience financial
distress than smaller public hospitals.
The association between teaching status and financial performance. Some
studies have demonstrated that teaching status is associated with higher financial
performance. Tennyson and Fottler (2000) examined the financial performance of
hospitals that are members of hospital systems in Florida in 1986 and 1992. They found
that teaching status was positively associated with operating margin in 1992. Likewise,
another study on the determinants of financial performance of U.S. hospitals, based on a
national sample, suggested that teaching hospitals had higher total profit margin
compared to non-teaching hospitals (Younis & Forgione, 2005).
47
Teaching hospitals have been operating in the same competitive, complex and
challenging environment as non-teaching hospitals. They have been facing pressure to cut
costs, they have also competed with other hospitals, they have provided more
uncompensated care relative to non-teaching hospitals and they have experienced cuts in
Medicare and Medicaid funding (Guterman, 2003; Needleman, Lamphere, & Chollet,
1999). Medicare has been the major source of funds for graduate medical education
(Rosko, 2004).
However, being affiliated to a medical school is prestigious. Hospitals affiliated to
medical schools have had the reputation of providing high quality care for complex
procedures and they have been well known and highly respected in the healthcare
environment (Ayanian & Weissman, 2002; Kupersmith, 2005; Reuter & Gaskin, 1997).
In most cases, teaching hospitals have a monopoly of ground breaking technology to treat
specific conditions and deliver highly specialized services (Moses III, Thier, &
Matheson, 2005; Reuter & Gaskin, 1997). Good reputation and a monopoly of
sophisticated procedures have permitted teaching hospitals to charge fees up to 10%
higher than non-teaching hospitals (Reuter & Gaskin, 1997).
In addition to the ability to provide higher quality care and acquire advanced
technology, teaching hospitals have a competitive advantage relative to non-teaching.
Teaching hospitals are usually larger than non-teaching hospitals (Reuter & Gaskin,
1997). As discussed in the previous section, large organizational size facilitates the
achievement of economies of scale that smaller organizations cannot obtain. In addition,
larger organizations have bargaining power over suppliers as they purchase larger
quantities of supplies; bargaining power facilitates the acquisition of resources at a lower

48
price. Thus, teaching hospitals with a larger number of residents were found to have
positive financial performance (Langabeer II, 1998). Besides, teaching hospitals have
larger endowment funds than non-teaching hospitals (Rosko, 2004); endowments serve as
financial protection against adversities. Therefore, it is hypothesized that teaching public
hospitals are shielded from financial crisis compared to non-teaching public hospitals.
Hypothesis 5: Public hospitals affiliated with a medical school are less likely to
experience financial distress than non-affiliated public hospitals.
The Association between financial performance and privatization.
Some empirical studies on the association between financial performance and
privatization showed evidence that firm with poor financial performance that face fiscal
pressure were more likely to privatize than firms with higher financial performance. Poor
financial performance such as low operating margin and high debt-to-asset ratio were
found to increase the probability of public hospitals‘ privatization (Sloan, et al., 2003). In
addition, current financial distress and apprehension that the financial crisis will worsen
were reported to be the major reasons for privatization (Bovbjerg et al., 1987; Bovbjerg et
al., 2000; Burns et al., 2009; Legnini et al., 1999; Sloan et al., 2000).
The resource dependence theory argues that organizations need key resources to
successfully fulfill their missions and survive and the availability of resources enhances
operating and financial performance. Therefore, when organizations exhibit poor
financial performance, they engage in different strategic repositioning that will enhance
their access to key resources. Publicly owned organizations operate under the most
stringent and the least flexible environment that restrict the access to key resources and
49
yet they are the ones in the poorest financial condition. Converting into private status will
give public organizations the freedom and independence to adequately access key
resources such as financial capital, updated technology, and knowledgeable human
resources that can efficiently manage the organizations and boost their competitive
position.
Privatization has been one of the solutions that publicly owned firms adopt when
they face financial distress. Privatization is an attractive strategic move because it offers
solutions to multiple issues. First, privatization will give firms easy access to financial
resources offered by private investors. Second, easy access to financial resources enables
the organization to acquire other resources such as qualified human resources and
updated technology, for example. Third, privatization provides the government a relief
from fiscal burden. Fourth, privatization provides the government additional income from
the sale of the firm‘s assets and enhanced tax revenue. Fifth, privatization enables the
organization to continue its operations and preserve jobs. Therefore, it is hypothesized
that public hospitals in financial distress will privatize.
Hypothesis 6: Public hospitals in financial distress are more likely to privatize
than public hospitals exhibiting higher financial performance.
The impact of privatization on hospital financial performance. As discussed
in the literature review section, empirical studies have demonstrated that hospital
financial performance and efficiency improved after privatization (Thorpe, et al., 2000;
Shen, 2003; Bovbjerg et al., 2000; Anonymous). Since public hospitals provide care
based on public funding, the principal purpose of public hospitals is to provide care to
50
everyone regardless of ability to pay and deliver non-profitable tertiary services. Public
hospitals do not focus on making profit and they do not expect to make profit. And since
the provision of public funding is not based on the hospital‘s positive financial
performance but on its financial needs and availability of funds, public hospitals do not
have the incentive to improve their efficiency and consequently financial performance.
However, private hospitals have less social and bureaucratic burden and more
freedom in acquiring key resources relative to public hospitals and they do not have to
deal with politics. Less burden improves efficiency and as a result, financial performance.
Based on the resource dependence theory, the ability to access and obtain key resources
is the means for organizational survival (Pfeffer & Salancik, 1978) and survival is
determined by good financial condition. Consequently, privatization improves hospital
financial performance. Therefore, it is hypothesized that privatization results in better
financial outcomes.
Hypothesis 7: Privatized public hospitals have higher financial performance
after privatization than before privatization.
Some empirical studies provided evidence that for-profit hospitals exhibit
superior financial performance compared to not-for-profit hospitals. Friedman and
Shortell (1988) demonstrated that for-profit hospitals had higher operating margin and
higher profit margin relative to not-for-profit hospitals (Friedman & Shortell, 1988).
Tennyson and Fottler (2000) suggested that private for-profit ownership was positively
associated with superior operating margin, total margin and return on assets of hospitals
affiliated with multihospital systems(Tennyson & Fottler, 2000). Younis and Forgione
51
(2005) also found that compared to not-for-profit hospitals, for-profit hospitals had higher
total profit margin (Younis & Forgione, 2005).
Furthermore, the evidence from three studies on the impact of public hospitals
privatization demonstrated that hospitals that converted into for-profit status significantly
reduced the level of uncompensated care provided to the patients (Desai et al., 2000;
Needleman et al., 1999; Thorpe et al., 2000), whereas the level of uncompensated care
did not change among public hospitals that converted into not-for-profit status (Desai et
al., 2000). A decrease in the level of uncompensated care may result in increased patient
revenue, which consequently enhances a hospital‘s financial condition.
Since the ultimate goal of for-profit hospitals is to maximize profit and
consequently shareholder return, it emphasizes efficiency to achieve high financial
performance. In addition, for-profit hospitals have no social obligation to provide care for
the needy since they are not the recipients of public funding or philanthropist donations
and they have to pay income tax. Therefore, they are able to pursue profitable ventures
that boost their financial performance. Furthermore, for-profit hospitals are the most
flexible regarding access to financial resource as they are able to raise capital through the
sale of stocks. Greater access to financial resources implies easier acquisition of other
resources. As discussed previously, easier access to resources leads to higher
performance. Therefore, it is hypothesized that conversion into private for-profit status
generates a higher financial performance than conversion into private not-for-profit
status.

52
Hypothesis 8: Public hospitals that converted into for-profit status exhibit
higher financial performance compared to public hospitals that converted into not-for-
profit status.
53
CHAPTER 3
RESEARCH METHODOLOGY
This chapter will discuss the methodology applied in this study: the research
design, the data sources, the population and sample, the dependent and independent
variables and their respective operationalization, and the analytical methods used to test
the hypotheses. The purpose of this study was to answer three research questions:
1. What are the organizational and environmental factors associated with
financial distress of public hospitals?
2. Does financial distress precede public hospital privatization?
3. Does privatization lead to better financial performance?
These questions were answered based on the conceptual framework depicted in
Figure 1. Research question 1 was answered by testing hypotheses 1, 2, 3, 4, 5.
Hypothesis 1: Public hospitals operating in a more munificent environment are
less likely to experience financial distress than public hospitals
operating in a less munificent environment.
Hypothesis 2: Public hospitals operating in a more dynamic environment are
more likely to experience financial distress than public hospitals
operating in a more stable environment.
Hypothesis 3: Public hospitals operating in a more complex environment are
more likely to experience financial distress than public hospitals
operating in a less complex environment.

54
Hypothesis 4: Larger public hospitals are less likely to experience financial
distress than smaller public hospitals.
Hypothesis 5: Public hospitals affiliated with a medical school are less likely to
experience financial distress than non-affiliated public hospitals.
Research question 2 was answered by testing hypothesis 6.
Hypothesis 6: Public hospitals in financial distress are more likely to privatize
than public hospitals exhibiting higher financial performance.
Research question 3 was answered by testing hypotheses 7 and 8.
Hypothesis 7: Privatized public hospitals have higher financial performance after
privatization than before privatization.
Hypothesis 8: Public hospitals that converted into for-profit status exhibit higher
financial performance compared to public hospitals that converted
into not-for-profit status.
Research Design
This study used a non-experimental longitudinal design. Longitudinal panel data
sets are the most appropriate data structure to clearly determine the effects of the
independent variables on the dependent variables and infer causality.
Data Sources
This study used longitudinal panel data sets from 1997 to 2009. Four data sets
from: (1) the American Hospital Association (AHA) Annual Survey of Hospitals, (2) the
Bureau of Health Profession‘s Area Resource File (ARF), (3) the Medicare Cost Report

55
(MCR) from the Centers for Medicare and Medicaid Services, and (4) the Local Area
Unemployment Statistics (LAUS) from the Bureau of Labor Statistics were merged and
analyzed. AHA, ARF and MCR data files have been used in prior empirical studies on
the impact of environmental and organizational factors on hospital strategic adaptation to
the environment such as mergers, closures, conversions into non-acute care services, and
ownership conversions (Alexander, D'Aunno, & Succi, 1996a; Alexander, et al., 1996b;
Mark, 1999; Sloan, et al., 2003).
The AHA data file contains the results of an annual nationwide survey of all
hospitals in the US. It has organizational information such as ownership status, type of
services the hospital provides (e.g. general medical and surgical services, or specialty
services), census division, and hospital size. It also contains information regarding
hospital affiliation with other organizations such as affiliation with a hospital system, a
medical school, or a healthcare organization network. In addition, the AHA data includes
information on healthcare utilization, clinical and non-clinical staff, and financial data.
The ARF data file contains demographic and economic information on counties
such as age, race, sex, unemployment rate, income level, and population density. It also
includes information on hospital services utilization, regional classification, rural versus
urban classification, the number of healthcare workforce, and the level of Medicare HMO
penetration.
The MCR data file contains the variables to be included in the hospital financial
analysis. The financial data in the MCR is the most validated and widely accepted data
for hospital financial analysis (Pink, et al., 2005; Schumann, 2008).

56
The LAUS data file contains the estimates of monthly and annual averages of
total employment, total unemployment, and unemployment rates at various geographical
levels including metropolitan areas, cities, census regions and divisions, as well as
counties.
Population and Sample
The population for this study was all publicly owned, non-federal, acute care,
general and surgical hospitals in the U.S. as of 1997, which is first year of the study
period. These hospitals were followed year after year up to 2009. Federal hospitals,
outpatient hospitals, specialty hospitals, critical access hospitals, and long-term care
facilities were not included in the study. Hospital-year was the unit of analysis.
To derive the analytic sample, several exclusion criteria were applied. First,
hospitals that converted to a skilled nursing facility (N= 6), an ambulatory care facility
(N=1), or a critical access hospital (N=520), during the study period were excluded from
the analytic sample. The Critical Access Hospital (CAH) designation was established by
the Balanced Budget Act of 1997. Critical Access Hospitals are small rural community
hospitals that have 15 or fewer acute care beds, with additional 10 swing beds, and
receive cost-based Medicare reimbursement (AHA, 2012). Since CAHs operate in a
different reimbursement environment, it was deemed appropriate to exclude them for this
study. Second, we excluded hospitals that were acquired or merged (N= 9) during the
study period. When a hospital is acquired by another hospital, the submission of its
financial report is under the responsibility of the parent organization (Bartrum, 2009).
Thus, the former hospital ceases submitting financial report after a merger. Third,
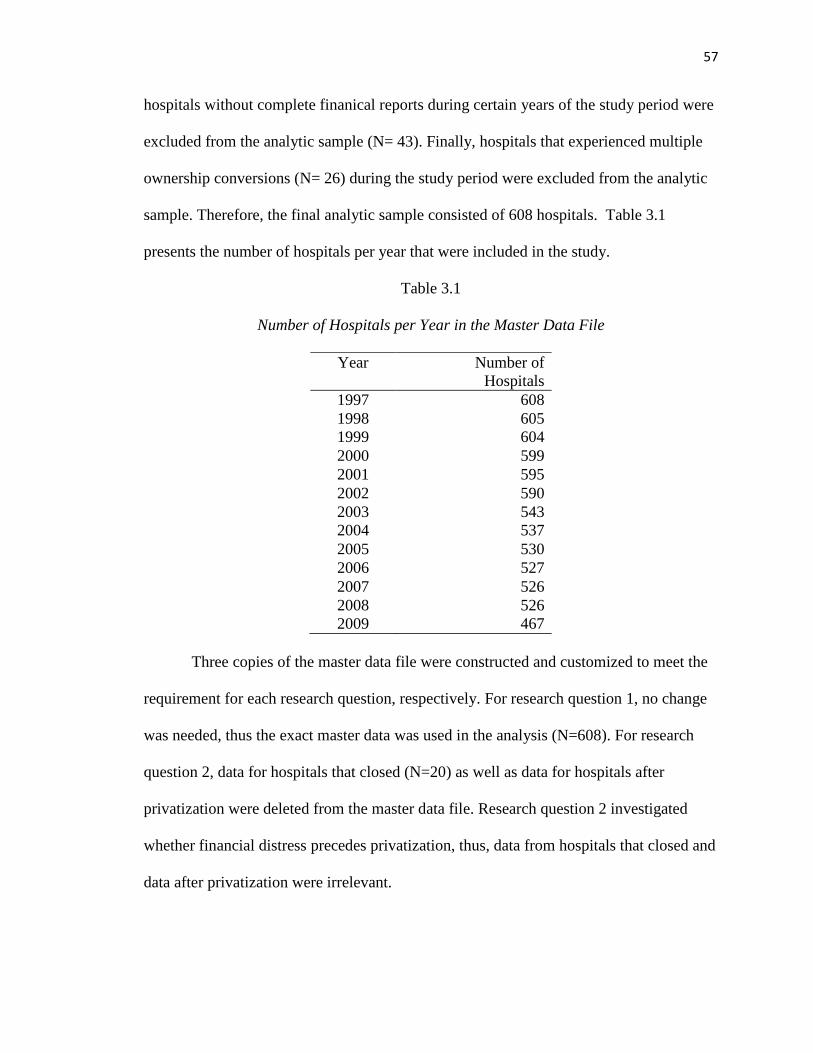
57
hospitals without complete finanical reports during certain years of the study period were
excluded from the analytic sample (N= 43). Finally, hospitals that experienced multiple
ownership conversions (N= 26) during the study period were excluded from the analytic
sample. Therefore, the final analytic sample consisted of 608 hospitals. Table 3.1
presents the number of hospitals per year that were included in the study.
Table 3.1
Number of Hospitals per Year in the Master Data File
Three copies of the master data file were constructed and customized to meet the
requirement for each research question, respectively. For research question 1, no change
was needed, thus the exact master data was used in the analysis (N=608). For research
question 2, data for hospitals that closed (N=20) as well as data for hospitals after
privatization were deleted from the master data file. Research question 2 investigated
whether financial distress precedes privatization, thus, data from hospitals that closed and
data after privatization were irrelevant.
Year Number of
Hospitals
1997 608
1998 605
1999 604
2000 599
2001 595
2002 590
2003 543
2004 537
2005 530
2006 527
2007 526
2008 526
2009 467

58
Research question 3 required each hospital to have complete yearly financial
reports from 1997 until at least 2008. Therefore, 67 hospitals that converted but did not
submit their financial reports through 2008, and the 20 hospitals that closed during the
study period were deleted from the master data file.
Variables and their Operationalization
Table 3.4 summarizes the variables conceptual definitions, operational
definitions, references and data sources. The variables pertaining to each research
question are discussed in the following sections.
Question 1: What are the organizational and environmental factors
associated with financial distress of public hospitals?
Dependent variable.
Financial distress. The dependent variable for hypotheses 1-5 was a dichotomous
variable (1 = yes; 0= no) that indicates whether a hospital is in financial distress in a
given year. Financial distress is an indicator of the financial health of the hospital, and it
can be used to predict the likelihood of a hospital in meeting its debt obligations. The
Altman Z-score model was used to determine whether a public hospital was in financial
distress (Altman, 1968; Altman, 2000; Langabeer, 2006; Almwajeh, 2004). The Altman
Z-score model was especially designed to detect financial distress. It was developed by
Edward Altman as a response to the complaints from scholars regarding the ambiguous
conclusions drawn from simple ratio analyses in determining whether a firm is in
financial distress or not. Simply using individual financial ratios to interpret the financial

59
situation of an organization can be misleading as individual financial ratios do not really
reflect the whole situation. For example, a firm might have a negative profit margin but
still may have an adequate liquidity ratio; hence, it is difficult to decide whether the firm
is in risk of being in financial distress or not (Altman, 1968). Conversely, lack of liquidity
is not reflected in the margins (Bazzoli & Andes, 1995; Kim, 2010; Langabeer, 2006).
Therefore, combining all the most relevant financial ratios into one discriminant function
enhances financial situation estimation and helps draw a more definitive conclusion as to
whether a firm is in financial distress.
The first Altman z-score model was developed based on the study of financial
statements, over twenty years, of 66 manufacturing corporations equally divided into two
groups: the group with bankrupt firms and the group without bankrupt firms. Altman
included twenty two financial ratios, mostly used in empirical studies and corporate
finance. The final discriminant function comprised of five financial ratios that measured:
net liquid assets, cumulative profitability, true productivity of the firm assets, market
value of the firm‘s assets, and the use of assets to generate sales. The discriminant
analysis assigned a specific weight for each of these measures and the Z-score is the sum
of the weighted financial ratios. The analysis provided cut-off scores that separate the
bankrupt group from the group with average financial performance and the group with
superior financial performance. The lower the Z-score, the higher the firm‘s potential of
being bankrupt (Altman, 1968; Altman, 2000). The final model was able to predict
financial distress within two years with 82% to 94% accuracy.
Altman designed other Z-score models for non-manufacturing firms. Altman Z-
score models have been applied by scholars to predict the probability of firm‘s

60
bankruptcy and has been recognized as having a high predictive capability (Altman,
2000) and it was used to predict the financial distress of teaching hospitals (Langabeer,
2006) and rural hospitals in Western Pennsylvania (Almwajeh, 2004). While the main
purpose of the Altman Z-score is to predict financial distress, it has been found to be a
useful managerial tool to assess the financial situation of the organization. Therefore,
using the Altman Z-score to assess whether a hospital is in financial distress or not is
justified in this study (Almwajeh, 2004; Calandro, 2007).
For this study, the Altman Z-score model designed for service and retail firms
applied in Langabeer (2006) was used to estimate public hospitals financial condition.
The discriminant function is formulated as follows:
Z= 6.56 X1 + 3.26X2 + 6.72X3 + 1.05X4 where: 6.56, 3.26, 6.72 and 1.05 are the
respective weights of the financial ratios X1, X2, X3 and X4. The sum of the weighted
independent variables constitutes the Z-score.
X1 = Net Working Capital (Current Assets - Current Liabilities)/ Total Assets
X2 = Net Assets (Total Assets-Total Liabilities) /Total Assets
X3 = Excess Revenue over Expenses (Total Revenue-Total Expenses) /Total
Assets
X4 = Fund balance/ Total liabilities
X1 is defined as the ratio of net working capital to total assets. Net working capital
is measured as the difference between current assets and current liabilities. Thus, this
ratio represents the value of the hospital‘s liquid assets as a percentage of total assets.
Altman (1968, 2000) suggested that the ratio of net working capital to total assets proved
to be the most valuable liquidity ratio relative to current ratio and quick ratio.
61
X2 was originally defined as the ratio of retained earnings to total assets. This
study used net assets instead of retained earnings given that public hospitals do not
accumulate earnings from prior years. Thus, in this study X2 is defined as the ratio of net
assets to total assets. It represents the value of the hospital‘s net worth as percentage of
total assets. It measures the extent to which one dollar worth of total asset is financed by
liability and net assets, respectively. High net assets to total assets ratio means that the
hospital has more assets than debts.
X3 was originally defined as the ratio of earnings before income taxes to total
assets; however, public hospitals do not pay taxes. Therefore, excess revenue over
expenses was used in place of earnings before income taxes. In this study, X3 is defined
as the ratio of excess revenue over expenses to total assets. This is a profitability ratio
that measures how much profit a hospital can make out of one dollar worth of total assets.
X4 was originally defined as the ratio of book value of equity to the book value of
debt. This ratio represents the capital structure of the hospital; it is the extent to which the
assets are financed by debt and equity, respectively. Public hospitals do not have equity,
but the book value of equity can be derived by subtracting total liabilities from total
assets, which is equal to fund balance. In this study, X4 is defined as the ratio of total fund
balance to total liabilities.
The Altman Z-score for each individual hospital was derived based on the
discriminant function described above. Langabeer (2006) divided the Altman Z-score
into three categories: the hospital is in finanical distress if its Z-score is less than 1.1, the
hospital is in neither in finanical distress nor in good financial condition if its Z-score is

62
greater than 1.1 but less than 2.6, and the hospital is in good finanical condition its Z-
score is greater than 2.6. For this study, the Altman Z-score was divided into two
categories. The hospital is in financial distress if its Z-score is less than 1.1. The hospital
is not in financial distress if its Z-score is greater than 1.1. Since the purpose of research
question 1 was to determine whether the hospital was in financial distress or not, it was
deemed appropriate to divide the hospitals in two groups: those in financial distress and
those not in financial distress.
Independent variables. Similar to prior studies on the environment, county-based
data were used for the environmental level variables: environmental munificence,
environmental dynamism, and environmental complexity.
Environmental munificence. Environmental munificence (hypothesis 1) refers to
the amount of resources available in the environment that sustains hospital‘s operations
and growth. In this study, the environmental munificence construct was operationalized
with four variables: county per capita income, county unemployment rate, percentage of
people who are 65 years old or older in the county, and number of active physicians per
1000 persons in the county.
County per capita income reflects the availability of resources that enables the
population to consume hospital services. When the county has higher per capita income,
its population can better afford paying for healthcare services; therefore, the demand for

63
healthcare services is higher and reimbursement is greater (Mark, 1999; Sloan, 2003). In
other words, a county with high per capita income is a wealthy county. Consequently, it
has more abundant resources and capable of supporting the mission of the public hospital,
such as the provision of indigent care (Alexander, D‘Aunno & Succi, 1996b; Ginn &
Young, 1992; Lee & Alexander, 1999).
Likewise, the county unemployment rate has an effect on whether the majority of
the population in the county is able to pay for healthcare services. A higher
unemployment rate means that more people do not have health insurance; therefore they
cannot pay for healthcare services. Thus, a county with a high unemployment rate has
lower demand for healthcare services, and it is not as munificent as a county with a lower
unemployment rate (Sloan, 2003; Gregory & Young, 1992). From a public hospital
perspective, the hospital may have to serve a larger patient population which can translate
into higher healthcare costs. Therefore, the county with a higher unemployment rate is
less munificent relative to a county with a lower unemployment rate.
Similarly, the percentage of elderly people (65 years of age and older) in the
county shows whether the county is a munificent environment or not. If the county has a
higher percentage of elderly people, it needs more healthcare services as elderly people
are in general sicker than younger people. Higher demand for healthcare services from
the elderly generally means more resources for public hospitals, in terms of patient
revenue, since the elderly are generally covered by Medicare (Sloan, 2003).
Number of active physicians per 1000 population also reflects the availability of
resources that hospitals can use. Physicians are key resources for hospitals; hospitals
cannot deliver healthcare services if they do not have an adequate supply of physicians

64
(Alexander, D‘Aunno & Succi, 1996b). If the county has a larger supply of physicians, it
means that the county is a more munificent environment. In this case, public hospitals
have greater bargaining power over physicians, so they can negotiate lower compensation
for employed physicians (Ginn & Young, 1992). Number of active physicians per 1000
population was measured as the number of nonfederal active physicians per 1,000 county
population.
Environmental dynamism. Environmental dynamism (hypothesis 2) refers to the
degree of instability of the environment due to the frequency and unpredictability of
changes. An unstable environment results in uncertain availability of resources; making it
more difficult for hospitals to predict whether there will be enough resources to support
their operations. As stated previously, the unemployment rate reflects the availability of
resources and its fluctuation reflects the fluctuation of resources in the environment.
Environmental dynamism was measured as the yearly change in unemployment rate at
the county level (Menachemi, Mazurenko, Kazley, Diana, & Ford, 2012; Menachemi,
Shin, Ford, & Yu, 2011).
Environmental complexity. Environmental complexity (hypothesis 3) is the extent
to which the environment is homogenous or heterogeneous. In this study, environmental
complexity is operationalized with three variables: market concentration, excess capacity,
and Medicare HMO penetration.
Prior studies have argued that a more competitive environment is more complex
than an environment with high industry concentration. An environment with a higher

65
level of competition comprises more organizations competing for the same resources.
Therefore, operating in a more competitive environment is more complex than operating
in an environment with fewer competitors.
Competition refers to the extent to which the market is concentrated; it is whether
a few hospitals have the major market share in the county, or all the hospitals have
relatively the same market share. If only a few hospitals own the largest market share in
the county, the market is highly concentrated. High market concentration means less
competition, and less concentration means more competition. The Hirschman-Herfindahl
Index (HHI) has been used to measure market concentration across different healthcare
organizations (Bowblis, 2010; Lee & Alexander, 1999; Mark, 1999; Sloan, et al., 2003;
Starkey, et al., 2005; Weech-Maldonado, et al., 2009, 2012; Kim, 2010). A higher HHI
implies greater market concentration. Market share was measured in terms of acute-care
patient days. HHI was defined as the sum of squared market shares (acute-care patient
days for individual hospital/total acute-care patient days of all the hospitals in the county)
(Kim, 2010). Given its negatively skewed distribution, HHI was dichotomized as 1 if
equal to or below the mean (greater competition) and 0 if greater than the mean (less
competition).
Excess capacity has also been used to measure the degree of competition.
Competition for patients is stronger when there is excess capacity; hospitals compete for
patients to fill the extra empty beds (Weech-Maldonado, et al., 2009, 2012). Excess
capacity was measured was the average number of unoccupied beds per hospital in the
county.
66
Medicare HMO penetration can increase the level of environmental complexity
because the higher the number of HMO enrollees, the higher the number of HMO
contracts that the hospital must deal with. As stated previously, the existence of large
number of entities that the organization needs to interact with makes the environment
more complex. In addition, the greater the HMO penetration, the greater the leverage of
managed care organizations in negotiating hospital prices, which can result in lower
Medicare reimbursement compared to fee-for-service Medicare (Shen, Wu, & Melnick
2010). Medicare HMO penetration was measured as the percentage of Medicare HMO
enrollees relative to the total number of Medicare eligibles in the county. This study
included two organizational independent variables: hospital size and teaching status.
Hospital size. Hospital size (hypothesis 4), measured as the total number of beds
in the hospital, has been the most widely used measure of hospital size (Anderson,
Allred, & Sloan, 2003; Sloan, Ostermann, & Conover, 2003). While the number of
licensed beds has been used in prior studies, the number of licensed beds was not
available from the AHA data set prior to 2003. Therefore, the number of licensed beds
could not be used in this study.
Teaching status. Teaching status (hypothesis 5) was coded ―1‖ if the hospital did
not have a teaching status and ―0‖ if it had a teaching status. Hospitals can engage in
medical education in three different, but not mutually exclusive, ways: 1) membership of
the Council of Teaching Hospitals and Health Systems (COTH); 2) affiliation to a
medical school; and 3) provision of residency programs. The hospital was defined as
67
having teaching status if it met one or more of the above criteria (Alexander & Morrisey,
1989; Bazzoli & Andes, 1995; Bazzoli, Chan, Shortell, & D'Aunno, 2000).
Control variables. The following variables were used as control variables:
Outpatient mix, occupancy rate, and payer mix. Since hospitals differ in the number of
outpatient visits, occupancy rate, payer mix, and geographical location, and since these
variables may affect hospital financial performance, it was essential to include them as
control variables.
Outpatient mix. Hospitals offer both inpatient and outpatient services. Donnelly
(2011) suggested that since reimbursement of inpatient services is highly controlled by
payers relative to those of outpatient services, inpatient services are less profitable than
outpatient services (Donnelly, 2011). Therefore, we expect a hospital with higher
outpatient service mix to be less likely in finanical distress.
To determine the outpatient mix, it was necessary to convert outpatient visits to
its inpatient days equivalent. Research has suggested that outpatient services are less
resource intensive relative to inpatient services; resources consumed to provide one
outpatient service are equivalent to one third of the resources consumed to provide a
service for one inpatient day (Detsky, O'Rourke, Naylor, Stacey, & Kitchens, 1990;
Insight, 2002; Vujicic, Addai, & Bosomprah, 2009). Thus, to convert outpatient visits
into inpatient days equivalent, total outpatient visits was divided by three and total
equivalent inpatient days equaled the sum of (total outpatient visits /3) and total inpatient

68
days. Therefore, outpatient mix was operationalized as Outpatient mix = (total outpatient
visits/3)/total equivalent inpatient days.
Occupancy rate. Occupancy rate reflects the level of inpatient services utilization
and the efficiency of the hospital. Occupancy rate affects financial performance because
empty beds do not generate revenue. Trussel and Patrick (2010) suggested that lower
occupancy rate was associated with financial distress among rural hospitals in
Pennsylvania. Occupancy rate was measured at the hospital level as the ratio of total
inpatient days to the total number of beds *365 (Trussel & Patrick, 2010).
Payer mix. Payer mix reflects the proportions of Medicare and Medicaid patients.
For public hospitals, payments from Medicare and Medicaid can represent an important
source of revenue. For example, public hospitals members of the National Association of
Public Hospitals generate 21% of their revenues from Medicare and 35% from Medicaid
(NAPH, 2011). Therefore, having a higher proportion of Medicare and Medicaid
payments can contribute to public hospital survival, especially if the hospital serves a
larger proportion of uninsured patients. Medicare mix was measured as total Medicare
inpatient days divided by total inpatient days, and Medicaid mix as total Medicaid
inpatient days divided by total inpatient days. The reference group represents those
patients that were neither covered by Medicare nor Medicaid. Year and hospital
identification number are needed for longitudinal panel data sets. Year estimates the
effect of time in term of the annual overall trend of the dependent variable (Pradhan,

69
2010; Weech-Maldonado, Qaseem & Mkanta, 2009; Wooldridge, 2006). Year dummy
variables were created using year 2009 as the reference group.
Hospital ID was needed to track each hospital over time. The hospital‘s Medicare
Provider Number was used as the hospital identification number (Pradhan, 2010; Weech-
Maldonado, Qaseem & Mkanta, 2009; Wooldridge, 2006).
Question 2. Is financial distress associated with public hospitals
privatization?
Dependent variable. Ownership conversion is the dependent variable for
hypothesis 6. According to previous studies, ownership conversion is one of the
consequences of hospital financial distress. Other consequences include hospital closure,
diversification into services totally unrelated to previous ones, or bankruptcy filing,
among others (Alexander, D'Aunno, & Succi, 1996a, 1996b; Bazzoli & Andes, 1995;
Landry & Landry III, 2009; Sloan, Ostermann, & Conover, 2003). For the scope of this
study, the dependent variable ―ownership conversion‖ was a dichotomous variable coded
as ―1‖ if the hospital privatized and ―0‖ if the hospital did not privatize.
Independent variable. Financial distress measured by the Altman Z-score
(Langabeer, 2006) described as the dependent variable in question 1 became the
independent variable for research question 2. This variable was lagged one year and two
years before privatization because privatization does not occur immediately after the
hospital recognizes its financial distress.
70
Control variables. Control variables were also lagged by one year and two years.
The environmental and organizational variables used to determine the factors associated
with financial distress in question 1 were used as control variables for question 2. The
dotted arrows depicted in Figure 1 represented the associations between the control
variables and the dependent variable. Thus, environmental factors (munificence,
dynamism, complexity) and organizational factors (hospital size, teaching status) were
used as control variables in predicting public hospital privatization.
From the resource dependence perspective, lack of resources, fluctuation of
resources and difficulty in acquiring resources can serve as incentives for a public
hospital to privatize since privatization offers more flexibility in resources acquisition
such as better payer mix and stronger capital structure. Therefore, it is expected that a
public hospital located in a more munificent environment is less likely to privatize; a
public hospital located in a more dynamic environment is more likely to privatize; and a
public hospital located in a more competitive environment is more likely to privatize.
Larger organizations are slower to initiate change than smaller organizations.
Hannan and Freeman (1984) argued that the larger the size of the organization the
stronger the structural inertia that prevents it from initiating change. For large public
hospitals, factors that generate structural inertia include larger infrastructure and large
number of stakeholders. A large number of stakeholders indicate that it is more difficult
to convince the stakeholders to initiate a radical change such as privatization as they may
have divergent interests. In addition, a larger public hospital serves a larger community,
with a strong voice, that might oppose privatization for fear of loss of community
benefits (Legnini et al., 1999). Therefore, it is expected that larger public hospital are less
71
likely to privatize than smaller public hospitals. The same argument applies to teaching
status. Teaching hospitals are usually larger than non-teaching hospitals; therefore, they
are less likely to privatize compared to non-teaching hospitals. In addition, outpatient
mix, occupancy rate, payer mix, and states were used as control variables. Since a higher
outpatient mix and a higher occupancy rate are expected to enhance public hospital
finanical performance, therefore, a public hospital with high outpatient mix and high
occupancy rate is less likely to privatize. As discussed in the previous section, Medicare
and Medicaid account for almost 56 % of public hospitals revenue (NAPH, 2011),
therefore, a hospital with higher Medicare and Medicaid enrollees is less likely to
privatize. The operationalization of outpatient mix, occupancy rate and payer mix was
described under research question 1.
Variables ―states‖ and ―metropolitan vs. non-metropolitan location‖ were also
used as control variables. States refer to the geographical state where the hospital is
located. States have different regulations. For example, Alabama, Massachusetts and
Ohio have CON laws; other states such as California, Colorado and Indiana do not have
CON laws. In some states CON laws oversee ownership conversion, for example,
Connecticut and Washington State (National Conference of State Legislatures, 2012).
The non-existence of CON law in Texas from 1985 might explain the higher number of
conversions in that state compared to other states (Needleman, Chollet & Lamphere,
1997). Therefore, it was necessary to control for states for research question 2. States
were measured as a set of dummy variables representing the 50 states of the United States
using Fips State Codes.

72
The location of the hospital in a metropolitan county or in a non-metropolitan
county can have an impact on privatization. Operating in a metropolitan county requires
more resources because of the need to interact with a greater number of organizations
compared to operating in a non-metropolitan county (Alexander, D'Aunno, & Succi,
1996a, 1996b; Dansky, Milliron, & Gamm, 1996). For example, a hospital located in a
metropolitan area interacts with a larger number of third party payers, especially private
payers given the larger number of businesses and employees in a metropolitan area
relative to a non-metropolitan area. Furthermore, a metropolitan hospital not only
interacts a with various types of healthcare organizations, but also faces a larger number
of competitors compared to a non-metropolitan hospital, which contributes to its
difficulty in making sound finanical performance and stay competitive (Alexander,
D‘Aunno, & Succi, 1996a, 1996b). Therefore, a metropolitan hospital is more likely to
privatize compared to a non-metropolitan hospital.
Variable ―metropolitan vs. non-metropolitan location‖ was determined according
to the Rural-Urban Continuum Codes of 2003 (RUCC) published by the Economic
Research Service of the United States Department of Agriculture (USDA & ERS, 2004).
The RUCC of 2003 are the most recent codes and they are based on the 2000 census. The
RUCC classify each county in the U.S. into metropolitan (metro) counties and
nonmetropolitan (nonmetro) counties. Metro counties are determined based on the
population size of their respective metropolitan areas and nonmetro counties are
determined based on their degree of urbanization and adjacency to a metropolitan area or
areas.

73
Metro counties are counties located in metropolitan areas with a population size
ranging from fewer than 250,000 to more than 1 million. Nonmetro counties are those
with an urban population ranging from less than 2,500 to more than 20,000 and the
county is either adjacent or not adjacent to a metropolitan area. Counties that RUCC
coded as 1, 2, 3 are metro counties and counties coded as 4, 5, 6, 7, 8, 9 are non-metro
counties (USDA & ERS, 2004). Following RUCC, metropolitan vs. non-metropolitan
location was a dichotomous variable indicating whether the hospital is located in a
metropolitan county or not. Metropolitan location was coded as ―1‖, and non-
metropolitan location was coded as ―0‖.
Finally, three interorganizational variables (membership of a multihospital
system, operation under contract management, and participation in a healthcare network)
were used as control variables. Hospitals that are engaged in these types of
interorganizational relationship can have difficulty initiating ownership change because
doing so might lead to the loss of privileges they enjoy as a member of these associations.
For example, a hospital under contract management is less likely to privatize given that
the management of the hospital is under the responsibility of the contractor, making it
difficult for the hospital to initiate such change. In addition, from the resource
dependence theory, hospitals engage in these types of interorganizational relationships in
order to obtain easier access to resources. Therefore, we expect public hospitals members
of a multihospital system, under contract management or part of a healthcare network to
be less likely to privatize.
Membership of a multihospital system, operating under contract management, and
participation in a healthcare network were measured as dichotomous variables coded as

74
1‖ if the hospital engaged in such relationship and ―0‖ if the hospital did not. Year and
hospital ID were also included in the analysis.
Question 3. Does privatization lead to a better financial performance?
Dependent variable. The dependent variable for hypotheses 7 and 8 is financial
performance, which is measured as the Operating Margin and Total Margin. These two
measures reflect the overall financial performance and profitability of the hospital.
Operating margin measures the percentage of income a hospital exclusively generates
from providing health care services relative to the expenses incurred from providing such
services. Operating Margin equals Total Operating Income divided by Total Operating
Revenue. Total Margin measures the percentage of income a hospital generates from all
its activities, including income from health care services and other income, relative to the
hospital‘s total expenses. Total margin indicates the hospital‘s ability to control overall
expenses. The lower the overall expenses the higher the net income and total margin.
Total margin equals Net Income divided by Total Revenue (Gapenski, 2004).
The financial variables from the MCR needed to be recalculated because several
hospitals had either multiple financial reports for a certain fiscal year, or the financial
report for a fiscal year covered less than 12 months. Each row in the data set was checked
to assess whether the condition of 12 months of reporting for one fiscal year was met.
When that condition was not met, the following criteria were used to adjust the reports to
12 months.
75
When there was more than one report in one fiscal year (X1 and X2 ) and these
reports covered more than 12 months, the adjustment was computed as follows:
Report = (X1 +X2) / (total number of months) * 12
When there were two reports (X1 and X2) for one fiscal year and they added up
to 12 months, the adjustment was computed as follows: Report = X1 + X2
When there were two reports (X1 and X2) for one fiscal year and one of these
reports covered 12 months, then that report was kept and the other report was
deleted from the data set.
When there was one report for one fiscal year and it did not cover 12 months or
covered more than 12 months, then the report was adjusted as follows:
Report = (X / total number of months) * 12.
Independent variable. Ownership conversion became the independent variable.
To test hypothesis 7, whether privatization leads to a better financial performance, the
independent variable ―ownership conversion‖ was a dichotomous variable coded as ‗1‖ if
the hospital privatized (the year of privatization and subsequent years were coded as 1)
and ―0‖ if the hospital stayed public. In addition, for public hospitals that privatized, the
years before conversion were coded as ―0‘ (Pradhan, 2010). To test hypothesis 8, whether
the hospitals that converted into private for-profit status had a higher financial
performance compared to those that converted into private not-for-profit status, two
dummy variables were created: one dummy variable for conversion to private not-for-
profit status, and another one for conversion to private for-profit status. The hospitals that
did not convert were used as the reference group.

76
Control variables. The environmental, organizational, and control variables used
in question 1 were used as control variables for question 3: environmental factors
(munificence, dynamism, complexity), organizational factors (hospital size and teaching
status), and outpatient mix, payer mix and occupancy rate. These variables were used in
research question 1 to predict public hospital financial distress. Since research question 3
predicts financial performance, it is deemed important to control for these variables given
their association with financial condition. A hospital located in a less munificent, more
dynamic and more complex environment is expected to have poorer financial
performance compared to a hospital located in a more munificent, less dynamic and less
complex environment. Larger hospitals have competitive advantage given their ability to
generate economies of scale and their bargaining power over suppliers and buyers.
Therefore, larger hospitals are expected to have higher financial performance compared
to smaller hospitals. Likewise, since teaching hospitals are usually larger than non-
teaching hospitals, they are expected to have higher financial performance than non-
teaching hospitals. In addition, their reputation of delivering higher health care quality
allows them to charge higher price than non-teaching hospitals. Teaching hospitals are
also expected to be in better financial condition that non-teaching hospitals due to their
large endowment funds.
Higher occupancy rate is expected to be positively associated with financial
performance as it generates patient revenue. Therefore, a hospital with a higher
occupancy rate is expected to have higher financial performance than a hospital with a
lower occupancy rate. The same expectation applies to a hospital with a higher outpatient
mix. As discussed previously, hospitals have more freedom in setting the price of

77
outpatient service compared to the price of inpatient services which are highly controlled
by payers. Therefore, a higher proportion of outpatient services relative to inpatient
services is expected to generate higher revenue. The measurement of these variables was
defined in the previous sections.
Similar to questions 1 and 2, Year and Hospital ID needed for longitudinal panel
data were also included in the analysis.
Analysis
Fixed-effects (FE) and random effects (RE) are the most widely used models to
study panel data. FE model is used when there is an assumption that there are
unobservable characteristics that do not change over time but these characteristics are
thought to be correlated with the independent variables. Therefore, FE model is used to
control for all these time-invariant unobserved factors. Failing to do so leads to biased
results due to omitted variables (Allison, 2005; Wooldridge, 2006).
On the other hand, the RE model is used when we think that there are some
unobservable characteristics of each observation and we assume that these characteristics
are uncorrelated with the independent variables. Therefore, they needed to be included in
the analysis (Allison, 2005; Wooldridge, 2006). In this study, both fixed effects and
random effects regressions were used, and the type of regression depends on the nature of
the dependent variable.
Research question 1 had a dichotomous dependent variable: financial distress
coded as ―1‖ if the hospital as in financial distress and ―0‖ otherwise. Therefore, fixed-
effects logistic regression was used to analyze the models for question 1. Research

78
question 2 had a dichotomous dependent variable: ownership conversion coded as ―1‖ if
the hospital privatized and ―0‖ otherwise. The independent variables were lagged by one
year and two years given that hospitals may engage in privatization after they experience
financial distress during a certain number of years. Two models were used, the first
model with independent variables lagged by one year and the second model with
independent variables lagged by two years. Fixed-effects logistic regression models were
attempted but the models did not converge properly; the lack of within-group variation
did not allow the completion of the analysis with fixed-effects model. Therefore, random-
effects logistic regression models with state fixed-effects were used in the analysis.
For research question 3, the dependent variables: operating margin and total
margin were both continuous variables; linear fixed-effects regression models were the
appropriate method. Normal distribution assumption with respect to the dependent
variable should not be violated in linear regression. To ensure normal distribution of
operating margin and total margin, skewness needed to be equal or close to zero and
kurtosis equal or close to three (Weech-Maldonado et al., 2012). The deletion of
observations with five most extreme values for each dependent variable was firstly
conducted. Then, the deletions of extreme values that were five standard deviations above
and below the mean were performed until operating margin and total margin met the
conditions for skewness and kurtosis (Weech-Maldonado, et al., 2012). Table 3.2 and
table 3.3 summarize the processes used to make operating margin total margin normally
distributed.

79
Table 3.2
Normalization of Operating Margin
Univariate
Analysis
N Mean Standard
Deviation
Extreme values Skewness Kurtosis Kolmogorov
Smirnoff
P-value Lowest Highest
1* 6658 -0.107 0.387 < -5.662 > 0.629 -9.943 185.041 <0.01
2** 6649 -0.102 0.325 < -3.538 > 0.586 -5.424 44.384 <0.01
3 6587 -0.081 0.226 < -1.677 > 0.586 -3.060 13.637 <0.01
4 6539 -0.070 0.193 < -1.200 > 0.586 -2.374 8.943 <0.01
5 6507 -0.065 0.179 < -1.011 > 0.586 -2.060 7.378 <0.01
6 6486 -0.062 0.171 < -0.945 > 0.586 -1.898 6.769 <0.01
7 6472 -0.060 0.166 < -0.912 > 0.586 -1.789 6.375 <0.01
8 6458 -0.059 0.162 < -0.864 > 0.586 -1.673 5.954 <0.01
9 6454 -0.058 0.161 < -0.851 > 0.586 -1.640 5.838 <0.01
*After the first univariate analysis, the five highest and lowest values were deleted
**After the second univariate analysis, observations that were five standard deviation above and below the mean were
delete and the same process was performed until skewness close to zero and kurtosis close to three were attained
Table 3.3
Normalization of Total Margin
Univariate
Analysis
N Mean Standard
Deviation
Extreme values Skewness Kurtosis Kolmogorov
Smirnoff
P-value Lowest Highest
1* 6659 -0.026 0.196 < -1.480 > 0.638 -33.129 1647.300 <0.01
2** 6647 -0.031 0.096 < -0.798 > 0.636 -0.538 18.847 <0.01
3 6596 -0.031 0.078 < -0.411 > 0.443 -0.109 4.710 <0.01
4 6579 -0.031 0.075 < -0.306 > 0.380 -0.110 3.259 <0.01
*After the first univariate analysis, the five highest and lowest values were deleted
**After the second univariate analysis, observations that were five standard deviation above and below the mean were delete and the same process was performed until skewness close to zero and kurtosis close to three were attained
Statistical packages Statistical Analysis System (SAS) versions 9.2 and 9.3,
International Business Machines Statistical Package for Social Sciences (IBM SPSS)
80
version 19 and Microsoft Excel 2007 were used in the data cleaning phase and SAS and
STATA version 11 were used in the descriptive statistics and regression analyses.
Potentially endogenous variables. Special attention was given to three
interorganizational variables: membership of a multihospital system, operation under
contract management and participation in a healthcare network. They were considered
potentially endogenous to financial distress measured by the Altman Z-score and to
financial performance measured by total margin and operating margin. Hospitals might
initiate these types of interorganizational partnerships because they already face financial
hardship. These kinds of partnerships could be the strategic moves that hospitals initiate
to solve their financial problems. Therefore, these variables were included in the analysis
of research questions 1 and 3 following the methodology applied by Morrisey,
Menachemi, Cawley and Ginter (2010). To control for potentially endogenous variables,
three models were constructed. The first model included the independent variables. In the
second model, the potentially endogenous variables were added to the regression
equation and the third model contained all the independent, endogenous and control
variables. The next section summarizes the models used in this study.
Models
Research question 1 used three models: Fixed-effects logistic regressions
Model 1. Financial distress = f (environmental factors, organizational factors)
Model 2. Financial distress = f (environmental factors, organizational factors, potentially
endogenous variables)
Model 3. Financial distress = f (environmental factors, organizational factors, potentially
endogenous variables, control variables)

81
Research question 2 used two models of random-effects logistic regressions with state
fixed-effects.
Ownership conversion = f (financial distress, control variables lagged by one year)
Ownership conversion = f (financial distress, control variables lagged by two years)
Research question 3 used three models for each dependent variable Operating Margin and
Total Margin: linear fixed-effects regressions.
Models for operating margin.
Model 1. Operating Margin = f (conversion)
Model 2. Operating Margin = f (conversion, potentially endogenous variables)
Model 3. Operating Margin = f (conversion, potentially endogenous variables, control
variables)
Models for total margin.
Model 1. Total Margin = f (conversion)
Model 2. Total Margin = f (conversion, potentially endogenous variables)
Model 3. Total Margin = f (conversion, potentially endogenous variables, control
variables)
For research question 2, environmental and organizational factors and the three
interorganizational variables (multihospital system membership, contract management
and health network participation) were included as control variables.
For research questions 1 and 3, environmental and organizational factors were included
as control variables.
Table 3.4 summarizes the variables definition and their operationalization.

82
Table 3.4
Summary of Variables Conceptual Definitions, Operational Definitions, References and Data Sources.
Used as Dependent Variables and Independent Variables
Variable Conceptual Definition Operational definition
Reference Data
Source
Financial
distress/perform
ance
Hospital financial
condition Altman Z-score= 6.56 X1 + 3.26X2 + 6.72X3 + 1.05X4
X1 = Net Working Capital / Total Assets
X2 = Net Assets /Total Assets
X3 = Excess revenue over expenses/ Total Assets
X4 = Fund Balance/Total liabilities
Altman Z-score is dichotomous
Coded 1 if in financial distress < 1.1
Coded 0 if not in financial distress > 1.1
Langabeer, 2006
MCR*
Ownership
conversion
Change of ownership
status resulting from
interorganizational
transaction such as hospital
sale, merger, lease, or joint
venture
Dichotomous variable for research question 2 and question 3 (first
hypothesis)
coded 1 if the hospital privatized
coded 0 if the hospital did not privatize
Two dummy variables for research question 3 (second hypothesis)
Public to NP: coded 1 if the hospital privatized
coded 0 if the hospital did not privatize
Public to FP: coded 1 if the hospital privatized
coded 0 if the hospital did not privatize
Burns, Shah, Frank
& Powell, 2009
Sloan, Osterman &
Conover, 2003
Needleman&
Chollet, 1997
AHA **
Used as Dependent Variable
Financial
performance
Hospital financial situation Operating margin =( net patient revenue – total operating expense)
/net patient revenue
Total margin = net income/total revenue
Pink et al. 2005
Pink et al. 2005
MCR
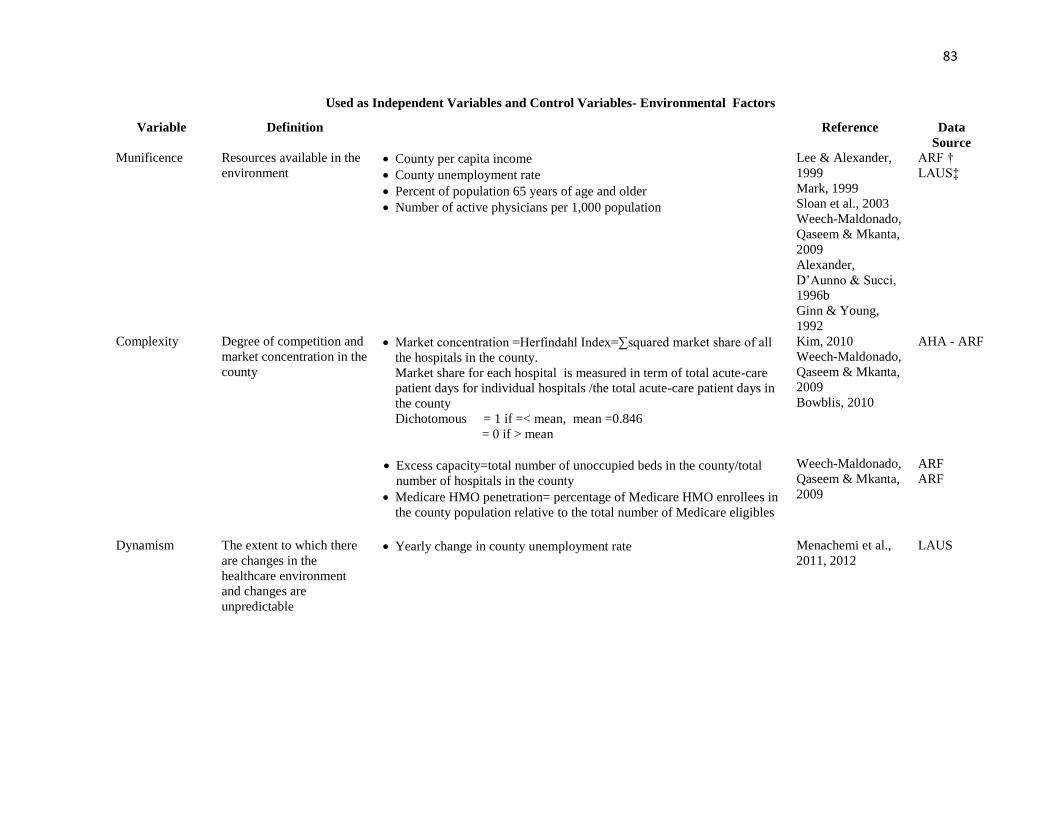
83
Used as Independent Variables and Control Variables- Environmental Factors
Variable Definition Reference Data
Source
Munificence
Resources available in the
environment
County per capita income
County unemployment rate
Percent of population 65 years of age and older
Number of active physicians per 1,000 population
Lee & Alexander,
1999
Mark, 1999
Sloan et al., 2003
Weech-Maldonado,
Qaseem & Mkanta,
2009
Alexander,
D‘Aunno & Succi,
1996b
Ginn & Young,
1992
ARF †
LAUS‡
Complexity
Degree of competition and
market concentration in the
county
Market concentration =Herfindahl Index=∑squared market share of all
the hospitals in the county.
Market share for each hospital is measured in term of total acute-care
patient days for individual hospitals /the total acute-care patient days in
the county
Dichotomous = 1 if =< mean, mean =0.846
= 0 if > mean
Excess capacity=total number of unoccupied beds in the county/total
number of hospitals in the county
Medicare HMO penetration= percentage of Medicare HMO enrollees in
the county population relative to the total number of Medicare eligibles
Kim, 2010
Weech-Maldonado,
Qaseem & Mkanta,
2009
Bowblis, 2010
Weech-Maldonado,
Qaseem & Mkanta,
2009
AHA - ARF
ARF
ARF
Dynamism The extent to which there
are changes in the
healthcare environment
and changes are
unpredictable
Yearly change in county unemployment rate
Menachemi et al.,
2011, 2012
LAUS

84
Used as Independent Variables and Control Variables- Organizational Factors
Variable Definition Measure Reference Data
source
Hospital size Bed size Total number of beds in the hospital Anderson, Allred,
& Sloan, 2003
Sloan, Ostermann,
& Conover, 2003
AHA
Teaching status The extent to which the
hospital is COTH member,
affiliated to a medical
school or offers residency
program
Dichotomous
Coded 1 if no teaching activities
Coded 0 if with teaching activities
Bazzoli & Andes,
1995
AHA
Control Variables
Variable Definition Measure Reference Data
source
Occupancy rate Extent to which the
hospital beds are used by
patients
Occupancy rate =total inpatient days at the hospital level /( # beds *365) Trussel & Patrick,
2010
MCR
Outpatient mix Proportion of outpatients
relative to inpatients
Total outpatient visits (equivalent inpatient days)
= total outpatient visits/3
Total equivalent inpatient days = (total outpatient patient visits / 3 ) +
total inpatient days
Outpatient mix = (total outpatient visit /3) / Total equivalent inpatient
days
Detsky et al., 1990
Insight, 2000
Vujicic, Addai &
Bosomprah, 2009
AHA
Payer mix Proportion of Medicaid
and Medicare enrollees Proportion of Medicare and Medicaid patients
Continuous variables
Medicaid mix = Medicaid inpatient days/total inpatient days
Medicare mix = Medicare inpatient days / total inpatient days
and private payers mix
Kazley and Ozcan
(2007)
AHA
Metropolitan vs.
non-
metropolitan
location
Whether the hospital
operates in a metropolitan
or nonmetropolitan area
Rural-Urban Continuum Codes, 2003.
Dichotomous: metro = 1; nonmetro = 0
Metro counties: codes 1,2,3 = 1
Nonmetro counties: codes 4,5,6,7,8,9 = 0
Dansky, Milliron &
Gamm, 1996
Kazley & Ozcan,
2007
ARF

85
Potentially Endogenous Variables
Variable Definition Measure Reference Data
source
Multihospital
system
membership
Whether the hospital is a
member of a multihospital
system
Dichotomous variable
Yes=1
No = 0
Hsieh, Clement,
Bazzoli, 2010
Zinn, Proenca &
Rosko, 1997
AHA
Participation in a
healthcare
network
Whether the hospital is a
participant in a healthcare
network
Dichotomous variable
Yes=1
No = 0
Bazzoli et al.
(2000)
AHA
Operating under
contract
management
Whether the hospital is a
under contract
management or not
Dichotomous variable
Yes=1
No = 0
Alexander and
Morrisey (1989)
AHA
Other information needed for the analysis
Hospital ID Unique identifier for each
hospital Medicare Provider Number AHA
MCR
Year
The impact of time on the
hospitals‘ situation
AHA
MCR
LAUS
ARF
FIPS State Code ARF AHA
FIPS County
Code
ARF AHA
Combined FIPS
state and FIPS
county code
ARF
AHA
LAUS * MCR means Medicare Cost Report **AHA means American Hospital Association
† ARF means Area Resource File ‡LAUS means Local Area Unemployment Statistics

86
CHAPTER 4
RESULTS
This chapter discusses the results and findings from the analyses that tested the
hypotheses pertaining to the three research questions this study attempted to answer. The
following analyses were performed for each research question: univariate analyses
(means and standard deviation and frequency tables), bivariate analyses (independent
samples t-tests and chi-squared tests), and regression analyses. For all the analyses,
hospital-year was the unit of analysis and sample size (N) accounts for repeated
observations.
Results from Research Question 1
Research question 1 investigated whether environmental factors and
organizational factors were associated with public hospital financial distress.
Table 4.1 presents the descriptive analysis of the variables included in the regression
analyses. Continuous variables are listed with their respective number of observations,
mean, standard deviation, and the lowest and highest measure of each variable.
Categorical variables are listed with their respective number of observations and coding.

87
Table 4.1
Descriptive Analysis of all Variables a
N Mean
(%)
Std. Dev. Minimum Maximum
Dependent variable – financial distress
Not in financial distress 6,316 (87.03)
In financial distress 941 (12.97)
Independent variables
Per capita income 7,249 26,541.19 8,883.36 0 132,728.00
Unemployment rate 7,238 5.74 2.64 1.10 28.20
Percentage of population>= 65 7,239 0.14 0.04 0.05 0.45
Physicians per 1000 population 7,239 1.86 1.98 0 35.00
Excess capacity 7,239 55.87 36.70 1.00 291.00
HHI
HHI > mean 5,199 (71.64)
HHI < =mean 2,058 (28.36)
Medicare HMO penetration 7,249 9.41 13.59 0 55.00
Change in unemployment rate 7,232 0.06 0.24 -0.68 2.07
Hospital beds 7,256 177.00 197.00 0 2,186.00
Teaching status
Teaching 1,594 (21.97)
No teaching 5,660 (78.03)
Control variables
Occupancy rate 7,155 0.56 0.19 0.02 1.00
Medicare mix 7,256 0.45 0.20 0 0.98
Medicaid mix 7,256 0.23 0.18 0 0.99
Outpatient mix 7,256 0.43 0.25 0 0.99
Potential endogenous variables
System membership
Non member 4,953 (68.25)
Member 2,304 (31.75)
Contract Management
No contract 6,138 (84.58)
Contract 1,119 (15.42)
Health network
No network 5,465 (75.31)
Network 1,792 (24.69) a Hospital-year is the unit of analysis, N accounts for repeated observations

88
Table 4.2 presents the results from the independent samples t-test on the
dependent dichotomous variable ―financial distress‖ and the continuous independent
variables. The number of observations of independent variables from the hospitals not in
financial distress varied between 6,297 and 6,315. The number of observations for the
hospitals in financial distress varied between 910 and 925. The null hypothesis of
independent samples t-test states that two independent samples come from populations
with the same mean with respect to the independent variables such as per capita income,
percentage of population of 65 years of age and over and number of active physicians per
1000 population (Norusis, 2006).
Two independent samples t-test can be performed based on the assumption that
the two samples have the same variances with regards to the independent variables. The
Folded F-test is needed to test the assumption of equality of variance. The Satterthwaite t-
test is the appropriate test if the assumption of equality of variance is violated; the Pooled
t-test is used otherwise (UCLA, 2012). The Satterthwaite t-test was significant at p <
0.05 for per capita income, number of physicians per 1000 population, Medicare HMO
penetration, number of hospital beds, occupancy rate, Medicare mix, Medicaid mix and
private mix indicating these variables do not have the same mean for the hospitals not in
financial distress and those in financial distress. The Pooled t-test was significant at p <
0.05 for variables unemployment rate and outpatient mix; it was marginally significant at
p < 0.10 for variable change in unemployment rate. Hospitals in finanical distress tended
to be located in counties with higher unemployment rate, higher Medicare HMO
penetration, and higher change in unemployment rate, higher per capita income and
higher number of physicians per 1000 population compared to hospitals not in finanical

89
distress. In addition, hospitals in financial distress were smaller, had lower outpatient mix
and Medicare mix and higher Medicaid mix.

90
Table 4.2
Independent Samples t-test on Dependent Variable “Financial Distress a
Variable Not in Financial Distress
In Financial Distress t-Value
N Mean Std. Dev.
N Mean Std. Dev
Per capita income 6,308 26,311.10 8582.10
941 28,083.50 10,562.50 -4.91*
Unemployment rate 6,301 5.68 2.64
937 6.11 2.66 -4.60**
Percentage of population>= 65 6,300 0.14 0.04
939 0.14 0.04 1.33
Physicians per 1000 population 6,300 1.82 1.96
939 2.14 2.10 -4.32*
Excess capacity 6,300 55.89 37.09
939 55.76 33.91 0.11
Medicare HMO penetration 6,308 8.43 12.77
941 16.00 0.55 -13.29*
Change in unemployment rate 6,297 0.05 0.24
935 0.07 0.24 -1.77*
Hospital beds 6,315 179 194.90
941 164 213.20 1.97*
Occupancy rate 6,245 0.56 0.19
910 0.57 0.22 -2.35*
Outpatient mix 6,315 0.44 0.25
941 0.41 0.25 2.61**
Medicare mix 6,315 0.46 0.19
941 0.40 0.23 8.69*
Medicaid mix 6,315 0.23 0.17
941 0.28 0.22 -7.40*
T-test **p < 0.05 *p < 0.10 a Hospital-year is the unit of analysis. N accounts for repeated observations
91
A cross-tabulation followed by Chi-square tests was performed to test the null
hypothesis that the population has the same percentage of hospitals in financial distress
and those not in financial distress with respect to dichotomous variables Hirschman
Herfindahl index, system membership, health network and teaching status (Norusis,
2006). The Chi-square tests of these variables were statistically significant at p<0.05,
except for variable contract management which was significant at p < 0.1 indicating that
these variables did not have the same percentage of hospitals in financial distress and
hospitals not in financial distress.
A total of 941 observations (13%) of all observations were in financial distress
for each of the categorical variables except for teaching status with a total of 938
observations in financial distress. Of these 941 observations, 44% were located in areas
with higher competition, 52% were members of multihospital systems, 15% were under
contract management, and 18% participated in health network. Of the 938 observations
in financial distress with respect to teaching status, 626 (67%) did not have teaching
status. Table 4.3 summarizes the findings from the cross-tabulation and Pearson Chi-
square tests and table 4.4 presents the Pearson correlation matrix of the independent
variables.

92
Table 4.3
Cross-tabulation and Pearson Chi-Square Test on Dependent variable “Financial
Distress”a
Pearson Chi-square statistic **
p < 0.05 * p < 0.1
a Hospital-year is the unit of analysis
Variable Chi-square
statistic No financial
distress (%)
Financial distress
(%)
HHI
123.14 **
HHI>mean 4,668 (64.32) 531 (7.32)
HHI<=mean 1,648 ( 22.71) 410 (5.65)
System
Membership
208.26 ** Non member 4,503 (62.05) 450 (6.20)
Member 1,813 (24.98) 491 (6.77)
Contract Management
0.090 * No contract 5,339 (73.57) 799 (11.01)
Contract 977 (13.47) 142 (1.96)
Health network
25.73 ** No network 4,695 (64.70) 770 (10.61)
Network 1,621 (25.66) 171(2.36)
Teaching status
81.58 ** Teaching 1,281 (17.66) 313 (4.31)
No teaching 5,035 (69.41) 625 (8.62)

93
Table 4.4
Pearson Correlation Matrix of Independent Variables
1 2 3 4 5 6 7 8 9 10 11 12 13
1. Financial distress 1
2. Per capita income 0.07**
1
3. Percentage of
population >= 65 -0.02
-0.17** 1
4. Unemployment
Rate 0.05**
-0.19** -0.02 1
5. Physicians per 1000
population 0.05**
0.38** -0.19** -0.17** 1
6. Excess capacity
-0.001
0.34** -0.22** -0.15** 0.50** 1
7. Medicare HMO
penetration 0.19**
0.39** -0.19** 0.005 0.22** 0.031** 1
8. Change in
unemployment rate 0.02
0.21** 0.04* 0.32** 0.03* 0.04* 0.14** 1
9. Hospital beds
-0.02* 0.34** -0.18** -0.10** 0.50** 0.66** 0.31** 0.05** 1
10. Occupancy rate
0.03* 0.27** -0.21** -0.05** 0.37** 0.32** 0.30** 0.01 0.50 1
11. Outpatient mix
-0.03* 0.06** 0.04* -0.19** -0.01 -0.09** -0.12** -0.21** -0.15** 0.31** 1
12. Medicare mix
-0.11** -0.17** 0.26** -0.02 -0.25** -0.26** -0.27** 0.01 -0.36** -0.54** 0.25** 1
13. Medicaid mix
0.10** 0.3* -0.14** -0.13** 0.07** 0.11** 0.14** -0.01 0.22** 0.44** -.023** -0.72** 1
Pearson correlation coefficient **p < 0.001 *p < 0.05

94
The correlation matrix in table 4.4 depicts the Pearson correlation coefficients
among independent variables. The null hypothesis for Pearson correlation states that
there is no significant association between two variables. While pairs of several variables
had significant associations, their correlation coefficients did not indicate potential for
multicollinearity issue. Multicollinearity arises when the correlation coefficient is equal
to or above 0.80 (Field, 2009), it becomes problematic because it produces biased and
inflated standard errors (Wooldridge, 2006). The correlation between Medicare mix and
Medicaid mix had the highest correlation with an absolute value of 0.72. The negative
correlation coefficients between percentage of population 65 years of age and over and
Medicare HMO penetration, and occupancy rate seem counterintuitive as elderly people
are more likely to use healthcare services.
The next section discusses the inferential statistics that tested the five hypotheses
associated with research question 1. The first hypothesis tested whether environmental
munificence was negatively associated with financial distress. The second and third
hypotheses tested whether environmental dynamism and environmental complexity were
positively associated with financial distress, respectively. The fourth hypothesis tested
whether hospital size was negatively associated with financial distress and the fifth
hypothesis tested whether teaching status was negatively associated with financial
distress.
The test of these hypotheses consisted of three fixed-effects logistic regression
models. Logistic regression is appropriate for dichotomous dependent variables; it
addresses the violation of normality assumption, due to non-linear dependent variable,
required in linear regression. Fixed-effects model assumes that some unobserved

95
variables, which do not change over time, are associated with the independent variables.
Thus, the model controls for these time-invariant variables such as geographical location.
Three models were used to address some concern over the potential endogeneity of three
interorganizational variables membership of a multihospital system, operation under
contract management and participation in a health network to financial distress. Hospitals
might initiate such arrangements because they have already experienced financial distress
(McCue & Furst, 1986). These arrangements might be the solution to financial distress.
The first regression model used the environmental and organizational variables only, the
second model included the variables with potential endogeneity to financial distress, and
the third model was the full model comprising all the variables from the second model
and the control variables (Morrisey, Menachemi, Cawley & Ginter, 2010). The overall
likelihood ratio Chi-square tests of the three models were significant at p < 0.0001.
Results of fixed-effects logistic regressions.
Hypothesis 1. Hypothesis 1was not supported; environmental munificence was
not associated with lower probability of financial distress.
Hypothesis 2. Hypothesis 2 was not supported. High environmental dynamism in
terms of yearly change in unemployment rate was not associated with higher probability
of financial distress.
Hypothesis 3. Hypothesis 3 was partially supported by models 1 and 3. A higher
environmental complexity in terms of greater Medicare HMO penetration was
significantly associated with a greater odds of experiencing financial distress, OR = 1.03,
p < 0.05, 95% CI [1.00, 1.06]. High environmental complexity in terms of market
96
concentration and excess capacity was not associated with higher odds of experiencing
financial distress.
Hypothesis 4. Hypothesis 4 was supported by the three models. Larger hospitals
were significantly less likely to experience financial distress than smaller hospitals, OR =
0.996, p < 0.05, 95 % CI [0.99, 1.00].
Hypothesis 5. Hypothesis 5 was not supported. Teaching status was not
associated with financial distress.
The results also indicated that variable system membership was significantly
associated with financial distress. The odds of experiencing finanical distress for
hospitals members of multihospital systems was 2.80 times greater than the odds of
experiencing financial distress for stand-alone hospitals, OR = 2.80, p < 0.001, 95% CI
[1.67, 4.68]. Variable contract management was not associated with financial distress.
Variable health network was significantly and negatively associated with financial
distress. Hospitals participating in health networks were significantly less likely to
experience financial distress than non-participating hospitals, OR = 0.63, p < 0.05, 95%
CI [0.43, 0.93].
In addition, variable outpatient mix was negatively associated with financial
distress. The association was marginally significant. Higher proportion of outpatients was
associated with smaller odds of experiencing financial distress, OR = 0.14, p < 0.10, 95%
CI [0.14, 1.18]. Table 4.5 presents the results of the analyses for research question 1.

97
Table 4.5
Results of Fixed-effects Logistic Regressions e
Financial distress Model 1a (N = 2412) d Model 2b (N=2412) d Model 3c (N= 2344) d
Odds
Ratio
Standard
Error 95% CId Odds
Ratio
Standard
Error 95% CId Odds
Ratio
Standard
Error 95% CId
Munificence
Per capita income 1.003 0.03 0.95 1.06 0.99 0.03 0.94 1.05 0.99 0.03 0.94 1.04
Unemployment rate 1.04 0.05 0.95 1.14
1.04 0.05 0.95 1.14
1.05 0.50 0.66 1.15
Percent >=65 1.07 0.56 0.96 1.18 1.06 0.55 0.96 1.18 1.05 0.06 0.95 1.17
Physicians/1000pop 0.94 0.16 0.67 1.31 0.90 0.16 0.64 1.28 0.91 0.16 0.64 1.30
Complexity
HHI 0.79 0.17 0.52 1.21 0.77 0.17 0.50 1.19 0.73 0.16 0.47 1.14
Excess capacity 1.002 0.004 0.99 1.01 1.002 0.004 0.99 1.01 1.00 0.005 0.99 1.00
HMO penetration 1.03** 0.01 1.001 1.06 1.02 0.15 0.99 1.05 1.03 ** 0.02 1.00 1.06
Dynamism
Change in
unemployment rate 0.99 0.38 0.46 2.11
0.99 0.39 0.46 2.13
0.81 0.32 0.38 1.78
Organizational factors
Hospital beds 0.996** 0.001 0.99 1.00 0.996** 0.001 0.99 1.00 0.996 ** 0.001 0.99 1.00
Teaching status 1.31 0.44 0.68 2.54 1.22 0.41 0.63 2.37 1.25 0.43 0.63 2.45
Potential endogenous
variables
System
Membership
2.80*** 0.73 1.68 4.67
2.79*** 0.73 1.67 4.67
Contract
management
1.33 0.27 0.89 1.99
1.36 0.29 0.90 2.05
Health network 0.65** 0.12 0.45 0.94 0.63 ** 0.12 0.43 0.93
Control variables
Occupancy rate 0.59 0.34 0.19 1.83
Outpatient mix 0.41* 0.22 0.14 1.18
Medicare mix 0.99 0.53 0.35 2.85
Medicaid mix 1.17 0.58 0.44 3.08
Overall Chi-square test 103.41*** 129.87*** 139.76***
*p < 0.1 **p < 0.05 ***p < 0.001 a Model with environmental and organizational independent variables b Model with environmental and organizational independent variables and endogenous variables c Full model d CI means confidence interval d N represents hospital-years e year dummy variables are included in the analysis
98
Results from Research Question 2
Research question 2 asked whether financial distress precedes public hospital
privatization (hypothesis 6). Two models of random effects logistic regression with state
fixed-effects were constructed. The first model included independent variables lagged by
one year and the second model contained independent variables lagged by two years.
Lagging the independent variables was appropriate for research question 2 due to the fact
that hospitals do not immediately decide to privatize as soon as they experience financial
distress. For research question 2, all the environmental, organizational and potential
endogenous variables were used as control variables. Table 4.6 summarizes the number
of observations with respect to both continuous and categorical variables. The number of
observations ranged between 6,407 and 6,432.
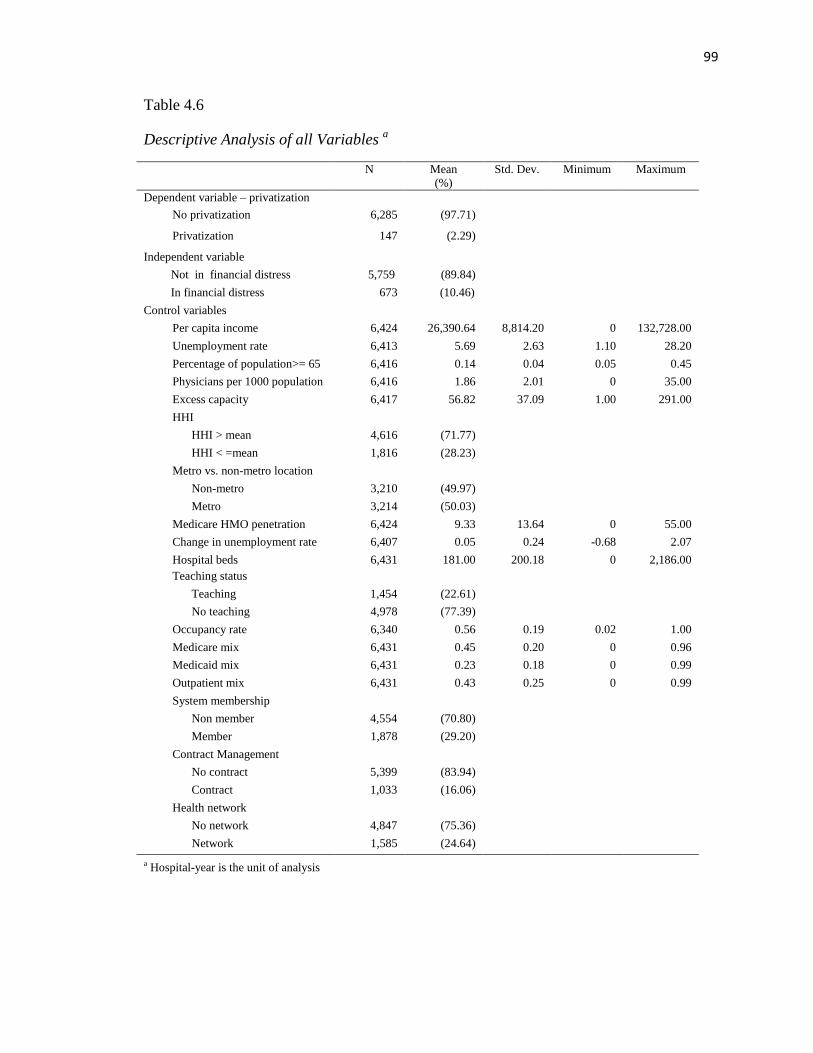
99
Table 4.6
Descriptive Analysis of all Variables a
N Mean
(%)
Std. Dev. Minimum Maximum
Dependent variable – privatization
No privatization 6,285 (97.71)
Privatization 147 (2.29)
Independent variable
Not in financial distress 5,759 (89.84)
In financial distress 673 (10.46)
Control variables
Per capita income 6,424 26,390.64 8,814.20 0 132,728.00
Unemployment rate 6,413 5.69 2.63 1.10 28.20
Percentage of population>= 65 6,416 0.14 0.04 0.05 0.45
Physicians per 1000 population 6,416 1.86 2.01 0 35.00
Excess capacity 6,417 56.82 37.09 1.00 291.00
HHI
HHI > mean 4,616 (71.77)
HHI < =mean 1,816 (28.23)
Metro vs. non-metro location
Non-metro 3,210 (49.97)
Metro 3,214 (50.03)
Medicare HMO penetration 6,424 9.33 13.64 0 55.00
Change in unemployment rate 6,407 0.05 0.24 -0.68 2.07
Hospital beds 6,431 181.00 200.18 0 2,186.00
Teaching status
Teaching 1,454 (22.61)
No teaching 4,978 (77.39)
Occupancy rate 6,340 0.56 0.19 0.02 1.00
Medicare mix 6,431 0.45 0.20 0 0.96
Medicaid mix 6,431 0.23 0.18 0 0.99
Outpatient mix 6,431 0.43 0.25 0 0.99
System membership
Non member 4,554 (70.80)
Member 1,878 (29.20)
Contract Management
No contract 5,399 (83.94)
Contract 1,033 (16.06)
Health network
No network 4,847 (75.36)
Network 1,585 (24.64)
a Hospital-year is the unit of analysis

100
Independent samples t-tests were performed to test whether the population of
public hospitals that privatized had the same means as the population of public hospitals
that did not privatize with respect to the continuous independent variables. The t-tests
were significant at p <0.05 for all variables except for outpatient mix indicating that the
means of this variable was the same for population of public and private hospitals
respectively. Hospitals that privatized tended to be located in areas with lower per capita
income, lower unemployment rate, lower number of physicians per 1000 population,
lower excess capacity, higher Medicare HMO penetration, higher change in
unemployment rate and higher percentage of population 65 years of age and over,
compared to hospitals that remained public. They also tended be smaller and had lower
occupancy rate, lower outpatient mix, higher Medicare mix, lower Medicaid mix. Table
4.7 presents the summary of the independent samples t-tests.
Cross-tabulation followed by Chi-square tests was conducted to investigate the
association of categorical variables with privatization variable. All the independent
variables were significant at p < 0.05 except for variables HHI and health network that
were marginally significant at p < 0.10. One hundred and forty seven hospitals (2.29%)
privatized. Among hospitals that privatized, 46 (31%) were in financial distress, 32
(28%) were located in more competitive markets, 60 (41%) were located in metropolitan
areas, 76 (52%) were members of multihospital systems, 25 (17%) operated under
contract management, 46 (31%) participated in health care network, and 134 (91%) did
not provide medical education.

101
Among hospitals that remained public, (hospital-years N = 6,285), 10% were in
financial distress (hospital-years N = 627). Table 4.8 summarizes the cross-tabulation and
Chi-square tests. The correlation matrix in Table 4.9 shows the same patterns as in the
correlation matrix for research question 1. The correlation between Medicare mix and
Medicaid mix had the highest number in term of absolute value.

102
Table 4.7
Independent Samples t-Tests on Dependent Variable Privatization a
No Privatization Privatization
Variable N Mean Std. Dev. N Mean Std. Dev t-Value
Per capita income 6,278 26,434.50 8,837.80 146 24,502.80 7,516.1 3.06*
Unemployment rate 6,266 5.70 2.63 147 5.21 2.37 2.47*
Percentage of population>= 65 6,270 0.140 0.04 146 0.145 0.04 -2.67*
Physicians per 1000 population 6,270 1.87 2.02 146 1.62 1.43 1.99*
Excess capacity 6,272 57.07 37.15 145 46.11 32.44 4.01*
Medicare HMO penetration 6,278 9.39 13.67 146 6.71 11.90 2.68*
Change in unemployment rate 6,260 0.05 0.23 147 0.01 0.19 2.71 *
Hospital beds 6,285 182.00 201.00 146 119.00 148.4 5.04*
Occupancy rate 6,195 0.56 0.00 145 0.50 0.02 3.51*
Outpatient mix 6,285 0.43 0.25 146 0.41 0.29 0.33
Medicare mix 6,285 0.45 0.20 146 0.49 0.23 -2.19*
Medicaid mix 6,285 0.24 0.18 146 0.20 0.19 2.45*
t- Value *p < 0.05 a Hospital-year is the unit of analysis

103
Table 4.8
Chi-square Tests on Dependent Variable “Privatization” a
Pearson Chi-square statistic **
p < 0.05 *
p < 0.1 a Hospital-year is the unit of analysis
Variable Chi-square Statistic No privatization (%) Privatization (%)
Financial distress
69.67** No distress 5,658 (87.97) 101 (1.57)
Distress 627 (9.75) 46 (15.38)
HHI
3.10* HHI > mean 4,501 (69.98) 115 (7.32)
HHI<=mean 1,784 ( 27.74) 32 (5.65)
Metro vs. non-metro location
4.77** Non-metro 3,124 (48.63) 86 (1.34)
Metro 3,154 (49.10) 60 (0.93
System
Membership
36.85** Non member 4,483 (69.70) 71 (1.10)
Member 1,802 (28.67) 76 (51.70)
Contract Management
0.10 No contract 5,277 (82.04) 122 (1.90)
Contract 1,008 (15.67) 25 (2.42)
Health network
3.58* No network 4,746 (73.79) 101 (1.57)
Network 1,539 (23.93) 46 (0.72)
Teaching status
16.29** Teaching 1,441 (22.40) 13 (0.02)
No teaching 4,844 (97.31) 134 (2.69)

104
Table 4.9
Pearson Correlation Matrix Research Question 2
1 2 3 4 5 6 7 8 9 10 11 12 13 14
1. Financial distress 1
2. Privatization
0.10*** 1
3. Per capita income
0.08*** -0.03** 1
4. Percentage of
population >= 65 -0.05*** 0.03** -0.18*** 1
5. Unemployment rate 0.04** -0.03** -0.18*** -0.02* 1
6. Physicians per 1000
population 0.07*** -0.02 0.37*** -0.18*** -0.17*** 1
7. Excess capacity
0.03 -0.04** 0.34*** -0.22*** -0.15*** 0.49*** 1
8. Medicare HMO penetration
0.23*** -0.03** 0.38*** -0.19*** -0.01 0.22*** 0.32*** 1
9. Change in unemployment rate
0.003 -0.03** 0.21*** 0.04** 0.31*** 0.04** 0.05** 0.13*** 1
10. Hospital beds
0.02 -0.05** 0.36*** -0.16*** -0.09*** 0.50*** 0.65*** 0.33*** 0.05*** 1
11. Occupancy rate
0.06*** -0.05*** 0.28*** -0.21** -0.06*** 0.36*** 0.32*** 0.32*** 0.02 0.50*** 1
12. Outpatient mix
-0.04** -0.01 0.07*** 0.04** -0.18*** -0.01 -0.08*** -0.12*** -0.19*** -0.14*** -0.29*** 1
13. Medicare mix
-0.15*** 0.03** -0.21*** 0.27*** -0.01 -0.27*** -0.27*** -0.29*** 0.002 -0.36*** -0.53*** 0.24*** 1
14. Medicaid mix 0.11*** -0.03** 0.06*** -0.15***
0.13***
0.08*** 0.12*** 0.16*** -0.01 0.23*** 0.42*** -0.22*** -0.70***
1
Pearson correlation coefficient ***
p < 0.001 **
p < 0.05 *
p < 0.1

105
The following section discusses the findings from the random-effects logistic
regression with state fixed effects for research question 2.
Hypothesis 6 was supported by models 1 and 2. Financial distress was
significantly associated with privatization. Model 1 found that the odds of privatization
for hospitals in financial distress was 3.48 times greater than the odds of privatization for
hospitals not in financial distress, OR = 3.48, p < 0.001, 95% CI [2.11, 5.75]. Model 2
found that the odds of privatization for hospitals in financial distress was 2.59 times
greater than the odds of privatization for hospitals not in financial distress OR = 2.59,
p < 0.001, 95% CI [1.39, 4.84]. The control environmental variables as well as hospital
size were not significantly associated with privatization. Model 1 found a marginally
significant positive association between teaching status and privatization. The odds of
privatization for hospitals without teaching status was 2.09 times greater than the odds for
public hospitals with teaching status, OR = 2.09, p < 0.10, 95% CI [0.89, 4.93]). That
association was strongly significant for model 2. The odds of privatization for hospitals
without teaching status was 3.07 times greater than the odds for public hospitals with
teaching status, OR = 3.07, p < 0.005, 95% CI [1.035, 9.12].
In addition, both models found that affiliation with multihospital systems was
positively and significantly associated with privatization. That association was strongly
significant for model 1, OR = 2.49, p<0.001, 95% CI [1.57, 3.96]. The odds of
privatization for hospitals affiliated to a multihospital system was 2.49 times greater than
the odds of privatization for stand-alone hospitals. The association between multihospital
system affiliation and privatization was marginally significant for model 2, OR = 1.64,
p<0.1, 95% CI [0.94, 2.88].

106
Model 1 found a marginally significant negative association between contract
management and privatization. Hospitals operating under contract management were less
likely to privatize than hospitals without contract management, OR = 0.62, p<0.1, 95%
CI [0.36, 1.07]. Besides, occupancy rate had a strongly significant negative association
with privatization for model 1. Hospitals with higher occupancy rate were significantly
less likely to privatize than hospitals with lower occupancy rate, OR = 0.20, p < 0.05,
95% CI [0.05, 0.80]. Table 4.10 summarizes the findings from the two models.
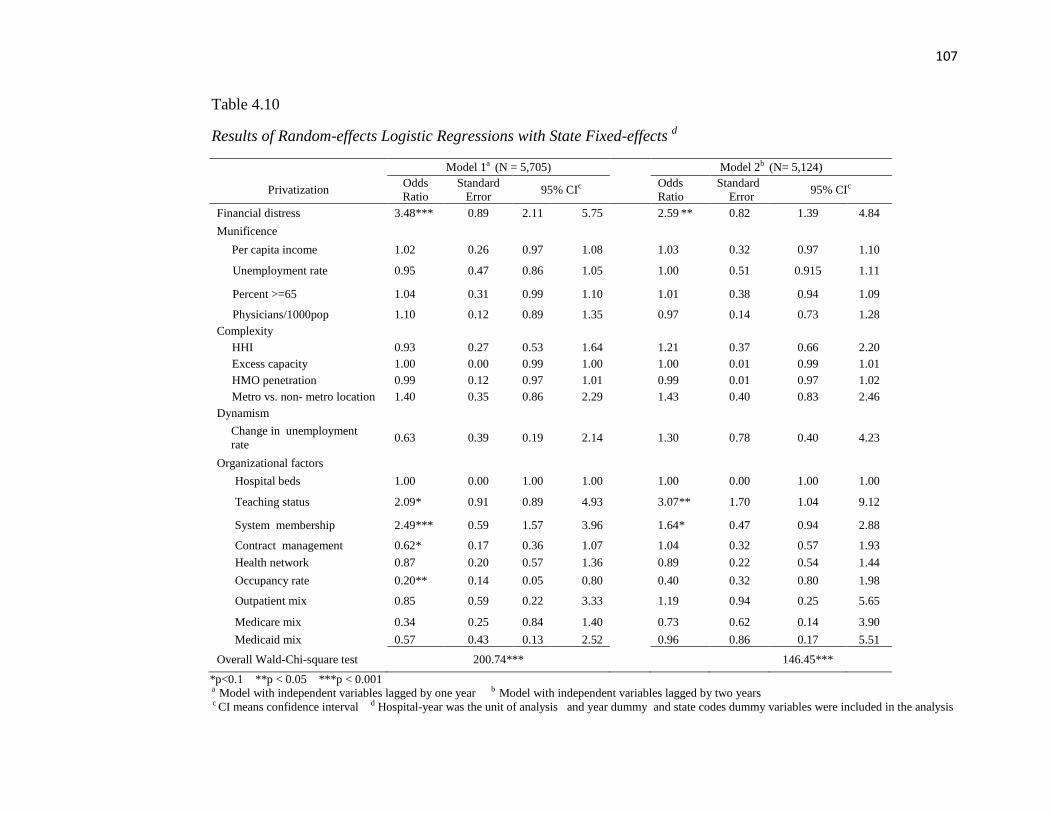
107
Table 4.10
Results of Random-effects Logistic Regressions with State Fixed-effects d
Model 1a (N = 5,705) Model 2b (N= 5,124)
Privatization Odds
Ratio
Standard
Error 95% CIc
Odds
Ratio
Standard
Error 95% CIc
Financial distress 3.48*** 0.89 2.11 5.75 2.59 ** 0.82 1.39 4.84
Munificence
Per capita income 1.02 0.26 0.97 1.08 1.03 0.32 0.97 1.10
Unemployment rate 0.95 0.47 0.86 1.05 1.00 0.51 0.915 1.11
Percent >=65 1.04 0.31 0.99 1.10 1.01 0.38 0.94 1.09
Physicians/1000pop 1.10 0.12 0.89 1.35 0.97 0.14 0.73 1.28
Complexity
HHI 0.93 0.27 0.53 1.64 1.21 0.37 0.66 2.20
Excess capacity 1.00 0.00 0.99 1.00 1.00 0.01 0.99 1.01
HMO penetration 0.99 0.12 0.97 1.01 0.99 0.01 0.97 1.02
Metro vs. non- metro location 1.40 0.35 0.86 2.29 1.43 0.40 0.83 2.46
Dynamism
Change in unemployment
rate 0.63 0.39 0.19 2.14 1.30 0.78 0.40 4.23
Organizational factors
Hospital beds 1.00 0.00 1.00 1.00 1.00 0.00 1.00 1.00
Teaching status 2.09* 0.91 0.89 4.93 3.07** 1.70 1.04 9.12
System membership 2.49*** 0.59 1.57 3.96 1.64* 0.47 0.94 2.88
Contract management 0.62* 0.17 0.36 1.07 1.04 0.32 0.57 1.93
Health network 0.87 0.20 0.57 1.36 0.89 0.22 0.54 1.44
Occupancy rate 0.20** 0.14 0.05 0.80 0.40 0.32 0.80 1.98
Outpatient mix 0.85 0.59 0.22 3.33 1.19 0.94 0.25 5.65
Medicare mix 0.34 0.25 0.84 1.40 0.73 0.62 0.14 3.90
Medicaid mix 0.57 0.43 0.13 2.52 0.96 0.86 0.17 5.51
Overall Wald-Chi-square test 200.74*** 146.45***
*p<0.1 **p < 0.05 ***p < 0.001 a Model with independent variables lagged by one year b Model with independent variables lagged by two years c CI means confidence interval d Hospital-year was the unit of analysis and year dummy and state codes dummy variables were included in the analysis
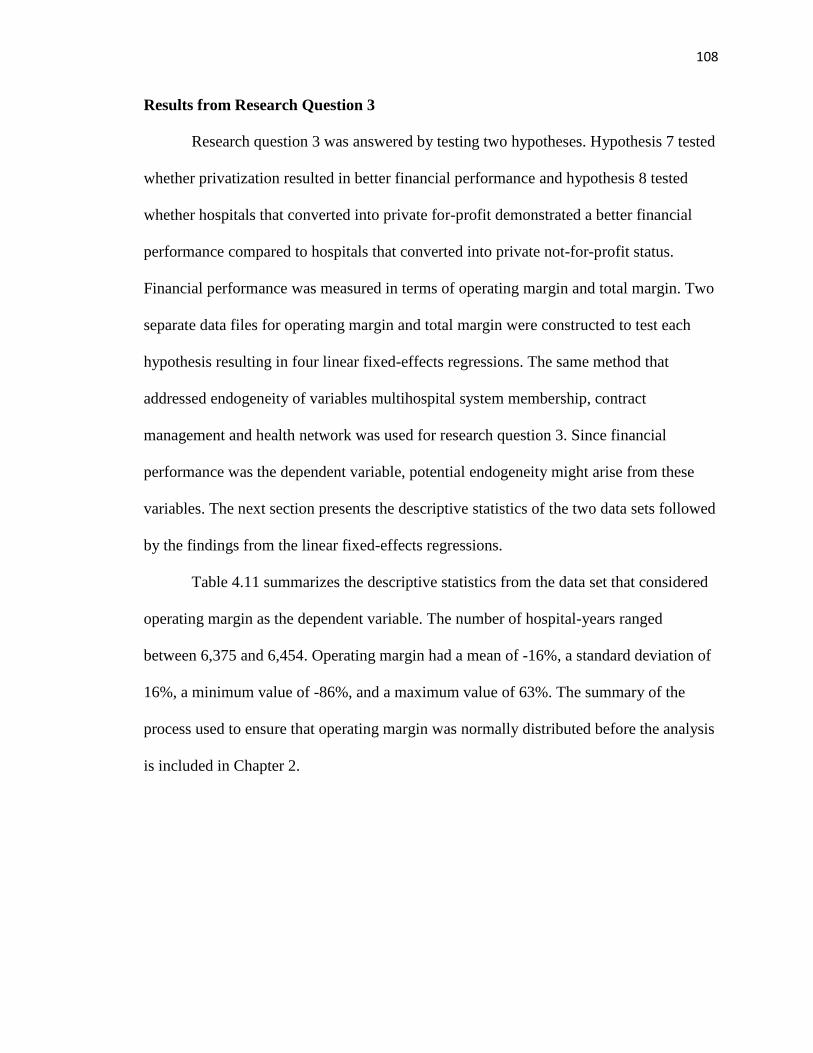
108
Results from Research Question 3
Research question 3 was answered by testing two hypotheses. Hypothesis 7 tested
whether privatization resulted in better financial performance and hypothesis 8 tested
whether hospitals that converted into private for-profit demonstrated a better financial
performance compared to hospitals that converted into private not-for-profit status.
Financial performance was measured in terms of operating margin and total margin. Two
separate data files for operating margin and total margin were constructed to test each
hypothesis resulting in four linear fixed-effects regressions. The same method that
addressed endogeneity of variables multihospital system membership, contract
management and health network was used for research question 3. Since financial
performance was the dependent variable, potential endogeneity might arise from these
variables. The next section presents the descriptive statistics of the two data sets followed
by the findings from the linear fixed-effects regressions.
Table 4.11 summarizes the descriptive statistics from the data set that considered
operating margin as the dependent variable. The number of hospital-years ranged
between 6,375 and 6,454. Operating margin had a mean of -16%, a standard deviation of
16%, a minimum value of -86%, and a maximum value of 63%. The summary of the
process used to ensure that operating margin was normally distributed before the analysis
is included in Chapter 2.

109
Table 4.11 Descriptive Statistics on the Operating Margin Data Set a
N Mean (%) Std. Dev. Minimum Maximum
Dependent variable
Operating Margin 6,454 -0.06 0.16 -0.86 0.63
Independent variable –privatization *
No privatization 5,832 (90.36)
Privatization 622 (9.64)
Independent variable –Public to For-Profit**
No privatization 6,298 (97.58)
Public to for-profit 156 (2.42)
Independent variable- Public to not-for-profit**
No privatization 5,988 (92.78)
Public to not-for-profit 466 (7.22)
Control variables
Per capita income 6,447 26,564.33 8,678.47 0 132,728.00
Unemployment rate 6,437 5.73 2.64 1.10 28.20
Percentage of population > = 65 6,439 0.14 0.04 0.05 0.45
Physicians per 1000 population 6,439 1.84 1.97 0 35.00
Excess capacity 6,440 56.50 36.45 1.00 291.00
HHI
HHI > mean 4,704 (72.89)
HHI < = mean 1,750 (27.11)
Medicare HMO penetration 6,447 9.24 13.45 0 55.00
Change in unemployment rate 6,433 0.06 0.25 -0.68 2.07
Hospital beds 6,454 181.00 198.40 0 2,186.00
Teaching status
Teaching 1,340 (20.76)
No teaching 5,114 (79.24)
Occupancy rate 6,375 0.56 0.19 0.02 1.00
Medicare mix 6,454 0.46 0.19 0 0.96
Medicaid mix 6,454 0.23 0.17 0 0.99
Outpatient mix 6,454 0.43 0.25 0 0.97
Potential endogenous variables
System membership
Non member 4,511 (69.89)
Member 1,943 (30.11)
Contract Management
No contract 5,447 (84.40)
Contract 1,007 (15.60)
Health network
No network 4,833 (74.88)
Network 1,621 (25.12) a Hospital-year was the unit of analysis
* Independent variable for first hypothesis ** Independent variable for second hypothesis

110
Independent samples t-tests on operating margin were performed with respect to
dichotomous independent variable ―privatization‘ as well as control variables HHI,
system membership, contract management, health network and teaching status. All the
variables met the equality of variance assumption and their respective Statterthwaite tests
were statistically significant at p < 0.05, suggesting that the groups had different means
with respect to operating margin.
Hospitals that privatized had a higher mean operating margin (-1%) compared to
hospitals that remained public (- 6%). Hospitals members of multihospital systems as
well as those under contract management and those involved in health network tended to
have higher operating margin. Non-teaching hospitals tended to have higher operating
margin relative to teaching hospitals. Table 4.12 summarizes the independent samples t-
test on operating margin and table 4.13 presents the correlation matrix of the variables.
The same correlation pattern as in the first two research questions was noticed in the data
set with normally distributed operating margin.

111
Table 4.12
Independent Samples t-Tests on Operating Margin
* All t-Values significant at p < 0.05
Operating Margin
Variable N Mean Std. Dev. t-Value*
Privatization
Public vs. Private
No privatization 5,832 -0.06 0.16
-9.87
Privatization 622 -0.01 0.12
HHI
> mean 4,707 -0.04 0.13 13.12
=<mean 1,750 -0.11 0.21
System
Membership
Non member 5,411 -0.07 0.16 -8.57
Member 1,943 -0.03 0.15
Contract
Management
No contract 5,447 -0.06 0.17 -4.27
Contract 1,007 -0.04 0.13
Health network
No network 4,833 -0.06 0.17 -6.55
Network 1,621 -0.04 0.14
Teaching status
Teaching 1,340 -0.13 0.22 -13.98
No teaching = 1 5,114 -0.04 0.13

112
Table 4.13
Correlation Matrix of Data Set for Operating Margin
1 2 3 4 5 6 7 8 9 10 11 12 13 14
1. Operating margin
1
2. Per capita income
-0.08** 1
3. Unemployment rate
-0.03* -0.18** 1
4. Percentage of
population >= 65 -0.01 -0.15** -0.01 1
5. Physicians per 1000
population -0.04* 0.34** -0.18** -0.17** 1
6. Excess capacity
0.00 0.32** -0.15** -0.19** 0.48** 1
7. Medicare HMO
penetration -0.12** 0.38** -0.01** -0.16** 0.20** 0.30**
1
8. Change in
unemployment rate -0.00
0.21**
0.33** 0.04* 0.03* 0.04* 0.15** 1
9. Hospital beds
-0. 09** 0.33** -0.10** -0.16** 0.51** 0.65** 0.31** 0.04* 1
10. Occupancy rate
0.28** 0.25** -0.06** -0.19** 0.37** 0.32** 0.29** 0.01 0.50** 1
11. Outpatient mix
-0.06** 0.04* -0.20** 0.05* -0.02 -0.11** -0.13** -0.23** -0.17** -0.30** 1
12. Medicare mix
-0.15** -0.02** -0.01 0.25** -0.22** -0.24** -0.27** 0.01 -0.36** -0.51** 0.25** 1
13. Medicaid mix
-0.10** 0.01 0.13** -0.14** 0.06** 0.10** 0.11** -0.20 0.21** 0.41** -0.23** -0.72** 1
14. Private mix
-0.08** 0.21** -0.15** -0.17** 0.24** 0.22** 0.22** 0.01 0.23** 0.20** -0.05** -0.49** -0.26** 1
Pearson correlation coefficient **p < 0.001 *p < 0.05

113
The next section presents the descriptive statistics of the data set that was used for
dependent variable total margin. The number of hospital-years ranged between 6,497 and
6,579. Table 4.14 summarizes the descriptive statistics of the variables. Total margin had
a mean of 3% with a minimum value of -34% and a maximum value of 38%.
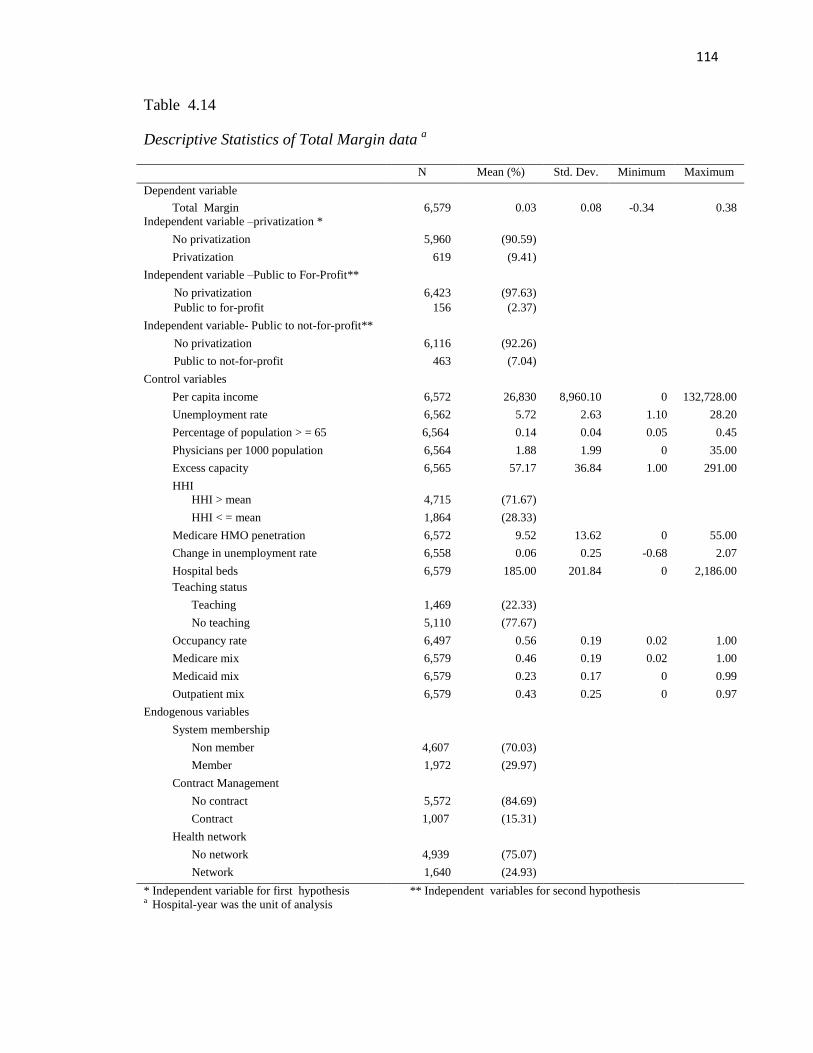
114
Table 4.14
Descriptive Statistics of Total Margin data a
N Mean (%) Std. Dev. Minimum Maximum
Dependent variable
Total Margin 6,579 0.03 0.08 -0.34 0.38
Independent variable –privatization *
No privatization 5,960 (90.59)
Privatization 619 (9.41)
Independent variable –Public to For-Profit**
No privatization 6,423 (97.63)
Public to for-profit 156 (2.37)
Independent variable- Public to not-for-profit**
No privatization 6,116 (92.26)
Public to not-for-profit 463 (7.04)
Control variables
Per capita income 6,572 26,830 8,960.10 0 132,728.00
Unemployment rate 6,562 5.72 2.63 1.10 28.20
Percentage of population > = 65 6,564 0.14 0.04 0.05 0.45
Physicians per 1000 population 6,564 1.88 1.99 0 35.00
Excess capacity 6,565 57.17 36.84 1.00 291.00
HHI
HHI > mean 4,715 (71.67)
HHI < = mean 1,864 (28.33)
Medicare HMO penetration 6,572 9.52 13.62 0 55.00
Change in unemployment rate 6,558 0.06 0.25 -0.68 2.07
Hospital beds 6,579 185.00 201.84 0 2,186.00
Teaching status
Teaching 1,469 (22.33)
No teaching 5,110 (77.67)
Occupancy rate 6,497 0.56 0.19 0.02 1.00
Medicare mix 6,579 0.46 0.19 0.02 1.00
Medicaid mix 6,579 0.23 0.17 0 0.99
Outpatient mix 6,579 0.43 0.25 0 0.97
Endogenous variables
System membership
Non member 4,607 (70.03)
Member 1,972 (29.97)
Contract Management
No contract 5,572 (84.69)
Contract 1,007 (15.31)
Health network
No network 4,939 (75.07)
Network 1,640 (24.93)
* Independent variable for first hypothesis ** Independent variables for second hypothesis a Hospital-year was the unit of analysis

115
The summary of the independent samples t-test on the association between total
margin and dichotomous variables privatization, HHI, system membership, contract
management, health network and teaching status in table 4.15 demonstrated that a total of
619 hospital-years (1.11%) had private status. Hospitals that privatized had a mean total
margin of 4% relative to 3% for those that remained public. While the Folded test was
significant at p < 0.05 for variable privatization with respect to total margin, the
Statterthwaite test was not significant, indicating that the mean of total margin between
the observations that privatized and those that did not privatize were the same.
Statterthwaite test was significant at p < 0.05 for HHI, system membership, health
network and teaching status.

116
Table 4.15
Independent Samples t-Tests on Total Margin a
t-Value *p < 0.05 a Hospital-year was the unit of analysis
Table 4.16 presents the correlation matrix of the variables from the data set used
to make total margin normally distributed. Similar to previous correlations matrices, the
correlation between Medicaid mix and Medicare mix had the highest correlation
coefficient in terms of absolute value.
Total Margin
Variable
N Mean Std. Dev. t-Value
Privatization
Public vs. Private
No privatization 5,960 0.03 0.07
-1.22
Privatization 619 0.04 0.09
HHI
> mean 4,715 0.03 0.07
3.28*
= < mean 1,864 0.03 0.09
System
Membership
Non member 4,607 0.03 0.07
-2.60*
Member 1,972 0.04 0.08
Contract
Management
No contract 5,572 0.03 0.08 1.19
Contract 1,007 0.03 0.07
Health network
No network 4,939 0.03 0.08
2.41*
Network 1,640 0.04 0.08
Teaching status
Teaching 1,469 0.02 0.08
-4.88* No teaching 5,110 0.03 0.07
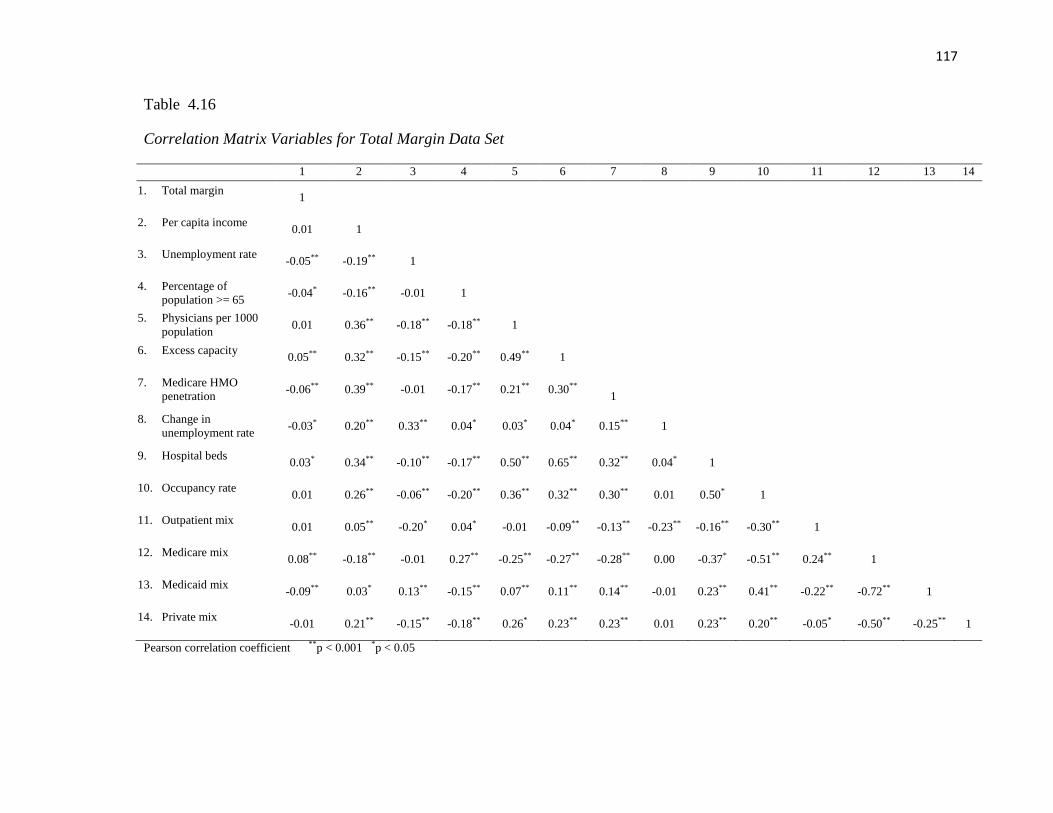
117
Table 4.16
Correlation Matrix Variables for Total Margin Data Set
1 2 3 4 5 6 7 8 9 10 11 12 13 14
1. Total margin
1
2. Per capita income
0.01 1
3. Unemployment rate
-0.05** -0.19** 1
4. Percentage of
population >= 65 -0.04* -0.16** -0.01 1
5. Physicians per 1000
population 0.01 0.36** -0.18** -0.18** 1
6. Excess capacity
0.05** 0.32** -0.15** -0.20** 0.49** 1
7. Medicare HMO
penetration -0.06** 0.39** -0.01 -0.17** 0.21** 0.30**
1
8. Change in
unemployment rate -0.03*
0.20**
0.33** 0.04* 0.03* 0.04* 0.15** 1
9. Hospital beds
0.03* 0.34** -0.10** -0.17** 0.50** 0.65** 0.32** 0.04* 1
10. Occupancy rate
0.01 0.26** -0.06** -0.20** 0.36** 0.32** 0.30** 0.01 0.50* 1
11. Outpatient mix
0.01 0.05** -0.20* 0.04* -0.01 -0.09** -0.13** -0.23** -0.16** -0.30** 1
12. Medicare mix
0.08** -0.18** -0.01 0.27** -0.25** -0.27** -0.28** 0.00 -0.37* -0.51** 0.24** 1
13. Medicaid mix
-0.09** 0.03* 0.13** -0.15** 0.07** 0.11** 0.14** -0.01 0.23** 0.41** -0.22** -0.72** 1
14. Private mix
-0.01 0.21** -0.15** -0.18** 0.26* 0.23** 0.23** 0.01 0.23** 0.20** -0.05* -0.50** -0.25** 1
Pearson correlation coefficient **p < 0.001 *p < 0.05

118
Results of hypothesis 7. The next section presents the results from the two fixed-
effects linear regression analyses used to test hypothesis 7, one for dependent variable
operating margin and one for dependent variable total margin. Table 4.17 presents the
results of the fixed-effects regression models predicting operating margin on
dichotomous variable privatization and table 4.18 presents the results of the fixed-effects
linear regression models predicting total margin on dichotomous variable privatization.

119
Table 4.17
Results of Fixed-effects Linear Regression on Operating Margin First Hypothesis e
Model 1 a (N= 6,454) Model 2 b (N= 6,454) Model 3c (N= 6,341)
Operating Margin Coefficient Standard
Error 95% CI d
Coefficient Standard
Error 95% CI d
Coefficient Standard
Error 95% CI d
Privatization 0.06*** 0.008 0.04 0.07 0.05*** 0.008 0.37 0.68 0.05*** 0.008 0.04 0.07
Potential endogenous
variables
System
membership
0.011 0.007 -0.002 0.02
0.01* 0.007 -0.001 0.03
Contract
management
-0.009 0.006 -0.02 0.003
-0.02** 0.006 -0.029 -0.004
Health network 0.02*** 0.004 0.008 0.03 0.02*** 0.004 0.007 0.03
Munificence
Per capita income 0.0004 0.001 -0.001 0.001
Unemployment
rate
0.0002 0.001 -0.002 0.002
Percent >=65 0.06 0.13 -0.19 0.31
Physicians/1000pop -0.001 0.003 -0.008 0.01
Complexity
HHI -0.009 0.006 -0.020 0.002
Excess capacity -0.00005 0.0001 -0.0002 0.0001
HMO penetration -0.0001 0.0003 -0.001 0.001
Dynamism
Change in
unemployment rate
-0.002 0.008 -0.02 0.014
Organizational factors
Hospital beds 0.0001** 0.00004 0.00002 0.0002
Teaching status -0.000 0.008 -0.02 0.02
Occupancy rate 0.08*** 0.02 0.05 0.11
Outpatient mix 0.05*** 0.01 0.02 0.07
Medicare mix 0.05** 0.02 0.02 0.08
Medicaid mix 0.01 0.02 -0.02 0.04
Overall F- test 10.69*** 9.74*** 7.05***
*p < 0.1 **p < 0.05 ***p < 0.001 a Model with privatization dummy variable as independent variable b Model with privatization dummy independent variable and endogenous variables c Full model d CI means confidence interval e Hospital-year is the unit of analysis, year dummy variables were included in the analysis

120
Table 4.18
Results of Fixed-effects Linear Regression on Total Margin First Hypothesis d
Total Margin Model 1 a (N = 6,579)
Model 2 b (N = 6,463)
Model 3 c (N = 6,463)
Coefficient Standard
Error 95% CI e
Coefficient Standard
Error 95% CI e
Coefficient Standard
Error 95%CI e
Privatization 0.02 *** 0.005 0.01 0.03 0.02 *** 0.01 0.01 0.03 0.02 *** 0.005 0.008 0.03
Potential endogenous
variables
System
membership
0.004 0.004 -0.004 0.013
0.004 0.004 -0.004 0.013
Contract
management
-0.01 * 0.004 -0.015 0.001
-0.01 ** 0.004 -0.02 -0.0003
Health network 0.01 *** 0.004 0.004 0.015 0.01 *** 0.003 0.004 0.02
Munificence
Per capita income 0.001 ** 0.0004 0.0001 0.002
Unemployment rate
-0.001 0.001 -0.002 0.000
Percent > = 65 -0.26** 0.08 -0.42 -0.09
Physicians/1000pop -0.001 0.002 -0.006 0.003
Complexity
HHI 0.001 0.004 -0.007 0.008
Excess capacity -0.0001 0.0001 -0.0002 0.00004
HMO penetration -0.005 ** 0.0002 -0.001 -0.0001
Dynamism
Change in
unemployment rate
-0.001 * 0.005 -0.021 0.001
Organizational factors
Hospital beds 0.00002 0.00002 -0.00002 0.00007
Teaching status 0.020 0.005 -0.008 0.012
Occupancy rate 0.02 * 0.010 -0.001 0.039
Outpatient mix 0.007 0.009 -0.010 0.025
Medicare mix 0.03 ** 0.010 0.006 0.045
Medicaid mix 0.005 0.010 -0.014 0.025
Overall F-tests 8.44*** 7.74*** 5.85***
*p < 0.1 **p < 0.05 ***p < 0.001 a Model with privatization as independent variable b Model with privatization variable and potential endogenous variables c Full model d Hospital-year is the unit of analysis, year dummy variables were included in the analysis e CI means confidence interval
121
Hypothesis 7 was supported; operating margin and total margin were statistically
significant at p < 0.001 for all the three models, respectively. Compared to hospitals that
remained public, privatized hospitals had 6% higher operating margin, p < 0.001, 95% CI
[0.04, 0.07] for the model 1. Privatized hospitals had 5.3% higher operating margin, p <
0.001, 95% CI [0.37, 0.68] for the model 2 and 5% higher operating margin p < 0.001,
95% CI [0.04-0.07] for the full model. In addition, all three models found that compared
to public hospitals that remained public, privatized hospitals had 2% higher total margin,
p < 0.001, 95% CIs [0.01, 0.03], [0.01,0.03], and [0.008, 0.03], respectively.
Operating margin was also positively associated with health network for the
second model and third model; compared to hospitals without health network, those
involved in health network had 2% higher operating margin, p < 0.001, 95% CI [0.008,
0.03]. Multihospital system membership was marginally associated with operating
margin. Compared to hospitals not affiliated with multihospital system, those with
affiliation had 1.2% higher operating margin, p < 0.10, 95% CI [-0.001, 0.03]. Contract
management was negatively associated with operating margin. Hospitals engaged in
contract management had 2% lower operating margin than those without contract
management; this association was marginally significant at p < 0.10, 95% CI [-0.029, -
0.004]. Control variables hospital beds, occupancy rate, outpatient mix and Medicare mix
were positively associated with operating margin. One hundred units increase in hospital
beds was associated with 1% increase in operating margin, p < 0.05, 95% CI [0.00002,
0.0002]; one unit increase in occupancy rate was associated with 8% increase in
operating margin, p < 0.001, 95% CI [0.05. 0.11]; one unit increase in outpatient mix
was associated with 5% increase in operating margin, p < 0.001 95% CI [0.02, 0.07]; and
122
one unit increase in Medicare mix was associated with 5% increase in operating margin,
p < 0.05, 95% CI [0.02, 0.08].
Similar to operating margin, contract management was also negatively associated
with total margin. Compared to hospitals without contract management, those with
contract had total margin 1% lower for model 2, the association was marginally
significant at p < 0.10, 95% CI [-0.004, 0.013]. For model 3, contract management was
significantly associated with 1% decrease in total margin, p < 0.05, 95% CI [-0.02, -
0.0003]. In addition, involvement in health network increased total margin by 1%, for
both models 2 and 3, p < 0.001, 95% CIs [-0.004, 0.015], and CIs [0.004, 0.02],
respectively. Variables per capita income, occupancy rate and Medicare mix were
positively associated with total margin. An increase of $1,000 in per capita income was
associated with 0.1% increase in total margin, p < 0.05, 95% CI [0.0001, 0.002]; one unit
increase in occupancy rate was marginally associated with 2% increase in total margin,
p < 0.10, 95% CI [-0.001, 0.039], and one unit increase in Medicare mix was associated
with 3% increase in total margin, p < 0.05, 95% CI [0.006, 0.045].
Variables percentage of population 65 years of age and older, HMO penetration
and change in unemployment rate were negatively associated with total margin. One unit
increase in percentage of population 65 years of age and older was marginally associated
with 26% decrease in total margin, p < 0.05, 95% CI [-0.42, -0.09], one unit increase in
HMO penetration was associated with 0.5% decrease in total margin, p < 0.05,
95% CI [-0.001, -0.0001]; and one unit increase in change in unemployment rate was
marginally associated with 0.1% decrease in total margin, p < 0.1, 95% CI [-0.021,
0.001].

123
Results of Hypothesis 8. This section discusses the results of hypothesis 8, which
tested whether hospitals that converted into private for-profit status exhibited better
financial performance than hospitals that converted into private not-for-profit status.
Two independent dummy variables were constructed: private for-profit and
private not-for-profit using public hospitals as control group. Similar to the structure of
the data sets used to test hypothesis 7, two data sets, one with normally distributed
operating margin and another with normally distributed total margin were used in the
analysis. Fixed-effects linear regression models with joint tests, were used to test
hypothesis 8. Joint tests were designed to test the null hypothesis that the Beta
coefficients of operating margin and total margin for hospitals with for-profit status and
those with not-for-profit status were equal. Potential endogeneity of variables
membership of a multihospital system, contract management and participation in health
network on financial performance was taken into account using the same method in
research question 1 and the first part of research question 3. The same data set for
operating margin and total margin used to test hypothesis 7 were used to test hypothesis
8. Tables 4.11 and 4.14 summarize the number of observations, means , standard
deviations and the minimum and maximum values of the variables based on the data sets
with normally distributed operating margin and total margin, respectively. The
independent samples t-tests for dependent variables operating margin and total margin
are presented in table 4.12 and table 4.15, respectively. Tables 4.13 and 4.13 contain the
correlation matrices of the data sets for operating margin and total margin, respectively.
Table 4.19 compares the sample sizes and operating margin by the three
ownership type: public, private not-for-profit and private for-profit. There was a total of

124
6,454 hospital-years, 5,832 (90.36%) were public, 156 (2.42%) for-profit and 466
(7.22%) for-profit. Public hospitals had the lowest mean operating margin (-6%) and for-
profit hospital had the highest mean of (4%). The one sample t-test for each ownership
type was statistically significant at p < 0.001, respectively suggesting that the mean
operating margin of each ownership type was different from the population mean.
Table 4.19
Operating Margin by Ownership Type a
N (%) Mean Std. Dev. T-statistic µ=0
Public 5,832 (90.36%) -0.06 0.16 -29.60*
For-profit 156 (2.42%) 0.04 0.12 3.92*
Not-for-profit 466 (7.22%) -0.03 0.12 -4.41*
Total 6,454 (100.00%)
* p < 0.001
a Hospital-year is the unit of analysis
Table 4.20 summarizes the sample sizes and one sample t-tests of total margin by
ownership type. Of the total of 6,454 hospital-years, 5,832 (90.36%) were public, 156
(2.42%) were for-profit and (7.22%) were not-for-profit. T-statistics were statistically
significant at p < 0.001 indicating that the mean of total margin for each sample was
different from the population mean. Similar to operating margin, for-profit hospitals had
the highest mean of total margin (5%), public and not for profit hospitals had the same
mean (3%).

125
Table 4.20
Total Margin by Ownership Type a
N Mean Std. Dev. T-statistic µ=0
Public 5960 (90.59%) 0.03 0.07 32.22*
For-profit 156 (2.37%) 0.05 0.10 6.40*
Not-for-profit 463 (7.04%) 0.03 0.08 7.86*
Total 6579 (100.00%)
*p < 0.001
a Hospital-year was the unit of analysis
Tables 4.21 and 4.22 present the fixed-effects linear regression models for the
operating margin and total margin data sets.
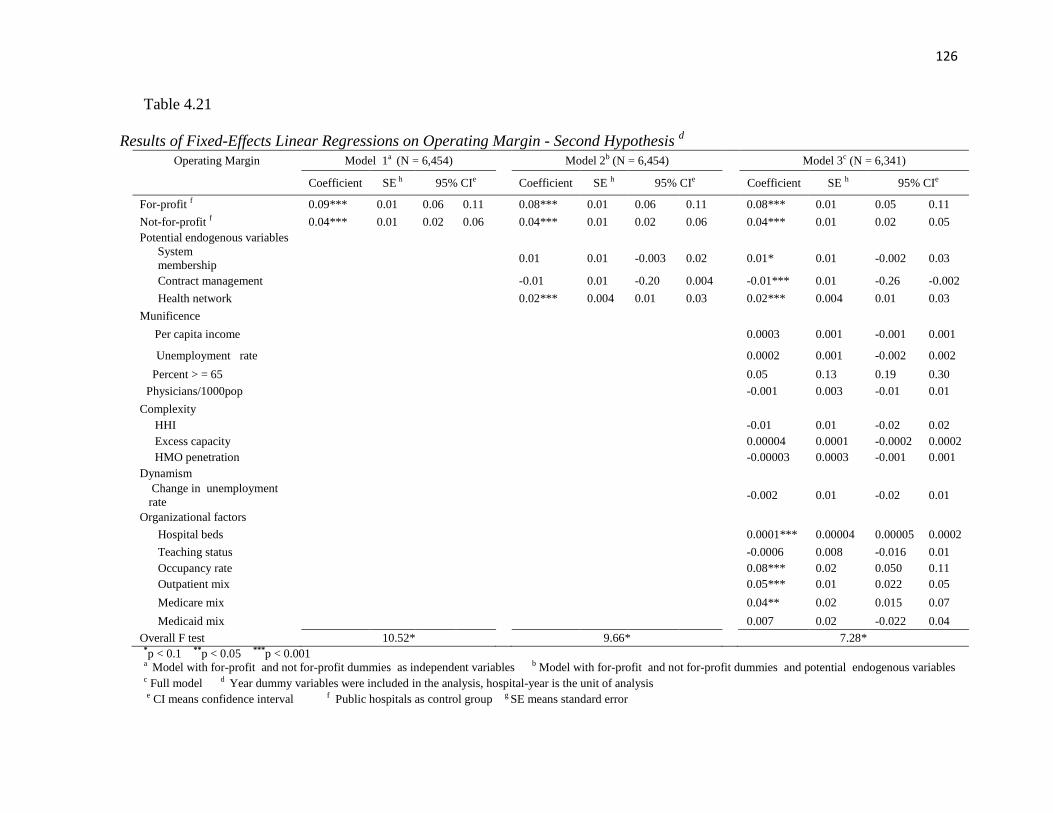
126
Table 4.21
Results of Fixed-Effects Linear Regressions on Operating Margin - Second Hypothesis d
Operating Margin Model 1a (N = 6,454) Model 2b (N = 6,454) Model 3c (N = 6,341)
Coefficient SE h 95% CIe Coefficient SE h 95% CIe Coefficient SE h 95% CIe
For-profit f 0.09*** 0.01 0.06 0.11 0.08*** 0.01 0.06 0.11 0.08*** 0.01 0.05 0.11
Not-for-profit f 0.04*** 0.01 0.02 0.06 0.04*** 0.01 0.02 0.06 0.04*** 0.01 0.02 0.05
Potential endogenous variables
System
membership
0.01 0.01 -0.003 0.02
0.01* 0.01 -0.002 0.03
Contract management -0.01 0.01 -0.20 0.004 -0.01*** 0.01 -0.26 -0.002
Health network 0.02*** 0.004 0.01 0.03 0.02*** 0.004 0.01 0.03
Munificence
Per capita income 0.0003 0.001 -0.001 0.001
Unemployment rate 0.0002 0.001 -0.002 0.002
Percent > = 65 0.05 0.13 0.19 0.30
Physicians/1000pop -0.001 0.003 -0.01 0.01
Complexity
HHI -0.01 0.01 -0.02 0.02
Excess capacity 0.00004 0.0001 -0.0002 0.0002
HMO penetration -0.00003 0.0003 -0.001 0.001
Dynamism
Change in unemployment
rate
-0.002 0.01 -0.02 0.01
Organizational factors
Hospital beds 0.0001*** 0.00004 0.00005 0.0002
Teaching status -0.0006 0.008 -0.016 0.01
Occupancy rate 0.08*** 0.02 0.050 0.11
Outpatient mix 0.05*** 0.01 0.022 0.05
Medicare mix 0.04** 0.02 0.015 0.07
Medicaid mix 0.007 0.02 -0.022 0.04
Overall F test 10.52* 9.66* 7.28* *p < 0.1 **p < 0.05 ***p < 0.001 a Model with for-profit and not for-profit dummies as independent variables b Model with for-profit and not for-profit dummies and potential endogenous variables
c Full model d Year dummy variables were included in the analysis, hospital-year is the unit of analysis
e CI means confidence interval f Public hospitals as control group g SE means standard error
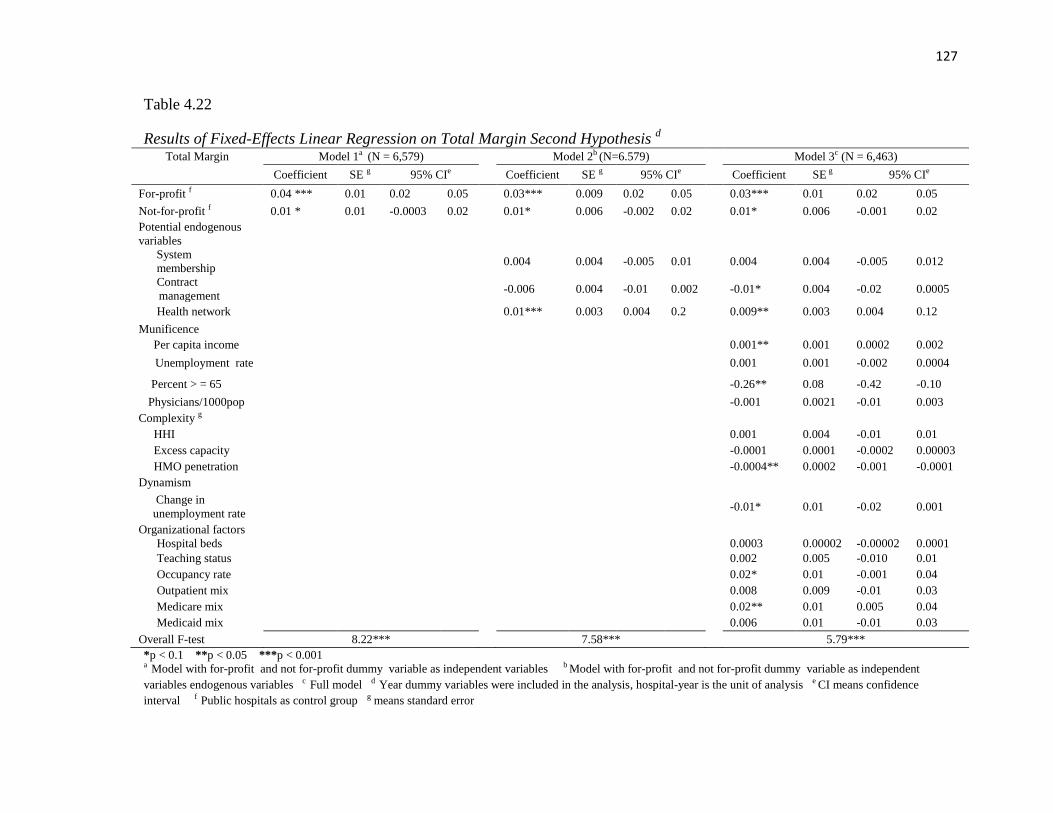
127
Table 4.22
Results of Fixed-Effects Linear Regression on Total Margin Second Hypothesis d
Total Margin Model 1a (N = 6,579) Model 2b (N=6.579) Model 3c (N = 6,463)
Coefficient SE g 95% CIe Coefficient SE g 95% CIe Coefficient SE g 95% CIe
For-profit f 0.04 *** 0.01 0.02 0.05 0.03*** 0.009 0.02 0.05 0.03*** 0.01 0.02 0.05
Not-for-profit f 0.01 * 0.01 -0.0003 0.02 0.01* 0.006 -0.002 0.02 0.01* 0.006 -0.001 0.02
Potential endogenous
variables
System
membership
0.004 0.004 -0.005 0.01
0.004 0.004 -0.005 0.012
Contract
management
-0.006 0.004 -0.01 0.002
-0.01* 0.004 -0.02 0.0005
Health network 0.01*** 0.003 0.004 0.2 0.009** 0.003 0.004 0.12
Munificence
Per capita income 0.001** 0.001 0.0002 0.002
Unemployment rate 0.001 0.001 -0.002 0.0004
Percent > = 65 -0.26** 0.08 -0.42 -0.10
Physicians/1000pop -0.001 0.0021 -0.01 0.003
Complexity g
HHI 0.001 0.004 -0.01 0.01
Excess capacity -0.0001 0.0001 -0.0002 0.00003
HMO penetration -0.0004** 0.0002 -0.001 -0.0001
Dynamism
Change in
unemployment rate
-0.01* 0.01 -0.02 0.001
Organizational factors
Hospital beds 0.0003 0.00002 -0.00002 0.0001
Teaching status 0.002 0.005 -0.010 0.01
Occupancy rate 0.02* 0.01 -0.001 0.04
Outpatient mix 0.008 0.009 -0.01 0.03
Medicare mix 0.02** 0.01 0.005 0.04
Medicaid mix 0.006 0.01 -0.01 0.03
Overall F-test 8.22*** 7.58*** 5.79***
*p < 0.1 **p < 0.05 ***p < 0.001 a Model with for-profit and not for-profit dummy variable as independent variables b Model with for-profit and not for-profit dummy variable as independent
variables endogenous variables c Full model d Year dummy variables were included in the analysis, hospital-year is the unit of analysis e CI means confidence
interval f Public hospitals as control group g means standard error

128
Hypothesis 8 was supported. Model 1 found that hospitals that converted to for-profit
status had 9% higher operating margin than hospitals that remained public, p <0.001,
95% CI [0.06,0.11] relative to 4% higher for hospitals that converted to not-for-profit
status , p < 0.001, 95% CI [0.02, 0.06]. Models 2 and 3 found that compared to hospitals
that remained public, hospitals that converted to for-profit had 8% higher operating
margin, p < 0.001, 95% CIs [0.06, 0.11], [0.05,0. 11] relative to 4% higher for hospitals
that converted to not-for-profit status, p < 0.001, 95% CIs [0.02, 0.06], [0.02, 0.05] .
In addition, model 1 found that compared to hospitals that remained public,
hospitals that converted to for-profit status had 4% higher total margin, p < 0.001, 95%
CI [0.02, 0.05] relative to 1% higher, p < 0.1, 95% CI [-0.0003, 0.02]for hospitals that
converted to not-for-profit status. Model 2 and 3 found that compared to hospitals that
remained public, hospitals that converted to for-profit status had 3% higher total margin,
p < 0.001, 95% CI [0.02, 0.05], relative to 1% for hospitals that converted to not-for-
profit status, p < 0.1, 95% CIs [-0.002, 0.02], [-0.001, 0.02]. These results indicated that
1% increase in total margin for hospitals that converted into not-for-profit status was
marginally significant.
Furthermore, the joint tests confirmed that the difference in operating margin
between for-profit and not-for-profit hospitals were statistically significant at p < 0.001
across the three models, with for-profit hospitals having 5% higher operating margin for
model 1 and 4% higher operating margin for models 2 and 3. The difference in total
margin was also statistically significant at p < 0.001 for model 1 at p < 0.05 for models 2
and 3. For-profit hospitals had 3% higher total margin than not-for-profit hospitals for
model 1 and 2% higher total margin for models 2 and 3.
129
With respect to the potentially endogenous variables, participating in health
network was positively associated with both operating margin and total margin across
models 2 and 3. Compared to hospitals without network, those with network had 2%
higher operating margin, p < 0.001, 95% CI [0.01, 0.03], for both models 2 and 3. In
addition, hospitals with network has 1% higher total margin for model 2 and 0.9% higher
for model three at p < 0.001, p < 0.05, 95% CI [0.004, 0.2], [0.004, 0.12], respectively.
Membership of multihospital systems was marginally associated with 1% increase in
operating margin for model 3, p < 0.10; it was not significant for total margin. Contract
management was negatively associated with both operating margin and total margin.
Compared to hospitals not engaged in contract management, those with contract
management had 1% lower operating margin, p < 0.001, 95% CI [-0.26, -0.002] and 1%
lower total margin with marginal significance, p < 0.1, 95% CI [-0.02. 0.0005].
While no environmental variable was associated with operating margin, some
organizational variables hospital beds, occupancy rate, outpatient mix and Medicare mix,
were positively associated with operating margin. One hundred units increase in hospital
beds was associated with 1% increase in operating margin p < 0.001, 95% CI [0.00005,
0.0002]. One unit increase in occupancy rate was associated with 8% increase in
operating margin, p < 0.001, 95% CI [0.05, 0.11]. One unit increase in outpatient mix
was associated with 5% increase in operating margin, p < 0.001, 95% CI [0.022, 0.05]
and one unit increase in Medicare mix was associated with 4% increase in operating
margin, p < 0.05, 95% CI [0.015, 0.07].

130
Some environmental variables were associated with total margin. Per capita
income was positively association with total margin. An increase of $1,000 in per capita
income was associated with an increase of 0.1% in operating margin, p < 0.05, 95% CI
[0.0002, 0.002]. Variables percentage of population of 65 years of age and over, HMO
penetration and change in unemployment rate, were negatively associated with operating
margin. One unit increase in percentage of population of 65 years and older was
associated with 26% decrease in total margin p < 0.05, 95% CI [-0.42, -0.10] and one unit
increase in HMO penetration was associated with 0.04% decrease in total margin,
p < 0.05, 95% CI [-0.001, -0.0001]. One unit increase in change in unemployment rate
was marginally associated with 1% decrease in total margin, p < 0.10, 95% CI [-0.02,
0.001].
Occupancy rate and Medicare mix were the organizational variables associated
with total margin. One unit increase in occupancy rate was marginally associated with
2% increase in total margin p < 0.10, 95% CI [-0.001, 0.04] and one unit increase in
Medicare mix was associated with 2% increase in total margin, p < 0.05, 95% CI [-0.01,
0.03].
Conclusion
This study investigated the association of environmental factors, in terms of
munificence, complexity and dynamism with public hospital financial distress; the
association of organizational factors, in terms of hospital size and teaching status with
public hospital financial distress; the effect of financial distress on public hospital
privatization, and the impact of privatization on financial performance. This study found
that environmental munificence and environmental dynamism was not associated with

131
financial distress; environmental complexity, in terms of HMO penetration, was
positively associated with the odds of being in financial distress. In addition, this study
found that hospital size, in terms of number of beds was negatively associated with the
odds of being in financial distress. Financial distress was associated with privatization
and privatization had a positive association with financial performance. Additionally,
public hospitals that converted into for-profit status had better financial performance
relative to public hospitals that converted into not-for-profit status. Though no
environmental variable was positively associated with operating margin, variables
percentage of population 65years of age or older, Medicare HMO penetration, and yearly
change in unemployment rate had a negative impact on total margin. Table 4.23
summarizes the results of hypothesis testing and table 4.24 summarizes the statistically
significant associations between the dependent variable and independent variables
pertaining to each research question.

132
Table 4.23
Summary of Findings from Hypotheses Testing
Hypothesis
Statement Findings
Hypothesis 1 Public hospitals operating in a more munificent environment are less likely to experience financial
distress than public hospitals operating in a less munificent environment.
Not supported
Hypothesis 2
Public hospitals operating in a more dynamic environment are more likely to experience financial
distress than public hospitals operating in a more stable environment.
Not supported
Hypothesis 3 Public hospitals operating in a more complex environment are more likely to experience financial
distress than public hospitals operating in a less complex environment.
Partially
supported
Hypothesis 4 Larger public hospitals are less likely to experience financial distress than smaller public hospitals. Supported
Hypothesis 5 Public hospitals affiliated with a medical school are less likely to experience financial distress than
non-affiliated public hospitals.
Not supported
Hypothesis 6 Public hospitals in financial distress are more likely to privatize than public hospitals exhibiting
higher financial performance. Supported
Hypothesis 7 Privatized public hospitals have higher financial performance after privatization than before
privatization. Supported
Hypothesis 8 Public hospitals that converted into for-profit status exhibit higher financial performance compared
to public hospitals that converted into not-for-profit status. Supported

133
Table 4.24
Summary of Findings from Each Research Question a
Antecedents of
Financial
Distress b
Impact of Financial
Distress on
Privatization c
Impact of Privatization on Financial
Distress b
Operating Margin Total margin
Endogenous variables
System
membership + + + Contract
management - - - Health network - + + Munificence Per capita income +
Unemployment rate
Percent > = 65 - Physicians/1000pop Complexity HHI Excess capacity HMO penetration + - Dynamism
Change in unemployment
rate - Organizational factors Hospital beds - + Teaching status + Occupancy rate - + + Outpatient mix - + Medicare mix + + Medicaid mix a Negative sign indicates negative association with dependent variable and positive sign indicates positive association b Results taken from the full model c Results compiled from models 1 and 2
134
CHAPTER 5
DISCUSSION
The aim of this chapter is to further discuss the findings and results presented in
chapter 4, compare these findings with findings from prior studies, and discuss the
managerial and policy implications of these findings as well as the limitations of this
study.
The purpose of this study was to investigate the environmental and organizational
factors associated with financial distress, explore whether financial distress precedes
privatization and assess whether privatization leads to better financial performance.
Financial distress was measured using the Altman Z-score method that combined the
mostly used financial ratios in one discriminant function. The discriminant function
customized for service and retail firms was applied in this study. Based on these
questions, eight hypotheses were tested on a national sample of public hospitals using a
panel longitudinal data from 1997 until 2009. The following section discusses the
findings from each hypothesis pertaining to each research question.
Discussion of Findings from Research Question 1
Research question 1 explored whether environmental factors and organizational
factors were associated with financial distress. The first three hypotheses investigated the
association between environmental factors and financial distress. Langabeer, 2006 is the
only study on health care organizations that applied the Altman Z-score method using the

135
same discriminant function for service and retail firms used in this study, but he did not
include environmental variables. Langabeer (2006) predicted financial distress of
teaching hospitals with special focus on organizational factors. Kim (2010) studied
financial distress of nonprofit hospitals using a different approach of measuring financial
distress. He used financial strengths index, a composite measure of profitability, liquidity,
financial leverage and physical facilities. Kim (2010) used both environmental and
organizational variables. Though Langabeer (2006) and Kim (2010) did not exactly use
the same methods and variables as in this study, they are the mostly comparable with the
results from research question 1.
Findings from Hypothesis 1
Hypothesis 1 proposed that environmental munificence, in terms of per capita
income, county unemployment rate, percent of elderly people of 65 years of age and
older, and number of active physicians per 1000 population, was negatively associated
with financial distress. Hypothesis 1 was rejected, indicating that lack of resources in the
environment had no direct impact on financial distress. This finding is not consistent with
Kim (2010), which found a significant positive associated with higher unemployment rate
and financial distress. Other findings from Kim (2010) are contrary to the expected
direction of the association between environmental variables and financial distress;
higher percentage of physicians and higher percentage of population 65 years and older
were positively associated with financial distress.

136
Findings from Hypothesis 2
Hypothesis 2 proposed that environmental dynamism, in terms of yearly change
in county unemployment rate was positively associated with public hospital financial
distress. This hypothesis was not supported, suggesting that environmental dynamism had
no direct impact on financial distress. No other empirical study on hospital financial
distress used this measure of environmental dynamism, so it cannot be compared to prior
studies.
Findings from Hypothesis 3
Hypothesis 3 proposed environmental complexity in terms of market competition,
excess capacity, and HMO penetration was positively associated with financial distress.
This hypothesis was partially supported; higher Medicare HMO penetration was
associated with greater odds of being in financial distress; this finding corroborates the
finding from Kim (2010). This finding might indicate the consequence of aggressive
pricing HMOs exert on their contractors which squeezes margins and consequently affect
hospital financial performance.
While this study did not find a significant association between HHI and financial
distress, Kim (2010) found that high market concentration was negatively associated with
financial distress among not-for-profit hospitals indicating that higher competition (lower
HHI) was associated positively associated with financial distress. The next two
hypotheses, hypothesis 4 and hypothesis 5 tested whether organizational factors, hospital
size and teaching status, were negatively associated with financial distress.
137
Findings from Hypothesis 4
Hypothesis 4 proposed that large public hospitals, in terms of number of hospital
beds, were less likely to experience financial distress. Hypothesis 4 was supported; this
finding was stronger than the results from Langabeer (2006). Though Langabeer found a
strong and significant positive correlation between number of beds and Altman Z-score
(correlation = 0.832, p<0.001), the regression analysis from Langabeer did not find a
significant association between number of beds and financial distress (Langabeer, 2006).
Similar to Langabeer (2006), Kim (2010) did not find a significant association between
number of beds and financial distress. The highly significant finding from this study
corroborates the results from prior studies suggesting organizational size has a positive
impact on financial performance (Goll & Rasheed, 2004; Kotha & Nair, 1995;
McNamara et al., 2002; Simerly & Li, 2000; Wan & Yiu, 2009). Several factors such as
economies of scale (Hall & Weiss, 1967), accumulation of slack resources (Sharfman et
al., 1988; Wan & Yiu, 2009; Dawley et al., 2003), and bargaining power over suppliers
(Porter, 1985) were found to be among the reasons for positive association between
organizational size and financial performance.
Findings from Hypothesis 5
Hypothesis 5 proposed that compared to non-teaching hospitals, teaching
hospitals were less likely to experience financial distress. While the result shows the
expected direction of the association between teaching status and financial distress,
hypothesis 5 was not supported; this finding is not consistent with Kim (2010) who found
a positive association between teaching status and higher probability of financial distress.

138
The findings with respect to the association of potentially endogenous variables and
control variables with financial distress are discussed in the next section.
Multihospital system membership and health network had significant association
with financial distress. Hospitals members of multihospital systems were found to be
three times more likely to be in financial distress compared to stand-alone hospitals. This
finding is counterintuitive from the resource dependence theory which argues that
multihospital systems provide several resources to their members such as financial
support, technology and expertise, thus members are less likely to experience financial
distress. However, this association might support the argument that multihospital
membership is endogenous to financial distress. Hospitals in financial distress might seek
affiliation with multihospital systems to solve their financial problems. This finding
might also suggest that hospitals in financial distress are easy targets for acquisition as
they can be purchased at bargain. Thus, acquisition of public hospitals in financial
distress could be a strategy for multihospital systems to expand their market share and
competitive position.
Participation in health network was negatively associated with financial distress.
This finding is consistent with the findings from prior studies. Some studies that
investigated the association between hospitals participation in health network and
financial performance found that network membership was positively associated with
financial performance (Bazzoli, et al., 2000; Broyles, Brandt & Biard-Holmes, 1998;
Nauenberg, Brewer, Basu, Bliss, & Osborne, 1999). Broyles et al. (1998) investigated
the impact of network membership on the financial performance of rural hospitals in
Oklahoma; their findings indicated that participation in a network was associated with

139
higher net cash flow and lower services costs, lower labor costs, and lower non-labor
costs (Broyles, et al., 1998).
The negative association between health network and financial distress can be
explained from resource dependence perspective. Healthcare organization network is an
example of interorganizational relations that healthcare organizations initiate to have
better access to resources. The resource dependence theory argues that organizations
engage in various kinds of interorganizational relationship to secure key resources for
their survival (Pfeffer & Salancik, 1978). In the healthcare setting, such resources include
financial and human resources, legal support, knowledge, technologies, and the capability
to deliver high quality care, among others (Bazzoli, Shortell, Ciliberto, Kralovec, &
Dubbs, 2001; Federico, 2005; Nauenberg, et al., 1999; Bazzoli et al., 2000).
Additionally, hospitals participating in a network enhance their images and
competitive positions that they can leverage in negotiating contract with managed care
organizations. Participants also get access to the additional knowledge and insights on
best practices. Moreover, healthcare organization networks increase participants‘
bargaining power with suppliers and purchasers; and they enhance economies of scale
and scope leading to cost savings and hospitals‘ efficiency and effectiveness (Bazzoli et
al., 2000; Broyles, et al., 1998; Federico, 2005). The strongest motive that leads
healthcare organizations to participate in a network is the expectation of higher financial
performance and enhanced efficiency (Nauenberg, et al., 1999).
Control variable outpatient mix was marginally and negatively associated with
financial distress. This finding was not consistent with Langabeer (2006) which found no

140
significant association between outpatient services and financial distress. However, the
negative association between outpatient service and financial distress supports the
argument that the provision of outpatient services is not highly controlled by Medicare
and Medicaid; as a result, providers can achieve better profit in providing a higher
percentage of outpatient services. Additionally, outpatient services are less resource
intensive, which enhances hospital efficiency.
Discussion of Findings from Research Question 2
Hypothesis 6 explored whether financial distress precedes privatization.
Hypothesis 6 was supported across the two models. No prior study applied the Altman Z-
score to predict privatization; it is not possible to compare this finding with findings from
prior studies.
This study also found positive associations with organizational variables teaching
status and multihospital system membership with privatization. Teaching status was
marginally associated with privatization in model 1, but the association was highly
significant in model 2 . This finding is not consistent with Sloan, Ostermann and Conover
(2003) that found no significant association between teaching status and conversion into
for-profit status. Since teaching hospitals require more resources than non-teaching
hospitals; they might prefer privatization as a strategy to enhance their access to
resources (Blumenthal & Weissman, 2000; Feder & Hadley, 1987). In addition, if
privatization of teaching hospital was achieved through acquisition by a multihospital
system, it can be explained from the acquirer‘s perspective. Acquiring a teaching hospital
141
is an attractive investment since it enhances the acquirer‘s access to medical expertise
and improves its image as owner of a teaching institution, which consequently reinforces
the private hospital chain‘s strategic posture (Blumenthal & Weissman, 2000).
This study also found that hospitals members of multihospital systems are more
likely to privatize relative to stand-alone hospitals. This association might be explained
from a political perspective. Given their size, multihospital systems can be highly
influential in the community and in politics; thus it is easier for them to convince the
community to convert a hospital. In addition, the financial burden that a struggling
hospital member imposes on the whole system might encourage the system to put
pressure on the hospital to privatize. Since the finding from research question 1 suggests
that hospitals in financial distress might seek affiliation with multihospital systems to
enhance their financial performance, if affiliation does not lead to a better financial
condition, then privatization could be the second solution.
Occupancy rate had a negative association with financial distress. This finding
was consistent with Amirkhanyan (2007); high occupancy rate was found to be
negatively associated with nursing home privatization. High occupancy rate reflects the
organization‘s market share and high market share indicates greater revenue and
consequently higher financial performance. Therefore, hospitals with high occupancy rate
are less likely to privatization. Contract management was found to be negatively
associated with privatization, this finding is logical. Since contractors manage the
hospitals, it is in their interest to keep the managerial control of the hospital, therefore,
the hospital is less likely to privatize if it is under contract management.

142
The findings that per capita income, unemployment rate, and percent of
population 65 years of age and older, HHI, and HMO penetration were not associated
with privatization were not consistent with prior study (Sloan, Osterman & Conover,
2003) which found that higher per capita income, higher unemployment rate, higher
percentage of elderly and higher HHI decreased the likelihood of conversion from public
or not-for-profit status to private-for-profit status. However, the negative association
between unemployment rate and conversion is counterintuitive (Sloan, Osterman &
Conover, 2003.) The discrepancies of the results from these studies might be due to the
fact that Sloan, Osterman & Conover combined public hospitals and private not-for profit
hospitals in one category. The next section discusses the findings from research question
3.
Discussion of Findings from Research Question 3
Research question 3 assessed whether privatization improved financial
performance was addressed by testing hypotheses 7 and 8. Hypothesis 7 proposed that
privatization was positively associated with financial performance. Hypothesis 8
proposed that hospitals that privatized into for-profit status exhibited higher financial
performance compared to hospitals that privatized into private not-for-profit status.
Financial performance was measured in terms of operating margin and total margin. Both
hypotheses were supported.
These findings with respect to the positive impact of conversion to for-profit
status on total margin are consistent with Shen (2003). The findings on the positive
impact of conversion to for-profit status on operating margin are consistent with Picone

143
et al., (2002). This finding confirms that privatization does improve financial
performance, and could be a better alternative to closure. In addition, if the hospital
purpose has shifted from delivering affordable care to profit maximization and then
converting to for-profit status is the best choice.
This study also found participation in health network, hospital beds, occupancy
rate, outpatient mix and Medicare mix to be positively associated with operating margin.
In addition, the association between multihospital membership and operating margin was
positive and marginally significant; contract management was found to have a negative
impact on both operating margin and total margin. The finding that multihospital system
membership is positively associated with operating margin seems to be inconsistent with
the results from research question 1 which suggested that membership of multihospital
system significantly increased the odds of being in financial distress. However, the use of
the Altman Z-score as indicator of financial distress instead of financial ratios such as
operating margin might explain this discrepancy; lower operating margin does not
necessarily indicate finanical distress. Furthermore, the association between multihospital
system membership with operating margin is marginally significant at p < 0.10.
An interesting finding from this study, which is counterintuitive, is the positive
association between Medicare mix and total margin and operating margin and the
negative association between percentage of population 65 years of age and older and total
margin. If the percentage of the elderly is greater, it should lead to greater Medicare mix;
therefore greater percentage of the elderly should enhance financial performance.
However, this discrepancy might be explained due to the fact that not everyone who is
Medicare eligible is enrolled in Medicare. Therefore, higher percentage of population 65

144
years or older could be associated with poorer financial performance. Older people
without Medicare coverage might result in a finanical burden to the hospital because
older people are on average sicker than younger people. The following section will
discuss the managerial and policy implications of the findings from this study.
Managerial and Policy Implications
The findings from this study provide some insights for health care management.
Hospitals have played an important role in health care delivery, yet they are highly
resource intensive. Therefore, monitoring the financial situation of hospitals should be
among the major responsibilities of management team. The Altman Z-score, which is a
managerial tool to watch the financial condition of an organization, has not been widely
applied in health care management and health services research. The findings from this
study suggested that the Altman Z-score can help determine public hospital financial
condition; the combination of the most important financial ratios into one discriminant
function facilitates the evaluation of the organization‘s financial condition. Though the
primary purpose of using the Altman Z-score is to detect financial distress, it could be
used as a managerial tool to regularly check the financial condition of the organization
(Calandro, 2007) and consequently solve the problem before it is too late.
This study also found that privatization leads to better financial performance;
therefore, management team could consider privatization as an alternative if financial
crisis and fiscal pressure occur. However, the decision to privatize a hospital should be
taken seriously. Though, this study and prior studies suggested that privatization have a
positive impact on financial performance, it can have some negative effects on other

145
dimensions of healthcare delivery such as access to and quality of care. For instance,
extant literature suggested that privatization resulted in decreased uncompensated care
(Thorpe et al., 2000; Desai, Lucas & Young, 2000; Needleman, Lamphere & Chollet,
1999), increased probability of trauma center closures (Shen, 2003), increased mortality
rate on patients with acute myocardial infarction (Shen, 2002), increased crude mortality
rate (Picone, Shin, Sloan, 2002), and increased pneumonia complication (Sloan, 2002).
Table 1.1 demonstrated the shrinking market share of public hospitals and public
hospital beds at the expense of private for-profit hospitals and since privatization is
mostly conducted through the sale of public hospitals to multihospital systems, there is
growing consolidation trend in the health care industry resulting in fewer competitors that
have the monopoly of certain markets. Hospital anti-trust laws should take a closer look
at every instance of privatization that involves acquisition to avoid the growth of fewer
but very large multihospital systems, which might results in aggressive pricing for
patients not covered by Medicare and Medicaid.
In addition, CON laws could be used to monitor privatization in order to make
sure that the needed services are not closed after privatization. The close monitoring of
health care quality after privatization is also needed to ensure that privatization leads to
improved quality of care as well as better financial performance. Higher quality of care
was found to be positively associated with better financial performance in the nursing
home industry (Weech-Maldonado, Neff & Mor, 2003).
146
In addition, the finding that participation in health network is negatively
associated with financial distress and positively associated with financial performance in
terms of both operating margin and total margin gives insight to managers to consider
participation in health network to enhance their financial situation. The finding from this
study also suggests that contract management is negatively associated with financial
performance in terms of both operating and total margins. Therefore, management team
should impose more stringent contract that ensures that the financial situation of the
hospital is improved through contract management if it plans to engage in such contract.
Among the environmental factors, Medicare HMO penetration was the major
factor positively associated with financial distress and negatively associated with
operating total margin. There is no way to avoid Medicare HMO penetration, but one
alternative to prevent its negative effect could be efficiency enhancement. Medicare
HMO contractors require efficient delivery of care, if the organization is efficient, then it
might get Medicare HMO contracts and able to increase revenue and enhance financial
performance.
This study also found that hospital size was negatively associated with financial
distress and positively associated with operating margin. This finding might explain the
merger and acquisition trend among hospitals, however bigger is better as long as it does
not lead to excess capacity and increased market concentration. Moreover, the finding
that greater outpatient mix was negatively associated with financial distress and
positively associated with financial performance makes the provision of outpatient
services an attractive strategy to health care providers. Overall, this study found that
compared to environmental factors, organizational factors have greater and more direct

147
impact on public hospital financial condition. Therefore paying more attention to
organizational factors might be more helpful than spending time worrying about the
environment. The following section discusses the limitations of this study.
Limitations of the Study
This study has some limitations with respect to the variables included in the
analysis. Given that this study was conducted with data covering 13 years, from 1997 to
2003, some of the variables deemed appropriate for this study could not be captured. For
example, some studies have demonstrated that the measure of environmental munificence
in terms of number of active physicians in the county could be more appropriate if the
separate number of specialists per capita and generalists per capita were used; high
number of primary care physicians per capita might represent a ―negative munificence‖
for hospitals as they can prevent hospitalization (Menachemi et al., 2011). However, the
number of specialists per capita was not included in the ARF data before 2005. The same
situation applied to hospital size in terms of number for beds. Using the number of
licensed beds is more appropriate as it reflects the actual number of beds the hospital can
legally install; however, the number of licensed beds was not included in the AHA data
before 2003.
This study is also limited due to the fact that variables to measure political
environment and tax rate were not available. Since public hospitals are burdened with
politics, controlling for political environment might yield different results. The same
concern applies to the lack of tax rate variable. Since public hospitals rely on
148
government funding, which is contingent on tax income, controlling for tax rate might
provide different results.
The unavailability of data with respect to the proportion of privately insured,
underinsured and uninsured patients was another limitation to this study. Since the role of
public hospitals as safety net providers requires them to provide health care services
regardless of the patient‘s ability to pay, including the proportion of privately insured and
uninsured patients could have given additional insights on whether serving patients other
than those enrolled in Medicare and Medicaid has an impact on financial performance
and privatization. The next section discusses the direction for future research.
Directions for Future Research
This study demonstrated the dearth of empirical studies on public hospital
privatization as well as the lack of the application of the Altman Z-score model in studies
of financial performance of different health care organizations such as independent group
practice, HMOs, critical access hospitals, nursing homes, and ambulatory care hospitals.
While several studies combined public hospitals and private not-for-profit hospitals in
one category this approach might not yield reliable results since public hospitals and
private not-for profit hospitals do not have the same operating context (Sloan, Osterman
& Conover, 2003; Sloan, 2002; Picone et al., 2002; Shen, 2002, 2003; Anderson et al.,
2003). Therefore, future studies should consider studying public hospitals as a separate
entity.
149
In addition, studies on ownership conversion from private not-for-profit status to
for-profit status have drawn the attention of most research, leaving a gap in the literature
with respect to public hospital privatization. Further empirical studies on public hospitals
are needed in terms of the impact of privatization on patient satisfaction, employee
satisfaction, physician satisfaction, competitive landscape, pricing of health care services,
access to health care services, and quality of care.
Conclusion
This study investigated the antecedents and consequences of public hospital
privatization with focus on financial distress and financial performance and from the
resource dependence perspective. A national sample of public hospitals using data from
1997 to 2008 was used in this study, environmental variables and organizational variables
were used in the analyses. The Altman Z-score method was applied to detect financial
distress.
The findings from this study suggested that environmental variable HMO
penetration was positively associated with financial distress; organizational variables
health network, hospital beds and outpatient mix were negatively associated with
financial distress; and membership of a multihospital system was positively associated
with financial distress, indicating that membership of a multihospital system is
endogenous to financial distress. Additional findings indicated financial distress preceded
privatization and privatization resulted in enhanced financial performance in terms of
operating margin and total margin.
150
LIST OF REFERENCES
American Hospital Association (2006.) CAH legislative history. Retrieved from
http://www.aha.org/advocacy-issues/cah/history.shtml
Aldrich, H. E. (1979). Organizations and Environments. Englewood Cliffs, N.J.:
Prentice-Hall.
Aldrich, H. E., & Pfeffer, J. (1976). Environments of organizations. Annual Review of
Sociology, 2, 79-105.
Alexander, J. A., & Morrisey, M. A. (1989). A resource-dependence model of hospital
contract management. Health Services Research, 24(2), p259 (226).
Alexander, J. A., & Wells, R. (2008). How do resource dependencies affect treatment
practices? The case of outpatient substance abuse treatment programs. Med Care
Res Rev, 65(6), 729-747.
Alexander, J., D'Aunno, T., & Succi, M. J. (1996a). Determinants of profound
organizational change: Choice of conversion of closure among rural hospitals.
Journal of Health and Social Behavior, 37(3), 238-251.
Alexander, J., D'Aunno, T., & Succi, M. J. (1996b). Determinants of rural hospital
conversion: A model of profound organizational change. Medical Care, 34(1), 29-
43.
Allison, P. D. (2005). Fixed Effects Regression Methods for Longitudinal Data Using
SAS. Cary, NC: SAS Institute 2005.
Almwajeh, O. (2004). Applying Altman's Z-score model of Bankruptcy for the prediction
of financial distress of rural hospitals in Western Pennsylvania. Unpublished
Dissertation, Indiana University of Pennsylvania, Indiana.
Al-Sulati, K., & Almwajeh, O. (2007). Applying Altman Z-score model of bankrupcty on
service organizations and its implications on marketing concepts and strategies.
Journal of International Marketing and Marketing Research, 32(2), 59-74.
Altman, E. I. (1968). Financial ratios, discriminant analysis and the prediction of
corporate bankruptcy. The Journal of Finance, 23(4), 589-609.
Altman, E. I. (2000). Predicting financial distress of companies: Revisiting the Z-score
and Zeta models. Stern School of Business, New York University.
Altman, E. I. (2000). Predicting finanical distress of companies: Revisiting the Z-score
and Zeta models.Unpublished manuscript, New York.

151
Amirkhanyan, A. (2007). The Smart-Seller Challenge: Exploring the Determinants of
Privatizing Public Nursing Homes. Journal of Public Administration Research and
Theory, 17(3), 501.
Anand, G., & Ward, P. (2004). Fit, flexibility and performance in manufacturing: coping
with dynamic environments. Production and Operations Management, 13(4),
369-385.
Anderson, R. A., Allred, C. A., & Sloan, F. A. (2003). Effect of hospital conversion on
organizational decision making and service coordination. Health Care
Management Review, 28(2), 141-154.
Andrulis, D. P. (1997). The public sector in health care: evolution or dissolution? Health
Affairs, 16(4), 131.
Anonymous. Investigating the effects of hospital privatization on efficiency and quality
of care. Retrieved from
http://www.econstor.eu/dspace/bitstream/10419/37374/1/VfS_2010_pid_417.pdf
Ayanian, J., & Weissman, J. (2002). Teaching hospitals and quality of care: a review of
the literature. Milbank Quarterly, 80(3), 569-593.
Banaszak-Holl, J., Zinn, J., & Mor, V. (1996). The impact of market and organizational
characteristics on nursing care facility service innovation: A resource dependency
perspective. Health Services Research, 31(1), 97-116.
Bartrum, T. E. (2009). Healthcare Transactions and Medicare's Change of Ownership
Rules. The American Health Lawyers Association. Retrieved from
http://www.healthlawyers.org/Events/Programs/Materials/Documents/MM09/bart
rum.pdf
Baum, R. J., & Wally, S. (2003). Strategic decision speed and firm performance.
Strategic Management Journal, 24(11), 1107-1129.
Baumol, W. J. (1967). Business behavior, value and growth: Harcourt, Brace & World
New York.
Bazzoli, G., & Andes, S. (1995). Consequences of hospital financial distress. Hospital
and Health Services Administration, 40(4), 472-495.
Bazzoli, G., Chan, B., Shortell, S., & D'Aunno, T. (2000). The financial performance of
hospitals belonging to health networks and systems. Inquiry: a journal of medical
care organization, provision and financing, 37(3), 234.
Bazzoli, G., Shortell, S., Ciliberto, F., Kralovec, P., & Dubbs, N. (2001). Tracking the
changing provider landscape: implications for health policy and practice. Health
Affairs, 20(6), 188.

152
Begun, J. W., & Kaissi, A. (2004). Uncertainty in health care environments: Myth of
reality? Health Care Management Review, 29(1), 31-19.
Blumenthal, D., & Weissman, J. (2000). Selling teaching hospitals to investor-owned
hospital chains: Three case studies. health Affairs, 19(2), 158-166.
Bovbjerg, R. R., Held, P. J., & Pauly, M. V. (1987). Privatization and Bidding in the
Health-Care Sector. Journal of Policy Analysis and Management, 6(4), 648-666.
Bovbjerg, R. R., Marsteller, J. A., & Ullman, F. C. (2000). Health Care for the Poor and
Uninsured After a Public Hospital's Closure of Conversion: The Urban Institute.
Bowblis, J. R. (2010). Ownership conversion and closure in the nursing home industry.
Health Economics n/a. doi: 10.1002/hec.1618.
Boyd, B. (1990). Corporate Linkages and Organizational Environment: A Test of the
Resource Dependence Model. Strategic Management Journal, 11(6), 419-430.
Brecher, C., & Nesbitt, S. (1985). Factors associated with variation in financial condition
among voluntary hospitals. Health Services Research, 20(3), 267.
Brown, R. E. (1983). Public hospitals on the brink: their problems and their options.
Journal of Health Politics Policy and Law, 7(4), 927-944.
Broyles, R. W., Brandt Jr, E. N., & Biard-Holmes, D. (1998). Networks and the fiscal
performance of rural hospitals in Oklahoma: are they associated? The Journal of
Rural Health, 14(4), 327-337.
Burgess, J. F., Jr., & Wilson, P. W. (1996). Hospital Ownership and Technical
Inefficiency. Management Science, 42(1), 110-123.
Burns, L., Shah, R. J., Frank, A. S., & Powell, A. (2009). The impact of hospital
ownership conversions: Review of the literature and results from a comparative
field study. Advances in Health Care Management, 8, 171-229.
Calandro, J. J. (2007). Considering the utility of Altman's Z-score as a strategic
assessment and performance management tool. Strategy & Leadership, 35(5), 37.
Campbell, C. I., & Alexander, J. A. (2005). Health services for women in outpatient
substance abuse treatment. (Patient Care and Decisions). Health Services
Research, 40(3), 781(730).
Capon, N., Farley, J., & Hoenig, S. (1990). Determinants of financial performance: a
meta-analysis. Management Science, 36(10), 1143-1159.
153
Child, J. (1972). Organizational structure, environment and performance: The role of
strategic choice. Sociology, 6(1), 1-22.
Clark, R. C. (1980). Does not nonprofit form fit the hospital industry? The Harvard Law
Review, 93(7), 1416-1489.
Clement, J. P., D'Aunno, T. A., & Poyzer, B. L. M. (1993). Hospital Corporate
Restructuring and Financial Performance. Medical Care, 31(11), 975-988.
Coyne, J. S., Richards, M. T., Short, R., Shultz, K., & Singh, S. G. (2009). Hospital cost
and efficiency: do hospital size and ownership type really matter? Journal of
Healthcare Management, 54(3), 163-177.
Cutler, D. M., & Horwitz, J. R. (1997). Converting hospitals from not-for-profit to for-
profit status: Why and what effects. Paper presented at the National Bureau of
Economic Research Conference on Not-For-Profit Hospitals.
Dansky, K., Milliron, M., & Gamm, L. (1996). Understanding hospital referrals to home
health agencies. Hospital & Health Services Administration, 41(3), 331.
Das, D. (2009). Factor analysis of financial and operational performance measures of
non-profit hospitals. Journal of Health Care Finance, 36(2), 13.
Davies, H., & Walters, P. (2004). Emergent Patterns of Strategy, Environment and
Performance in a Transition Economy. Strategic Management Journal, 25(4),
347-364.
Davis, G., & Cobb, A. (2009). Resource dependence theory: Past and future. To appear
in Sociology of Organizations.
Dawley, D. D., Hoffman, J. J., & Brockman, E. N. (2003). Do size and diversification
type matter? An examination of post-bankruptcy outcomes. Journal of
Managerial Issues, 15(4), 413-429.
de Hoogh, A., Hartog, D., Koopman, P., Thierry, H., Berg, P., van der Weide, J., et al.
(2004). Charismatic leadership, environmental dynamism, and performance.
European Journal of Work and Organizational Psychology, 13(4), 447-471.
Desai, K. R., Lukas, C. V., & Young, D. W. (2000). Public hospitals: Privatization and
uncompensated care. Health Affairs, 19(2), 167.
Dess, G. G., & Beard, D. W. (1984). Dimensions of Organizational Task Environments.
Administrative Science Quarterly, 29(1), 52-73.
Dess, G. G., & Rasheed, A. M. A. (1991). Conceptualizing and measuring organizational
environments: A critique and suggestions. Journal of Management, 17(4), 701.

154
Detsky, A., O'Rourke, K., Naylor, D., Stacey, S., & Kitchens, J. (1990). Containing
Ontario's hospital costs under universal insurance in the 1980s: What was the
record? Canadian Medical Association Journal, 142(6), 565-572.
Department of Health and Human Services. Office of Inspector General (1992). Public
Health Service's Oversight of the Hill-Burton Program. Retrieved from
http://oig.hhs.gov/oei/reports/oei-05-90-00260.pdf
Department of Health Human Services. National Center of Health Statistics (2011).
Health, United States, 2010: With Special Feature on Death and Dying. Retrieved
from http://www.cdc.gov/nchs/data/hus/hus10.pdf
Dill, W. R. (1958). Environment as an Influence on Managerial Autonomy.
Administrative Science Quarterly, 2(4), 409-443.
Donnelly, J. M. (2011, August 26). Hospitals turn to outpatient services to offset inpatient
care cuts. Boston Business Journal. Retrieved from
http://www.bizjournals.com/boston/print-edition/2011/08/26/hospitals-turn-to-
outpatient-services.html
Dowling, H. (1982). City Hospitals: The Undercare of the Underprivileged. Cambridge:
Harvard University Press.
Duncan, R. B. (1972). Characteristics of organizational environments and perceived
environmental uncertainty. Administrative Science Quarterly, 17(3), 313-327.
Emery, P. E., & Trist, E. L. (1965). The causal texture of organizational environments.
Human Relations, 18, 21-32.
Falik, M. (1983). Hospital financial viability: when is government intervention
appropriate? Health Services Research, 18(4), 582.
Feder, J., & Hadley, J. (1987). A threat or a promise: Acquisition of teaching hospitals by
investor-owned chains. Journal of Health Policy and Law, 12(2), 325-342.
Federico, L. (2005). Strategies for multi-hospital networks: a framework. Health Services
Management Research, 18(2), 86.
Field, A. (2009). Discovering Statistics Using SPSS. Thousand Oaks, CA.SAGE
Publications, Inc.
Fisher, E. S., Bynum, J. P., & Skinner, J. S. (2009). Slowing the growth of health care
costs—lessons from regional variation. New England Journal of Medicine,
360(9), 849-852.
Fisher, E. S., Wennberg, D. E., Stukel, T. A., Gottlieb, D. J., Lucas, F. L., & Pinder, É.
(2003). The implications of regional variations in Medicare spending. Part 2:

155
health outcomes and satisfaction with care. Annals of Internal Medicine, 138(4),
288.
Friedman, B., & Shortell, S. (1988). The financial performance of selected investor-
owned and not-for-profit system hospitals before and after Medicare prospective
payment. Health Services Research, 23(2), 237.
Friedman, E. (1987). Public Hospitals: Doing what everyone wants done but few others
wish to do. Journal of the American Medical Association, 257(11), 1437-1444.
Fuentes-Fuentes, M. M., Albacete-Saez, C. A., & Llorens-Montes, F. J. (2004). The
impact of environmental characteristics on TQM principles and organizational
performance. Omega, 32(6), 425-442.
Galaskiewicz, J. (1985). Interorganizational relations. Annual Review of Sociology, 11,
281-304.
Gapenski, L. C. (2004). Healthcare Finance: An Introduction to Accounting and
Financial Management (Third Edition). Alrington: Association of University
Programs in Health Administration.
Ginn, G., & Young, G. (1992). Organizational and environmental determinants of
hospital strategy. Hospital & Health Services Administration, 37(291-302), 291.
Goldberg, D. G., & Mick, S. S. (2010). Medical home infrastructure: Effect of the
environment and practice characteristics on adoption in Virginia. Medical Care
Research Review, 67(4), 431-449.
Goll, I., & Rasheed, A. (2004). The moderating effect of environmental munificence and
dynamism on the relationship between discretionary social responsibility and firm
performance. Journal of Business Ethics, 49(1), 41-54.
Goll, I., & Rasheed, A. A. (1997). Rational Decision-Making and Firm Performance: The
Moderating Role of Environment. Strategic Management Journal, 18(7), 583-
591.
Goodstein, J., & Boecker, W. (1991). Turbulence at the top: A new perspective on
governance structure changes and strategic changes. The Academy of
Management Journal, 34(2), 306-330.
Gray, B. (1997). Conversion of HMOs and hospitals: What's at stake? Health Affairs,
16(2), 29-47.
Gray, B. H. (1986). For-profit enterprise in health care. Washington D.C.: National
Academy Press.

156
Gray, B. H., Smelser, N., & Baltes, P. (2001). Health Care Organizations: For-profit and
Nonprofit International Encyclopedia of the Social & Behavioral Sciences (pp.
6527-6534). Oxford: Pergamon.
Guterman, S. (2003). Financing teaching hospital missions: a context. Health Affairs,
22(6), 123.
Hall, M. A., & Conover, C. J. (2006). For-profit conversion of Blue Cross plans: Public
benefit or public harm? Annual Review of Public Health, 27, 443-463. Health
Administration Press.
Hall, M., & Weiss, L. (1967). Firm Size and Profitability. The Review of Economics and
Statistics, 49(3), 319-331.
Hannan, M. T. & Freeman, J.(1984). Structural inertial and organizational change.
American Sociological Review, 49 (2), 149-164.
Hayes, S. K., Hodge, K. A., & Hughes, L. W. (2010). A study of efficacy of Altman's Z
to predict bankruptcy of speciality retail frims doing business in contemporary
times. Economics and Business Journal: Inquiries and Perspectives 3(1), 122-
134.
Hunt, S. (2002). The Morphology of Theory Foundations of Marketing Theory: Toward
a General Theory of Marketing (4th ed., pp. 191-221). Armonk: M.E. Sharpe, Inc.
Global Insight, G. (2002). Hospital Compensation Costs: An Analysis of Escalation in
ECI Wage and Benefit Cost Indices Relative to PPS Proxies. Retrieved from
https://www.cms.gov/MedicareProgramRatesStats/downloads/wagestudyfinal.pdf
Gray, B.H. (Ed.). (1986). For-Profit Enterprise in Health Care. Washington, DC:
National Academy Press. Retrieved from
http://www.nap.edu/openbook.php?record_id=653&page=R1
Jacobs, D. (1974). Dependency and vulnerability: An exchange approach to the control of
organizations. Administrative Science Quarterly, 19(1), 55-59.
Jogaratnam, G., Tse, E., & Olsen, M. (1999). Strategic posture, environmental
munificence, and performance: An empirical study of independent restaurants.
Journal of Hospitality & Tourism Research, 23(2), 118.
Keats, B. W., & Hitt, M. A. (1988). A causal model of linkages among environmental
dimensions, macro organizational characteristics, and performance. The Academy
of Management Journal, 31(3), 570-598.
Kim, T. H. (2010). Factors associated with financial distress of nonprofit hospitals. The
Health Care Manager, 29(1), 52-62.

157
Kotha, S., & Nair, A. (1995). Strategy and environment as determinants of performance:
Evidence from the Japanese Machine Tool Industry. Strategic Management
Journal, 16(7), 497-518.
Kumar, K., Subramanian, R., & Strandholm, K. (2002). Market and efficiency-based
strategic responses to environmental changes in the health care industry. Health
Care Management Review, 27(3), 21.
Kupersmith, J. (2005). Quality of care in teaching hospitals: a literature review. Academic
Medicine, 80(5), 458.
Landry, A., & Landry III, R. (2009). Factors associated with hospital bankruptcies: A
political and economic framework. Journal of Healthcare Management/American
College of Healthcare Executives, 54(4), 252.
Langabeer II, J. (1998). Competitive strategy in turbulent healthcare markets: An analysis
of financially effective teaching hospitals. Journal of healthcare
management/American College of Healthcare Executives, 43(6), 512-525.
Langabeer, J. (2006). Predicting financial distress in teaching hospitals. Journal of Health
Care Finance, 33(2), 84.
Lee, S., & Alexander, J. A. (1999). Managing hospitals in turbulent times: Do
organizational changes improve hospital survival? Health Services Research,
34(4), 923.
Legnini, M. L., Anthony, S. E., Wicks, E. K., Meyer, J. E., Rybowski, L. S., & Stepmick,
L. S. (1999). Privatization of public hospitals: The Henry J. Kaiser Family
Foundation.
Lenz, R. T. (1980). Environment, Strategy, Organization Structure and Performance:
Patterns in One Industry. Strategic Management Journal, 1(3), 209-226.
Margarethe, F. W., & Bantel, K. A. (1993). Top Management Team Turnover as an
Adaptation Mechanism: The Role of the Environment. Strategic Management
Journal, 14(7), 485-504.
Mark, T. L. (1999). Analysis of the rationale for, and consequences of, nonprofit and for-
profit ownership conversions. Health Services Research, 34(1), 83-301.
Marsteller, J. A., Bovbjerg, R. R., & Nichols, L. M. (1998). Nonprofit conversion:
Theory, evidence, and state policy options. Health Services Research, 33(5),
1495-1535.
McCue, M., Furst, R. (1986). Finanical characteristics of hospitals purchased by investor-
owned chains. Health Services Research, 21(4), 515-526.

158
McEachern, M. T. (1936). Hospital Organization and Management. Chicago: Physicians
Record Company.
McKinney, M. M, Morrissey, J.P., & Kaluzny, A. D. (1993). Interorganizational
exchanges as performance markers in a community cancer network. Health
Services Research, v28 (n4), 420-459.
McNamara, G., Luce, R., & Tompson, G. (2002). Examining the effect of complexity in
strategic group knowledge structures on firm performance. Strategic Management
Journal, 23(2), 153-170.
Menachemi, N., Mazurenko, O., Kazley, A. S., Diana, M. L., & Ford, E. W. (2012).
Market factors and electronic medical record adoption in medical practices.
Health Care Management Review January/March, 37(1), 14-22.
Menachemi, N., Shin, D. Y., Ford, E. W., & Yu, F. (2011). Environmental factors and
health information technology management strategy. Health Care Management
Review July/September, 36(3), 275-285.
Molinari, C., Alexander, J., Morlock, L., & Lyles, C. A. (1995). Does the hospital board
need a doctor? The influence of physician board participation on hospital
financial performance. Medical Care, 33(2), 170-185.
Morrisey, M. A., Menachemi, N., Cawley, J., & Ginter, O. (2010). Publication Activity
of Health Adminsitration Faculty. The Journal of Health Administration
Education, 27(3), 199-217.
Moses III, H., Thier, S., & Matheson, D. (2005). Why have academic medical centers
survived? JAMA, 293(12), 1495.
National Conference of State Legislatures (2012). Certificate of Need: State Health Laws
and Programs. Retrieved from http://www.ncsl.org/issues-research/health/con-
certificate-of-need-state-laws.aspx
National Public Health and Hospital Institute (2009). America‘s Public Hospitals and
Health Systems, 2009. Results of the Annual NAPH Hospital Characteristics
Survey. Retrieved from http://www.nphhi.org/Homepage-Layout/Featured-
Publications/Monographs/2009-Public-Hospital-Financial-Characteristics-
.aspx?FT=.pdf
National Association of Public Hospitals and Health Systems (2011). History of Public
Hospitals in the United States. Retrieved from http://www.naph.org/Homepage-
Sections/Explore/History.aspx
Nauenberg, E., Brewer, C. S., Basu, K., Bliss, M. K., & Osborne, J. W. (1999). Network
structure and hospital financial performance in New York State: 1991-1995.
Medical Care Research and Review, 56(4), 415.

159
Needleman, J. (1999). Nonprofit to for-profit conversions by hospitals, health insurers
and health plans. Public Health Reports, 114(2), 108-119.
Needleman, J., Chollet. D. J., & Lamphere, J. A. (1997). Hospital conversion trends.
Health Affairs, 16(2), 187-195.
Needleman, J., Lamphere, J. A., & Chollet, D. J. (1999). Uncompensated care and
hospital conversions in Florida. Health Affairs, 18(4), 125-133.
Nienhuser, W. (2008). Resource dependence theory-How well does it explain behavior of
organizations? Management Review, 19(1+2), 9-32.
Pelham, A. (1999). Influence of environment, strategy, and market orientation on
performance in small manufacturing firms. Journal of Business research, 45(1),
33-46.
Pfeffer, J. (1973). Size, competition and function of hospital boards of directors: A study
of organization-environment linkage. Administrative Science Quarterly, 18(3),
349-364.
Pfeffer, J. (2005). Developing Resource Dependence Theory: How Theory is affected by
its Environment. In Great Minds in Management: The Process of Theory
Development. Oxford: Oxford University Press.
Pfeffer, J., & Salancik, G. (1978). The External Control of Organizations: A Resource
Dependence Perspective. New York: Harper & Row.
Picone, G., Chou, S.-Y., & Sloan, F. (2002). Are For-Profit Hospital Conversions
Harmful to Patients and to Medicare? The RAND Journal of Economics, 33(3),
507-523.
Pink, G. H., Holmes, M., D'Alpe, C., Strunnk, L. A., McGee, P., & Slifkin, R. (2005).
Financial Indicators for Critical Access Hospitals: Flex Monitoring Team:
University of Minnesota, University of North Carolina at Chapel Hill, University
of Southern Maine.
Porter, M. (1985). Competitive advantage (Vol. 15): Free Press New York.
Pradhan, R. (2010). Quality and Financial Performances of Private Equity Owned
Nursing Homes in the State of Florida. (Unpublished dissertation). University of
Florida, Gainesville.
Proenca, E. J., Rosko, M. D., & Zinn, J. S. (2000). Community Orientation in Hospitals:
An Institutional and Resource Dependence Perspective. Health Services
Research, 35(5),
Reuter, J., & Gaskin, D. (1997). Academic health centers in competitive markets. Health
Affairs, 16(4), 242.

160
Rosenberg, C. (1982). From Almshouse to hospital: the shaping of Philadelphia General
Hospital. Milbank Memorial Fund Quarterly. Health and Society, 60(1), 108-154.
Rosko, M. D. (2004). Performance of US teaching hospitals: a panel analysis of cost
inefficiency. Health Care Management Science, 7(1), 7-16.
Sataline, S. (2010). Cash-Poor Governments Ditching Public Hospitals. The Wall Street
Journal, pp. 1-4. Retrieved from http://online.wsj.com/article
Sebelius, K., Frieden, T. R., & Sondik, E. J. (2010). Health, United States, 2009: US
Department of Health and Human Services.
Sharfman, M. P., & Dean Jr, J. W. (1991). Conceptualizing and Measuring the
Organizational Environment: A Multidimensional Approach. Journal of
Management, 17(4), 681.
Sharfman, M., Wolf, G., Chase, R., & Tansik, D. (1988). Antecedents of organizational
slack. Academy of Management Review, 13(4), 601-614.
Shen, Y.-C. (2002). The effect of hospital ownership choice on patient outcomes after
treatment for acute myocardial infarction. Journal of Health Economics, 21(5),
901-922.
Shen, Y.-C. (2003). Changes in hospital performance after ownership conversions.
Inquiry - Excellus Health Plan, 40(3), 217.
Shen, Y.-C, Wu, V. Y, & Melnick, G. (2010). Trends in hospital cost and revenue, 1994-
2005: How are they related to HMO penetration, concentration, and for-profit
ownership? Health Services Research, 45 (1), 42-61.
Shi, L., & Singh, D. A. (2004). Delivering Health Care in America: A Systems Approach
(Third Edition ed.). Sudbury, MA: Jones and Bartlett Publishers.
Siegel, B. (1996). Public Hospitals--a Prescription for Survival: Commonwealth Fund.
Simerly, R. L., & Li, M. (2000). Environmental Dynamism, Capital Structure and
Performance: A Theoretical Integration and an Empirical Test. Strategic
Management Journal, 21(1), 31-49.
Sloan, F. A. (2002). Hospital Ownership Conversions: Defining the Appropriate Public
Oversight Role. NBER/Frontiers in Health Policy Research, 5(1), 123-166.
Sloan, F. A., Ostermann, J., & Conover, C. J. (2003). Antecedents of hospital ownership
conversions, mergers, and closures. Inquiry-the Journal of Health Care
Organization Provision and Financing, 40(1), 39-56.

161
Sloan, F. A., Taylor Jr, D. H., & Conover, C. J. (2000). «Hospital Conversions: is the
Purchase Price Too Low? ». The changing hospital industry: comparing not-for-
profit and for-profit institutions, 13–44.
Starkey, K. B., Weech-Maldonado, R., & Mor, V. (2005). Market competition and
quality of care in the nursing home industry. Journal of Healthcare Finance,
31(1), 67-81.
Starr, P. (1982). The Social Transformation of American Medicine. Cambridge, MA:
Basic Books.
Stearns, T. M., Hoffman, A. N., & Heide, J. B. (1987). Performance of Commercial
Television Stations as an Outcome of Interorganizational Linkages and
Environmental Conditions. The Academy of Management Journal, 30(1), 71-90.
Stevens, R. (1989). In Sickness and in Wealth: American Hospitals in the Twentieth
Century. New York: Basic Books.
Tennyson, D. H., & Fottler, M. D. (2000). Does system membership enhance financial
performance in hospitals? Medical Care Research and Review, 57(1), 29.
Thorpe, K., Florence, C., & Sieber, E. (2000). Hospital conversions, margins, and the
provision of uncompensated care. Health Affairs, 19(6), 187-194.
Trinh, H. Q., & Begun, J. W. (1999). Strategic adaptation of US rural hospitals during an
era of limited financial resources: A longitudinal study, 1983 to 1993. Health
Care Management Science, 2(1), 43-52.
Trussel, J. M., & Patrick, P. A. (2010). Rural Hospital Financial Conditions: Evaluating
Financial Distress in Rural Pennsylvania Hospitals. Harrisburg: The Center for
Rural Pennsylvania.
UCLA Academic Technology Services (2012). SAS Annotated Output Proc TTest.
Retrieved from http://www.ats.ucla.edu/stat/sas/output/ttest.htm
Ulrich, D., & Barney, J. B. (1984). Perspectives in organizations: resource dependence,
efficiency and population. The Academy of Management Review, 9(3).
United States Department of Agriculture. Economic Research Service (2004). Measuring
Rurality: Rural-Urban Continuum Codes, 2003. Retrieved from
http://www.ers.usda.gov/Briefing/Rurality/ruralurbcon/
Vujicic, M., Addai, E., & Bosomprah, S. (2009). Measuring Health Wrokforce
Productivity: Application of a Simple Methodology in Ghana. Washington, DC:
The International Bank for Reconstruction and Development/The World Bank.
162
Walker, D. M. (2005). Nonprofit, for-profit and government hospitals: Uncompensated
care and other community benefits: United States Government Accountability
Office.
Wan, W. P., & Yiu, D. W. (2009). From Crisis to Opportunity: Environmental Jolt,
Corporate Acquisitions, and Firm Performance. Strategic Management Journal,
30(7), 791-801.
Weech-Maldonado, R., Neff, G., Mor, V. (2003). Does quality of care lead to better
finanical performance? The case of the nursing home industry. Health Care
Management Review. 28 (3), 201-216.
Weech-Maldonado, R., Laberge, A., Pradhan, R., Johnson, C. E., Yang, Z., & Hyer, C.
(in press). Nursing home financial performance: The role of ownership and chain
affiliation. Health Care Management Review.
Weech-Maldonado, R., Qaseem, A., & Mkanta, W. (2009). Operating environment and
USA nursing homes' participation in the subacute care market: A longitudinal
analysis. Health Services Management Research, 22(1), 1-7.
Weil, T. P. (2011). Privatization of hospitals: Meeting divergent interests. Journal of
Healthcare Finance, 38(2), 1-11.
Wessel, R. H. (1995). Privatization in the United States. Business Economics, 30(4), 45.
Wooldridge, J. M. (2006). Introductory Econometrics: A Modern Approach (Thomson
South-Western, Mason, OH).
Younis, M. Z., & Forgione, D. A. (2005). Using return on equity and total profit margin
to evaluate hospital performance in the U.S.: a piecewise regression analysis. J
Health Care Finance, 31(3), 82-88.
Younis, M. Z., Younies, H., & Okojie, F. (2006). Hospital financial performance in the
United States of America: a follow-up study. Hospital, 12(5).
Zakus, D. L. (1998). Resource dependency and community participation in primary
health care. Social Science and Medicine, 46(4-5), 475-494.
Zinn, J. S., Mor, V., Castle, N., Intrator, O., & Brannon, D. (1999). Organizational and
environmental factors associated with nursing home participation in managed
care. Health Services Research, 33(6), 1753-1767.
Zinn, J. S., Weimer, D. L., Spector, W., & Mukamel, D. B. (2010). Factors influencing
nursing home response to quality measure publication: A resource dependence
perspective. Health Care Manage Rev, 35(3), 256-265.

163
Zinn, J., Weech, R. J., & Brannon, D. (1998). Resource dependence and institutional
elements in nursing home TQM adoption. Health Services Research, 33(2), 261-
273.

164
APPENDIX A
Table A.1
Summary of Empirical Studies on the Consequences of Privatization Determinants and Antecedents of Privatization in
Healthcare Organizations
Authors Purpose Data and Methods Variables Results
Frank Sloan
Jan Osterman
Christopher Conover,
2003
Investigated the antecedents
of hospital conversions,
mergers, and closures.
Conversion from NP or
Gov to FP
Theory: Finance/economic
theory on Net Present Value
of future cash flow from
operations and from sale of
the facility
Data: 1985-1996
AHA 1985-1996
Medicare Cost Report
Area Resource File
Data from Mark(1999)
N= 5,089 (all short stay
general and surgical non-
federal community hospitals.
Methods
Multinomial logit model for
the three strategies
(conversion, merger, closure).
Each observation was entered
in the model 11 times.
2 logistic regressions for
ownership change from NP or
Gov to FP and from FP
Dependent variables
Multinomial model
Probability of conversion,
merger or closure
Logistic regression
Probability of ownership
conversion from NP or
Gov to FP
Probability of conversion
of from FP to NP or Gov
Independent variables
For multinomial logistic and
regular logistic regressions
Hospitals financial health
Operating margin
Operating margin squared
Operating margin cubed
Debt-to-capitalization
County demand
characteristics
Percent 65 years old or
older
Per capita income ($1995)
Unemployment rate
Population density
Percent HMO enrollees
County supply
Conversion from NP or
Gov to FP was preceded
by chronically low margins
and high debt-to-asset ratio
Conversion from FP to NP
or Gov occurred quickly
after a decline in profit
margin
Conversion occurred more
in the South
Higher percent of elderly
people, higher debt-to-asset
ratio, higher percentage of
HMO enrollees, higher
unemployment rate, and
higher percentage of
Medicaid patients were
associated with higher
likelihood of closure
Large hospital size and
higher occupancy rate were
associated with lower
probability of closure
Higher per capita income
and higher unemployment
rate were associated with
lower probability of
conversion
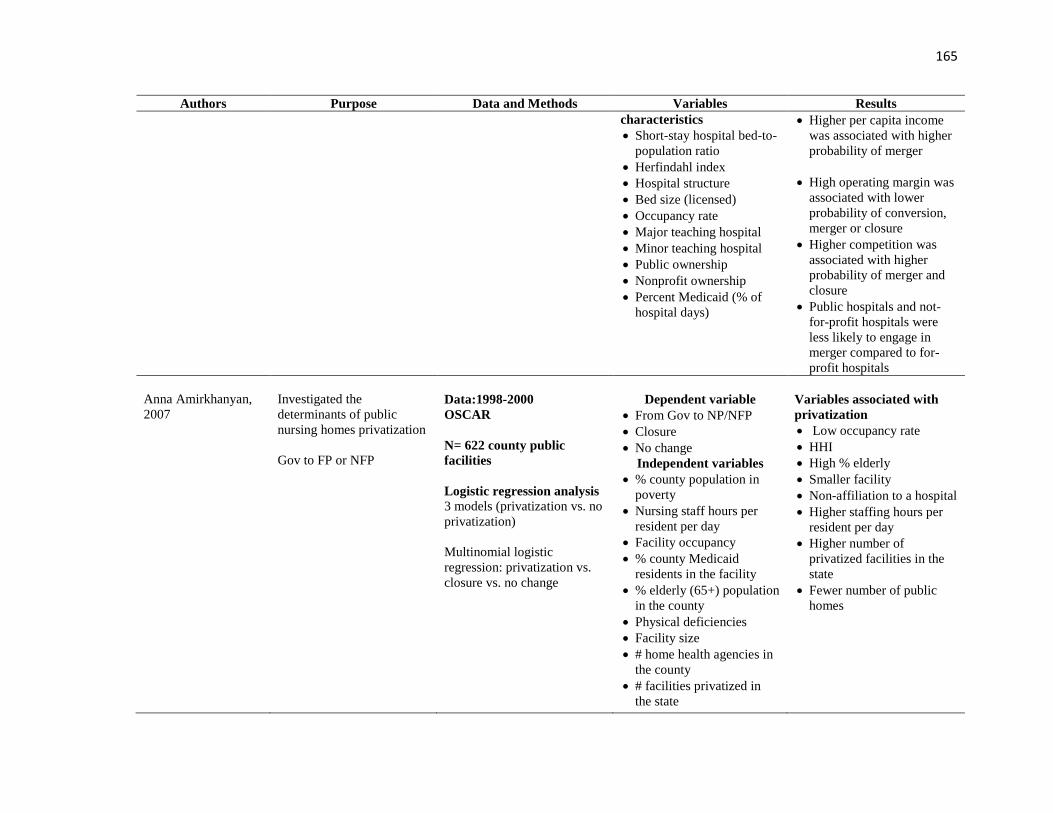
165
Authors Purpose Data and Methods Variables Results
characteristics
Short-stay hospital bed-to-
population ratio
Herfindahl index
Hospital structure
Bed size (licensed)
Occupancy rate
Major teaching hospital
Minor teaching hospital
Public ownership
Nonprofit ownership
Percent Medicaid (% of
hospital days)
Higher per capita income
was associated with higher
probability of merger
High operating margin was
associated with lower
probability of conversion,
merger or closure
Higher competition was
associated with higher
probability of merger and
closure
Public hospitals and not-
for-profit hospitals were
less likely to engage in
merger compared to for-
profit hospitals
Anna Amirkhanyan,
2007
Investigated the
determinants of public
nursing homes privatization
Gov to FP or NFP
Data:1998-2000
OSCAR
N= 622 county public
facilities
Logistic regression analysis
3 models (privatization vs. no
privatization)
Multinomial logistic
regression: privatization vs.
closure vs. no change
Dependent variable
From Gov to NP/NFP
Closure
No change
Independent variables
% county population in
poverty
Nursing staff hours per
resident per day
Facility occupancy
% county Medicaid
residents in the facility
% elderly (65+) population
in the county
Physical deficiencies
Facility size
# home health agencies in
the county
# facilities privatized in
the state
Variables associated with
privatization
Low occupancy rate
HHI
High % elderly
Smaller facility
Non-affiliation to a hospital
Higher staffing hours per
resident per day
Higher number of
privatized facilities in the
state
Fewer number of public
homes

166
Authors Purpose Data and Methods Variables Results
Anna Amirkhanyan,
2007 (continued)
# public facilities in the
state
# facilities in the county
that pay for Medicaid
Facility in a state with
CON regulation
Organized groups in the
facility
Facility is hospital
affiliated
Divested facility
HHI
Table A.2
Consequences of Privatization on Financial Performance in Healthcare Organizations
Authors Purpose Data and Methods Variables Results
Gabriel Picone
Shin Yi-Chou
Frank Sloan, 2002
Investigated the
consequences of hospital
conversions from NP or Gov
to FP and vice versa on
mortality rate and Medicare
payment per hospital stay
Data : 1982, 1984, 1989,
1994
National Long-Term Care
Survey
AHA
Medicare Cost Reports
AHA and MCR data were
used to validate ownership
conversion info
Data was computed over 5
years before conversion and
three years after conversion
N= 3,645 hospitals
N= 73,503 Medicare
enrollees
Dependent variables
Mortality rates
Medicare payment per
admission
Hospital level of analysis
Operating margin
Bedsize
Total employment
Total wage and salary
Total wage to annual
number of adjusted patient
days (output)
Total salary to annual
number of adjusted patient
days (output)
Patient level of analysis
For conversion from FP to
NP or Gov
Mortality rate decreased
after conversion from FP
to NP or Gov
Medicare payment
monotonically increased
from 5 years before
conversion up to 3 years
after conversion
For conversion from Gov
or NP to FP
Crude mortality rate (no
control variable) increased
after conversion from NP
or Gov to FP

167
Authors Purpose Data and Methods Variables Results
Hospital level analysis
Patient level analysis
Primary Sampling Unit
(PSU) fixed effects
regression
Hospital fixed effects
regression
(Difference-in-difference)
Diagnostic cost group
score (DxCG)
Activity of daily living
(ADL)
Predicted mortality at one
year
Medicare payment
monotonically increased
from 5 years before
conversion up to 3 years
after conversion
Increased operating margin
Decreased employment
Decreased salaried
Decreased output
Yu-Chu Shen, 2003
Yu-Chu Shen, 2003
(continued)
Investigated the effects of
conversion on financial
performance, staffing,
capacity and unprofitable
care
Conversions in all directions
Data; 1985-1998
1985-1999
AHA, ARF
Conversion between 1987
and 1998 was analyzed (2-
year pre-conversion
information)
N=5,200 hospitals
Used 2-year pre-conversion
data
Hospital fixed-effects model
for the entire sample and a
matched sample of converted
and non-converted hospitals
using propensity score
method (difference-in-
difference)
Dependent variables
Financial performance
Total profit margin
Operating cost per
discharge
Patient revenue per
discharge
Staffing ratios
FTE per hospital bed
FTE registered nurses per
hospital bed
FTE licensed practical and
vocational nurses per
hospital bed
Capacity and patient load
Number of hospital beds in
general services
Total number of patient
discharges
Total number of outpatient
visits
Unprofitable care
Admission to emergency
room
Share of total Medicaid
discharges
NP to Gov and FP
increased profit margin
Gov or NP to FP reduced
workforce
GOV or NP to FP
decreased operating cost
per discharge
Decreased staffing ratio
after Gov or No to FP and
Gov or FP to FP
Gov or NP to FP increased
the probability of trauma
center closures, increased
share of outpatient visits
in the emergency
department, increased
Medicaid discharge
No type of conversion
affected the amount of
unprofitable care

168
Authors Purpose Data and Methods Variables Results
Independent variables
All types of conversion
Control variables
Hospital fixed effects
Teaching status
Hospital market area
(within 15-mile radius
from zip-code location
HHI
Percentage of FP, NP, Gov
hospitals in the area
Urban/rural
Anonymous
Anonymous
Investigated the effects
conversion from Gov to FP
and Gov to NP on efficiency
and quality.
Hospitals in Germany
Data: 1996-2007
N= 1,015 hospitals that
received DRG payment from
social health insurance and
private health insurance
companies
Data envelopment analysis
(DEA)
Random effects linear
regression for longitudinal
model with DEA efficiency
scores
Propensity score
Input variables
Supplies expenses
including operational
expenses, capital and
depreciation expenses
FTE clinical staff
FTE nursing staff
FTE medical-technical
staff
FTE administrative staff
FTE other staff members
Output variables
# treated patients per case
per year
1-Average mortality rate
Control variables
Staffed Beds
HHI
Teaching status
Beds hired to self-
employed ambulatory
physicians
% patients over 65
Case mix
Positive impact of
privatization on hospital
efficiency
Gov to FP outperformed
Gov to NP
Less competitive markets
enhanced efficiency
Larger effect of
privatization on efficiency
after DRG implementation
in 2003

169
Table A.3
Healthcare Industry: Case Studies
Authors Purpose Methods Findings
Frank Sloan
Donald Taylor
Chris Conover, 2000
Investigated the causes
and effects of conversion
on financial performance
To see whether the
community received a fair
price from sale or lease of
hospitals
All conversion types
10 case studies of hospitals in
Tennessee, North and South Carolina
Mixed methods: case study and
quantitative
1 case on Gov to NP
2 cases on Gov to FP
Data:
AHA 1987-1995
MCR
Tennessee Joint Annual Reports of
Hospitals
Consultation with board
Motives for conversion: to enhance financial
viability, to preserve local jobs, efficiency,
Consequences of conversion
Maintained hospital viability
Increased profitability
Concern of loss of control to an organization
controlled by outsiders.
From Gov or NP to FP
Decreased availability of services for community
health and patient education
Decreased Medicare share
Higher real rate of return vs. cost of capital (1
case)
Lower real rate of return vs. cost of capital (1
case)
From Gov to NP
Higher real rate of return vs. cost of capital
Mark W. Legnini
Stephanie E. Anthony
Elliot K. Wicks
Jack A. Meyer
Lise S. Rybowski
Larry S. Stepnick
1999
Studied the determinants and
effects of privatization of
public hospitals from private
NP and quasi-public.
5 public hospitals in 5 states
Privatizations resulted from
lease, merger, sale,
management contract,
consolidation, joint venture,
partnership and system
affiliation
Site visits (two hospitals)
Intensive structured interviews of 10
to 20 individuals per site
Phone interviews
Other data
AHA data, Newspapers
Additional research to describe and
analyze 10 more conversions
Motivations for conversion
Financial difficulties due to increasingly
competitive environment
Attract broad range of patients who can afford to
pay healthcare services
Freedom from public governance constraints
Access to capital
Motivation of private sector to expand market
power
Strategy for long-term survival of private
hospitals
Process of conversion
Long political processes: need to embrace
―perceived opposition‖ and ―appease affected

170
Authors Purpose Methods Findings
Mark W. Legnini
Stephanie E. Anthony
Elliot K. Wicks
Jack A. Meyer
Lise S. Rybowski
Larry S. Stepnick
1999 (continued)
parties‖
Private organizations that succeeded in the
transactions had good track record in serving the
needy and the vulnerable and exhibited
acceptable concern for the hospital‘s mission.
Challenges of public hospitals
Public hospitals faced more constraints than
private hospitals: fewer patient care revenue,
financial burden of charity care, loss of Medicaid
patients to private hospitals
Increasing number of uninsured patients
Randall Bovbjerg
Jill Marsteller
Frank Ullman, 2000
Studied the effects of public
hospitals closures or
conversion on the healthcare
for the poor and uninsured
Reasons and effects of
conversion
Case study
Studied 5 public hospitals
Reasons of conversion
Inefficiency
Competition
Political preferences
Effects of conversion
Improved efficiency
Overall access for the uninsured remained
unchanged as before (3 converted hospitals)
Limited local funding
More importance of state and federal funding
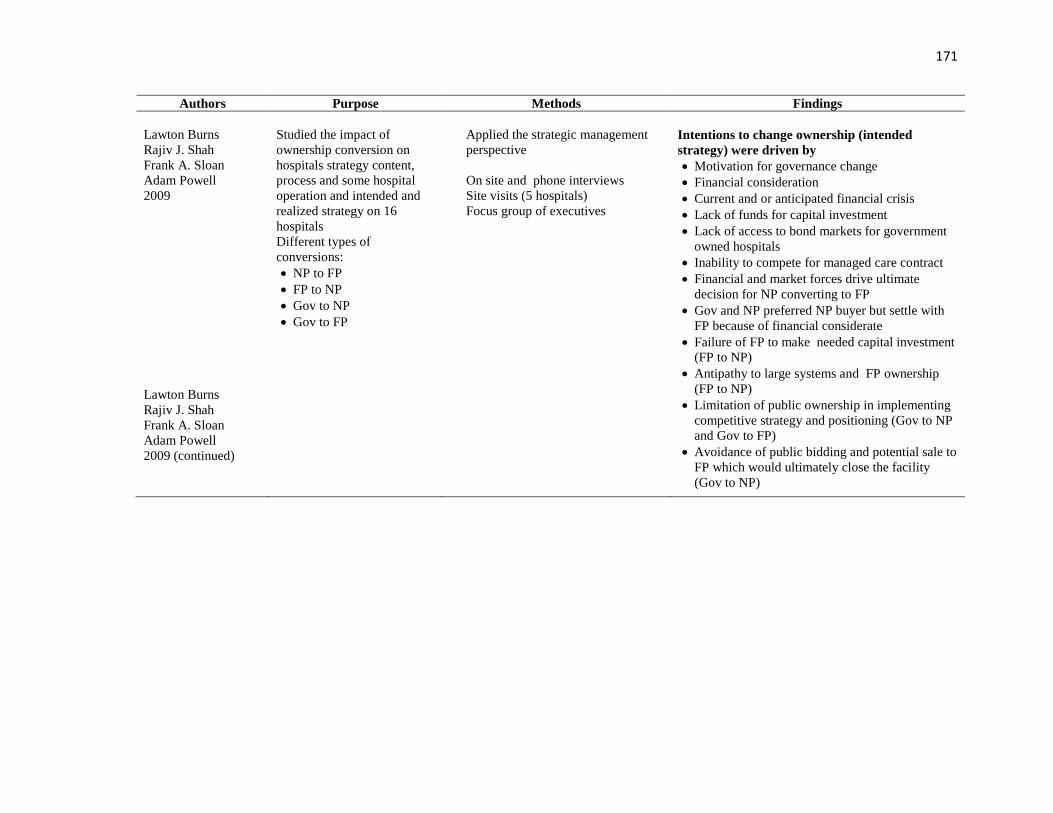
171
Authors Purpose Methods Findings
Lawton Burns
Rajiv J. Shah
Frank A. Sloan
Adam Powell
2009
Lawton Burns
Rajiv J. Shah
Frank A. Sloan
Adam Powell
2009 (continued)
Studied the impact of
ownership conversion on
hospitals strategy content,
process and some hospital
operation and intended and
realized strategy on 16
hospitals
Different types of
conversions:
NP to FP
FP to NP
Gov to NP
Gov to FP
Applied the strategic management
perspective
On site and phone interviews
Site visits (5 hospitals)
Focus group of executives
Intentions to change ownership (intended
strategy) were driven by
Motivation for governance change
Financial consideration
Current and or anticipated financial crisis
Lack of funds for capital investment
Lack of access to bond markets for government
owned hospitals
Inability to compete for managed care contract
Financial and market forces drive ultimate
decision for NP converting to FP
Gov and NP preferred NP buyer but settle with
FP because of financial considerate
Failure of FP to make needed capital investment
(FP to NP)
Antipathy to large systems and FP ownership
(FP to NP)
Limitation of public ownership in implementing
competitive strategy and positioning (Gov to NP
and Gov to FP)
Avoidance of public bidding and potential sale to
FP which would ultimately close the facility
(Gov to NP)

172