the antecedents of brand equity: a study from
TRANSCRIPT

In Pakistan, the telecommunication sector after foreign investment has become highly competitive and it has become difficult for this sector to hold existing customers and retain new ones. By providing better brand perceptions, the companies could have a satisfied base of consumers. The population for this study are the customers in the telecommunication sector, and the sample size is 510 throughout five metro cities of Pakistan. After a couple of pilot tests, the questionnaires administered to the respondents through a mall intercept method and 22 malls used for distribution for that in five metro cities that are Karachi, Lahore, Islamabad, Peshawar & Quetta. The developed model explains the effect of branding parameters on brand equity and concludes that if a telecommunication company is anxious to increase brand equity then it should try to build customers' perceived quality so it may lead in the generation of brand equity with higher levels. It is very beneficial for the marketing management who wants to know the essence of its customer’s engagement with the marketing efforts as they know that later it will aid in the company’s high performance. This research is limited to Pakistan but not bound to any country and it can be implemented according to the environment of other countries. Name of brands used for this survey is Mobilink, Ufone, Telenor, Warid, Zong, and PTCL.
The Antecedents of Brand Equity: A Study from Telecommunication Industry of Pakistan
ABSTRACT
INTRODUCTION
Masood Hassan1
1- Institute of Business Management (IoBM), Karachi, Email: [email protected]
When brands are strong then they become lucrative for the customers and then the customers buy the brands or products or show an inclination towards a particular brand, which gives companies chances to earn a high market share, profits, share values, and goodwill. According to Keller (1993), it is termed as Brand Equity when the customer gives response against the marketing of a product or brand with different views of brand knowledge. Not only on the domestic level as well as for the global era, but this has also become the important phenomenon and it helps to set the prices accordingly which is beneficial to the companies, which support to a firm that a customer would be able to pay a premium price. Several types of research have done on this topic (Aaker, 1991; Yasin et al., 2007).
Consumer’s perception for a brand depending upon several factors that form a brand equity and several researchers have tested those variables and it affects the brand equity (Aaker, 1991; Lee, 2000) while common variables directing to brand equity are brand awareness, perceived quality and brand loyalty which are counted as brand equity’s dimensions. Researchers have tested concepts of brand equity dimensions for different product and service categories such as film, television sets (Yoo et al., 2001), paper towels (Plank et al., 2002), sports shoes (Iglesias, 2002), cars, televisions (Cooksey et al., 2005), cars, electronics,
JEL Classification: M10, M30, M31, M39
Keywords: Brand Equity, Brand Loyalty, Brand Awareness, Brand Association, Perceived Quality
49July-December 2018JISR-MSSE Number 2Volume 16
DOI: 10.31384/jisrmsse/(2018).16.2.4

sportswear and soft drinks (Martinez, 2008), holiday destinations (Ekinci, 2018),tourist satisfaction (San Martín, Herrero & García de los Salmones, 2018), Employer Branding (Theurer et al., 2018), higher education brands (Khanna, Jacob, & Chopra , 2018), social media (Colicev, Malshe , & Pauwels, 2018) . Understanding about outcomes and sources of brand equity give leverage to the managers and marketers so that they can process the information which is necessary for adding brand value (Keller & Brexendorf, 2017).
Since 1960, brand equity has been considered a thing of interest for the marketing but an opinion is that antecedents have more focus than the consequences but this study was subjected to a framework for the consequences and antecedents of brand equity and examines within specific environment of mobile telecommunications in Pakistan. A website (www.budde.com.au) stated that foreign investment has become a substantive part of the telecom sector of Pakistan. This market had been striving hard for a long time due to a regulated state-owned monopoly while capital inputs from the government along with the World Bank and Asian Development Bank supported to make it a deregulated competitive structure. Due to a re-verification program of government in 2015, there was a setback in the growth with the temporary decline. Now rapid rollout of the 3G and 4G networks has done a strong uptake of mobile broadband during 2016 and 2017. This has been assumed that the market for fixed telephone lines will be decline further for over the next five years till 2022 because the mobile segment is gradually growing in both voice and data/broadband usage.
An official website (www.pta.gov.pk) reveals the figures that Total Tele-density (Fixed + WLL+ Mobile) was 4.31 % during 2002-03, which has turned up to 71.81 by Aug-17. Annual Cellular Subscribers were 0.5 million during 2003- 04 that has raised up to 140 million by August-17. Annual Cellular Mobile Teledensity was 3.29% during 2003-04 which has been raised up to 70.25 % by August-17. Total Foreign Direct Investment in Telecom Sector was 949.4 US $ million during 2003-04 which has been raised up to 1901.2US $ million during 2015-16 (Source: State Bank of Pakistan).
The conceptualization of integrated brand equity model in this study has been adopted from previous studies based upon Aker (1991) in order to test four basic dimensions of brand equity towards a telecommunication network such as, Mobilink, Ufone (PTCL’s subsidiary), Telenor Pakistan, Warid, Telecom, Zong and Pakistan Telecommunication Co. Ltd (PTCL).
Branding will make clarity for the reasons for the existence of such telecommunication brands and will give inspiration to the employees so they can use it for brand building for the customers. The basic four dimensions of brand equity i.e. Brand loyalty, Brand Awareness, Brand Association, Perceived Quality will have an influence on the customers, and this study will help in the understanding of the marketers and the firms. This research is unique among other researches as it is evaluating the perception of brand equity in the perception of consumers’ minds while being conducted in five metro cities of Pakistan. It could be applied to any other metro cities of the world that resembles metro cities of Pakistan.
Pakistan is growing in the telecommunication sector and despite the fact that this sector is the key driver of economic growth; we do not have literature present that can tell us properly about brand equity concepts in the minds of consumers.
Research Gap
50 July-December 2018 JISR-MSSENumber 2Volume 16

To discuss the relationships between brand equity’s dimensions and overall brand equity, this study is important as it measures brand equity and identifies the antecedents of brand equity. We would like to study how Pakistani people’s perceptions could influence the telecom brand through brand equity dimensions.
How do Pakistani people’s perceptions could be influenced towards telecom brand through the conceptualization of brand equity?
The objective of this study is to examine how Pakistani people’s perceptions could influence the telecom brand through brand equity as it measures brand equity and identifies the brand equity's dimensions. This is our hope that this study would support in a better understanding of the brand perception of Pakistani people within the telecom industry.
This worthy research targets the public which have a basic understanding of the brand concepts and who are customers of any of the telecom brands. This study is very beneficial for those marketers who want to understand the telecom market and then want to apply marketing tactics accordingly. The working, recommendation and conclusion of this study will also help those researchers who are interested in finding the effects of brand equity on the telecom industry.
Problem Statement
Research Question
H1: There is a significant relationship between Brand loyalty and Brand Equity
As defined by Kumar et al. (2013), a core dimension of brand equity is Brand Loyalty. Bovee et al. (1995) defined Brand loyalty that it is a commitment level, which felt by a customer to a specific brand due to which continuous purchases takes place (Kumar et al., 2013). The relationship and relatedness of a customer towards a brand labeled as the ‘brand resonance’, which is found in those customers who have high brand loyalty level (Keller, 2003).According to Aaker (1991), it is a dimension of brand equity. Chi et al. (2009) claimed that behavioral loyalty is not that if a customer is continuously purchasing the same brand. Brand Loyalty is a form of repeat purchase, which is due to the feeling, and association of customer towards the brand (Bovee et al., 1995).
Based on the above discussions presented below is the developed hypothesis:
LITERATURE REVIEW
Brand loyalty and Brand Equity
Aaker (1996) defined that brand awareness is the power of a brand in the mind of the consumer. Bovee et al., (1995) defined that for a target market, which is aware of a brand, it is a measure of the percentage of that particular market. Throughout continuous advertisement and publicity, awareness could create among the target audience (Strydom et al., 2000). A brand adds high value to customers when it has a high brand awareness and positively
Brand Awareness and Brand Equity
51July-December 2018JISR-MSSE Number 2Volume 16

H2: There is a significant relationship between Brand Awareness and Brand Equity
H3: There is a significant relationship between Brand Association and Brand Equity
According to Peter (2007), “the association portrays that the products that consumer’s use define their way of living, and also that shows where they stand socially, their roles in profession, their goals, product usage, the stores where the products are available or the availability in the country of origin”. When consumers buy a product then at the same time they buy the image associations of product that are identification, wealth, sophistication, power and special connection with other users of the same brand (Evans et al., 2006). Gica et al. (2007) defined that through brand association, consumers rememorize the information about specific brands that help them in their purchasing decisions. According to Keller (1993), the perception of the consumer towards a specific brand is the brand image that reflects at the buyer's memory due to brand association. Brand associations are images that linked by people and strong brands possess positive associations along with awareness and loyalty (Bovee et al., 1995). According to the Aaker (1996), when a customer memory linked with a brand either direct or indirect then it referred to as ‘brand association'. Marketing programs create a positive brand image that conceive a positive, powerful and appraisable image of the brand in the mind of the consumer (Keller, 2003). According to Aaker (1991), it is a dimension of brand equity.
Based on the above discussions presented below is the developed hypothesis:
Brand Association and Brand Equity
According to Gica et al. (2007), perceived quality refers to a certain level of quality which customer associate with the specific brand. Perceived quality distinguishes the brand from other brands (Aaker, 1996).Purchase decision influenced by the perceived quality (Ha et al., 2010). Perceived Quality is a perception in customers’ mind about the good quality of the brand which later leads towards the consideration of buying (Chandswang, 2009). According to Gica et al. (2007), perception about quality in consumers’ mind is due to utilizing that product or brand directly, through the information provided by other consumers, or through the promotional activities by the concerned company. An individual judgment about the quality of the product is the perceived quality when it caters experience, needs and situations for consumptions (Zeithaml, 1988). According to Aaker (1991), it is a dimension of
Perceived Quality and Brand Equity
distinguished associations (riezebos, 2013). A pre-requisite of brand equity is brand awareness because it should be in the knowledge of customer that a brand exists (Buil, Martinez, & De Chernatony, 2013). Brand awareness is significant in the making of decision (Keller, 2003). The customers (Hoo et al., 2012) have purchased identified brands; Awareness has an impact on familiarity and reputation (Yasin et al., 2007). According to Aaker (1991), it is a dimension of brand equity. Brand awareness is very important for customers due to that they choose and buy only famous and familiar brands (Keller, 1993).
Based on the above discussions presented below is the developed hypothesis:
52 July-December 2018 JISR-MSSENumber 2Volume 16

H4: There is a significant relationship between Perceived Quality and Brand Equity
The main objective of a design in this research is to find out the conformity that the gathered information is effective enough to address the research argument logically (De Vaus, D. A. et al., 2012). The study is based on quantitative research method to explore the impact of brand loyalty, brand awareness, brand association, the perceived quality on the brand equity of the people in Pakistan who are educated and with a basic understanding of brands in Pakistan. We have used Quantitative approach for this study because it provides exact measurements, observations related to the objective, truthful verification through analysis of statics. We will analyze the hypotheses obtained in the section of the literature review through statistics.
Data for this is study collected using both sources i.e., primary and secondary. For primary data, we collected the data manually and a structured questionnaire used as an instrument to prove the hypothesis and for the results. The secondary data collected from the thesis, research papers, publications in the academic journal and professional journals. A structured questionnaire used as an instrument to prove the hypothesis and for the results.
METHODOLOGY
Based on the above discussions presented below is the developed hypothesis:
Presented in Figure 1 is the developed conceptual framework. The literature supports the relationships depicted in the conceptual framework as discussed in the following sections. In this study, selected variables are Brand Loyalty, Brand Awareness, Brand Association, and Perceived Quality and these variables have an impact on Brand Equity (Yoo, Donthu & Lee, 2000; Chaudhuri, 1999).
Theoretical Grounding of the Conceptual Framework
Figure 1: Conceptual Framework
customer-based brand equity. Overall feeling about a brand, which associates with quality or advantage of the product by the customer, is the perceived quality (Aaker, 1999).
Brand Equity
Brand Loyalty
Brand Awareness
Brand Association
Perceived Quality
H1
H2
H3
H4
53July-December 2018JISR-MSSE Number 2Volume 16

Quantitative research is conducted to analyze the relationship between a dependent variable and an independent variable in a population. The quantitative research method is used to explain variables, to find out the relationships between variables and to find the interaction of cause-and-effect between variables (Burns & Grove, 2005).
In Survey research, we gather information from different groups of people or population (Polit & Hungler, 1999). The data that is collected relates to the fact, distribution, and relationships between variables among these groups. The questionnaire is one of the tools of survey research.
In cross-sectional studies, we evaluate once the interesting variables in a sample of subjects and determine their relationships (Hopkins, 2000). It measures only the differences in or among different group of people, subjects, or situations rather than change.
To solve the issue of a research study at hand, it is necessary that the researcher collects data from the selected population that is readily accessible. A population is generally a group of individuals and that group is normally large in size that is why it is difficult to gather their response that is why for collecting the data through questionnaire a sample is derived (Malhotra, Baalbaki, & Bechwati, 2010). For this research study, we have selected the population of employees who are educated and with a basic understanding of brand in Pakistan. The sample size selected for this study was 510 and distribution of questionnaires with respect to cities is below:
Sampling is the initial step from which we start the procedure of practical work of research. The sampling technique that used for this study is Non-Probability sampling that is convenience sampling. We used this technique because we are targeting educated people having basic knowledge of the brand, which cannot be possible if we would select the Probability sampling. It made us an easy way to get the right sample. Usually elite class comes in good shopping malls at metro cities.
Five instruments were utilized to investigate interlink of Brand Equity with Brand Loyalty, Brand Awareness, Brand Association, and Perceived Quality. The instruments were developed from the study of Aaker,1991, Yoo et al., 2000, Yasin et al., 2007 and Yoo et al., 2000) which have been adopted by Mahfooz (2015) and we used that in this paper. The instrument consists of 22 items according to the constructs that we used in this study. The scale used in the instrument is Likert Scale five points. This scale consists of questions as per the research constructs, which described below. This scale shows the range from One (1) to Five (5), One (1) is for strongly disagree and five (5) is for the strongly agree.
Karachi =170, Lahore=130, Islamabad=100, Peshawar = 60, Quetta = 50
Construct No of Items AuthorsBrand Equity 5 (Yoo et al., 2000)Brand Loyalty 4 (Aaker ,1991; Yoo et al., 2000; Yasin et al., 2007)Brand Awareness 6 (Aaker ,1991; Yoo et al., 2000; Yasin et al., 2007)Brand Association 4 (Aaker ,1991; Yoo et al., 2000; Yasin et al., 2007)Perceived Quality 3 (Aaker ,1991; Yoo et al., 2000; Yasin et al., 2007)
Table 1Constructs Adopted.
54 July-December 2018 JISR-MSSENumber 2Volume 16

We have obtained the reliability of this instrument through literature that has discussed earlier but now we will obtain reliability again according to this research study and demographics. We divided instruments into 5 parts, i.e.: Demographics, Dominant Characteristics (Brand Equity), Brand Loyalty, Brand Association, Brand Awareness, and Perceived Quality.
We have used Pre-test for testing the instruments on a small number of groups of respondents before doing a study of entire research, used for the improvement of the instrument. It can reduce unrelated or unclear feature of the instrument (Zikmund, 2003). Pretesting is usually based upon the 10 to 50 range of respondents. In this research, the sample size of 25 respondents chosen for the pre-test questionnaires that is almost 5% of the selected sample size for this research. After this test, we have made our instrument better with improved questions and then it was distributed in 510 respondents for collecting the data.
To analyze the gathered information we used methods of Quantitative research. In the Quantitative analysis, we make diagrams or different tables to show the resulted frequencies and we use statistical modeling to find out comparisons by obtaining relationships of interrelated variables (Saunders et al, 2007). We analyzed results through SPSS 17 and converted these results into tables and percentage. We found the reliability, validity, correlation, regression analysis, and confirmatory factor analysis (CFA) and discriminant validity through analysis.
Then we analyzed our results and made tables and percentages from the results to find out the difference in opinions of those who filled the questionnaire.
These techniques of analysis described below:
Normality of the data ascertained two ways. Initially, all the items converted to standardized Z scores. The score projected the range between ±2.5 that allows us to assume that the data is normally distributed. Eventually, Skewness and Kurtosis methods used to analyze the Univariate normality of the constructs, which results in the range between ±2.5. Therefore the requirements of Univariate normality was fulfilled (Kline, 2015).
To generalize the results of a large number of the population we use reliability. To find the reliability and stability of the collected responses, an accurate tool is used that is Cronbach alpha (Sekaran, 1992). Through reliability, similarity between collected answers given by individuals who respond to the survey is tested through reliability (Litwin 1995, Salant & Dillman 1994). Accepted coefficient reliability is 0.6 - 0.7 and if reliability comes above 0.8 then it is a good reliability (Sekaran, 1992).
Validity a scientific research used to measure what research actually declares to measure. Validity is very important in social sciences to test that the constructs, which are being, used measure the idea under attention or not (Bryman & Bell, 2007). We have used three forms of validity for this research that are content, criterion and construct validity.
DATA ANALYSIS
Reliability
Validity
55July-December 2018JISR-MSSE Number 2Volume 16

Summary provided on regard with a sample that used in the research. Descriptive statistics show various results which depend upon the scale of variance, range, and standard deviation. (Miller, 2002), While at times the results of mean, median, mode, and mode of central tendency also included (Christensen., 2010).
To describe the variability between constructs, we use a statistical technique known as Exploratory Factor Analysis. It finds out the variability of variables that correlated as a lower number of variables that are unobserved. We have used the Principle Component Analysis (PCA) for this research to obtain the maximum variance by computing the weight of factors. We did consecutive factoring until there is no more purposeful variance remains. According to the rule of confirmatory factor analysis, the value of loadings should be 0.7 or more to verify there is a fact that independent variables previously identified by the research studies. If the value comes above 0.6 then it is known as high and if the value comes below 0.4 then it is considered as low (Hair, 2010)
It is the analysis that used to represent the effectiveness and level of association between two different variables. The commonly used coefficient of correlation is Karl Pearson that describes two variables i.e., X and Y in linear relation (Malhotra, 2010). The value of correlation lies in the range of -1 to +1, -1 represents a strong and negative relationship whereas +1 represents a strong and positive relationship. If we get 0 values, then it shows there is no correlation (Bryman & Bell, 2005).
In Regression analysis, we analyse the relationship among variables. It also provides the answer of the questions like, does any relationship exist or not between variables, is the relationship significant or non-significant (Malhotra, 2010). We calculate the p-value to ensure the significance of the outcomes that we get from the regression analysis, which illustrates the reliability of the regression. The result shows significant relationship if the p-value is less than 0.05 with 95% level of confidence. The significant relationship with 99% level of confidence comes when p-value comes less than 0.01 (Nolan & Heinzen, 2007). In order to analyze the relationship among variables, we test the hypothesis with regression analysis.
The skill to come with the change in a research study, which makes it more accurate to fulfill the requirement of the topic, is Criterion Validity (Yin, 2007).
Content Validity is to represent the high level of measurement to the readers that used in research (Bryman & Bell, 2007).
To measure the constructs by using the validity of the framework of theory and the extent to which there is a requirement of the instrument is known as Construct validity (Cronbach & Mechl, 1955).
Correlations analysis
Regression Analysis
Descriptive Statistics
Confirmatory Factor Analysis (CFA)
56 July-December 2018 JISR-MSSENumber 2Volume 16
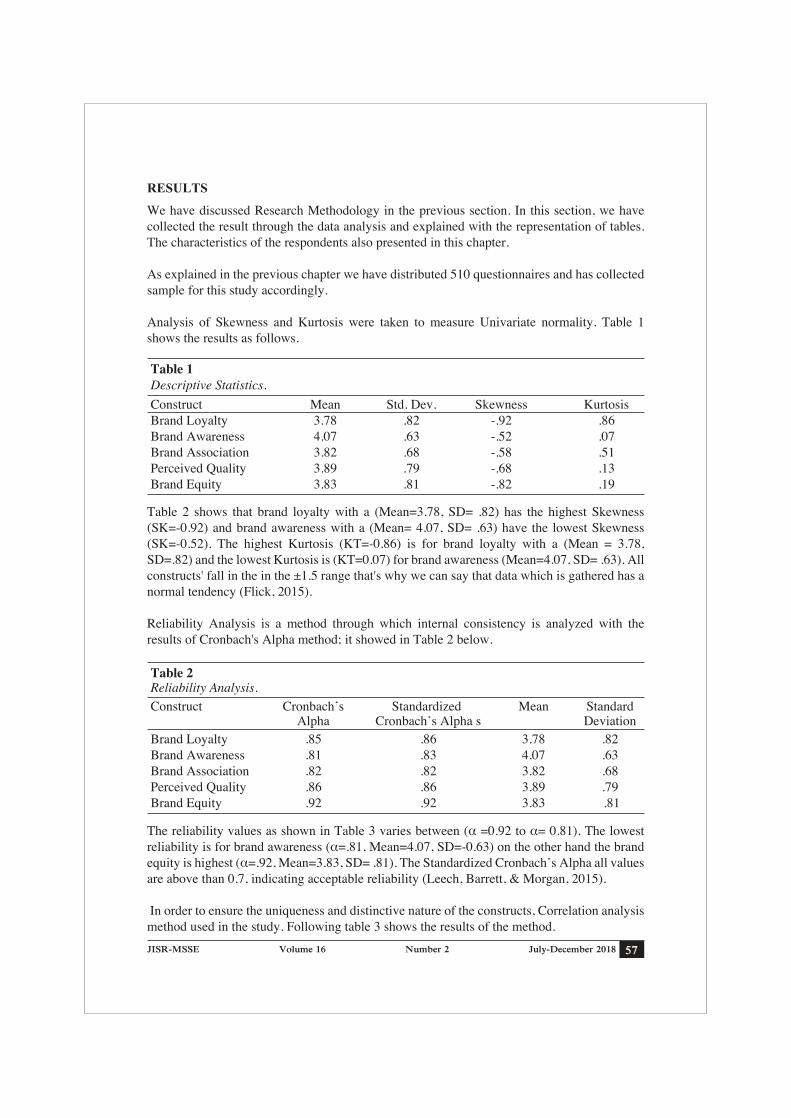
The reliability values as shown in Table 3 varies between (α =0.92 to α= 0.81). The lowest reliability is for brand awareness (α=.81, Mean=4.07, SD=-0.63) on the other hand the brand equity is highest (α=.92, Mean=3.83, SD= .81). The Standardized Cronbach’s Alpha all values are above than 0.7, indicating acceptable reliability (Leech, Barrett, & Morgan, 2015).
In order to ensure the uniqueness and distinctive nature of the constructs, Correlation analysis method used in the study. Following table 3 shows the results of the method.
We have discussed Research Methodology in the previous section. In this section, we have collected the result through the data analysis and explained with the representation of tables. The characteristics of the respondents also presented in this chapter.
As explained in the previous chapter we have distributed 510 questionnaires and has collected sample for this study accordingly.
Analysis of Skewness and Kurtosis were taken to measure Univariate normality. Table 1 shows the results as follows.
Table 2 shows that brand loyalty with a (Mean=3.78, SD= .82) has the highest Skewness (SK=-0.92) and brand awareness with a (Mean= 4.07, SD= .63) have the lowest Skewness (SK=-0.52). The highest Kurtosis (KT=-0.86) is for brand loyalty with a (Mean = 3.78, SD=.82) and the lowest Kurtosis is (KT=0.07) for brand awareness (Mean=4.07, SD= .63). All constructs' fall in the in the ±1.5 range that's why we can say that data which is gathered has a normal tendency (Flick, 2015).
Reliability Analysis is a method through which internal consistency is analyzed with the results of Cronbach's Alpha method; it showed in Table 2 below.
RESULTS
Construct Mean Std. Dev. Skewness KurtosisBrand Loyalty 3.78 .82 -.92 .86Brand Awareness 4.07 .63 -.52 .07Brand Association 3.82 .68 -.58 .51Perceived Quality 3.89 .79 -.68 .13Brand Equity 3.83 .81 -.82 .19
Table 1Descriptive Statistics.
Construct Cronbach’s Standardized Mean Standard Alpha Cronbach’s Alpha s DeviationBrand Loyalty .85 .86 3.78 .82Brand Awareness .81 .83 4.07 .63Brand Association .82 .82 3.82 .68Perceived Quality .86 .86 3.89 .79Brand Equity .92 .92 3.83 .81
Table 2Reliability Analysis.
57July-December 2018JISR-MSSE Number 2Volume 16

The highest correlation (r=.82) is between the pairs perceived quality (Mean= 3.89, SD=.79) and brand association (Mean= 3.82, SD=-.68). In addition, the lowest correlation (r=.51) is between the pair perceived quality (Mean=3.89, SD=.79) and brand awareness (Mean=4.07, SD=-.63). All the pairs are between the ranges of .30 and .90 indicating there is no issue with multicollinearity and all the constructs are distinctive.
With the help of Varimax Rotation, the relationship between latent variables and the constructs discovered as is shown in table 4 below.
Factor loadings for each construct are above than 0.6, that is acceptable (Hair J., B. Hair, 2015).
Convergent Validity method relies upon the result of each variable and its reliability scale. The requirements for each variable should be more than 0.40 and the reliability should be above 0.70. Table 5 below confirms that these requirements fulfilled accordingly.
Table 5 shows that variance explained is as high as (V=.79) for perceived quality (Mean=3.89, SD=.79), and as low as (V=.55) for brand awareness (Mean=4.07, SD=.63). The lowest reliability is for brand awareness (α=.81, Mean=4.07, SD=-0.63) on the other hand the brand equity is highest (α=.92, Mean=3.83, SD= .81). As variance explained for all the constructs are more than 0.40, while the reliably is at least .81, therefore the constructs measures what
Construct BL_T BA_T BAs_T PQ_T BE_TBrand Loyalty 1.00 Brand Awareness .68 1.00 Brand Association .76 .72 1.00 Perceived Quality .67 .51 .82 1.00 Brand Equity .51 .59 .74 .77 1.00
Table 3Correlation.
Brand Loyalty .781 272.924 69.76 4Brand Awareness .778 371.982 55.02 6Brand Association .707 250.351 65.77 4Perceived Quality .729 214.040 78.74 3Brand Equity .882 545.761 76.09 5
Construct Kaiser-Mayer- Bartlett’s Cumulative Items Olkin Test Sphericity Test Factor loading (P<0.05) Test (%)
Table 4CFA for the Constructs.
Brand Loyalty .851 .70 3.78 .82Brand Awareness .808 .55 4.07 .63Brand Association .820 .66 3.82 .68Perceived Quality .863 .79 3.89 .79Brand Equity .919 .76 3.83 .81
Construct Cronbach’s Variance Mean Standard Alpha Explained Deviation
Table 5Convergent Validity.
58 July-December 2018 JISR-MSSENumber 2Volume 16

Dependent Variable: Brand Equity, R2= .674, Adjusted R2=.665, F= (4, 150) =74.956, p< 0.05.
The results show that the predictors (brand loyalty, brand awareness, brand association, and perceived quality) aggregately explain 67% of the variance F (4, 150) =74.956, p< 0.05. It was also found that perceived quality (ß = .64, p<.05) significantly influences brand equity, followed by brand awareness (ß = .38, p<.05); brand loyalty (ß = .26, p<.05) and brand association (ß = .26, p<.05). The developed model explains the effect of branding parameters on brand equity, which is evident from the following regression equation: Brand Equity=.18+.26*Brand Loyalty+.38*Brand Awareness+.26*Brand Association+.64* Perceived Quality+.26*
The hypothesis brand loyalty significantly affects brand equity and it is tested with the method of simple regression analysis that concludes the following results in Table 7
Hypothesis 1: Brand Loyalty and Brand Equity
Results of regression show brand loyalty explain 26% of the variance (R2=.258, F (1,150) = 52.901, p<.05). It has been found that brand loyalty (ß = .513, p<.05) significantly influences brand equity and as per Leech et al. (2015), it is a large effect. The regression equation is Brand Equity= 1.91 + .510*brand loyalty +.271.
The hypothesis brand awareness positively influences brand equity and it tested on the method of simple regression analysis. Table 8 shows the results.
Hypothesis 2: Brand Awareness and Brand Equity
they intend to (Kline, 2015). Predictors (brand loyalty, brand awareness, brand association, and perceived quality) have a significant effect on brand equity which was measured through multiple-regression analysis. Summary of results is depicted in Table 6 below.
1 Brand Equity -.18 .26 -.67 .50 Brand Loyalty -.26 .08 -.26 -3.40 .00 .372 2.688 Brand Awareness .38 .10 .29 3.99 .00 .414 2.413 Brand Association .26 .13 .21 1.95 .05 .188 5.333 Perceived Quality .64 .09 .62 7.16 .00 .298 3.356
B Error Beta T Sig. Std. Tolerance VIF
Unstandardized Standardized Collinearity Coefficients Coefficients Statistics
Table 6Summarized Regression Results.
Dependent Variable: Brand Equity, R2= .263, Adjusted R2=.258, F (1, 150) =52.901, p< 0.05.
1 Brand Equity 1.91 .271 7.054 .000 Brand Loyalty .510 .070 .513 7.273 .000
Model B Std. Error Beta T Sig.
Unstandardized Standardized Coefficients Coefficients
Table 7Hupothests 1 Results.
59July-December 2018JISR-MSSE Number 2Volume 16

Regression results shows brand awareness explains 34% of the variance (R2=.340, F (1,150) = 77.846, p<.05). It was also found that brand awareness (ß = .587, p<.05) significantly influences brand equity and as per Leech et.al. (2015), it is a large effect. The regression equation is Brand Equity= .751 + .758*brand awareness +.354.
The brand association has a positive influence on brand equity and it is tested by simple regression analysis. Table 9 depicts the brief results
Hypothesis 3: Brand Association& Brand Equity
Regression results shows brand association explains 54% of the variance (R2=.539, F (1,150) = 175.003, p<.05). It has been found that brand association (ß = .736, p<.05) significantly influences brand equity that as per Leech et.al. (2015), it is a large effect. The regression equation is: Brand Equity= .466 + .882*brand association +.259.
The hypothesis empathy positively influences brand equity assessed by regression analysis while summarized results are depicted in Table 10 below:
Hypothesis 4: Perceived Quality and Brand Equity
Dependent Variable: Brand Equity, R2= .345, Adjusted R2=.340, F (1, 150) =77.846, p< 0.05.
1 Brand Equity .751 .354 2.122 .035 Brand Awareness .758 .086 .587 8.823 .000
Model B Std. Error Beta T Sig.
Unstandardized Standardized Coefficients Coefficients
Table 8Hupothests 2 Results.
Dependent Variable: Brand Equity, R2= .542, Adjusted R2=.539, F (1, 150) =175.003, p< 0.05
1 Brand Equity .466 .259 1.801 .074 Brand Association .882 .067 .736 13.229 .000
Model B Std. Error Beta T Sig.
Unstandardized Standardized Coefficients Coefficients
Table 9Hupothests 3 Results.
Dependent Variable: Brand Equity, R2= .596, Adjusted R2=.593, F (1, 150) =218.052, p< 0.05.
1 Brand Equity .756 .213 3.551 .001 Perceived Quality .791 .054 .772 14.767 .000
Model B Std. Error Beta T Sig.
Unstandardized Standardized Coefficients Coefficients
Table 10Results of summarized regression.
60 July-December 2018 JISR-MSSENumber 2Volume 16

The results of regression have shown that perceived quality explains 60% of the variance (R2=.593, F (1,150) = 218.052, p<.05). It has been found that perceived quality (ß = .772, p<.05) significantly influences brand equity that according to Leech et.al. (2015) is a large effect. Equation for regression is: Brand Equity= .756 + .791*perceived quality +.213.
It has been found that the hypothesis is compatible with the studies done earlier and fulfilled the research objectives. The later paragraphs will elaborate on how much relevance and results aligned with the previous studies. The hypothesis stating that predictors (brand loyalty, brand association, brand awareness, and perceived quality) significantly affect Brand equity was accepted (Refer to Table 6). It could be said that results were consistent with some earlier studies (Mahfooz, 2015; Bumrungkitjareon & Tanasansopin, 2011).
The hypothesis defining that predictor Brand Loyalty positively has an effect on brand equity was also accepted (Refer to Table 7). Chi et al. (2009) claimed that behavioral loyalty is not that if a customer is continuously purchasing the same brand. Brand Loyalty is a form of repeat purchase, which is due to the feeling, and association of customer towards the brand (Bovee et al., 1995).
The hypothesis showing that predictor Brand Awareness positively has an impact on brand equity was also accepted (Table 8). Earlier studies found a significant positive impact on brand awareness and brand equity. Brand Awareness is significant in making of decision (Keller, 2003). Customers have purchased identified brands (Hoo et al., 2012); Awareness has an impact on familiarity and reputation (Yasin et al., 2007).
The hypothesis stating that predictor Brand Association positively impacts brand equity was also accepted Table 10). According to the Aaker (1996), when a customer memory linked with a brand either direct or indirect then it referred to as ‘brand association'. Marketing programs create a positive brand image that conceives a positive, powerful and appraisable image of the brand in the mind of the consumer (Keller, 2003).
The hypothesis stating that the predictor empathy positively effects Perceived Quality was also accepted (Refer to Table 10). According to Gica et. al. (2007), perception about quality in consumers mind is due to utilizing that product or brand directly, through the information provided by other consumers, or through the promotion activities by the concerned company. An individual judgment about the quality of the product is the perceived quality when it caters experience, needs and situations for consumptions (Zeithaml, 1988).
The above model has successfully defined the relationship of brand equity on consumer perception. It also showed that the strongest influence on predictor to brand equity was perceived quality (R2 =.60) followed by brand association (R2 =.54) and brand awareness (R2 =.34) while brand loyalty (R2 =.26) has a moderate relationship. All the hypotheses, answered to all the objectives and the findings are consistent to earlier studies. This would carry the implication that a telecommunication company if anxious to increase brand equity then it should attempt to build customers' perceived quality that may lead in the generation of brand equity with higher levels.
DISCUSSION AND CONCLUSION
61July-December 2018JISR-MSSE Number 2Volume 16

Managerial implications for theory & Practice
Limitations and Future Research Opportunities
The findings have implications for the practitioners of marketing as well as for the scholars. The results confirmed the importance of brand equity in the telecom industry of Pakistan. This research confirms that brand equity strengthens a brand with its antecedents. This research gives an empirical support to the integrated model and acts as an advised prescription for the marketers who want to gain from the brand equity. The said antecedents are required to manage properly to get complete benefits of the brand equity.
This can consider as an opportunity for the telecom companies so to make visualization of their products while conveying a message of excellent communication quality to their consumers through innovation in their advertising, and thus, can develop a brand image in favor of them along with the proper message for the better quality service. Furthermore, the findings can guide marketers for the allocation of appropriate resources for the execution of their marketing plans.
The paper relates to researchers who want to know about the impact of brand equity. It is very beneficial of the marketing management who wanted to know the essence of its customer's engagement with the marketing efforts as they know that later it connects to the company high performance. This research is limited to five metro cities of Pakistan but not bound to any region or country and it can implement according to the environment of other cities in other countries or same country. Although this paper has written on a smaller scale researcher can take it to the large scale after doing further research through Pakistan. This study purely specified on measuring brand equity with selected variables. Future studies could also include other variables after finding from the literature.
REFERENCESAaker, D. (1991). Brand Equity. La gestione del Valore olella marca, 347-356Al-Azzam , D. A. F. M. (2015). The Impact of Service Quality Dimensions on Customer
Satisfaction: A Field Study of Arab Bank in Irbid City, Jordan. European Journal of Business and Management, 7(15).
Angelova , B., & Zekiri, J. (2011). Measuring Customer Satisfaction with Service Quality Using American Customer Satisfaction Model (ACSI Model). International Journal of Academic Research in Business and Social Sciences, 1(3).
Arokiasamy, A. R. A., & Huam, H. T. (2014). Assessing the relationship between service quality and customer satisfaction in the Malaysian automotive insurance industry. Middle-East Journal of Scientific Research, 20(9), 1023-1030.
Arokiasamy , A. R. A., & Tat, H. H. (2014). Assessing the Relationship Between Service Quality and Customer. Middle-East Journal of Scientific Research, 20(9), 1023-1030.
Arsanam, P., & Yousapronpaiboon, K. (2014). The Relationship between Service Quality and Customer Satisfaction of Pharmacy Departments in Public Hospitals. International Journal of Innovation, Management, and Technology. 5(4), 261-275.
Baghla, A., & Garai, A. (2016). Service quality in the retail banking sector-A study of selected public and new Indian private sector banks in India. IJAR, 2(6), 598-603.
Bharwana, T. K., Bashir, M., & Mohsin, M. (2013). Impact of Service Quality on Customers’ Satisfaction: A Study from Service Sector especially Private Colleges of Faisalabad,
62 July-December 2018 JISR-MSSENumber 2Volume 16

Punjab, Pakistan. International Journal of Scientific and Research Publications, 3(5). Bryman, A., & Bell, E. (2015). Business research methods. Oxford University Press, USA.Colicev, A., Malshe, A., & Pauwels, K. (2018). Social Media and Customer-Based Brand
Equity: An Empirical Investigation in Retail Industry. Administrative Sciences, 8(3), 55.Collis, J., & Hussey, R. (2013). Business research: A practical guide for the undergraduate
and postgraduate student. Palgrave macmillan.Chaudhuri, A. (1999). Does brand loyalty mediate brand equity outcomes?.Journal of
Marketing Theory and Practice, 7(2), 136-146.Ekinci, Y. (2018, June). A model of consumer based brand equity for holiday destinations. In
8th advances in hospitality and tourism marketing and management (AHTMM) conference (p. 830).
Flick, U. (2015). Introducing research methodology: A beginner's guide to doing a research project. United Kingdom: Sage.
Hair Jr, J. F., Wolfinbarger, M., Money, A. H., Samouel, P., & Page, M. J. (2015). Essentials of business research methods. Routledge.
Hussain, R., Al Nasser, A., & Hussain, Y. K. (2015). Service quality and customer satisfaction of a UAE-based airline: An empirical investigation. Journal of Air Transport Management, 42, 167-175.
Iberahim, H., Taufik, N. K. M., Adzmir, A. S. M., & Saharuddin, H. (2016). Customer Satisfaction on Reliability and Responsiveness of Self Service Technology for Retail Banking Services. Procedia Economics and Finance, 37(3), 13-20.
Jaggia, S., & Kelly, A. (2012). Business statistics: Communicating with numbers. McGraw-Hill Higher Education.
K, C., Oyerinde J. , A. A. A. O., & Eweoya , A. I. O. (2016). E-banking users’ behaviour: e-service quality, attitude, and customer satisfaction. International Journal of Bank Marketing, 34(3).
Kashif, M., Suzana , S., Shukran, W., & Rehman , M. A. (2015). Customer satisfaction and loyalty in Malaysian Islamic banks: a PAKSERV investigation. International Journal of Bank Marketing, 33(1).
Khan, M. M., & Fasih, M. (2014). Impact of Service Quality on Customer Satisfaction and Customer Loyalty: Evidence from Banking. Pakistan Journal of Commerce and Social Sciences, 8(2), 331- 354.
Khan, M. M., & Mariam, F. (2014). Impact of Service Quality on Customer Satisfaction and Customer Loyalty: Evidence from Banking Sector. Pakistan Journal of Commerce & Social Sciences, 8(2), 331-354.
Keller, K. L. (1993). Conceptualizing, measuring, and managing customer-based brand equity. the Journal of Marketing, 1-22.
Keller, K.L, & Brexendorf, T.O.(2017). Measuring brand equity, Handbuch Markenführung, 1-32.
Khanna, M., Jacob, I., & Chopra, A. (2018, July). Analyzing factors that influence brand resonance among alumni (as past customers) to develop brand equity for higher education brands. In 2018 global marketing conference at tokyo (pp. 385-385).
Kline, R. B. (2015). Principles and practice of structural equation modeling. Guilford publications.
Kombo, F. (2015). Factors for customer satisfaction and customer dissatisfaction in commercial banks. Mediterranean Journal of Social Sciences.
63July-December 2018JISR-MSSE Number 2Volume 16

Kotler, P., & Keller, K. L. (2009). Dirección de marketing. Pearson educación.Leech, N., Barrett, K., & Morgan, G. A. (2013). SPSS for intermediate statistics: Use and
interpretation. Routledge.Loke, S. P., Taiwo, A. A., Salim, H. M., Downe, A. G., & PETRONAS, U. T. (2011). Service
quality and customer satisfaction in a telecommunication service provider. International conference on financial management and economics (Vol. 11, pp. 24-29).
Malhotra, N. K., Birks, D. F., Palmer, A., & Koenig-Lewis, N. (2003). Market research: an applied approach. Journal of marketing management, 27, 1208-1213.
Miller, D. C., & Salkind, N. J. (2002). Handbook of research design and social measurement. Sage.
Omar, H. F. H., Saadan, D. K. B., & Seman, P. K. B. (2015). Determining the Influence of the Reliability of Service Quality on Customer Satisfaction. The Case of Libyan. International Journal of Learning & Development, 5(1).
Parasuraman, A., & Zeithaml, V. A. (1988). SERVQUAL: A multiple-item scale for measuring con- sumer perceptions of service quality. Journal of Retailing, 64(1), 12-40.
Patten, M. L., & Newhart, M. (2017). Understanding research methods: An overview of the essentials. Taylor & Francis.
Paul, J., Mittal, A., & Srivastav, G. (2016a). Impact of service quality on customer satisfaction in private and public sector banks. International Journal of Bank Marketing, 34(5), 606-622.
Paul, J., Mittal, A., & Srivastav, G. (2016b). Impact of service quality on customer satisfaction in private and public sector banks. International Journal of Bank Marketing, 34(5).
Rowley, J. (2014). Designing and using research questionnaires. Management Research Review, 37(3), 308-330.
Sabir, R. I., Ghafoor, O., Akhtar, N., Hafeez, I., & Rehman, A. U. (2014). Factors affecting customer satisfaction in banking sector of Pakistan. International Review of Management and Business Research, 3(2), 1014.
San Martín, H., Herrero, A., & García de los Salmones, M. D. M. (2018). An integrative model of destination brand equity and tourist satisfaction. Current Issues in Tourism, 1-22.
Saunders, M. N. (2011). Research methods for business students, 5/e. Pearson Education India.
Sekaran, U., & Bougie, R. (2016). Research methods for business: A skill building approach. John Wiley & Sons.
Sureshbab, B., T.Devasenathipathi, & Vijay, A. N. (2014). Customer Satisfaction on Tangiblity of Banking Servcies in Thanjavur City. Journal of Research in Commerce & Management, 3(9).
Theurer, C. P., Tumasjan, A., Welpe, I. M., & Lievens, F. (2018). Employer branding: a brand equity‐based literature review and research agenda. International Journal of Management Reviews, 20(1), 155-179.
Yoo, B., Donthu, N., & Lee, S. (2000). An examination of selected marketing mix elements and brand equity. Journal of the Academy of Marketing Science, 28(2), 195-211.
Walliman, N. (2015). Social research methods: The essentials. Sage.Zikmund, W. G., Babin, B. J., Carr, J. C., & Griffin, M. (2013). Business research methods.
Cengage Learning.
64 July-December 2018 JISR-MSSENumber 2Volume 16