the application of astm standard d7720 to used oil data
TRANSCRIPT

Author:
Kathryn Kuhr
PerkinElmer, Inc. Shelton, CT
Integrated Analytics
Introduction The definition of big data depends on who you ask. According to one Forbes article, big data could be the recent emergence of massive data types, or
more formally, data of such large size that “its manipulation and management present significant logistical challenges”. Another such definition presents big data as an attitude; one that acknowledges that integrating data from various sources may lead to the expansion of better business decisions1. This concept of big data in the oil and lubricant industry has opened the doors to a modern industrial revolution. Data routinely collected from equipment has the power to provide deeper understanding of the underlying causes behind equipment or oil failure. The importance of managing and utilizing such data is emphasized by the creation of ASTM standard D7720, Statistically Evaluating Measurand Alarm Limits when Using Oil Analysis to Monitor Equipment and Oil for Fitness and Contamination. This application note demonstrates the transformation of used oil data in accordance with the aforementioned ASTM standard using data visualization software program TIBCO Spotfire®.
The Application of ASTM Standard D7720 to Used Oil Data Using TIBCO Spotfire®
A P P L I C A T I O N N O T E
PerkinElmer is the exclusive global distributor of the TIBCO Spotfire® platform for certain scientific and clinical R&D applications.
2
Experimental
Two sets of data were used for this analysis: inorganic and infrared. The inorganic data was acquired from a company with a fleet of vehicles spread throughout the United States. These oil samples were collected from used engine oil for the purpose of determining engine wear. Ten inorganic elements were tested: aluminum, calcium, chromium, copper, iron, lead, magnesium, molybdenum, phosphorus and zinc. The infrared data was acquired from an energy company located in the eastern United States with multiple sites and machine sampling locations spread throughout the region.
This analysis utilized TIBCO Spotfire®, an advanced data visualization software program, to relate the inorganic and infrared results to ASTM standard D7720. Standard D7720, Statistically Evaluating Measurand Alarm Limits when Using Oil Analysis to Monitor Equipment and Oil for Fitness and Contamination, defines the procedure which should be used to properly define alarm limits for equipment condition monitoring2.
Results
Inorganic AnalysisThe inorganic data set contained 137 samples collected over the time period of January 1, 2012 to November 14, 2013. Of the 10 elements analyzed by ICP-OES, only four were used in this visual analysis for demonstrative purposes.
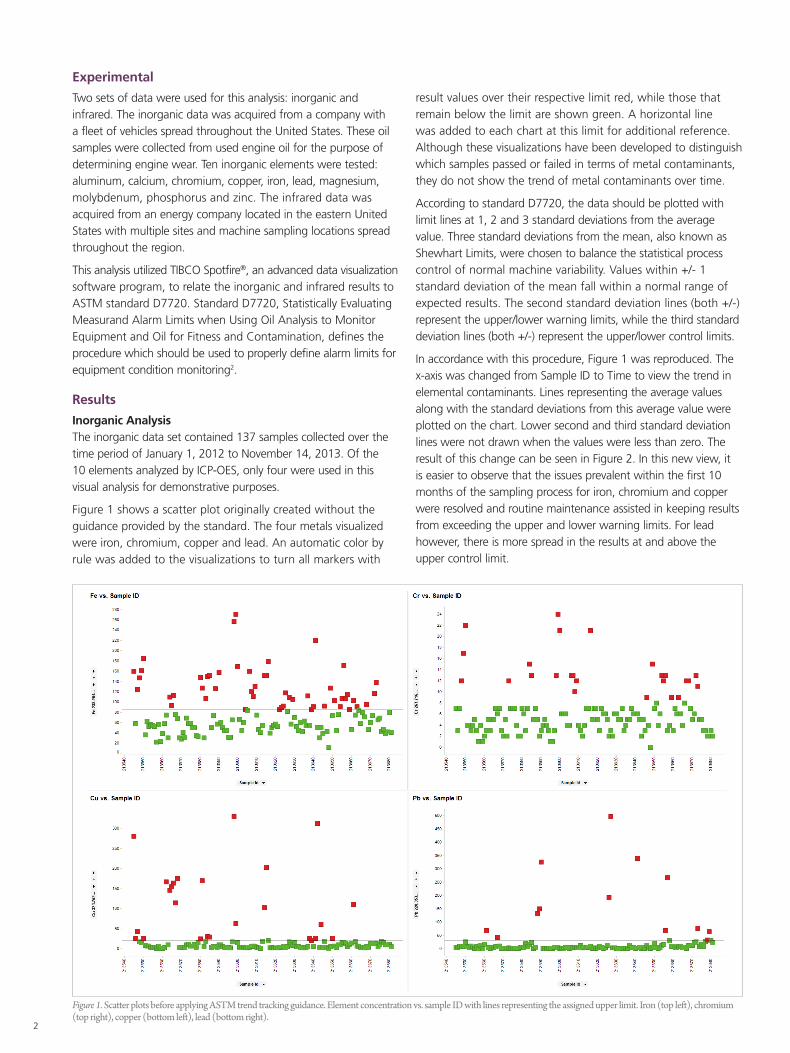
Figure 1 shows a scatter plot originally created without the guidance provided by the standard. The four metals visualized were iron, chromium, copper and lead. An automatic color by rule was added to the visualizations to turn all markers with
result values over their respective limit red, while those that remain below the limit are shown green. A horizontal line was added to each chart at this limit for additional reference. Although these visualizations have been developed to distinguish which samples passed or failed in terms of metal contaminants, they do not show the trend of metal contaminants over time.
According to standard D7720, the data should be plotted with limit lines at 1, 2 and 3 standard deviations from the average value. Three standard deviations from the mean, also known as Shewhart Limits, were chosen to balance the statistical process control of normal machine variability. Values within +/- 1 standard deviation of the mean fall within a normal range of expected results. The second standard deviation lines (both +/-) represent the upper/lower warning limits, while the third standard deviation lines (both +/-) represent the upper/lower control limits.
In accordance with this procedure, Figure 1 was reproduced. The x-axis was changed from Sample ID to Time to view the trend in elemental contaminants. Lines representing the average values along with the standard deviations from this average value were plotted on the chart. Lower second and third standard deviation lines were not drawn when the values were less than zero. The result of this change can be seen in Figure 2. In this new view, it is easier to observe that the issues prevalent within the first 10 months of the sampling process for iron, chromium and copper were resolved and routine maintenance assisted in keeping results from exceeding the upper and lower warning limits. For lead however, there is more spread in the results at and above the upper control limit.
Figure 1. Scatter plots before applying ASTM trend tracking guidance. Element concentration vs. sample ID with lines representing the assigned upper limit. Iron (top left), chromium (top right), copper (bottom left), lead (bottom right).

3
Infrared AnalysisThe dataset from the regional energy company contained 128 samples, however all samples were not tested for all parameters. In this exercise, phenolic content and soot were also visualized using standard D7720. Figure 3 shows a basic scatter plot of Phenolic-OH vs. Date. In this view, it becomes apparent that there are four results whose phenolic-OH value exceeds the remaining markers. It is not inherently understood whether these results have any similarities. To increase the value of this visualization, trellising was applied. The trellis feature separated the data in the scatter plot into similar categories based on the column name chosen. Machine name was selected in order to observe the individual trends by date for each machine. The same average and +/- 1, 2 and 3 standard deviation lines were also created. This newly formatted scatter plot is shown in Figure 4.
The four previously mentioned markers display results from Site 1 Machine 2. After applying the trellising, it can be seen that these four markers are the latest four results and have remained consistently greater than the past 5 test results. A line connection was added to this scatter plot in order to more easily observe trending over time. The color by rule, lubricant status, added to these markers compares the lubricant fitness to the Shewhart Limits. Now, fitness assessed for unique samples of lubricant can be tested against the results for each desired parameter.
Many noteworthy trends can be seen in this updated visualization. New questions, such as why is the phenolic content of lubricant at Site 1 Machine 1 decreasing, and why did the phenolic content increase so drastically at Site 1 Machine 2 between 2/11/2014 and 5/21/2014, can now be uncovered and answered by drilling down deeper into the data. The same process was applied to soot results, shown in Figure 5. When observing the data in this way, it can be seen that on 2/7/2014 soot results for sampling locations 1, 2, 3, 4, 6, 10, 11, and 13, all at Site 2, were 0.0 and rose again on the next sample date. Applying even simple data visualization techniques, such as those described above and outlined in D7720, can be used to unveil hidden trends within results and distinguish patterns between data spread throughout multiple sampling sites, geographical locations, and even those collected years apart.
Figure 2. Scatter plots after applying ASTM trend tracking guidance. Element concentration vs. time with lines representing the average and upper/lower standard deviations.
Figure 3. Phenolic-OH vs. Date before trellising and applying ASTM standard guidance.

4
Figure 4. Phenolic-OH vs. Date with trellising by machine name and ASTM standard guidance applied.
Figure 5. Soot vs. Date with trellising by machine name and ASTM standard guidance applied.
For a complete listing of our global offices, visit www.perkinelmer.com/ContactUs
Copyright ©2015, PerkinElmer, Inc. All rights reserved. PerkinElmer® is a registered trademark of PerkinElmer, Inc. All other trademarks are the property of their respective owners. 012463_01 PKI
PerkinElmer, Inc. 940 Winter Street Waltham, MA 02451 USA P: (800) 762-4000 or (+1) 203-925-4602www.perkinelmer.com
Conclusion
The petrochemical industry is experiencing a modern day industrial revolution; a deluge of data being collected and processed for enhanced understanding of oil fitness and contamination. In this application note, it is shown that TIBCO Spotfire® can simplify analytic procedure while simultaneously maximizing analytic potential. By utilizing data visualization to view used oil results against ASTM standard D7720, the history of an oil sample comes to light, shining insight on fluid and machine maintenance.
References
1. Press, Gil. “12 Big Data Definitions: What’s Yours?”. Forbes. 3 Sept 2014. Web. 23 Sept 2015.
2. ASTM Standard D7720-11, 2011, “Statistically Evaluating Measurand Alarm Limits when using Oil Analysis to Monitor Equipment and Oil for Fitness and Contamination,” ASTM International, West Conshohocken, PA, DOI: 10.1520/D7720-11, www.astm.org.