the application of passive sampling techniques for water ... · science report: sc000062 – the...
TRANSCRIPT

The application of passive sampling techniques for water quality monitoring
Science report: SC000062
SCHO0906BLJM-E-P

The Environment Agency is the leading public body protecting andimproving the environment in England and Wales.
It’s our job to make sure that air, land and water are looked after byeveryone in today’s society, so that tomorrow’s generations inherit acleaner, healthier world.
Our work includes tackling flooding and pollution incidents, reducingindustry’s impacts on the environment, cleaning up rivers, coastalwaters and contaminated land, and improving wildlife habitats.
This report is the result of research commissioned and funded by theEnvironment Agency’s Science Programme.
Published by:Environment Agency, Rio House, Waterside Drive, Aztec West,Almondsbury, Bristol, BS32 4UDTel: 01454 624400 Fax: 01454 624409www.environment-agency.gov.uk
ISBN: 1-84432-584-9
© Environment Agency
All rights reserved. This document may be reproduced with priorpermission of the Environment Agency.
The views expressed in this document are not necessarilythose of the Environment Agency.
This report is printed on Cyclus Print, a 100% recycled stock,which is 100% post consumer waste and is totally chlorine free.Water used is treated and in most cases returned to source inbetter condition than removed.
Further copies of this report are available from:The Environment Agency’s National Customer Contact Centre byemailing [email protected] or bytelephoning 08708 506506.
Dissemination Status:Publicly available / released to all regions
Keywords:Passive, integrated, in-situ, time-weighted average, water quality
Research Contractor:Environment Agency, Thames Region, South East Area
Environment Agency’s Project Manager:Jon Goddard, Swift House, Frimley Business Park,
Science Project reference:SC000062
Product Code:SCHO0906BLJM-E-P
September 2006
Tel: 01276 454300 Fax: 01276 454301
Frimley, Camberley, GU16 7SQ.

Science at the Environment AgencyScience underpins the work of the Environment Agency. It provides an up-to-dateunderstanding of the world about us and helps us to develop monitoring tools andtechniques to manage our environment as efficiently and effectively as possible.
The work of the Environment Agency’s Science Group is a key ingredient in thepartnership between research, policy and operations that enables the EnvironmentAgency to protect and restore our environment.
The science programme focuses on five main areas of activity:
• Setting the agenda, by identifying where strategic science can inform our evidence-based policies, advisory and regulatory roles;
• Funding science, by supporting programmes, projects and people in response tolong-term strategic needs, medium-term policy priorities and shorter-term operationalrequirements;
• Managing science, by ensuring that our programmes and projects are fit for purposeand executed according to international scientific standards;
• Carrying out science, by undertaking research – either by contracting it out toresearch organisations and consultancies or by doing it ourselves;
• Delivering information, advice, tools and techniques, by making appropriateproducts available to our policy and operations staff.
Steve Killeen
Head of Science

SCIENCE REPORT: SC000062 – THE APPLICATION OF PASSIVE SAMPLING TECHNIQUES FOR WATERQUALITY MONITORING
ii
AcknowledgementsThis report was compiled with contributions from the following organisations:
Environment Agency:Midlands, North East, Southern, South West, Thames and Welsh Regions
National Laboratory Service (NLS): Waterlooville, Leeds, Llanelli and Starcross
US Geological Survey:Columbia Environmental Research Centre (CERC), Missourri, USA
University of Lancaster:Institute of Environmental and Natural Sciences (IENS)
The following are thanked for their contributions:
• David Alvarez, Kees Booij, Bill Davison, James Huckins, James Petty and Hao Zhangfor their specialist knowledge and advice on passive samplers;
• Anthony Gravell, Chris Hunter, Richard Symonds and Baku Thaker of the NLS forlaboratory analysis of passive sampling devices;
• Richard Acornley, Paul Armstrong, Danielle Aveling, Clare Buckler, Katherine Griffiths,Martin Jerome, Tom Lewis, Mark Lillie, Tim Loveday, Simon Moody, RichardPritchard, James Pugh and Tessa Vandenberghe at Environment Agency regionaloffices for help with site background information, project planning and fieldwork.

SCIENCE REPORT: SC000062 – THE APPLICATION OF PASSIVE SAMPLING TECHNIQUES FOR WATERQUALITY MONITORING
iii
Executive SummaryPassive sampling is a new technique for monitoring water quality. It works on the principleof accumulating contaminants over a period of time to give a time-weighted averageconcentration.
Passive sampling gives a better indication of overall water quality than conventional spotsampling because it is a continuous monitoring technique and thus responds to episodiccontamination events that might not otherwise be detected. Passive sampling has twoother advantages compared with spot sampling. The accumulation of contaminantsmakes the detection of lower environmental concentrations much easier and the processof accumulation is selective for labile contaminants, thus giving an indication of the bio-available fraction.
The study’s main objectives were to:
• test out passive sampling devices and become familiar with them;• apply passive sampling techniques to monitor real contamination events;• develop field and laboratory analysis methods.
The work involved a variety of sampling locations (both inland and coastal waters) andcontamination issues such as polycyclic aromatic hydrocarbons (PAHs), pesticides, heavymetals and pharmaceuticals.
Three types of passive sampling device were used:
• semi-permeable membrane devices (SPMD) for non-polar organic contaminants suchas PAHs and organochlorine pesticides;
• diffusive gradient in thin film (DGT) devices for heavy metals such as cadmium, cobalt,copper, nickel, lead and zinc;
• polar organic chemical integrative samplers (POCIS) for polar organic compoundssuch as pharmaceuticals and organophosphorous pesticides.
POCIS units are a recent development and the work carried out in this study aided thisresearch. New passive sampling devices are being developed and one of these, thePortsmouth passive sampler (PPS), is being used to continue the study of the River Weyat Bordon.
Techniques for the deployment and retrieval of passive sampling devices arestraightforward, and procedures and equipment have been developed during this study.Laboratory analysis methods have also been developed and have attained, or are workingtowards, accreditation by the UK Accreditation Service (UKAS).
The data obtained from passive sampling have shown that these devices:
• can provide viable information on water quality;• will be a valuable tool for both routine water quality monitoring and special
investigations, particularly with respect to the requirements of the Water FrameworkDirective (WFD).
In addition to the involvement of environment monitoring teams from the EnvironmentAgency in a number of Regions and the National Laboratory Service, some work hasbeen carried out in collaboration with the US Geological Survey and the University of

SCIENCE REPORT: SC000062 – THE APPLICATION OF PASSIVE SAMPLING TECHNIQUES FOR WATERQUALITY MONITORING
iv
Lancaster. Contacts have also been made with the groups at Australian Research Counciland the University of Heidelberg carrying out related work.
Of greatest interest for further study is the combination of passive sampling withecotoxicological analysis to provide a tiered screening approach to water qualitymonitoring and environmental risk assessment.

SCIENCE REPORT: SC000062 – THE APPLICATION OF PASSIVE SAMPLING TECHNIQUES FOR WATERQUALITY MONITORING
v
List of AcronymsARC Australian Research CouncilAWQMS automatic water quality monitoring stationCERC Columbia Environmental Research Centre, Missouri, USACSO combined sewer overflowDGT diffusive gradient in thin filmEAF exposure adjustment factorEQS Environmental Quality StandardGC-MS gas chromatography mass spectrometryGPC gel permeation chromatographyGQA General Qualitative AssessmentHPLC high performance liquid chromatographyICP-MS inductively coupled plasma mass spectrometryICP-AAS inductively coupled plasma atomic absorption spectrometryLC-MS liquid chromatography mass spectrometryLDPE low density polyethyleneLOD limit of detectionMDL minimum detection limitMQL method quantitation limitNGR National Grid ReferenceNLS National Laboratory Service (Environment Agency)PAH polycyclic aromatic hydrocarbonPCB polychlorinated biphenylPCDD polychlorinated dibenzo-dioxinPCDF polychlorinated dibenzo-furanPIMS passive integrated mercury samplerPOCIS polar organic chemical integrative samplerPPS Portsmouth passive samplerPRC performance reference compoundQC quality controlR&D research and developmentRL reporting limitRSD relative standard deviation (expressed as a percentage)SIM selective ion modeSLMD stabilised liquid membrane deviceSPMD semi-permeable membrane deviceSPE solid phase extractionSTW sewage treatment worksTWA time-weighted averageUKAS United Kingdom Accreditation ServiceUSGS US Geological SocietyWFD Water Framework Directive

SCIENCE REPORT: SC000062 – THE APPLICATION OF PASSIVE SAMPLING TECHNIQUES FOR WATERQUALITY MONITORING
vi
ContentsAcknowledgements iiExecutive Summary iiiList of Acronyms iv
1 Introduction
1.1 Background 11.2 Objectives 2
2 Passive sampling devices
2.1 Semi-Permeable Membrane Device (SPMD) 32.2 Diffusive Gradient in Thin film (DGT) Device 92.3 Polar Organic Chemical Integrative Sampler (POCIS) 142.4 Other Samplers 17
3 Passive sampling studies
3.1 Godalming Sewage Treatment Works, River Wey, Surrey (1999) 193.2 Crossness STW, River Thames, London (1999) 263.3 Thames Tideway PAH, London (1999–2002) 293.4 Avenue Coking Works, River Rother, Derbyshire (2000) 393.5 Cranleigh Brick and Tile Works, River Wey, Surrey (2000) 433.6 Pharmaceuticals in STW Effluents, Northamptonshire (2002) 493.7 Bordon STW, River Wey, Hampshire (2002) 583.8 Fleet Lagoon, East Fleet, Dorset (2003) 623.9 Woolsbridge Industrial Estate, Moors River, Dorset (2003) 653.10 Waterlooville Industrial Estate, Sheepwash Tributary, Hampshire
(2003)67
3.11 Dwr Ial, River Clwyd, Camarthenshire (2003) 773.12 Able UK Docks, Teeside, Durham (2003) 80
4 Discussion and conclusions
4.1 Selection of Passive Samplers 854.2 Deployment Requirements 854.3 Analysis 864.4 Interpretation of Data 874.5 Combination of Passive Sampling with Bioassays 884.6 Conclusions 884.7 Recommendations for Further Work 90
5 References 92

SCIENCE REPORT: SC000062 – THE APPLICATION OF PASSIVE SAMPLING TECHNIQUES FOR WATERQUALITY MONITORING
1
1 Introduction1.1 BackgroundNormal strategies for monitoring water quality for specific chemical contaminants rely onthe periodic collection of spot samples – a principle that has remained largely unchangedsince the 16th century. The main drawback to spot sampling is that because it providesmonitoring data for that one moment in time, this can give a misleading impression ofwater quality due to the episodic nature of water contamination. In addition, changes inriver flow and anthropogenic practices are often not reflected adequately in spot samplingprogrammes. For example, higher flows have a chemical dilution effect in manycatchments. In contrast, however, some substances can increase in concentration due toseasonal agricultural application (e.g. of nitrates and pesticides). Spot samplingprogrammes are able to detect some contaminants that exhibit long-term seasonalfluctuations (e.g. nitrates), but are unable to detect more episodic pollutants such aspesticides. An integrated or continuous/semi-continuous targeted approach has thereforebeen suggested as an alternative option. In addition, more attention is being given to thelong-term affects of low levels of contaminants and their accumulation in aquatic biota.Analysis of spot samples for such low levels can be difficult and expensive to carry outand does not provide information on biological uptake.
Biomonitoring techniques offer an alternative for the low level detection of chemicalresidues due to the bioaccumulation and biomagnification of compounds in the fatty tissueof the host organism (Booij et al., 2000; Richardson et al., 2001). However, such studiesare complicated by uptake rate variations in the tissue of some organisms and therelationship of analyte concentrations in an organism to those in the environment. Inaddition, biomonitoring organisms are less likely to survive in environments wherecomplex chemical residues are lethal or where other environmental conditions, such asdissolved oxygen or temperature, cause stress during the period of exposure. In lessextreme cases, contaminants can cause biomonitoring organisms to stop feeding andthus they are no longer accumulated.
Passive monitoring devices were developed in the early 1990s to address theseproblems. They consist of a layer of sorbent material protected by a selectively permeablelayer. Labile contaminant species such as those that are bioaccumulated by aquaticorganisms pass through the outer layer and are absorbed on the inner matrix. Becausethese devices are artificial, chemical kinetics rather than biological processes governcontaminant uptake. This gives the devices a more robust and predictable response toenvironmental change. By definition, passive samplers perform without any manualhuman activity or power source; they function simply by chemical exchange between ahost sampling device and the environment.
In practice, passive samplers are deployed for a period of time (typically anywherebetween a week and a month), during which contaminants are absorbed. They are thenremoved to a laboratory where the contaminants are eluted and analysed to quantify theamount accumulated. The result can be used to calculate a time-weighted average (TWA)concentration in the environment; this gives a better overall indication of water quality andcan show up episodes of increased contaminant levels.
The accumulation process means that contaminants are effectively pre-concentrated onthe passive sampler, thus allowing easier quantification of concentrations below normaldetection limits in spot samples. Many conventional monitoring techniques cannotmeasure environmental contamination at trace level (≤ng/litre). A few successful methods

SCIENCE REPORT: SC000062 – THE APPLICATION OF PASSIVE SAMPLING TECHNIQUES FOR WATERQUALITY MONITORING
2
such as solid phase extraction (SPE) involve collecting large sample volumes in order toobtain sufficient mass of analyte to achieve quantification limits on even state-of-the-artinstruments (Ellis et al., 1995).
1.2 Study Objectives
The main aim of this study was to assess whether passive sampling technology could beapplied in both an operational and research context for water quality monitoring. Therationale behind this aim was to:
• establish whether water quality monitoring requirements could incorporate time-integrated sampling techniques to detect trace or episodic chemical concentrations;
• quantify amounts of certain compounds that are normally below instrumental detectionlimits.
The specific objectives were to:
• evaluate the more established passive sampling techniques in a range of water qualityconditions (effluents, freshwater and tidal waters);
• establish accredited National Laboratory Service handling and analysis protocols forpassive sampling devices;
• evaluate and further develop newer techniques for the detection of polar herbicides,steroid oestrogen and pharmaceutical compounds (undertaken in partnership with theUS Geological Survey’s Environmental Chemistry branch in Columbia, Missouri,USA);
• design and develop deployment procedures and apparatus for handling passivesamplers in the field.
SCIENCE REPORT: SC000062 – THE APPLICATION OF PASSIVE SAMPLING TECHNIQUES FOR WATERQUALITY MONITORING
3
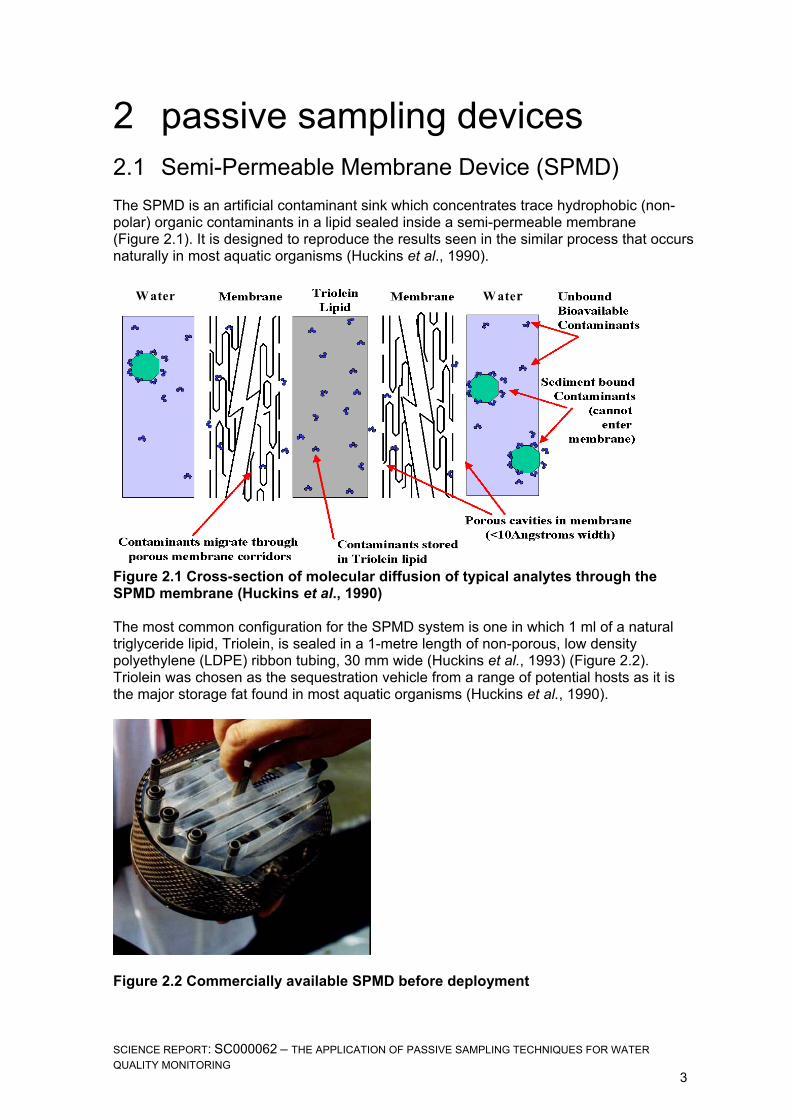
2 passive sampling devices2.1 Semi-Permeable Membrane Device (SPMD)The SPMD is an artificial contaminant sink which concentrates trace hydrophobic (non-polar) organic contaminants in a lipid sealed inside a semi-permeable membrane(Figure 2.1). It is designed to reproduce the results seen in the similar process that occursnaturally in most aquatic organisms (Huckins et al., 1990).
W ater W ater
Figure 2.1 Cross-section of molecular diffusion of typical analytes through theSPMD membrane (Huckins et al., 1990)
The most common configuration for the SPMD system is one in which 1 ml of a naturaltriglyceride lipid, Triolein, is sealed in a 1-metre length of non-porous, low densitypolyethylene (LDPE) ribbon tubing, 30 mm wide (Huckins et al., 1993) (Figure 2.2).Triolein was chosen as the sequestration vehicle from a range of potential hosts as it isthe major storage fat found in most aquatic organisms (Huckins et al., 1990).
Figure 2.2 Commercially available SPMD before deployment

SCIENCE REPORT: SC000062 – THE APPLICATION OF PASSIVE SAMPLING TECHNIQUES FOR WATERQUALITY MONITORING
4
The LDPE membrane permits the transport of a wide range of environmentally importanthydrophobic (non-polar) organic chemicals into the lipid, in a manner that mimics thenatural bioaccumulation phenomena in many aquatic organisms (Herve et al., 1995).Organic contaminants that can be monitored include:
• polycyclic aromatic hydrocarbons (PAHs);• polychlorinated biphenyls (PCBs);• organochlorine pesticides.
The LDPE used in the standard SPMD design has transient cavities of 10 Ǻ in diameter,which have almost identical characteristics of gill membranes in fish. This ensures thateven the smallest chemically loaded particles cannot penetrate the membrane, but doesnot impede the transfer of truly mobile hydrophobic contaminants in the aqueous orvapour phase.
The rate of contaminant accumulation in the lipid is controlled by the rate of diffusionthrough the membrane and the aqueous boundary layer that develops between the SPMDand the bulk solution in which it is deployed. As contaminants are sequestered into thelipid, the concentration at the lipid/membrane boundary is effectively zero. A concentrationgradient is therefore set up between the lipid and bulk solution (Figure 2.3).
Figure 2.3 Simplified representation of contaminant uptake kinetics in SPMDs
In principle, the higher the concentration of contaminant in the bulk solution, the steeperthe concentration gradient; thus, the amount of contaminant accumulated on the lipidincreases proportionally. The uptake rate is different for each compound and must bedetermined experimentally; uptake rates are also dependent on temperature and waterflow rate in the bulk solution. Table 2.1 at the end of this section gives a list of compoundsfor which calibration data have been determined.
When assessing selected trace contaminants in water, the SPMD system possessesseveral major advantages over many conventional biomonitoring organisms. It has a fargreater capacity and is a more efficient surrogate for contaminants due to the highervolume of lipid. It is also non-selective in the uptake of hydrophobic contaminants (Chiou,1985; Richardson et al., 2001). In addition, SPMDs are not restricted by water quality,physiochemical stresses, metabolism or depuration (excretion) complications. Theiruniform design avoids the complications associated with comparing different species withlife-cycle variations and analyte uptake through dietary ingestion and the dissolvedmaterial. This makes them ideal as an initial screening method prior to an investigation ofthe impact of chemical mixtures on fish or selected biomonitoring organisms.
SPMDs cannot demonstrate the impact of chemicals on biota or specific parts of a hostorganism’s anatomy (e.g. the reproductive system or brain). They are also unable tomonitor for more polar organic compounds such as steroid oestrogens, which areconsidered a major contributor to endocrine disruption and the impedance of sexualdevelopment.
Lipid
Membrane
Aqueousboundary layer
Bulk solution
Concentrationgradient

SCIENCE REPORT: SC000062 – THE APPLICATION OF PASSIVE SAMPLING TECHNIQUES FOR WATERQUALITY MONITORING
5
The use of a standard SPMD design is a prerequisite for a widely applied samplingmethod, as major changes would make it impossible to compare results with other SPMDresearch and calibration data. All SPMD samplers employed in for this study wereprepared using the method developed by the US Geological Survey (USGS, 2000).Manufacture is straightforward, although it requires use of a clean room as SPMDs aresusceptible to contamination from atmospheric sources. The LDPE membrane and toolsused to manufacture the SPMDs also need to be cleaned carefully to reducecontamination of materials during fabrication. Once prepared, the samplers are stored insealed tins previously flushed with an inert gas such as argon.
Field deployment of SPMDs into water is relatively simple and straightforward. Undernormal conditions, the devices are fixed on commercially available mountings and loadedinto protective deployment cages. During the loading period, one SPMD is exposed to theatmosphere but then returned to a sealed tin to provide a background correction.
Once secured in the deployment apparatus, the units are suspended into a submergedarea for the duration of exposure. If some of the survey area is tidal or subject to extremevariations in flow; appropriate buoyancy and weighting equipment should be employed toensure that the devices are not exposed to atmospheric interference when water levelsfluctuate.
During recovery, it is important to handle the devices carefully to avoid contamination. Anyloose debris should be rinsed off with distilled water before the devices are placed in asealed tin and frozen until analysis to reduce sample deterioration.
For this study, the SPMDs were analysed at the Leeds laboratory of the EnvironmentAgency’s National Laboratory Service (NLS). The United Kingdom Accreditation Service(UKAS) accredited PAH method using gas chromatography-mass spectrometry (GC-MS)was followed. The specific laboratory procedures varied slightly when consideringparticular suites of compounds required by separate studies.
In brief, the procedure involves cleaning the SPMD externally in deionised H²O andrinsing it with a combination of acetone and propan-2-ol (isopropyl alcohol; IPA). TheSPMDs are then placed in pre-cleaned Kilner preserving jars that have been rinsed withhexane. Hexane is added until the devices are completely submerged. The SPMDs aredialysed at a constant 20°C for 18 hours, after which the materials are discarded and theextract solution cleaned up by gel permeation chromatography (GPC). The GPCconditions are configured to separate the target organic compounds from any interferingfat, oil and elemental sulphur molecules. The GPC extract is reduced to approximately 1ml under a steady stream of nitrogen and then subjected to SPE using 500 mg silica in a 6ml glass column pre-conditioned with hexane (2 × 10 ml) and collected under gravity. Theclean extract is reduced to 1 ml under a gentle stream of nitrogen and divided into two 0.5ml portions one each for PAH and PCB analyses. These are made up to approximately0.9 ml with hexane before 100 µl of a deuterated internal standard solution is added. Theextracts are then analysed by GC-MS operated in selected ion monitoring (SIM) mode.
Quality control (QC) procedures are an essential part of a passive monitoring study. Allinstrumental work is completed with internal standards. The QC procedures shouldaccount for any interference due to the storage, transport, deployment, recovery and thelaboratory phase of the sampling strategy. A field blank, which is used to correct foratmospheric exposure during deployment and recovery, is essential. Various blanks canbe analysed to correct for potential interferences. These include:
• a fabrication blank (manufactured at the same time as the devices used in the field);

SCIENCE REPORT: SC000062 – THE APPLICATION OF PASSIVE SAMPLING TECHNIQUES FOR WATERQUALITY MONITORING
6
• a trip blank (this accompanies the field samplers and can help to identify anycontamination during transport to and from the field locations).
Basic studies suggest considerations for field and trip blank correction. This commonlyincludes performance reference compound (PRC) samplers. These are SPMDs that havebeen spiked with a labelled compound which will elute during exposure and thereforeprovide an exposure adjustment factor (EAF) through comparison of the PRC loss in theenvironment with that observed in laboratory trials (Huckins et al., 2002). The EAF shouldprovide a correction for variation in uptake rates affected by changes in temperature andsolution flow rate and, to a lesser extent, biofouling.
Calibration trials have revealed that SPMDs are capable of sampling accurately within atwo-fold variability range, e.g. ±50% at trace level (ng/l) (Huckins J, personalcommunication). To obtain this level of accuracy, the PRC approach has to be applied tocorrect for environmental variables such as flow, fouling, etc.
This represents excellent environmental field accuracy compared with conventionalsampling; SPMDs only sequester dissolved contaminants and are not influenced byinterference derived from total organic carbon loading. The reproducibility betweenreplicate SPMDs reported for most compounds in river water and during calibrationstudies is <10 %.
The basic relationship for SPMD-derived analysis of water concentrations is:
CTWA = M / (RS × t)
where:
CTWA = Time-weighted average concentration of contaminant in water duringthe deployment period (ng/litre)
M = Mass of analyte (ng) collected by the SPMD over the deploymentperiod as determined by laboratory analysis
RS = Sampling rate (litres/day) determined from calibration experiments(Mackay et al., 1997) and EAF corrected (if PRC data are available)
t = Deployment time (days)
This calculation assumes a linear relationship between TWA concentration and massaccumulated; this is the case when the SPMDs are first deployed. If the deploymentperiod is too long, accumulated contaminants start to diffuse back into solution at anincreasing rate until equilibrium is reached (Figure 2.4).

SCIENCE REPORT: SC000062 – THE APPLICATION OF PASSIVE SAMPLING TECHNIQUES FOR WATERQUALITY MONITORING
7
0102030405060708090
100
0 50 100 150
Deployment time (days)
Mas
s ac
cum
ulat
ed (n
g)
Figure 2.4 Contaminant accumulation with deployment time for SPMDs underconditions of constant concentration, temperature and flow rate
To determine the TWA concentration reliably, deployment should only take place duringthe linear uptake phase. The duration of linear uptake depends on the contaminant’spreference to be in solution in the aqueous or organic phase, and is defined as the ratio ofsolubility in water compared with that in octanol, i.e.the octanol-water partition coefficient(KOW). Because these values span several orders of magnitude, they are expressed as logKOW. Higher KOW values mean a greater preference to be in solution in the organic phase;these compounds remain longer in the lipid layer of an SPMD before desorption starts. Inpractice, SPMDs sample most effectively for compounds with log KOW values in the rangeof 3 to 7. Equilibrium conditions are approached if the contaminant concentration in thewater drops to a level much lower than in the lipid, such as occurs for episodic events(Rogers, 1997)
Much of the modelling work undertaken to date has incorporated the chemical recoveriesfound within both the lipid and membrane part of the SPMD (Huckins et al., 1999). Somestudies have also attempted to address the kinetics of the aqueous boundary layerbetween the membrane layer and the bulk solution (Booij et al., 1998). The main methodsof analyte recovery used in SPMD research include both the lipid and the membranecontribution. Some of the modelling reported to date includes the determination of ambientwater concentrations from all three phases of SPMD uptake (e.g. linear, curvilinear andequilibrium) (USGS, 2000).
At the present stage of development, SPMD modelling has been undertaken to determinecontaminant levels in surface water and ground water (USGS, 2000). To a lesser degree,some modelling has also been undertaken to incorporate ambient absorption ofcontaminants from sediments and air (Cleveland et al., 1997; USGS, 1999), althoughmuch of the calibration data for this aspect of the research are currently unavailable.Sediment analysis has successfully been undertaken using the SPME (solid-phase micro-extraction) technique. However, its application is subject to the monitoring strategyrequired due to its rapid uptake and loss of analyte, coupled with its relatively low capacity(Mayer et al., 2000).
Linearphase
Start ofdesorption
Equilibriumphase

SCIENCE REPORT: SC000062 – THE APPLICATION OF PASSIVE SAMPLING TECHNIQUES FOR WATERQUALITY MONITORING
8
Table 2.1 Compounds for which sampling rates have been experimentallydetermined
SPMD calibrated compunds
Organochlorine PAHs and related Individual PCB congenerspesticides heterocyclic compounds IUPAC No.
Hexachlorobenzene (HCB) Naphthalene 6 53 97 149Pentachloroanisole (PCA) Biphenyl 18 63 99 151alpha-HCH Dibenzofuran 19 64 101 153Lindane (gamma-HCH) 1-methylnaphthalene 22 66 105 156beta-HCH 2-methylnaphthalene 25 67 107 157Heptachlor 2,6-dimethylnaphthalene 26 70 110 158delta-HCH 2,3,5-trimethylnaphthalene 28 74 114 169Chlorthal Dimethyl Acenaphthylene 31 77 118 172Oxychlordane Acenaphthene 40 78 119 174Heptachlor Epoxide Fluorene 41 79 126 176trans-Chlordane 1-methylfluorene 42 81 127 178trans-Nonachlor dibenzothiophene 43 82 128 179o,p'-DDE Phenanthrene 44 83 129 180cis-Chlordane Anthracene 45 84 130 183Endosulfan-I 1-methylphenanthrene 46 85 134 187p,p'-DDE Fluoranthene 47 87 136 194Dieldrin Pyrene 48 90 137 199o,p'-DDD Benz[a]anthracene 49 91 138 201Endrin Chrysene 51 92 141 207cis-Nonachlor Benzo[b]fluoranthene 52 95 146o,p'-DDT Benzo[k]fluoranthenep,p'-DDD Benzo[e]pyrene Miscellaneous compoundsEndosulfan-II Benzo[a]pyrenep,p'-DDT Indeno[1,2,3-cd]pyrene AllethrinEndosulfan Sulfate Dibenzo[a,h]anthracene Chlorpyrifosp,p'-Methoxychlor Benzo[g,h,I]perylene DiazinonMirex Coronene Fenvalerate
Individual PCDD/PCDF congeners
2,3,7,8-Tetrachloro-dibenzo-p-dioxin1,2,3,7,8-Pentachloro-dibenzo-p-dioxin1,2,3,4,7,8-Hexachloro-dibenzo-p-dioxin1,2,3,6,7,8-Hexachloro-dibenzo-p-dioxin1,2,3,7,8,9-Hexachloro-dibenzo-p-dioxin1,2,3,4,6,7,8-Heptachloro-dibenzo-p-dioxinOctachloro-dibenzo-p-dioxin2,3,7,8-Tetrachlorodibenzofuran1,2,3,7,8-Pentachlorodibenzofuran2,3,4,7,8-Pentachlorodibenzofuran1,2,3,4,7,8-Hexachlorodibenzofuran1,2,3,6,7,8-Hexachlorodibenzofuran2,3,4,6,7,8-Hexachlorodibenzofuran1,2,3,7,8,9-Hexachlorodibenzofuran1,2,3,4,6,7,8-HeptachlorodibenzofuranOctachlorodibenzofuranSource: USGS, 2000

SCIENCE REPORT: SC000062 – THE APPLICATION OF PASSIVE SAMPLING TECHNIQUES FOR WATERQUALITY MONITORING
9
2.2 Diffusive Gradient in Thin Film (DGT) DevicesThese passive samplers (Figure 2.5) are designed to monitor water contamination from arange of metals (Davison and Zhang, 1994). DGTs work on the principle of ionic diffusionthrough a thin film and accumulation by an ion exchange resin. This means that only labilemetal species in solution are monitored; they do not accumulate metals that are bound tosuspended solids or organic complexes, or are present as insoluble precipitates.
Figure 2.5 Photograph and schematic of a DGT device
The binding layer (0.4 mm in thickness) is made of Chelex 100 ion exchange resin. Thiscan absorb a range of environmentally important metals simultaneously; an importantexception is chromium VI. The diffusive gel layer (0.8 mm in thickness) is apolyacrylamide hydrogel; containing acrylamide (15 %) and AcrylAide agarose cross-linker (0.3 %).
The gel layer can be made to be selective for free metal ions only, or to allow diffusion ofmetal ions bound to organic complexes as well. However, only those ions that candissociate from the complex will be accumulated. The outer layer is a standard 0.45 µmcellulose nitrate filter, which protects the gel layer from damage by particulates. Once insitu, the labile metal ions diffuse through the gel layer and are sequestered by the resinlayer. This results in a concentration gradient across the gel layer, which is proportional tothe analyte concentration in the environment. The higher the environmental concentration,the steeper the gradient in the gel layer and the greater the loading of the resin layer.
The diffusion gradient takes about 30 minutes to establish. In practice, this means aminimum deployment time of one hour, though devices are normally left in place forperiods of a week up to a month depending on contaminant levels. The rate of diffusionhas been found to be independent of water flow rate (provided the water is not stagnantand not affected by pH changes between 5.0 and 9.0), but increases with temperature(Zhang and Davidson, 1995; Davison and Hutchinson, 1997; Zhang, 1998).
Deployment of DGTs requires that they remain submerged in the moving water streamand are held in a fixed location while being protected from damage or fouling byparticulate matter in the water. A number of techniques have been developed to achievethis, depending on the conditions at the sampling location (Figures 2.6–2.8).
Before deployment, the DGT devices are stored at a temperature of ~4°C in separatesealed bags containing a few drops of high purity 0.01M sodium nitrate solution (this stopsthe gel layer from dehydrating). Unlike SPMDs, DGTs do not readily absorb atmosphericcontaminants so there is no requirement for an air blank. However, it is important torecord the water temperature during deployment because this affects the rate of diffusion.Ideally water temperature should be monitored continuously. Recording the temperatures

SCIENCE REPORT: SC000062 – THE APPLICATION OF PASSIVE SAMPLING TECHNIQUES FOR WATERQUALITY MONITORING
10
at deployment and removal is acceptable. When the devices are removed, they are rinsedwith distilled water. They are then put into separate sealed bags and placed in coolstorage (~4°C) as soon as possible.
Figure 2.6 DGT holder: plate design Figure 2.7 DGT holder: cage design
Figure 2.8 DGT deployment in shallow water
Laboratory analysis for the studies described in this report was carried out at LancasterUniversity or by the NLS at Waterlooville where the UKAS-accredited method outlinedbelow was developed (Symonds, 2003).
The devices are allowed to come to room temperature prior to analysis, but remain in theirsealed bags. Each device is then removed in turn, washed with distilled water anddismantled carefully. The resin layer is placed in a micro-centrifuge tube containing 1 ml of1M nitric acid (trace metal grade). At all times, the devices are handled while wearinglatex or nitrile gloves (Figure 2.9) and plastic tweezers are used to remove the filter,diffusive gel and resin layers (Figures 2.10 and 2.11). Particular care must be taken whenremoving the diffusive gel layer as the resin layer, which is much thinner, can easily stickto it. Once the resin layer is fully immersed in the nitric acid, the tube is sealed and tappedwith a finger to remove any air bubbles. It is then left for at least 24 hours to ensurecomplete leaching of the accumulated metals. All other parts of the device are discarded(Figure 2.12).
After the metals have been extracted, the solution is transferred to a 60 ml centrifuge tubeand diluted to 50 ml with 1 per cent nitric acid (trace metal grade) (Figure 2.13). All

SCIENCE REPORT: SC000062 – THE APPLICATION OF PASSIVE SAMPLING TECHNIQUES FOR WATERQUALITY MONITORING
11
solutions are then analysed by inductively coupled plasma mass spectrometry (ICP-MS)for cadmium, copper, lead, nickel and zinc (Figure 2.14). Each analytical run also includesblanks and reference solutions to ensure acceptable limits of detection (LODs) andinstrumental precision and accuracy. In addition, DGT devices that have been previouslydeployed in a standard solution in the laboratory are analysed as quality control samples.

SCIENCE REPORT: SC000062 – THE APPLICATION OF PASSIVE SAMPLING TECHNIQUES FOR WATERQUALITY MONITORING
12
Figure 2.9 Dismantling a DGT device Figure 2.10 Removal of outer layers
Figure 2.11 Placing the DGT resin layer Figure 2.12 Discarded DGT partsinto an extraction tube
Figure 2.13 Dilution of extract solution Figure 2.14 ICP-MS analysis

SCIENCE REPORT: SC000062 – THE APPLICATION OF PASSIVE SAMPLING TECHNIQUES FOR WATERQUALITY MONITORING
13
The results of the ICP-MS analysis are converted into a TWA concentration in theenvironment as follows.
First, the mass of each metal accumulated on the resin is calculated:
M = (CICP × Df × (VACID + VRES)) / Ef
where:M = Mass of metal accumulated on the resin (ng)CICP = Concentration of metal as reported by ICP-MS analysis (µg/ml)Df = Dilution factor used in analysis; in this method Df = 50VACID = Volume of acid used in extraction (1 ml)VRES = Volume of resin layer (0.15 ml)Ef = Elution factor (0.8).
The elution factor of 0.8 was determined experimentally during DGT development studies(Zhang 1998); not all the accumulated metal is extracted from the resin layer, but recoverylevels were consistent at around 80 per cent.
Then, the TWA concentration in the environment is calculated:
CTWA = (M × ∆g) / (D × t × A)
where:CTWA = TWA concentration at the sampling location (µg/l)M = Mass of metal accumulated on the resin (ng)∆g = Thickness of diffusive gel and the membrane filter (0.094 cm)D = Diffusion coefficient for the metal (Table 2.2) (cm2/second)t = Deployment time (seconds)A = Exposure area (3.14 cm2).
The diffusion coefficient (D) for a number of metals has been experimentally determinedof a range of temperatures (Zhang, 1998). The value for the average temperature duringdeployment can be either be looked up from a table or calculated from the equationproduced by performing a second order polynomial regression of these data.
In practice, the calculation can be combined into:
CTWA = (CEXT × 0.043) / (D × t)
where:CEXT = Concentration of metal in the undiluted extract solution.
This is the result quoted in laboratory reports. The value 0.043 in the equation is the resultof combining the constants present.
While the mechanism for contaminant uptake for DGT to SPMD is similar, the DGT modeldoes not include an aqueous boundary layer. This is because this is only significant instagnant conditions. In addition, once the metal ions are sequestered by the Chelex resin,they are not desorbed back into solution unless this becomes very acidic. Uptaketherefore remains linear until the resin becomes saturated.

SCIENCE REPORT: SC000062 – THE APPLICATION OF PASSIVE SAMPLING TECHNIQUES FOR WATERQUALITY MONITORING
14
Table 2.2 Diffusion coefficients of metal ions in DGT gel at 1–35°C
Source: Zhang, 1998.
Temp Diffusion coefficients(oC) (E-6 cm2/sec)
Ag AI Cd Co Cr Cu Fe Mn Ni Pb Zn1 6.58 2.22 2.84 2.77 2.36 2.91 2.85 2.73 2.69 3.75 2.842 6.83 2.30 2.95 2.88 2.45 3.02 2.96 2.83 2.80 3.89 2.943 7.09 2.39 3.06 2.99 2.54 3.13 3.07 2.94 2.90 4.04 3.054 7.35 2.48 3.18 3.10 2.63 3.25 3.18 3.05 3.01 4.19 3.175 7.62 2.57 3.29 3.21 2.73 3.36 3.30 3.16 3.12 4.34 3.286 7.89 2.66 3.41 3.32 2.82 3.48 3.42 3.27 3.23 4.49 3.407 8.17 2.75 3.53 3.44 2.92 3.61 3.54 3.39 3.34 4.65 3.528 8.45 2.85 3.65 3.56 3.02 3.73 3.66 3.50 3.46 4.81 3.649 8.74 2.94 3.78 3.68 3.13 3.86 3.79 3.62 3.58 4.98 3.7710 9.04 3.04 3.90 3.80 3.23 3.99 3.91 3.74 3.70 5.14 3.8911 9.34 3.14 4.03 3.93 3.34 4.12 4.04 3.87 3.82 5.31 4.0212 9.64 3.25 4.16 4.06 3.45 4.26 4.18 4.00 3.94 5.49 4.1513 9.95 3.35 4.30 4.19 3.56 4.39 4.31 4.12 4.07 5.67 4.2914 10.27 3.46 4.43 4.32 3.67 4.53 4.45 4.26 4.20 5.85 4.4215 10.59 3.57 4.57 4.46 3.79 4.68 4.59 4.39 4.33 6.03 4.5616 10.92 3.68 4.72 4.60 3.91 4.82 4.73 4.52 4.47 6.21 4.7017 11.25 3.79 4.86 4.74 4.03 4.97 4.87 4.66 4.60 6.40 4.8518 11.59 3.90 5.01 4.88 4.15 5.12 5.02 4.80 4.74 6.60 4.9919 11.93 4.02 5.15 5.02 4.27 5.27 5.17 4.95 4.88 6.79 5.1420 12.28 4.14 5.30 5.17 4.39 5.42 5.32 5.09 5.02 6.99 5.2921 12.64 4.26 5.46 5.32 4.52 5.58 5.47 5.24 5.17 7.19 5.4422 13.00 4.38 5.61 5.47 4.65 5.74 5.63 5.39 5.32 7.40 5.6023 13.36 4.50 5.77 5.63 4.78 5.90 5.79 5.54 5.47 7.61 5.7624 13.73 4.62 5.93 5.78 4.91 6.06 5.95 5.69 5.62 7.82 5.9225 14.11 4.75 6.09 5.94 5.05 6.23 6.11 5.85 5.77 8.03 6.0826 14.49 4.88 6.26 6.10 5.19 6.40 6.28 6.01 5.93 8.25 6.2427 14.88 5.01 6.43 6.27 5.32 6.57 6.45 6.17 6.09 8.47 6.4128 15.27 5.14 6.60 6.43 5.47 6.74 6.62 6.33 6.25 8.69 6.5829 15.67 5.28 6.77 6.60 5.61 6.92 6.79 6.50 6.41 8.92 6.7530 16.08 5.41 6.94 6.77 5.75 7.10 6.96 6.66 6.58 9.15 6.9231 16.49 5.55 7.12 6.94 5.90 7.28 7.14 6.83 6.74 9.39 7.1032 16.90 5.69 7.30 7.12 6.05 7.46 7.32 7.00 6.91 9.62 7.2833 17.32 5.83 7.48 7.29 6.20 7.65 7.50 7.18 7.09 9.86 7.4634 17.75 5.98 7.67 7.47 6.35 7.84 7.69 7.36 7.26 10.10 7.6435 18.18 6.12 7.85 7.66 6.51 8.03 7.87 7.53 7.44 10.35 7.83

SCIENCE REPORT: SC000062 – THE APPLICATION OF PASSIVE SAMPLING TECHNIQUES FOR WATERQUALITY MONITORING
15
2.3 Polar Organic Chemical Integrative Sampler(POCIS)The POCIS system was developed to extend the SPMD concept to monitor more polar orhydrophilic organic contaminants. Examples include pesticides such as the uronherbicides diazinon and atrazine, and pharmaceuticals such as 17α-ethynyloestradiol(Alvarez, 1999). Analysis has revealed a number of other compounds of interest, althoughthese have not yet been calibrated for analytical purposes. Research is continuing toenhance and diversify the technique as a tool for measuring priority compounds of interestto the Environment Agency and other scientific organisations.
At present, the devices consist of an admixture of a SPE resin, Isolute ENV + and apolystyrene divinylbenzene polymer dispersed on S-X3 Ambersorb 1500. Thiscombination has evolved due to the high capacity and good recovery rates of Ambersorb1500 and Isolute ENV+. Initial laboratory trials demonstrated that this combination couldgive analyte recovery rates >87 per cent. Laboratory studies also demonstrated that, foreach analyte tested, the mass balance was >89 per cent of the samples in each case(Alvarez 2004). An alternative matrix, which has also been used, is 200 mg of Oasis HLBsorbent.
The sampling matrix is sandwiched evenly between two membrane layers ofpolyethsulphone polymer. This was selected owing to its high analyte transfer rates,durability and ability to restrict diffusion of anything other than truly dissolved analytes intothe sequestration complex. It also demonstrates excellent resilience to biological fouling –a factor that can reduce sampling rates on all passive sampling systems. Initial calibrationwork involving laboratory exposures of static and non-static devices in solutions of threetarget analytes has been undertaken for the prototype POCIS configuration outlinedabove. Clearance rates (analyte uptake kinetics) have also been measured (Alvarez,1999). Table 2.3 listed those compounds that have so far been detected in POCISextracts.
The deployment requirements for POCIS devices are broadly similar to those for SPMDs.No standard or commercial design has yet been developed for POCIS, although theconfigurations employed to date have followed the Alvarez prototype.
Figure 2.15 Original deployment system for POCIS (Alvarez, 1999)
Samplers were deployed in sets of three or four at each site (due to their relatively smallsurface area), using a deployment apparatus similar to SPMD cages (Figure 2.15). A new

SCIENCE REPORT: SC000062 – THE APPLICATION OF PASSIVE SAMPLING TECHNIQUES FOR WATERQUALITY MONITORING
16
design was manufactured for this project made from household drainage piping capped ateach end and fitted with stainless steel anchorage hooks (Figure 2.16).
12 cmdiam.
31.5 cm
Figure 2.16 POCIS deployment system as used on the Thames Tideway and RiverRavensbourne (dimensions are approximate)
It is important to protect the POCIS diskettes from damage by miscellaneous debriswithout impairing the flow of water across the device surfaces. The cages need to be keptfully submerged for the duration of the monitoring period using buoys and weights ortether lines as required; a typical submersion depth is 30 cm.
Quality control procedures should include the use of PRC samplers and, although not assusceptible to atmospheric contamination as SPMDs, POCIS monitoring strategies shouldinclude batch and field blanks for the identification of interferences. All field and PRCexposure blanks are frozen for storage before analysis at the earliest opportunity. ThePOCIS and PRC units are also frozen for storage as soon as they are recovered at theend of the deployment period.
For analysis, the samplers are allowed to come to room temperature and then rinsed withwater to remove surface debris. The absorption matrix is removed from the POCIS unitand transferred with methanol to a glass chromatography column (1 cm internal diameter),which has been pre-rinsed with hexane. The matrix is kept in place with glass wool plugs.
Analytes are eluted with methanol: toluene: dichloromethane 1:1:8 (50 ml) for the IsoluteENV+/S-X3 admixture or methanol (40 ml) for the Oasis HLB sorbent. The extract is thenconcentrated by rotary film evaporation to 1 ml in methanol. It is further cleaned up andprepared as required for analysis by high performance liquid chromatography (HPLC) orliquid chromatography mass spectrometry (LC-MS).
The modelling procedure for the existing POCIS configuration follows the rationale behindthe SPMD system. Assuming that the calibration rates for the target compounds havebeen established:
CTWA = M / (RS × t)
where:CTWA = TWA concentration during the deployment period (ng/litre)M = Mass of analyte collected by the POCIS device (ng) as determined by
laboratory analysis

SCIENCE REPORT: SC000062 – THE APPLICATION OF PASSIVE SAMPLING TECHNIQUES FOR WATERQUALITY MONITORING
17
RS = Sampling rate (litres/day) as determined experimentally.t = Time (days).
Table 2.3 Compounds identified in POCIS extracts
Calibration data are available for chemicals in bold. Calibration data are planned for chemicals in italics.
17b-estradiol desethylterbuthylazine methyl salicylate17b-estradiol--3-sulfate desisopropylatrazine metolachlor2,4-D dextropropoxyphene metoxuron2,6-dichlorbenzamide (BAM) diazinon metribuzin3,4-dichlorophenyl isocyanate dichlorprop metsulfuron-methyl3-methyl(H)indole dichlorvos nicotinic acid4-cumylphenol diclofenac omeprazole4-hydroxyindole diethylhexyl phthalate oxindole4-octylphenol diethoxylate diltiazem oxytetracycline4-tert-octylphenol dimethoate pendimethalin5-methyl-1H-benzotriazole dinoseb pentachlorophenol5-phenylydantoin diphenhydramine phenelzineacetaminophen diuron phenolalachlor DNOC pirimicarbalkyl phenols (nonyl phenol) ephedrine acetate p-nitrophenolanthraquinone erythromycin prochlorazatrazine estrone prometonazinphos-ethyl ethofumesat propachlorazinphos-methyl ethotoin propiconazolazithromycin ethynylestradiol propoxurbentazon fenpropimorph propranololbenzophenone fluoxetine propyzamidbisphenol A fyrol simazinebromacil hexazinon sulfadiazinebromoform dissolved hydroxyatrazine sulfadimethoxinebromoxynil hydroxycarbofuran sulfamerazineb-sitosterol hydroxysimazine sulfamethoxazolecaffeine ibuprofen tamoxifencarbamazepine indole terbuthylazinecarbofuran ioxynil tetracyclinechloridazon isoproturon thiabendazolechlorpyrifos lenacil tri-2-butoxyethylphosphatechlorsulfuron levothryoxine tributylphosphatechlortetracycline MCPA triclosancholesterol mechlorprop triethyl citrateCotinine mefenamic acid trimethoprimcyanazine mephenytoin triphenyl phosphateDEET metabenzthiazuron tris-2-butoxyethylphosphatedehydronifedipine metamitron vitamin Adesethylatrazine metazachlor
Source: Alvarez D, personal communication (2004)

SCIENCE REPORT: SC000062 – THE APPLICATION OF PASSIVE SAMPLING TECHNIQUES FOR WATERQUALITY MONITORING
18
2.4 Other Passive SamplersA number of passive sampling devices have been developed recently but were notinvestigated as part of this study. These include:
• passive integrative mercury sampler (PIMS)
• Portsmouth passive sampler (PPS)
• stabilised liquid membrane device (SLMD).
Passive integrative mercury sampler (PIMS)Like the SPMD system, this mercury sampling technique was pioneered by the USGeological Survey at CERC, Missouri, USA. The device was designed to sequester Hg0
primarily for air, but also for neutral species of mercury in water (Brumbaugh et al., 2000).
The PIMS system (Figure 2.17) consists of a sealed semi-permeable polymericmembrane containing a mercury-sequestering reagent. Mercury can permeate themembrane and is rapidly stabilised inside the device. Sampling periods of weeks andmonths have been reported, although this technique is still considered very new.
After preparation, the PIMS sampling reagent can be analysed directly for mercury usingconventional ICP-MS methods.
Figure 2.17 PIMS sampler in atmospheric sampling configuration (USGS, 2000)
Portsmouth passive sampler (PPS)Developed by the University of Portsmouth in the UK, this device (Figure 2.18) is reportedto be capable of sampling polar and non-polar chemical compounds, including commonpharmaceuticals, herbicides, PAHs and PCBs (Kingston et al., 2000). The principal ofoperation is based on the diffusion of target compounds through a rate-limiting membrane,which then bind onto a solid phase material, C18 Empore discs. The membrane is eitherpolyethersulphone or polyethylene depending on whether polar or non-polar analytes arebeing targeted. The prototype samplers are currently being calibrated with a view toproduction of a commercial version.

SCIENCE REPORT: SC000062 – THE APPLICATION OF PASSIVE SAMPLING TECHNIQUES FOR WATERQUALITY MONITORING
19
Figure 2.18 PPS prototype sampler configuration (Kingston et al., 2000)
Stabilised liquid membrane device (SLMD)The SLMD is another USGS development in the field of passive sampling. It wasdesigned to be an alternative and complementary approach to the sampling of tracemetals in water (Brumbaugh et al., 1999). The technique consists of a water-insolubleorganic complexing mixture that diffuses to the exterior of the polymeric membrane. Thisallows the diffusion of labile and, hence bioavailable, forms of metal through into thedevice. The device has been developed sufficiently to sequester for cadmium, cobalt,copper, nickel, lead and zinc for up to six weeks. Sheathed and unsheathed variants thatallow for the sampling of filtered and unfiltered water have been tested in two mainconfigurations.
The SLMD benefits from high sampling rates. When the sample concentrate is extractedby nitric acid, analysis can be undertaken using conventional ICP-MS/ICP-AAS(inductively coupled plasma atomic absorption spectrometry).

SCIENCE REPORT: SC000062 – THE APPLICATION OF PASSIVE SAMPLING TECHNIQUES FOR WATERQUALITY MONITORING
20
3 Passive Sampling Studies3.1 Godalming Sewage Treatment Works, River Wey,Surrey (1999)Background and objectivesGodalming Sewage Treatment Works Figure 3.1 was built primarily to treat domesticwaste, but also receives a limited volume of industrial waste from nearby sources. Thelatter makes it suitable as a test site for evaluating the performance of DGT metalsamplers. The works is also one of the few sites in the Region with tertiary treatment of itseffluent output. This meant it was possible to assess whether passive monitoring couldindicate the efficiency of the wetland complex through which the effluent flows to removelabile contaminants.
The River Wey is considered to be of reasonably good quality, having a General QualityAssessment (GQA) rating of A and B in both chemical and biological terms, and wouldthus not over-saturate the devices with contaminants.
Figure 3.1 Aerial photograph of Godalming STW (Environment Agency)
Little research had previously been conducted on the practical application of DGTdevices, particularly in more extreme environments such as sewage effluents andestuarine conditions. A series of experiments were conducted to address the lack ofknowledge in this field. The study’s specific objectives were to:
• Evaluate DGT monitoring over time periods of up to 10 days;• Gain practical experience of using DGT devices in a range of conditions;• Identify any sampling discrepancies between DGT samplers used in effluent and
freshwater.

SCIENCE REPORT: SC000062 – THE APPLICATION OF PASSIVE SAMPLING TECHNIQUES FOR WATERQUALITY MONITORING
21
Sampling locationsThree deployment sites were selected to give as wide a variety of test conditions aspossible (Figure 3.2):
• Site 1. Godalming STW in the effluent channel as it exits the tertiary wetland complexand joins the main river channel (NGR: SU 99578 45697);
• Site 2. The River Wey upstream of Site 1 (NGR: SU 99281 45571);
• Site 3. The River Wey downstream of Site 1 (NGR: SU 99215 45788).
Figure 3.2 Map of sampling locations for Godalming STW studySource: Ordnance Survey. Crown Copyright. Licence reference: NC/03/16457.
Passive sampler deploymentAt Site 1, 20 DGT samplers were deployed at the same time. Four devices wererecovered every two days. At Sites 2 and 3, 10 devices were deployed at each site; twodevices recovered every two days.
A plate design of DGT holder was used at all three sites. At Sites 2 and 3, the holderswere suspended from a float, anchored down by a brick (Figure 3.3). At Site 1, the waterwas <50 cm deep and so the holder was attached to bricks at either end and submergedin flowing tertiary effluent (Figure 3.4).

SCIENCE REPORT: SC000062 – THE APPLICATION OF PASSIVE SAMPLING TECHNIQUES FOR WATERQUALITY MONITORING
22
Figure 3.3 DGTdeployment at Sites 2
and 3
Figure 3.4 DGT deployment at Site 1
Other monitoring carried outNone
ResultsThe DGT devices were analysed at Lancaster University for cadmium, cobalt, copper,manganese, nickel, lead and zinc. The mean TWA concentration (CTWA in µg/l) and thesample reproducibility between devices (relative standard deviation; RSD) were thencalculated for these metals. The survey results for the different metals are summarised inTables 3.1–3.7 and Figures 3.5–3.11.
Cadmium
Table 3.1 Cadmium: mean CTWA and RSD (Godalming STW, 1999)
Cd Mean C twa (ug/l) %RSDt (hrs) Site 1 Site 2 Site 3 Site 1 Site 2 Site 3
48 0.02 0.08 0.07 18 3.5 4.496 0.02 0.03 0.03 59 12 43144 0.03 0.02 0.02 17 13 31192 0.05 0.01 0.01 5.8 14 3.3240 0.05 0.01 0.01 14 6.0 7.3

SCIENCE REPORT: SC000062 – THE APPLICATION OF PASSIVE SAMPLING TECHNIQUES FOR WATERQUALITY MONITORING
23
Figure 3.5 Cadmium: mean CTWA vs time
DGT Survey Godalming STW 1999
0.000.010.020.030.040.050.060.070.080.09
48 96 144 192 240Time (hrs)
C tw
a (u
g/l)
Cd Site 1
Site 2
Site 3

SCIENCE REPORT: SC000062 – THE APPLICATION OF PASSIVE SAMPLING TECHNIQUES FOR WATERQUALITY MONITORING
24
Cobalt
Table 3.2 Cobalt: mean CTWA and RSD (Godalming STW, 1999)
Figure 3.6 Cobalt: mean CTWA vs time
Copper
Table 3.3 Copper: mean CTWA and RSD (Godalming STW, 1999)
Figure 3.7 Copper: mean CTWA vs time
Co Mean C twa (ug/l) %RSDt (hrs) Site 1 Site 2 Site 3 Site 1 Site 2 Site 3
48 0.12 0.17 0.14 6.8 11 1396 0.13 0.13 0.14 8.2 14 14144 0.36 0.14 0.12 7.2 9.6 6.2192 0.31 0.12 0.10 7.5 0.7 7.7240 0.26 0.12 0.10 2.1 2.3 4.2
DGT Survey Godalming STW 1999
0.000.050.100.150.200.250.300.350.40
48 96 144 192 240Time (hrs)
C tw
a (u
g/l)
Co
Site 1
Site 2
Site 3
Cu Mean C twa (ug/l) %RSDt (hrs) Site 1 Site 2 Site 3 Site 1 Site 2 Site 3
48 5.9 1.0 1.6 7.3 45 5296 3.6 1.1 0.93 2.5 54 23144 2.1 0.30 0.52 35 12 12192 2.0 0.37 0.46 13 18 0.5240 2.1 0.41 0.44 14 16 6.7
DGT Survey Godalming STW 1999
0.01.0
2.03.0
4.05.0
6.07.0
48 96 144 192 240Time (hrs)
C tw
a (u
g/l)
Cu Site 1
Site 2
Site 3

SCIENCE REPORT: SC000062 – THE APPLICATION OF PASSIVE SAMPLING TECHNIQUES FOR WATERQUALITY MONITORING
25
Manganese
Table 3.4 Manganese: mean CTWA and RSD (Godalming STW, 1999)
Figure 3.8 Manganese: mean CTWA vs time
Nickel
Table 3.5 Nickel: mean CTWA and RSD (Godalming STW, 1999)
Figure 3.9 Nickel: mean CTWA vs time
Mn Mean C twa (ug/l) %RSDt (hrs) Site 1 Site 2 Site 3 Site 1 Site 2 Site 3
48 64 35 30 6.2 12 7.296 57 26 29 6.1 13 19144 74 26 23 5.6 3.2 1.1192 64 23 19 8.6 2.6 9.8240 41 23 20 20 1.5 0.5
DGT Survey Godalming STW 1999
01020304050607080
48 96 144 192 240Time (hrs)
C tw
a (u
g/l)
Mn
Site 1
Site 2
Site 3
Ni Mean C twa (ug/l) %RSDt (hrs) Site 1 Site 2 Site 3 Site 1 Site 2 Site 3
48 28 3.3 4.5 5.6 26 2696 24 3.4 4.1 6.5 6.2 5.5144 18 2.7 3.7 6.8 14 5.7192 16 2.5 3.0 0.6 2.3 9.9240 14 2.3 2.9 2.9 4.9 1.4
DGT Survey Godalming STW 1999
0
5
10
15
20
25
30
48 96 144 192 240Time (hrs)
C tw
a (u
g/l)
Ni Site 1
Site 2
Site 3

SCIENCE REPORT: SC000062 – THE APPLICATION OF PASSIVE SAMPLING TECHNIQUES FOR WATERQUALITY MONITORING
26
Lead
Table 3.6 Lead: mean CTWA and RSD (Godalming STW, 1999)
Figure 3.10 Lead: mean CTWA vs time )
Zinc
Table 3.7 Zinc: mean CTWA and RSD (Godalming STW, 1999)
Figure 3.11 Zinc: mean CTWA vs time
Pb Mean C twa (ug/l) %RSDt (hrs) Site 1 Site 2 Site 3 Site 1 Site 2 Site 3
48 0.08 0.01 0.02 7.2 30 11596 0.07 0.00 0.01 17 17 95144 0.02 0.00 0.01 15 37 80192 0.03 0.01 0.01 37 70 83240 0.03 0.01 0.01 66 13 0.7
DGT Survey Godalming STW 1999
0.000.010.020.030.040.050.060.070.080.09
48 96 144 192 240Time (hrs)
C tw
a (u
g/l)
Pb
Site 1
Site 2
Site 3
Zn Mean C twa (ug/l) %RSDt (hrs) Site 1 Site 2 Site 3 Site 1 Site 2 Site 3
48 12 3.1 3.8 3.9 30 3596 8.9 2.3 2.2 3.6 6.0 5.1144 9.2 4.0 3.4 60 5.5 11192 11 1.6 1.6 1.4 12 2.6240 8.7 1.3 1.5 1.8 2.3 1.3
DGT Survey Godalming STW 1999
0
2
4
6
8
10
12
14
48 96 144 192 240Time (hrs)
C tw
a (u
g/l)
Zn
Site 1
Site 2
Site 3

SCIENCE REPORT: SC000062 – THE APPLICATION OF PASSIVE SAMPLING TECHNIQUES FOR WATERQUALITY MONITORING
27
Discussion and conclusions
This study showed that DGTs are effective and reliable sampling devices for metals infreshwater streams and effluent channels. In most cases, sampling reproducibility wasgood with RSD values <10 per cent; where RSD was greater than 10 per cent, this couldgenerally be attributed to the effect of the anomalous results from one device. A notableexception are, the results for lead and copper where sampling reproducibility is generallypoor.
There were few differences between the results for samplers deployed upstream anddownstream of the discharge point. This showed that the effluent has little or no effect ondissolved metal concentrations in the River Wey.
The performance of the DGTs in the effluent channel demonstrated their ability to functionin more turbid and contaminated waters in which biomonitoring organisms might notsurvive it would be more difficult to analyse for trace contaminants in conventional spotsamples.
Sampling precision data suggest that DGTs should be deployed in batches of no less thanfour. In addition, the devices in the Godalming study were deployed with little protectionfrom debris. This allowed deposits to form on the devices, risking possible damage to thegel layer. It is therefore also recommended that future deployments should be carried outwith the DGTs placed in a protective housing. Extending the sampling time of ten days infuture studies would allow the longer term performance of DGTs to be assessed. Forroutine monitoring, a sampling period of a month would generally be the norm.

SCIENCE REPORT: SC000062 – THE APPLICATION OF PASSIVE SAMPLING TECHNIQUES FOR WATERQUALITY MONITORING
28
3.2 Crossness STW, River Thames, London (1999)Background and objectives
Crossness STW (Figure 3.12) in south-east London deals with domestic and industrialwaste from South London. It discharges approximately 650,000 m3 of effluent per day intothe Thames Tideway between Erith and Woolwich. Although considered large, it is onlyhalf the size of its north bank counterpart at Beckton, which discharges approximately 1million m3 per day.
This site was selected to test DGT devices as a contrast with the trials at GodalmingSTW.
• The tidal conditions would test device efficiency in various states of salinity.• The exceptionally high turbidity and strong current of the Thames tideway would help
to evaluate the robustness of the DGTs.
Figure 3.12 Aerial photograph of Crossness STW showing effluent discharge intothe Thames Tideway (Environment Agency)
Sampling locationsTwo sampling locations were selected (Figure 3.13).
• Site 1. The main effluent channel from Crossness STW (NGR: TQ 49070 80850)
• Site 2. The ‘Kingfisher’ survey vessel, which is permanently moored just up river ofSite 1 (NGR: TQ 48935 81121)

SCIENCE REPORT: SC000062 – THE APPLICATION OF PASSIVE SAMPLING TECHNIQUES FOR WATERQUALITY MONITORING
29
Figure 3.13 Map of sampling locations for Crossness STW studySource: Ordnance Survey. Crown Copyright. Licence reference: NC/03/16457.
Passive sampler deploymentAt Sites 1 and 2, 20 DGT samplers were deployed at the same time. Four devices wererecovered every two days. A plate design was used for the DGT holder at both sites. Itwas suspended from a float and anchored down by a brick.
Other monitoring carried outNone
ResultsThe DGT devices were analysed at Lancaster University for cadmium, cobalt, copper,manganese, nickel, lead and zinc. The mean TWA concentration (in µg/l)) and the samplereproducibility between devices (RSD) were then calculated (Tables 3.8 and 3.9).
Only the samplers deployed at Site 2 were recovered; those at Site 1 were not anchoredsufficiently and were swept away.
Table 3.8 Mean CTWA at Site 2 ( Crossness STW, 1999)
Site 2 Mean time weighted average concentration (ug/l)t (hrs) Cd Co Cu Mn Ni Pb Zn
48 0.002 0.119 2.40 15.9 2.81 0.31 7.7196 0.007 0.099 1.28 13.2 2.76 0.38 6.15144 0.006 0.092 1.41 10.5 3.02 0.18 5.99192 0.007 0.090 1.06 10.6 2.65 0.16 4.86240 0.008 0.095 1.32 11.1 3.04 0.13 6.02

SCIENCE REPORT: SC000062 – THE APPLICATION OF PASSIVE SAMPLING TECHNIQUES FOR WATERQUALITY MONITORING
30
Table 3.9 Sampling reproducibility at Site 2 (Crossness STW, 1999)
Discussion and conclusions
Similar conclusions can be drawn from this study to those found on the River Weyat Godalming. In addition, this study showed that DGTs function in estuarineenvironments which can be difficult to analyse for trace metals due to salinityvariations.
Site 2 %RSDt (hrs) Cd Co Cu Mn Ni Pb Zn
48 115 9.5 26 8.7 30 26 1096 28 5.4 9.2 11 6.0 48 11144 36 4.8 17 11 6.2 35 14192 13 9.9 8.3 13 6.0 59 4.9240 5.7 5.0 9.8 5.2 4.4 6.6 29

SCIENCE REPORT: SC000062 – THE APPLICATION OF PASSIVE SAMPLING TECHNIQUES FOR WATERQUALITY MONITORING
31
3.3 Thames Tideway PAH, London (1999–2002)Background and objectives
There is a clear link between urbanisation and the presence of PAHs in nearby aquaticand sedimentary environments (Taylor and Lester, 1995; Van Metre et al., 2000).However, most PAH assessment work has used sediment and suspended load materialrather than the dissolved, bioavailable fraction of the water column. This is because theaim was to identify the historical record of PAHs using a stratigraphic sedimentary profile,and also due to the practical difficulty of analysing dissolved PAH at trace levels.
Limited research has been conducted on the subject of dissolved PAH loads in tidal rivers(Prest et al., 1992). Further work is now necessary due to the forthcoming requirements ofthe Water Framework Directive.
With the objective of demonstrating the practical and regulatory applications of SPMDtechnology in a complex urban environment, a study was set up to evaluate:
• Spatial fluctuations in dissolved PAHs in an urban environment;
• Sampling reproducibility in SPMDs deployed in relatively freshwater bodies comparedwith those deployed in more saline conditions;
• The relative impact of point source discharges on PAH concentrations;
• The physical integrity of SPMDs in turbid, estuarine conditions.
The River Thames was chosen for this study because it runs through a major metropolisand because it gradually changes from freshwater conditions upstream to high salinity inthe lower reaches. Sodium chloride levels change from almost 0 to 35 parts per thousand.In addition, London remains one of the few major cities in the industrial world to retain anoperational combined sewer overflow (CSO) system. This means that storm water mixeswith untreated effluent during heavy rainfall and discharges into the central reaches of theThames Tideway. Such discharges contain high levels of contaminants and particulatematter. Collectively, these features make the Thames Tideway a unique and novel surveylocation for water quality assessments.
Sampling locations
To experience a wide range of water quality conditions, samplers were deployed at eightautomatic water quality monitoring stations (AWQMS) along a 55 km stretch of theThames Tideway (Figure 3.14) between Kew and Purfleet. These monitoring stationsdeliver real-time environmental data such as temperature, pH, dissolved oxygen andsalinity.

SCIENCE REPORT: SC000062 – THE APPLICATION OF PASSIVE SAMPLING TECHNIQUES FOR WATERQUALITY MONITORING
32
Figure 3.14 Sampling locations for the Thames Tideway PAH study
• Site 1. Kew Pier AWQMS (NGR: TQ 19070 77802) approximately 9 km east ofTeddington Lock, where the freshwater Thames ceases by default of the weir and lockinstallation. This site is essentially freshwater, as its exposure to estuarine water isnegligible. Land use around Kew is suburban with two large parks nearby. TheMogden STW at Isleworth is some 4 km west of Kew and is the main negativeinfluence on water quality.
• Site 2. The Polo AWQMS (NGR: TQ 22273 78175) consists of a small bargeanchored between Barnes and Hammersmith Bridges approximately 13 km east ofTeddington. The monitoring station is anchored just off the main channel and, likeKew, land uses on the banks are predominantly urban, with small parkland sectionsbordering the banks and with similar water quality.
• Site 3. Putney AWQMS (NGR: TQ 24054 75771) 12 km up river of London Bridge.This site has been the scene of large fish mortality incidents due to dissolved oxygenreductions caused by CSO discharges. Little industrial activity exists eitherimmediately east or west of this site and water quality is predominantly freshwater,although saline levels rise during spring tides. It is heavily influenced by dischargesfrom the Mogden STW.
• Site 4. Cadogan Pier AWQMS (NGR: TQ 27415 77589) located on the north bank ofthe Thames and 4.5 km east of Putney. The impact of occasional CSO dischargesfrom the nearby Western Pumping Station increases contaminant loading into the tidalzone at Cadogan (Crang A, personal communication).
• Site 5. Wapping AWQMS (NGR: TQ 34749 79957) based on the north bank of theriver 1 km east of London Bridge (Figure 3.15). Land use around this area isprincipally commercial (residential uses are compact) and the water is highly turbiddue to substantial sediment disturbance. Wapping is not exposed directly to the effectsof STW effluent output from Mogden, Beckton or Crossness, although plumes of CSOdischarge influence water quality from time to time (Environment Agency, 2002a).

SCIENCE REPORT: SC000062 – THE APPLICATION OF PASSIVE SAMPLING TECHNIQUES FOR WATERQUALITY MONITORING
33
Figure 3.15 Aerial view of River Thames at Tower Bridge close to Site 5
• Site 6. Greenwich AWQMS (NGR: TQ 38290 77983) located approximately 7.4 kmdown river of London Bridge (Figure 3.16). The site is again turbid and within the directtidal range of the effluent discharged from the Crossness and Beckton STWs. Themain channel at Greenwich is dredged occasionally and this activity may cause PAHremobilisation. Greenwich itself has a history of contamination derived from industrialactivity on the banks, although it is difficult to determine its current impact on currentwater quality.
Figure 3.16 Aerial view of River Thames at Greenwich
• Site 7. Crossness AWQMS (NGR: TQ 48948 81120) located approximately 400 mwest of the Crossness STW outfall between Woolwich and Dartford. Combined withBeckton STW outfall on the opposite side of the river, this area experiences the mostconcentrated source of aquatic contamination into the Thames Tideway. It alsorepresents one of the most concentrated point sources of contamination into acontrolled water in western Europe (Lloyd P, personal communication). Water analysis

SCIENCE REPORT: SC000062 – THE APPLICATION OF PASSIVE SAMPLING TECHNIQUES FOR WATERQUALITY MONITORING
34
undertaken in the area suggests that the point sources produce virtually all thedeterminands.
• Site 8. Purfleet AWQMS (NGR: TQ 56540 76929) located on the north bank of thetideway by the QEII Dartford Bridge. Monitoring apparatus based there is within thedirect tidal range of the Crossness STW and Beckton STW outfalls. Lubricants appliedto the pier rollers may influence PAH levels in the immediate vicinity of the platform.
Passive sampler deploymentMultiple SPMDs were deployed at each site using spider cage holders. These were keptin place by being tethered to the monitoring stations and, where required, with buoysattached to maintain the samplers at a constant depth exposed during the tidal cycle.
Atmospheric field blanks were to provide a background correction for exposure duringdeployment. Water temperature data were collected from the monitoring stations.
The samplers were deployed for 28 days at a time during March 1999, March 2000,March 2001 and March 2002. In March 2002, the samplers were only recovered from sites1, 2, 3, 4 and 8. After removal, the devices were rinsed quickly with distilled water toremove any loose debris and then placed in clean, vapour-tight containers and frozenprior to analysis.
Other monitoring carried outData from the AWQMS were collected.
ResultsAll SPMDs (excluding those that showed any damage) and field blanks were analysed atthe NLS in Leeds according to the USGS method described in Section 2.1.
The results were corrected against the blanks and the TWA concentrations (ng/l))calculated using the USGS-estimated water concentration calculator (Alvarez D A,personal communication). Mean CTWA (ng/l) and sample reproducibility (RSD) for SPMDsdeployed in triplicate were then calculated. The results for various PAHS are shown inFigures 3.17–31 and Table 3.10.
Figure 3.17 Acenaphthene mean CTWA (Thames Tideway, 1999–2002)
Acenaphthene, Thames Tideway
0.0
0.2
0.4
0.6
0.8
1.0
1.2
Mea
n C
twa
(ng/
l)
1999 0.3 0.3 0.3 0.1 0.2 0.2 0.1
2000 0.4 0.6 0.5 0.4 0.3 0.1 0.1
2001 0.5 0.8 0.4 0.9 1.1 0.4 0.1
2002 0.2 0.2 0.1 0.2 0.4 0.3
Site 1 Site 2 Site 3 Site 4 Site 5 Site 6 Site 7 Site 8

SCIENCE REPORT: SC000062 – THE APPLICATION OF PASSIVE SAMPLING TECHNIQUES FOR WATERQUALITY MONITORING
35
Figure 3.18 Acenaphthylene mean CTWA (Thames Tideway, 1999–2002)
Figure 3.19 Anthracene mean CTWA (Thames Tideway, 1999–2002)
Figure 3.20 Benzo [a] anthracene mean CTWA (Thames Tideway, 1999–2002)
Acenaphthylene, Thames Tideway
0.0
0.2
0.4
0.6
0.8
Mea
n C
twa
(ng/
l)
1999 0.1 0.2 0.2 0.2 0.2 0.1 0.4
2000 0.6 0.7 0.5 0.5 0.3 0.2 0.1
2001 0.2 0.5 0.3 0.5 0.4 0.3 0.1
2002 0.1 0.1 0.1 0.2 0.1 0.2
Site 1 Site 2 Site 3 Site 4 Site 5 Site 6 Site 7 Site 8
Anthracene, Thames Tideway
0.0
1.0
2.0
3.0
4.0
5.0
Mea
n C
twa
(ng/
l)
1999 0.2 0.2 0.2 0.1 0.2 0.2 0.1
2000 0.5 0.5 0.4 0.4 0.2 0.1 0.1
2001 0.3 0.7 0.4 0.2 0.6 0.4 0.2
2002 0.4 0.5 4.5 0.9 0.5 0.3
Site 1 Site 2 Site 3 Site 4 Site 5 Site 6 Site 7 Site 8
Benzo [a] anthracene, Thames Tideway
0.0
2.0
4.0
6.0
8.0
10.0
Mea
n C
twa
(ng/
l)
1999 4.4 5.2 3.4 2.8 2.8 2.4 1.8
2000 3.2 3.8 3.7 4.2 3.0 2.5 1.3
2001 2.0 5.5 2.6 3.4 4.5 3.5 1.7
2002 3.9 7.2 5.8 7.9 4.2 0.6
Site 1 Site 2 Site 3 Site 4 Site 5 Site 6 Site 7 Site 8

SCIENCE REPORT: SC000062 – THE APPLICATION OF PASSIVE SAMPLING TECHNIQUES FOR WATERQUALITY MONITORING
36
Figure 3.21 Benzo [a] pyrene mean CTWA (Thames Tideway, 1999–2002)
Figure 3.22 Benzo [b] fluoranthene mean CTWA (Thames Tideway, 1999–2002)
Figure 3.23 Benzo [ghi] perylene mean CTWA (Thames Tideway, 1999–2002)
Benzo [a] pyrene, Thames Tideway
0.02.04.06.08.0
10.012.014.0
Mea
n C
twa
(ng/
l)
1999 1.9 2.2 1.9 1.8 2.2 2.1 2.2
2000 0.3 1 0.9 1 0.9 1 0.9
2001 0.5 1.1 0.7 0.9 0.8 0.7 2.1
2002 6.2 6.4 12.5 7.1 5.9 1.3
Site 1 Site 2 Site 3 Site 4 Site 5 Site 6 Site 7 Site 8
Benzo [b] fluoranthene, Thames Tideway
0.0
2.0
4.0
6.0
8.0
Mea
n C
twa
(ng/
l)
1999 4.6 5.7 4.4 4.2 5.2 5.1 4.9
2000 1.1 3.5 3.3 4.4 2.5 2.6 2.4
2001 1.7 3.9 1.8 2.5 2.4 1.8 5.5
2002 3.8 5.5 6.6 5.1 3.2 1.1
Site 1 Site 2 Site 3 Site 4 Site 5 Site 6 Site 7 Site 8
Benzo [ghi] perylene, Thames Tideway
0.0
1.0
2.0
3.0
4.0
5.0
Mea
n C
twa
(ng/
l)
1999 1.0 1.1 0.8 1.0 1.1 0.9 0.8
2000 0.8 0.8 0.8 0.8 0.9 0.8 0.7
2001 0.2 0.5 0.5 0.3 0.2 0.2 0.8
2002 3.4 1.7 23.3 3.8 2.4 0.9
Site 1 Site 2 Site 3 Site 4 Site 5 Site 6 Site 7 Site 8

SCIENCE REPORT: SC000062 – THE APPLICATION OF PASSIVE SAMPLING TECHNIQUES FOR WATERQUALITY MONITORING
37
Figure 3.24 Benzo [k] fluoranthene mean CTWA (Thames Tideway, 1999–2002)
Figure 3.25 Chrsyene mean CTWA (Thames Tideway, 1999–2002)
Figure 3.26 Dibenzo [ah] anthracene mean CTWA, (Thames Tideway, 1999–2002)
Benzo [k] fluoranthrene, Thames Tideway
0.0
1.0
2.0
3.0
4.0
5.0
6.0
Mea
n C
twa
(ng/
l)
1999 1.3 1.5 1.1 1.0 1.2 1.4 1.2
2000 0.8 1.1 1.2 1.2 0.9 1.0 0.9
2001 0.5 1.0 0.5 0.7 0.7 0.5 1.3
2002 3.0 4.2 5.8 3.9 2.0 0.9
Site 1 Site 2 Site 3 Site 4 Site 5 Site 6 Site 7 Site 8
Chrysene, Thames Tideway
0.0
4.0
8.0
12.0
16.0
Mea
n C
twa
(ng/
l)
1999 4.2 4.9 3.1 2.9 2.9 2.4 1.9
2000 2.9 3.9 3.8 3.5 7.3 6.1 3.6
2001 3.1 15.5 9.3 9.4 5.8 4.8 8.0
2002 7.0 12.8 9.8 13.7 8.3 1.6
Site 1 Site 2 Site 3 Site 4 Site 5 Site 6 Site 7 Site 8
Dibenzo [ah] anthracene, Thames Tideway
0.0
1.0
2.0
3.0
4.0
Mea
n C
twa
(ng/
l)
1999 0.5 0.7 0.4 0.5 0.5 0.4 0.6
2000 0.0 0.1 0.0 0.0 0.0 0.0 0.0
2001 0.1 0.2 0.1 1.0 0.1 0.1 0.4
2002 0.5 0.7 3.5 0.7 0.4 0.1
Site 1 Site 2 Site 3 Site 4 Site 5 Site 6 Site 7 Site 8

SCIENCE REPORT: SC000062 – THE APPLICATION OF PASSIVE SAMPLING TECHNIQUES FOR WATERQUALITY MONITORING
38
Figure 3.27 Fluoranthene mean CTWA (Thames Tideway, 1999–2002)
Figure 3.28 Fluorene mean CTWA (Thames Tideway, 1999–2002)
Figure 3.29 Indeno [123-cd] perylene mean CTWA (Thames Tideway, 1999–2002)
Fluoranthene, Thames Tideway
0.0
5.0
10.0
15.0
Mea
n C
twa
(ng/
l)
1999 10.8 14.1 10 7.8 10.8 10.8 7.1
2000 7 9.4 8.1 8.5 6.9 8.2 4.7
2001 4.6 8.9 4.8 6.6 9.3 8.6 5.1
2002 7.0 11.2 8.2 12.0 10.3 4.6
Site 1 Site 2 Site 3 Site 4 Site 5 Site 6 Site 7 Site 8
Fluorene, Thames Tideway
0.0
0.2
0.4
0.6
0.8
1.0
1.2
Mea
n C
twa
(ng/
l)
1999 0.5 0.5 0.4 0.2 0.3 0.2 0.2
2000 0.5 0.5 0.4 0.4 0.2 0.1 0.1
2001 0.6 0.8 0.5 1.0 0.9 0.3 0.0
2002 0.3 0.3 0.2 0.6 0.4 0.7
Site 1 Site 2 Site 3 Site 4 Site 5 Site 6 Site 7 Site 8
Indeno [123-cd] perylene, Thames Tideway
0.0
1.0
2.0
3.0
4.0
Mea
n C
twa
(ng/
l)
1999 0.7 0.6 0.5 0.7 0.8 0.6 0.6
2000 0.3 0.3 0.3 0.2 0.2 0.2 0.2
2001 0.2 0.4 0.2 0.3 0.2 0.2 0.7
2002 2.3 2.2 7.9 2.5 0.8 0.6
Site 1 Site 2 Site 3 Site 4 Site 5 Site 6 Site 7 Site 8

SCIENCE REPORT: SC000062 – THE APPLICATION OF PASSIVE SAMPLING TECHNIQUES FOR WATERQUALITY MONITORING
39
Figure 3.30 Phenanthrene mean CTWA (Thames Tideway, 1999–2002)
Figure 3.31 Pyrene mean CTWA (Thames Tideway, 1999–2002)
Table 3.10 Sample reproducibility (Thames Tideway, 2002)
Phenanthrene, Thames Tideway
0.0
1.0
2.0
3.0
4.0
5.0
Mea
n C
twa
(ng/
l)
1999 1.5 1.4 1.3 0.9 1.1 0.9 0.6
2000 2.3 2.7 2.1 2 0.9 0.7 0.7
2001 2.1 3.9 2.6 3.4 3.4 1.1 0.6
2002 1.5 1.5 2.4 3.2 1.5 4.7
Site 1 Site 2 Site 3 Site 4 Site 5 Site 6 Site 7 Site 8
Pyrene, Thames Tideway
0.0
10.0
20.0
30.0
40.0
50.0
Mea
n C
twa
(ng/
l)
1999 30.1 45.5 35 32.2 33.6 23.1 16.1
2000 2.8 22.4 23.4 26.2 24.1 21.1 6.3
2001 9.4 15 8.2 9.3 13.7 12 8.2
2002 16.8 31.6 22.7 34.5 29.0 5.0
Site 1 Site 2 Site 3 Site 4 Site 5 Site 6 Site 7 Site 8
%RSDSite 1 Site 2 Site 3 Site 4 Site 8
Acenapthene 0.0 0.0 0.0 14.5 13.4Acenaphthylene 0.0 0.0 0.0 1.3 9.1
Anthracene 0.0 12.4 0.0 6.5 1.3Benzo [a] anthracene 8.3 2.8 8.6 6.0 2.7
Benzo [a] pyrene 14.3 17.6 9.1 2.5 3.0Benzo [b] fluoranthene 9.9 6.6 11.9 8.7 0.2
Benzo [ghi] perylene 9.1 59.7 1.8 5.8 0.4Benzo [k] fluoranthene 12.5 7.2 13.3 9.3 2.8
Chrysene 8.4 3.3 5.8 4.3 2.0Dibenzo [ah] anthracene 21.7 8.7 4.1 9.4 7.2
Fluoranthene 8.1 5.0 14.6 4.7 3.0Fluorene 0.0 0.0 0.0 8.8 13.2
Indeno [1,2,3-cd] pyrene 21.8 16.4 6.3 7.5 0.5Phenanthrene 6.7 3.8 8.8 10.1 0.0

SCIENCE REPORT: SC000062 – THE APPLICATION OF PASSIVE SAMPLING TECHNIQUES FOR WATERQUALITY MONITORING
40
Discussion and conclusions
The surveys during 1999–2002 found that PAH levels in the Thames were generallypresent at trace levels and thus have only a small environmental impact.
London has a combined drainage system with sewage and surface water collected in thesame system. During dry weather, the entire contents of the sewerage system flow to thetwo large sewage works at Crossness and Beckton for treatment. However, moderaterainfall quickly fills the network and sewage spills to the river via 57 overflows. Manythousands of tonnes (an average 20,000,000 tonnes per year) of sewage and rainwaterare discharged to the river every week. PAHs from road run-off and other sewage-derivedsources therefore enter the river frequently, washing up and down with the tide, which hasa 15 km range. Another likely source of PAHs in the Thames is atmospheric deposition.
The distribution of PAH in the Thames may be explained by the molecular weight of thedifferent PAH isomers. Lighter PAHs (e.g. acenapthylene, acenaphthene and fluorene)may be lost to the atmosphere and more easily broken down during sewage treatment.High molecular weight PAHs (e.g. benzo [ghi] perylene) are more likely to bind tosediment and organic matter, and are therefore less likely to be picked up by SPMD.Intermediate weight PAHs (e.g. pyrene) show a distribution pattern more closelyresembling the areas of point discharges from sewage treatment works (Mogden in theupper Tideway, and Crossness and Beckton in the middle reaches).
The surveys highlighted the need for robust and well-designed deployment apparatus formonitoring environments with high flows and highly turbid and abrasive water.

SCIENCE REPORT: SC000062 – THE APPLICATION OF PASSIVE SAMPLING TECHNIQUES FOR WATERQUALITY MONITORING
41
3.4 Avenue Coking Works, River Rother, Derbyshire(2000)Background and objectives
The former Avenue Coking facility (Figure 3.32) and adjacent tar lagoons along the RiverRother near Chesterfield, Derbyshire, were chosen for investigation because of the knownpollution of the river from these sites including hydrocarbons, phenols, heavy metals andexcessive levels of ammoniacal nitrogen.
The River Rother carries water from a range of contaminant sources including twosewage treatment facilities in the northern part of the catchment at Tupton andDanesmoor. The Environment Agency and the East Midlands Development Board(EMDA) have examined a range of options for monitoring water quality along the river.Previous studies (National Rivers Authority, 1990/91/92; Environment Agency, 1996a andalso 1996b found that the site had been responsible for previous contamination of theRiver Rother. These studies suggested that the water quality of the Rother deterioratedalong the length of the river, although it recovered slightly before its confluence with theRiver Hipper. As a whole, the catchment is classified as between poor or bad based onGQA criteria.
Figure 3.32 Disused coal bunker structures and other contaminated productionfacilities at the Avenue Coking Works
Field trials were set up to determine whether SPMDs could be used as part of a targetedmonitoring study to measure PAH levels quantitatively in the River Rother. The mainobjectives of the study were to:
• Measure the spatial distribution of PAH homologues along the River Rother betweenthe parishes of Tupton and Birdholme;
• Assess the relative impact of contamination derived from the former Avenue Cokingworks on the River Rother.

SCIENCE REPORT: SC000062 – THE APPLICATION OF PASSIVE SAMPLING TECHNIQUES FOR WATERQUALITY MONITORING
42
Sampling locationsFive sampling locations were selected (Figure 3.33).
Figure 3.33 Sampling locations for the Avenue Coking Works studySource: Ordnance Survey. Crown Copyright. Licence reference: NC/03/16457.
• Site 1 is at a footbridge (NGR: SK 40088 65497) some 600 m east of Tupton and nextto the London to Leeds railway line. The river at this location is little more than a

SCIENCE REPORT: SC000062 – THE APPLICATION OF PASSIVE SAMPLING TECHNIQUES FOR WATERQUALITY MONITORING
43
stream approximately 2 m wide and 0.5 m deep, with a moderate flow rate. Thechannel bed is covered with a mixture of sediment and gravel.
• Site 2 (NGR: SK 39814 67088) is at the south-east corner of the Avenue CokingWorks, approximately 1.5 km downstream of Site 1 and where the river is crossed bya small road called Mill Lane. The channel here is wider and deeper, approximately2.5 m wide and about 0.6 m deep at the point of deployment, largely due to theaddition of Redleadmill Brook and several other small tributaries.
• Site 3 (NGR: SK 39338 68276) is close to the entry point of a surface drainagechannel from the Avenue Coking Works, about 1.5 km downstream of Site 2, and nextto the London to Leeds railway line. The stream is, on average, 2.8 m wide at thispoint and about 0.6 m deep.
• Site 4 (NGR: SK 39009 68440) is about 350 m downstream of Site 3 on a section ofthe river that has been re-routed to avoid contaminant seepage through the retainingbunds of the tar lagoons directly to the south. Despite this remedial measure, pollutionhas seeped beyond the former channel and entered the new channel. The river here isaround 2 m wide and 0.4–0.7 m deep. Plumes of organic pollution were observedseeping up from the river sediment while the SPMD apparatus was being deployed(Figure 3.34).
Figure 3.34 Contamination seeping from disturbed sediment (arrowed) during thedeployment of SPMD samplers at Site 4
• Site 5. A bridge (NGR: SK 38534 69665) close to Storforth Industrial Estate about 1km downstream from where Birdholme Brook joins the River Rother. This site wouldmeasure any attenuation of contaminants due to the influx from Birdholme Brook. Theriver here is at least 5 m wide and 1 m deep.
Passive sampler deploymentTwo SPMDs were deployed at each site using spider cage holders, which were kept inplace by either being tethered to land-based fixtures near the river such as bridges ortrees, or anchored with concrete blocks placed in the river. At Site 4, care was taken toensure the samplers did not come into contact with the heavily contaminated silt on theriver bed.
The temperature at each site was measured during deployment and atmospheric fieldblanks were kept to provide a background correction for exposure during deployment.Given the observation of pollution during the field deployment (Figure 3.36), a survey

SCIENCE REPORT: SC000062 – THE APPLICATION OF PASSIVE SAMPLING TECHNIQUES FOR WATERQUALITY MONITORING
44
period of 14 days was chosen to prevent the devices being saturated by contaminants.However, prolonged heavy rainfall during the period of deployment made it unsafe toenter the River Rother to recover the monitoring apparatus. Having waited a further sevendays, the devices were recovered from their respective monitoring sites. It was notpossible to measure flow rates along the river due to the intense rainfall, but localhydrologists estimated an approximate three-fold increase in flow occurred during thisperiod (Potter H, personal communication). After removal, the devices were rinsedimmediately with distilled water to remove any loose debris and then placed in clean,vapour-tight containers and frozen prior to analysis.
Other monitoring carried outNone
ResultsAll SPMDs (excluding those that showed any damage) and field blanks were analysed forPAHs at the NLS in Leeds according to the USGS method (see Section 2.1). The resultswere corrected against the blanks and the TWA concentrations (ng/l) calculated using theUSGS-estimated water concentration calculator (Alvarez D A, personal communication).The PAH mean CTWA was then calculated (Table 3.11).
Table 3.11 PAH mean TWA concentrations (River Rother, 2000)
Discussion and conclusionsThe River Rother around the Avenue Coking Works is highly contaminated with PAHs.These high levels appeared to affect the sampling reproducibility of the SPMDs adversely.However, the deposition of disturbed sediment material caused by high storm flows islikely to have had a major affect on sampling. When such conditions are likely to beencountered, SPMDs will become less effective unless well protected in a housing whichcan attenuate high flow rates and keep the majority of suspended solids from impactingthem.
PAH Mean C twa (ng/l) Site 1 Site 2 Site 3 Site 4 Site 5
Acenaphthene 2.4 4.9 6.8 155 63Acenaphthylene 7.3 0.7 1.1 25 5
Anthracene 24 2.6 3.2 14 11Benzo [a] anthracene 17 1.7 2.1 5.2 6.3
Benzo [a] pyrene 1.9 0.4 0.3 1.4 2.2Benzo [ghi] perylene 0.6 0.25 0.2 0.5 0.7
Benzo [k] fluoranthene 1.1 0.3 0.2 0.8 1.2Chrysene 18 2.3 2.4 4.4 5.4
Fluoranthene 108 15 20 53 65Fluorene 8.9 1.9 2.8 42 20
Indeno [1,2,3-cd] pyrene 0.2 0.1 0.1 0.2 0.4Phenanthrene 23 4.0 5.9 23 17
Pyrene 46 10.1 14 31 40

SCIENCE REPORT: SC000062 – THE APPLICATION OF PASSIVE SAMPLING TECHNIQUES FOR WATERQUALITY MONITORING
45
3.5 Cranleigh Brick and Tile Works, River Wey, Surrey(2000)Background and objectives
In October 2000, the substantial rainfall experienced by south-east England resulted inlocalised flooding and high water levels on many rivers, reservoirs and storage lagoons.Cranleigh Brick and Tile Works near the village of Cranleigh in Surrey has two settlinglagoons (Figure 3.35). These lagoons discharge into Collins Brook, which flows intoCranleigh Waters, part of the River Wey catchment.
Both the settling lagoons contain high levels of metals derived from site run-off,particularly dissolved zinc and cadmium. The site operated a munitions facility during theSecond World War resulting in significant contamination. The scale of the contaminationmeans that little remedial work can be undertaken without substantial expenditure. Whenthe lagoons reach maximum capacity, they are discharged into Cranleigh Waters toprevent uncontrolled overflow into the water catchment.
Figure 3.35 Aerial photograph of the Cranleigh Brick and Tile Works, with the twosettling lagoons to the left (Environment Agency)
In order to undertake an emergency discharge, the Environment Agency is required tomonitor the river at various sites throughout the local catchment area. Following anunscheduled request for operational monitoring support from one of its EnvironmentManagement teams, DGTs were selected as a possible technique to evaluate metal loadfluctuations upstream and downstream of the Cranleigh Brick and Tile Works.
This study provided an opportunity to develop and extend the scope of passive monitoringusing DGT samplers. The aims of this study were to:
• Establish whether passive samplers could be used for operational pollution incidentsat short notice;
• Analyse replicate sampler groups at two independent laboratory facilities.• Determine the reliability of DGT monitoring in waters that have high metal
concentrations (e.g. in excess of trigger levels determined under the DangerousSubstances Directive).
Settling lagoons

SCIENCE REPORT: SC000062 – THE APPLICATION OF PASSIVE SAMPLING TECHNIQUES FOR WATERQUALITY MONITORING
46
Sampling locationsFive sample locations were selected (Figure 3.36).
Figure 3.36 Sampling locations for Cranleigh Brick and Tile Works studySource: Ordnance Survey. Crown Copyright. Licence reference: NC/03/16457.
• Site 1. Cranleigh Brick and Tile Works (NGR: TQ 07037 35480) (CB&T on Figure3.36).
• Site 2. Cranleigh Waters upstream of Collins Brook (NGR: TQ 07342 36345) andunaffected by contaminated water from Site 1.
• Site 3. Collins Brook (NGR: TQ 07294 36202) (Figure 3.37), which carriescontaminated water from the overflow point at the lagoons on the Cranleigh Brick andTile works.
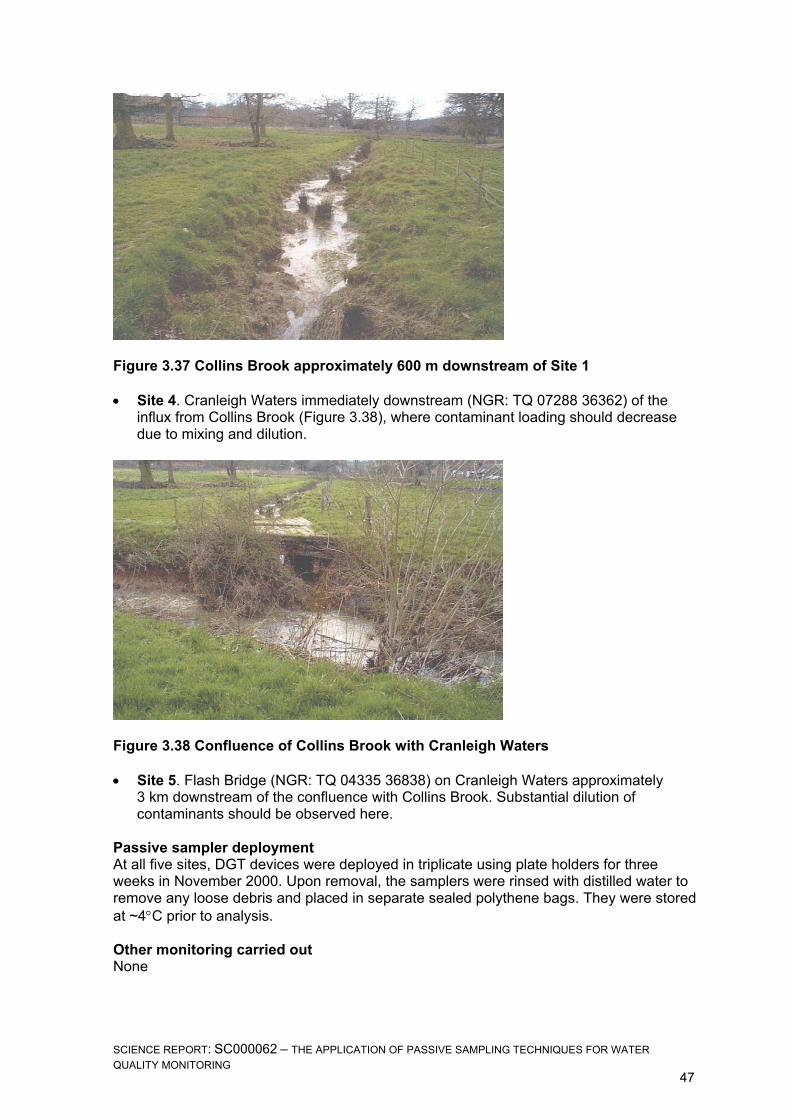
SCIENCE REPORT: SC000062 – THE APPLICATION OF PASSIVE SAMPLING TECHNIQUES FOR WATERQUALITY MONITORING
47
Figure 3.37 Collins Brook approximately 600 m downstream of Site 1
• Site 4. Cranleigh Waters immediately downstream (NGR: TQ 07288 36362) of theinflux from Collins Brook (Figure 3.38), where contaminant loading should decreasedue to mixing and dilution.
Figure 3.38 Confluence of Collins Brook with Cranleigh Waters
• Site 5. Flash Bridge (NGR: TQ 04335 36838) on Cranleigh Waters approximately3 km downstream of the confluence with Collins Brook. Substantial dilution ofcontaminants should be observed here.
Passive sampler deploymentAt all five sites, DGT devices were deployed in triplicate using plate holders for threeweeks in November 2000. Upon removal, the samplers were rinsed with distilled water toremove any loose debris and placed in separate sealed polythene bags. They were storedat ~4°C prior to analysis.
Other monitoring carried outNone

SCIENCE REPORT: SC000062 – THE APPLICATION OF PASSIVE SAMPLING TECHNIQUES FOR WATERQUALITY MONITORING
48
Results
Analysis of replicate sampler groups was carried out at two independent laboratoryfacilities:
• Environment Agency NLS at Waterlooville;• Institute of Environmental and Natural Sciences at Lancaster University.
Both laboratories followed the same method (see Section 2.2). The mean TWAconcentration (µg/l) and sample reproducibility (%RSD) were calculated for cadmium,copper, nickel, lead and zinc at all five sites. The results are summarised in Tables 3.12and 3.13 and Figures 3.39–3.43. A comparison of sample reproducibility is shown inFigure 3.46.
Table 3.12 Mean CTWA and sample reproducibility obtained by NLS Waterlooville(Cranleigh Waters, 2000)
Table 3.13 Mean CTWA and sample reproducibility obtained by Lancaster University(Cranleigh Waters, 2000)
C twa C twa C twa C twa C twa(ug/l) %RSD (ug/l) %RSD (ug/l) %RSD (ug/l) %RSD (ug/l) %RSD
Site 1 1.09 17 1.88 6.9 24.9 15 0.17 17 2279 14Site 2 2.14 61 1.42 23 15.2 11 0.05 14 3251 51Site 3 0.02 4.0 1.14 0.6 2.83 4.7 0.06 24 10.1 27Site 4 0.28 3.5 1.21 4.0 3.58 5.3 0.06 29 349 3.5Site 5 0.24 3.1 1.43 3.6 4.93 0.4 0.17 13 256 5.1
ZnCd Cu Ni Pb
C twa C twa C twa C twa C twa(ug/l) %RSD (ug/l) %RSD (ug/l) %RSD (ug/l) %RSD (ug/l) %RSD
Site 1 1.07 4.8 1.68 2.6 29.0 0.9 0.16 5.3 1610 1.2Site 2 1.85 58 1.15 18 15.2 9.3 0.05 14 2054 49Site 3 0.01 11 1.10 0.4 2.97 2.2 0.05 15 3.55 3.5Site 4 0.23 8.5 1.11 6.4 3.73 4.9 0.07 4.8 225 3.6Site 5 0.19 4.7 1.33 3.0 5.31 4.0 0.14 7.1 164 2.9
ZnCd Cu Ni Pb

SCIENCE REPORT: SC000062 – THE APPLICATION OF PASSIVE SAMPLING TECHNIQUES FOR WATERQUALITY MONITORING
49
Cadmium
Figure 3.39 Cadmium mean CTWA (Cranleigh Waters, 2000)Copper
Figure 3.40 Copper mean CTWA (Cranleigh Waters, 2000)
Nickel
Figure 3.41 Nickel mean CTWA (Cranleigh Waters, 2000)
0.0
5.0
10.0
15.0
20.0
25.0
30.0
35.0
Site 1 Site 2 Site 3 Site 4 Site 5
Ni M
ean
C tw
a (u
g/l)
EA-NLS
LancasterUniversity
0.00
0.40
0.80
1.20
1.60
2.00
Site 1 Site 2 Site 3 Site 4 Site 5
Cu
Mea
n C
twa
(ug/
l)
EA-NLS
LancasterUniversity
0.00
0.50
1.00
1.50
2.00
2.50
Site 1 Site 2 Site 3 Site 4 Site 5
Cd
Mea
n C
twa
(ug/
l)
EA-NLS
LancasterUniversity

SCIENCE REPORT: SC000062 – THE APPLICATION OF PASSIVE SAMPLING TECHNIQUES FOR WATERQUALITY MONITORING
50
Lead
Figure 3.42 Lead mean CTWA (Cranleigh Waters, 2000)
Zinc
Figure 3.43 Zinc mean CTWA (Cranleigh Waters, 2000)
0.000.020.040.060.080.100.120.140.160.18
Site 1 Site 2 Site 3 Site 4 Site 5
Pb M
ean
C tw
a (u
g/l)
EA-NLS
LancasterUniversity
0
500
1000
1500
2000
2500
3000
3500
Site 1 Site 2 Site 3 Site 4 Site 5
Zn M
ean
C tw
a (u
g/l)
EA-NLS
LancasterUniversity

SCIENCE REPORT: SC000062 – THE APPLICATION OF PASSIVE SAMPLING TECHNIQUES FOR WATERQUALITY MONITORING
51
Comparison of sample reproducibility
Figure 3.44 Comparison of DGT sample reproducibility (Cranleigh Waters, 2000)
Discussion and conclusions
The DGT survey was successful in monitoring the situation in Cranleigh Waters andidentifying the impact due the brickworks
The DGTs also functioned in a highly contaminated environment, although the high levelsfound raised concerns over possible saturation of the resin.
Inter-laboratory differences in the results (Figure 3.44) show that strict analyticalprocedures are required to avoid magnification of errors.
0
10
20
30
40
50
60
70
Site 1 Site 2 Site 3 Site 4 Site 5
%R
SD
Cd EA-NLS
Cd LU
Cu EA-NLS
Cu LU
Ni EA-NLS
Ni LU
Pb EA-NLS
Pb LU
Zn EA-NLS
Zn LU
SCIENCE REPORT: SC000062 – THE APPLICATION OF PASSIVE SAMPLING TECHNIQUES FOR WATERQUALITY MONITORING
52
3.6 Pharmaceutical in STW Effluents,Northamptonshire (2002)
Background and objectivesThe identification and relative impact of pharmaceutical contaminants in the environmentis a subject of increasing scientific awareness and debate (Hilton et al., 2003; Liu andRiddle, 2004). However, the measurement of these polar compounds in effluent isgenerally limited to high-volume spot sampling techniques.
POCIS has been identified as a technique that can be employed to sequester tracecontaminants in the environment (Alvarez thesis, 1999 and Alvarez 2004). Unlike theSPMD technique (Huckins at al., 1993), the POCIS configuration for pharmaceuticalmonitoring uses the Oasis HLB sequestration medium to concentrate target analytes in-situ in an integrated manner during the deployment period.
An Environment Agency study undertaken by the Centre for Environment, Fisheries andAquaculture Science (CEFAS) (Hilton et al., 2003) examined the presence of a number ofpharmaceutical compounds (Table 3.14). All the target compounds (other thanparacetamol, clofibric acid and tamoxifen) were identified in the wastewater effluent and/orreceiving waters at some stage during the study. [clofibric acid is not in the list in thetable] [Please give any other alternative namesused in the text for the compoundsin Table 3.14 (acetaminophen has been added for paracetamol.]
Table 3.14 Target compounds for CEFAS pharmaceutical studies
Compound Typical UseSulfamethoxazole AntibacterialTrimethoprim AntibacterialErythromycin AntibacterialDiclofenac Anti-inflammatoryMefenamic acid Anti-inflammatoryIbuprofen Anti-inflammatoryParacetamol (acetaminophen) AnalgesicDextropropoxyphene AnalgesicPropanolol Beta-blockerTamoxifen Non steroidal anti-estrogen
Unlike most of the other operational investigations undertaken during this study, POCISunits were deployed during a period when a conventional sampling strategy was alsounderway. The CEFAS report had not been published at the time of sampling for thisstudy.
The aims of this study were to:
• Investigate whether this novel sampling method would detect pharmaceuticalcompounds in three different sewage effluents;
• Deploy the POCIS units where relative fluctuations of analyte concentration wouldinevitably occur;
• Establish laboratory extraction techniques and instrumental identification protocols forthe compounds of interest;
• Compare the data derived from the CEFAS study with the data obtained from thePOCIS analysis.

SCIENCE REPORT: SC000062 – THE APPLICATION OF PASSIVE SAMPLING TECHNIQUES FOR WATERQUALITY MONITORING
53
Sampling locationsThe sewage effluent outfalls at the Corby, East Hyde and Ryemeads STWs inNorthamptonshire were selected for this trial. They were deployed in May, June and July2002. Further site details are given in the Environment Agency technical report P6-012/06(Hilton et al., 2003).
Passive sampler deploymentDuring the deployment at each site, the POCIS unit was removed from an airtight storagetin and harnessed to the effluent trap/channel using iron chains (Figure 3.45). PRCSPMDs were also attached to the main POCIS units and a field blank POCIS wasexposed to ensure that any atmospheric or transport contamination influences wereidentified post-analysis.
Figure 3.45 POCIS samplers being deployed at East Hyde STW
The equipment was left in-situ for 28 days, after which it was recovered and repackaged.New samplers were then deployed at each respective site (the recovery andredeployment process took no more than about 3 minutes). The used samplers wereshipped immediately to the US Geological Survey’s Columbia Environmental ResearchCenter for basic analyte extraction. This process was undertaken three times.
Laboratory method development
Extraction of POCIS (recovery of analytes)Each POCIS was removed from its deployment canister and rinsed carefully with water toremove any debris (Figure 3.46). The POCIS units were opened carefully by removing thethumb screws and wing nuts while holding the device horizontally. The contents of thePOCIS were then transferred (rinsed) with methanol into 1 cm (internal diameter) glasschromatography columns fitted with a glass wool plug and stopcock (Figure 3.47). Themethanol used to rinse the sorbent into the columns was collected in the same flask aswas used to collect the extraction solvent. Once the sorbent had been transferred into thecolumns, the membrane disks were discarded.

SCIENCE REPORT: SC000062 – THE APPLICATION OF PASSIVE SAMPLING TECHNIQUES FOR WATERQUALITY MONITORING
54
Solvent extraction (elution) of sorbent analytes was achieved by adding 40 ml of methanolto the glass column and adjusting the stopcock to a near dropwise flow. The collectedeluate was concentrated by rotary evaporation to approximately 1 ml. The sample wasthen transferred quantitatively through a pre-rinsed filter into labelled test tubes. Allglassware was silanised prior to use to minimise the loss of the analytes throughadsorption onto the surface of the glassware. The extracts were then shipped to NLSLlanelli for analysis.
Figure 3.46 Dismantling of POCIS units fromdeployment apparatus
Figure 3.47 Extraction of analytesfrom sorbents
AnalysisAnalysis and quantification of all compounds was performed using liquid chromatographycoupled with electrospray mass spectrometry (single quad). Tandem mass spectrometry(ion trap MS/MS) was used for confirmation.
High performance liquid chromatographyHPLC was carried out on an Agilent 1110 series system. Three solvent gradients wereused (Tables 3.15–3.17).
The first gradient was used to separate erythromycin, sulfamethoxazole, trimethoprim,propranolol, dextropropoxyphene, diclofenac and tamoxifen on a 250 mm × 2.1 mm LunaC18(2) 5 µm column using a buffered water/methanol mobile phase. The flow rate was200 µl/min, with a run time of 35 minutes and a re-equilibration time of 15 minutes at initialgradient conditions.
The second gradient was used to separate ibuprofen and mefenamic acid, while the thirdgradient was for acetaminophen. A 150 mm × 2.1 mm Zorbax Bonus RP 5 um columnwith the same buffered water/methanol mobile phase was used for the second and thirdgradients. The flow rate was 500 µl/min, with a run time of 20 minutes and a re-equilibration time of 10 minutes at initial gradient conditions.
Calibration standards were prepared in 50:50 methanol: ammonium formate (pH 5.5) atconcentrations of 0.1, 0.2, 0.4, 1.0, 2.0 and 4 ng on column for each compound.

SCIENCE REPORT: SC000062 – THE APPLICATION OF PASSIVE SAMPLING TECHNIQUES FOR WATERQUALITY MONITORING
55
Time Solvent A Solvent B0.00 85 153.00 85 1520.00 10 9030.00 10 9030.01 0 10035.00 0 100
Solvent A: water (5 mM ammonium formate adjusted to pH 5.5 with formic acid)Solvent B: methanol (5 mM ammonium formate)Injection volume: 2 µlColumn temperature: 40ºC
Table 3.15 HPLC solvent gradient for the separation of erythromycin,sulfamethoxazole, trimethoprim, propranolol, dextropropoxyphene, diclofenac and
tamoxifen
Time Solvent A Solvent B0.00 60 401.00 60 4015.10 5 9520.00 5 95
Solvent A: water (5 mM ammonium formate adjusted to pH 5.5 with formic acid)Solvent B: methanol (5 mM ammonium formate)Injection volume: 5 µlColumn temperature: 40ºC
Table 3.16 HPLC solvent gradient for the separation of ibuprofen and mefenamicacid
Time Solvent A Solvent B0.00 90 103.00 90 1015.00 0 10020.00 0 100
Solvent A: water (5 mM ammonium formate adjusted to pH 5.5 with formic acid)Solvent B: methanol (5 mM ammonium formate)Injection volume: 2 µlColumn temperature: 40ºC
Table 3.17 HPLC solvent gradient for acetaminophen
Mass spectrometryThe mass spectrometer used for the analysis of the pharmaceuticals was an Agilent 1100Series SL Quad operated in SIM mode. Confirmation of the pharmaceuticals present inthe POCIS extracts was made using an Agilent 1100 Series SL Ion Trap operated in fullscan MS/MS mode. Spectra obtained from POCIS extracts were compared to libraryspectra obtained from pure standards.
The target and qualifier mass ions monitored are listed in Table 3.18. The general MSparameters are given in Table 3.190 and the LODs for the target compounds in Table

SCIENCE REPORT: SC000062 – THE APPLICATION OF PASSIVE SAMPLING TECHNIQUES FOR WATERQUALITY MONITORING
56
3.20. Study results are shown in Figures 3.48–3.50 and Table 3.21. [Could not checkTable 3.21 as unable to display on screen (problem with file size).]
Table 3.18 SIM mass and retention data
Compound Target massion
Qualifier massions
Retention time(minutes)
Acetaminophen 152.4 - 3.1Sulfamethoxazole 254.3 156.2 10.5Ibuprofen* 205.4 - 10.8Mefenamic acid* 240.4 196.4 12.7Trimethoprim 291.5 275.3, 261.3 18.9Propranolol 260.4 183.3 22.4Erythromycin 734.7 576.7 24.5Dextropropoxyphene 340.5 266.4 25.6Diclofenac 296.3 298.3 26.4Tamoxifen 372.5 327.4 29.0*Negative ionisation [M-H]–
Table 3.19 General mass spectrometer parameters
Method Drying gasflow
(litres/minute)
Gas temperature(°C)
Nebuliserpressure (psi)
Capillaryvoltage (V)
Table 3.16 13 350 35 2000Table 3.17 10 300 40 2500Table 3.18 13 350 40 2000
Table 3.20 Limits of detection
Compound LOD (ng) on columnAcetaminophen 0.03
Sulfamethoxazole 0.03Ibuprofen 0.05
Mefenamic acid 0.03Trimethoprim 0.01Propranolol 0.01
Erythromycin 0.01Dextropropoxyphene 0.01
Diclofenac 0.03Tamoxifen 0.01

SCIENCE REPORT: SC000062 – THE APPLICATION OF PASSIVE SAMPLING TECHNIQUES FOR WATERQUALITY MONITORING
57
Figure 3.48 Extracted ion chromatograms of trimethoprim, propranolol anddextropropoxyphene in a POCIS sample extract obtained from the Agilent 1100
series SL Quad
Figure: 3.49 Full scan MS/MS spectrum of erythromycin in POCIS sample extract

SCIENCE REPORT: SC000062 – THE APPLICATION OF PASSIVE SAMPLING TECHNIQUES FOR WATERQUALITY MONITORING
58
Figure 3.50 Full scan MS/MS spectrum of erythromycin in standard
2002 EA-USGS POCIS Pharmaceuticals DeploymentAll Results quoted as ug per POCIS extract
Sulfamethoxazole Trimethoprim Propranolol Erythromycin Dextropropoxyphene Diclofenac Tamoxifen Acetaminophen Ibuprofen Mefenamic Acid
Spike Verify Survey 1 0.993 1.12 1.161 0.42 1.241 1.086 1.012 1.179 0.945 1.15Spike Verify Survey 2 1.007 1.162 1.19 0.761 1.229 1.081 1.068 1.171 0.948 1.18Spike Verify Survey 3 1.053 1.149 1.214 0.498 1.255 1.155 1.058 1.187 0.996 1.274
average 1.018 1.144 1.188 0.560 1.242 1.107 1.046 1.179 0.963 1.201%RSD 3.1 1.9 2.2 31.9 1.0 3.7 2.9 0.7 3.0 5.4
Survey 1 Matrix Spike 0.971 1.097 1.126 0.583 1.122 1.068 0.975 1.139 0.933 1.104Survey 2 Matrix Spike 0.923 1.058 1.108 0.816 1.088 1.021 0.96 0.749 0.917 1.127Survey 3 Matrix Spike 1.005 1.117 1.157 0.789 1.139 1.066 0.969 1.18 1.012 1.264
average 0.966 1.091 1.130 0.729 1.116 1.052 0.968 1.023 0.954 1.165%RSD 4.3 2.8 2.2 17.5 2.3 2.5 0.8 23.3 5.3 7.4
% Recovery 95 95 95 130 90 95 93 87 99 97
Reagent Blank <0.015 <0.005 <0.005 <0.005 <0.005 <0.015 <0.005 <0.015 <0.025 <0.015Survey 1 Fabrication Blank <0.015 <0.005 <0.005 <0.005 <0.005 <0.015 <0.005 <0.015 <0.025 <0.015Survey 2 Fabrication Blank <0.015 <0.005 <0.005 <0.005 <0.005 <0.015 <0.005 <0.015 <0.025 <0.015Survey 3 Fabrication Blank <0.015 <0.005 <0.005 <0.005 <0.005 <0.015 <0.005 <0.015 <0.025 <0.015
average <0.015 <0.005 <0.005 <0.005 <0.005 <0.015 <0.005 <0.005 <0.005 <0.005%RSD 0 0 0 0 0 0 0 0 0 0
Survey 2 Site 1 Field Blank <0.015 <0.005 <0.005 <0.005 <0.005 <0.015 <0.005 <0.015 <0.025 <0.015Survey 2 Site 1 Rep A <0.015 0.302 0.352 *** 0.524 0.524 <0.005 <0.015 <0.025 0.594Survey 2 Site 1 Rep B <0.015 0.259 0.345 *** 0.457 0.368 <0.005 <0.015 <0.025 0.439Survey 2 Site 1 Rep C <0.015 0.283 0.371 *** 0.504 0.549 <0.005 <0.015 <0.025 0.478
average <0.015 0.281 0.356 0.495 0.480 <0.005 <0.005 <0.005 0.504%RSD 0 7.7 3.8 6.9 20.4 0 0 0 16.0
Survey 3 Site 1 Field Blank <0.015 <0.005 <0.005 <0.005 <0.005 <0.015 <0.005 <0.015 <0.025 <0.015Survey 3 Site 1 Rep A <0.015 0.063 0.484 *** 0.689 0.506 <0.005 <0.015 <0.025 0.548Survey 3 Site 1 Rep B <0.015 0.053 0.428 *** 0.642 0.423 <0.005 <0.015 <0.025 0.326Survey 3 Site 1 Rep C <0.015 0.053 0.322 *** 0.44 0.297 <0.005 <0.015 <0.025 0.388
average <0.015 0.056 0.411 0.590 0.409 <0.005 <0.005 <0.005 0.421%RSD 0 10.2 20.0 22.4 25.8 0 0 0 27.2
Survey 1 Site 2 Field Blank <0.015 <0.005 <0.005 <0.005 <0.005 <0.015 <0.005 <0.015 <0.025 <0.015Survey 1 Site 2 Rep A <0.100* 0.029 0.645 *** 0.525 2.114 <0.005 <0.015 <0.025 1.497Survey 1 Site 2 Rep B 0.15 0.077 0.941 *** 0.563 2.177 <0.005 <0.015 <0.025 1.83Survey 1 Site 2 Rep C 0.181 0.032 0.454 *** 0.332 1.832 <0.005 <0.015 <0.025 1.368
average 0.166 0.046 0.680 0.473 2.041 <0.005 <0.005 <0.005 1.565%RSD 13.2 58.5 36.1 26.2 9.0 0 0 0 15.2
Survey 2 Site 2 Field Blank <0.015 <0.005 <0.005 <0.005 <0.005 <0.015 <0.005 <0.015 <0.025 <0.015Survey 2 Site 2 Rep A 0.227 0.082 0.56 *** 0.297 0.488 <0.005 <0.015 <0.025 0.659Survey 2 Site 2 Rep B 0.197 0.1 0.714 *** 0.378 1.271 <0.005 <0.015 <0.025 1.024Survey 2 Site 2 Rep C 0.048 0.058 0.572 *** 0.288 0.702 <0.005 <0.015 <0.025 0.824
average 0.157 0.080 0.615 0.321 0.820 <0.005 <0.005 <0.005 0.836%RSD 60.9 26.3 13.9 15.4 49.3 0 0 0 21.9
Survey 3 Site 2 Field Blank <0.015 <0.005 <0.005 <0.005 <0.005 <0.015 <0.005 <0.015 <0.025 <0.015Survey 3 Site 2 Rep A 0.186 0.099 0.757 *** 0.336 0.868 <0.005 <0.015 <0.025 1.015Survey 3 Site 2 Rep B 0.23 0.12 0.728 *** 0.317 3.677 <0.005 <0.015 <0.025 1.085Survey 3 Site 2 Rep C 0.166 0.116 0.737 *** 0.318 0.754 <0.005 <0.015 <0.025 0.99
average 0.194 0.112 0.741 0.324 1.766 <0.005 <0.005 <0.005 1.030%RSD 16.9 10.0 2.0 3.3 93.7 0 0 0 4.8
Survey 1 Site 3 Field Blank <0.015 <0.005 <0.005 <0.005 <0.005 <0.015 <0.005 <0.015 <0.025 <0.015Survey 1 Site 3 Rep A <0.015 1.066 1.154 *** 0.794 3.144 <0.005 <0.015 <0.025 1.58Survey 1 Site 3 Rep B <0.015 1.03 1.055 *** 0.701 2.8 <0.005 <0.015 <0.025 1.247Survey 1 Site 3 Rep C <0.015 0.963 1.004 *** 0.652 2.838 <0.005 <0.015 <0.025 1.405
average <0.015 1.020 1.071 0.716 2.927 <0.005 <0.005 <0.005 1.411%RSD 0 5.1 7.1 10.1 6.4 0 0 0 11.8
Survey 2 Site 3 Field Blank <0.015 <0.005 <0.005 <0.005 <0.005 <0.015 <0.005 <0.015 <0.025 <0.015Survey 2 Site 3 Rep A <0.015 0.784 1.005 *** 0.545 2.228 <0.005 <0.015 <0.025 0.818Survey 2 Site 3 Rep B <0.015 0.781 0.956 *** 0.625 2.108 <0.005 <0.015 <0.025 0.869Survey 2 Site 3 Rep C <0.015 0.685 0.976 *** 0.697 1.378 <0.005 <0.015 <0.025 1.025
average <0.015 0.750 0.979 0.622 1.905 <0.005 <0.005 <0.005 0.904%RSD 0 7.5 2.5 12.2 24.2 0 0 0 11.9
Table 3.21 Full results from pharmaceutical studies (2002)
SCIENCE REPORT: SC000062 – THE APPLICATION OF PASSIVE SAMPLING TECHNIQUES FOR WATERQUALITY MONITORING
59
ResultsNo results were obtained from the first deployment at the Corby STW (May 2002)because all the samplers were damaged.
Recovery data for spiked samples showed that analysis for all but one compound(erythromycin) was undertaken successfully with <6 per cent RSD between the sites.More importantly, however, recoveries of >90 per cent between sites were reported for allbut one compound (acetaminophen). The RSD between each of the matrix spikes wasvery good, reporting <8 per cent for all but two compounds (erythromycin 17.5 per centand acetaminophen 23.3 per cent).
The fabrication blank data confirmed that no contamination interferences could beidentified as arising during the manufacture of the samplers. Furthermore, the field blankdata revealed that there were no analytical interferences derived from any phase of thefieldwork. This is an excellent quality control observation for this experiment.
Corby STWThe effluent at Corby showed a mean trimethoprim mass of 0.28 µg/POCIS for June2002, which then declined to 0.056 µg/POCIS during July. This trend was not observed forpropranolol, which rose from a mean of 0.35 µg/POCIS in June to a mean of0.41 µg/POCIS in July. In June, dextropropoxyphene was measured at a mean of 0.49µg/POCIS, rising to a mass of 0.59 µg/POCIS in July.
Diclorofenac was found at a mean concentration of 0.48 µg/POCIS in June and thenapparently declined to a mean of 0.41 µg/POCIS July. Mefanamic acid was found at aconcentration of 0.5 µg/POCIS in June, declining to 0.42 µg/POCIS in July.
The sampling accuracy (represented by RSD between replicates) was greater in Junecompared with the relative standard deviations reported for the July deployment.
Overall, the data suggest that concentrations of pharmaceutical contamination at Corbywere the same order of magnitude in the two sampling periods.
East Hyde STWUnlike the Corby survey, sulfamethoxazole was detected in the extracts from the EastHyde wastewater effluent. In May 2002, a mean mass of 0.16 µg/POCIS was measured,followed by 0.15 µg/POCIS in June and 0.19 µg/POCIS in July. Trimethoprim wassequestered at a mean mass of 0.046 µg/POCIS in May, although the RSD of 58.5 percent between replicates was unsatisfactory. For June, the analysis reported an increasedmean mass of 0.08 µg/POCIS, rising further in July to 0.11 µg/POCIS.
Mean propranolol concentrations in May were 0.68 µg/pocis, although the reproducibilitybetween the individual samplers was 36.1 per cent (RSD). For June, the meanconcentration was 0.61 µg/POCIS, rising to 0.74 µg/POCIS in July. Meandextropropoxyphene concentrations were found at 0.47 µg/POCIS for May, decliningslightly to a mean of 0.32 µg/POCIS in June. The same concentration was reported for theJuly survey.
Diclofenac mean concentrations of 2 µg/pocis (May), 0.82 µg/POCIS (June) and1.76 µg/pocis (July) were measured in the POCIS extracts. The RSD values for the Junesurvey (49.3 per cent) and July survey (93.7 per cent) were influenced by two excessiveindividual sampler results. For May, June and July, the mean mefanamic acidconcentrations were 1.56, 0.83 and 1.03 µg/POCIS, respectively.

SCIENCE REPORT: SC000062 – THE APPLICATION OF PASSIVE SAMPLING TECHNIQUES FOR WATERQUALITY MONITORING
60
The data from East Hyde also demonstrate that ambient concentrations of the targetcontaminants varied little over the three months of survey. High RSD values can beattributed to inconsistent data derived from one replicate sampler.
Rymeads STWThe analyses undertaken for the samplers at Rymeads STW demonstrate thatsulfamethoxazole was not sequestered during any sampling period, but that trimethoprimwas found at a mean of 1.02 µg/POCIS in May. This declined slightly to a mean of0.75 µg/POCIS in June, before rising to a mean of 0.79 µg/POCIS in July. All RSD datashowed that replicates did not vary >10 per cent for this compound.
Mean propanolol concentrations were similar to those for trimethoprim. For May, meanconcentrations were measured at 1.07 µg/POCIS, while 0.97 µg/POCIS was reported forJune. In July, the mean concentrations peaked at 1.31 µg/POCIS. RSDs between themonthly replicates were all <8 per cent for the three months of sampling.Dextropropoxyphene mass was measured in May at a mean of 0.71 µg/POCIS, decliningto 0.62 µg/POCIS in June. This concentration rose in July to a mean of 0.89 µg/POCIS.Reproducibility between the monthly sampler replicates were all <13 per cent RSD.
Diclofenac concentrations of 2.92 µg/Pocis (May mean) declined to 1.91 µg/POCIS (Junemean), and then 0.61 µg/POCIS (July mean) during the sampling period. Samplingreproducibility between the monthly samplers was good for May and July (RSDs of 6.4and 5.1 per cent, respectively), although one poor sampler in June (Replicate C) reducedthe monthly mean RSD to 24.2 per cent.
Mefenamic acid was measured at mean concentrations of 1.41, 0.90 and 1.70 µg/POCISfor May, June and July, respectively. These data suggest that the ambient time-integratedconcentrations were in the same order of magnitude. The RSD data derived from analysisof this compound indicate that collective reproducibility was good for May (RSD 11.8 and11.9 per cent, respectively), but a reduced individual replicate analysis in July (ReplicateB) increased the mean monthly RSD to 47 per cent.
Discussion and conclusionsPOCIS units are an important development in passive sampling as they monitor classes ofcontaminants not suitable for SPMDs. Pharmaceutical impacts on the environment arenow of concern and POCIS offers a cost-effective means of monitoring for trace levels ofthese compounds, which this survey found in STW effluents. Further development work isrequired for these devices, mainly to generate the calibration data required to calculateuptake rates for contaminants of interest.

SCIENCE REPORT: SC000062 – THE APPLICATION OF PASSIVE SAMPLING TECHNIQUES FOR WATERQUALITY MONITORING
61
3.7 Bordon STW, River Wey, Hampshire (2002–2004)Background and objectives
In June 2002 and 2003, biologists discovered a severe depletion of invertebrates in theRiver Wey (South) at Bordon. Investigations revealed that an 11 km stretch was affectedbetween the Bordon STW effluent discharge point and the confluence with the River Wey(North) at Tilford. However, the fish population was found to be unaffected.
Spot sampling of the river and effluent was carried out in an attempt to identify the causeof the drop in the number of invertebrates. In 2002, the effluent from the Bordon STW wasfound to contain the scabicide, crotamiton, though at concentrations below reported thetoxic thresholds for invertebrates. The insecticide, chlorpyrifos, was identified in spoteffluent samples in June 2003.
Extensive pollution prevention and additional monitoring activities were undertaken to tryto identify sources within the sewer catchment. Passive sampling devices (SPMD andPOCIS) were deployed during the June 2002 and 2003 monitoring periods to identify anysuspect chemical pollutants in the effluent. Additional deployments were carried out inOctober/November 2002 to test the POCIS unit for a range of pesticides.
In anticipation of further problems in 2004, a monitoring programme was planned for thesewage effluent and River Wey. Passive sampling devices (PPS and SPMD) weredeployed in the sewer network in an attempt to trace potential pollutants to source. Thissurvey, undertaken in July 2004, demonstrated that there are difficulties in deployingdevices in sewers. The main problem encountered was fouling of the deployment devicewith sewage solids. Consideration is being given to the design of deployment apparatussuitable for this type of survey.
Sampling locations
Five sampling locations along the River Wey were selected (Figure 3.51).
• Site 1. 20 m upstream (u/s) Bordon STW (NGR: SU 80186 36047)
• Site 2. Bordon STW final effluent sampling chamber (NGR: SU 80266 36185)
• Site 3. 200 m downstream (d/s) Bordon STW (NGR: SU 80617 36515)
• Site 4. Lindford Bridge (NGR: SU 80862 36721)
• Site 5. Headley Wood Farm (NGR: SU 82026 37431)

SCIENCE REPORT: SC000062 – THE APPLICATION OF PASSIVE SAMPLING TECHNIQUES FOR WATERQUALITY MONITORING
62
Figure 3.51 Sampling locations for Bordon study, 2002Source: Ordnance Survey. Crown Copyright. Licence reference: NC/03/16457.
Passive sampler deployment
POCIS units were deployed at Site 2 for 14 days in June 2002 to confirm the presence ofcrotamiton. Further POCIS units were deployed during October/November 2002 at Sites 2and 3 for 28 days and again in June 2003 at Sites 1, 2, 3 and 5. Deployment unitscontaining eight devices (four with 200 mg sorbent admixture and four with 200 mg ofOasis HLB) were deployed at each site.
Sampling during April/May 2004 involved the deployment of PPSs (for 7 and 14 days) andSPMDs (for 14 and 28 days) in four pumping station chambers and in the inlet channel atBordon STW. The results of analysing these devices for chlorpyrifos will to be reported inJuly 2004. These sites are extremely harsh environments for passive sampling due to theheavy fouling of the devices (Figure 3.52).
Figure 3.52 Severe fouling of passive samplers deployed in sewage pumpingstation chambers (Bordon, 2004)
Other monitoring carried outSpot samples taken at Site 2 between June 2003 and September 2003 were analysed forchlorpyrifos.
ResultsAnalysis of POCIS units was performed out at the CERC laboratories in Missouri, USA.
d/s
Headley Wood Farm
Linford Bridged/s Bordon STW
Bordon STWu/s Bordon STW

SCIENCE REPORT: SC000062 – THE APPLICATION OF PASSIVE SAMPLING TECHNIQUES FOR WATERQUALITY MONITORING
63
In 2002, the determinands included diuron, isoproturon and crotamiton plus a range ofother pesticides. Analysis for a range of oestrogens was also undertaken.
In 2003, the determinands were simazine, atrazine, terbutryn, chlorpyrifos and diazinon.Calibration data for the compounds were not available, so the POCIS results are quotedas mass accumulated (ng). Extracts were also sent to the NLS at Llanelli for use in thedevelopment of analytical methods for pharmaceuticals. This work will be reported when itis complete.
POCIS 2002In June 2002, 83 ng of crotamiton was accumulated by the POCIS units at Site 2. Surveydata for October/November 2002 are shown in Table 3.22.
Accumulated masses (ng)*Site 1 Site 2Crotamiton 50 Crotamiton 550Desethylatrazine 13 Diuron 88Simazine 5 Isoproturon 78Terbutryn 9.9 Simetryn 9
Terbutryn 5* Results are quoted as mass accumulated (ng) because calibration data for conversion to CTWA are not yetavailable.
Table 3.22 POCIS data for Bordon survey, October/November 2002
POCIS 2003The results obtained during 2003 are shown in Table 3.23 and Figure 3.53.
Site 1 Site 2 Site 3 Site 5Massaccumulated(ng)*
ADMIX OASIS ADMIX OASIS ADMIX OASIS ADMIX OASIS
SimazineAtrazineTerbutrynChlorpyriphosDiazinon
14.015.017.9n/dn/d
11.512.115.4n/dn/d
10.07.012.574.96.38
10.68.2514.0124.16.75
24.519.529.3n/dn/d
10.88.013.3n/dn/d
64.876.336.53.86.0
25.034.316.51.52.5
* Results are quoted as mass accumulated (ng) because calibration data for conversion to CTWA are not yetavailable.
Table 3.23 POCIS data for Bordon survey, June 2003.

SCIENCE REPORT: SC000062 – THE APPLICATION OF PASSIVE SAMPLING TECHNIQUES FOR WATERQUALITY MONITORING
64
Figure 3.53 POCIS data for Bordon survey, June 2003
Spot sampling 2003The results of spot sampling for chlorpyrifos are shown in Figure 3.54.
Figure 3.54 Spot sampling data for chlorpyrifos (Bordon STW, 2003)
SPMD and PPS 2004Results to date have been disappointing: no pesticides have been reported as detected byeither SPMD or PPS units. This is probably due to heavy fouling of the devices, althoughthe laboratory has reported SPMD results for other contaminants. The laboratory atLlanelli, which has carried out the analysis of the PPS units, believes the lack of detectionfor chlorpyrifos could be due to them being supplied in the non-polar configuration andtherefore be less suitable for detecting this pesticide (Gravell A, personal communication2004).
0
50
100
150
200
250
27/0
6/03
04/0
7/03
11/0
7/03
18/0
7/03
25/0
7/03
01/0
8/03
08/0
8/03
15/0
8/03
22/0
8/03
29/0
8/03
05/0
9/03
12/0
9/03
19/0
9/03
Chl
orpy
rifos
(ng/
l)
0
25
50
75
100
125
AD
MIX
Site
1
OA
SIS
Site
1
AD
MIX
Site
2
OA
SIS
Site
2
AD
MIX
Site
3
OA
SIS
Site
3
AD
MIX
Site
4
OA
SIS
Site
4
Mas
s ac
cum
ulat
ed (n
g)Simazine
Atrazine
Terbutryn
Chlorpyrifos
Diazinon

SCIENCE REPORT: SC000062 – THE APPLICATION OF PASSIVE SAMPLING TECHNIQUES FOR WATERQUALITY MONITORING
65
Discussion and conclusions
This survey trialled three types of passive sampler. It reinforced the conclusions fromother surveys both on the value of these devices in monitoring water quality and thelimitations that need to be considered when planning a passive sampling study –particularly with respect to fouling.
The survey also highlighted the need for further work in generating the calibration datarequired to calculate uptake rates and thus TWA concentrations, especially for POCIS andPPS units.

SCIENCE REPORT: SC000062 – THE APPLICATION OF PASSIVE SAMPLING TECHNIQUES FOR WATERQUALITY MONITORING
66
3.8 Fleet Lagoon, East Fleet, Dorset (2003)Background and objectives
The Fleet Lagoon (Figure 3.55) is the largest saline lagoon in England. It is a Site ofSpecial Scientific Interest (SSSI) and is monitored for compliance with the EC ShellfishWaters Directive.
On 21 March 2003, a dissolved zinc level of 347 µg/l was found at The Narrowsmonitoring point (NGR: SY 65130 77190). This is considerably higher than the south-westEnvironmental Quality Standard (EQS) of 40 µg/l. The previous highest level recorded fordissolved zinc was 9.9 µg/l on 26 November 2002.
Figure 3.55 View of Fleet Lagoon
The elevated levels were first thought to be due to marine anti-fouling treatments.However, they are now thought to be derived from industrial or agricultural sources, asfurther monitoring by spot sampling showed persistent elevated zinc levels inconsistentwith contamination by anti-fouling treatments.
Alongside routine monitoring of the situation, a short passive sampling study wasconducted to:
• gain further field experience with this technology;• provide extra information on zinc levels in and around the Fleet Lagoon.
Sampling locations
Four sampling locations were chosen for DGT deployment (Figure 3.56).
• Site 1. Oyster beds at East Fleet (NGR: SY 65962 76618)
• Site 2. Chickerell Hive, East Fleet (NGR: SY 63626 78974)
• Site 3. Clouds Hill, West Fleet (NGR: SY 58935 82528)
• Site 4. Footbridge over Rodden Stream (NGR: SY 60586 82568)

SCIENCE REPORT: SC000062 – THE APPLICATION OF PASSIVE SAMPLING TECHNIQUES FOR WATERQUALITY MONITORING
67
Figure 3.56 DGT sampling locations for Fleet Lagoon study, 2003Source: Ordnance Survey. Crown Copyright. Licence reference: NC/03/16457.
Passive sampler deploymentDGTs were deployed in triplicate at all four sites using cage holders between 15 July and30 July 2003 and 15 July and 13 August 2003. Continuous temperature data for the areawere obtained from a monitoring station at Clouds Hill.
Other monitoring carried outSpot samples were collected at each site at deployment and retrieval, and additionally on8 May 2003 from Sites 1 and 2 and three further sites in the Fleet Lagoon (Figure 3.57).
• Site 5. Smallmouth (NGR: SY 66630 76110)
• Site 6. The Narrows (NGR: SY 65130 77190)
• Site 7. Little Sea (NGR: SY 64740 77890)

SCIENCE REPORT: SC000062 – THE APPLICATION OF PASSIVE SAMPLING TECHNIQUES FOR WATERQUALITY MONITORING
68
#
#
#
#
#
Figure 3.57 Spot sampling locations for Fleet Lagoon study, 2003
Results
DGT samples were analysed at the NLS at Waterlooville and the mean CTWA (µg/l) wascalculated based on a mean water temperature of 20.7°C. Spot samples were analysedfor dissolved zinc at the NLS at Starcross. The results are shown in Table 3.24.
Table 3.24 Zinc: DGT mean CTWA July/August and spot sample analysis (FleetLagoon, 2003)
Spot sample analysisZn
(µg/l)CTWA at14 days
CTWA at28 days
8 May2003
17 July2003
30 July2003
13August2003
Site 1 2.12 0.96 43 <4.0Site 2 1.30 0.88 76 <4.0 <4.0 <4.0Site 3 0.80 0.73 <40 <4.0 <4.0Site 4 1.83 1.15 8.9 <5.0 41Site 5 144 4.5 54Site 6 116 7.2Site 7 4.5
Discussion and conclusions
A comparison of the results for DGTs and spot samples shows that the latter give muchhigher levels in a number of instances. Further investigation is required to determine ifthese differences are due to fluctuations in zinc levels or if the spot sample analysis isdetecting more than just the labile fraction.
Chickerell
Little Sea
The Narrows
East Fleet
Smallmouth
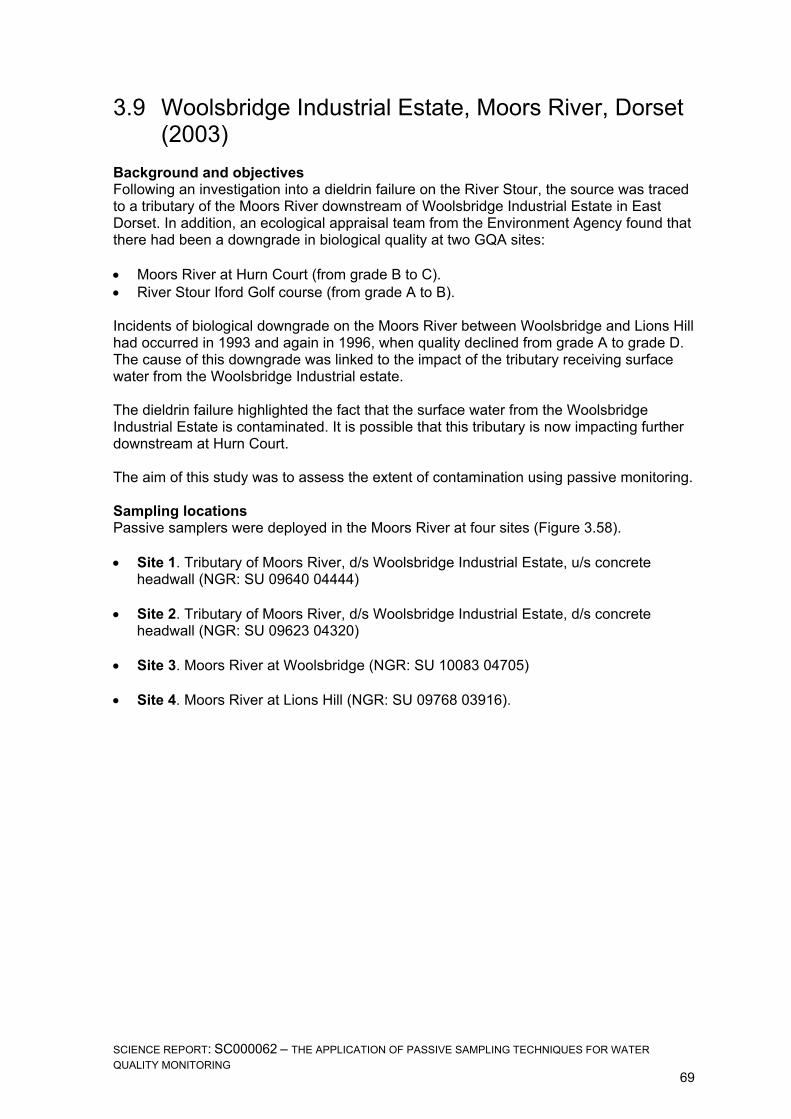
SCIENCE REPORT: SC000062 – THE APPLICATION OF PASSIVE SAMPLING TECHNIQUES FOR WATERQUALITY MONITORING
69
3.9 Woolsbridge Industrial Estate, Moors River, Dorset(2003)
Background and objectivesFollowing an investigation into a dieldrin failure on the River Stour, the source was tracedto a tributary of the Moors River downstream of Woolsbridge Industrial Estate in EastDorset. In addition, an ecological appraisal team from the Environment Agency found thatthere had been a downgrade in biological quality at two GQA sites:
• Moors River at Hurn Court (from grade B to C).• River Stour Iford Golf course (from grade A to B).
Incidents of biological downgrade on the Moors River between Woolsbridge and Lions Hillhad occurred in 1993 and again in 1996, when quality declined from grade A to grade D.The cause of this downgrade was linked to the impact of the tributary receiving surfacewater from the Woolsbridge Industrial estate.
The dieldrin failure highlighted the fact that the surface water from the WoolsbridgeIndustrial Estate is contaminated. It is possible that this tributary is now impacting furtherdownstream at Hurn Court.
The aim of this study was to assess the extent of contamination using passive monitoring.
Sampling locationsPassive samplers were deployed in the Moors River at four sites (Figure 3.58).
• Site 1. Tributary of Moors River, d/s Woolsbridge Industrial Estate, u/s concreteheadwall (NGR: SU 09640 04444)
• Site 2. Tributary of Moors River, d/s Woolsbridge Industrial Estate, d/s concreteheadwall (NGR: SU 09623 04320)
• Site 3. Moors River at Woolsbridge (NGR: SU 10083 04705)
• Site 4. Moors River at Lions Hill (NGR: SU 09768 03916).

SCIENCE REPORT: SC000062 – THE APPLICATION OF PASSIVE SAMPLING TECHNIQUES FOR WATERQUALITY MONITORING
70
Figure 3.58 Sampling locations for the Woolbridge Industrial Estate survey,2003Source: Ordnance Survey. Crown Copyright. Licence reference: NC/03/16457.
Passive sampler deploymentSPMDs were deployed in triplicate, plus a field blank, at each site for a period offour weeks during April 2003.
Other monitoring carried outNone
ResultsSPMDs were analysed by the NLS at Leeds for dieldrin. The mean CTWA (ng/l) andsampling precision (%RSD) were calculated (Table 3.25).
Table 3.25 Dieldrin: mean CTWA and sampling precision (%RSD) (MoorsRiver, 2003)
Dieldrin Mean CTWA (ng/l) %RSD
Site 1 250 53Site 2 270 21Site 3 0.4 32Site 4 34 14

SCIENCE REPORT: SC000062 – THE APPLICATION OF PASSIVE SAMPLING TECHNIQUES FOR WATERQUALITY MONITORING
71
Discussion and conclusions
The tributary of the Moors River running through the industrial estate was identified as asource of dieldrin. The survey also showed dilution of dieldrin levels downstream of thisinput.

SCIENCE REPORT: SC000062 – THE APPLICATION OF PASSIVE SAMPLING TECHNIQUES FOR WATERQUALITY MONITORING
72
3.10 Waterlooville Industrial Estate, Sheepwash Tributary, Hampshire(2003)
Background and objectivesThe Waterlooville Industrial Estate in south Hampshire covers an area of 65 ha(centred at NGR: SU 467850 109890) and accommodates a mix of light and heavyindustrial units, service outlets and offices (Figure 3.59). Developments in the areadate back to the Second World War and have been somewhat piecemeal,resulting in less than ideal drainage.
Streams running through the site have suffered from pollution incidents involvingboth metal and organic contaminants, and there have been occasions whenbiology has been severely affected. Surface water drainage for the newerdevelopments on site is handled by a balancing lagoon, while run-off from theolder developments still drains directly to the Sheepwash Tributary, which in turnflows into the River Wallington.
Figure 3.59 Various commercial and industrial activities on the WaterloovilleIndustrial Estate
The aims of this study were to:
• Gain practical field experience in the use of passive sampling devices in orderto develop standard operating procedures for passive monitoring;
• Compare passive monitoring with spot sampling, with particular reference todifferences in data obtained and the resources and effort required;
• Identify any pollution issues present in the streams running out of theWaterlooville Industrial Estate.

SCIENCE REPORT: SC000062 – THE APPLICATION OF PASSIVE SAMPLING TECHNIQUES FOR WATERQUALITY MONITORING
73
Sampling locationsThree sampling locations were selected for this study (Figure 3.60).
Site 1Site 2
Site 3
Figure 3.60 Sampling locations for Waterlooville study, 2003Source: Ordnance Survey. Crown Copyright. Licence reference: NC/03/16457.
• Site 1. Sheepwash tributary d/s Waterlooville Industrial Estate and 5 m u/s ofbalancing lagoon outfall and drainage channel outfall (NGR: 467504 109690)(Figure 3.61).
• Site 2. NGR 467463 109675 Surface water drainage channel emptying into theSheepwash tributary 5 m d/s Site 1.
• Site 3. Environment Agency routine sampling point on the Sheepwash tributary1.5 km d/s of Site 1 (NGR: 466128 109868) (Figure 3.62).

SCIENCE REPORT: SC000062 – THE APPLICATION OF PASSIVE SAMPLING TECHNIQUES FOR WATERQUALITY MONITORING
74
Figure 3.61 Sheepwash tributary at Site 1, with junction of surface waterdrainage channel (Site 2) on the right of the picture [Will need to adjust
labels]
Figure 3.62 Sheepwash tributary at Site 3 (Environment Agency routinesampling point)
Passive sampler deploymentAt Sites 1 and 2, DGT devices were deployed in batches of four and changedevery six days. As the water was very shallow (~5 cm), the devices were deployedusing plate holders laid flat and held in place by bricks found at the site.
At Site 3, DGT devices were deployed in batches of four and changed every sixdays. SPMDs were deployed in batches of three (plus a field blank) and changedevery 30 days. The water was deep enough at this point for all devices to bedeployed using cage holders attached by chain to a tree on the stream bank.
Site 1
Site 2

SCIENCE REPORT: SC000062 – THE APPLICATION OF PASSIVE SAMPLING TECHNIQUES FOR WATERQUALITY MONITORING
75
Extra weight was added to sample holders at Sites 2 and 3 after they weredisplaced after a period of high storm flow.
Other monitoring carried outDaily spot samples were collected at Sites 1 and 2 between 29 April and 29 May2003. These samples were analysed for total metals for cadmium, copper, nickel,lead and zinc. Routine spot samples collected by the Environment Agency at Site3 were analysed for the same metals and for selected organochlorinecontaminants.
ResultsAll samples apart from the SPMDs were analysed by the NLS at Waterlooville.The SPMDs were sent to the NLS at Leeds, but were not analysed. Mean CTWA(µg/l) and %RSD from the DGT analysis results were calculated. The surveyresults are shown in Figures 3.63–3.77.
Values below laboratory reporting limits (RLs) were excluded.
RLs for the spot samples are: Cd = 0.1 µg/l; Cu = 0.5 µg/l; Ni = 5.0 µg/l; Pb = 0.4µg/l; Zn = 2.0 µg/l.
DGT RLs for CTWA over 6 days at 15°C are: Cd = 0.09 µg/l; Cu = 0.44 µg/l; Ni = 4.8µg/l; Pb = 0.28 µg/l; Zn = 1.8 µg/l.

SCIENCE REPORT: SC000062 – THE APPLICATION OF PASSIVE SAMPLING TECHNIQUES FOR WATERQUALITY MONITORING
76
Cadmium
Figure 3.63 Cadmium: mean CTWA from DGT monitoring (WaterloovilleIndustrial Estate, 2003)
Figure 3.64 Total cadmium at Site 1: daily spot sampling results comparedwith mean CTWA from DGT monitoring (Waterlooville Industrial Estate, 2003)
Figure 3.65 Total cadmium at Site 2: daily spot sampling compared withmean CTWA from DGT monitoring (Waterlooville Industrial Estate, 2003)
0.0
0.1
0.2
0.3
0.4
0.5
29/0
4/03
05/0
5/03
11/0
5/03
17/0
5/03
23/0
5/03
29/0
5/03
Cd
(ug/
l)
Spot
DGT
0.0
0.1
0.2
0.3
11/0
4/03
17/0
4/03
23/0
4/03
29/0
4/03
05/0
5/03
11/0
5/03
17/0
5/03
23/0
5/03
29/0
5/03
04/0
6/03
10/0
6/03
16/0
6/03
22/0
6/03
Cd
(ug/
l)
Site 1
Site 2
Site 3
0.0
0.2
0.4
0.6
0.8
1.0
1.2
29/0
4/03
05/0
5/03
11/0
5/03
17/0
5/03
23/0
5/03
29/0
5/03
Cd
(ug/
l)
Spot
DGT

SCIENCE REPORT: SC000062 – THE APPLICATION OF PASSIVE SAMPLING TECHNIQUES FOR WATERQUALITY MONITORING
77
Copper
Figure 3.66 Copper: mean CTWA from DGT monitoring (WaterloovilleIndustrial Estate, 2003)
Figure 3.67 Total copper levels at Site 1 from daily spot sampling comparedwith mean CTWA from DGT monitoring (Waterlooville Industrial Estate, 2003)
Figure 3.68 Total copper levels at Site 2 from daily spot sampling comparedwith mean CTWA from DGT monitoring at Site 2 (Waterlooville Industrial
Estate, 2003)
0
50
100
150
200
11/0
4/03
17/0
4/03
23/0
4/03
29/0
4/03
05/0
5/03
11/0
5/03
17/0
5/03
23/0
5/03
29/0
5/03
04/0
6/03
10/0
6/03
16/0
6/03
22/0
6/03
Cu
(ug/
l)
Site 1
Site 2
Site 3
0
5
10
15
20
29/0
4/03
05/0
5/03
11/0
5/03
17/0
5/03
23/0
5/03
29/0
5/03
Cu
(ug/
l)
Spot
DGT
0200400600800
100012001400
29/0
4/03
05/0
5/03
11/0
5/03
17/0
5/03
23/0
5/03
29/0
5/03
Cu
(ug/
l)
Spot
DGT

SCIENCE REPORT: SC000062 – THE APPLICATION OF PASSIVE SAMPLING TECHNIQUES FOR WATERQUALITY MONITORING
78
Nickel
Figure 3.69 Nickel: mean CTWA from DGT monitoring (Waterlooville IndustrialEstate, 2003)
Figure 3.70 Total nickel levels at Site 1 from daily spot sampling comparedwith mean CTWA from DGT monitoring (Waterlooville Industrial Estate, 2003)
Figure 3.71 Total nickel levels at Site 2 from daily spot sampling comparedwith mean CTWA from DGT monitoring (Waterlooville Industrial Estate, 2003)
0
2
4
6
8
10
12
11/0
4/03
17/0
4/03
23/0
4/03
29/0
4/03
05/0
5/03
11/0
5/03
17/0
5/03
23/0
5/03
29/0
5/03
04/0
6/03
10/0
6/03
16/0
6/03
22/0
6/03
Ni (
ug/l)
Site 1
Site 2
Site 3
0
2
4
6
8
10
12
29/0
4/03
05/0
5/03
11/0
5/03
17/0
5/03
23/0
5/03
29/0
5/03
Ni (
ug/l)
Spot
DGT
0
10
20
30
40
50
29/0
4/03
05/0
5/03
11/0
5/03
17/0
5/03
23/0
5/03
29/0
5/03
Ni (
ug/l)
Spot
DGT
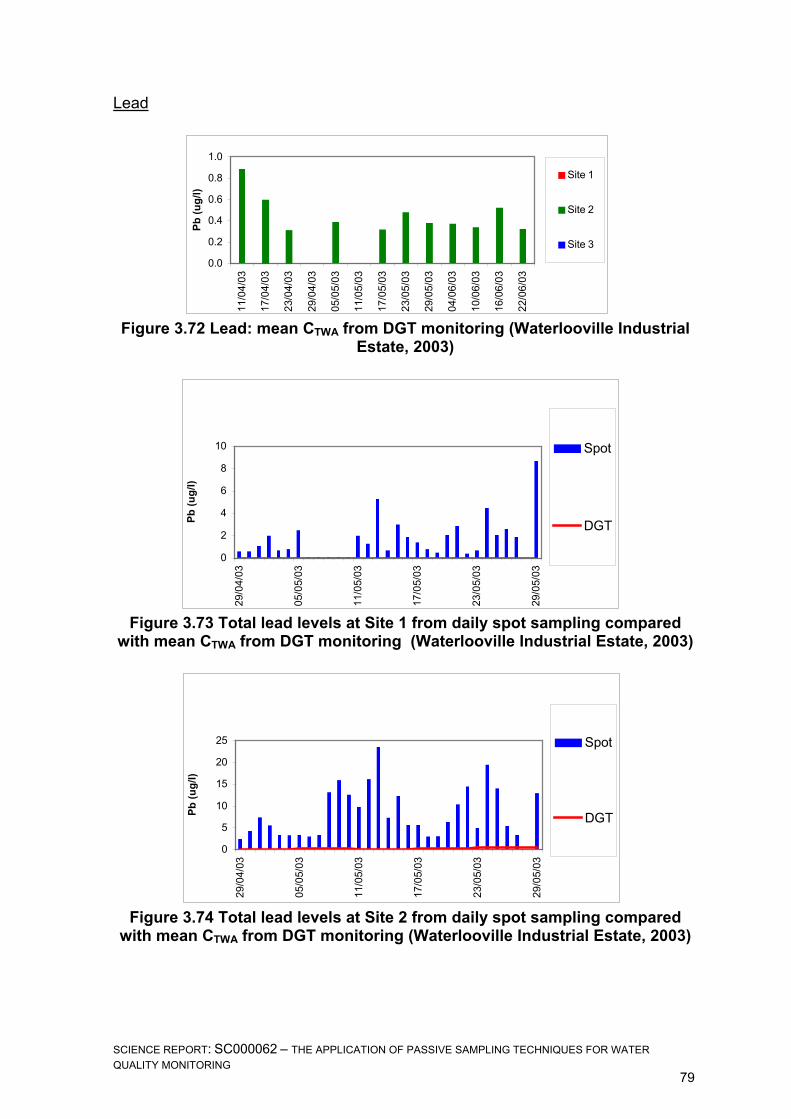
SCIENCE REPORT: SC000062 – THE APPLICATION OF PASSIVE SAMPLING TECHNIQUES FOR WATERQUALITY MONITORING
79
Lead
Figure 3.72 Lead: mean CTWA from DGT monitoring (Waterlooville IndustrialEstate, 2003)
Figure 3.73 Total lead levels at Site 1 from daily spot sampling comparedwith mean CTWA from DGT monitoring (Waterlooville Industrial Estate, 2003)
Figure 3.74 Total lead levels at Site 2 from daily spot sampling comparedwith mean CTWA from DGT monitoring (Waterlooville Industrial Estate, 2003)
0.0
0.2
0.4
0.6
0.8
1.0
11/0
4/03
17/0
4/03
23/0
4/03
29/0
4/03
05/0
5/03
11/0
5/03
17/0
5/03
23/0
5/03
29/0
5/03
04/0
6/03
10/0
6/03
16/0
6/03
22/0
6/03
Pb (u
g/l)
Site 1
Site 2
Site 3
0
2
4
6
8
10
29/0
4/03
05/0
5/03
11/0
5/03
17/0
5/03
23/0
5/03
29/0
5/03
Pb (u
g/l)
Spot
DGT
0
5
10
15
20
25
29/0
4/03
05/0
5/03
11/0
5/03
17/0
5/03
23/0
5/03
29/0
5/03
Pb (u
g/l)
Spot
DGT
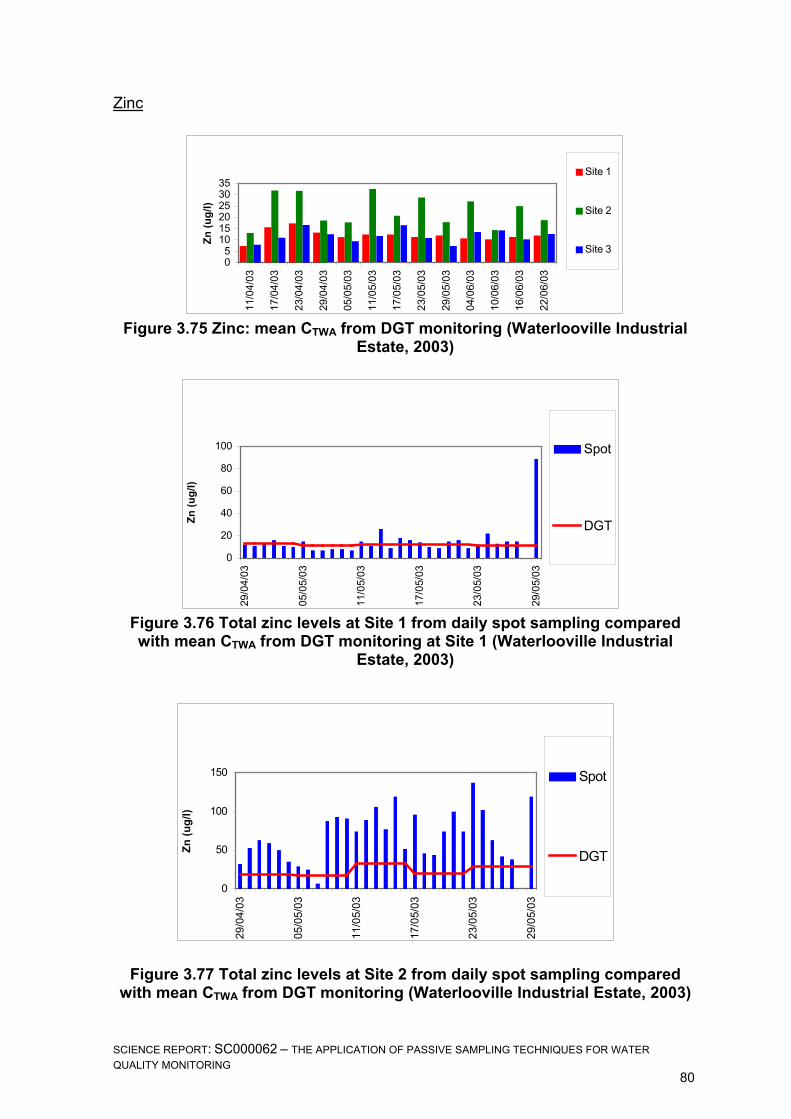
SCIENCE REPORT: SC000062 – THE APPLICATION OF PASSIVE SAMPLING TECHNIQUES FOR WATERQUALITY MONITORING
80
Zinc
Figure 3.75 Zinc: mean CTWA from DGT monitoring (Waterlooville IndustrialEstate, 2003)
Figure 3.76 Total zinc levels at Site 1 from daily spot sampling comparedwith mean CTWA from DGT monitoring at Site 1 (Waterlooville Industrial
Estate, 2003)
Figure 3.77 Total zinc levels at Site 2 from daily spot sampling comparedwith mean CTWA from DGT monitoring (Waterlooville Industrial Estate, 2003)
05
101520253035
11/0
4/03
17/0
4/03
23/0
4/03
29/0
4/03
05/0
5/03
11/0
5/03
17/0
5/03
23/0
5/03
29/0
5/03
04/0
6/03
10/0
6/03
16/0
6/03
22/0
6/03
Zn (u
g/l)
Site 1
Site 2
Site 3
0
20
40
60
80
100
29/0
4/03
05/0
5/03
11/0
5/03
17/0
5/03
23/0
5/03
29/0
5/03
Zn (u
g/l)
Spot
DGT
0
50
100
150
29/0
4/03
05/0
5/03
11/0
5/03
17/0
5/03
23/0
5/03
29/0
5/03
Zn (u
g/l)
Spot
DGT

SCIENCE REPORT: SC000062 – THE APPLICATION OF PASSIVE SAMPLING TECHNIQUES FOR WATERQUALITY MONITORING
81
Comparison with routine sampling results
Only data for copper and zinc (Figures 3.78 and 3.79) are shown because theresults for cadmium, nickel and lead were all below reporting limits.
Figure 3.78 Total copper levels at Site 3 from routine spot samplingcompared with mean CTWA from DGT monitoring (Waterlooville Industrial
Estate, 2003)
Figure 3.79 Total zinc levels at Site 3 from routine spot sampling comparedwith mean CTWA from DGT monitoring (Waterlooville Industrial Estate, 2003)
0
10
20
30
40
05/0
5/03
11/0
5/03
17/0
5/03
23/0
5/03
29/0
5/03
04/0
6/03
10/0
6/03
16/0
6/03
Cu
(ug/
l)
Spot
DGT
0
10
20
30
40
50
05/0
5/03
11/0
5/03
17/0
5/03
23/0
5/03
29/0
5/03
04/0
6/03
10/0
6/03
16/0
6/03
Zn (u
g/l)
Spot
DGT

SCIENCE REPORT: SC000062 – THE APPLICATION OF PASSIVE SAMPLING TECHNIQUES FOR WATERQUALITY MONITORING
82
DGT sampling precision
To determine sampling precision for the DGT devices, the %RSD was calculatedfor each batch deployed. A summary of these results (Table 3.26) shows thatsampling precision was acceptable with RSD <10 per cent for most batches, butthat some batches exceeded this value. In a few cases, one result in a batch wasclearly anomalous compared with the other three and this result was excluded.
Table 3.26 Summary of DGT sampling precision data (Waterloo IndustrialEstate, 2003)
Discussion and conclusionsThe comparison of spot sampling with DGT monitoring produced some interestingresults.
In general, the levels in spot samples are higher than DGT levels, indicating thedifference between measuring total metal content versus the labile fraction,particularly in the case of lead.
The fluctuations in DGT levels and spot sampling levels agree in most cases, withthe exception of nickel at Site 1 where the DGT data show a fluctuation notdiscernable in the spot sample results, indicating a possible contaminant pulse notpicked up in the spot samples. In contrast, the nickel results at Site 2 show a sharprise in levels detected by both methods; the duration of this spike is very short andwould probably have been missed by less frequent spot sampling.
This study looked at detection limits of the DGT devices. It found that a six -dayexposure gave a comparable LOD with the spot samples. This could have beenimproved by reducing the dilution level used during laboratory analysis or bydeploying the devices for a longer period. The lack of protective housing and theshallow depth of water at Sites 1 and 2 made it difficult to keep the samplerssubmerged properly but not in contact with the stream bed. New equipment fordeploying passive samplers in shallow waters needs to be developed.
The survey identified the stream flowing through the Waterlooville Industrial Estateas a source of metal contamination to the Sheepwash tributary. However, highlevels of nickel recorded at Site 1 indicate that there is a separate source of nickelcontamination into the surface water drainage channel.
DGT Sampling Precision (%RSD) WIE 2003Cd Cu Ni Pb Zn
Max 7.4 34.2 19.2 26.6 26.7Min 4.19 0.60 2.10 5.29 1.96
Mean 5.8 7.89 8.55 13.7 10.8

SCIENCE REPORT: SC000062 – THE APPLICATION OF PASSIVE SAMPLING TECHNIQUES FOR WATERQUALITY MONITORING
83
3.11 Dwr Ial, River Clwyd, Carmarthenshire (2003)
Background and objectivesThe Dwr Ial is a tributary of the River Clwyd in Carmarthenshire, North-East Wales(Figure 3.80). The dominant land use in the area is improved pasture for rearinglivestock. The catchment contains six areas authorised under the GroundwaterRegulations 1998 for the disposal of sheep dip by spreading to land.
Figure 3.80 Aerial view of River Dwr Ial
In 1997, the Environment Agency’s Welsh Region implemented a water qualitymonitoring programme for sheep dip in Wales. Since then, the Dwr Ial has failedEQSs for diazinon on four occasions, exceeding the maximum allowableconcentration (MAC) of 0.1 µg/l.
The source of the EQS failure that occurred in 1997 was identified throughbiological monitoring. This and the more recent detection of diazinon in the Dwr Ialcatchment shows that sources of sheep dip pollution still exist (EnvironmentAgency, 1998; Westerberg, 1999).
Dipping is a seasonal activity and chemical monitoring has indicated that peaks indiazinon concentration generally occur between September and October. Localofficers also suspect that contaminant peaks are rainfall-related, coinciding withthe first flush of rain that follows the dipping season. The intermittent nature ofsheep dip pollution sources means that they can be difficult to trace and spotsampling can miss short-lived peaks in contaminant concentrations.
The two main aims of this study were to:
• field test POCIS units in the Dwr Ial for the detection of diazinon;• use any positive diazinon results to target farm visits in the area.

SCIENCE REPORT: SC000062 – THE APPLICATION OF PASSIVE SAMPLING TECHNIQUES FOR WATERQUALITY MONITORING
84
Sampling locations
Sampling took place at six locations along the river Dwr Ial (Figure 3.81).
• PM/C/01. Pont Telpyn (NGR: SJ 12106 60560)
• PM/02. Pont Rhyd-Dwrial (NGR: SJ 13980 58689)
• PM/03. Llanrhyd Mill (NGR: SJ 14091 57800)
• PM/C/04. u/s from Merilyn Farm (NGR: SJ 13608 56570)
• PM/05. Llanfair Dyffryn Clwyd (NGR: SJ 13756 55556)
• PM/06. Graig Fechan (NGR: SJ 14750 53442)
Figure 3.81 Sampling locations for the Dwr Ial diazinon survey, 2003Source: Ordnance Survey. Crown Copyright. Licence reference: NC/03/16457.
Passive sampler deploymentThe passive monitoring work used two types of POCIS units based on ADMIX andOASIS sorbent layers, which were supplied by the USGS CERC.
A preliminary survey was carried out at sample sites PM/C/01, PM/02 andPM/C/04 between 14 August and 12 September 2003. The main survey at all sixsites took place between 29 September and 20 October 2003.

SCIENCE REPORT: SC000062 – THE APPLICATION OF PASSIVE SAMPLING TECHNIQUES FOR WATERQUALITY MONITORING
85
Devices were held in place in the main channel of the river by tethering the POCISholder to an anchor point on the riverbank. Field blanks were also included witheach deployment. At the end of the deployment period, the POCIS units were sentto the NLS at Llanelli for analysis.
Other monitoring carried outSpot samples were collected from sites PM/C/01 and PM/C/04 on 22 September,21 October and 21 November 2003, and sent to the NLS at Llanelli for analysis.
ResultsAll analysis was carried out at the NLS at Llanelli following UKAS accreditedprocedures for the spot samples and previously published USGS extractionprocedures for the POCIS units. In all cases, final analysis for diazinon wasperformed using GC-MS. Mean CTWA (ng/l) values were calculated for the POCISresults using experimentally derived calibration data. The survey results are givenin Table 3.27.
Table 3.27 Results of diazinon survey for the Dwr Ial, 2003
Fouling by silt deposits on the devices was observed in instances where thePOCIS results for ADMIX and OASIS differed significantly.
When the time came for retrieval, the POCIS units deployed at PM/05 were foundto have been removed from the river and so these data could not be used. [Wasthis true on all dates?]
Discussion and conclusions
The difference in OASIS and ADMIX results shows the ADMIX is the more efficientmatrix for contaminants such as diazinon. The OASIS sorbent is considered moresuitable for monitoring pharmaceutical compounds; the fouling observed isprobably not the significant cause of the difference.
The spot samples show high levels of diazinon than the POCIS data. This may bedue to the difference in the total content and labile fraction. Because the spotsample levels also show a decreasing trend, however, the CTWA could be a trueindication of the average level over the deployment period. One other possibilitythat should be investigated is the breakdown of diazinon once adsorbed by thePOCIS units.
Dwr Ial Diazinon Survey 2003POCIS Results Mean C twa (ng/l) Spot Sampling Results (ng/l)
Date In Date Out Date In Date Out14/08/03 12/09/03 29/09/03 20/11/03 22/09/03 08/10/03 21/10/03 21/11/03ADMIX OASIS ADMIX OASIS
PM/C/01 49.6 18.5 48.5 37.0 94.7 137 47.0 3.2PM/02 17.2 22.2 34.8 27.4PM/03 0 0PM/C/04 0 0 0 0 12.1 2.3 <1.0 <1.0PM/05 4.54 29.7PM/06 0 0

SCIENCE REPORT: SC000062 – THE APPLICATION OF PASSIVE SAMPLING TECHNIQUES FOR WATERQUALITY MONITORING
86
One other observation relates to the removal of one POCIS canister from thewater. It is possible that attention was drawn to the device as the canister is whiteand therefore easier to spot. Passive sampling equipment should ideally be madein dull colours to reduce chance discovery and tampering.
The survey suggests that future investigations should concentrate on the areaaround sites PM01 and PM02. However, a further study at PM05 may also berequired since some diazinon was detected at this site.

SCIENCE REPORT: SC000062 – THE APPLICATION OF PASSIVE SAMPLING TECHNIQUES FOR WATERQUALITY MONITORING
87
3.12 Able UK Docks, Teeside, Durham (2003)
Background and objectivesThe aim of this study was to evaluate any increased contamination to the areafollowing the arrival 13 US Navy auxiliary ships for dismantling (‘the ghost ships’)(Figure 3.82).
Figure 3.82 Ships at Able UK Docks for dismantling
Sampling locationsSampling took place at four locations (Figure 3.83).
• Site 1. Seaton Snook (NGR: 453245 526650)
• Site 2. Hartlepool Power Station (NGR: 452660 526700)
• Site 3. Greatham Creek (NGR: 451695 525575)
• Site 4. Seaton Channel (NGR: 452380 526270)

SCIENCE REPORT: SC000062 – THE APPLICATION OF PASSIVE SAMPLING TECHNIQUES FOR WATERQUALITY MONITORING
88
Figure 3.83 Sampling locations for Able UK Docks study, 2003Source: Ordnance Survey. Crown Copyright. Licence reference: NC/03/16457.
Passive sampler deployment
DGT and SPMD units were deployed at all four sites in triplicate between 24 and30 September, 30 September to 20 October, 10 to 18 December 2003, and 18December 2003 to 7 January 2004 using the deployment shown in Figure 3.84.
Figure 3.84 Example of deployment equipment used for the Able UK Dockspassive monitoring survey, 2003–2004
Seal Sands - GR 13Philips Approach
Tees Control TE 60
Power StationIntake Seaton Snook GR 16
Laings Basin GR 15
Barge Berth GR 14
Tioxide Outfall GR01
Greatham Creek
Seaton Channel
Seaton SnookHartlepool Power Station

SCIENCE REPORT: SC000062 – THE APPLICATION OF PASSIVE SAMPLING TECHNIQUES FOR WATERQUALITY MONITORING
89
Other monitoring carried outNone
ResultsDGT devices were analysed by NLS at Waterlooville for cadmium, copper, nickel,lead and zinc (Tables 3.29–3.31). The mean CTWA (µg/l) and sampling precision(%RSD) were calculated. The SPMDs were analysed by NLS at Leeds for a rangeof PCB congeners (Tables 3.32–3.35).
Cadmium
Table 3.28 Cadmium mean CTWA and sampling precision from DGT survey(Able UK Docks, 2003)
A number of cadmium results were below the reporting limit of 5.0 µg/l in theextract solution and only the second deployment at Site 3 is based on triplicateresults.
Copper
Table 3.29 Copper mean CTWA and sampling precision from DGT survey(Able UK Docks, 2003)
NickelAll analysis results were below the reporting limit of 250 µg/l in the extract solution.
Cd Date in Date out Date in Date out Date in Date out Date in Date out24/09/03 30/09/03 30/09/03 20/10/03 10/12/03 16/12/03 16/12/03 08/01/04
Mean Mean Mean MeanCtwa %RSD Ctwa %RSD Ctwa %RSD Ctwa %RSD(ug/l) (ug/l) (ug/l) (ug/l)
Site 1Site 2 0.029 30 0.033 4Site 3 0.025 12Site 4 0.149 24 0.032 2
Cu Date in Date out Date in Date out Date in Date out Date in Date out24/09/03 30/09/03 30/09/03 20/10/03 10/12/03 16/12/03 16/12/03 08/01/04
Mean Mean Mean MeanCtwa %RSD Ctwa %RSD Ctwa %RSD Ctwa %RSD(ug/l) (ug/l) (ug/l) (ug/l)
Site 1 0.844 18 0.374 29Site 2 1.192 94 0.711 9Site 3 1.067 20 0.526 13Site 4 1.416 20 0.436 8

SCIENCE REPORT: SC000062 – THE APPLICATION OF PASSIVE SAMPLING TECHNIQUES FOR WATERQUALITY MONITORING
90
Lead
Table 3.30 Lead mean CTWA and sampling precision from DGT survey (Able
UK Docks, 2003)
Zinc
Table 3.31 Zinc mean CTWA and sampling precision from DGT survey (AbleUK Docks, 2003)
PCB congenersThere are no results for the last two sampling periods at Site 1 due to the loss ofdeployment equipment.
Table 3.32 PCB mean CTWA and sampling precision at Site 1 of SPMD survey(Able UK Docks, 2003)
Pb Date in Date out Date in Date out Date in Date out Date in Date out24/09/03 30/09/03 30/09/03 20/10/03 10/12/03 16/12/03 16/12/03 08/01/04
Mean Mean Mean MeanCtwa %RSD Ctwa %RSD Ctwa %RSD Ctwa %RSD(ug/l) (ug/l) (ug/l) (ug/l)
Site 1 0.574 17 0.217 41Site 2 0.353 24 0.213 23Site 3 0.839 11 0.414 23Site 4 0.797 13 0.278 12
Zn Date in Date out Date in Date out Date in Date out Date in Date out24/09/03 30/09/03 30/09/03 20/10/03 10/12/03 16/12/03 16/12/03 08/01/04
Mean Mean Mean MeanCtwa %RSD Ctwa %RSD Ctwa %RSD Ctwa %RSD(ug/l) (ug/l) (ug/l) (ug/l)
Site 1 31.7 15 4.54 20Site 2 16.5 48 5.62 9 7.66 11 12.4 34Site 3 32.5 32 9.12 29 16.7 46 15.7 35Site 4 11.4 7 5.16 17 9.86 26 5.13 44
Site 1 Date in Date out Date in Date out Date in Date out Date in Date out24/09/03 30/09/03 30/09/03 20/10/03 04/12/03 10/12/03 16/12/03 08/01/04
Mean Mean Mean MeanC twa %RSD C twa %RSD C twa %RSD C twa %RSD(ug/l) (ug/l) (ug/l) (ug/l)
PCB#28 0.030 na 0.006 1.7PCB#31 0.032 na 0.009 23PCB#52 0.023 na 0.023 70PCB#77PCB#101 0.013 na 0.007 2.6PCB#105PCB#118 0.008 naPCB#126PCB#128PCB#138 0.007 naPCB#153 0.013 na 0.008 1.4PCB#156PCB#169PCB#180 0.011 na

SCIENCE REPORT: SC000062 – THE APPLICATION OF PASSIVE SAMPLING TECHNIQUES FOR WATERQUALITY MONITORING
91
Table 3.33 PCB mean CTWA and sampling precision at Site 2 of SPMD survey(Able UK Docks, 2003)
Table 3.34 PCB mean CTWA and sampling precision at Site 3 of SPMD survey(Able UK Docks, 2003)
Site 2 Date in Date out Date in Date out Date in Date out Date in Date out24/09/03 30/09/03 30/09/03 20/10/03 04/12/03 10/12/03 16/12/03 08/01/04
Mean Mean Mean MeanC twa %RSD C twa %RSD C twa %RSD C twa %RSD(ug/l) (ug/l) (ug/l) (ug/l)
PCB#28 0.015 4 0.009 26 0.004 17PCB#31 0.015 11 0.013 18 0.005 41PCB#52 0.030 12 0.014 18 0.014 28PCB#77PCB#101 0.018 14 0.009 16 0.024 121PCB#105 0.006 12PCB#118 0.007 na 0.005 24 0.004 43PCB#126PCB#128PCB#138 0.008 11 0.006 23 0.003 15PCB#153 0.017 15 0.010 15 0.015 na 0.008 15PCB#156PCB#169PCB#180
Site 3 Date in Date out Date in Date out Date in Date out Date in Date out24/09/03 01/10/03 01/10/03 21/10/03 03/12/03 10/12/03 18/12/03 07/01/04
Mean Mean Mean MeanC twa %RSD C twa %RSD C twa %RSD C twa %RSD(ug/l) (ug/l) (ug/l) (ug/l)
PCB#28 0.023 na 0.019 20 0.020 na 0.006 12PCB#31 0.046 na 0.020 na 0.031 na 0.017 35PCB#52 0.061 22 0.029 8 0.076 23 0.032 2.9PCB#77 0.007 naPCB#101 0.018 64 0.017 1.4 0.026 na 0.016 6PCB#105 0.005 52 0.008 na 0.004 5.0PCB#118 0.017 54 0.009 25 0.011 5 0.008 26PCB#126 0.017 na 0.014 17 0.005 1.3PCB#128 0.004 48 0.003 naPCB#138 0.014 na 0.011 13 0.013 na 0.008 18PCB#153 0.028 43 0.019 10 0.022 19 0.011 12PCB#156 0.008 naPCB#169 0.008 naPCB#180 0.008 42

SCIENCE REPORT: SC000062 – THE APPLICATION OF PASSIVE SAMPLING TECHNIQUES FOR WATERQUALITY MONITORING
92
Table 3.35 PCB mean CTWA and sampling precision at Site 4 of SPMD survey(Able UK Docks, 2003)
Discussion and conclusions
In general, the arrival of the ‘ghost ships’ did not seem to have affected thecontaminant levels in the docks. The survey is ongoing and contaminant levelsmay change when the ships are decommissioned.
Site 4 Date in Date out Date in Date out Date in Date out Date in Date out24/09/03 30/09/03 30/09/03 20/10/03 04/12/03 10/12/03 16/12/03 08/01/04
Mean Mean Mean MeanC twa %RSD C twa %RSD C twa %RSD C twa %RSD(ug/l) (ug/l) (ug/l) (ug/l)
PCB#28 0.018 9 0.036 8 0.011 11PCB#31 0.019 na 0.022 19 0.047 4.3 0.011 20PCB#52 0.034 0.8 0.023 21 0.047 7 0.015 11PCB#77PCB#101 0.020 10 0.012 5 0.025 na 0.007 22PCB#105 0.003 naPCB#118 0.009 11 0.006 29 0.009 2.0 0.004 25PCB#126 0.015 naPCB#128PCB#138 0.013 1.4 0.006 6 0.007 naPCB#153 0.020 6 0.013 17 0.019 14 0.010 14PCB#156PCB#169PCB#180

SCIENCE REPORT: SC000062 – THE APPLICATION OF PASSIVE SAMPLING TECHNIQUES FOR WATERQUALITY MONITORING
93
4 Discussion and conclusionsThe results from the various studies described in this report show that passivesampling is a viable technique for water quality monitoring. Passive samplersdetected short-term contamination events that could have been missed in a spotsampling programme. They also make the quantitative determination of trace levelcontaminants easier. Because they are selective for the labile fraction of anycontaminant, they are also more likely to provide a better indication ofbioavailability. The studies also demonstrate some of the limitations of passivesampling devices and the factors that need to be considered when planning apassive monitoring programme.
4.1 Selection of Passive SamplersThe choice of samplers and the duration of their deployment will depend on thenature and level of contaminants involved. Prior knowledge of the site’senvironmental chemistry is therefore helpful.
Passive sampling devices fall into three main categories depending on the type ofcontaminant under study:
• metals (DGT, PIMS (mercury only], SLMD);• non-polar organics (SPMD, PPS);• polar organics (POCIS, PPS).
Other devices are being developed and these will hopefully be investigating infuture studies.
When selecting a device, users are advised to refer to the literature and/ormanufacturer’s guidelines for details on the uptake rates and detection limits ofcompounds of interest. If available, PRC devices should be used to allowcorrection for the variation of uptake rates in the environment compared with thosequoted in calibration data.
For samplers such as DGTs where the contaminants remain bound to theabsorption matrix, the duration of deployment is dictated by the level ofcontaminants present; the higher the total concentration, the quicker the devicewill become saturated. If levels are very low, then a longer deployment time will benecessary in order for the mass of accumulated contaminants to rise above thelimits of detection.
For samplers such as SPMDs, contaminants start to desorb back into the waterafter a period of time and the relationship between the rate of uptake and theenvironmental concentration is no longer linear. To be able to calculate the time-weighted average concentration reliably, the sampler must be retrieved before thisdesorption process begins. The duration of the linear uptake phase depends onthe contaminant species as well as the level present.

SCIENCE REPORT: SC000062 – THE APPLICATION OF PASSIVE SAMPLING TECHNIQUES FOR WATERQUALITY MONITORING
94
Where samplers were deployed at highly contaminated sites such as the RiverRother adjacent to the Avenue Coking Works (Section 3.4) or the River Weyadjacent to the Cranleigh Brick and Tile Works (Section 3.5), the samplingprecision was generally more than 10 per cent RSD. This suggests that, unlessthey are deployed for very short periods of time (two or three days), passivesamplers may not be suitable for monitoring high contaminant levels. In situationswhere there are high levels of contamination, however, passive monitoring isunlikely to yield any extra data compared with other methods. The exception wouldbe a requirement to determine low levels of those contaminants that would notnormally be detected due to interference and masking by those present at highlevels.
4.2 Deployment RequirementsWhen planning a passive sampling study, the choice of sampling location dependsnot only on the contaminants to be monitored but also on the physicalrequirements of the sampling devices.
Only DGTs have so far been deployed in very shallow waters (e.g. at Godalmingand Waterlooville; Sections 3.1 and 3.10, respectively), using a specially designedsampler holder. The normal configuration of passive sampling device holder is aperforated cylinder, which requires a minimum water depth of 0.5 m. Whateverdesign of sample holder is used, it must be remain in place for the duration of thedeployment. In a number of cases, samplers have been carried downstream bystrong currents and, in some cases, there has been evidence of humaninterference. The ideal situation is to tether the sampler holders to a fixed pointand to attach them to weights and/or floats as necessary to maintain them at therequired water depth.
The deployment equipment must be robust enough to withstand highly turbidaquatic conditions. It must also be made of materials such as stainless steel ormedical grade plastics that do not leach chemicals which could interfere with thesamplers. To prevent tampering, the location of the devices should, wherepossible, be inaccessible to the public; otherwise, the sampler holders should bediscretely positioned out of sight. It is also important to consider the possibility offouling or damage by suspended solids. The sampler holders provide a degree ofprotection, but a high degree of fouling has been found at sites with intenseturbidity such as STWs. This could severely restrict the uptake of contaminants.The deployment of passive samplers along the Thames Tideway has shown thatthese devices function efficiently in both fresh and saline waters.
Samplers should be deployed where the water flows freely and be positioned tostay below the water surface but clear of the riverbed/sea bottom. If there is anysurface contamination such as algae or oil, a clear area should be created intowhich the samplers can be lowered; this should also be done before retrieval.When using samplers such as a DGT or a PPS, they should be checked once inplace to make sure that no air bubbles have been trapped and that they areoriented with the membrane facing down to reduce the possibility of suspendedsolids building up on them.

SCIENCE REPORT: SC000062 – THE APPLICATION OF PASSIVE SAMPLING TECHNIQUES FOR WATERQUALITY MONITORING
95
Field blanks are important to correct for any contamination during deployment andretrieval; the only exceptions are DGT and POCIS devices as they do not havesignificant atmospheric uptake.
It is also important that passive samplers are deployed in batches, partly in caseone device is damaged, but also because sampling precision is sometimes greaterthan 10 per cent RSD. This is most likely to be caused by variations in the degreeof fouling between devices; this should be noted upon retrieval. Other factors thatshould be noted because they can affect contaminant uptake rates and speciationare temperature, flow rates, pH and dissolved oxygen.
Once removed from the water, the devices should be rinsed with de-ionised water,placed in clearly labelled sealed containers, and stored as required prior toanalysis. SPMDs need to be frozen and other devices require refrigeration; use ofa cool box for transport is recommended.
When handling passive sampling devices, clean non-coated latex gloves shouldbe worn at all times.
Handling of passive samplers in the field is not a complex operation, but thosenew to the technique will require some familiarisation and training with the devicesand deployment equipment.
4.3 AnalysisSome methods for the extraction and analysis of passive samplers in thelaboratory are outlined in Section 2. Detailed information can be obtained from themanufacturer’s guidelines or from the NLS. New methods are being developed,but a full review of all available methods is beyond the scope of this report.
The NLS at Leeds, Llanelli and Waterlooville has achieved or is working towardsUKAS accredited methods for SPMD (C. Hunter, Leeds), POCIS and PPS (A.Gravell, Llanelli) and DGT (R. Symonds, Waterlooville). In general, theselaboratories report that the methods for extraction and analysis are reasonablystraightforward and do not require any additional equipment or techniques. Theonly minor difficulty reported by the NLS has been in the initial handling anddismantling of some devices in order to get the absorption matrix into theextraction solution. For DGTs, the Chelex resin layer is much thinner than the gellayer and can easily stick to it; the gel layer should be checked before it isdiscarded. Dismantling of POCIS units is awkward initially but it only requires asmall amount of practice to become proficient with the procedure.
Because DGTs sample a fairly small suite of contaminants, little alteration in themethod for analysis is necessary depending on the analytes required. The NLSmethod currently uses a dilution factor of 50× prior to analysis of the extractsolution. For the Waterlooville study (Section 3.10), a number of results fell belowreporting limits, indicating a lower initial dilution may have been better; furtherdilution can be performed subsequently if some analytes are present at very highlevels. For DGTs analysed at the University of Lancaster, the dilution factor wasusually 10×. It has recently been reported that use of concentrated nitric acid in

SCIENCE REPORT: SC000062 – THE APPLICATION OF PASSIVE SAMPLING TECHNIQUES FOR WATERQUALITY MONITORING
96
place of 1M nitric acid results in full extraction of accumulated metals from theresin, thus removing the need for an extraction factor (Garmo O A, personalcommunication). Water samples generally require little preparation prior to metalsanalysis, making DGT analysis more costly and time-consuming. However, thedifference is not great and should be considered against the resources required togenerate the equivalent data using spot sampling.
The extraction and analysis methods used with SPMD, POCIS and PPS unitsvaries according to the analytes required. This is due to the wide range of organiccompounds each device can accumulate. The main difference between themethods is in the clean-up and preparation of the initial extract prior to analysis;this is dictated by the analytes required and the instrumental method of analysis.This is also the case for the analysis of spot samples for organic contaminants. Inaddition, some routine methods are more complex than those required for passivesampling devices. However, passive samplers from the same deployment batchcan be combined during extraction to achieve very low limits of detection.
Laboratory personnel carrying out extraction and analysis will require full training.This is also required to obtain UKAS accreditation. Another requirement foraccreditation is the inclusion of QC samples; these consist of passive samplersthat have deployed in fortified solutions under controlled laboratory conditions.
4.4 Interpretation of DataThe initial data generated by the laboratory analysis measures the amount of eachanalyte accumulated by the absorption matrix. Use of the appropriate formula andcalibration data are required to convert these results into time-weighted averageconcentrations.
• For DGTs, the diffusion coefficients for a range of metals and the formulae aregiven in Section 2.
• For SPMDs, a wide range of compounds have now been calibrated and theUSGS has produced an Excel spreadsheet to perform the calculation.
• For POCIS and PPS units, development is ongoing to increase the range ofcompounds for which calibration data exist.
• For SPMD, POCIS and PPS units, PRC devices are available to provide anEAF as described in Section 2. When no calibration data exist for a compoundof interest, it must be determined in the laboratory or the results will only give aqualitative indication of contamination, as was the case for the POCIS surveyat Bordon STW (Section 3.7).
There is some debate about what the time-weighted average concentration valuesactually indicate about the quality of the environment. Some of the studiesdescribed in this report compared passive sampling to spot sampling. This was aparticular aim of the Waterlooville study (Section 3.10) and showed that, for DGTdata, the changes in contaminant levels could be seen in results from bothsampling methods. The main difference noted was that, as spot samples were

SCIENCE REPORT: SC000062 – THE APPLICATION OF PASSIVE SAMPLING TECHNIQUES FOR WATERQUALITY MONITORING
97
analysed for total metals, these results were usually higher than for DGTmonitoring, which only determines the labile fraction. One result of note from theWaterlooville study is that for nickel levels at Site 2. These remained below the RLof 5.0 µg/l, except during a period of a few days when the level spiked to 40 µg/l inthe spot samples and the CTWA from the DGTs rose to 8.5 µg/l. This resultprovides a clear example of the value of passive sampling as a continuousmonitoring technique that can also indicate sporadic contamination incidents. Thistype of information can then be used to target further investigations. Had the spotsampling been on a monthly or weekly basis, this spike might easily have beenmissed. In other studies, direct comparison between the two sets of results wasnot possible because the spot sampling was not so intensive.
4.5 Combination of Passive Sampling with BioassaysThe present debate concerns how passive sampling data can be related toenvironmental quality and thus aid risk assessment. A number of studies havecompared SPMD passive sampling with biological monitoring organisms (Herve etal., 1995; Huckins et al., 1998; Berge et al., 2004). The results of these studiesshow several similarities and differences between contaminant levels found inorganisms compared with those in SPMDs. These factors need to be consideredwhen using SPMD data to estimate exposure effects on organisms.
The main complication is the difference in passive sampling uptake ratescompared with those in biota. Bio-accumulation varies between organisms and isaffected by environmental factors that have no impact on passive samplers.Studies have examined the use of passive sampler extracts in ecotoxicity testssuch as Microtox, Mutatox and EROD (ethoxyresorufin-O-deethylase) (Huckins etal., 1996; Johnson, 1998; Parrot et al., 1999). This approach provides a screeningtest to identify those extracts and sampling locations which give a positivetoxicological response and require further in-depth analysis (Rastall et al., 2004). Italso means that both exposure and effect can be measured for each samplinglocation and used to provide an environmental risk assessment.
4.6 ConclusionsPassive sampling offers the following benefits.
• It allows continuous long-term monitoring for trace contaminants present in thedissolved aqueous phase and therefore potentially bio-available.
• Detection of sporadic pollution events that may be missed by spot sampling.However, such events must occur for long enough and at a high enough levelto leave a detectable residue in the passive sampler.
• Trace level contaminants can be quantified below detection limits normallyachievable in spot samples.
• Deployment and retrieval of the devices in the field is a straightforward processrequiring only a small amount of training.

SCIENCE REPORT: SC000062 – THE APPLICATION OF PASSIVE SAMPLING TECHNIQUES FOR WATERQUALITY MONITORING
98
• Once deployed, the devices require no further attention until they are retrieved.
• Laboratory extraction and analysis are within the capability of facilities thatalready undertake analysis of water samples for trace contaminants.
When planning a passive monitoring survey, the following steps should befollowed:
• Select passive sampling devices based on the types of contaminants to bemonitored (refer to manufacturer’s guidance and consider availability ofcalibration data)
• Identify appropriate sampling locations where passive sampling devices can besecurely and safely deployed
• Determine the duration of deployment depending on contaminant levelspresent or expected such that devices accumulate sufficient analyte mass tobe detectable but are not overloaded
• Obtain sufficient supplies of samplers and deployment equipment beforeundertaking a survey (passive monitoring is not yet widespread and equipmentavailability is limited)
• Check availability of other equipment required such as fridge/freezer storage,cool box, de-ionised water and wash bottle, non-coated latex gloves, rope,weights, floats/buoys, and temperature, pH and dissolved oxygen meters
• Prepare a waterproof information card (if possible) explaining their purpose toanyone discovering the devices and requesting that they be left undisturbed(include a contact phone number so any problems or queries can be reported)
• Deploy passive sampling devices in batches to monitor sampling precision andto provide a back-up should some devices be damaged (ultra-trace levels ofcontaminants can be detected by combining devices during extraction in thelaboratory)
• Generate field blanks when required in manufacturer’s guidelines and, if theyare available, deploy PRC devices
• Record water temperature, flow rate, pH and dissolved oxygen be recorded,preferably on a continuous basis (otherwise at each site visit)
• Record any fouling or damage to passive samplers during retrieval
• Rinse samplers with de-ionised water on retrieval, place them in separateclearly labelled containers and store as required with the minimum delay

SCIENCE REPORT: SC000062 – THE APPLICATION OF PASSIVE SAMPLING TECHNIQUES FOR WATERQUALITY MONITORING
99
• Arrange for analysis to be carried out at a laboratory with the appropriatefacilities and procedures in place
In terms of the requirements of the WFD for integrative water quality monitoring,passive sampling should be considered an additional complementary techniquealongside biological monitoring and ecotoxicity testing. Due to the timescaleinvolved in conducting a passive monitoring survey, spot sampling may still berequired when analysis is required quickly (e.g. when monitoring a reportedpollution incident). In general, passive sampling is best suited for long-termmonitoring programmes, avoiding areas of high contamination where the devicescould become overloaded or suffer from heavy fouling. This is subject to designand availability of deployment equipment that may mitigate against these sorts ofproblems.
No standard format for reporting passive monitoring data has yet been developed,as illustrated by the variety of tables and charts used in the studies in this report.Standardisation of result calculation and reporting should be part of the standardoperating procedures (SOPs) for laboratory analysis and is required for UKASaccreditation.
There is also a need for SOPs for deployment and retrieval, and the developmentof the necessary equipment to allow deployment in shallow waters. Thisstandardisation is not only required to allow passive sampling to become aroutinely used technique, but also to allow for a proper economic assessment ofthe cost benefits. The studies in this report suggest that:
• passive sampling reduces costs in terms of site visits required;• deployment equipment is more expensive than that required for normal spot
sampling, but less than the cost of an autosampler;• laboratory analysis costs are largely comparable with those for normal water
samples and, in some cases, are less complex (Gravell A, personalcommunication, 2004).
The costs of passive sampling are therefore similar to conventional spot sampling,but the environmental information gained from passive sampling is a hugeadvantage.
4.7 Recommendations for further workMost of the studies detailed in this report have involved deploying a single type ofsampler in the aquatic environment over a short period to determineconcentrations of a narrow range of contaminants. The studies have beensuccessful in providing time-weighted average concentrations of pollutants to helpdeal with operational issues.
The Environment Agency is planning to use passive samplers for a moreextensive study to determine the pesticide input to a river catchment over a two-year period. This study could reveal useful information to determine the extent of

SCIENCE REPORT: SC000062 – THE APPLICATION OF PASSIVE SAMPLING TECHNIQUES FOR WATERQUALITY MONITORING
100
the impact on aquatic biota and to allow the Environment Agency to develop arisk-based monitoring strategy for pesticides.
The development and application of passive sampling is dynamic and further workis already being planned and undertaken in the following areas.
• Calibration. This information is critical for accurate determination ofenvironmental concentrations. This work is being undertaken throughpartnership research with the Australian Research Council Linkage projects(ARC) and US Geological Society. This will be carried out in collaboration withthe NLS. Calibration work is underway for key pollutants such aspharmaceuticals, endocrine-disrupting chemicals and WFD priority substances.
• Risk tools. The combination of passive monitoring and ecotoxicology couldprovide the basis for a tool for assessing environmental risk from pollutants,where risk is the function of exposure (measured using passive samplingdevices) and effect (through toxicological assessment). As well as enablingeffective measures to be taken against adverse effects, such a tool couldprovide a rapid screening mechanism for routine monitoring. This approach isbeing developed through an ARC linkage project as well as joint researchbetween the University of Heidelberg and the Environment Agency.
• Performance Reference Compounds. Further work to develop and assessPRCs will help to provide more accurate calculation of environmentalconcentrations from passive sampling devices. This will be particularly usefulfor sites that have large fluctuations in flow and temperature, or where bio-fouling is prevalent.
• Air monitoring PSDs. Further investigation into use of passive samplingdevices for air monitoring would provide useful tools for assessing both pointand diffuse airborne pollutants. SPMDs have been shown to be very effectivefor air monitoring, but further work on calibration is required.
• Equilibrium ‘event sampler’. Preliminary trials have demonstrated that somemembranes used in passive sampling devices may reach equilibrium in waterwithin a few days and could act as a sentinel device for dealing with sporadicpollution incidents. Post-incident harvesting of cheap and simple ‘eventsamplers’ might yield information on the chemical responsible for the pollution.
• Economic evaluation. A cost benefit study is to be undertaken to demonstratethe cost savings and/or greater effectiveness of passive sampling devicescompared with conventional monitoring devices.
• Deployment apparatus. Development of cheap and effective mechanisms fordeploying passive sampling devices in a range of environments is ongoing.The studies undertaken as part of this review of passive monitoring techniqueshave shown that the configuration of the deployment apparatus and its siting inthe field are crucial to obtaining accurate information.

SCIENCE REPORT: SC000062 – THE APPLICATION OF PASSIVE SAMPLING TECHNIQUES FOR WATERQUALITY MONITORING
101
5. ReferencesAlvarez D A, 1999 Development of an integrative sampling device for hydrophiliccontaminants in aquatic environments. Unpublished PhD thesis. University ofMissouri.
Alvarez D A, Petty J D, Huckins J N, Jones-Lepp T L, Getting D T, Goddard J P,Manahan S E 2004 Development of passive, in situ, integrative sampler forhydrophilic organic contaminants in aquatic environments. EnvironmentalToxicology and Chemistry, 23, 1640-1648.
Berge J, Hylland K, Ruus A and Schlabach M 2004 Accumulation of PCDDs/Fs inAtlantic cod Gadus morhua and SPMDs in a Norwegian fjord influenced by amagnesium smelter, including an evaluation of accumulation directly from watercompared to diet. In Proceedings of the 1st International Passive SamplingWorkshop and Symposium (Ceske Budejovice, 14–18 April 2004).
Booij K, Sleiderink H M and Smedes F 1998 Calibrating the uptake kinetics ofsemi-permeable membrane devices using exposure standards. EnvironmentalToxicology and Chemistry, 17, No. 7, 1236–1245.
Booij K, Zegers B N and Boon J P 2000 Levels of some polybrominated diphenylether (PBDE) flame retardants along the Dutch coast as derived from theiraccumulation in SPMDs and blue mussels (Mytilus Edulis). OrganohalogenCompounds, 47, 89–92.
Brumbaugh W G, Petty J D, Huckins J N and Manahan S E 1999 Development ofa passive sampler integrative sampler for labile metals in water. US GeologicalSurvey (USGS) Water Resources Investigations Report 99-4018A 1. pp. 93–98.Reston, Virginia: USGS.
Brumbaugh W G, Petty J D, May T W and Huckins J N 2000 A passiveintegrative sampler for mercury vapour in air and neutral mercury species inwater. Chemosphere: Global Change Science, 2, 1–9.
Chiou C T 1985 Partition co-efficients or organic compounds in lipid-watersystems and correlations with fish bioconcentration factors. EnvironmentalScience and Technology 19, No. 1, 57–62.
Cleveland L, Little E E, Petty J D, Johnson B T, Lebo J A, Orazio C E, Dionne Jand Crocket A 1997 Toxicological and chemical screening of Antarcticasediments: use of whole sediment toxicity tests, microtox, mutatox, and semi-permeable membrane devices (SPMDs). Marine Pollution Bulletin, 31, 194–202.
Davison W and Zhang H 1994 In situ speciation measurements of tracecomponents in natural waters using thin film gels. Nature 367, 546–548.

SCIENCE REPORT: SC000062 – THE APPLICATION OF PASSIVE SAMPLING TECHNIQUES FOR WATERQUALITY MONITORING
102
Davison W and Hutchinson W 1997 An assessment of the feasibility of usingDGT procedures to measure trace metals and radionuclides in rivers.Environment Agency R&D Technical Report P92. Bristol: Environment Agency.
Ellis G S, Huckins J N, Rostad C E, Schmitt C J, Petty J D and MacCarthy P1995 Lipid containing semi-permeable membrane devices (SPMDs) formonitoring organochlorine contaminants in the Upper Mississippi River.Environmental Toxicology and Chemistry, 14, 1875–1884.
Environment Agency 1996a River habitat survey, River Rother August 1996.Bristol: Environment Agency.
Environment Agency 1998 Welsh sheep dip monitoring programme 1997. Cardiff:Environment Agency Wales.
Environment Agency 2002a Time Integrated Monitoring System (TIMS) digitaldata recall programme. Environment Agency Thames Region.
Herve S, Prest H F, Heinonen P, Hyötyläinen T, Koistinen J and Pasivirta J 1995Lipid filled semi-permeable membrane devices (SPMDs) and mussels assamplers of organochlorine compounds in lake waters. Environmental Scienceand Pollution Research, 2, 24–30.
Hilton M J, Thomas K V and Ashton D, 2003 Targeted monitoring programme forpharmaceuticals in the aquatic environment. Environment Agency R&D TechnicalReport P6-012/06. Bristol: Environment Agency.
Huckins J N, Tubergen M W and Manuweera G K 1990 Semi-permeablemembrane devices (SPMDs) containing model lipid: a new approach tomonitoring the bioavailability of lipophilic contaminants and estimating theirbioconcentration potential. Chemosphere, 20, 533–552.
Huckins J N, Manuweera G K, Petty J D, Mackay D and Lebo J A 1993 Lipidcontaining semi-permeable membrane devices (SPMDs) for monitoring organiccontaminants in water. Environmental Science and Technology, 27, 2489–2496.
Huckins J N, Petty J D, Lebo J A, Orazio C E, Prest H F, Tillit D E, Ellis G S,Johnson B T and Manuweera G K 1996 Semi-permeable membrane devices(SPMDs) for the concentration and assessment of bioavailable organiccontaminants in aquatic environments. In Techniques in Aquatic Toxicology (ed.G K Ostrander), pp. 625–655.New York: Lewis Publishers.
Huckins J N, Prest H F, Petty J D, Roe T I, Meadows J C, Echols K R, Lebo J Aand Clark R C 1998 An overview of the results of several comparisons of lipidcontaining semi-permeable membrane devices (SPMDs) and biomonitoringorganisms for assessing organic chemical exposure. In Proceedings of the 19thAnnual Meeting of the Society of Environmental Toxicology and Chemistry(SETAC) (Charlotte, North Carolina, 15 November 1998).

SCIENCE REPORT: SC000062 – THE APPLICATION OF PASSIVE SAMPLING TECHNIQUES FOR WATERQUALITY MONITORING
103
Huckins J N, Petty J D, Orazio C E, Lebo J A, Clark R C, Gibson V L, Gala W Rand Echols K R 1999 Determination of uptake kinetics sampling rates by lipidcontaining semi-permeable membrane devices (SPMDs) for polycyclic aromatichydrocarbons (PAHs) in water. Environmental Science and Technology, 33,3918–3923.
Huckins J N, Petty J D, Lebo J A, Almedia F N, Booij K, Alvarez D A, Cranor W L,Clark R C and Mogensen B B 2002 Development of the permeability/performancereference compounds (PRC) approach for in situ calibration of semi-permeablemembrane devices (SPMDs). Environmental Science and Technology, 36, 85–91.
Johnson B T 1998 Microtox toxicity test system - new developments andapplications. In Microscale Testing in Aquatic Toxicology (ed. P G Wells), 1stedition. pp. 201–218. Boca Raton, Florida: CRC Press.
Kingston J K, Greenwood R, Mills G A, Morrison G M and Person L B 2000Development of a novel passive sampler for the time-averaged measurement of arange of organic pollutants in aquatic environments. Journal of EnvironmentalMonitoring, 2, 487–495.
Liu Q T and Riddle A M 2004 The effects of scale on predicting the fate ofpharmaceuticals in the environment. In Proceedings of the 14th Annual Meetingof the Society of Environmental Toxicology and Chemistry (SETAC) Europe(Prague, 18–22 April 2004).
Mackay D, Shiu W Y and Ma K C 1997 Chemical Properties and EnvironmentalFate for Organic Chemicals II. Chelsea , Michigan: Lewis Publishers
Mayer P, Vaes W H J and Hermens J L M 2000 Absorption of hydrophobiccompounds into polydimethylsiloxane coating of solid-phase micro extraction(SPME) fibres. High partition coefficients and microscopy images. AnalyticalChemistry, 72, 459–464.
National Rivers Authority Yorkshire Region 1990/91/92 National routine biologicalsurvey, River Rother catchments.
Parrot J L, Backus S M, Borgman A I and Swyripa M 1999 The use of semi-permeable membrane devices (SPMDS) to concentrate chemicals in oil refineryeffluent on the Makenzie River. Arctic 52, 125–138.
Prest H F, Jarman W M, Burns S A, Weismuller T, Martin M and Huckins J N1992 Sampling via semi-permeable membrane devices (SPMDs) in concert withbi-valve organisms in the Sacremento/San Joachin River Delta. Chemosphere,25, 1351–1361.
Rastall A C, Neziri A, Vukovic Z, Jung C, Mijovic S, Holbert H, Nikcevic S andErdinger L 2004 The identification of readily bioavailable pollutants in LakeShkodra/Skadar using semi-permeable membrane devices (SPMDs), bioassays

SCIENCE REPORT: SC000062 – THE APPLICATION OF PASSIVE SAMPLING TECHNIQUES FOR WATERQUALITY MONITORING
104
and chemical analysis. ESPR – Environmental Science and Pollution ResearchOnline First [online] 14 pp. DOI: http://dx.doi.org/10.1065/espr2004.03.188
Richardson B J, Zheng G J, Tse E S C and Lam P K S 2001 A comparison ofmussels Perna Veridis and semi-permeable membrane devices (SPMDs) formonitoring chlorinated trace organic contaminants in Hong Kong coastal waters.Chemosphere, 45, 1201–1208.
Rogers H R 1997 Influence of suspended solids and back diffusion on organiccontaminant uptake by semi-permeable membranes (SPMDs). Chemosphere,35, No. 8, 1651–1657.
Symonds R 2003 Guidance for the storage, deployment and analysis of diffusivegradient in thin-film DGT devices. Environment Agency National LaboratoryService Standard Operating Procedures 1–4.
Taylor T N and Lester J N 1995 Polynuclear aromatic hydrocarbons (PAHs) in aRiver Thames sediment core. Environmental Technology, 16, 1155–1163.
US Geological Survey (USGS) 1999 Development and application of techniquesfor sampling bioavailable airborne organic contaminants. United StatesEnvironmental Protection Agency Technical Report prepared by USGS ColumbiaEnvironmental Research Center. http://www.cerc.usgs.gov/pubs/pubs.htm
US Geological Survey (USGS) 2000 A guide for the use of semi-permeablemembrane devices (SPMDs) as samplers of waterborne hydrophobic organiccontaminants. USGS Columbia Environmental Research Center - personalcommunication.
Huckins J N, Petty J D, Prest H F, Clark R C, Alverez D A, Orazio C E, Lebo J A,Cranor W L and Johnson B T (2000) A guide for the use of semi-permeablemembrane devices (SPMDs) as samplers of waterborne hydrophobic organiccontaminants. American Petroleum Institute (API) Publication No. 4690.Washington DC: API.
Van Metre P C, Maler B J and Furlong E T 2000 Urban sprawl leaves its PAHsignature. Environmental Science and Technology, 34, 4064–4070.
Westerberg K 1999 A further investigation into low biological quality in the DwrIal. Technical Memorandum NEAT/99/TM25.
Zhang H and Davison W 1995 Performance characteristics of diffusion gradientsin thin films (DGT) for in-situ measurement of trace metals in aqueous solutions.Analytical Chemistry, 67, No. 19, 3391–3400.
Zhang H 1998 Practical guide for dealing with loaded DGT units. 1–4. DGTResearch Ltd.

We are The Environment Agency. It's our job to look afteryour environment and make it a better place – for you, andfor future generations.
Your environment is the air you breathe, the water you drinkand the ground you walk on. Working with business,Government and society as a whole, we are making yourenvironment cleaner and healthier.
The Environment Agency. Out there, making yourenvironment a better place.
Published by:
Environment AgencyRio HouseWaterside Drive, Aztec WestAlmondsbury, Bristol BS32 4UDTel: 0870 8506506Email: [email protected]
© Environment Agency
All rights reserved. This document may be reproduced withprior permission of the Environment Agency.