the application of sat to transport systems · · 2007-05-11unit process scenario bus-transport...
TRANSCRIPT

Laboratory for Energy Systems Analysis Brussels, 25. April 2007 M.Spielmann
The Application of SAT to "Transport Systems"
Michael SpielmannBrussels April 2007

Laboratory for Energy Systems Analysis Brussels, 25. April 2007 M.Spielmann 2
Table of Content
Introduction: Life Cycle Assessment (LCA) of Transport Systems
Overall Methodological Issues
• Scenario Modelling
• Environmental Rebound Effects
Technology Category Rules (TCR): Examples
The Economic Aspects and Eco-Efficiency
Concluding Remarks and Acknowledgements

Laboratory for Energy Systems Analysis Brussels, 25. April 2007 M.Spielmann 3
LCI-Transport Model Structure (Transport Components)
LCA of Transport Systems Scenario Modelling Rebound Effects TCR – Examples Economic Aspects Conclusions
Vehicle Manufacturing
Vehicle DisposalVehicle
Maintenance
d3d3d3
Infrastructure Construction
Infrastructure Disposal
Infrastructure Maintenance
d4d5d4
0% 10% 20% 30% 40% 50% 60% 70% 80% 90% 100%
CO2, fossile (a)
NMHC (a)
PW Diesel Arbeitsweg [%]
Betrieb Energiebereitstellung Fzg. Herstellung u. Entsorgung Fzg. Unterhalt Infra. Unterhalt Infra. Konstrukt ion
Infrastructure Processes

Laboratory for Energy Systems Analysis Brussels, 25. April 2007 M.Spielmann 4
LCI-Transport Model: Unit Process - Matrix - Approach
LCA of Transport Systems Scenario Modelling Rebound Effects TCR – Examples Economic Aspects Conclusions
⎟⎟⎟⎟⎟⎟⎟⎟⎟⎟⎟⎟⎟⎟
⎠
⎞
⎜⎜⎜⎜⎜⎜⎜⎜⎜⎜⎜⎜⎜⎜
⎝
⎛
=⎟⎟⎠
⎞⎜⎜⎝
⎛
n
j
m
i
b
b
ba
a
a
...
...
...
...
1
1
ba
⎟⎟⎟⎟⎟⎟⎟⎟⎟⎟⎟⎟⎟⎟
⎠
⎞
⎜⎜⎜⎜⎜⎜⎜⎜⎜⎜⎜⎜⎜⎜
⎝
⎛
=⎟⎟⎠
⎞⎜⎜⎝
⎛=
......
............
......
............
......
......
............
......
............
......
1
1
111
1
1
111
nln
jlj
l
mlm
ili
l
bb
bb
bbaa
aa
aa
BA
P
Unit process Process system
A
B
Cummulative Impacts of a process system: XS = B * A-1 * rS
Laboratory for Energy Systems Analysis Brussels, 25. April 2007 M.Spielmann 5
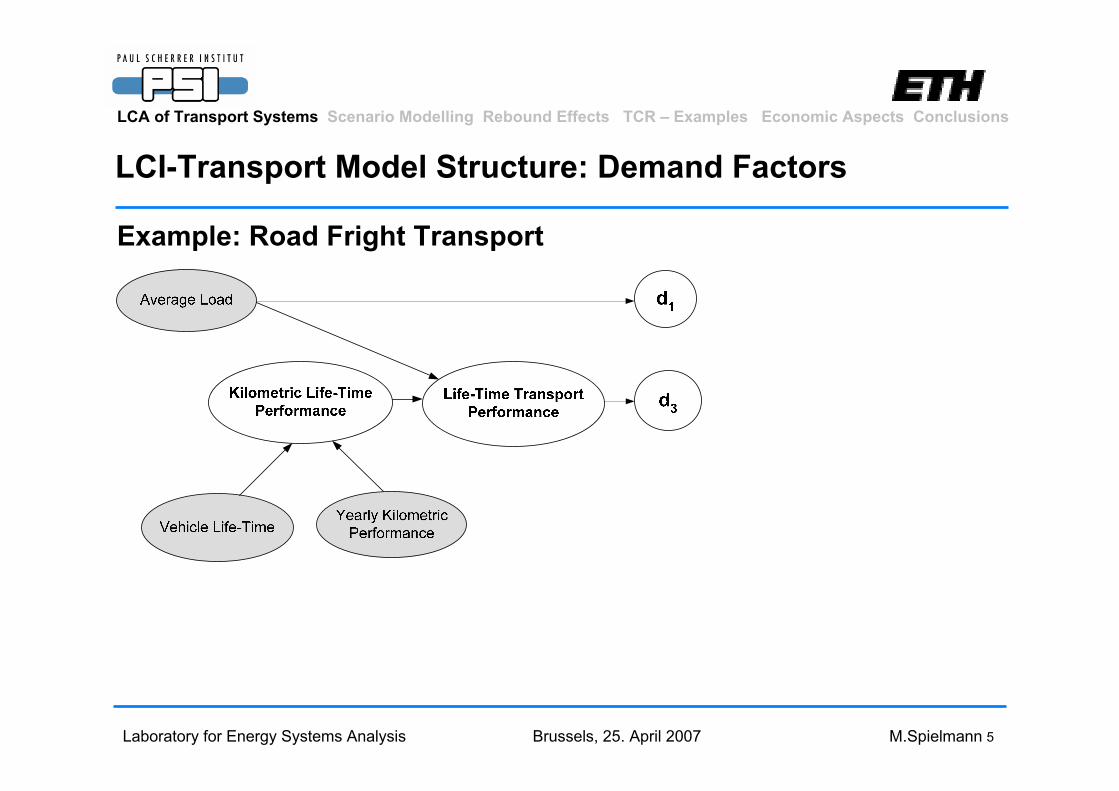
LCI-Transport Model Structure: Demand Factors
LCA of Transport Systems Scenario Modelling Rebound Effects TCR – Examples Economic Aspects Conclusions
Example: Road Fright Transport

Laboratory for Energy Systems Analysis Brussels, 25. April 2007 M.Spielmann 6
LCI-Transport Model: Transport ComponentsLCA of Transport Systems Scenario Modelling Rebound Effects TCR – Examples Economic Aspects Conclusions
0% 10% 20% 30% 40% 50% 60% 70% 80% 90% 100%
lorry 32t (RER)
lorry EURO 3 (DE, 50% load)
lorry EURO 3 (DE, 100% load)
Barge
Barge excl. river
Rail (RER)
lorry 32t RER
lorry EURO 3 (DE, 50% load)
lorry EURO 3 (DE, 100% load)
Barge
Barge excl. river
Rail (RER)
CO
2N
ox
operation infrastructure

Laboratory for Energy Systems Analysis Brussels, 25. April 2007 M.Spielmann 7
Types and Scope of LCA studies: level of comparison
LCA of Transport Systems Scenario Modelling Rebound Effects TCR – Examples Economic Aspects Conclusions
Transport technology singularly vs. transport system level
– transport services singularly:– a) an intra-modal comparison (e.g. diesel vs. gas bus)
and/or – b) an inter-modal comparison (e.g. bus vs. rail), provided
a complete substitution of one mode (e.g. rail) with another mode (e.g. bus) takes place.
– transport system level assessment, i.e. taking into account possible changes in the technology development of transport services and in the modal split.

Laboratory for Energy Systems Analysis Brussels, 25. April 2007 M.Spielmann 8
Intra-Modal Comparison (Fuel Type)
LCA of Transport Systems Scenario Modelling Rebound Effects TCR – Examples Economic Aspects Conclusions
Vs.

Laboratory for Energy Systems Analysis Brussels, 25. April 2007 M.Spielmann 9
Inter-Modal Comparison
LCA of Transport Systems Scenario Modelling Rebound Effects TCR – Examples Economic Aspects Conclusions
Vs.

Laboratory for Energy Systems Analysis Brussels, 25. April 2007 M.Spielmann 10
Transport System Level Assessment
LCA of Transport Systems Scenario Modelling Rebound Effects TCR – Examples Economic Aspects Conclusions

Laboratory for Energy Systems Analysis Brussels, 25. April 2007 M.Spielmann 11
Requirements for Sustainable Assessment of Transport Technologies
LCA of Transport Systems Scenario Modelling Rebound Effects TCR – Examples Economic Aspects Conclusions
A systematic and transparent approach addressing the investigation of:
• parallel changes and developments in other technologies and products that will be linked with the analysed technology in the life cycle context; background processes.
• parallel developments of the system to be substituted. For instance, if we investigate the environmental consequences of a
future substitution of rail transport with bus transport we have to account for possible future bus technologies (options) but also we have to investigate future possible train transport technologies.
• the introduction of new transport technologies/modes that are likely to reshape the balance between transport modes and services (e.g. maglev technology) should be investigated on transport system level.

Laboratory for Energy Systems Analysis Brussels, 25. April 2007 M.Spielmann 12
LCA of Transport Systems Scenario Modelling Rebound Effects TCR – Examples Economic Aspects Conclusions
Scenario Modelling

Laboratory for Energy Systems Analysis Brussels, 25. April 2007 M.Spielmann 13
Definitions
LCA of Transport Systems Scenario Modelling Rebound Effects TCR – Examples Economic Aspects Conclusions
Scenarios
• describe hypothetical possible future states of a system (at least 2)
• consist of a consistent set of key variables representing the system under investigation
• assist our understanding of possible future developments of complexsystems
• are neither predictions nor forecasts
• Are no policy recommendations
Scenario Analysis in LCA:
• Aim: Identification of a set of cornerstone scenarios (2-4) representing the entire product system *)
• Problem: Heterogeneous nature of an LCA product system

Laboratory for Energy Systems Analysis Brussels, 25. April 2007 M.Spielmann 14
Requirements and Tool
LCA of Transport Systems Scenario Modelling Rebound Effects TCR – Examples Economic Aspects Conclusions
Requirements
• Scenario development on unit process level (bottom up approach), addressing uncertainties due to different possible developments of technology options (foreground processes) and background systems.
Problem: combinatorial multitude Scenario Integration is required
Tool: Formative Scenario Analysis (FSA)
• Principle of FSA: – allows for the application of formal mathematical criteria to
a)structure the process of unit process scenario constructionb)select a set of consistent and diverse cornerstone scenarios
– variables are known, but the knowledge about the quantitative interrelation of these variables with the rest of the system is incomplete.
( )TnK
ni
nk
Kkikk ddd ,,,,11 KK=s

Laboratory for Energy Systems Analysis Brussels, 25. April 2007 M.Spielmann 15
Case Study: Future Regional Transport vs. Bus
LCA of Transport Systems Scenario Modelling Rebound Effects TCR – Examples Economic Aspects Conclusions
Options for decision maker
Possible development of public bus transport
Research Question:•Is regional rail transport in the year 2020 still the environmental preferable option,
•And if so, under which conditions.

Laboratory for Energy Systems Analysis Brussels, 25. April 2007 M.Spielmann 16
Unit Process Selection
LCA of Transport Systems Scenario Modelling Rebound Effects TCR – Examples Economic Aspects Conclusions
Process Matrix A Unit Processes for Scenario Modelling
Selection Criteria:considerable time dependenceenvironmental importance
Transport Rail Transport Bus
Electricity (p80)
CO2
S1 S2 S3
LFO Refining &Reg.Storage (p90)
CO2
S1 S2 S3
Diesel Refining &Reg. Storage (p100)
CO2
S1 S2 S3
Operation Train (p1)
CO2
S1 S2 S3
Infrastructure Rail(p20)
CO2
S1 S2 S3
Manufacturing Train(p10)
CO2
S1 S2 S3
Operation Bus (p30)
CO2
S1 S2 S3
Manufacturing Bus(p40)
CO2
S1 S2 S3
NG LocalDistribution (p120)
CO2
S1 S2 S3
Extraction/Processing/Transport Oil (p130)
CO2
S1 S2 S3
Extraction/Processing/Transport NG (p140)
CO2
S1 S2 S3

Laboratory for Energy Systems Analysis Brussels, 25. April 2007 M.Spielmann 17
Steps and Moves
LCA of Transport Systems Scenario Modelling Rebound Effects TCR – Examples Economic Aspects Conclusions
Bus OperationBus Manufacturing
Electricity Supply
Unit Process Scenario Development:
Incl. Scenario Variables Selection

Laboratory for Energy Systems Analysis Brussels, 25. April 2007 M.Spielmann 18
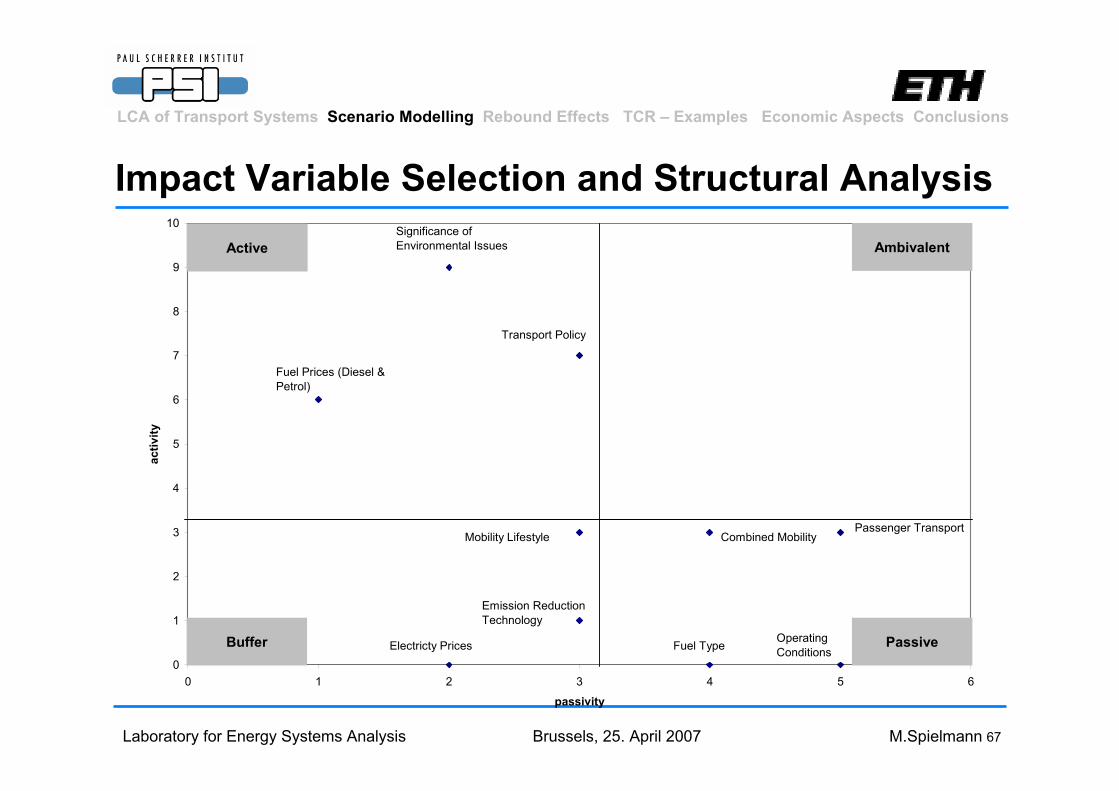
Impact Variable Selection and Structural Analysis
LCA of Transport Systems Scenario Modelling Rebound Effects TCR – Examples Economic Aspects Conclusions
Identification of driving forces forenv. interventions of a LCI unit
process
Identification of driving forces of aLCI unit process’ environment
Identification of Key Variables
1. Selection ofScenarioVariables
2. StructuralAnalysis
Moves
)d( t VariablesTechnology )d( e ariablesEconomic V-Socio
1td affectingd of tionIdentifica e
Ttd affectingd of tionIdentifica e
2td affecting d of tionIdentifica e …

Laboratory for Energy Systems Analysis Brussels, 25. April 2007 M.Spielmann 19
Scenario Construction and Quantification
LCA of Transport Systems Scenario Modelling Rebound Effects TCR – Examples Economic Aspects Conclusions
⎟⎟⎟⎟⎟⎟⎟⎟
⎠
⎞
⎜⎜⎜⎜⎜⎜⎜⎜
⎝
⎛
1nj
1j1
1mj
1j1
b...
ba...
a
⎟⎟⎟⎟⎟⎟⎟⎟
⎠
⎞
⎜⎜⎜⎜⎜⎜⎜⎜
⎝
⎛
2nj
2j1
2mj
2j1
b...
ba...
a
⎟⎟⎟⎟⎟⎟⎟⎟
⎠
⎞
⎜⎜⎜⎜⎜⎜⎜⎜
⎝
⎛
rnj
rj1
rmj
rj1
b...
ba...
a
=1jp =r
jp=2jp
td selected for states future posible of Definition
tδ
et dd selected of and selected of states Linking et δδ
ed selected for states future posible of Definition
eδ

Laboratory for Energy Systems Analysis Brussels, 25. April 2007 M.Spielmann 20
Scenario Construction and Quantification
LCA of Transport Systems Scenario Modelling Rebound Effects TCR – Examples Economic Aspects Conclusions
No. Name Description # of levels Future levels (levels)
Technology Impact Variable ( td ) Compressed Natural Gas (CNG)
1 Fuel Type Fuel used for the operation of bus (compressed natural gas (CNG) or diesel)
21 =m
Diesel
PM-Kat/ Euro 4 Particle-filter/ Euro 5
2 Emission Reduction Technology Technical measures to fulfill certain future emission regulation. (EURO-Norms)
32 =m
DeNOx (SCR)/ Euro 5 Urban: constant travel Rural: constant travel. Urban: stop and go (S&G). Rural: constant travel.
3 Operating Conditions Operation mode depending on type of road and traffic conditions. (trip composition: 20% urban; 80% rural)
33 =m
Urban: 50 % S&G and 50% constant travel. Rural: Constant Travel

Laboratory for Energy Systems Analysis Brussels, 25. April 2007 M.Spielmann 21
Scenario Construction and Quantification
LCA of Transport Systems Scenario Modelling Rebound Effects TCR – Examples Economic Aspects Conclusions
No. Name Description # of levels Future levels (levels)
Socio-Economic Impact Variable ( ed ) Vanished Global
4 Significance of Environmental Issues
Orientation of environmental policy and general environmental awareness.
34 =m
Global and local Decline Slight increase
5 Fuel Prices Prices for conventional fossil fuels (diesel and petrol)
35 =m
Significant increase Directed promotion rail and road Promotion rail
6 Transport Policy Promotion of certain means of transport, such as rail use or use of private cars.
36 =m
Promotion road Constant Slight increase
7 Mobility Lifestyle Mobility demand; total amount of passenger kilometers.
37 =m
Significant increase

Laboratory for Energy Systems Analysis Brussels, 25. April 2007 M.Spielmann 22
Unit Process Scenario Bus-Transport (excerpt)
LCA of Transport Systems Scenario Modelling Rebound Effects TCR – Examples Economic Aspects Conclusions
Impact Factors UPS1 UPS2
Significance of Env. Issues global & local globalFuel Prices significant increase slight increaseTransport Policy Road & Rail: + Road & Rail: +Mobility Life Style constant transport demand sign. increased transp. demand
Fuel Type CNG DieselEm.Reduction Technology n.a. DeNox (SCR) Cat (Euro 5)Operating Conditions constant 20% S&G urban
Socio-economic
Technolgy
Linking states of impact variables

Laboratory for Energy Systems Analysis Brussels, 25. April 2007 M.Spielmann 23
Scenario Integration: Identification of Cornerstone Sc.
Integration is based on all unit process specific socio-economic impact variablesProblem:
• 10 impact variables and • each variable only has 2 stateswe will have 210 different scenarios.
Tool for the reduction of number of possible scenarios is required to single out a set of cornerstone scenarios that are charaterised as follows:
• High consistency score • No inconsistencies• Diversity
LCA of Transport Systems Scenario Modelling Rebound Effects TCR – Examples Economic Aspects Conclusions
Tools:
Consistency Analysis:
For each pair of impact variables and possible states a single consistency measure is determined.
Minimum Distance Analysis
Selection of scenarios (out of the set of consistent scenarios) that differ in a defined number of states of impact factors
Laboratory for Energy Systems Analysis Brussels, 25. April 2007 M.Spielmann 24
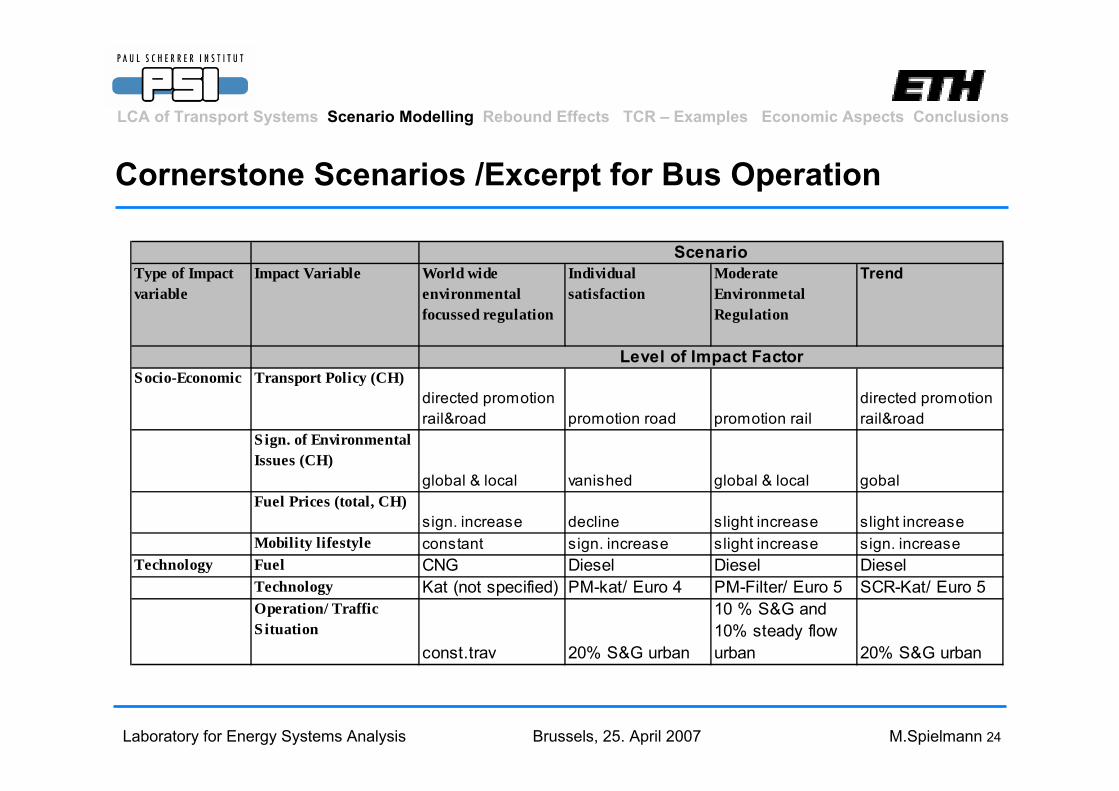
Cornerstone Scenarios /Excerpt for Bus Operation
LCA of Transport Systems Scenario Modelling Rebound Effects TCR – Examples Economic Aspects Conclusions
Type of Impact variable
Impact Variable World wide environmental focussed regulation
Individual satisfaction
Moderate Environmetal Regulation
Trend
Socio-Economic Transport Policy (CH)directed promotion rail&road promotion road promotion rail
directed promotion rail&road
Sign. of Environmental Issues (CH)
global & local vanished global & local gobalFuel Prices (total, CH)
sign. increase decline slight increase slight increaseMobility lifestyle constant sign. increase slight increase sign. increase
Technology Fuel CNG Diesel Diesel DieselTechnology Kat (not specified) PM-kat/ Euro 4 PM-Filter/ Euro 5 SCR-Kat/ Euro 5Operation/ Traffic S ituation
const.trav 20% S&G urban
10 % S&G and 10% steady flow urban 20% S&G urban
Scenario
Level of Impact Factor

Laboratory for Energy Systems Analysis Brussels, 25. April 2007 M.Spielmann 25
Results/ Interpretation
LCA of Transport Systems Scenario Modelling Rebound Effects TCR – Examples Economic Aspects Conclusions
0
0.01
0.02
0.03
0.04
0.05
0.06
Rail: lo
w cost
Rail: c
omfor
t
Rail: u
ltra lig
htBus
: CNG Car
Rail: lo
w cost
Rail: c
omfor
t
Rail: u
ltra lig
ht
Bus: D
iesel
PM-Kat Car
Rail: lo
w cost
Rail: c
omfor
t
Rail: u
ltra lig
ht
Bus: D
iesel
PM-Filte
rCar
Rail: lo
w cost
Rail: c
omfor
t
Rail: u
ltra lig
ht
Bus: D
iesel
SCR-Kat Car
Technology Options and Alternatives
Clim
ate
Cha
nge
Emis
sion
Sco
res
in k
g C
O2
eq.
/sea
t Kilo
met
re
direct emissions pre combusition manufacturing transport infrastructure
Worldwide Environmental Regulation
Individual Satisfaction
Moderate Environmental Regulation
Trend
Spielmann M, Scholz R W, de Haan P and Tietje O (2004): Scenario Modelling in Prospective LCA of Transport Systems: Application of Formative Scenario Analysis. Int J LCA online first, 11

Laboratory for Energy Systems Analysis Brussels, 25. April 2007 M.Spielmann 26
Conclusions (1)
The feasibility of scenario modelling for LCA could be demonstrated in a transport case study.
In order to facilitate unit process scenario modelling, the selected unit processes must fulfil two conditions:
1. different possible technology options are known and
2. these technology options can be linked to at least one variable in the socio-economic environment of a considered unit process
LCA of Transport Systems Scenario Modelling Rebound Effects TCR – Examples Economic Aspects Conclusions

Laboratory for Energy Systems Analysis Brussels, 25. April 2007 M.Spielmann 27
Conclusions (2)
The proposed procedure is• well-suited to support participatory methods, in particular to structure the process
of scenario modelling, and thus improves the credibility of LCA in the framework of participatory Technology Assessment 1)
• provides a framework for the application of various forecasting methods and allows for the integration of tools to tackle data uncertainties (e.g. Monte Carlo simulation).
• Offers the potential to link technology developments to external impact variables such as policy options, oil price developments.
In principle the concept is applicable to facilitate prospective life cycle assessment of other technologies and thus may be applicable for SAT
LCA of Transport Systems Scenario Modelling Rebound Effects TCR – Examples Economic Aspects Conclusions
1: Joss S. and Bellucci S. (2002) Participatory Technology Assessment. European perspectives. Centre for the Study of Democracy (CSD) at University of Westminster in association with TA Swiss, London.

Laboratory for Energy Systems Analysis Brussels, 25. April 2007 M.Spielmann 28
LCA of Transport Systems Scenario Modelling Rebound Effects TCR – Examples Economic Aspects Conclusions
Rebound Effects

Laboratory for Energy Systems Analysis Brussels, 25. April 2007 M.Spielmann 29
Rebound Effects: Types
LCA of Transport Systems Scenario Modelling Rebound Effects TCR – Examples Economic Aspects Conclusions
Conventional:
Rebound of energy with respect to changes in energy-efficiency
Observed decrease in energy consumption lower than theoretical
decrease as derived from increase in energy-efficiency
Also:
Rebound of time with respect to changes in time-efficiency
(relevant, since time = money, and time = energy)

Laboratory for Energy Systems Analysis Brussels, 25. April 2007 M.Spielmann 30
Rebound Effects: Examples
LCA of Transport Systems Scenario Modelling Rebound Effects TCR – Examples Economic Aspects Conclusions

Laboratory for Energy Systems Analysis Brussels, 25. April 2007 M.Spielmann 31
Transport Related Examples
LCA of Transport Systems Scenario Modelling Rebound Effects TCR – Examples Economic Aspects Conclusions
Rebound effects possibly related to hybrid cars:
• (above-trend) increase in car size
• increase in average household vehicle ownership
• use hybrid car instead of mass transit“ / more and/or longer trips
New by-pass for congested roads
• more traffic
Improved (faster) train service:
• increase of commuting distance (same commuting time budget)

Laboratory for Energy Systems Analysis Brussels, 25. April 2007 M.Spielmann 32
Environmental Rebound Effect (Time)
• The environmental rebound effect describes changes in the environmental performance of a transport system due to the introduction of a time-saving innovation in an existing the transport system.
• Two types of environmental impact changes, describing the difference of a transport system with high-speed transport (A1) and a transport system without high speed transport (A0):
LCA of Transport Systems Scenario Modelling Rebound Effects TCR – Examples Economic Aspects Conclusions

Laboratory for Energy Systems Analysis Brussels, 25. April 2007 M.Spielmann 33
Environmental Rebound Effect (Time)
LCA of Transport Systems Scenario Modelling Rebound Effects TCR – Examples Economic Aspects Conclusions
∆EIcp: Environmental impact changes (∆EIcp) expressing exclusively efficiency substitution effects of selected transport service with high speed transport; i.e. the total kilometric performance of the transport system remains constant, (cp = ceteris paribus).
∆EIdc: Environmental impact changes expressing efficiency substitution effects and including environmental impacts due to demand corrections (dc). The latter describe the environmental impacts of the activities that occupies the time that is saved by using a high speed transport service instead of a conventional service.
Environmental Rebound Effect: cp
dc
EIEIERE
∆∆
−=1

Laboratory for Energy Systems Analysis Brussels, 25. April 2007 M.Spielmann 34
Environmental Rebound Effect (Time)
The revealed Environmental Impact Changes and theoretical Environmental Impact Changes for each scenario S are derived follows:
where TDi is the daily transport demand (pkm) of a certain transport service i, and EEi is the environmental efficiency (kg/pkm) of transport service i.
Si
Si
i
Si
SSsdc EETDTDEIEIEI AdcA
dc*)( .
001
,1−=−=∆ ∑
LCA of Transport Systems Scenario Modelling Rebound Effects TCR – Examples Economic Aspects Conclusions
Si
Si
i
Si
SSscp EETDTDEIEIEI AcpA
cp*)( .
001
,1−=−=∆ ∑

Laboratory for Energy Systems Analysis Brussels, 25. April 2007 M.Spielmann 35
Environmental Rebound Effect (Time)
LCA of Transport Systems Scenario Modelling Rebound Effects TCR – Examples Economic Aspects Conclusions
-10 10
-10
? EIdc
? EIcp
1b
1a
10 5 4
ERE > 0 ERE < 0
AC D III
I IV
II
32
BClassification of Rebound
Effects:1. Classical ERE (0 < ERE < 2)
2. Compensational ERE (ERE = 2)
3. Backfire Effect (ERE > 2)
4. Amplifying Effect (0 > ERE > -1)
5. Leverage Effect (ERE <= -1)

Laboratory for Energy Systems Analysis Brussels, 25. April 2007 M.Spielmann 36
Case Study Swissmetro: Method, Concepts & Scope
LCA of Transport Systems Scenario Modelling Rebound Effects TCR – Examples Economic Aspects Conclusions
Scenario Modelling: (Swiss Transport System 2040)
• Unit Process S.: Technology improvements of transport services
• Service S.: Future changes in traveler behavior
Transport Demand Modelling:• Concept: Constant Travel Time Budget (TTB) 1):
– people will allocate a fixed amount of their daily time to travel. – Consequently, if travel speed increases, the time saved will be exclusively used to travel
more or further. – The TTB only holds for all travel by all modes. The sum of the daily per capita travel
time, TT, over all modes of transport, i, which satisfy daily transport demands, TDi, at mean speed ,vi, must equal the TTB.
Functional Unit: Daily mobility demand of an average Swiss traveler
1: Schafer, A. (1998). "The global demand for motorized mobility." Transportation Research Part A: Policy and Practice, 32(6), 455-477..

Laboratory for Energy Systems Analysis Brussels, 25. April 2007 M.Spielmann 37
Environmental Rebound Effect (Time)
LCA of Transport Systems Scenario Modelling Rebound Effects TCR – Examples Economic Aspects Conclusions
0
1000
2000
3000
4000
5000
6000
EI0 EIcp EIdc EI0 EIcp EIdc EI0 EIcp EIdc EI0 EIcp EIdc
Individual Diversity Moderate Regulation Sufficiency World in Change
g C
O2
eq.*(
trav
elle
r*da
y)-1
Car Motorbike Local Public Road Transport Coach Train Aircraft Swissmetro
∆EIcp ∆EIdc
Laboratory for Energy Systems Analysis Brussels, 25. April 2007 M.Spielmann 38
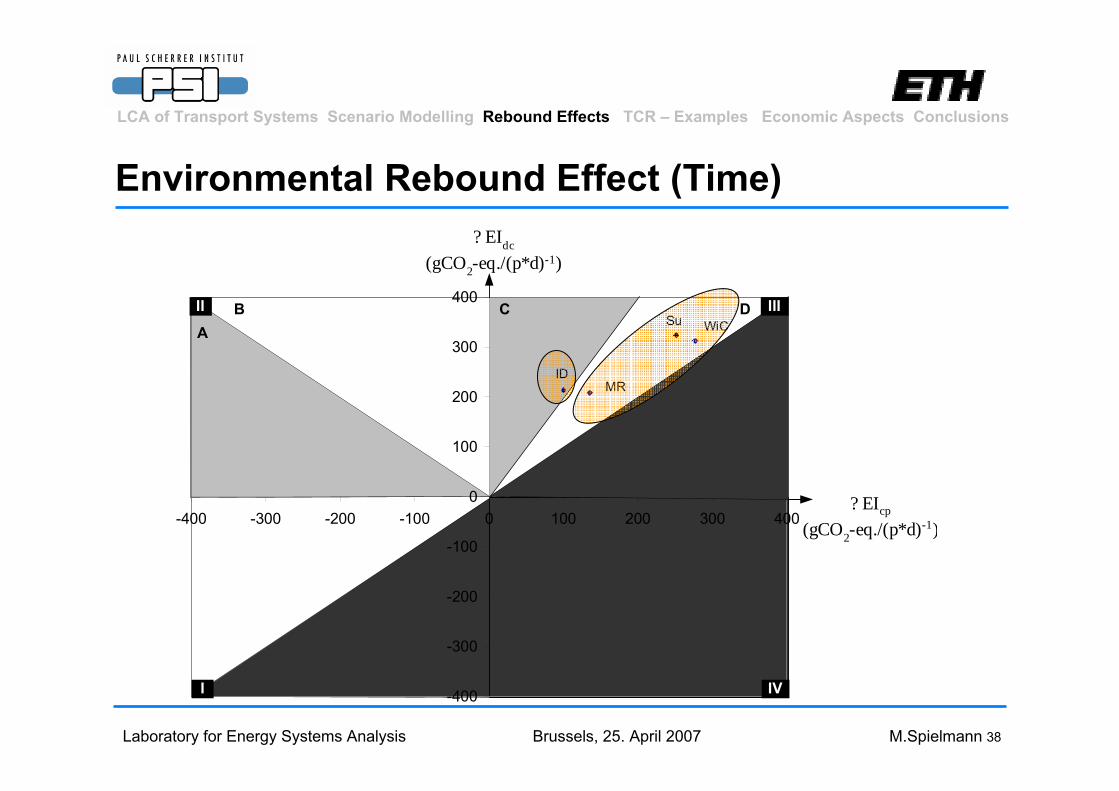
Environmental Rebound Effect (Time)
LCA of Transport Systems Scenario Modelling Rebound Effects TCR – Examples Economic Aspects Conclusions
-400
-300
-200
-100
0
100
200
300
400
-400 -300 -200 -100 0 100 200 300 400
IDMR
Su WiC
? EIdc
(gCO2-eq./(p*d)-1)
II
I
III
IV
AB C D
? EIcp
(gCO2-eq./(p*d)-1)

Laboratory for Energy Systems Analysis Brussels, 25. April 2007 M.Spielmann 39
Conclusions (1)
Methodology:
• The foundation of the quantification of the ERE is a comprehensive environmental assessment of the new transport technology as well as possible developments of existing transport services.
• For high-speed transport technologies that require a completely new vehicle concepts as well as transport infrastructure, a life cycle approach – taking into account all transport components – is required.
• Integration of scenario modeling to address uncertainties in technological developments of existing transport services and changes in mobility patterns that may occur at the time the new transport technology is in operation has been demonstrated in a case study.
LCA of Transport Systems Scenario Modelling Rebound Effects TCR – Examples Economic Aspects Conclusions

Laboratory for Energy Systems Analysis Brussels, 25. April 2007 M.Spielmann 40
Conclusions (2)
Constrains:
• Ceteris paribus restriction of unit process paradigm of LCA:expected rebound effects on a macro-level – for instance as a consequence of changes in the regional development – cannot be considered, since they are likely to change production patterns in distant sectors as well.
• Constant travel time budget is not a commonly accepted hypothesis 1).
LCA of Transport Systems Scenario Modelling Rebound Effects TCR – Examples Economic Aspects Conclusions
1: Mokhtarian, P. L. and C. Chen (2004). "TTB or not TTB, that is the question: a review and analysis of the empirical literature
on travel time (and money) budgets." Transportation Research Part A: Policy and Practice 38(9-10): 643-675

Laboratory for Energy Systems Analysis Brussels, 25. April 2007 M.Spielmann 41
TCR Examples
LCA of Transport Systems Scenario Modelling Rebound Effects TCR – Examples Economic Aspects Conclusions

Laboratory for Energy Systems Analysis Brussels, 25. April 2007 M.Spielmann 42
General Information:
Scope: • depends on the type of investigation intra modal vs. inter modal vs. system level.
Functional Unit• depends on the type of investigation intra modal vs. inter modal vs. system level.• supply or demand oriented
Data:• Case specific data (e.g. load factors, emission standards)• Generic data should be based on same assumption (e.g. heating values) and principle (e.g.
cut-off allocation for metals).Impact Categories:
• Mandatory: Climate Change (incl. at least CO2, CH4 and N2O), regulated single pollutants: NOx, PM, NMHC
• Research: Land Use (occupation and transformation) (infrastructure and for biofuels)
LCA of Transport Systems Scenario Modelling Rebound Effects TCR – Examples Economic Aspects Conclusions

Laboratory for Energy Systems Analysis Brussels, 25. April 2007 M.Spielmann 43
Supply to Demand: Break-Even-Points of Load Factors
LCA of Transport Systems Scenario Modelling Rebound Effects TCR – Examples Economic Aspects Conclusions
Bus vs. Car for NOx (incl. vehicle manufacturing)
0 5 10 15 20 25 30 35 40 45 50 55 60 65 70 75 80 85 90 95 100
Demand (passengers)
Envi
ronm
enta
l Im
pact
NO
x Bus (50 seats EURO2)
Bus (50 seats, EURO4)
Car (1.59 p, Diesel)
Car (1.59 p, Petrol)

Laboratory for Energy Systems Analysis Brussels, 25. April 2007 M.Spielmann 44
Life Cycle Inventory
Vehicle Travel:
• Emission Indices for fuel dependent emissions (e.g. CO2, SO2, HM; e.g. SO2/kgFuel)
• Type of emission measurement. (underlying driving cycle; furthercalculations).
• Emission Reduction Technology
• Inclusion of cold start emissions, varporisation ??
• Emissions due to abrasion (tyres: Zinc, PM)
• Rail Transport: electricity mix (often rail specific mixes)
LCA of Transport Systems Scenario Modelling Rebound Effects TCR – Examples Economic Aspects Conclusions

Laboratory for Energy Systems Analysis Brussels, 25. April 2007 M.Spielmann 45
Life Cycle Inventory
Fuel Supply:• Demand Factor d = fuel consumption• Fuel type (incl. S-content, heating value, density)• Information on the feedstock and conversion processes in particular for
alternative fuels:E.g. Fischer Tropsch Diesel:
– Feedstock: – Forest wood chips and/or industrial residual wood chips– Properties: heating values (MJ/bulk-m3), potential…..– Transport activities
– Conversion Process: – Plant Size, Plant concept: e.g. Entrained Flow Gasifier vs. Choren-
concept. – Documentation of: heat use, overall process efficiency. By-
products/Allocation ?!
LCA of Transport Systems Scenario Modelling Rebound Effects TCR – Examples Economic Aspects Conclusions

Laboratory for Energy Systems Analysis Brussels, 25. April 2007 M.Spielmann 46
Life Cycle Inventory
Vehicle Infrastructure:
• Demand Factor d, is based on vehicle life time performance.
• Material Composition (problem: numerous materials)
• Env. Burdens of Assembly Processes (Energy use !!)
• Maintenance Expenditures incl. Repair (Battery !!)
For comparisons: specification and quantification of new features
LCA of Transport Systems Scenario Modelling Rebound Effects TCR – Examples Economic Aspects Conclusions

Laboratory for Energy Systems Analysis Brussels, 25. April 2007 M.Spielmann 47
Life Cycle Impact Assessment: Life Cycle Stages
In the description of the analysis and consequent impact assessment's inventory, and in the calculation and presentation of the results, the life-cycle should be divided into three/four phases:
LCA of Transport Systems Scenario Modelling Rebound Effects TCR – Examples Economic Aspects Conclusions
EcoIndicator 99 H/A
0.00E+00
5.00E-03
1.00E-02
1.50E-02
2.00E-02
2.50E-02
Petrol car Diesel car Petrol car Diesel car Petrol car Diesel car Petrol car Diesel car
2000 2005 2008 2010
EI-P
t/vkm
Vehicle Travel Fuel Chain Car Infrastructure

Laboratory for Energy Systems Analysis Brussels, 25. April 2007 M.Spielmann 48
Life Cycle Impact Assessment: Contribution Analysis (1)
Contribution Analysis of NOx, CO2 and PM5 to the EI-99 HA
LCA of Transport Systems Scenario Modelling Rebound Effects TCR – Examples Economic Aspects Conclusions
0%
10%
20%
30%
40%
50%
60%
70%
80%
90%
Diesel2000
Diesel2010
Petrol2000
Petrol2010
Diesel2000
Diesel2010
Petrol2000
Petrol2010
Diesel2000
Diesel2010
Petrol2000
Petrol2010
Diesel2000
Diesel2010
Petrol2000
Petrol2010
Nitrogen Oxide PM 2.5 Carbon dioxide Sum (NOx; PM2.5; CO2)
% o
f EI-P
oint
s
Vehicle Travell Fuel Consumption Car Infrastructur Total Life Cycle
Laboratory for Energy Systems Analysis Brussels, 25. April 2007 M.Spielmann 49
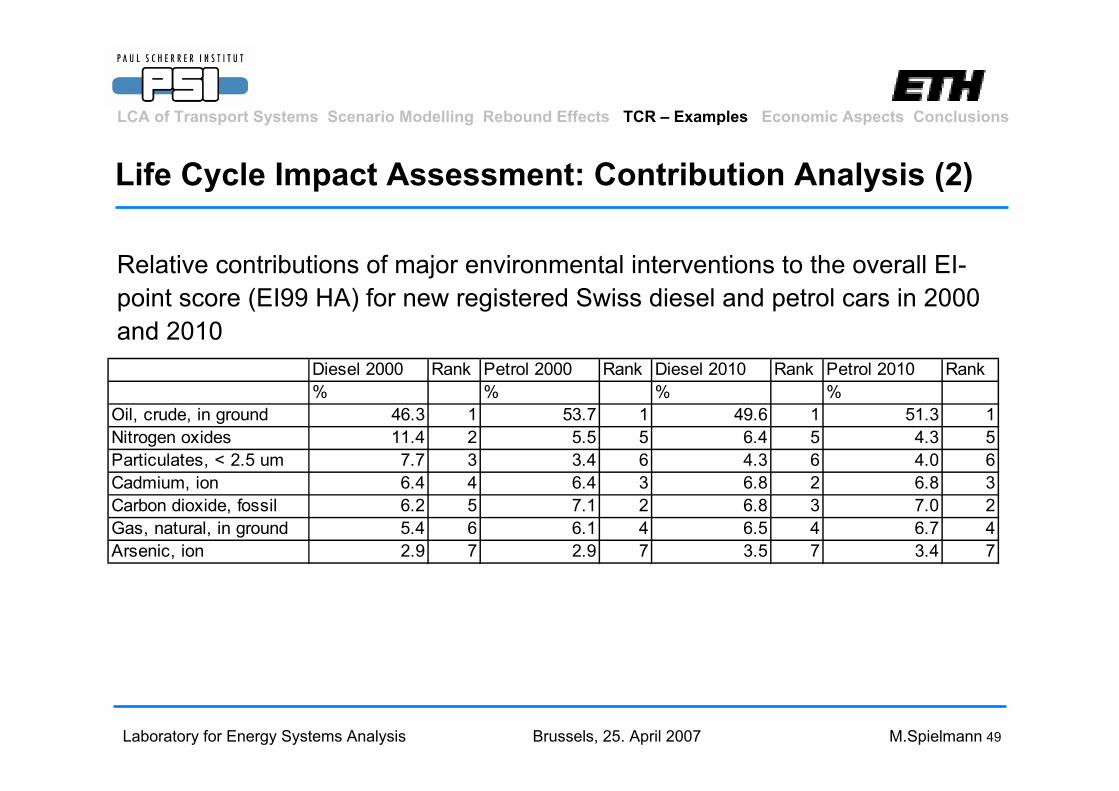
Life Cycle Impact Assessment: Contribution Analysis (2)
Relative contributions of major environmental interventions to the overall EI-point score (EI99 HA) for new registered Swiss diesel and petrol cars in 2000 and 2010
LCA of Transport Systems Scenario Modelling Rebound Effects TCR – Examples Economic Aspects Conclusions
Diesel 2000 Rank Petrol 2000 Rank Diesel 2010 Rank Petrol 2010 Rank% % % %
Oil, crude, in ground 46.3 1 53.7 1 49.6 1 51.3 1Nitrogen oxides 11.4 2 5.5 5 6.4 5 4.3 5Particulates, < 2.5 um 7.7 3 3.4 6 4.3 6 4.0 6Cadmium, ion 6.4 4 6.4 3 6.8 2 6.8 3Carbon dioxide, fossil 6.2 5 7.1 2 6.8 3 7.0 2Gas, natural, in ground 5.4 6 6.1 4 6.5 4 6.7 4Arsenic, ion 2.9 7 2.9 7 3.5 7 3.4 7

Laboratory for Energy Systems Analysis Brussels, 25. April 2007 M.Spielmann 50
Life Cycle Impact Assessment: Prospective LCA
Implications for Prospective LCA
So far the presented method for prospective LCA is only is applicable to the life cycle inventory analysis of LCA.
Further research may be focus on the identification and comparison of scenarios already inherent in
• commonly used impact categories and
• weighting factors.
LCA of Transport Systems Scenario Modelling Rebound Effects TCR – Examples Economic Aspects Conclusions

Laboratory for Energy Systems Analysis Brussels, 25. April 2007 M.Spielmann 51
Economic Dimension: Concept of Eco-Efficiency
A
B
C
D
Current Concept
0
0.5
1
1.5
2
0 0.5 1 1.5 2
Economic Expenses (EcoE)
Envi
ronm
enta
l Bur
dens
(Env
B)
inferior
win-win situation
Suh S., Lee K. M. and Ha S. (2005) Eco-efficiency for pollution prevention in small to medium-sited enterprises. In: Journal of Industrial Ecology, 9(4), pp. 223-240.
LCA of Transport Systems Scenario Modelling Rebound Effects TCR – Examples Economic Aspects Conclusions

Laboratory for Energy Systems Analysis Brussels, 25. April 2007 M.Spielmann 52
Economic Dimension EE: Costs vs. Climate Change
IS
PS1
PS2 PS3PS-Mix
Crude Oil Mix
0.00
1.00
2.00
0.20 0.40 0.60 0.80 1.00 1.20 1.40 1.60 1.80
Normalised Costs
Norm
alis
ed C
C-em
issi
ons
PS1: Logging Residues from Mature TreesPS2: Logging Residues and SD-TreesPS3: SD TreesIS: Logging Residues from Impassable Stands
LCA of Transport Systems Scenario Modelling Rebound Effects TCR – Examples Economic Aspects Conclusions

Laboratory for Energy Systems Analysis Brussels, 25. April 2007 M.Spielmann 53
Economic Dimension: Example Forest Wood Chips
A first attempt to apply the concept of EE, revealed some issues that may need to be discussed:
• Level of detail, i.e. unit process definition: The fuel chain crude oil comprises several unit processes, whilst for cost data the oil price and scenarios for the future development may be used, due to a lack of data.
• Definition of production costs: A clear definition and framework of the terms of production costs (e.g. total capital investment costs, operation and maintenance costs, feedstock costs, etc.) must be presented and match with the transport components of the environmental assessment.
• Allocation Principle: According to ISO 14040, allocation should be based on physical principles. However, in cost studies monetary units are applied. Does that imply, we have to apply economic allocation for LCA as well, in order to be consistent?
LCA of Transport Systems Scenario Modelling Rebound Effects TCR – Examples Economic Aspects Conclusions

Laboratory for Energy Systems Analysis Brussels, 25. April 2007 M.Spielmann 54
Conclusions & Recommendations: Methodology
We only identify one method for sustainable assessment of transport technologies with is characterised by:
• Scenario modelling (bottom up approach)– to tackle uncertainties in the technical development in foreground
and selected background processes.– to tackle uncertainties in the demand for transport services to allow
for an analysis on transport system level. (real impacts).
• System boundaries are imposed by the research question and the object of investigation.
• The choice of functional should be demand oriented, however, uncertainties in utilisation should be stated transparently.
LCA of Transport Systems Scenario Modelling Rebound Effects TCR – Examples Economic Aspects Conclusions

Laboratory for Energy Systems Analysis Brussels, 25. April 2007 M.Spielmann 55
Conclusions & Recommendations: Methodology
Challenges:
Current LCA approach is based on the ceteris paribus restriction 1).
it is questionable, whether LCA is applicable in cases, in which the new technology could radically change the surrounding conditions of the background system.
Rebound Effect Assessment poses new data requirements, in particular on consumers behavior. For instance how to people spend the timegained if they save commuting time. Will it be less or even more energy consuming activities.
LCA of Transport Systems Scenario Modelling Rebound Effects TCR – Examples Economic Aspects Conclusions
1: Hofstetter, P. (1998). Perspectives in Life Cycle Impact Assessment: A Structured Approach to Combine Models of the Technosphere, Ecosphere and Valuesphere, Kluwer Academic Publishers, Boston.

Laboratory for Energy Systems Analysis Brussels, 25. April 2007 M.Spielmann 56
Thanks to
Peter de Haan (ETHZ)
Roland W. Scholz (ETHZ)
Alexander Röder (ex-PSI)
Olaf Tietje (ex-ETHZ)
And to you, for your attention
Michael Spielmann

Laboratory for Energy Systems Analysis Brussels, 25. April 2007 M.Spielmann 57
Reserve

Laboratory for Energy Systems Analysis Brussels, 25. April 2007 M.Spielmann 58
processes
Die
sel @
R
egio
nal S
tora
ge
Gas
olin
e @
R
egio
nal S
tora
ge
NG
Hig
h Pr
essu
re
Elec
tric
ity S
uppl
y
Car
M
anuf
actu
ringd
Mai
nten
ance
Car
Ope
ratio
n C
ar
Roa
d C
onst
ruct
ione
Roa
d O
pera
tion
Transport Passenger Car
Commodity Unit
Diesel Fuel kg 1 0 0 0 0 0 4.7E-3 8.5E-1 0 0 Gasoline Fuel kg 0 1 0 0 0 0 6.2E-2 0 0 0 Natural Gas (NG)
MJ 0 0 1 6.7E-1 2.2E+3 0 0 0 0 0
Electricitya kWh 6.7E-3 6.7E-3 7.2E-5 1 2.1E+3 5.8E+2 0 6.1E-1 4.9E+1 0 Passenger Car v b 0 0 0 0 1 0 0 0 0 6.7E-06 Maintenance Car
v b 0 0 0 0 0 1 0 0 0 6.7E-06
Operation car vkm 0 0 0 0 0 0 1 0 0 6.3E-01 Road ma c 0 0 0 0 0 0 0 1 0 5.0E-04 Operation Road
ma c 0 0 0 0 0 0 0 0 1 9.0E-04
Transport Passenger Car
pkm 0 0 0 0 0 0 0 0 0 1
CO2 kg 0 0 1.4E-7 0 0 0 2.1E-1 0 0 0 Nox kg 0 0 0 0 0 0 4.9E-4 0 0 0
LCI-Transport Model: Unit Process - Matrix - Approach
LCA of Transport Systems Scenario Modelling Rebound Effects TCR – Examples Economic Aspects Conclusions
Demand
Factors (d)
Reference
Flow Vector

Laboratory for Energy Systems Analysis Brussels, 25. April 2007 M.Spielmann 59
LCI-Transport Model Structure: Demand Factors (2)
LCA of Transport Systems Scenario Modelling Rebound Effects TCR – Examples Economic Aspects Conclusions
Average LoadNet Vehicle Weight
Vehicle
Ratio Gtkm/tkmVehicle
Total Gtkmperformance on road
network
Road length Specific roaddemand per Gtkm
Specific roaddemand per tkm oftransport service
Total Kilometricperformance on road
network
Road trans. service xyearly kilometric
performance lorry28t yearly kilometricperformance
lorry16t yearly kilometricperformance
Road trans. service xyearly transport
performance lorry28t yearly transportperformance
lorry16t yearly transportperformance
Specific roaddemand per vkm
Ratio vkm/tkmvehicle
Specific roaddemand per tkm oftransport service
d4
d5

Laboratory for Energy Systems Analysis Brussels, 25. April 2007 M.Spielmann 60
Key Factors and Choice of Functional Unit
Technical Equipment oftransport vehicles/
services
LCA of Transport Systems Scenario Modelling Rebound Effects TCR – Examples Economic Aspects Conclusions
Utilisation of vehicle/transport service
Laboratory for Energy Systems Analysis Brussels, 25. April 2007 M.Spielmann 61
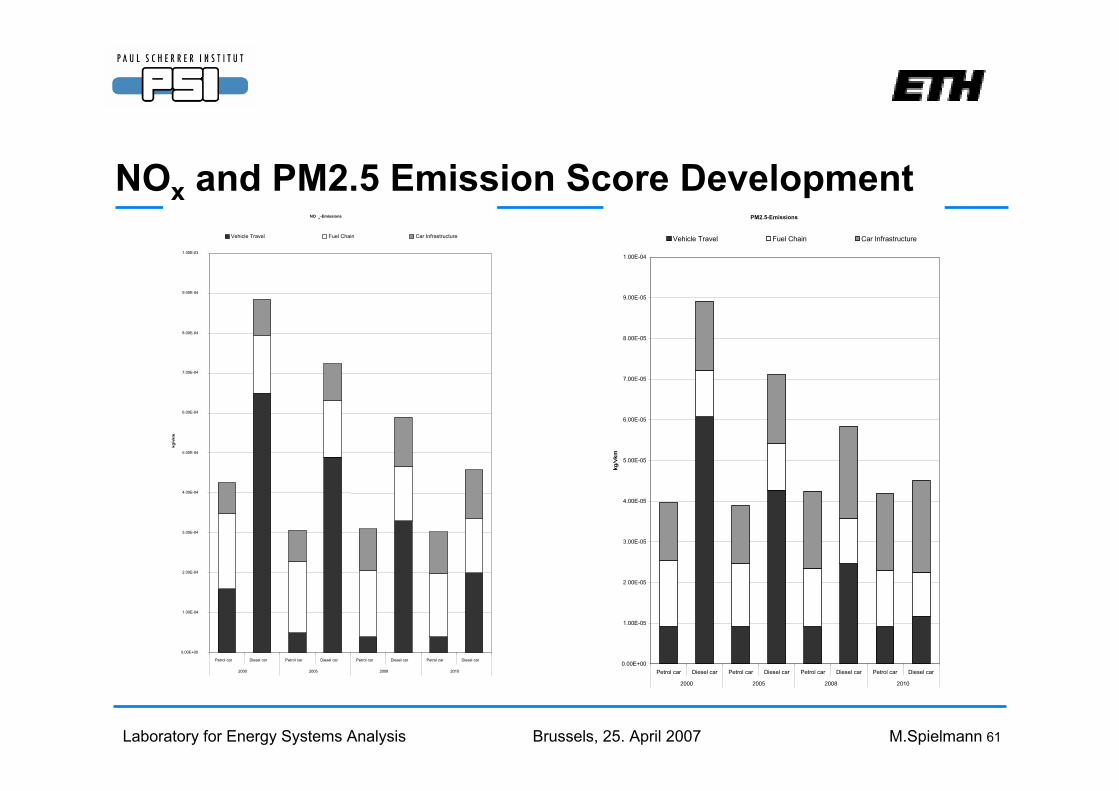
NOx and PM2.5 Emission Score Development NO x -Emissions
0.00E+00
1.00E-04
2.00E-04
3.00E-04
4.00E-04
5.00E-04
6.00E-04
7.00E-04
8.00E-04
9.00E-04
1.00E-03
Petrol car Diesel car Petrol car Diesel car Petrol car Diesel car Petrol car Diesel car
2000 2005 2008 2010
kg/v
km
Vehicle Travel Fuel Chain Car Infrastructure
PM2.5-Emissions
0.00E+00
1.00E-05
2.00E-05
3.00E-05
4.00E-05
5.00E-05
6.00E-05
7.00E-05
8.00E-05
9.00E-05
1.00E-04
Petrol car Diesel car Petrol car Diesel car Petrol car Diesel car Petrol car Diesel car
2000 2005 2008 2010
kg/v
km
Vehicle Travel Fuel Chain Car Infrastructure

Laboratory for Energy Systems Analysis Brussels, 25. April 2007 M.Spielmann 62
CO2 and Eco-Indicator Score Development CO2-Emissions
0.00E+00
5.00E-02
1.00E-01
1.50E-01
2.00E-01
2.50E-01
3.00E-01
Petrol car Diesel car Petrol car Diesel car Petrol car Diesel car Petrol car Diesel car
2000 2005 2008 2010
kg/v
km
Vehicle Travel Fuel Chain Car Infrastructure
EcoIndicator 99 H/A
0.00E+00
5.00E-03
1.00E-02
1.50E-02
2.00E-02
2.50E-02
Petrol car Diesel car Petrol car Diesel car Petrol car Diesel car Petrol car Diesel car
2000 2005 2008 2010
EI-P
t/vkm
Vehicle Travel Fuel Chain Car Infrastructure

Laboratory for Energy Systems Analysis Brussels, 25. April 2007 M.Spielmann 63
Requirements for Sustainable Assessment of Transport Technologies
LCA of Transport Systems Scenario Modelling Rebound Effects TCR – Examples Economic Aspects Conclusions
Issues determining the type and scope of transport technologies:
• the actual time of penetration/introduction of the new technology: short term, mid-term or long term.
• status of technology development
• the level of comparison: transport technology singularly vs. transport system level

Laboratory for Energy Systems Analysis Brussels, 25. April 2007 M.Spielmann 64
Levels of Technology
LCA of Transport Systems Scenario Modelling Rebound Effects TCR – Examples Economic Aspects Conclusions
Transport Systems & Concepts
Technology Application
Components & Base Technologies
TA
LCA
Technology Driven TA:New technology is considered as a potential solution for a problem
Potential effects of the technology and alternatives must be assessed

Laboratory for Energy Systems Analysis Brussels, 25. April 2007 M.Spielmann 65
Scenario Modelling: Background Uncertainty Management
LCA of Transport Systems Scenario Modelling Rebound Effects TCR – Examples Economic Aspects Conclusions
Epistemological uncertainties are important for prospective LCAs due to the unpredictability of the future state of the system under investigation.
Funtowicz S O and Ravetz J R (1990): Uncertainty and quality in science for policy. Dordrecht, The Netherlands, Kluwer

Laboratory for Energy Systems Analysis Brussels, 25. April 2007 M.Spielmann 66
Scenarios
LCA of Transport Systems Scenario Modelling Rebound Effects TCR – Examples Economic Aspects Conclusions
•Scenarios (S) are neither predictions nor forecasts•S are no policy recommendations•S are no isolated assumptions about the development of certain impact variables nor a sensitivity check with just the variation of model parameters.•S are no valuation
•Scenarios (S) are images of the future or alternative futures (i.e. there must be at lest two scenarios)•S describe a hypothetical possible future state•S provide an information on a system’s development •S consist of a consistent set of key variables representing the system under investigation
What scenarios are notWhat are scenarios
Laboratory for Energy Systems Analysis Brussels, 25. April 2007 M.Spielmann 67
Impact Variable Selection and Structural Analysis
LCA of Transport Systems Scenario Modelling Rebound Effects TCR – Examples Economic Aspects Conclusions
0
1
2
3
4
5
6
7
8
9
10
0 1 2 3 4 5 6
passivity
activ
ity
Significance of Environmental Issues
Fuel Prices (Diesel & Petrol)
Transport Policy
Passenger TransportMobility Lifestyle Combined Mobility
Electricty Prices
Emission Reduction Technology
Fuel TypeOperating Conditions
Active Ambivalent
PassiveBuffer

Laboratory for Energy Systems Analysis Brussels, 25. April 2007 M.Spielmann 68
Impact Variable Selection and Structural Analysis
LCA of Transport Systems Scenario Modelling Rebound Effects TCR – Examples Economic Aspects Conclusions
OperatingConditions (3)
Combinedmobility (8)
Passengertransport (9)
Electricity Prices
Transport Policy(6)
Mobility Lifestyle(7)
Fuel Price (5)
Significance ofEnvironmental
Issues (4)
Emissionreduction
Technology (2)Fuel Type (1)

Laboratory for Energy Systems Analysis Brussels, 25. April 2007 M.Spielmann 69
Scenario Integration
LCA of Transport Systems Scenario Modelling Rebound Effects TCR – Examples Economic Aspects Conclusions
Linear Consistency
0 4 8 12 16 20time
Linear Consistency
0 4 8 12 16 200 4 8 12 16 20time
Selection Criteria:
•High consistency score
•No inconsistencies
•Diversity
Procedure: Pair-wise ratings of the consistency of the various levels of socio-economic variables of all investigated unit processes are performed. (high consistency, no inconsistencies).Minimisation of the allowed number of impact factors with the same level (Diversity).

Laboratory for Energy Systems Analysis Brussels, 25. April 2007 M.Spielmann 70
Energy OptimisationModelling1)
Unit Process Scenarios
2nd level: (scenario integration):Fuel Price (level: constant, high)Emerging Technologies (conservative, optimistic)Tax regimes (no taxes, pollutants, greenhous gases AND pollutant)
Unit Process Scenarios
1st level:Powertrains (ICE, Fuel Cell)Fuels (Oil, Natural Gas, Nuclear Power, Biomass, Solar)
1: Röder, A. (2001). "Integration of Life-Cycle Assessment and Energy Planning Models for the Evaluation of CarPowertrains and Fuels," PhD, ETH, Zürich.

Laboratory for Energy Systems Analysis Brussels, 25. April 2007 M.Spielmann 71
Service ScenariosImpact Variables and Possible States
1st level: (quantification of travel time) •Leisure mobility (level: bau, mobility focused, local oriented)•Commuting (bau, spatial separation residence and work place)•Shopping (….)•Mode choice short distance trips (…)•Mode choice short distance trips (…)•Human powered mobility (…)
2nd level: (scenario integration)•Environmental awareness (high, low)•State regulation (high, low)
Service Scenarios
Laboratory for Energy Systems Analysis Brussels, 25. April 2007 M.Spielmann 72
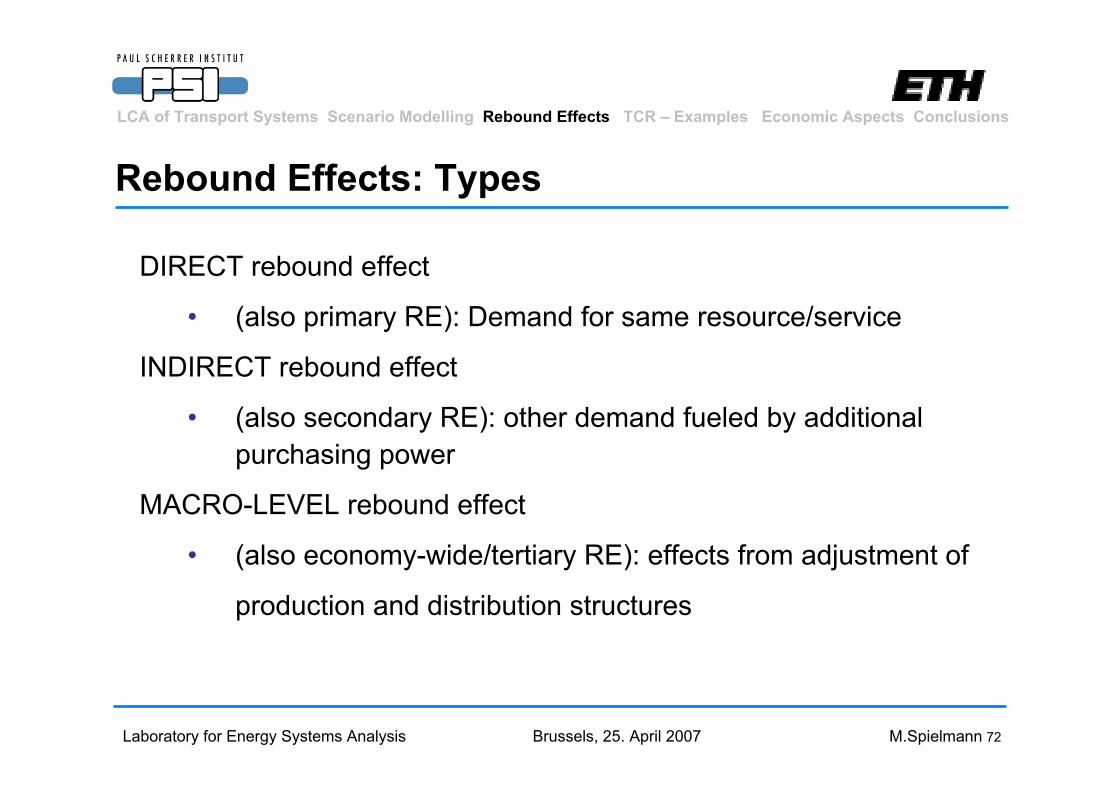
Rebound Effects: Types
LCA of Transport Systems Scenario Modelling Rebound Effects TCR – Examples Economic Aspects Conclusions
DIRECT rebound effect
• (also primary RE): Demand for same resource/service
INDIRECT rebound effect
• (also secondary RE): other demand fueled by additional purchasing power
MACRO-LEVEL rebound effect
• (also economy-wide/tertiary RE): effects from adjustment of
production and distribution structures

Laboratory for Energy Systems Analysis Brussels, 25. April 2007 M.Spielmann 73
Procedure Environmental Burdens
Cumulative Environmental Interventions (CEI) for Forest Wood Chip Supply Chains (FWCS):
∑ −+=j
FWSCMAMATruckTruckFWSC jijjiAFPRCEFLCEFCEI *** 1
,
CEFTruck: Cumulative Emission Factor Truck transport (operation, fuel supply, maintenance, manufacturing & disposal)
L: Load Factor Truck
CEFMA: Cum. Em. Fact. Forest Machinery (kgint*PMH-1) (operation, fuel supply, maintenance, manufacturing & disposal)
PRMA : Productivity of Forest Machinery (bulk-m3*PMH-1)
AF: Allocation Factor: Forest Machine j operation for energy wood
Laboratory for Energy Systems Analysis Brussels, 25. April 2007 M.Spielmann 74
Harvesting Chains/Equipment Passable Stands

Laboratory for Energy Systems Analysis Brussels, 25. April 2007 M.Spielmann 75
Harvesting Chain/Equipment Impassable Stands
Impassable Stands
Logs
Mature and SmallDiameter Trees
Stand
Locationof
Process
Striproad
ForestRoad
Forest -and
NationalRoad
Plant
Felling w.Chainsaw
Skidding w.Cable Crane
IS
Chipping w.Mobile Chipper
Logging Residues (LR)
Preparation ofChips and
Gasification
Bundling w.Energy Wood
Ha.
Truck Transportof Bundles

Laboratory for Energy Systems Analysis Brussels, 25. April 2007 M.Spielmann 76
Results: Forest Wood Supply Chains vs. Crude Oil: Climate Change-Emissions
Interventions Crude Oil: Jungbluth, N. Erdöl. In Sachbilanzen von Energiesystemen: Grundlagen für den ökologischen Vergleich von Energiesystemen und den Einbezug von Energiesystemen in Ökobilanzen für die Schweiz; Final report ecoinvent 2000 No. 6, Paul Scherrer Institut Villigen, Swiss Centre for Life Cycle Inventories: Duebendorf, CH, 2003.
Interventions Residual Chips: modified from Werner, F. et al. "Life Cycle Inventories of Wood as Fuel and Construction Material," EMPA Duebendorf, Swiss Centre for Life Cycle Inventories, 2004
0.00E+00
5.00E+00
1.00E+01
1.50E+01
2.00E+01
2.50E+01
PS1Chipping atlanding ofLogging
ResiduesMature T
PS2: TerrainChipping of
SD Trees andLogging
Residues
PS3: TerrainChipping ofPole TreeBunches
IS: LoggingResidues
FromIMPassable
Stands
Forest WoodChips MixPassabelStands
Forest WoodChips Mix
TotalPotential
IndustrialResidual
Wood ChipsPlantMIx
Raw Oil fromAfrica at
Refinery inCH
Raw Oil fromMiddle East at
Refinery inCH
Raw Oil fromNG at
Refinery inCH
Raw OilImport Mix atRefinery in
CH
kg C
O2
eq./G
J
Production Transport

Laboratory for Energy Systems Analysis Brussels, 25. April 2007 M.Spielmann 77
Results: Forest Wood Supply Chains vs. Crude Oil: PM2.5-Emissions
0.00E+00
5.00E-04
1.00E-03
1.50E-03
2.00E-03
2.50E-03
3.00E-03
PS1:Chipping atlanding ofLogging
Residues(Mature T.)
PS2: TerrainChipping ofSD Trees
and LoggingResidues
PS3: TerrainChipping ofPole TreeBunches
IS: LoggingResidues
FromIMPassable
Stands
ForestWood Chips
MixPassabelStands
ForestWood Chips
Mix TotalPotential
IndustrialResidual
Wood ChipsPlantMIx
Raw Oilfrom Africaat Refinery
in CH
Raw Oilfrom Middle
East atRefinery in
CH
Raw Oilfrom NG atRefinery in
CH
Raw OilImport Mix atRefinery in
CH
kg P
M2.
5/G
J
Production Transport

Laboratory for Energy Systems Analysis Brussels, 25. April 2007 M.Spielmann 78
Results: Forest Wood Supply Chains vs. Crude Oil: NOx-Emissions
0.00E+00
1.00E-02
2.00E-02
3.00E-02
4.00E-02
5.00E-02
6.00E-02
PS1:Chipping atlanding ofLogging
Residues(Mature T.)
PS2: TerrainChipping ofSD Trees
and LoggingResidues
PS3: TerrainChipping ofPole TreeBunches
IS: LoggingResidues
FromIMPassable
Stands
Forest WoodChips MixPassabelStands
Forest WoodChips Mix
TotalPotential
IndustrialResidual
Wood ChipsPlantMIx
Raw Oil fromAfrica at
Refinery inCH
Raw Oil fromMiddle Eastat Refinery
in CH
Raw Oil fromNG at
Refinery inCH
Raw OilImport Mix atRefinery in
CH
kg N
Ox/
GJ
Production Transport

Laboratory for Energy Systems Analysis Brussels, 25. April 2007 M.Spielmann 79
Economic Dimension: Example Forest Wood Chips
LCA of Transport Systems Scenario Modelling Rebound Effects TCR – Examples Economic Aspects Conclusions
Cumulative Environmental Interventions (CEI) for Forest Wood Chips:
Cumulative Cost (CC) for Forest Wood Chip Supply Chains (FWCS):
CCFWSCi= CCTruck + ∑CCMAj
*AFFWSCi,j
CEFTruck: Cumulative Emission Factor Truck transport
L: Load Factor Truck
CEFMA: Cum. Em. Fact. Forest Machinery (kgint*PMH-1)
PRMA : Productivity of Forest Machinery (bulk-m3*PMH-1)
AF: Allocation Factor: Forest Machine j operation for energy wood
CCTruck: Cumulative Costs Truck transport
CCMA: Cumulative Costs Forest Machine j
∑ −+=j
FWSCMAMATruckTruckFWSC jijjiAFPRCEFLCEFCEI *** 1
,

Laboratory for Energy Systems Analysis Brussels, 25. April 2007 M.Spielmann 80
Eco Efficiency: Costs vs. NOx-emissions
PS1
PS2 PS3
PS-mix
Crude Mix
IS
0
10.4 1.4
Normalised Costs
Norm
alis
ed N
Ox-
emis
sion
s
EU4-Standard for Harvest Machinery
EU4-Standard for Harvest Machinery
PS1: Logging Residues from Mature TreesPS2: Logging Residues and SD-TreesPS3: SD TreesIS: Logging Residues from Impassable Stands
Laboratory for Energy Systems Analysis Brussels, 25. April 2007 M.Spielmann 81
Conclusion
Forest Wood Chip Chains• The operation phase of forest machinery and truck dominate the
harvesting life cycle of Forest Wood Chips.• Forest wood chips derived from IMpassable stands show worse
environmental performance than wood chips from passable stands.• Production is more important than transport (assuming a distance of
20 km)• Bundling of wood is the critical element in the impassable stand chain.
For energy wood from passable stands chipping causes the highestemissions.
• A further inclusion of environmental burdens (allocation) due to felling and skidding of trees has only a marginal impact on the outcomes of logging residues chains

Laboratory for Energy Systems Analysis Brussels, 25. April 2007 M.Spielmann 82
Model Specifications/ Assumptions
40
45
50
55
60
65
70
1996 1997 1998 1999 2000 2001 2002 2003 2004 2005 2006 2007 2008 2009 2010
g/vk
m fu
el c
onsu
mpt
ion
Petrol Car (CH) g/km Diesel Car (CH) g/km
Average (Diesel + Petrol) Car (CH) g/km Average (Diesel + Petrol) Car (EU) g/km
target value EU
target value CH (28.7 % diesel)
y = 18.467x - 35555R2 = 0.9755
1'100
1'200
1'300
1'400
1'500
1'600
1'700
1995 2000 2005 2010 2015
Ave
rage
veh
icle
wei
ght [
kg]
Regulated Emissions: NOx, PM, HC, CO.Euro2: 2000
Euro3: 2005
Euro4: 2008
Euro5: 2010 (Proposal)
Material Composition DevelopmentIncrease of Aluminum 4% to 22%
Fleet Fuel Consumption Development
Fleet Weight Development

Laboratory for Energy Systems Analysis Brussels, 25. April 2007 M.Spielmann 83
Description of Technology
• Description of future rail options (three trains types, electricity mix) – Total weight, yearly performance, life span, number of seats,
electricity consumption per kg and km.
• Identification and Presentation of possible developments for competing transport services.
– Bus: Fuel Type: Diesel vs. CNG, Emission technology/Euro standard, etc, number of seats, fuel consumption.
LCA of Transport Systems Scenario Modelling Rebound Effects TCR – Examples Economic Aspects Conclusions

Laboratory for Energy Systems Analysis Brussels, 25. April 2007 M.Spielmann 84
Description of Scenario Modelling
Description of the various steps and actors involved (if participation is part of the project)
Description of technology and socio-economic impact variables for all included unit processes.
Description of all states of impact variables.
Documentation of quantification of scenarios
Overview of selected cornerstone scenarios (labeling and storyline)
LCA of Transport Systems Scenario Modelling Rebound Effects TCR – Examples Economic Aspects Conclusions

Laboratory for Energy Systems Analysis Brussels, 25. April 2007 M.Spielmann 85
General Information: Prospective LCA
Goal and Scope of Scenario Modelling:
• Research Question: – Is regional rail transport in the year 2020 still the environmental
preferable option,– And if so, under which conditions.
• Definition of transport components to be included, based on typeof comparison.
• Definition of unit processes which are included in scenario modeling.
LCA of Transport Systems Scenario Modelling Rebound Effects TCR – Examples Economic Aspects Conclusions