the application of stevia as sugar substitute in carbonated...
TRANSCRIPT
23
K. Saniah and M. Sharifah SamsiahJ. Trop. Agric. and Fd. Sc. 40(1)(2012): 23– 34
The application of Stevia as sugar substitute in carbonated drinks using Response Surface Methodology(Penggunaan Stevia sebagai pengganti gula di dalam minuman berkarbonat menggunakan Kaedah Gerak Balas Permukaan)
K. Saniah* and M. Sharifah Samsiah**
Keywords: Stevia, carbonated drinks, response surface methodology, sensory evaluation, nutritional value
AbstractA central composite design and response surface methodology were used to establish the optimum level of Stevia sweetener as a replacement of sucrose in carbonated drinks. In this study, Stevia-sucrose combinations in the range of 0.2–0.5% (Stevia) and 0–54% (sucrose) were the independent variables and their effects on sensory acceptability and physico-chemical profile of product were investigated. Based on the response surface and superimposed plots, the desired sensory quality of orange flavoured carbonated drink was obtained by incorporating 0.43% Stevia and 33.13% sucrose in syrup. Results also revealed that the amount of calorie and carbohydrate was reduced by 42.9%, indicating that Stevia has a good potential to be exploited as an alternative sweetener for carbonated drinks.
*MARDI Station, Johor Bahru, No. 13, Jalan Bakti, Larkin Industrial Area, 80350 Johor Bahru, Johor, Malaysia**Food Technology Research Centre, MARDI Headquarters, Serdang, P.O. Box 12301, 50774 Kuala Lumpur, MalaysiaAuthors’ full names: Saniah Kormin and Sharifah Shamsiah MohamedE-mail: [email protected]©Malaysian Agricultural Research and Development Institute 2012
IntroductionCarbonated beverages are generally sweetened, flavoured, acidified, artificially coloured and carbonated, and sometimes chemically preserved. The major ingredient of carbonated soft drink is sugar, where sucrose is the most common sweetener used in the product. Lately, the increasing consumption of sugar is known as a common factor associated with the rising number of diabetics and increase in obesity. The health concerns together with the continuous increase of sugar prices drives people to look at other alternative sweeteners or low calorie-based sugar for their daily intake. There is an increasing demand in society for more sugar substitutes in processed products. Consumers have also
moved beyond choosing food and drinks simply to maintain everyday health (Geuns 2003). There are only a few low calorie sweeteners as well as herb-based sweetening agents that have been introduced into the market to meet consumers needs. Aspartame is not stable at higher temperatures and loses its sweetening ability. Likewise, saccharin has limited accessibility because of certain restrictions by the Food and Drug Administration (FDA) as well as the Malaysian Food Act and Regulations (Anon. 2000). Since December 2008, the US FDA approved the Stevia-derived sweetener Reb A as generally recognized as safe (GRAS) for its use in foods and beverages (Puri et. al. 2011). Stevia rebaudiana is a perennial

24
Stevia in carbonated drinks
herb with claimed medicinal and culinary characteristics. Stevioside and rebaudioside A, the sweet components in Stevia, are approximately 200–300 times sweeter than sucrose (Soejarto et al. 1982; Hanson and de Oliveira 1993). Stevia plant extracts as well as stevioside have been used for a long time as a sweetener in Japan, America, Asia and some other countries. Stevia contributes about 40% of the sweetener market in Japan (Lester 1999). It is officially used as a low calorie sweetener and dietary supplement (Mizutani and Tanaka 2002). Stevia sweetener is heat stable up to 200 ºC, acid-stable and not fermentable, making it suitable for use in a wide range of products including baked/cooked foods (Puri et al. 2011) as well as acidified beverages. Stevia can partially replace sucrose in certain types of food products including non-carbonated drinks (Saniah et al. 2009), traditional cakes (Zainun et. al. 2009) and confectionery jellies (Sharifah Samsiah and Latifah 2009), without significantly affecting the sensory qualities. Furthermore, Stevia is non-calorific, able to maintain good dental health and suitable for diabetic patients (Geuns 2003). However, the problem of the bitter taste in Stevia is of concern in consumer acceptability (Saniah et al. 2009). Thus, the aim of the present study is to investigate the possibility of fully or partially replacing sucrose content in carbonated drinks with Stevia for achieving maximum consumer acceptance and quality.
Materials and methodsSample preparation and experimental designCarbonated drink was developed by incorporation of flavoured syrup or cordial, cooled water and carbon dioxide gas using a carbonated drink machine. Orange flavoured syrup was first prepared according to Hamzah (1987) with modifications on the amount of sucrose and Stevia substitution as sweetening agent. Stevia (Sweta brand) was
purchased from PureCircle Sdn Bhd, Negeri Sembilan. The effect of two independent variables (percentages of sucrose and Stevia) in syrup formulation were studied. Response surface methodology (RSM) using 22 central composite design (Khuri and Cornell 1987) was used to evaluate the effect of different formulations on the sensory and physico-chemical profiles of carbonated drink. Each of the variables to be optimized was coded at three levels: -1 (minimum), 0 (medium) and +1 (maximum). The minimum and maximum levels for sucrose and Stevia in syrup are shown in Table 1. The complete design consisted of 13 experimental points which included five replications of the centre point (Table 2).
Sensory evaluationTrained panellists were used for the sensory evaluation session. The training session was started with a screening test which ttaught the candidates the test process while weeding out unsuitable nondiscriminators. The screening tests aimed to determine differences among candidates in the ability to discriminate the different levels of intensity for each attribute. Panellists were carefully introduced to the attributes, the terminology used to describe them as well as the scale method used to indicate or measure the degree of liking for a product. Acceptance test was used to determine the ‘affective status’ of a product or how well it is liked by the panellists. Panellists were asked to rank the samples in ascending order ascording to the level of sensory attributes including sweetness, sourness, bitter-after taste and carbon dioxide taste. Panellists who were able to rank the samples correctly were accepted for the sensory evaluation
Table 1. Factors and levels for response surface study
Factor Low level High level (–1) (+1)X2 (A) – Sucrose (%) 0% 54%X1 (B) – Stevia (%) 0.2% 0.5%
25
K. Saniah and M. Sharifah Samsiah
Table 2. Experimental design for the formulation of flavoured syrup
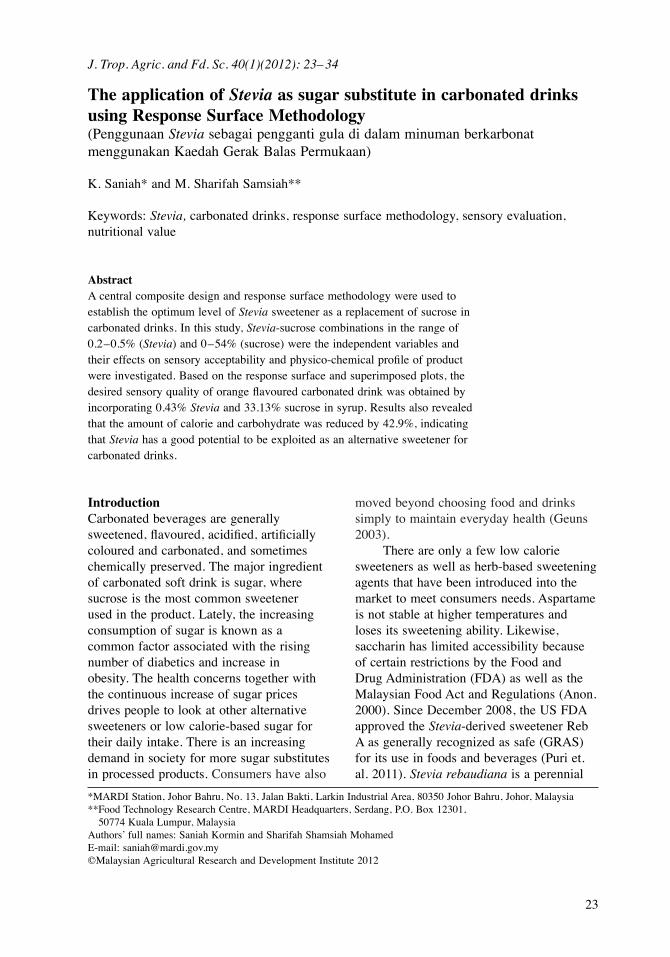
Std. run no. Coded independent variables Decoded independent variables X1 X2 Stevia (%) Sucrose (%) 1 –1 –1 0.20 0.00 2 1 –1 0.20 54.00 3 –1 1 0.50 0.00 4 1 1 0.50 54.00 5 –1 0 0.35 0.00 6 1 0 0.35 54.00 7 0 –1 0.20 27.00 8 0 1 0.50 27.00 9 0 0 0.35 27.0010 0 0 0.35 27.0011 0 0 0.35 27.0012 0 0 0.35 27.0013 0 0 0.35 27.00
the session. The preparation of samples and training procedures were carried out according to Meilgaard et al. (1999) with slight modifications. A total of 13 samples of carbonated drinks were subjected to sensory evaluation by 13 trained panellists. A sample of 40 ml was served and coded with three digits chosen at random. Sensory attributes evaluated were the degree of liking (DOL) for taste, texture, bitter after-taste, sourness, sweetness and overall acceptability. All panellists evaluated the samples using a 7-point category hedonic scale (1 = dislike extremely; 4 = neither like nor dislike; 7 = like extremely) as described by Meilgaard et al. (1999). Models with a greater coefficient of determination (R2) and adjusted coefficient of determination (R2
adj) and, consequently, greater F values; non-significance (p >0.05) in lack of fit and good results in the residual analysis were considered as good performances to provide predictive models for the responses. The Design-Expert 6.0.8 (DX6) Statistical Program (Stat-Ease Inc. 2000) was used to develop the experimental plan for RSM. This software was also used for regression analysis of the data obtained, to estimate the coefficients of the regression equation and to perform the analysis of variance (ANOVA).
The sensory quality of carbonated drinks with Stevia was also compared with commercial samples. The degree of liking (DOL) for viscosity, orange taste, sourness, sweetness, bitter after-taste, CO2 gas content as well as overall acceptability were evaluated.
Proximate analysisCrude fibre, sugar and fat contents of the samples were determined according to AOAC (1985). The Kjeldahl method of determining total nitrogen was based on Tecator Kjeltec System 1026 and Pearson (1976). The crude protein was calculated as N X 6.25. Total carbohydrate was estimated according to Nergiz and Otles (1993). Energy was calculated using the factors 4.0, 4.0 and 9.0 kcal/g for protein, carbohydrate and fat respectively (Abdurahman et al. 1998). Ascorbic acid content (mg/g sample) was determined using direct titration method according to Suntornsuk et al. (2002).
Results and discussionModel fitting from RSMUsing RSM, the relationship among the variables, i.e. sucrose and Stevia were expressed mathematically in the form of polynomial model, which gave response as a function of relevant variables. The independent and dependent variables were
26
Stevia in carbonated drinks
fitted to the second order model equation and examined for the goodness of fit. The analysis of variance was performed to test the adequacy of the model. The parameters found to be significant at the probability level (p) equal or less than 5% were considered in order to obtain the fitted models to predict the responses. In this case, the responses for bitter after-taste, sourness, sweetness, carbon dioxide gas content and overall acceptability were significant at 0.01% level. The evaluation of the effects on DOL for orange taste and texture (viscosity) indicated that a linear term was not significant, where the probability level (p) was above 5% (data not shown). Therefore, these attributes were not adequate and have not been used for the optimization study. The coefficient of determination or R2 suggested that for a good fit model, R2 should be at least 80% (Joglekar and May 1991), while Henika (1982) considered a minimum level of 85% for R2 as very good for explaining variance for sensory data. Thus the models developed for predicting sensory scores for carbonated drinks with different Stevia-sucrose levels were highly adequate because R2 was satisfactory and very close to 1 (Table 5). Sensory
evaluation result shows that the models for sweetness, sourness, bitter after-taste and overall acceptability had coefficients of determination (R2) above 0.8 and 0.9. This indicated that nearly 80–90% of the total variation can be explained or accounted for by the models. All models also presented a non-significant lack of fitness (p >0.05), which is desirable for the model as significant lack-of-fit indicates that there might be contributions in the regressor-response relationship that are not accounted for by the model.
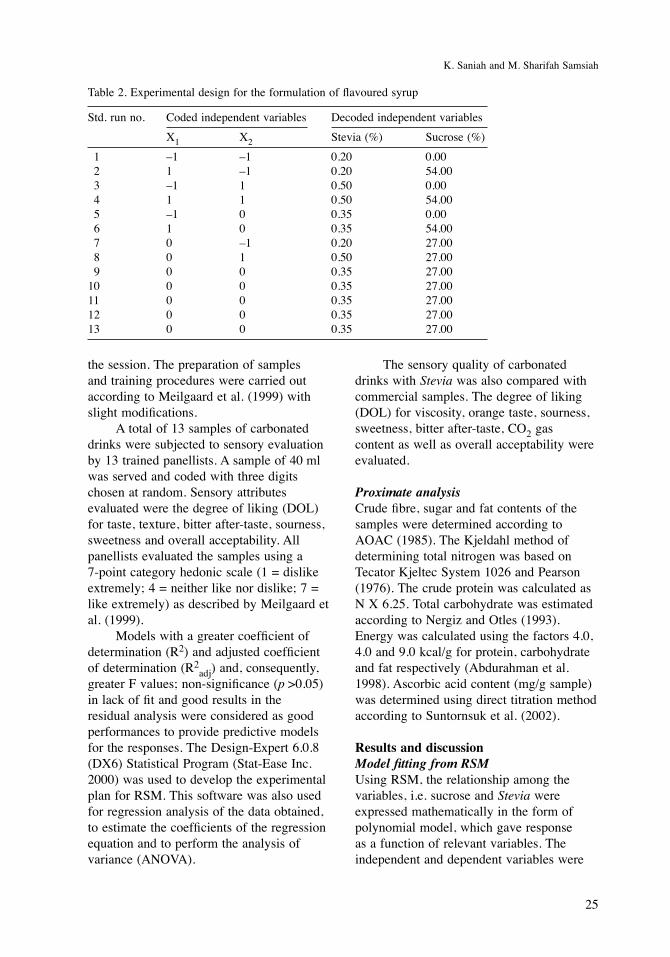
Effect of sucrose and Stevia on carbonated drinksViscosity It can be observed that the viscosity of carbonated drink depended on the amount of sucrose added, as its quadratic effect was positive at p <0.0001. Table 3 shows the effect of Stevia-sucrose levels on the viscosity of carbonated drink. The presence of sucrose increased the viscosity of syrup as well as carbonated drink. The addition of 54% sucrose (maximum range) increased the viscosity from 8.5 m.pas to 15.0 m.pas. In line with this observation, the acceptability of the product, particularly for viscosity also greatly depends on the amount
Table 3. The mean sensory scores, TSS and viscosity of the response variables of the carbonated drinks (n = 13)
Run DOL of bitter DOL of DOL of DOL of Overall TSS Viscosity after-taste sweetness sourness CO2 content acceptability (Brix) (m.pas) 1 3.46 3.91 4.00 3.73 3.54 2 8.5 2 4.73 3.91 4.82 4.82 4.82 14.8 15.0 3 4.73 4.46 4.00 3.91 3.91 0 8.5 4 4.82 4.82 4.64 4.54 5.36 14.6 13.5 5 3.73 3.82 4.18 4.18 3.54 0 7.0 6 5.00 4.73 5.18 4.73 4.54 14.2 13.5 7 4.91 4.73 4.82 4.82 4.64 7.4 9.0 8 5.30 5.70 5.10 5.00 5.60 7.2 8.5 9 5.10 5.80 5.40 5.20 5.50 7.2 8.010 5.20 5.70 5.60 5.80 5.60 7.2 8.011 4.80 5.20 5.30 5.40 5.30 7.2 9.012 5.00 5.30 4.90 5.20 5.33 7.4 8.013 4.70 4.90 5.40 5.56 5.36 7.4 8.01 = dislike extremely; 4 = neither like nor dislike; 7 = like extremely
27
K. Saniah and M. Sharifah Samsiah
of sucrose added. Potter (1986) previously noticed that the sugar in beverages not only contributes to sweetness but also adds body and mouthfeel. For this reason, if Stevia is used as a sweetener, the addition of thickening agent such as carboxymethyl cellulose or pectin is probably required to maintain the viscosity or concentration of the product.
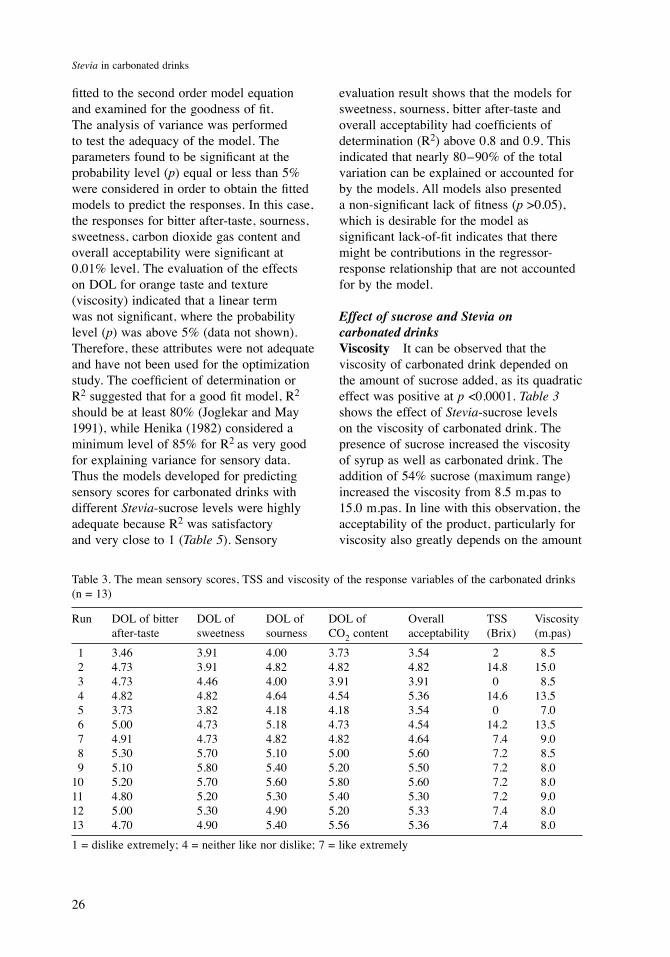
Total soluble solid content It was observed (Figure 1 and Table 4) that the total soluble solid content of carbonated drink depended on the amount of sucrose added, as its 2F1 (2 factor interaction) effect was positive at p <0.0001. Results also revealed that sucrose was the major contributor, wherease Stevia gave negative impact to the total soluble solid content in carbonated drink (p <0.05).
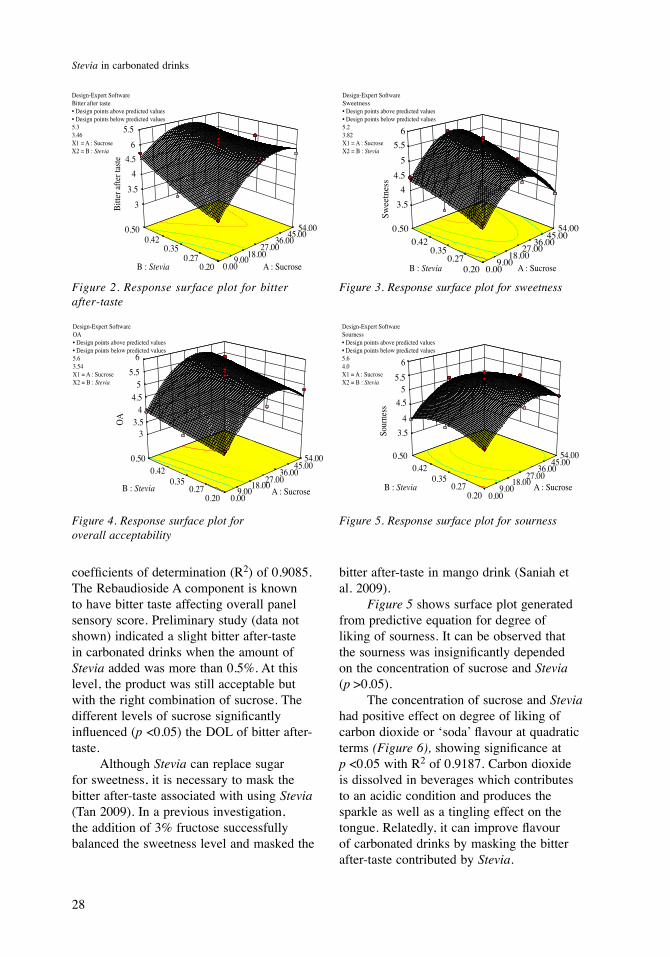
Sensory attributes of carbonated drink The predicted model calculated from sensory data of the response variables, i.e. bitter after-taste, sourness, sweetness, CO2 gas content and overall acceptability are shown in Table 5. From Figures 2–4, the score for bitter after-taste, sweetness and overall acceptability were affected by the amount of sucrose and Stevia added. The degree of liking (DOL) of bitter after-taste was also greatly dependant on the level of Stevia in syrup formulation with positive linear and quadratic effects at
14.414110.72247.03077
3.3371-0.352564
A: SucroseB: Stevia
DESIGN-EXPERT PlotTSSX = A: Sucrose Y = B: Stevia
0.50
0.420.35
0.270.20 0.00
13.5027.00
40.5054.00
TSS
Figure 1. Response surface plot for soluble solid content
Table 4. ANOVA table (partial sum of square) of response surface model for physico-chemical characteristics
Responses Total soluble solid (Brix) Viscosity (m.pas)F-value 591.83 90.23R2 0.9950 0.9847R2 adj 0.9933 0.9401Lack of Fit Not significant Not significantModel 2F1 Quadratic
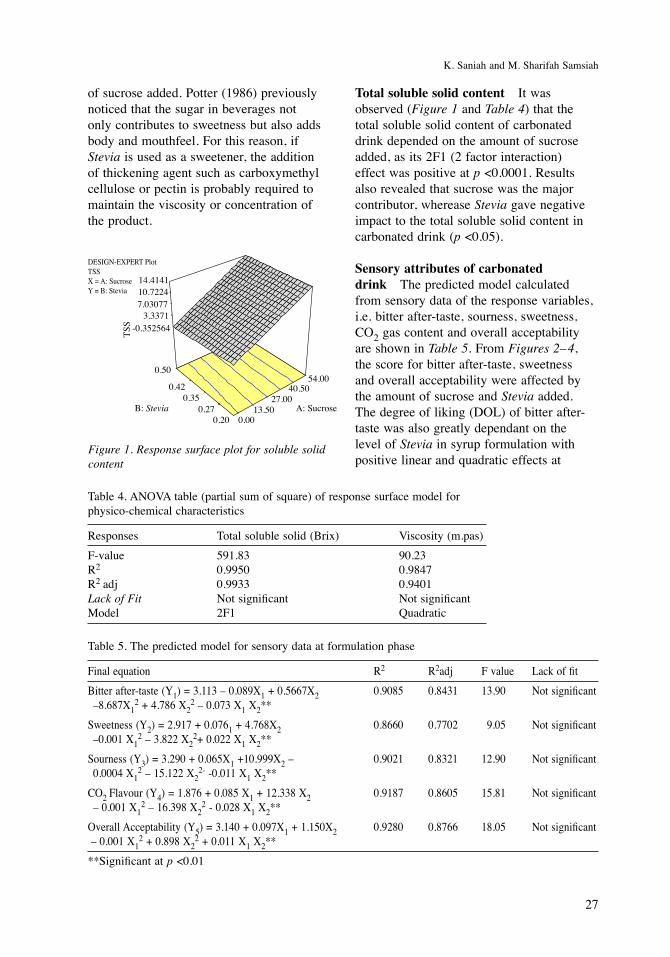
Table 5. The predicted model for sensory data at formulation phase
Final equation R2 R2adj F value Lack of fitBitter after-taste (Y1) = 3.113 – 0.089X1 + 0.5667X2 0.9085 0.8431 13.90 Not significant –8.687X1
2 + 4.786 X22 – 0.073 X1 X2**
Sweetness (Y2) = 2.917 + 0.0761 + 4.768X2 0.8660 0.7702 9.05 Not significant –0.001 X1
2 – 3.822 X22+ 0.022 X1 X2**
Sourness (Y3) = 3.290 + 0.065X1 +10.999X2 – 0.9021 0.8321 12.90 Not significant 0.0004 X1
2 – 15.122 X22- -0.011 X1 X2**
CO2 Flavour (Y4) = 1.876 + 0.085 X1 + 12.338 X2 0.9187 0.8605 15.81 Not significant – 0.001 X1
2 – 16.398 X22 - 0.028 X1 X2**
Overall Acceptability (Y5) = 3.140 + 0.097X1 + 1.150X2 0.9280 0.8766 18.05 Not significant – 0.001 X1
2 + 0.898 X22 + 0.011 X1 X2**
**Significant at p <0.01
28
Stevia in carbonated drinks
coefficients of determination (R2) of 0.9085. The Rebaudioside A component is known to have bitter taste affecting overall panel sensory score. Preliminary study (data not shown) indicated a slight bitter after-taste in carbonated drinks when the amount of Stevia added was more than 0.5%. At this level, the product was still acceptable but with the right combination of sucrose. The different levels of sucrose significantly influenced (p <0.05) the DOL of bitter after-taste. Although Stevia can replace sugar for sweetness, it is necessary to mask the bitter after-taste associated with using Stevia (Tan 2009). In a previous investigation, the addition of 3% fructose successfully balanced the sweetness level and masked the
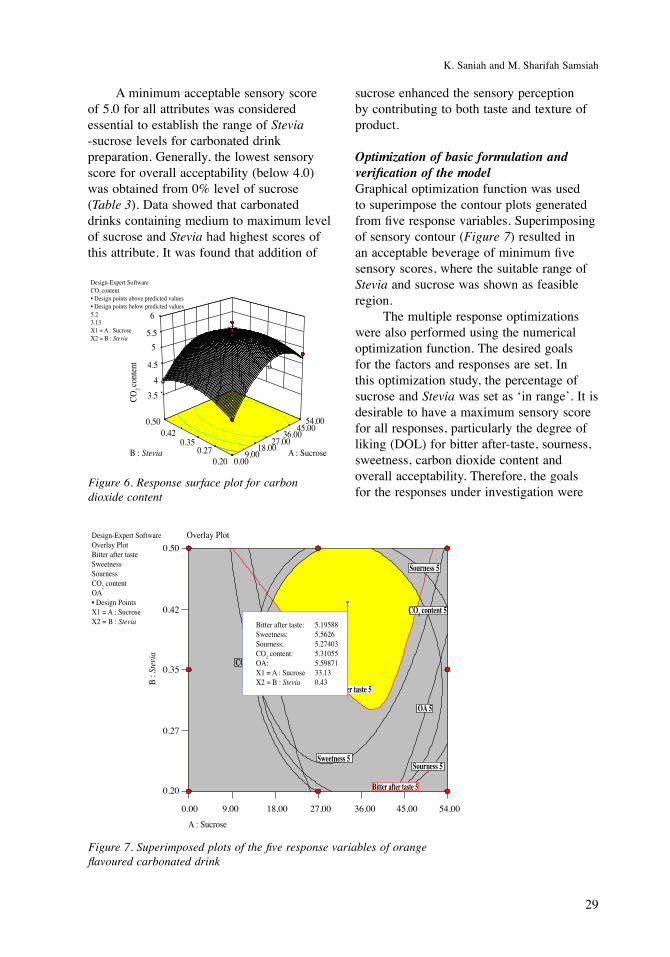
bitter after-taste in mango drink (Saniah et al. 2009). Figure 5 shows surface plot generated from predictive equation for degree of liking of sourness. It can be observed that the sourness was insignificantly depended on the concentration of sucrose and Stevia (p >0.05). The concentration of sucrose and Stevia had positive effect on degree of liking of carbon dioxide or ‘soda’ flavour at quadratic terms (Figure 6), showing significance at p <0.05 with R2 of 0.9187. Carbon dioxide is dissolved in beverages which contributes to an acidic condition and produces the sparkle as well as a tingling effect on the tongue. Relatedly, it can improve flavour of carbonated drinks by masking the bitter after-taste contributed by Stevia.
Figure 2. Response surface plot for bitter after-taste
Figure 3. Response surface plot for sweetness
Design-Expert SoftwareBitter after taste• Design points above predicted values• Design points below predicted values5.33.46X1 = A : SucroseX2 = B : Stevia
5.5
64.5
4
3.5
3
0.500.42
0.350.27
0.20 0.0018.009.00
27.0036.00
45.0054.00
A : SucroseB : Stevia
Bitte
r afte
r tas
te6
5.55
4.54
3.5
0.500.42
0.350.27
0.20 0.009.00
18.0027.00
36.0045.00
54.00
Swee
tnes
s
Design-Expert SoftwareSweetness• Design points above predicted values• Design points below predicted values5.23.82X1 = A : SucroseX2 = B : Stevia
A : SucroseB : Stevia
Figure 4. Response surface plot foroverall acceptability
Figure 5. Response surface plot for sourness
Design-Expert SoftwareOA• Design points above predicted values• Design points below predicted values5.63.54X1 = A : SucroseX2 = B : Stevia
65.5
54.5
43.5
3
0.500.42
0.350.27
0.20 0.0018.009.00
27.0036.00
45.0054.00
A : SucroseB : Stevia
OA
Design-Expert SoftwareSourness• Design points above predicted values• Design points below predicted values5.64.0X1 = A : SucroseX2 = B : Stevia
6
5
4
5.5
4.5
3.5
0.500.42
0.350.27
0.20 0.0018.00
9.0027.00
36.0045.00
54.00
A : SucroseB : Stevia
Sour
ness
29
K. Saniah and M. Sharifah Samsiah
A minimum acceptable sensory score of 5.0 for all attributes was considered essential to establish the range of Stevia -sucrose levels for carbonated drink preparation. Generally, the lowest sensory score for overall acceptability (below 4.0) was obtained from 0% level of sucrose (Table 3). Data showed that carbonated drinks containing medium to maximum level of sucrose and Stevia had highest scores of this attribute. It was found that addition of
sucrose enhanced the sensory perception by contributing to both taste and texture of product.
Optimization of basic formulation and verification of the modelGraphical optimization function was used to superimpose the contour plots generated from five response variables. Superimposing of sensory contour (Figure 7) resulted in an acceptable beverage of minimum five sensory scores, where the suitable range of Stevia and sucrose was shown as feasible region. The multiple response optimizations were also performed using the numerical optimization function. The desired goals for the factors and responses are set. In this optimization study, the percentage of sucrose and Stevia was set as ‘in range’. It is desirable to have a maximum sensory score for all responses, particularly the degree of liking (DOL) for bitter after-taste, sourness, sweetness, carbon dioxide content and overall acceptability. Therefore, the goals for the responses under investigation were
Figure 7. Superimposed plots of the five response variables of orange flavoured carbonated drink
Bitter after tasteOA 5
Sourness 5Co2 content 5
Design-Expert SoftwareOverlay PlotBitter after tasteSweetnessSournessCO2 contentOA• Design PointsX1 = A : SucroseX2 = B : Stevia
B : Stevia
0.50
0.42
0.35
0.27
0.20
0.00 9.00 18.00 27.00 36.00 45.00 54.00
A : Sucrose
CO2 content 5
Sourness 5
Sourness 5Sweetness 5
OA 5
Bitter after taste 5
Overlay Plot
CO2 content 5
Bitter after taste 5
Bitter after taste: 5.19588Sweetness: 5.5626Sourness: 5.27403CO2 content: 5.31055OA: 5.59871X1 = A : Sucrose 33.13X2 = B : Stevia 0.43
Figure 6. Response surface plot for carbon dioxide content
Design-Expert SoftwareCO2 content• Design points above predicted values• Design points below predicted values5.23.13X1 = A : SucroseX2 = B : Stevia
5.5
6
5
4.5
43.5
0.500.42
0.350.27
0.20 0.0018.00
9.0027.00
36.0045.00
54.00
A : SucroseB : Stevia
CO2 co
nten
t

30
Stevia in carbonated drinks
Table 6. Possible optimal solutions for orange flavoured carbonated drink
Sucrose Stevia Bitter after- Sourness Sweetness CO2 Overall Total soluble Viscosity taste content acceptability solid33.13 0.43 6.44 6.15 6.20 6.43 6.87 0.88 8.94
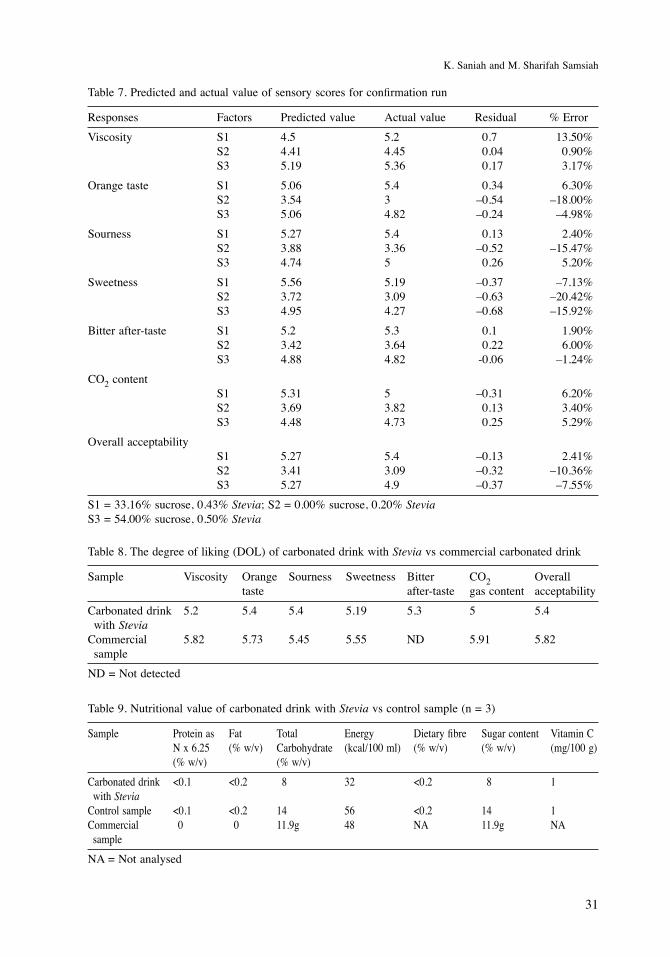
set as ‘maximize’. The possible optimal solutions for the percentage and combination of sucrose and Stevia for orange flavoured syrup are shown in Table 6. From the optimization tool, it is clear that the best DOL for sensory test is obtainable when 33.13% of sucrose was used in combination with 0.43% Stevia. With this formulation, the amount of sucrose can be reduced up to 39%. The incorporation of 33.13% sucrose and 0.43% Stevia suggested to obtain the optimum score of sensory attributes evaluated with the desirability of 0.859. The optimum scores for bitter after-taste, sourness, sweetness and carbon dioxide content were 6.44, 6.15, 6.20 and 6.43 or close to ‘like slightly’ respectively. The overall acceptability score was 6.87 or close to ‘like moderately’ (Table 6). In order to verify the adequacy of the model developed, several confirmation runs were performed involving different percentages of sucrose and Stevia within the range of the levels defined previously. Using the point prediction capability of the software, the DOL for orange taste, texture, bitter after-taste, sourness, sweetness, carbon dioxide content and overall acceptability of the selected experiments were predicted together with the 95% prediction interval. The predicted and the actual sensory score were compared and the residual and the percentage error were calculated. These are presented in Table 7. The calculated results indicated that the models developed were highly accurate, particularly for DOL of bitter after-taste, carbon dioxide content and overall acceptability, where the percentage errors for other responses were less then 10%. The percentage errors for other sensory attributes were considered as small
and acceptable. Only a few samples show an error between 10% and 20%.
Effect of Stevia on consumer preference and nutritional valueThe sensorial acceptability of carbonated drink with Stevia as compared with similar sugar rich commercial carbonated drink was evaluated. Generally, panellists gave higher score to commercial sample of orange-flavoured carbonated drink particularly for overall acceptability, carbon dioxide content, sweetness, orange taste and viscosity with a sensory score of 5.82, 5.91, 5.55, 5.73 and 5.82 respectively (Table 8). However, carbonated drink with Stevia gave comparable resuls with no significant difference, except for DOL of carbon dioxide content and viscosity (Table 8). This might be due to the different carbon dioxide gas flow rate applied by commercial companies (usually up to 12 bar) as compared to 4 bar used in this study, since the pressure is needed to force more CO2 into solution. The solubility of CO2 in water is greater at a lower temperature of liquid. A nutritious balanced diet is the key to good health and the changes in nutritional quality is also associated with greater changes in consumer acceptance. Table 9 shows the effect of adding Stevia in carbonated drink on the proximate composition as compared to control and commercial samples. The higher amount of carbohydrate was detected in the control and commercial samples which were mostly due to addition of sucrose in the formulation. The combination of sucrose-Stevia in the drink fomulation greatly reduced the carbohydrate content from 14% in the control sample to 8%. Stevia is considered to be a non-caloric sweetener. In line with
31
K. Saniah and M. Sharifah Samsiah
Table 7. Predicted and actual value of sensory scores for confirmation run
Responses Factors Predicted value Actual value Residual % ErrorViscosity S1 4.5 5.2 0.7 13.50% S2 4.41 4.45 0.04 0.90% S3 5.19 5.36 0.17 3.17%Orange taste S1 5.06 5.4 0.34 6.30% S2 3.54 3 –0.54 –18.00% S3 5.06 4.82 –0.24 –4.98%Sourness S1 5.27 5.4 0.13 2.40% S2 3.88 3.36 –0.52 –15.47% S3 4.74 5 0.26 5.20%Sweetness S1 5.56 5.19 –0.37 –7.13% S2 3.72 3.09 –0.63 –20.42% S3 4.95 4.27 –0.68 –15.92%Bitter after-taste S1 5.2 5.3 0.1 1.90% S2 3.42 3.64 0.22 6.00% S3 4.88 4.82 -0.06 –1.24%CO2 content S1 5.31 5 –0.31 6.20% S2 3.69 3.82 0.13 3.40% S3 4.48 4.73 0.25 5.29%Overall acceptability S1 5.27 5.4 –0.13 2.41% S2 3.41 3.09 –0.32 –10.36% S3 5.27 4.9 –0.37 –7.55%S1 = 33.16% sucrose, 0.43% Stevia; S2 = 0.00% sucrose, 0.20% SteviaS3 = 54.00% sucrose, 0.50% Stevia
Table 8. The degree of liking (DOL) of carbonated drink with Stevia vs commercial carbonated drink
Sample Viscosity Orange Sourness Sweetness Bitter CO2 Overall taste after-taste gas content acceptabilityCarbonated drink 5.2 5.4 5.4 5.19 5.3 5 5.4 with SteviaCommercial 5.82 5.73 5.45 5.55 ND 5.91 5.82 sampleND = Not detected
Table 9. Nutritional value of carbonated drink with Stevia vs control sample (n = 3)
Sample Protein as Fat Total Energy Dietary fibre Sugar content Vitamin C N x 6.25 (% w/v) Carbohydrate (kcal/100 ml) (% w/v) (% w/v) (mg/100 g) (% w/v) (% w/v)Carbonated drink <0.1 <0.2 8 32 <0.2 8 1 with SteviaControl sample <0.1 <0.2 14 56 <0.2 14 1Commercial 0 0 11.9g 48 NA 11.9g NA sampleNA = Not analysed

32
Stevia in carbonated drinks
that, sucrose-Stevia based carbonated drink provides only 32 kcal/100 ml of calorie content, significantly lower than the amount detemined in the control sample (56 kcal/100 ml). As can be observed, generally the amount of nutrient components in carbonated drink was very low and/or below human requirements. Results from the nutritional analysis indicated that the replacement of sugar with Stevia provides a healthier choice of carbonated drink to the global population, particularly those concerned about health and nutrition. Related to these findings, substituting sugar with low calorie sweeteners may be effective in weight management or preventing metabolic disorders such as obesity. Stephen et al. (2010), studied the effects of preloads containing Stevia, aspartame and sucrose on food intake, satiety, and postprandial glucose and insulin levels. He observed that Stevia preloads significantly reduced postprandial glucose levels compared to sucrose preloads and postprandial insulin levels compared to both aspartame and sucrose preloads. There are several possibilities for replacing the sucrose in a carbonated drink. Care must be taken to ensure that the balance of sweetness with a reduction in calories is achieved without adversely affecting the viscosity and quality. Scientists have also been exploring ways to mask the bitter flavours associated with the Reb A Stevia extract. The Cargill Inc. recently announced a dual-layered approach, starting with its patented technology examining taste responses to Reb A ‘at a cellular level’ and then developing flavour solutions based on these finding (Daniells 2009). The stability of stevioside during different processing and storage conditions has been evaluated in tea and coffee beverages. Stevioside is stable at elevated temperatures up to 120 ºC. In aqueous solutions, stevioside is remarkably stable in a pH range of 2–10 (Kroyer 2010). According to Clos et al. (2008), rebaudioside and stevioside in acidic beverages are stable when exposed to light.
ConclusionCentral composite design and response surface methodology can be used for the purpose of optimizing the formulation of Stevia-based carbonated drinks. This study has shown that the average panellists generally responded with a high level of acceptance for carbonated drinks containing 33.13% sucrose and 0.43% Stevia in syrup formulation. Results indicated that Stevia can partially replace the amount of sucrose without drastically affecting the physical properties and consumer acceptability. Reducing the concentration of sucrose as well as increasing the amount of Stevia decreased the viscosity and total soluble solid of the carbonated drink. Furthermore, the addition of 0.43% Stevia significantly reduced the level of carbohydrates and calories by 42.9% in the carbonated drink.
ReferencesAOAC (1985). AOAC Official Methods of Analysis,
14th ed. Arlington. VA: Association of Official Analytical Chemists, Inc.
Abdurahman, O.M., Ahmed, M.A. and Rao, M.V. (1998). Chemical composition of some traditional dishes of Oman. Food Chemistry 76(1/2): 17–22
Anon. (2000). Malaysian Food Act 1983 and Food Regulations 1985. Kuala Lumpur: MDC Sdn Bhd.
Clos, J.F., DuBios, G.E. and Prakash, I. (2008). Photostability of rebaudioside A and stevioside in beverages. J Agric Food Chem. 56: 8507–8513
Daniells, S. (2009). The science of Stevia. William Reed Business Media. 30th April 2009. Retrieved from http://www.Beveragedaily.com
Geuns, J.M.C. (2003). Stevioside. Phytochemistry 64: 913–921
Hamzah, A.R. (1987). Teknologi pemprosesan kordial berperisa. Nota Kursus MARDI.
Hanson, J.R. and De Oliveira, B.H. (1993). Stevioside and related sweet diterpenoid glycoside. Natural Products Reports 10: 301–309
Henika, R.G. (1982). Use of response surface methodology in sensory evaluation. Food Technol. 36(11): 96–101
Joglekar, A.M. and May, A.T. (1991). Product excellence through experimental design. In: Food product development from concept
33
K. Saniah and M. Sharifah Samsiah
to the market place (Graf, E. and Sugay, I.S., eds.), p. 211–230. New York: AVI Publishing Co.
Khuri, A.I. and Cornell, J.A. (1987). Response surface design and analyses. New York: Marcel Dekker
Kroyer, G. (2010). Stevioside and Stevia-sweetener in food: application, stability and interaction with food ingredients. J Verbraucherschutz Lebensmittelsicherh 5: 225–229
Lester, T. (1999). Stevia rebaudiana (sweet honey leaf). The Australian New Crops Newsletter, Issue No. 11
Meilgaard, M., Civille, G.V. and Carr, B.T. (1999). Sensory evaluation techniques, 3rd Ed. Boca Raton, Florida: CRC Press
Mizutani, K. and Tanaka, O. (2002). Use of Stevia rebaudiana sweeteners in Japan. In: Stevia, the Genus Stevia: Medicinal and Aromatic Plants – Industrial Profiles (Kinghorn, A.D., ed.), p. 178–195. London and NY: Taylor and Francis
Nergiz, C. and Otles, S. (1993). Chemical composition of Nigella sativa L. seeds. Food Chemistry 48: 259–261
Pearson, D. (1976). Chemical analysis of foods. 7th Edition, p. 14–16., Edinburg, London and New York: Churchill Livingstone
Potter, N.P. (1986). Food Science. 4th edition. Connecticut: AVI Publishing Company
Puri, M., Sharma, D. and Tiwari, A.K. (2011). Downstream processing of stevioside and its potential applications. Research Review Paper. Biotechnology Advance 29: 781–791
Saniah, K., Sharifah Samsiah, M., Mohd Lip, J., Mohd Nazrul, H. and Azizah, I. (2009). The potential of Stevia as a herbal sugar substitute in a non-carbonated drink. Proceedings of national conference on new crops and bio-resources, 15–17 Dec. 2009, Seremban, p. 220–222
Sharifah Samsiah, M. and Latifah, S. (2009). Acceptance of Stevia-incorporated sugarless flavoured confectionery jellies – a preliminary study. Proceedings of national conference on new crops and bio-resources, 15–17 Dec. 2009, Seremban, p. 218–219
Soejarto, D.D., Konghorn, A.D. and Fransworth, N.R. (1982). Potential sweetening agents of plant origin. III. Organoleptic evaluation of Stevia leaf herbarium samples of sweetness. Journal of Natural Products 45: 590–599
Suntornsuk, L., Gritsanapun, W., Nilkamhank, S. and Paochom, A. (2002). Quantitation of vitamin C content in herbal juice using direct titration. Journal of Pharmaceutical and Biomedical Analysis 28: 849–855
Stat-Ease, Inc. (2000). Design-Expert software version 6. Minneapolis
Stephen, D.A., Corby, K.M., Han, H., Coulon, S., Cefalu, W.T., Geiselman, P. and Williamson, D.A. (2010). Effect of Stevia, aspartame, and sucrose on food intake, satiety and postprandial glucose and insulin level. Appetite 55(1): 37–43
Tan, S.L. (2009). Stevia – satisfying Malaysia’s sweet tooth. Proceedings of national conference on new crops and bio-resources, 15–17 Dec. 2009, Seremban, p. 43–51
Zainun, C.A., Rokiah, B. and Siti Aishah, M. (2009). Effect of replacement of sucrose with Stevia on the organoleptic properties of a sugar rich wheat-based traditional cake. Proceedings of national conference on new crops and bio-resources, 15–17 Dec. 2009, Seremban, p. 215–217
34
Stevia in carbonated drinks
AbstrakKaedah gerak balas permukaan dan reka bentuk komposit berpusat telah digunakan dalam penentuan tahap optimum pemanis Stevia sebagai pengganti gula di dalam minuman berkarbonat. Dalam kajian ini kesan penggunaan kombinasi Stevia – sukrosa dengan julat 0.2–0.5% (Stevia) dan 0–54% (sukrosa) terhadap tahap penerimaan nilai rasa dan profil fizikal dan kimia bagi produk telah dikaji. Berdasarkan keputusan gerak balas permukaan dan pertindanan rajah, kualiti yang dikehendaki bagi minuman berkarbonat berperisa oren dapat diperoleh dengan menggabungkan 0.43% Stevia dan 33.13% sukrosa di dalam sirap. Keputusan menunjukkan nilai kalori serta karbohidrat menurun sebanyak 42.9%. Ini menggambarkan Stevia mempunyai potensi yang baik untuk diekploitasi sebagai pemanis alternatif bagi minuman berkarbonat.
Accepted for publication on 3 April 2012