the applications of hydroxamic acids in...
TRANSCRIPT
Hydroxamate complex hydrolysis Andrieux et al
THE HYDROLYSIS OF HYDROXAMIC ACID COMPLEXANTS IN THE
PRESENCE OF NON-OXIDISING METAL IONS 1:
FERRIC IONS
F.P.L.Andrieuxa, C.Boxall*a, R.J.Taylorb
aCentre for Materials Science, University of Central Lancashire, Preston PR1 2HE, UK
bNexia Solutions Ltd, British Technology Centre, Sellafield, Seascale, Cumbria CA20
1PG, UK
*To whom all correspondence should be sent. Centre for Materials Science, University
of Central Lancashire, Preston PR1 2HE, UK. Tel.: +44 1772 893530; fax: +44 01772
892996. E-mail: [email protected]
1
Hydroxamate complex hydrolysis Andrieux et al
Abstract
Hydroxamic acids (XHAs) are organic compounds with affinities for cations such as
Fe3+, Np4+ and Pu4+ and have been identified as useful reagents in nuclear fuel
reprocessing. Acid catalysed hydrolysis of free XHAs is well known and may impact
negatively on reprocessing applications. Hydrolysis of metal bound XHAs within metal
ion-XHA complexes is less understood. With the aid of speciation diagrams, we have
modelled UV-visible spectrophotometric kinetic studies of the acid-catalysed hydrolysis
of acetohydroxamic acid (AHA) bound to the model ion Fe(III). These studies have
yielded the following for the hydrolysis of AHA in the Fe(AHA)2+ complex at 293 K:
(i) the order with respect to [H+] during the rate determining step, m = 0.97, the same as
for the free ligand, indicating a similarity of mechanism; and
(ii) the rate parameter, k1=1.02 x 10⁻⁴ dm3 •mol-1 •s-1, greater than that for the free
ligand, k0 = 1.84 x 10⁻⁵ dm3 •mol-1 •s-1 for pH > -0.5, a result consistent with a Hammett
analysis of the system.
Keywords
Acetohydroxamic acid, ferric ions, complexation, speciation, hydrolysis, kinetics
2
Hydroxamate complex hydrolysis Andrieux et al
1. Introduction
The separation of U from Np and Pu are major stages in the reprocessing of spent
nuclear fuel by the Purex process [1,2]. Separation is commonly achieved by oxidation
state-specific aqueous / non-aqueous solvent extraction processes, controlled by redox
manipulation of key Pu or Np oxidation states or by the use of hydrophilic complexing
agents e.g. sulphate ions. Simple hydroxamic acids (XHA) are salt free, hydrophilic
organic compounds with the formula RCONHOH and so can act as di-oxygen ligands
with affinities for ‘hard’ cations such as Fe3+, Np4+ and Pu4+ [3-6] with which they form
5-membered chelate rings. They are also redox active, capable of reducing a range of
metal ions - for instance they very rapidly reduce Np(VI) to Np(V) [7]. These two
properties have led to them being identified as useful reagents for the control of Pu and
Np in an Advanced Purex and UREX processes [2,6,8-9].
Acid hydrolysis of free hydroxamic acids to hydroxylamine (itself a reducing agent for
a range of actinide species [10,11]) and the parent carboxylic acid is well known [12].
The kinetics of the hydrolysis of formohydroxamic acid (FHA, R=H) and
acetohydroxamic acid (AHA, R=CH3) in nitric acid have been determined [13] and are
found, at [HNO3] < 3 mol•dm-3 and when [HNO3] > [XHA], to obey eq. 1:
]H][XHA[Aedt
]XHA[dRT
AE+−=−
(1)
where, for FHA and AHA respectively, A, the pre-exponential factor, is 9.09 x 10⁹ and
3.22 x 10⁹ dm3 •mol-1 •s-1 and EA, the activation energy, is 77.3 and 79.9 kJ •mol-1.
Hydrolysis of metal ion bound-hydroxamates also occurs. Additionally, preliminary
studies have shown that the Pu(IV)-FHA and AHA complexes are slowly reduced to
free Pu(III) ions [9]. An understanding of these processes is vital if they are to be
3
Hydroxamate complex hydrolysis Andrieux et al
controlled within the design of an XHA-based Advanced Purex process. To this end, we
have experimentally studied and theoretically modelled the kinetics of the hydrolysis of
metal-XHA systems in nitrate media where (i) the metal ion complexes with, but does
not oxidise the ligand (Fe3+ / AHA; Np4+ / FHA, Np4+/AHA); (ii) the metal ion both
complexes and oxidises the ligand (Pu4+ / FHA and Pu4+ / AHA). This paper reports our
findings with respect to an example of the first class of experiments i.e. the hydrolysis
of an XHA in the presence of a complexing, but non-oxidising metal ion – specifically
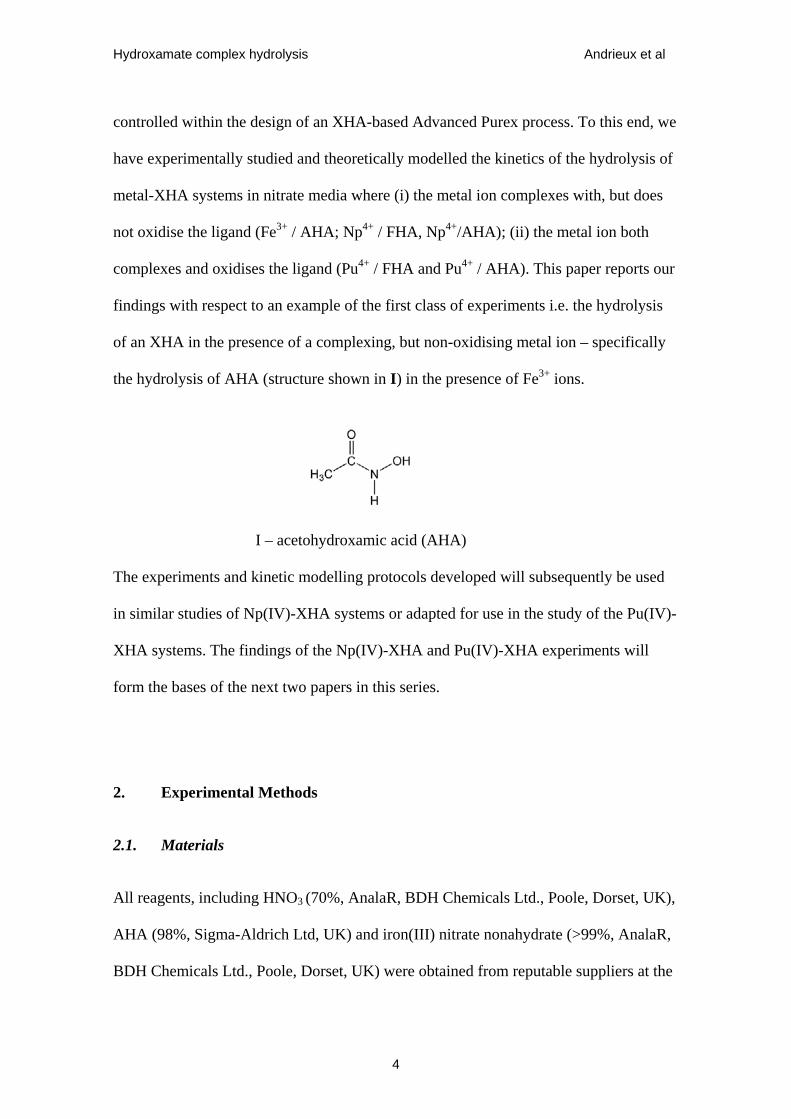
the hydrolysis of AHA (structure shown in I) in the presence of Fe3+ ions.
I – acetohydroxamic acid (AHA)
The experiments and kinetic modelling protocols developed will subsequently be used
in similar studies of Np(IV)-XHA systems or adapted for use in the study of the Pu(IV)-
XHA systems. The findings of the Np(IV)-XHA and Pu(IV)-XHA experiments will
form the bases of the next two papers in this series.
2. Experimental Methods
2.1. Materials
All reagents, including HNO3 (70%, AnalaR, BDH Chemicals Ltd., Poole, Dorset, UK),
AHA (98%, Sigma-Aldrich Ltd, UK) and iron(III) nitrate nonahydrate (>99%, AnalaR,
BDH Chemicals Ltd., Poole, Dorset, UK) were obtained from reputable suppliers at the
4
Hydroxamate complex hydrolysis Andrieux et al
highest available purity and used as received. AHA was stored in a conventional
refrigerator at 4°C in order to prevent its decomposition. Solutions of AHA were
prepared immediately prior to experiment. Solutions were prepared using doubly
distilled water, produced by a home-made still and further purified by a deionisation
system (E pure model 04642, Barnstead / Thermodyne, Dubuque, Iowa, USA) to a
resistivity of 1.8 x 10⁵ Ω m.
2.2. Procedures
UV-visible absorbance spectra of complex and complex precursor solutions were
measured by spectrophotometry (Diode Array model 8452A, Hewlett Packard, USA)
fitted with a HP89090A Peltier temperature controller.
For kinetic experiments, a single wavelength spectrophotometer (Model SP6-350, Pye-
Unicam, UK) was set to measure absorbance at λ = 498 nm, the absorption maximum of
the mono-acetohydroxamato complex (vide infra). Solutions for the kinetic experiments
were prepared from stock (Fe(III)) or freshly made solutions (AHA) and pipetted into
an optical cuvette (pathlength 1 cm). The complexant (AHA) was added last. The
volume of complexant required was always small and had no effect on the temperature
of the receiving solution when added. After mixing, the absorbance was then measured
manually at appropriate time intervals.
All experiments were conducted at 293 ± 1 K. All experiments involving Fe(III) were
conducted at pH < 2.5. However, it is well known that Fe3+ readily hydrolyses in water
in accordance with:
+++ +⇔+ HFeOHOHFe 22
3
5
Hydroxamate complex hydrolysis Andrieux et al
this equilibrium being the first step in a series of deprotonation / polymerisation
reactions that ultimately result in the formation of ferric hydroxides and oxyhydroxides.
Using the most recently published, critically assessed Gibbs energies of formation of the
various species involved [14,15], the equilibrium constant for this first deprotonation can be
calculated as being equal to 6.78 x 10⁻³, corresponding to a pKa(Fe3+) of 2.17. Thus, as
hydrolysis to form Fe(OH)2+ will become significant above pH = 2.17, only those data recorded
at pH = 2.1 and below will be subjected to rigorous experimental interpretation and modelling.
Data recorded in the range 2.1 < pH < 2.5, where shown, is presented for the purposes of
context only.
6
Hydroxamate complex hydrolysis Andrieux et al
3. Results and Discussion
3.1. Speciation and Kinetic Modelling of Metal-Hydroxamic Acid Systems
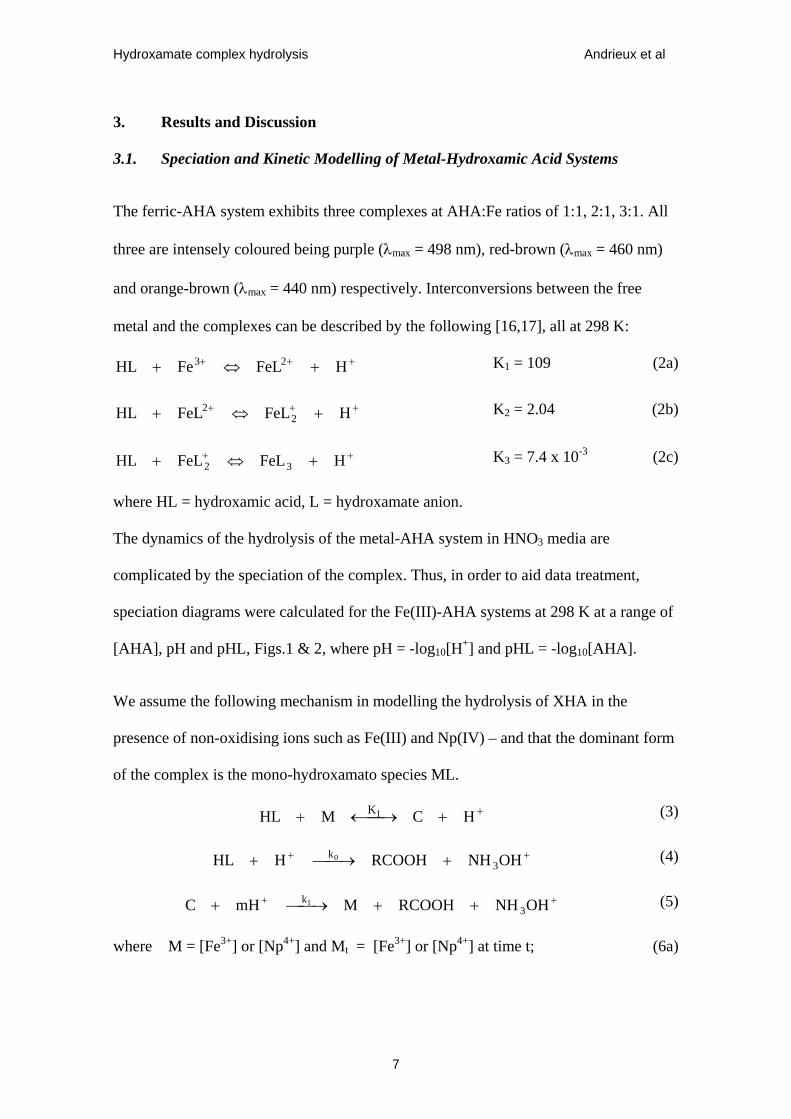
The ferric-AHA system exhibits three complexes at AHA:Fe ratios of 1:1, 2:1, 3:1. All
three are intensely coloured being purple (λmax = 498 nm), red-brown (λmax = 460 nm)
and orange-brown (λmax = 440 nm) respectively. Interconversions between the free
metal and the complexes can be described by the following [16,17], all at 298 K:
+++ +⇔+ HFeLFeHL 23 K1 = 109 (2a)
+++ +⇔+ HFeLFeLHL 22 K2 = 2.04 (2b)
++ +⇔+ HFeLFeLHL 32 K3 = 7.4 x 10⁻³ (2c)
where HL = hydroxamic acid, L = hydroxamate anion.
The dynamics of the hydrolysis of the metal-AHA system in HNO3 media are
complicated by the speciation of the complex. Thus, in order to aid data treatment,
speciation diagrams were calculated for the Fe(III)-AHA systems at 298 K at a range of
[AHA], pH and pHL, Figs.1 & 2, where pH = -log10[H+] and pHL = -log10[AHA].
We assume the following mechanism in modelling the hydrolysis of XHA in the
presence of non-oxidising ions such as Fe(III) and Np(IV) – and that the dominant form
of the complex is the mono-hydroxamato species ML.
++⎯⎯→←+ HCMHL 1K (3)
++ +⎯→⎯+ OHNHRCOOHHHL 3k0 (4)
++ ++⎯→⎯+ OHNHRCOOHMmHC 3k1 (5)
where M = [Fe3+] or [Np4+] and Mt = [Fe3+] or [Np4+] at time t; (6a)
7
Hydroxamate complex hydrolysis Andrieux et al
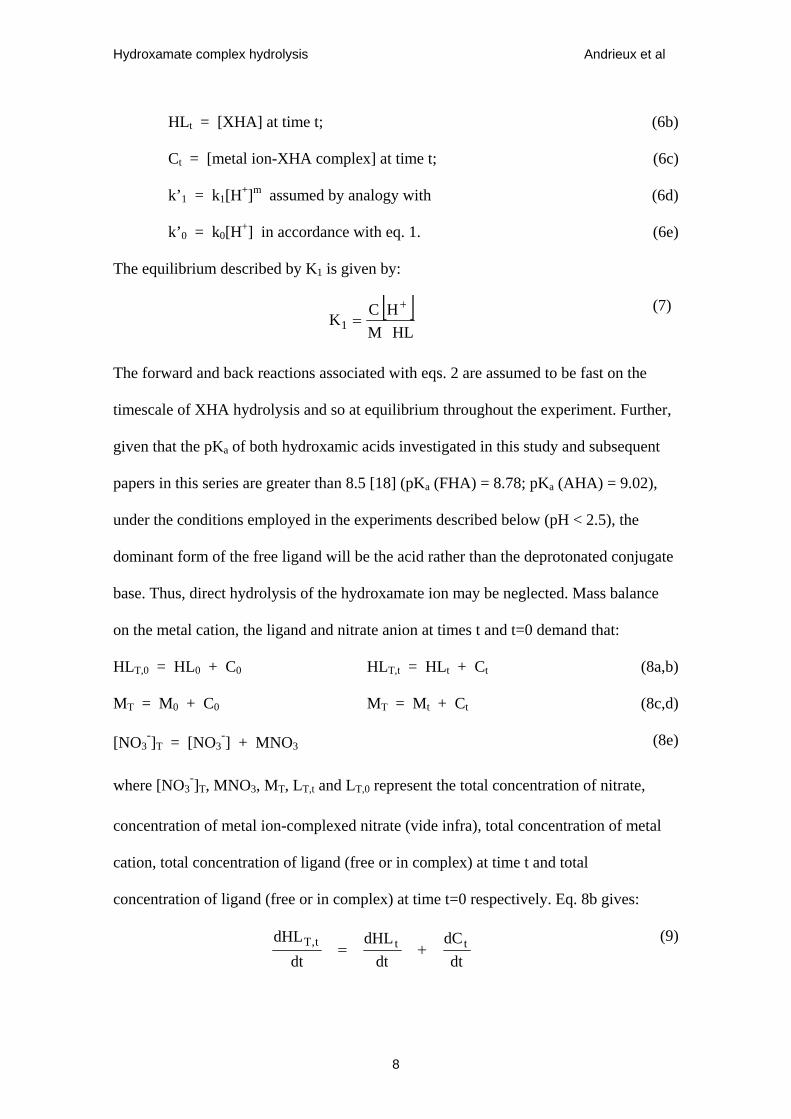
HLt = [XHA] at time t; (6b)
Ct = [metal ion-XHA complex] at time t; (6c)
k’1 = k1[H+]m assumed by analogy with (6d)
k’0 = k0[H+] in accordance with eq. 1. (6e)
The equilibrium described by K1 is given by:
[ ]HLM
HCK1
+=
(7)
The forward and back reactions associated with eqs. 2 are assumed to be fast on the
timescale of XHA hydrolysis and so at equilibrium throughout the experiment. Further,
given that the pKa of both hydroxamic acids investigated in this study and subsequent
papers in this series are greater than 8.5 [18] (pKa (FHA) = 8.78; pKa (AHA) = 9.02),
under the conditions employed in the experiments described below (pH < 2.5), the
dominant form of the free ligand will be the acid rather than the deprotonated conjugate
base. Thus, direct hydrolysis of the hydroxamate ion may be neglected. Mass balance
on the metal cation, the ligand and nitrate anion at times t and t=0 demand that:
HLT,0 = HL0 + C0 HLT,t = HLt + Ct (8a,b)
MT = M0 + C0 MT = Mt + Ct (8c,d)
[NO3-]T = [NO3
-] + MNO3 (8e)
where [NO3-]T, MNO3, MT, LT,t and LT,0 represent the total concentration of nitrate,
concentration of metal ion-complexed nitrate (vide infra), total concentration of metal
cation, total concentration of ligand (free or in complex) at time t and total
concentration of ligand (free or in complex) at time t=0 respectively. Eq. 8b gives:
dtdC
dtdHL
dtdHL ttt,T +=
(9)
8
Hydroxamate complex hydrolysis Andrieux et al
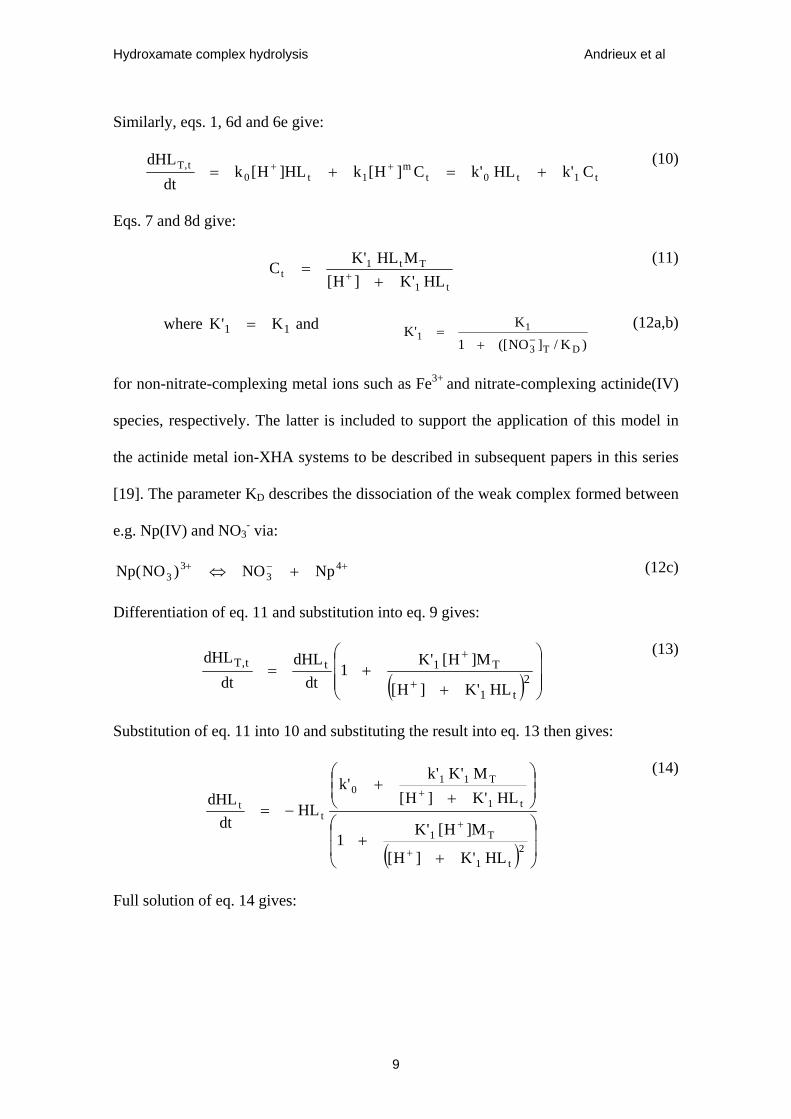
Similarly, eqs. 1, 6d and 6e give:
t1t0tm
1t0t,T C'kHL'kC]H[kHL]H[k
dtdHL
+=+= ++ (10)
Eqs. 7 and 8d give:
t1
Tt1t HL'K]H[
MHL'KC+
= + (11)
where and 11 K'K =)K/]NO([1
K'K
DT3
11 −+
= (12a,b)
for non-nitrate-complexing metal ions such as Fe3+ and nitrate-complexing actinide(IV)
species, respectively. The latter is included to support the application of this model in
the actinide metal ion-XHA systems to be described in subsequent papers in this series
[19]. The parameter KD describes the dissociation of the weak complex formed between
e.g. Np(IV) and NO3- via:
+−+ +⇔ 43
33 NpNO)NO(Np (12c)
Differentiation of eq. 11 and substitution into eq. 9 gives:
( ) ⎟⎟⎟
⎠
⎞
⎜⎜⎜
⎝
⎛
++=
+
+
2t1
T1tt,T
HL'K]H[
M]H['K1
dtdHL
dtdHL
(13)
Substitution of eq. 11 into 10 and substituting the result into eq. 13 then gives:
( ) ⎟⎟
⎠
⎞
⎜⎜
⎝
⎛
++
⎟⎟⎠
⎞⎜⎜⎝
⎛
++
−=
+
+
+
2t1
T1
t1
T110
tt
HL'K]H[
M]H['K1
HL'K]H[M'K'k
'kHL
dtdHL
(14)
Full solution of eq. 14 gives:
9
Hydroxamate complex hydrolysis Andrieux et al
⎟⎟⎟
⎠
⎞
⎜⎜⎜
⎝
⎛
++
++
⎟⎟⎟
⎠
⎞
⎜⎜⎜
⎝
⎛
+
+−
⎟⎟⎠
⎞⎜⎜⎝
⎛
⎟⎟⎟
⎠
⎞
⎜⎜⎜
⎝
⎛
+
+−
⎟⎟⎟
⎠
⎞
⎜⎜⎜
⎝
⎛
+
+=
++
++
+
+
+
+
+
+
]H['kM'K'k
]H[HL'K
]H['kM'K'k
]H[HL'K
120]H[
M'K'k'k
20]H[
M'K'k
0
t
0]H[M'K'k
]H[M'K
]H[HL'K
]H[HL'K
1
0
T1101
0
T11t1
T1210
T121
T11
T1
01
t1
1
1ln
'k'k
'k
HLHL
ln'k
1
1
1ln
'k1t
(15)
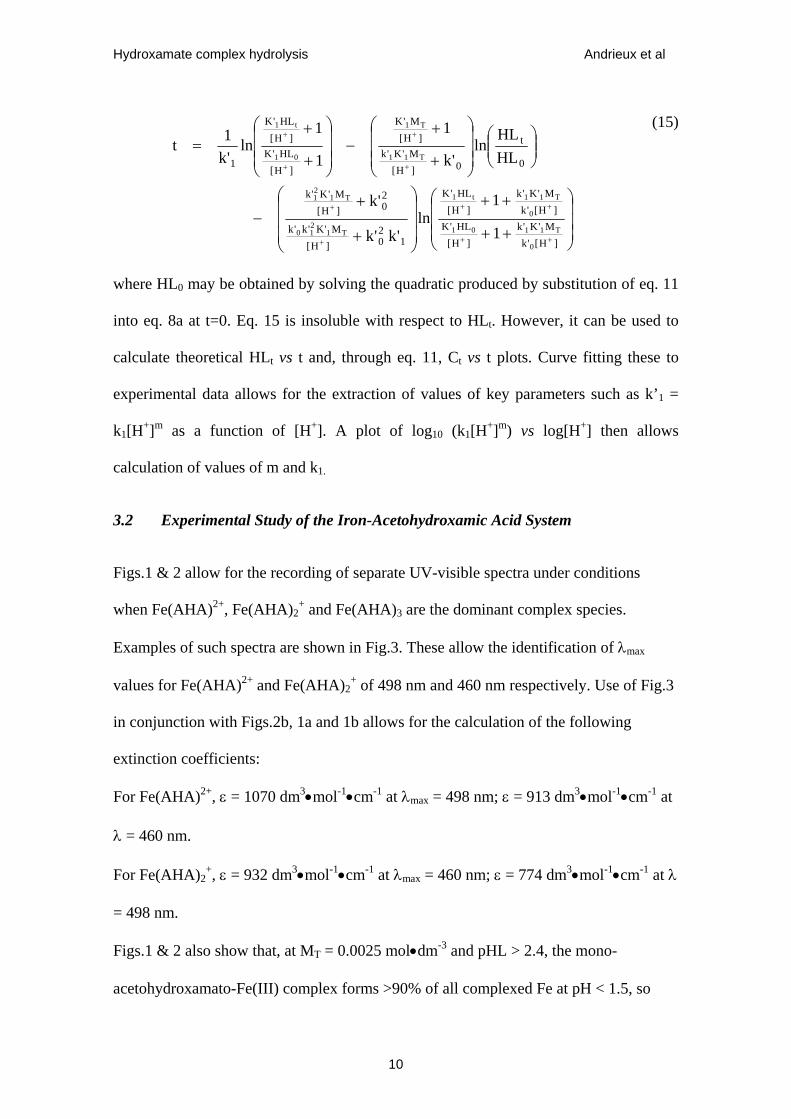
where HL0 may be obtained by solving the quadratic produced by substitution of eq. 11
into eq. 8a at t=0. Eq. 15 is insoluble with respect to HLt. However, it can be used to
calculate theoretical HLt vs t and, through eq. 11, Ct vs t plots. Curve fitting these to
experimental data allows for the extraction of values of key parameters such as k’1 =
k1[H+]m as a function of [H+]. A plot of log10 (k1[H+]m) vs log[H+] then allows
calculation of values of m and k1.
3.2 Experimental Study of the Iron-Acetohydroxamic Acid System
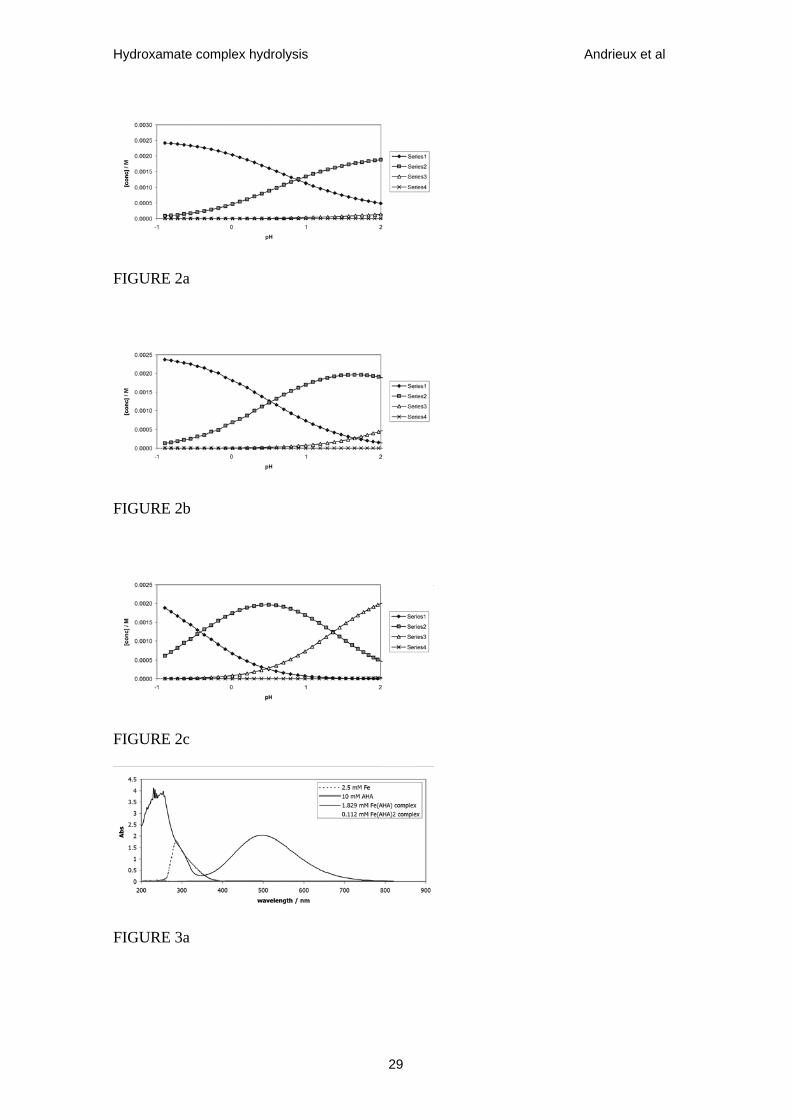
Figs.1 & 2 allow for the recording of separate UV-visible spectra under conditions
when Fe(AHA)2+, Fe(AHA)2+ and Fe(AHA)3 are the dominant complex species.
Examples of such spectra are shown in Fig.3. These allow the identification of λmax
values for Fe(AHA)2+ and Fe(AHA)2+ of 498 nm and 460 nm respectively. Use of Fig.3
in conjunction with Figs.2b, 1a and 1b allows for the calculation of the following
extinction coefficients:
For Fe(AHA)2+, ε = 1070 dm3•mol-1•cm-1 at λmax = 498 nm; ε = 913 dm3•mol-1•cm-1 at
λ = 460 nm.
For Fe(AHA)2+, ε = 932 dm3•mol-1•cm-1 at λmax = 460 nm; ε = 774 dm3•mol-1•cm-1 at λ
= 498 nm.
Figs.1 & 2 also show that, at MT = 0.0025 mol•dm-3 and pHL > 2.4, the mono-
acetohydroxamato-Fe(III) complex forms >90% of all complexed Fe at pH < 1.5, so
10
Hydroxamate complex hydrolysis Andrieux et al
defining the [AHA] and pH range over which kinetic experiments may be conducted
wherein, for ease of analysis, complexed Fe exists near-exclusively as the Fe(AHA)2+
complex.
With these experimental and analytical restrictions in mind, and in order to test the
range of utility of the various assumptions made, acetohydroxamato-Fe(III) complex
hydrolysis experiments were conducted at 293 K at a total iron concentration of 0.0025
mol•dm-3, a total AHA concentration of 0.004 mol•dm-3 (AHA:Fe ratio = 1.6:1) and at
pH ≤ 2.5, although it should be borne in mind that experiments conducted in the range
2.1 < pH ≤ 2.5 may be complicated by the hydrolysis of Fe3+ to form Fe(OH)2+. The
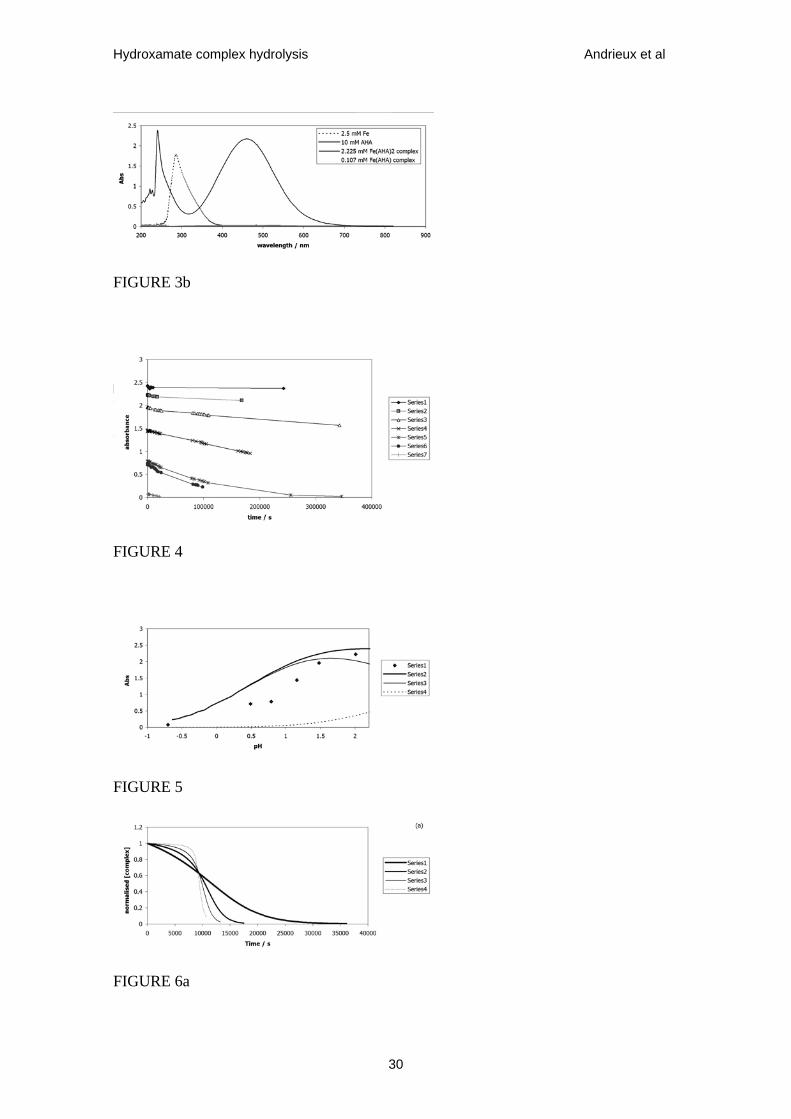
results of these experiments are shown in Fig.4. Taken from Fig.4, Fig.5 shows the
initial absorbance due to complexed Fe3+ at λ = 498 nm, as a function of pH, data at pH
> 2.1 having been discarded due to quantitative analysis being complicated by the
potential formation of Fe(OH)2+. Superimposed over this data set are three theoretical
absorbance traces, all calculated at λ = 498 nm using the speciation data of Fig.2b:
(i) the absorbance due to the 1:1 complex calculated using ε = 1070 dm3•mol-1•cm-1
(ii) the absorbance due to the 2:1 complex calculated using ε = 774 dm3•mol-1•cm-1
(iii)the sum of both absorbances.
There is reasonable correspondence between the calculated total and experimental
absorbance values. Comparison of the calculated total absorbance trace and that
calculated trace due to Fe(AHA)2+ indicates that, under the experimental conditions
employed, the 1:1 complex is responsible for >90% of the measured absorbance at pH <
1.7. This supports the analysis above that at MT = 0.0025 mol•dm-3 and pHL > 2.4, the
1:1 complex forms >90% of all complexed iron at pH < 1.5. The absorbance measured
11
Hydroxamate complex hydrolysis Andrieux et al
for all data recorded at pH < 1.7 is therefore predominantly due to Fe(AHA)2+, so
allowing use of the experimental model described by eqs. 7-15 and data analysis by
curve fitting with eqs. 11 and 15. This curve fitting is facilitated by the observation of k1
and K’1 having different effects on the shape of the calculated Ct vs t curve. These
effects are illustrated in Fig.6 and may be qualitatively understood as follows.
The rate parameter k1 affects the overall duration of the decrease in concentration of
complex with time, although this effect is found to vanish for very small values of k1.
This is readily understood in that once the process associated with k1 (eq. 5) is much
slower than the parallel process associated with k0 (eq. 4) (i.e. k1[H+]m << k0[H+]), the
latter process determines the overall rate. In contrast, no matter the overall duration of
the decay in complex concentration, the equilibrium constant K’1 only affects the degree
of sigmoid character in the Ct vs t profile with a pseudo-induction period appearing at
large K’1 during which Ct is invariant with time. The larger K’1 at any one set of
otherwise constant experimental conditions, the longer the induction period before the
concentration starts to decay. Again, this may be readily understood in that the larger
K’1, the longer a significant / measurable concentration of complex will maintain during
the overall decay time. Curve fitting the data of Fig.4 is further facilitated by only one
parameter being unknown in this instance: k’1 (= k1[H+]m, eq. 6d). Using Fig.4, the
curve fitting procedure can be conducted on data recorded as a function of [H+], so
allowing m and k1 to be determined from a plot of log10k’1 vs log10[H+] (eq. 6d).
Fig.7 shows the data of Fig.4, normalised with respect to the absorbance at t=0, and
associated theoretical fits generated using eqs. 11 and 15, also normalised with respect
to the calculated [Fe(AHA)2+] at t=0. Parameters used in the generation of each fitting
12
Hydroxamate complex hydrolysis Andrieux et al
plot are listed in table 1. Data at pH 2.5 have again been excluded from quantitative
analysis due to potential complications arising from Fe(OH)2+ formation. Of particular
interest are:
• at all pH bar –0.7, k1[H+]m > k0[H+] indicating that complexed acetohydoxamate is
more susceptible to acid-catalysed hydrolysis than free AHA.
• k1 has a negative value at pH –0.7 – this will be explored below.
From table 1 and in accordance with eq. 6d, Fig.8 shows a plot of log10 (k1[H+]m) vs
log10[H+], excluding data at pH 2.5 (vide supra) and 2.01 (outside the range where the
monoacetohydroxamato complex can be assumed to be the dominant form of
complexed ferric ions) and pH –0.7 (due to the above-mentioned negative value of k1).
The slope and intercept of the plot in Fig.8 give values of m and k1 of 0.97 and 1.02 x
10-4 dm3 •mol-1 •s-1 respectively.
According to Monzyk and Crumbliss, the forward and back reactions associated with
eq. 2a have rate coefficient values of 2 x 10³ and 7.6 x 10⁻² dm3 mol-1 s-1 respectively
[17]. As the rate coefficients for the hydrolysis of free AHA and AHA within the 1:1
complex are 1.84 x 10⁻⁵ (see table 1) and 1.02 x 10⁻⁴ dm3 mol-1 s-1 respectively, our
earlier assumption of the reaction associated with eq. 2a being at equilibrium throughout
the experiments reported here can be seen to be justified. This validates the use of eqs.
11 and 15 in the analysis of the data of Figs.4 and 7.
The negative value of k’1 obtained at pH = -0.7 is due to the lower pH limit of
applicability of eq. 1 being approximately pH –0.5. This limit is thought to arise from a
possible change in the mechanism of acid-catalysed hydrolysis of free AHA at or
around pH –0.5. The mechanism at pH > -0.5 has long been thought to involve [12]:
13
Hydroxamate complex hydrolysis Andrieux et al
(i) rapid pre-equilibrium protonation of the carbonyl oxygen; followed by
(ii) nucleophilic attack by water at the carbonyl carbon, resulting in the formation of a
tetrahedral intermediate; followed by
(iii) re-creation of carbonyl at the new tetrahedral C with loss of leaving group NH2OH
(see Fig.9).
Taylor et al report that in nitric acid (< 3 mol•dm-3), XHAs hydrolyse in accordance
with this mechanism to give hydroxylamine and the parent carboxylic acid, the rate
obeying eq. 1 [13]. Modena et al have also investigated the hydrolysis of
propanhydroxamic acid in sulphuric and nitric acid and found that both acids exert an
identical catalytic effect with the rates passing through a maximum as a function of [H+]
[20]. Buglass and Juffkins have reported a similar rate maximum in a series of studies
on 2,2-dimethylacetohydroxamic acid [21]. This experimental rate maximum is
therefore a departure from the applicability of eq. 1 at high [H+], with k’0 values
calculated using eq. 1 at pH < -0.5 being greater than those obtained by experiment – so
accounting for the negative value of k’1 = k1[H+]m obtained in table 1. Several
explanations have been forwarded to explain this change in mechanism and which of
these, if any, are true is still uncertain [12]:
(a) rate saturation at high [H+] due to complete conversion of the (weakly) basic
substrate into its conjugate acid;
(b) the acid-base pre-equilibrium steps and transition state formation steps being
governed by different acidity functions;
(c) a change in the initial protonation site from the carbonyl O to the hydroxylamino N
(see Fig.9).
14
Hydroxamate complex hydrolysis Andrieux et al
It is our view that it is the first of these explanations that is most applicable for the
system studied here. Whilst experiments are underway in our laboratories to verify this
view, an early indication of its validity is provided by the data of Fig.10 which again
presents the experimental data recorded at pH –0.7 from Fig.7. However, in this
instance, rather than taking the literature value of K’1, a value of k’0 calculated in
accordance with eq. 1 and then obtaining the best fit by variation of k’1, k’1 has first
been calculated using eq. 6d and the values of m and k1 of 0.97 and 1.02 x 10⁻⁴ dm3
•mol-1 •s-1 obtained above. The theoretical fit has then been obtained by varying k’0
within eqs. 11 and 15. The fit shown in Fig.10 was obtained using a value of k’0 of 5.51
x 10-5 s-1, which is less than the value of k’0 = 9.2 x 10⁻⁵ s-1 calculated by use of eqs. 1
and 6e at pH –0.7. Eq. 1 predicts a value of the second order rate constant k0 of 1.84 x
10-5 dm3 •mol-1 •s-1 (see table 1). Dividing the fitted value of k’0 of 5.51 x 10⁻⁵ s-1 by k0
= 1.84 x 10⁻⁵ dm3 •mol-1 •s-1 gives a value of [H+] = 3 mol•dm-3, this despite the
experiment having been conducted at pH –0.7, corresponding to [H+] = 5.01 mol•dm-3.
This effective value of [H+] = 3 mol•dm-3, corresponding to pH –0.48, is coincident
with the upper limit of applicability of eq. 1 reported by Taylor et al [13] and the acidity
at which Buglass and Juffkins report that the rate of hydrolysis of 2,2-
dimethylacetohydroxamic acid saturates [21]. In light of this result, we suggest that of
the three above suggested explanations of the hydrolytic behaviour of free AHA at low
pH, explanation (a) is the most likely to obtain i.e. that deviation from eq. 1 at high
acidity is caused by a saturation in the protonation of carbonyl group of AHA to form
its conjugate acid AHAH+. According to the generally accepted mechanism (i)-(iii)
above, AHAH+ is then the species that undergoes nucleophilic attack by water to form
the observed reaction products. Consequently, the measured rate of hydrolysis of free
15
Hydroxamate complex hydrolysis Andrieux et al
AHA would be expected to be proportional to the instantaneous concentration of
AHAH+.
From table 1 it is apparent that complexation of AHA with Fe3+ to form a 1:1 complex
accelerates the hydrolysis of AHA at pH > -0.5 at 293 K. This can be understood by
first noting that m = 1 for the hydrolysis of both the free and bound AHA, suggesting
that the same general mechanism obtains in each system at pH > -0.48 i.e. rapid pre-
equilibrium protonation of the carbonyl oxygen of the bound AHA is followed by
nucleophilic attack by water on the carbonyl carbon (mechanism (i)-(iii) above). With
this in mind, acceleration by complexation at pH > -0.5 is consistent with the
observation that, through a Hammett equation analysis, electron withdrawing
substituents (X in XHA, the metal in the hydroxamato-metal complex) accelerate the
hydrolysis of AHA by increasing the susceptibility of the carbon of the hydroxamate
carbonyl group to nucleophilic attack by H2O.
It is of interest to note that, at 1.48 ≥ pH ≥ 0.49, k1 is approximately 5.6x greater than
k0. Table 2 compares the hydrolytic half life of free AHA, (t½)0, with that of AHA in the
presence of Fe3+ as determined from the experimental data of Fig.7. This comparison
indicates that hydrolysis in the presence of Fe3+ is at most 3x faster than that of free
AHA, reflecting the incomplete complexation of AHA with ferric ions. The greatest
difference between the rate ratio expected on the basis of k1/k0 with that determined
experimentally is seen at low pH, reflecting the lower levels of mono-acetohydroxamato
complex formed at high acidities (Fig.2b).
Finally, let us return to our conclusion that the deviation at pH < -0.48 of the measured
value of k’0 from that calculated using eq. 1 is due to complete conversion of AHA into
16
Hydroxamate complex hydrolysis Andrieux et al
its conjugate acid AHAH+ (explanation (a) above). If such a secenario were to obtain
then a speciation diagram of the type shown in Fig.11 would apply. Concentrations of
AHAH+ and AHA over the pH range shown are then given by
TA
]AHA[]H[K
]H[]AHAH[+
++
+=
(16a)
TA
A ]AHA[]H[K
K]AHA[
++=
(16b)
where [AHA]T = [AHA] + [AHAH+] and KA is the equilibrium constant for:
++ +⇔ HAHAAHAH (17)
Eq. 16a has two asymptotic forms. At high pH, [H+] < KA and eq. 16a reduces to:
TA
]AHA[K
]H[]AHAH[+
+ = (18a)
which, if the rate of free AHA hydrolysis is taken to be proportional to [AHAH+] (vide
supra) is consistent with the experimental dependence of that rate on total AHA
concentration and [H+] given in eq. 1. At low pH, [H+] > KA and eq. 16a reduces to:
T]AHA[]AHAH[ =+ (18b)
and the rate becomes invariant with pH. Eq. 16 and eq. 18a therefore suggest that k’0 for
hydrolysis of the free ligand is most appropriately written as
]H[k]H[K]H[
k'k 0
A
H0
0++
+≈
+=
(19a)
where k0H is the pseudo-first order rate coefficient for the nucleophilic attack of water
on free AHAH+. An analogous equation can be written for the complexed ligand:
]H[k]H[K]H[
k'k 1
C,A
H1
1++
+≈
+=
(19b)
17
Hydroxamate complex hydrolysis Andrieux et al
where KA,C is the equilibrium constant for the process analogous to eq. 17 that occurs
with complexed AHA.
Returning to the free ligand, schematic plots of eq. 16a, 18a and 18b are shown in
Fig.12 from which it can be seen that, at the point of intersection of the plots derived
from asymptotic eqs. 18a and 18b, [H+] = KA. From eq. 19a, it can be seen that this
value of [H+] can also be determined by dividing the value of k0 calculated from eq. 1
into the (saturation) value of k’0 obtained by the curve fitting of Fig.10. Consequently,
KA for the equilibrium given by eq. 17 can be seen to have a value of 3 mol•dm-3.
Fig.11 shows the speciation diagram obtained from eqs. 16 using KA = 3 mol•dm-3and a
total concentration of acetohydroxamic acid = 0.0025 mol•dm-3.
In using the data of Fig.10 in this computation of KA, we are necessarily assuming that
the protonation of the carbonyl oxygen in the complexed ligand has yet to achieve
saturation at pH –0.7 i.e. k’1 = k1[H+] where k1 = 1.02 x 10⁻⁴ dm3 •mol-1 •s-1 obtained
above. This is not unreasonable as AHA complexation with Fe3+ to form a complex of
the type shown in Fig.9 will necessarily make the lone pairs on the carbonyl oxygen less
available for protonation. Thus KA,C for the complexed ligand will be greater than KA
for the free, with the degree of ligand protonation and so level of hydrolytically active
AHAH+ formation being suppressed upon complexation. Returning to table 1,
comparison of k’1 with k’0 in the context of eqs. 19 and the deduction that KA,C > KA,
then indicates that k1H > k0
H i.e. that the rate of nucleophilic attack of water on the
carbonyl carbon is greater for complexed than free AHAH+. This deduction is consistent
with the Hammett-based analysis above i.e. that electron withdrawing groups on the
carbonyl will increase the susceptibility of the carbonyl carbon to nucleophilic attack.
18
Hydroxamate complex hydrolysis Andrieux et al
4. Conclusions
Acid catalysed hydrolysis of free XHAs is well known and may impact negatively upon
their potential applications in spent nuclear fuel reprocessing. Hydrolysis of the metal
bound ligand within metal ion-XHA complexes is less well understood. In order to
elucidate the effect of complexation on the hydrolysis reaction, we have with the aid of
speciation diagrams, modelled and explained UV-visible spectrophotometric kinetic
studies of the acid-catalysed hydrolysis of acetohydroxamic acid (AHA) whilst bound to
the model ion Fe(III). Kinetic models have been developed and used to obtain the
following for the hydrolysis of AHA in the Fe(AHA)2+ complex at 293 K:
(i) the second order rate parameter, k1=1.02 x 10⁻⁴ dm3 •mol-1 •s-1; and
(ii) the order with respect to [H+] during the rate determining step, m = 0.97.
The latter indicates that the mechanism for the hydrolysis of complexed AHA is
analogous to that of the free ligand i.e. rapid pre-equilibrium protonation of the carbonyl
oxygen (pKa = -0.48) followed by nucleophilic attack by water on the carbonyl carbon.
The value of the former, k1, is greater than the analogous parameter for hydrolysis of the
free ligand, k0 = 1.84 x 10⁻⁵ dm3 •mol-1 •s-1 at all pH > -0.5. This is consistent with a
Hammett-based analysis wherein electron withdrawing groups (the metal during
complexation) accelerate AHA hydrolysis by increasing the susceptibility of the
carbonyl group to nucleophilic attack.
19
Hydroxamate complex hydrolysis Andrieux et al
Acknowledgements
The authors wish to thank British Nuclear Fuels Ltd and the Nuclear Decommissioning
Authority (NDA) for financial support and for a post-doctoral research fellowship for
FA.
20
Hydroxamate complex hydrolysis Andrieux et al
References
[1] Dennis, I.S., Jeapes, A.P., Reprocessing Irradiated Fuel. In: Wilson, P.D., Ed.,
The Nuclear Fuel Cycle, Oxford Science Publications, Chapter 7, p.116, 1996.
[2] Birkett, J.E., Carrott, M.J., Fox, O.D., Jones, C.J., Maher, C.J., Roube, C.V.,
Taylor, R.J., Woodhead, D.A.: Recent Developments in the Purex Process for Nuclear
Fuel Reprocessing: Complexant Based Stripping for Uranium - Plutonium Separation.
Chimia 59, 898-904 (2005).
[3] Desaraju, P., Winston, A.: Synthesis and Iron Complexation Studies of Bis-
Hydroxamic Acids. J.Co-ord.Chem. 14, 241-248 (1986).
[4] Barocas, A., Baroncelli, F., Biondi, G.B., Grossi, G.: The Complexing Power of
Hydroxamic Acids and its Effects on Behaviour of Organic Extractants in the
Reprocessing of Irradiated Fuels II. J.Inorg.Nucl.Chem. 28, 2961-2967 (1966).
[5] Baroncelli, F., Grossi, G.: The Complexing Power of Hydroxamic Acids and its
Effects on Behaviour of Organic Extractants in the Reprocessing of Irradiated Fuels I.
J.Inorg.Nucl.Chem. 27, 1085-1092 (1965).
[6] Taylor, R.J., May, I., Wallwork, A.L., Dennis, I.S., Hill, N.J., Galkin, B.Y.,
Zilberman, B.Y., Fedorov, Y.S.: The Applications of Formo- and Aceto- Hydroxamic
Acids in Nuclear Fuel Reprocessing. J.Alloys Comp. 271-273, 534-537 (1998).
[7] Colston, B.J.; Choppin, G.R.; Taylor, R.J. A preliminary study of the reduction
of Np(VI) by formohydroxamic acid using stopped-flow near-infrared
spectrophotometry. Radiochimica Acta 88, 329-334 (2000).
21
Hydroxamate complex hydrolysis Andrieux et al
[8] Fox, O.D., Jones, C.J., Birkett, J.E., Carrott, M.J., Maher, C.J., Roube, C.V.
Taylor, R.J.: Advanced PUREX flowsheets for future Np and Pu fuel cycle demands.
In: Separations for the Nuclear Fuel Cycle in the 21st Century; Lumetta, G.J, Nash,
K.L., Clark, S.B., Friese, J.I., Eds. ACS Symposium Series 933, ACS, Washington DC.
USA, 89-102, 2006.
[9] Todd, T.A., Wigelund, R.A., Advanced Separation Technologies for Processing
Spent Nuclear Fuel and the Potential Benefits to a Geologic Repository. In: Separations
for the Nuclear Fuel Cycle in the 21st Century; Lumetta, G.J, Nash, K.L., Clark, S.B.,
Friese, J.I., Eds. ACS Symposium Series 933, ACS, Washington DC. USA, 41-56,
2006.
[10] Koltunov, V.S., Zhuravleva, G.I., Shapovalov, M.P.: Kinetics of Actinide
Reduction by hydroxylamine 5 & 6. Soviet Radiochem. 23, 449-453 & 454-459 (1981).
[11] Barney, G.S.: A Kinetic Study of the Reaction of Plutonium(IV) with
Hydroxylamine. J.Inorg.Nucl.Chem. 38, 1677-1681 (1976).
[12] Ghosh, K.K.: Kinetic and Mechanistic Aspects of Acid Catalysed Hydrolysis of
Hydroxamic Acids. Indian J.Chem. 36B, 1089-1102 (1997).
[13] Carrott, M.J., Fox, O.D., Jones, C.J., Mason, C., Taylor, R.J., Sinkov, S.I.,
Choppin, G.R.: Solvent Extraction Behaviour of Plutonium Ions in the Presence of
Simple Hydroxamic Acids, Solvent Extraction and Ion Exchange, to be submitted
(2007)
[14] Cornell, R.M., Schwertmann, U.: The Iron Oxides, VCH Publishers, New York,
Chapter 8, p. 175, 1996.
22
Hydroxamate complex hydrolysis Andrieux et al
[15] Heusler, K.E., Lorenz, W.J., Standard Potentials in Aqueous Solution, Bard, A.J.,
Parsons, R., Jordan, J., Eds., Marcel Dekker Inc., New York, Chapter 14, p.391, 1985.
[16] Kazmi, S.A., McArdle, J.V.: Kinetics of Formation of Bis- and
Tris(acetohydroxamato) Fe(III). J.Inorg.Nucl.Chem. 43, 3031-3034 (1981).
[17] Monzyk, B., Crumbliss, A.L.: Mechanism of Ligand Substitution on High-Spin
Iron(III) by Hydroxamic Acid Chelators. Thermodynamic and Kinetic Studies on the
Formation and Dissociation of a Series of Monohydroxamatoiron (III) Complexes.
J.Am.Chem.Soc., 101:21, 6203 (1979).
[18] Martell, A.E., Smith, R.M.: Critical Stability Constants, National Institute of
Standards, Standard Reference Database 46, Version 6.0 (2001).
[19] Andrieux, F.P.L., Boxall, C., Mason, C., Taylor, R.J.: The Hydrolysis of
Hydroxamic Acid Complexants in the Presence of Non-Oxidising Metal Ions 2:
Neptunium (IV) Ions. J.Solution Chem., submitted (2007).
[20] Di Furia, F., Modena, G., Scrimin, P., Gasparini, G.M., Grossi, G.: The Role of
Hydroxamic Acids in the Retention of Fission Products in TBP Diluents. A Quantitative
Study in a Model System. Sep.Sci.Tech. 17, 1451-1468 (1982).
[21] Buglass, A.J., Dorr, M., Juffkins, M.: On the Rate Maxima Observed in the Acid
Hydrolysis of Some Alkylhydroxamic Acids. Tet.Letts. 28, 3283-3284 (1987).
23
Hydroxamate complex hydrolysis Andrieux et al
Figure Captions
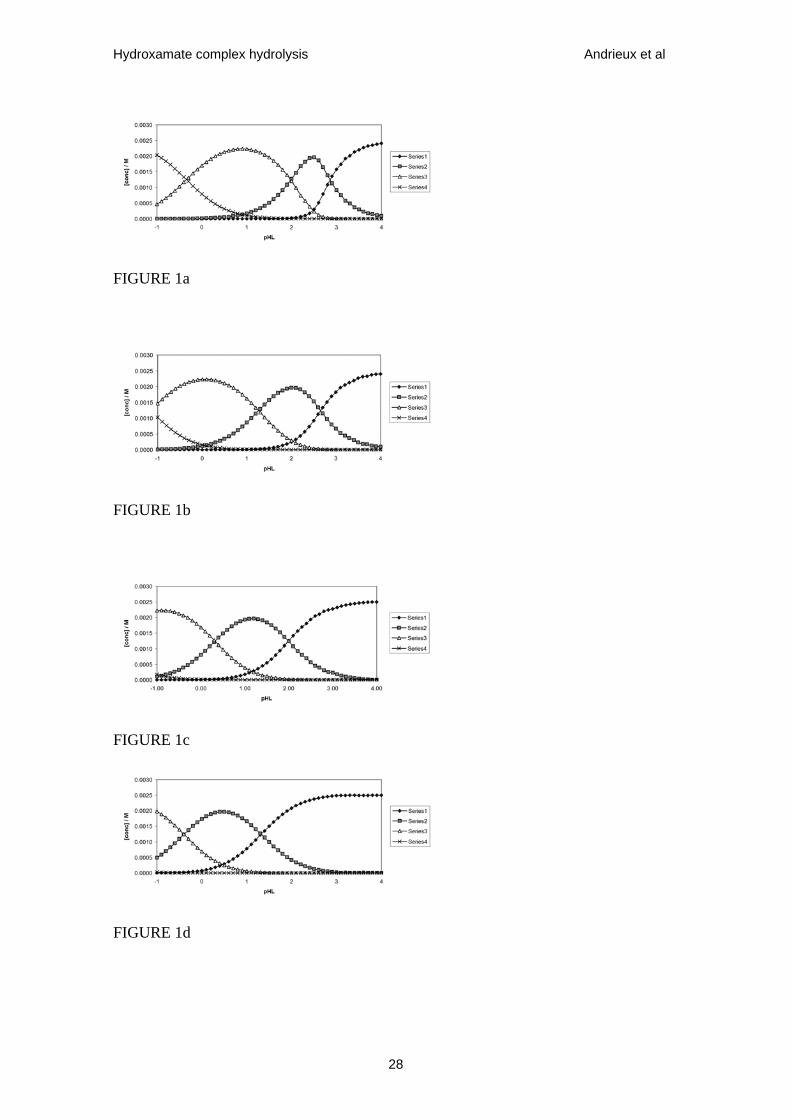
Figure 1. Speciation diagrams for Fe3+ - AHA system at 298 K showing concentrations
of Fe3+, FeL2+, FeL2+ and FeL3 (data series 1-4 respectively in all figures) as functions
of total AHA concentration (expressed as pHL) calculated at total [Fe(III)] = 0.0025
mol•dm-3 and [HNO3] = (a) 0.01 mol•dm-3; (b) 0.1 mol•dm-3; (c) 1 mol•dm-3 and (d) 6
mol•dm-3.
Figure 2. Speciation diagrams for Fe3+ - AHA system at 298 K showing concentrations
of Fe3+, FeL2+, FeL2+ and FeL3 (data series 1-4 respectively in all figures) as functions
of pH calculated at total [Fe(III)] = 0.0025 mol dm-3 and total [AHA] = (a) 0.0025
mol•dm-3; (b) 0.004 mol•dm-3; (c) 0.025 mol•dm-3, corresponding to AHA:Fe ratios of
1:1, 1.6:1, 10:1 respectively.
Figure 3. UV-visible absorption spectra of Fe-AHA system recorded in HNO3 solution.
Fe3+ and AHA spectra recorded as indicated in legend. (a) Fe(AHA)2+ spectrum
recorded from 4.2 x 10⁻⁴ mol•dm-3 solution of complex produced, as calculated from
Fig. 1b, from a solution of 2.5 x 10⁻³ mol•dm-3 Fe3+ and 4 x 10⁻³ mol•dm-3 AHA at pH
1.16, λmax = 498 nm. (b) Fe(AHA)2+ spectrum recorded from 2.23 x 10⁻³ mol•dm-3
solution of complex produced, as calculated from Fig.1a, from a solution of 2.5 x 10⁻³
mol•dm-3 Fe3+ and 0.16 mol•dm-3 AHA at pH 2, λmax = 460 nm. For both (a) and (b) the
spectra of AHA recorded in isolation were found to be featureless over the wavelength
range shown.
Figure 4. Absorbance of 0.0025 mol•dm-3 Fe3+, 0.004 mol•dm-3 AHA solution
(AHA:Fe(III) ratio = 1.6:1) as f(t) measured at 293 K, λmax = 498 nm. Experiments
24
Hydroxamate complex hydrolysis Andrieux et al
conducted in HNO3 solution, data series 1 – 7 recorded at pH 2.5, 2.01, 1.48, 1.16, 0.79,
0.49 and –0.7 respectively.
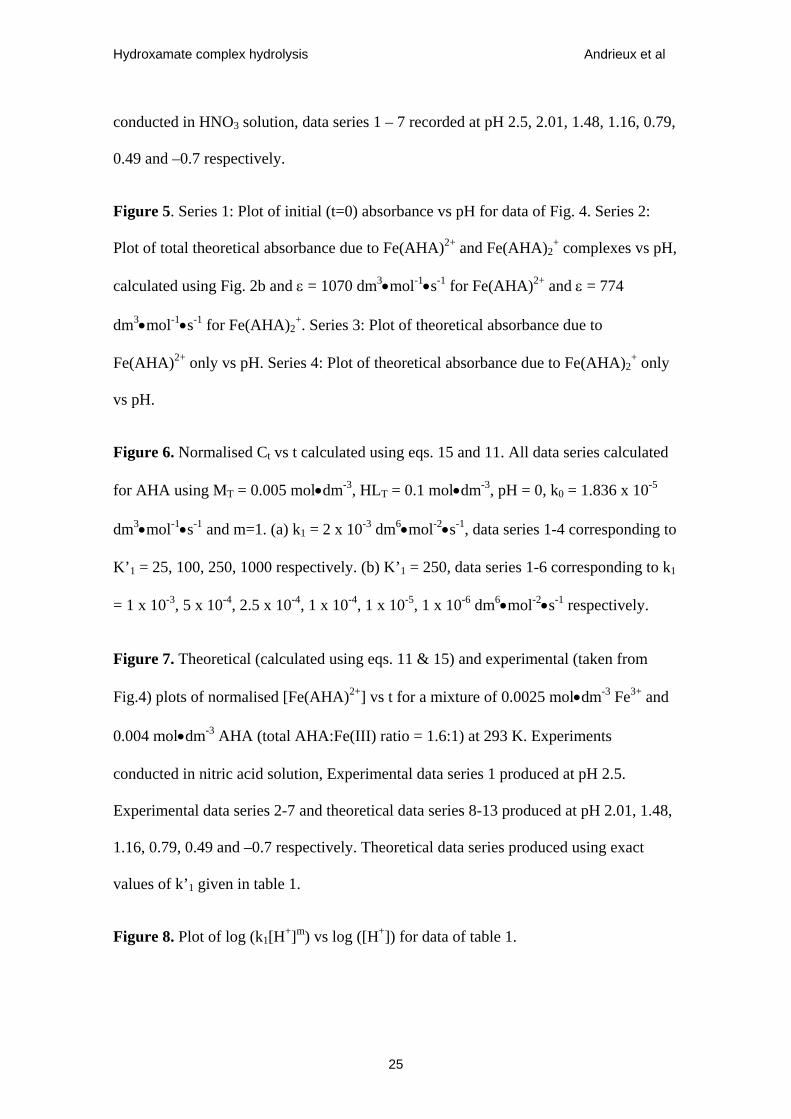
Figure 5. Series 1: Plot of initial (t=0) absorbance vs pH for data of Fig. 4. Series 2:
Plot of total theoretical absorbance due to Fe(AHA)2+ and Fe(AHA)2+ complexes vs pH,
calculated using Fig. 2b and ε = 1070 dm3•mol-1•s-1 for Fe(AHA)2+ and ε = 774
dm3•mol-1•s-1 for Fe(AHA)2+. Series 3: Plot of theoretical absorbance due to
Fe(AHA)2+ only vs pH. Series 4: Plot of theoretical absorbance due to Fe(AHA)2+ only
vs pH.
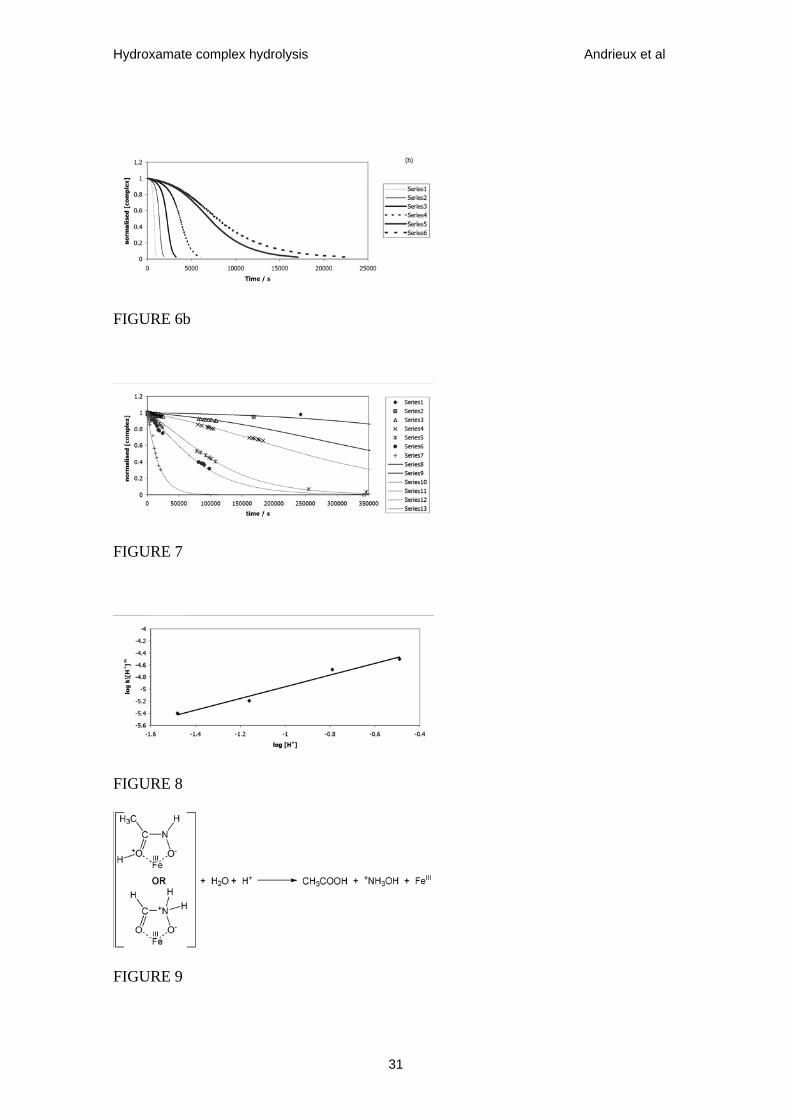
Figure 6. Normalised Ct vs t calculated using eqs. 15 and 11. All data series calculated
for AHA using MT = 0.005 mol•dm-3, HLT = 0.1 mol•dm-3, pH = 0, k0 = 1.836 x 10⁻⁵
dm3•mol-1•s-1 and m=1. (a) k1 = 2 x 10⁻³ dm6•mol-2•s-1, data series 1-4 corresponding to
K’1 = 25, 100, 250, 1000 respectively. (b) K’1 = 250, data series 1-6 corresponding to k1
= 1 x 10⁻³, 5 x 10⁻⁴, 2.5 x 10⁻⁴, 1 x 10⁻⁴, 1 x 10⁻⁵, 1 x 10⁻⁶ dm6•mol-2•s-1 respectively.
Figure 7. Theoretical (calculated using eqs. 11 & 15) and experimental (taken from
Fig.4) plots of normalised [Fe(AHA)2+] vs t for a mixture of 0.0025 mol•dm-3 Fe3+ and
0.004 mol•dm-3 AHA (total AHA:Fe(III) ratio = 1.6:1) at 293 K. Experiments
conducted in nitric acid solution, Experimental data series 1 produced at pH 2.5.
Experimental data series 2-7 and theoretical data series 8-13 produced at pH 2.01, 1.48,
1.16, 0.79, 0.49 and –0.7 respectively. Theoretical data series produced using exact
values of k’1 given in table 1.
Figure 8. Plot of log (k1[H+]m) vs log ([H+]) for data of table 1.
25
Hydroxamate complex hydrolysis Andrieux et al
Figure 9. Schematic summary of effects of nucleophilic attack of H2O on Fe(III)-AHA
complex protonated at the carbonyl oxygen or hydroylamino nitrogen.
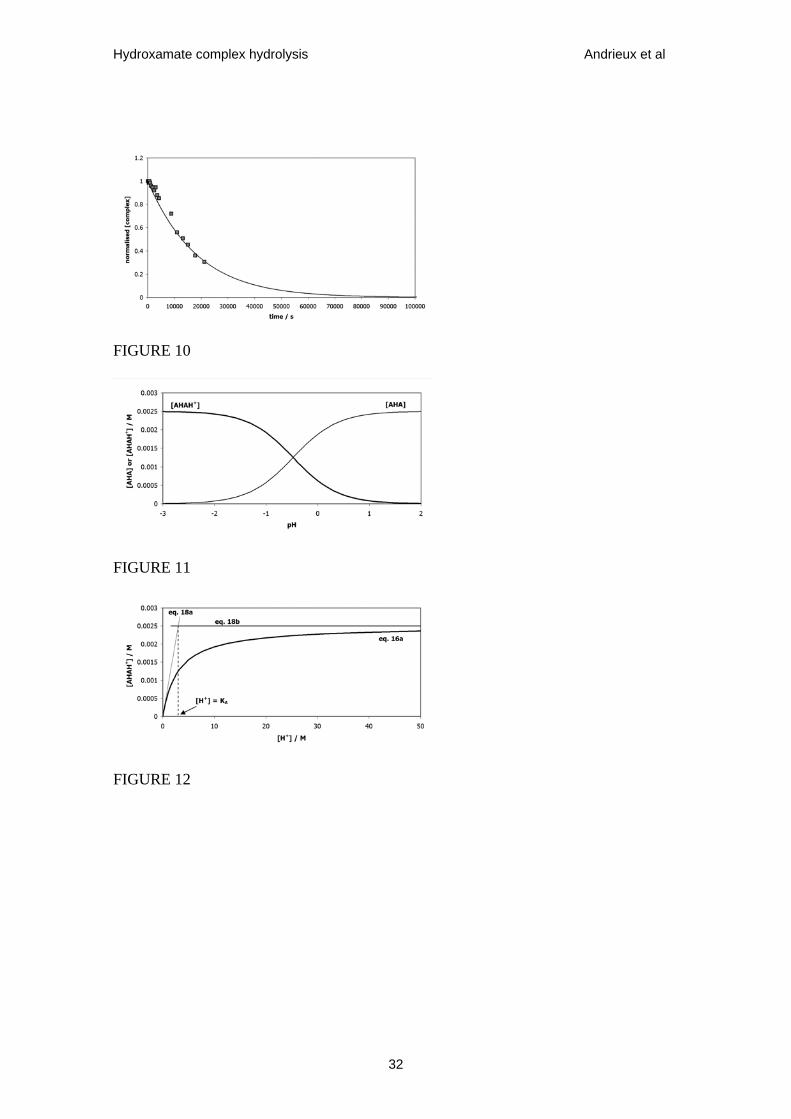
Figure 10. Theoretical (calculated using eqs. 11 & 15) and experimental (taken from
Fig.7) plots of normalised [Fe(AHA)2+] vs t for a mixture of 0.0025 mol•dm-3 Fe3+ and
0.004 mol•dm-3 AHA (total AHA:Fe(III) ratio = 1.6:1) at 293 K. Experiment conducted
in nitric acid solution, pH –0.7. Theoretical data series produced using k1 = 1.02 x 10⁻⁴
dm3•mol-1•s-1 (calculated from Fig.8) and k’0 = 5.51 x 10⁻⁵ s-1 (as a fitting parameter).
Figure 11. Schematic speciation diagram for AHA system at 298 K showing
concentrations of AHAH+ and AHA (data series 1 and 2 respectively) as a function of
pH. Total AHA concentration (= [AHA] + [AHAH+]) = 0.0025 mol•dm-3. KA = 3
mol•dm-3.
Figure 12. Schematic plots of [AHAH+] vs [H+] calculated using eq. 16a, 18a ([H+] <
KA) and 18b ([H+] > KA).
26
Hydroxamate complex hydrolysis Andrieux et al
Tables
pH k0 /
dm3•mol-1•s-1
from eq. 1
k’0 = k0[H+]
/ s-1
from eq. 6e
K1
=K’1
MT /
mol•dm-3
HLT /
mol•dm-3
k’1 = k1[H+]m
/ s–1
from Fig.4 & eqs. 11 & 15
2.01 1.84 x 10⁻⁵ 1.79 x 10⁻⁷ 109 0.0025 0.004 1.90 x 10⁻⁶
1.48 1.84 x 10⁻⁵ 6.08 x 10⁻⁷ 109 0.0025 0.004 3.97 x 10⁻⁶
1.16 1.84 x 10⁻⁵ 1.27 x 10⁻⁶ 109 0.0025 0.004 6.43 x 10⁻⁶
0.79 1.84 x 10⁻⁵ 2.98 x 10⁻⁶ 109 0.0025 0.004 2.11 x 10⁻⁵
0.49 1.84 x 10⁻⁵ 5.94 x 10⁻⁶ 109 0.0025 0.004 3.17 x 10⁻⁵
-0.7 1.84 x 10⁻⁵ 9.2 x 10⁻⁵ 109 0.0025 0.004 -6.26 x 10⁻⁴
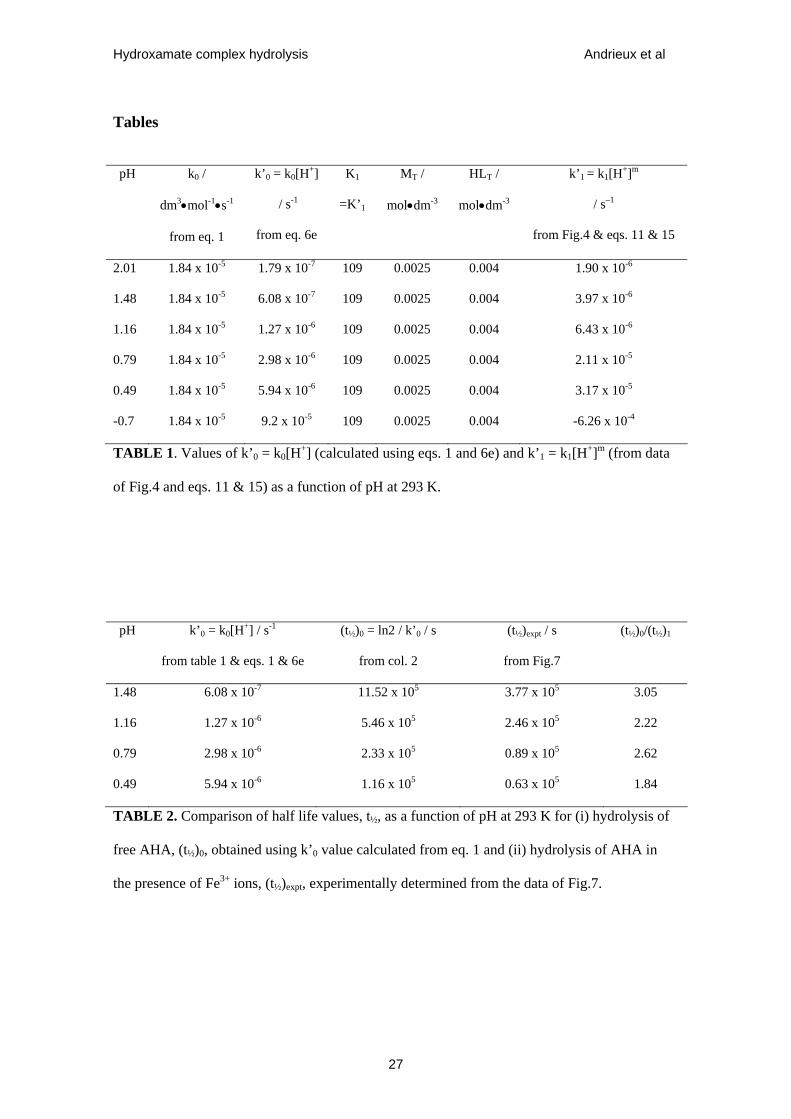
TABLE 1. Values of k’0 = k0[H+] (calculated using eqs. 1 and 6e) and k’1 = k1[H+]m (from data
of Fig.4 and eqs. 11 & 15) as a function of pH at 293 K.
pH k’0 = k0[H+] / s-1
from table 1 & eqs. 1 & 6e
(t½)0 = ln2 / k’0 / s
from col. 2
(t½)expt / s
from Fig.7
(t½)0/(t½)1
1.48 6.08 x 10⁻⁷ 11.52 x 10⁵ 3.77 x 10⁵ 3.05
1.16 1.27 x 10⁻⁶ 5.46 x 10⁵ 2.46 x 10⁵ 2.22
0.79 2.98 x 10⁻⁶ 2.33 x 10⁵ 0.89 x 10⁵ 2.62
0.49 5.94 x 10⁻⁶ 1.16 x 10⁵ 0.63 x 10⁵ 1.84
TABLE 2. Comparison of half life values, t½, as a function of pH at 293 K for (i) hydrolysis of
free AHA, (t½)0, obtained using k’0 value calculated from eq. 1 and (ii) hydrolysis of AHA in
the presence of Fe3+ ions, (t½)expt, experimentally determined from the data of Fig.7.
27
Hydroxamate complex hydrolysis Andrieux et al
FIGURE 1a
FIGURE 1b
FIGURE 1c
FIGURE 1d
28
Hydroxamate complex hydrolysis Andrieux et al
FIGURE 2a
FIGURE 2b
FIGURE 2c
FIGURE 3a
29
Hydroxamate complex hydrolysis Andrieux et al
FIGURE 3b
FIGURE 4
FIGURE 5
FIGURE 6a
30
Hydroxamate complex hydrolysis Andrieux et al
FIGURE 6b
FIGURE 7
FIGURE 8
FIGURE 9
31
Hydroxamate complex hydrolysis Andrieux et al
32
FIGURE 10
FIGURE 11
FIGURE 12