the art of thermal mass modeling for energy ... - concrete.org
TRANSCRIPT

1
ACI WEB SESSIONS
The Art of Thermal Mass Modeling for Energy Conservation in
Buildings, Part 2
ACI Spring 2012 ConventionMarch 18 – 21, Dallas, TX
ACI WEB SESSIONS
Jamie Farny is market manager, buildings for the Portland Cement Association. He focuses on promoting the use of concrete for low-rise buildings. This includes cast-in-place, precast, tilt-up, insulating concrete forms (ICFs), masonry, and autoclaved aerated concrete (AAC) structural systems,
as well as plaster, architectural, and decorative concrete. Farny is a member of ACI’s committees for ICFs, residential concrete, plastering, and decorative concrete, he also participates with the American Society for Testing and Materials’ committees on plastering, mortars, and masonry units. He holds a B.S. degree in Civil Engineering from the Illinois Institute of Technology.
TM
Multifamily Energy Modeling:New York Developer Saves Operating Costs
The Art of Thermal Mass Modeling forEnergy Conservation in Buildings
American Concrete InstituteMarch 19, 2012
Jamie Farny
Portland Cement Association
TM
OutlineDescribe the project, design intent,
construction system
Energy software and building modeling
Comparison with one year of energy data for occupied building
Implication of energy usage and savings—MIT
Green construction outlook—McGraw-Hill
TM
The AndrewQueens, New York City location
50-unit multi-family residence
Developer: The Bluestone Group
Energy consultant: Steven Winter Associates
Insulating concrete form (ICF) construction with R-20 insulation
TM
The Andrew

2
TM
The Andrew
TM
Energy Software
Energy analysis
New installations
Retrofitting existing buildings
Document energy use/savings of various wall systems
What did developer consider?
TM
TREAT SoftwareTargeted Retrofit Energy Analysis Tool
Performs energy audits
Used to sell energy efficiency retrofits
Comprehensive building energy analysis
Only energy audit software approved by the DOE for all residential– including multifamily
NYSERDA preferred (NY State Energy Research and Development Authority)
TM
NYSERDA Public benefit corporation, 1975 Initially R&D to reduce state petroleum consumption Now, NYSERDA focuses on New York’s energy goals: reducing consumption promoting renewables protecting the environment
Multifamily Performance Program Eligibility, 5 or more units, more than 3 stories Cash incentives for energy efficiency ($20K for
affordable housing, $15K for market rate)
TM
TREAT:
Create models quickly and easily with building component libraries
Calculate energy usage and predict energy savings
Aggregate improvements into packages
Automatically calculate payback and SIR (savings to investment ratio)
TM

3
TM
TREAT InputsActive links to input screens
Wizard tool to help build models or do manually
Libraries for most input screens
TM
TREAT Inputs – Building AreaThe Andrew
Space TypeArea,SqFt
Notes
Residential 36,585Include total floor area of all residential units in building
Common Area
8,469Include combined floor area of corridors, recreation areas, lobbies, elevator shafts, etc.
Commercial Area
0Include combined floor area of residential-associated office, retail, food sales, etc.
Garage 6,108Include floor area of residential-associatedenclosed/underground garages [ventilated]
Total Conditioned
45,054
TM
TREAT Inputs - Energy
Heating
Cooling
Infiltration and ventilation
Interior, exterior, in-unit lighting
Equipment loads (washer/dryer, dishwasher, refrigerator, etc.)
TM
TREAT Inputs – Fuel typesElectricity ($/kWh)Natural gas ($/Therm)Oil ($/gal)
TM
TREAT Inputs
TM
TREAT OutputsPerformance Rating Calculation, in Energy million Btu
Baseline Proposed Savings, %
Annual Load
Natural Gas
ElectricCost
$Natural
GasElectric
Cost$ Btu $
Heating 1,581 0 23,639 819 0 12,248 48 48
Cooling 0 62 2,761 0 40 1,783 35 35
Lighting 0 221 9,839 0 162 7,210 26 26
Hot Water 597 0 8,927 424 0 6,348 29 29
Appliance 1210 663 31,323 121 587 27,962 10 11
Other 0 0 0 0 0 0 0 0
Total 2,3007 946 76,491 1366 789 55,553 33 27
4
TM
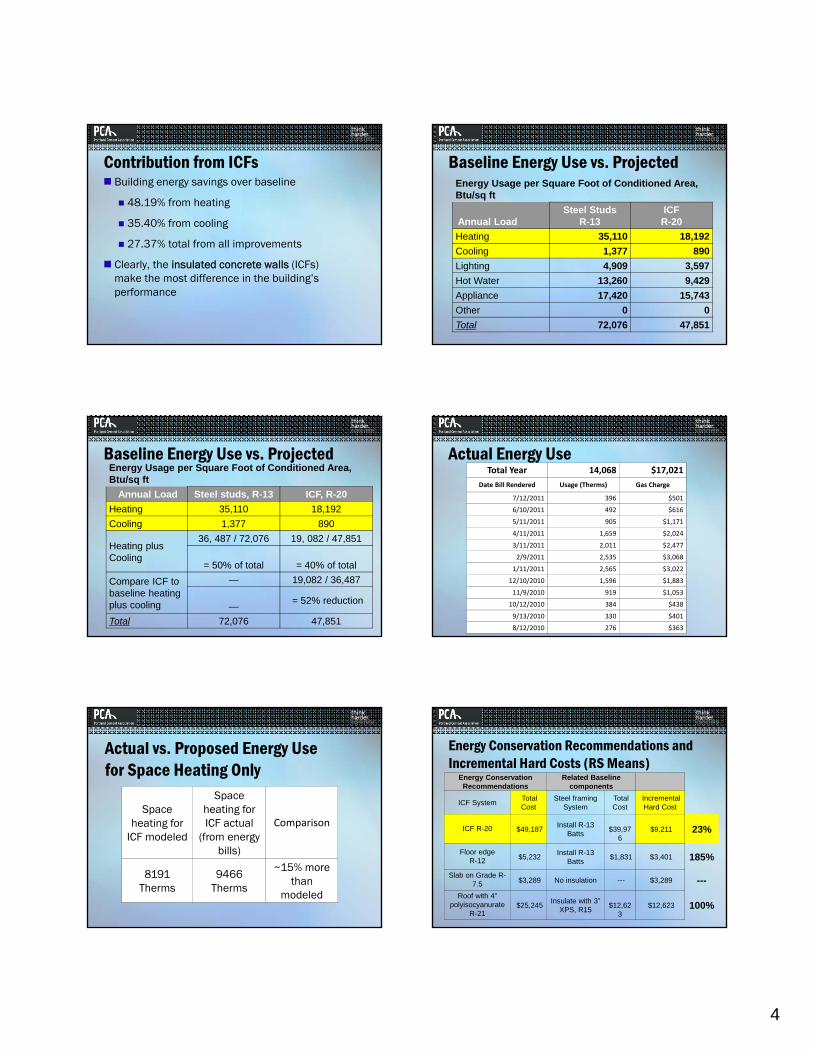
Contribution from ICFs Building energy savings over baseline
48.19% from heating
35.40% from cooling
27.37% total from all improvements
Clearly, the insulated concrete walls (ICFs) make the most difference in the building’s performance
TM
Baseline Energy Use vs. Projected Energy Usage per Square Foot of Conditioned Area, Btu/sq ft
Annual LoadSteel Studs
R-13ICFR-20
Heating 35,110 18,192
Cooling 1,377 890
Lighting 4,909 3,597
Hot Water 13,260 9,429
Appliance 17,420 15,743
Other 0 0
Total 72,076 47,851
TM
Baseline Energy Use vs. Projected Energy Usage per Square Foot of Conditioned Area, Btu/sq ft
Annual Load Steel studs, R-13 ICF, R-20
Heating 35,110 18,192
Cooling 1,377 890
Heating plus Cooling
36, 487 / 72,076 19, 082 / 47,851
= 50% of total = 40% of total
Compare ICF to baseline heatingplus cooling
— 19,082 / 36,487
—= 52% reduction
Total 72,076 47,851
TM
Actual Energy UseTotal Year 14,068 $17,021
Date Bill Rendered Usage (Therms) Gas Charge
7/12/2011 396 $501
6/10/2011 492 $616
5/11/2011 905 $1,171
4/11/2011 1,659 $2,024
3/11/2011 2,011 $2,477
2/9/2011 2,535 $3,068
1/11/2011 2,565 $3,022
12/10/2010 1,596 $1,883
11/9/2010 919 $1,053
10/12/2010 384 $438
9/13/2010 330 $401
8/12/2010 276 $363
TM
Actual vs. Proposed Energy Use for Space Heating Only
Spaceheating for
ICF modeled
Spaceheating for ICF actual
(from energy bills)
Comparison
8191Therms
9466Therms
~15% more than
modeled
TM
Energy Conservation Recommendations and Incremental Hard Costs (RS Means)
Energy Conservation Recommendations
Related Baseline components
ICF SystemTotal Cost
Steel framing System
Total Cost
Incremental Hard Cost
ICF R-20 $49,187 Install R-13
Batts$39,97
6 $9,211 23%
Floor edgeR-12 $5,232
Install R-13 Batts
$1,831 $3,401 185%
Slab on Grade R-7.5 $3,289 No insulation --- $3,289 ---
Roof with 4” polyisocyanurate
R-21$25,245
Insulate with 3” XPS, R15
$12,623
$12,623 100%
5
TM
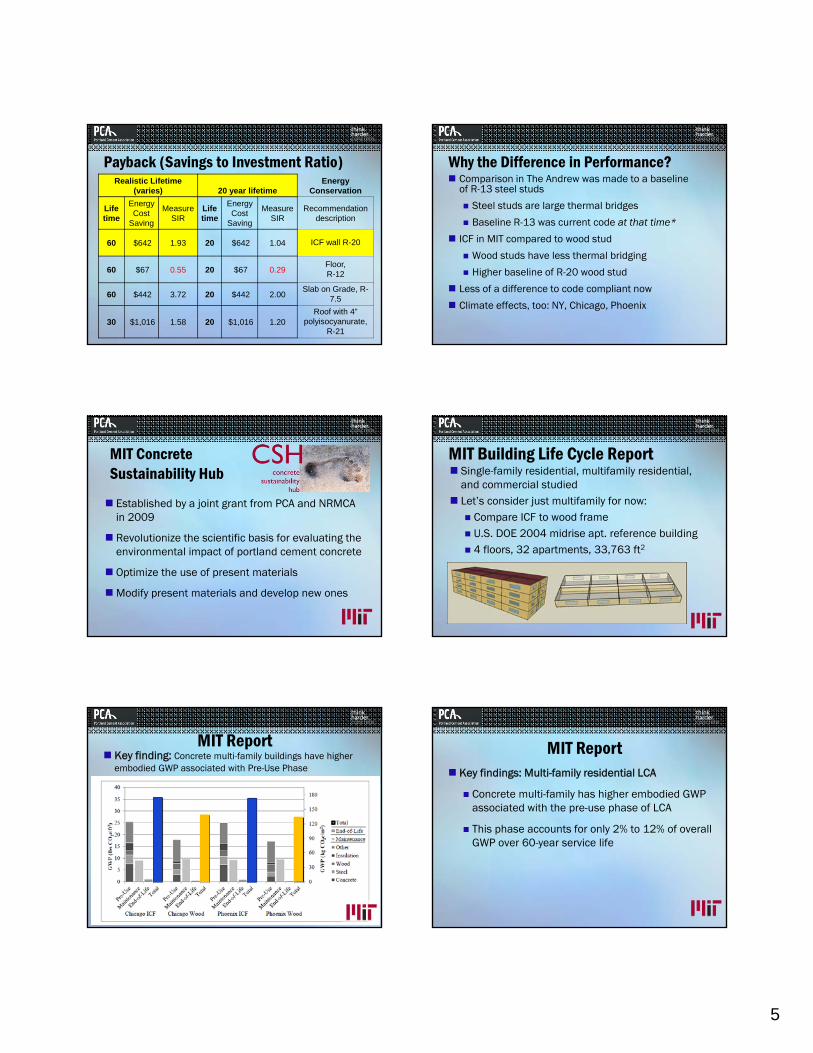
Payback (Savings to Investment Ratio)Realistic Lifetime
(varies) 20 year lifetimeEnergy
Conservation
Life time
Energy Cost
Saving
Measure SIR
Lifetime
Energy Cost
Saving
Measure SIR
Recommendation description
60 $642 1.93 20 $642 1.04 ICF wall R-20
60 $67 0.55 20 $67 0.29 Floor,R-12
60 $442 3.72 20 $442 2.00 Slab on Grade, R-
7.5
30 $1,016 1.58 20 $1,016 1.20 Roof with 4”
polyisocyanurate, R-21
TM
Why the Difference in Performance? Comparison in The Andrew was made to a baseline
of R-13 steel studs
Steel studs are large thermal bridges
Baseline R-13 was current code at that time*
ICF in MIT compared to wood stud
Wood studs have less thermal bridging
Higher baseline of R-20 wood stud
Less of a difference to code compliant now
Climate effects, too: NY, Chicago, Phoenix
TM
MIT Concrete Sustainability Hub
Established by a joint grant from PCA and NRMCA in 2009
Revolutionize the scientific basis for evaluating the environmental impact of portland cement concrete
Optimize the use of present materials
Modify present materials and develop new ones
TM
MIT Building Life Cycle Report Single-family residential, multifamily residential,
and commercial studied Let’s consider just multifamily for now: Compare ICF to wood frame U.S. DOE 2004 midrise apt. reference building 4 floors, 32 apartments, 33,763 ft2
TM
Key finding: Concrete multi-family buildings have higher embodied GWP associated with Pre-Use Phase
MIT ReportTM
Key findings: Multi-family residential LCA
Concrete multi-family has higher embodied GWP associated with the pre-use phase of LCA
This phase accounts for only 2% to 12% of overall GWP over 60-year service life
MIT Report

6
TM
Key finding: Over full Life Cycle, concrete multifamily buildings produce 2.8% to 5% lower GHG emissions than current best practice code compliant wood frame residences
MIT ReportTM
Key finding: Concrete multifamily buildings use 5% to 8% less energy than code compliant wood frame construction
Phoenix
MIT Report
TM
Summary– Residential Buildings LCA
The efficiency of concrete wall assemblies results in lower overall emissions over a 60-year service life
Combining the embodied energy with the operating energy over the full life of the structure, the concrete residential structures consume less energy than comparable current, code compliant wood frame construction.
TM
Influence of Green Sustainability will drive choice of construction
materials:
“Energy and environmental concerns will play increasing role in the construction materials used in homes” (PCA Economics Long Term Cement Consumption Report January 31, 2008)
TM
Green Building Market
Green construction was more than 5 times greater in 2010 than in 2005.
TM
Summary
Continuing growth of green constructionReal world case study, The AndrewEnergy modeling of that building by
TREAT software, real-world comparisonGeneral benefits of energy modelingMIT study to better understand energy
use of multifamily and its implications